Article

Climate Change Mitigation Pathways for Southeast Asia: CO2 Emissions Reduction Policies for the Energy and Transport Sectors

1
Institute of Transportation Studies, University of California, Davis, CA 95616, USA
2
Climate Action Implementation Facility (CAIF), Berlin 10439, Germany
3
The University of Sydney Business School, University of Sydney, Sydney, NSW 2006, Australia
4
Clean Air Asia, Pasig City 1605, Philippines
5
Laboratory of Transport Systems, Federal University of Rio Grande do Sul, Porto Alegre 90035-190, Brazil
6
Mobility and International Cooperation, Wuppertal Institute for Climate, Environment and Energy, Berlin 10178, Germany
*
Author to whom correspondence should be addressed.
Sustainability 2017, 9(7), 1160; https://doi.org/10.3390/su9071160
Submission received: 8 May 2017 / Revised: 19 June 2017 / Accepted: 25 June 2017 / Published: 3 July 2017

Abstract

:
As of June 2017, 150 countries have ratified the Paris Climate Agreement. This agreement calls for, among other things, strong reductions in CO2 emissions by 2030 and beyond. This paper reviews the Nationally Determined Contribution (NDCs) plans of six Association of Southeast Asian Nations (ASEAN) countries and compares their current and projected future CO2 levels across sectors, and their stated targets in the context of their economic and demographic situations. This comparison reveals wide variations in the types of targets, with the “ambition” level changing as the perspective changes from total CO2 to CO2/capita and per unit gross domestic product (GDP). We also review national plans as stated in NDCs and find that while there are many types of policies listed, few are quantified and no attempts are made to score individual or groups of policies for their likelihood in achieving stated targets. We conclude that more analysis is needed to better understand the possible impacts of current policies and plans on CO2 emissions, and whether current plans are adequate to hit targets. Considerations on better aligning targets are also provided.

1. Introduction

Since the signing of the Paris Climate Agreement in late 2016, countries around the world have been submitting plans regarding their Nationally Determined Contributions (NDCs) to cutting CO2 emissions. Nationally Determined Contributions are submitted to the United Nations Framework Convention on Climate Change (UNFCCC) upon a country’s ratification of the Paris Agreement; previously these were called “Intended Nationally Determined Contributions” (INDC). At the time of writing this paper, 197 parties to the Convention had submitted their INDCs and 150 had ratified it. The United States have announced their withdrawal from Paris Agreement, although the withdrawal process may not be substantially different to inaction on delivering on the stated commitment. The agreement includes only few requirements in terms of targets or strategies, and the variation across countries is remarkable. This paper provides an overview and analysis of the energy-related CO2 reduction targets and mitigation plans of six Southeast Asian nations, with a special emphasis on transportation. Given the available information, the paper aims to show the current situation in each country, the projected energy-related CO2 emissions to 2030, which will be compared to stated Nationally Determined Contributions. Considered in this analysis is a range of policies put forward by countries to reach these targets. This will feed into a preliminary assessment on the validity of the Nationally Determined Contributions. The main objective is to illustrate similarities and differences across the six Southeast Asian countries examined.
In May 2016, the UNFCCC issued an updated aggregate assessment of submissions of Nationally Determined Contributions, comparing these to both a baseline and to low carbon scenarios [1]. This also differentiates between 2 degree and 1.5 degree scenarios. The reductions in this figure suggest that, in a 2-degree scenario (2DS), countries need to reduce their emissions by 2030 to about their year 2000 emissions, on average. For a 1.5-degree scenario (1.5DS), they need to achieve 1990 emission levels, on average. This progresses to 2050 with the achievement of something in the range of 50% below 2000 levels in 2DS whereas the 1.5DS reaches close to zero by 2050–2060 [1].
There are many factors affecting these targets and how reductions might be allocated across countries. Typically, the Organisation for Economic Co-operation and Development (OECD) countries have pledged strong reductions, such as 80% by 2050, which should allow non-OECD countries more time to achieve similar targets [2,3]. The Paris Agreement as a voluntary framework only supports ambitions on countries and does not require a firm political or legal commitment, which makes the recent withdrawal of the United States irrational and unnecessary [4]. The targets outlined in Nationally Determined Contributions, as the name indicates, reflect voluntary commitments of individual countries. While during the review process, countries may only submit increased targets, they may choose not to deliver on the stated targets as there are no enforcement measures set by the UNFCCC. Hence, it is relevant to understand the current level of ambition, the current policy framework and how this relates to climate change mitigation pathways that would be in line with the goals of Paris Agreement.

2. Materials and Methods

This paper focuses on six Southeast Asian countries (Indonesia, Malaysia, Philippines, Singapore, Thailand and Vietnam) and analyzes the energy-related greenhouse gas (GHG) emissions and mitigation actions. Energy-related emissions from Association of Southeast Asian Nations (ASEAN) countries represent 4% of global greenhouse gas (GHG emissions [5]. We compare key indicators of the six countries’ targets, including total CO2 from a per-capita and CO2 intensity (per gross domestic product [GDP]) perspective, and then consider the policies and strategies put forward by each country.
In order to make the comparisons, we collected information in two categories, one related to countries’ Intended Nationally Determined Contributions (INDCs): target reduction level % (conditional and unconditional); type of target and against what (reference year); key targets; main policies related to energy cited in the INDC; and main policies related to energy not cited in the INDC. All the INDC submission documents are available at United Nations Framework Convention on Climate Change website [6]. Data related to population, historical GDP, historical emissions from 2005 to 2010, and a “baseline” emissions projection for 2030 are from Asia Pacific Economic Cooperation (APEC) [7]. Countries may have distinct ways to inform their data, which makes it difficult to compare the data with other countries, or simply did not have the necessary information. Using the database from APEC was found to be the best source for a consistent, independent reporting of such data and for a baseline and business-as-usual (BAU) projection (Business-as-usual projection refers to a scenario without policies/strategies to reduce CO2 emissions).

3. Results

This section provides an overview of the Nationally Determined Contributions (NDCs) and their targets, along with a general discussion of policies and plans within each of the six countries as of December 2016 that could contribute to achieving these targets. The six initial Intended Nationally Determined Contributions (INDCs) have been ratified and are now NDCs. Detailed modeling, and, in many cases, more information on the actual policies and measures planned or needed to deliver on the stated targets would be needed in order to get a clearer picture on the validity of the NDCs, but the following sections will provide an initial reflection on this issue.

3.1. Indonesia

3.1.1. NDC Summary and Targets

Indonesia’s Nationally Determined Contributions, submitted on 24 September 2015 to UNFCCC and ratified in October 2016, includes an unconditional 2030 GHG emissions reduction target (including land-use, land-use change and forestry (LULUCF)-emissions) of 29% below business-as-usual (BAU) and a conditional 41% reduction below BAU by 2030 (with sufficient international support). Indonesia is presenting its NDC as a deviation from business-as-usual using projections based on the historical trajectory (2000–2010).
According to Indonesia’s Second National Communication of 2010, GHG emissions were estimated to be 1800 MtCO2e in 2005 and represent an increase of 400 MtCO2e compared to 2000. Most of emissions, more than 60%, are the result of land use change and peat and forest fires, with combustion of fossil fuel contributing approximately 20% of total emissions. APEC projects Indonesia’s baseline emissions across all energy sectors to double between 2010 and 2030. The NDC target range brings this back down toward the 2010 level, though still about 50% higher in 2030 (Figure 1a). Per capita, the target contains the rise to about 30%, increasing from 1.5 to around 2 tons per capita, rather than to 3 tons in the BAU (Figure 1b). In terms of CO2 intensity of GDP, this declines by about 10% in the BAU to 2030 and an additional 20–30% if the target is met (Figure 1c).

3.1.2. NDC Main Policies

The NDC does not provide detail as to which sectors Indonesia intends to reduce emissions to achieve its targets. The most relevant policy included in Indonesia’s current policy projections is the National Energy Policy, which sets up plans for future energy supply. The National Energy Policy targets an increase of renewable energy to 23% of primary energy supply by 2025. To increase its share of renewables from 6% in early 2014, Indonesia introduced feed-in tariffs for renewable electricity generation and a biofuel quota [8]. Nevertheless, Indonesia is pushing the construction of new coal-fired power plants to meet rapidly increasing electricity demand and make use of domestic coal resources [9].
In line with the National Action Plan for Greenhouse Gas Emission Reduction, the National Medium Term Development Plan 2015–2019 specifies that the green economy is to be the foundation of Indonesia’s development program. The Plan aims to reduce GHG emissions for the five priority sectors, namely, forestry and peat lands, agriculture, energy and transportation, industrial, and waste, so that it will meet the target of 26% in 2019.

3.1.3. Other National Policies and Plans

The NDC does not mention any specific plan related to biofuel. However, since 2006, Indonesia has been increasing its biofuel blend targets as well as providing biofuels subsidies to producers, mainly to reduce the country’s dependence on oil imports, and also to support the domestic agricultural economy and to mitigate climate change. Biofuel Blending [10] is an ambitious program that aims to diversify domestic biodiesel consumption beyond the transportation sector. This regulation increases mandatory biodiesel blending from 10% to 15% for transportation and industrial uses, and it increases mandatory biodiesel blending to 25% for electricity generation from 2009 to 2025.
On the energy demand-side, the Transport Ministerial Regulation No. 201 (2013) [11] aims to mitigate emissions in the transportation sector through a complete “avoid, shift and improve” approach. Policy is mainly focused on fuel substitution from oil to gas, although several “shift” policies have been implemented, including car-free days on weekends, transit-oriented development (TOD) planning, and encouragement of the use of non-motorized vehicles. Road pricing and parking management are not yet actively implemented in Indonesia.
Indonesia also has two Nationally Appropriate Mitigation Action (NAMA) seeking support for implementation:
  • The Smart Street Lighting Initiative [12] aims to increase the energy efficiency of street lighting by substituting conventional street lighting with more efficient technologies in Indonesian cities and urban areas. Considering the current average lifetime (10 years) of LED street lighting technologies, the initiative can achieve up to approximately 1.4 MtCO2e in 2024.
  • Sustainable Urban Transport Initiative [13] comprises sustainable transport policies that include a tailor-made mix of “push” and “pull” measures for each city, including high quality public transport, non-motorized transport, parking management, traffic management, spatial planning, alternative fuels and vehicle efficiency. The estimated GHG reduction is 5 MtCO2e in eight years.

3.2. Malaysia

3.2.1. NDC Summary and Targets

The Malaysian INDC was delivered to the UNFCCC in January 2016 and ratified in November 2016. Malaysia intends to reduce its GHG emission intensity of GDP by 45% by 2030 relative to the emission intensity of GDP in 2005. This consist of 35% on an unconditional basis and a further 10% is condition upon receipt of climate finance, technology transfer and capacity building from developed countries.
No baseline projection or quantified analysis of measures of this baseline has been provided. Their NDC indicates a 2005 base-year emission level of 288 MtCO2e, which includes emissions of 25 MtCO2e from the LULUCF sector. Energy-related CO2 emissions are projected by APEC to increase from about 200 to 300 megatonnes by 2030. The intensity-based target range would reduce the 2030 BAU level by about 10%, which would still be well above the 2010 levels (Figure 2a). Malaysia has relatively high per-capita emissions compared to other ASEAN countries; the nearly 7 tonnes today would rise to over 8 in 2030 in the APEC BAU, whereas it would stay nearly constant under the low-carbon boundary of the target range (Figure 2b). CO2 intensity of GDP intensity is projected to drop by almost 40% in the BAU, with only a small additional drop at the low end of the target (Figure 2c).
Malaysia developed a Roadmap of Emissions Intensity Reduction in 2014. The study indicated that the country has opportunities across various sectors to meet the reduction target of 40% emissions intensity reduction of GDP. However, while these opportunities exist, considerable efforts would be required to realize these emissions reductions in light of the challenges and barriers.

3.2.2. NDC Main Policies

Among the key policies that serve as the basis of Malaysia’s NDC are the National Biofuel Policy 2006 [14], which lays the framework for biodiesel fuel blend (B5) comprising 5% processed palm oil with 95% petroleum diesel. According to the policy, the transport sector will be given priority, particularly land and sea transport. B5 diesel will also be supplied to the industrial sector. The removal of petrol and diesel subsidies [15] in December 2014—around the period of the collapse in global fuel prices—was primarily aimed to narrow Malaysia’s fiscal deficits, and is not necessary to shift the demand for renewable energy.
The NDC also refers to the National Renewable Energy Policy and Action Plan [16], effective since June 2010, to increase renewable energy contributions in the national power generation mix. By 2030, the total electricity mix from renewable energy is targeted to reach 11% of total electricity generated. This would contribute towards the reduction of 143 MtCO2 from the power sector.
In addition, under the Eleventh Malaysia Plan 2016–2020 (11MP) the government will further focus on pursuing green growth for sustainability. The actions outlined in the plan include strengthening and enabling the environment for green growth, adoption of sustainable consumption and production, conserving natural resources and strengthening resilience against climate change and natural disasters. These actions will further reduce Malaysia’s carbon footprint.
The Eleventh Malaysia Plan, among the measures, encourages the adoption of energy efficient vehicles and investments in public transport in cities such as the Mass Rapid Transit (MRT) systems in Kuala Lumpur and Klang Valley. Another measure the government will take is to work towards increasing biodiesel blending requirements of up to 15% in automotive fuel and implementing the EURO 5 emission standards during the Eleventh Malaysia Plan 2016–2020. Moreover, the use of compressed natural gas (CNG) will also be promoted.
Additional energy-related policies that form the basis for the INDC, since 2005, are:
  • National Biofuel Policy (2006)
  • National Energy Policy (2008)
  • National Green Technology Policy (2009)
  • National Policy on Climate Change (2009)
  • Low Carbon Cities Framework (2011)
  • National Automotive Policy (2014).

3.2.3. Other Background Information

The Malaysia Energy Centre predicts that Malaysia’s energy consumption will grow at an annual rate of 4.8% for the period 2000 to 2030 [17]. Energy for transport is projected to be the fastest growing sector during the next 25 years, expanding at an annual rate of 5.3%. Malaysia’s final energy requirements are expected to triple by the year 2030 from current consumption levels.

3.3. Philippines NDC

3.3.1. NDC Summary and Targets

The Philippines INDC was delivered to the UNFCCC in October 2015 and ratified in March 2017. The main commitment is a 70% reduction in all climate pollutants by 2030, relative to their BAU projection, and conditional on a range of financial and other support through international agreements. There is no unconditional target. Reduction of CO2e emissions will come from energy, transport, waste, forestry and industry sectors. They did not provide a baseline projection or a quantified analysis of measures off this baseline. Based on the Philippines’ INDC, we have developed the following snapshots of their projected energy-related CO2 emissions, and their targets.
The Philippines’ conditional target of 70% below the BAU projection would dramatically reduce emissions relative to the BAU 2030 near-tripling of emissions, and even lower CO2 to below 2010 levels. We show a large range in this target since it is conditional. At the high end, it could remain at BAU 2030 levels if conditions are not met to fulfill their targets. At the low end, this target could be consistent with a “well below 2 degree (2DS)” scenario if it continues to decline after 2030, reaching at least a 50% reduction below 1990 levels by 2050 (Figure 3a). The Philippines has a very low per-capita level of CO2, below 1 tonne per person, which would increase to about 1.5 in the 2030 BAU, but could remain below one if the conditional target is met (Figure 3b). This puts the Philippines at one of the lowest per-capita targets of any country in the world. From a GDP intensity perspective, this drops by about 25% in the BAU to 2030 and by 75% at the low end of the conditional target (Figure 3c).

3.3.2. NDC Main Policies

The NDC cites the National Climate Change Action Plan 2011–2028 [18]; one of the seven thematic areas in this action plan is sustainable energy. The action plan outlines supply-side short-, medium-, and long-term actions, such as the development of the National Renewable Energy Program (NREP). The NREP seeks to increase the country’s renewable energy-based capacity by 2030 [19]. The renewable energy sector is declared a priority investment sector that will regularly form part of the country's Investment Priority Plan.
The NDC also refers to the Biofuels Act of 2006 and the Renewable Energy Act of 2008, as an example to promulgate complementary sectorial laws that led to the increase in the utilization of renewable energy sources, reinforcing and institutionalizing climate change mitigation actions as well as creating opportunities for synergy and collaboration for an efficient utilization of limited resources.

3.3.3. Other National Policies and Plans

The Philippine Energy Plan 2012–2030 includes the targets set under the National Renewable Energy Program to strengthen its energy security plan. The Philippine Energy Plan 2012–2030 [20] specifies plans and programs for the power generation sector, rural electrification, indigenous energy development, renewable energy, downstream oil industry, downstream natural gas, alternative fuels, and energy efficiency and conservation. The relevant targets and plans for transport include 10% energy savings on total annual energy demand of all economic sectors by 2030; 30% of all public utility vehicles running on alternative fuels nationwide by 2030; natural gas as a major alternative fuel for public transport; and addition of compressed natural gas CNG refilling stations and liquefied natural gas (LNG) hub terminals.
The Philippine Energy Plan 2012–2030 states that, for the planning period 2012 to 2030, a total of 7779 MW capacity is estimated to be generated from the indicative power projects, 47.29% (3679.00 MW) of which would be from coal.
There are many energy demand-side strategies especially in reducing emissions from the transport sector, e.g., increase in rail ridership, increase of CNG buses, liquefied petroleum gas (LPG) taxis; though it should be noted that CNG/LPG are not especially low GHG fuels. Among the strategies, the National Environmentally Sustainable Transport Strategy 2010–2020 [21] mostly covers land transport in urban areas. There is also the National Energy Efficiency and Conservation Program launched in 2004 where, in the transport sector, emphasis is placed on the use of alternative fuels and natural gas.
There is greater need to up the supply of renewable energy resources and to avoid the building new coal-fired power plants, especially as there are plans and projects that are looking into efforts towards the electrification of road transport, fuel efficiency and improved public transport including buses, taxis, jeepneys, and tricycles. Incentives like import duty reductions for hybrid and CNG vehicles, and import duty reductions on completely knocked down parts and components for assembly of low engine displacement and hybrid vehicles are available. But coal has to be reduced in the electricity grid.

3.4. Singapore

3.4.1. NDC Summary and Targets

Singapore submitted its INDC in July 2015 and ratified in September 2016. The NDC contains a target to reduce the country’s GHG emissions intensity (total GHG emissions per unit of GDP) by 36% below 2005 levels by 2030 and the aim of peaking its total GHG emissions around the same time. In 2012, Singapore’s Emissions Intensity (EI) ranked favorably at 113 out of 140 countries, despite Singapore’s geographical limitations as a city state in generating renewable energies.
Based on the APEC BAU projection, Singapore’s CO2 emissions rise about 10% to 2030 and the intensity-based target does not change this picture much (Figure 4a). The relatively high per-capita emissions of nearly 9 tonnes of CO2 drop slightly in the BAU and with the target (Figure 4b), and the quite low emissions intensity continues to improve strongly in the BAU and similarly in the target case (Figure 4c).

3.4.2. NDC Main Policies

Singapore’s NDC does not address any specific policy related to energy. In general, the NDC states that the country is heavily dependent on fossil fuels, and emphasizes the limitations on using renewable energy sources within the limited boundaries of the city-state. Singapore had made early policy choices to reduce its GHG footprint by switching from to natural gas for electricity generation. Currently, over 90% of electricity is generated from natural gas. However, even if the emissions from natural gas are lower those from coal, the leakages in the transportation and usage offset a substantial part of the emission reduction potential [22].
Additionally, the government is considerably increasing the use of solar photovoltaic (PV) systems through the provision of an enabling environment which supports the following: facilitates system integration of intermittent sources to ensure grid stability and security; addresses non-market barriers to entry without subsidizing the consumption of any form of energy, and; supports continued investment in research, development, and demonstration (RD&D) to reduce the cost of solar PV modules and improve their efficiency. By 2030, it is estimated that renewable energy could potentially contribute up to 8% of Singapore’s peak electricity demand.

3.4.3. Other National Policies and Plans

Amongst the policies in Singapore, one of the key energy-related laws is the Energy Conservation Act that mandates energy efficiency requirements and energy management practices, to promote energy conservation, improve energy efficiency and reduce the environmental impact of energy use.
Also, Singapore has set an ambitious target of greening 80% of its buildings by 2030. Partnering with the United Nations (UN) Environment, the Building and Construction Authority (BCA) of Singapore established the Centre for Sustainable Buildings—a first in Asia—to support regional efforts to develop green building policies and actions. Other measures to encourage companies and households to invest in and use energy efficient equipment or technologies include the Grant for Energy Efficient Technologies (GREET) or the Energy Efficiency Improvement Assistance Scheme (EASe), environmental sustainability regulations under the Building Control Act, BCA Green Mark certification for buildings, Mandatory Energy Labeling Scheme (MELS) and Minimum Energy Performance Standards (MEPS) for household appliances.
Singapore has one of the most stringent and innovative systems in the world for controlling vehicle demand and usage, through a vehicular quota and road pricing system. To encourage the use of public transport, the length of the rail network in Singapore will be doubled from 178 km in 2012 to about 360 km by 2030. A Carbon Emissions-based Vehicle Scheme was introduced in 2013 to encourage car buyers to purchase low-emissions cars.
According to Singapore’s Third National Communication, the abatement potential of all the energy efficiency measures taken together is expected to be only 1.15 MtCO2e by 2020, and other measures like the ones related to the buildings sector and domestic transport demand are expected to abate 1.21 MtCO2e and 1.16 MtCO2e compared to BAU by 2020, respectively.

3.5. Thailand

3.5.1. NDC Summary and Targets

Thailand’s INDC was delivered to the UNFCCC in October 2015 and ratified in September 2016. The main commitment is a 20% reduction in all climate pollutants by 2030, relative to their BAU projection. This could increase up to a 25% reduction, conditional on enhanced access to technology development and transfer, financial resources, and capacity-building support through international agreements. The projected GHG emission level from the reference year of 2005, in the absence of major climate change policies, is 555 MtCO2e by 2030.
APEC projects Thailand’s baseline emissions across all energy sectors to roughly double between 2010 and 2030. With this BAU assumption, Thailand’s unconditional target of a 20–25% reduction relative to the BAU would reduce the 2030 level to around a 50% increase compared to 2010 (Figure 5a). This target appears unlikely to be consistent with a “well below 2 degree” scenario since it still represents a strong increase compared to 2010. Thailand has moderate per-capita emissions for ASEAN countries, around 3.5 tonnes in 2010 (Figure 5b). This rises to nearly 6 tonnes in the BAU, but only to between 4 and 5 tonnes in the target case. From an intensity standpoint, Thailand’s emissions are remarkably similar to the Philippines’ both in 2010 and in the 2030 BAU (with about a 10% drop), as well as for the target (about a 25–30% drop) as shown in Figure 5c.

3.5.2. NDC Main Policies

Key sources for Thailand’s plan for 2030 which form the basis of their NDC are as follows: National Economic and Social Development Plans, Climate Change Master Plan 2015–2050, Power Development Plan 2015–2036, Thailand Smart Grid Development Master Plan 2015–2036, Energy Efficiency Plan 2015–2036, Alternative Energy Development Plan 2015–2036, Environmentally Sustainable Transport System Plan 2013–2030, and National Industrial Development Master Plan 2012–2031.
The Alternative Energy Development Plan aims to achieve a 30% share of renewable energy in the total final energy consumption in 2036 and the Energy Efficiency Plan aims to reduce the country’s energy intensity by 30% below the 2010 level in 2036. Thailand´s NDC states that waste, biomass and biogas power generation are encouraged by the government, but regulations in these sectors are missing. Complementing the increase in renewable energy capacity is the fuel diversification strategy through 2036, which seeks to increase the hydropower purchases. Although Thailand intends to utilize clean coal technology, the indicative target for coal power generation shows retention of current share or a slight increase to 25% due to high reserves of coal. Moreover, the indicative targets show a decrease in natural gas power generation.
The Environmentally Sustainable Transport System Plan is also referred to in the NDC which proposes measures for road-to-rail mode shift for both freight and passenger transport. Thailand’s Climate Change Master Plan 2015–2050 indicates a 7–20% reduction of GHG emissions from the energy and transport sector by 2020 relative to BAU.
The NDC identifies the lack of incentives for renewable energy investments and enabling environment for large-scale technology transfer, but fails to outline policies that create sufficient incentives to overcome such barriers, making clear that strong political commitment is needed to drive the transition towards a low-carbon economy. Thailand would need to implement stronger energy efficiency and renewable energy fiscal and regulatory policies if it aims to achieve a 30% share of renewable energy in final energy consumption by 2036 as stated in the NDC.

3.5.3. Other National Policies and Plans

Thailand is also working on Nationally Appropriate Mitigation Actions (NAMAs) for which the country is seeking support for implementation. The NAMA “People-Centred Urban Mobility in Thailand” [23] focuses on improving feeder modes to the urban rail network in Bangkok. Building on various ongoing policy initiatives and the NDC, the proposed interventions include consolidation of the bus services, improvement of public transport hubs, bus prioritization, introduction of more energy-efficient buses and the improvement of conditions for cycling and walking. The measures will result directly in reduced energy consumed by buses, as well as promote a modal shift from private motor vehicles to public transport, walking and cycling, thereby saving GHG emissions.

3.6. Vietnam

3.6.1. NDC Summary and Targets

Vietnam’s INDC was delivered to the UNFCCC in September 2015 and ratified in November 2016. Vietnam has made an unconditional commitment of 8% reduction in GHG emissions by 2030 relative to their BAU projection, in which emission intensity per unit of GDP will be reduced by 20% compared to the 2010 levels. This commitment could reach a 25% GHG emission reduction by 2030, conditional on international support through bilateral and multilateral cooperation, as well as through the implementation of new mechanisms under the Global Climate Agreement, in which emission intensity per unit of GDP will be reduced by 30% compared to 2010 levels.
Their NDC specifies a 2010 GHG emission level of 247 MtCO2e, as well as BAU projections off this baseline of 474 MtCO2e by 2020, and 787 MtCO2e by 2030. Given the 300% CO2 increase in the BAU but also the rapid project economic growth, the 20–25% target reduction in emissions intensity results in more than a doubling in CO2 even if the 25% reduction is achieved. Per capita, emissions would rise by 100% from about 1.5 tCO2 to around 35 tCO2 to with the target, or 3.55 tCO2 to without the target. CO2 intensity of GDP drops by about 5% in the BAU to 2030, and by a far greater 20–30% in the target case (Figure 6a–c).

3.6.2. NDC Main Policies

The NDC cites the National Green Growth Strategy for the Period 2011–2020 with a vision to 2050, which puts forward targets for GHG reduction, energy consumption and energy efficiency, and conditional commitments for 2020, 2030 and 2050. GHG emission target for 2020 is to reduce the intensity of GHG emissions by 8–10% compared to the 2010 level, and the orientation towards 2030 and 2050 is to reduce annual GHG emissions by at least 1.5–2% annually.
In line with the targets, the National Green Growth Strategy states 17 specific action plans, a good number of which are explicitly for improving transport systems and technology. This also includes “Energy Infrastructure”, “Sustainable Urbanization” and “Promoting Sustainable Consumption and Building Green Lifestyles”.
The National Climate Change Strategy, on the other hand, recognizes that energy use and GHG emissions are to increase especially in industry, electricity, transport, and urban development, but that measures can be implemented to curb emissions growth. Such measures include more efficient production technologies, which are expected to be widely deployed in the industry sector by 2020, and fuel switch options for the transport sector (e.g., 20% of the buses and taxis use CNG and LPG by 2020 and 80% by 2050).
The NDC refers to National Socio-economic Development Strategy 2011–2020 [24], and among its goals is that the urbanization rate achieves more than 45%; this means that the management of urban energy consumption would be fundamental to achieving the NDC target. On the other side, the strategy estimates that annual energy consumption decreases at 2.5–3% relative to GDP.
Additional energy-related policies that form the basis for the NDC are:
  • National Target Program to Respond to Climate Change (2009–2015)
  • National Socio-economic Development Strategy (2011–2020)
  • Socio-economic Development Plan (2011–2015)
  • Law on Environment (6/2014)
  • Law on Economical and Efficient use of Energy (6/2010).

3.6.3. Other National Policies and Plan

The Renewable Energy Development Strategy 2016–2030, adopted in November 2015 by the government of Vietnam, guides renewable energy development in the country, setting clear medium and long-term goals. According to the strategy, Vietnam will promote onshore wind power until 2030 and assess offshore wind resources potential as an electricity solution post-2030.

4. Discussion

The following figures compare the six countries in terms of (a) energy-related CO2 emissions and targets by country (Figure 7), (b) per-capita energy-related CO2 emissions and targets by country (Figure 8), and (c) per GDP energy-related CO2 emissions and targets by country (Figure 9). Key points include:
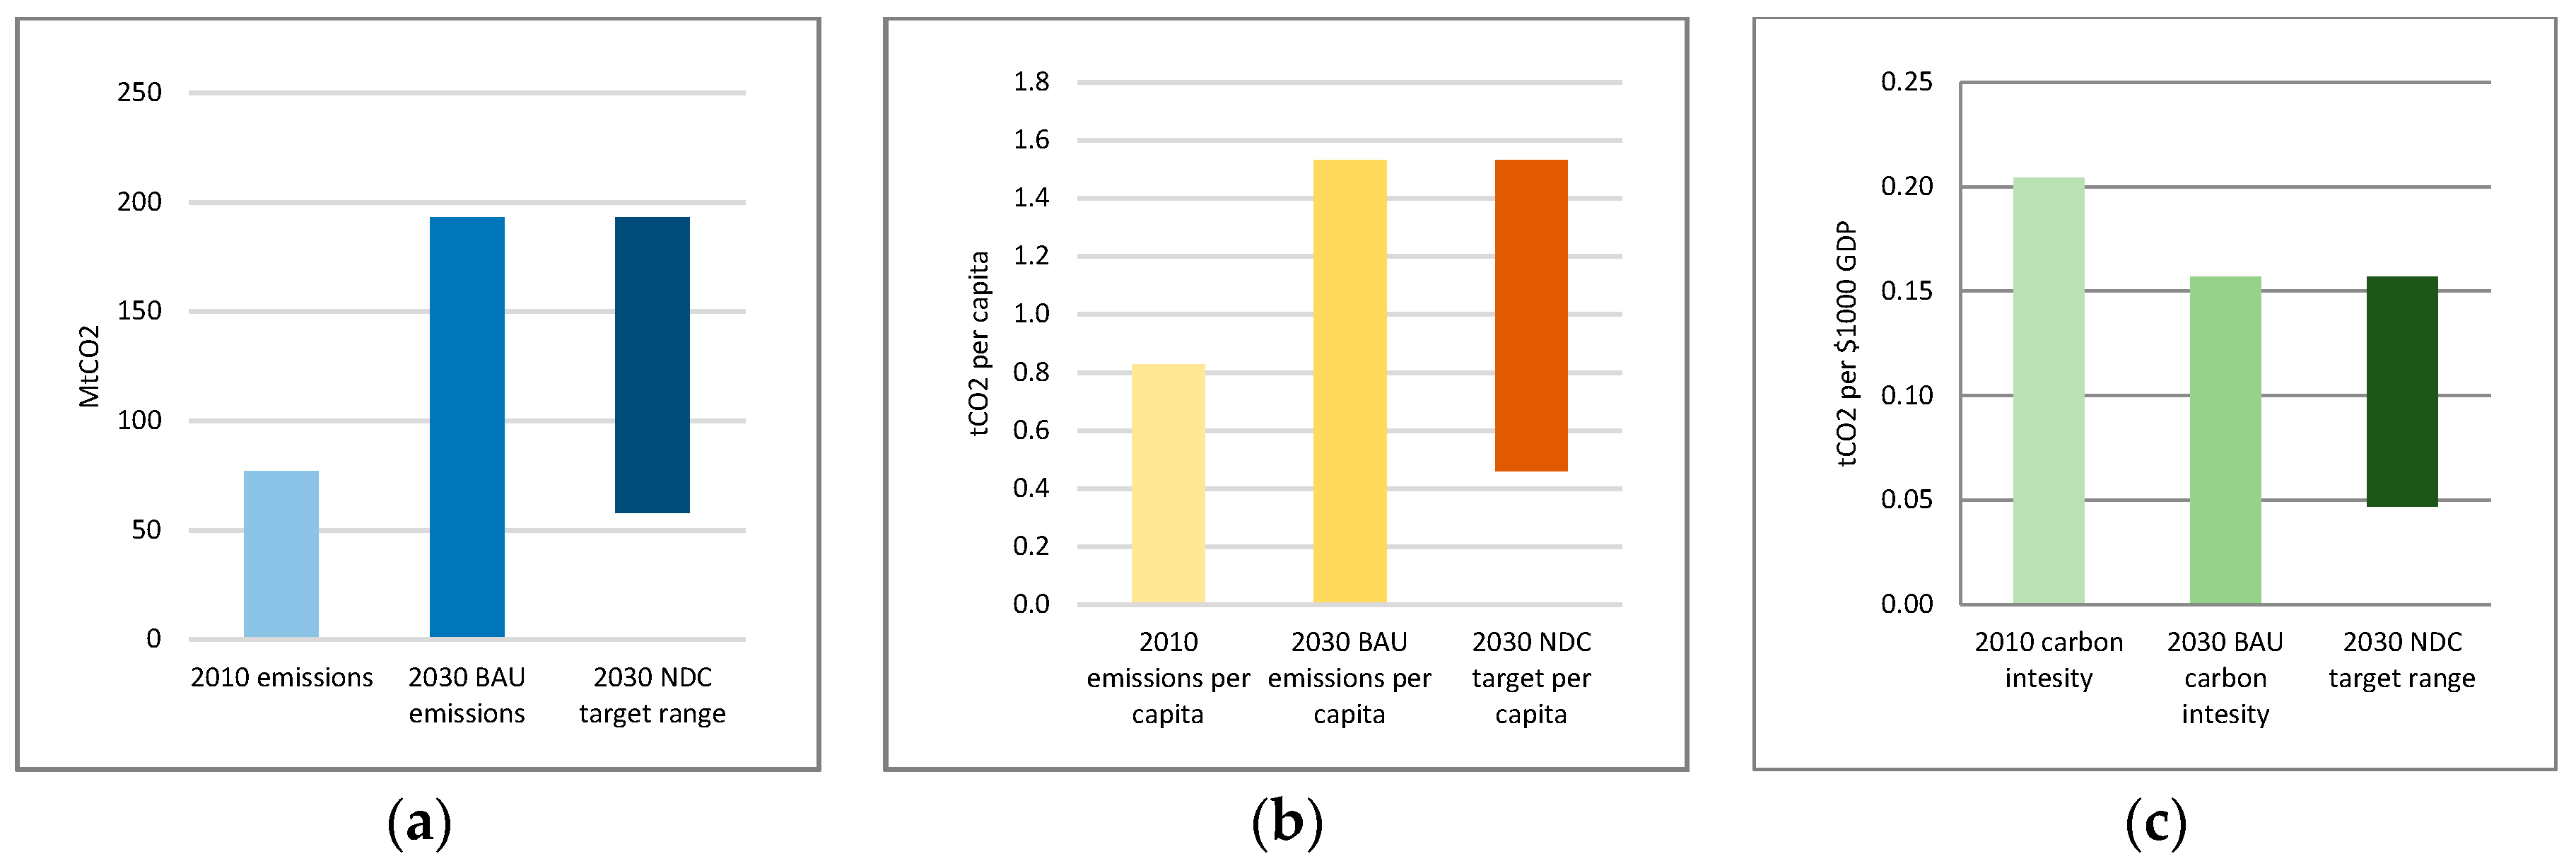
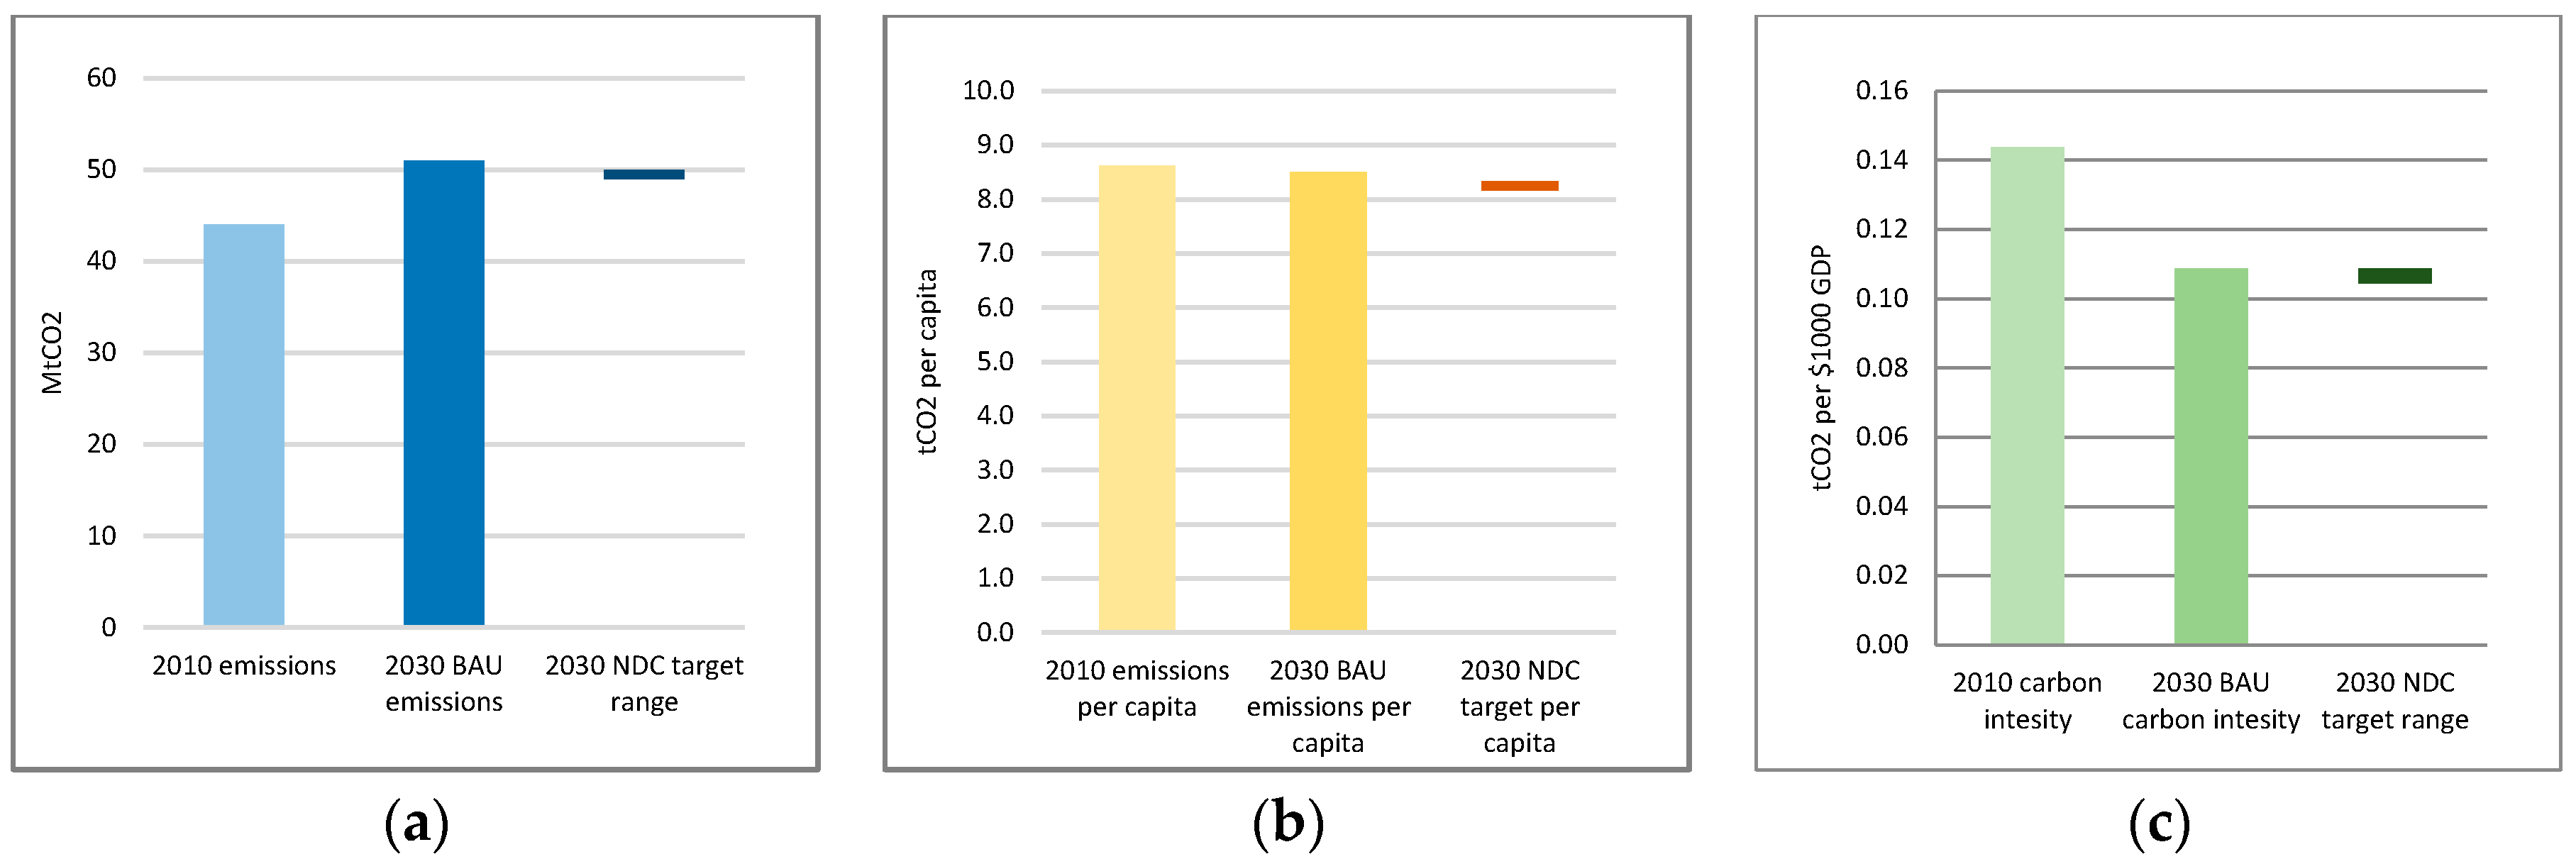
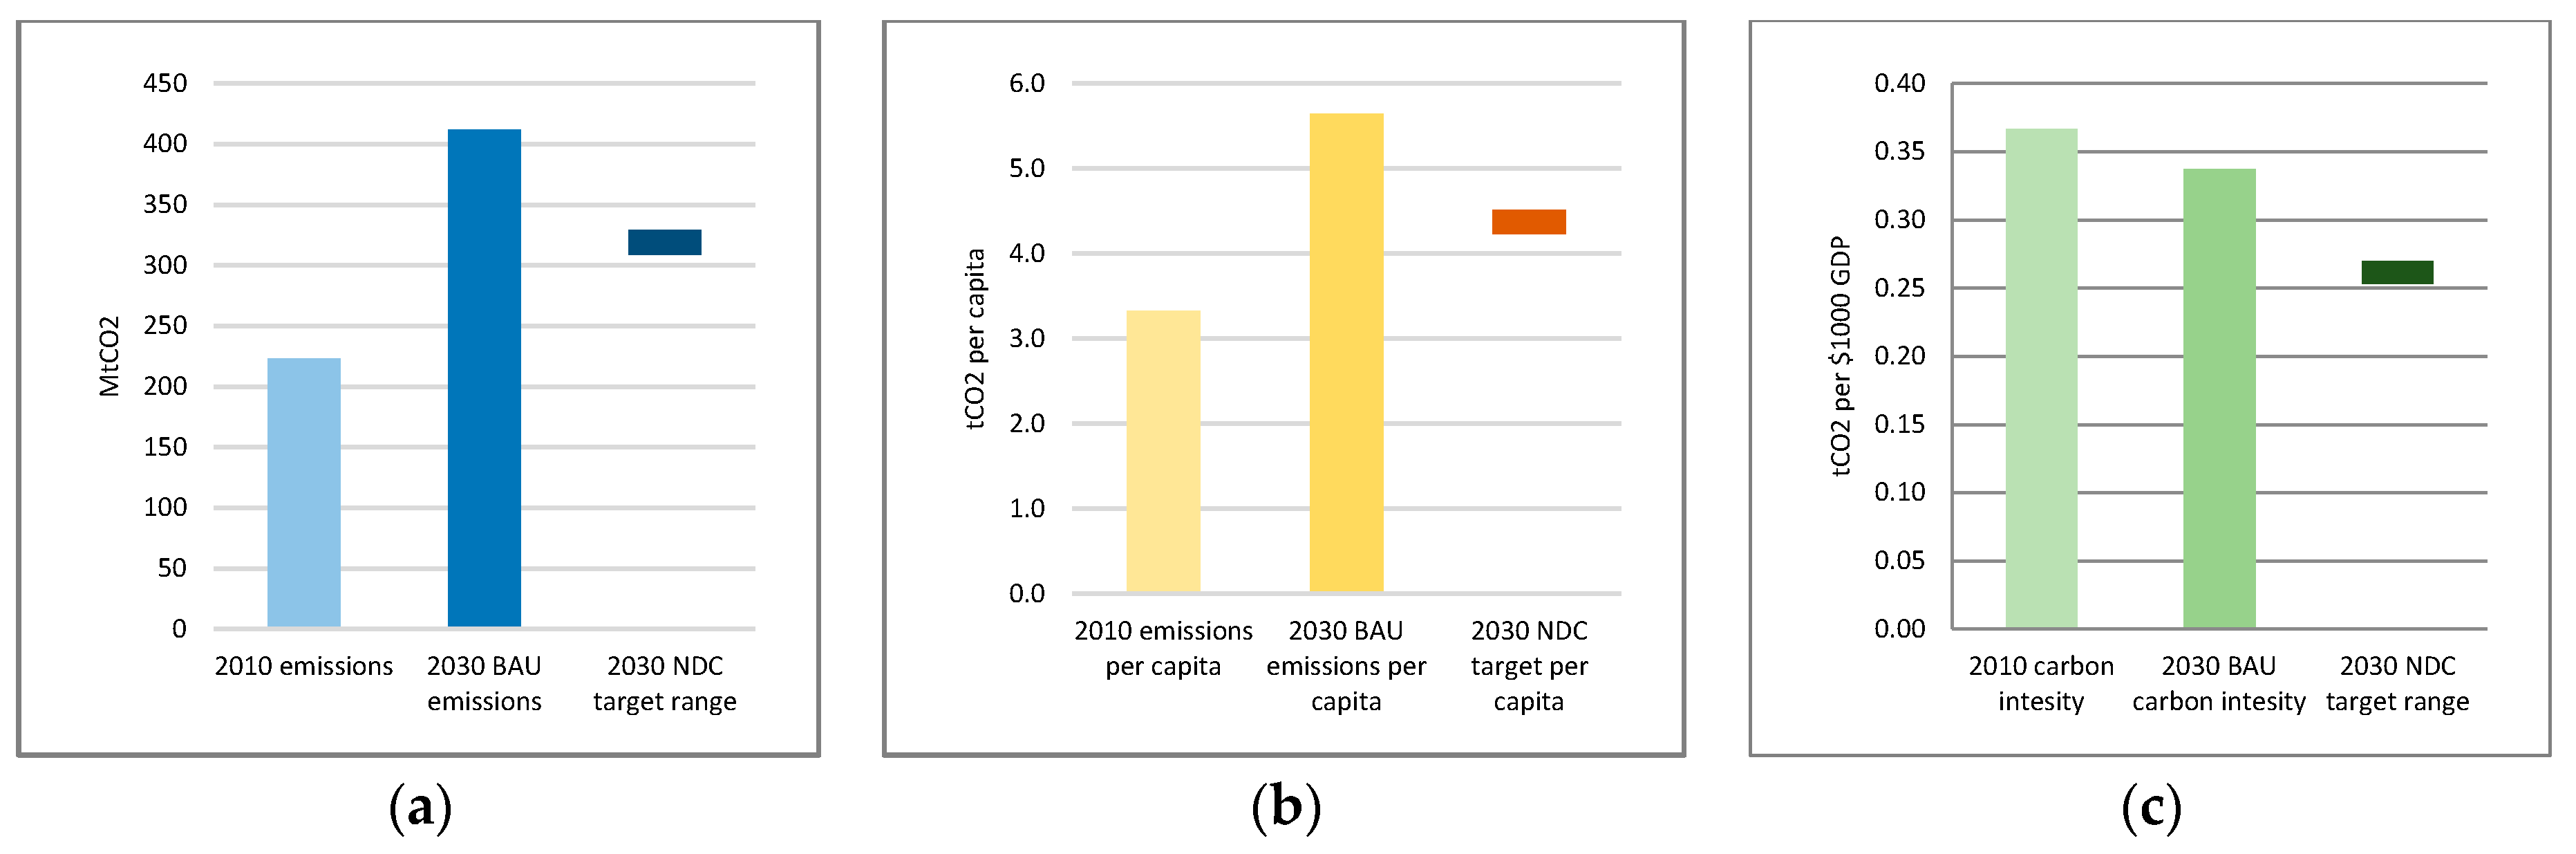
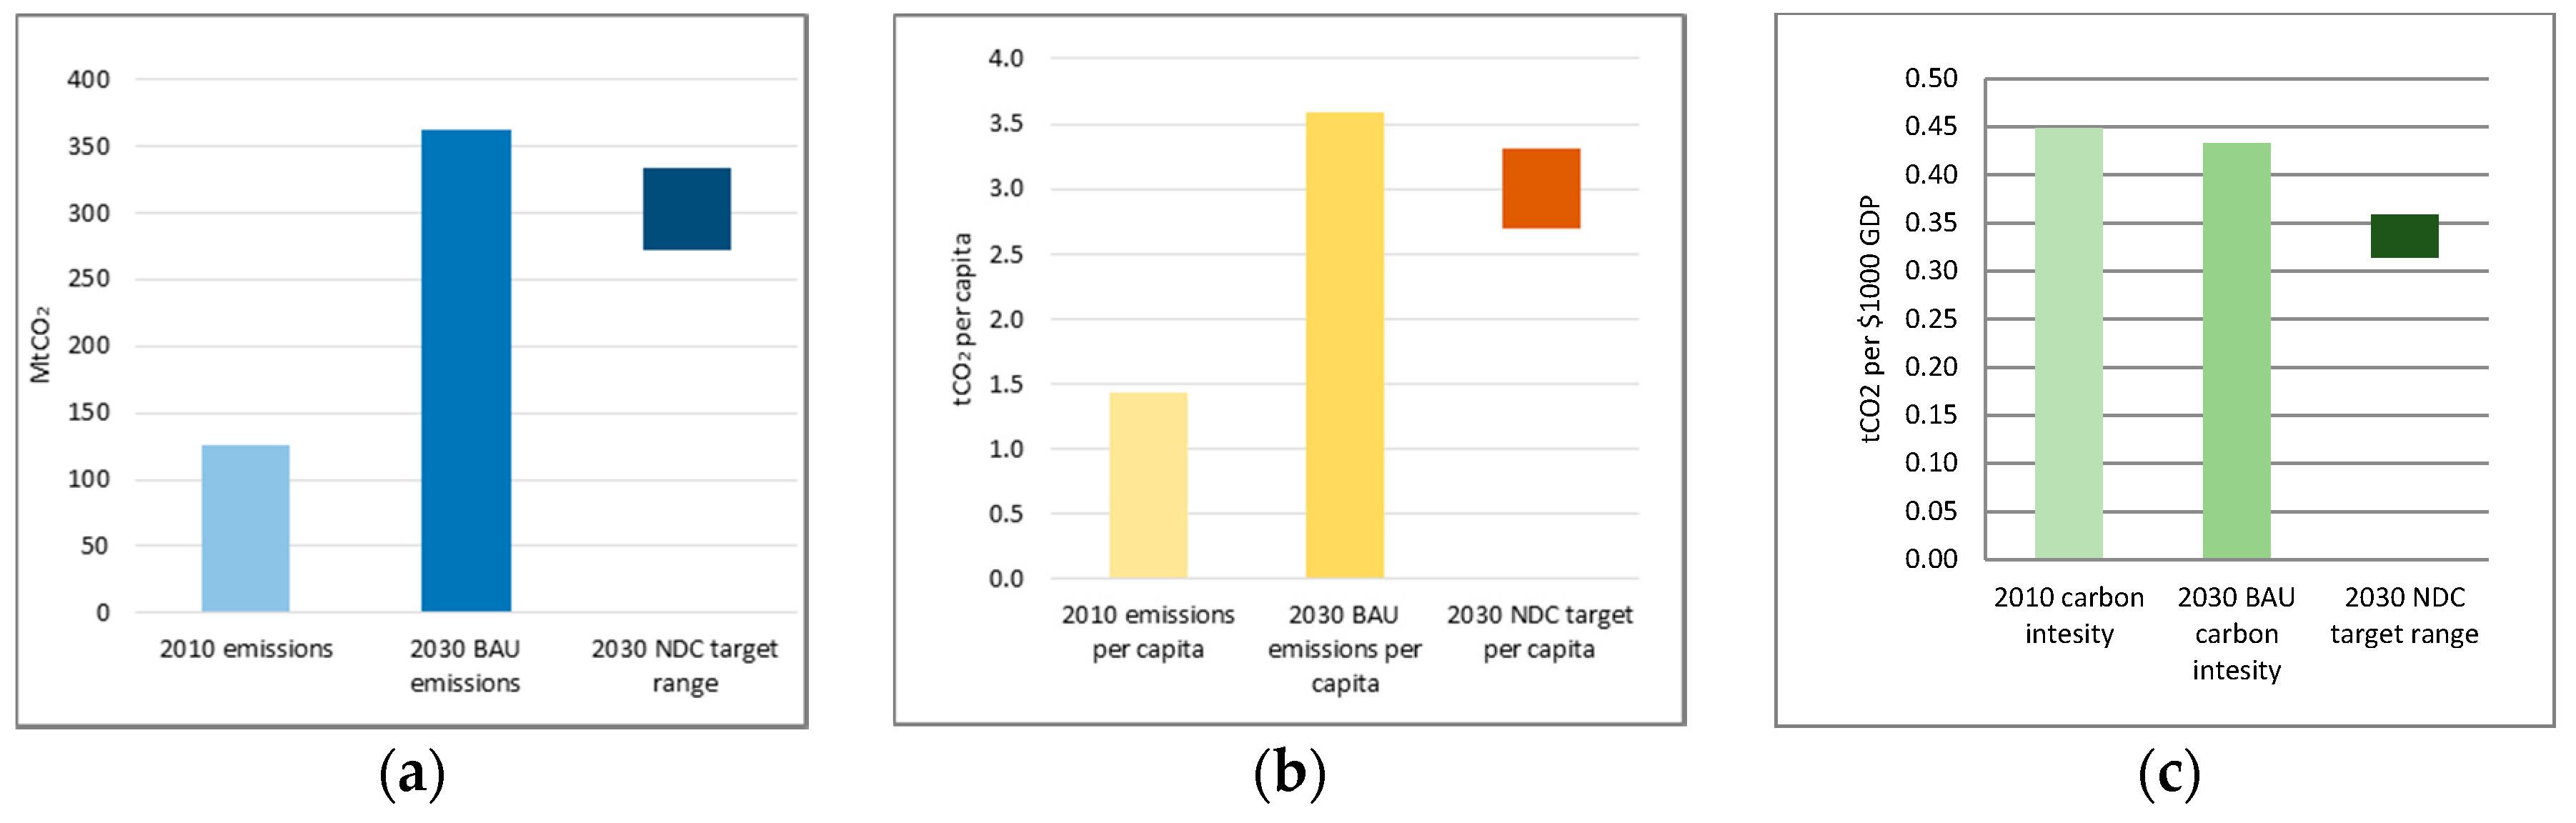
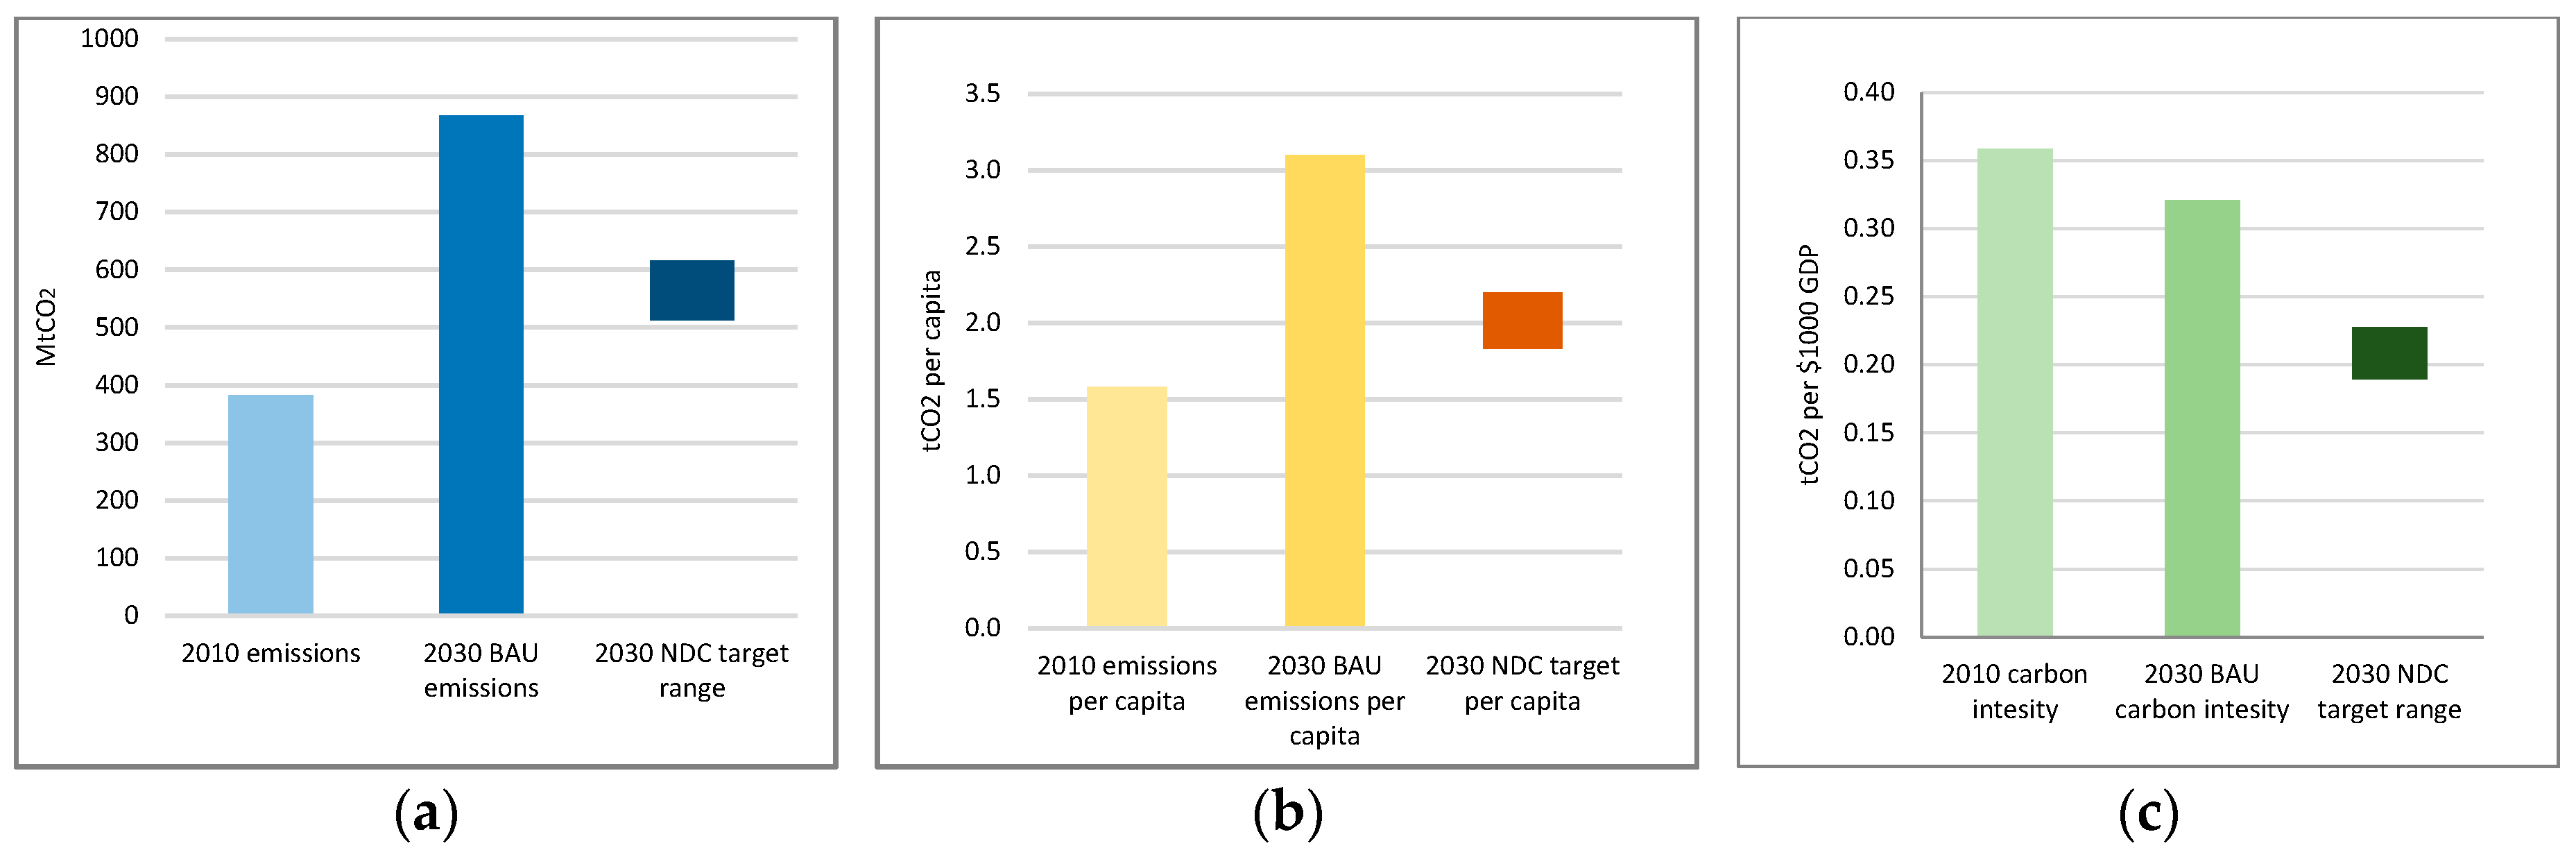
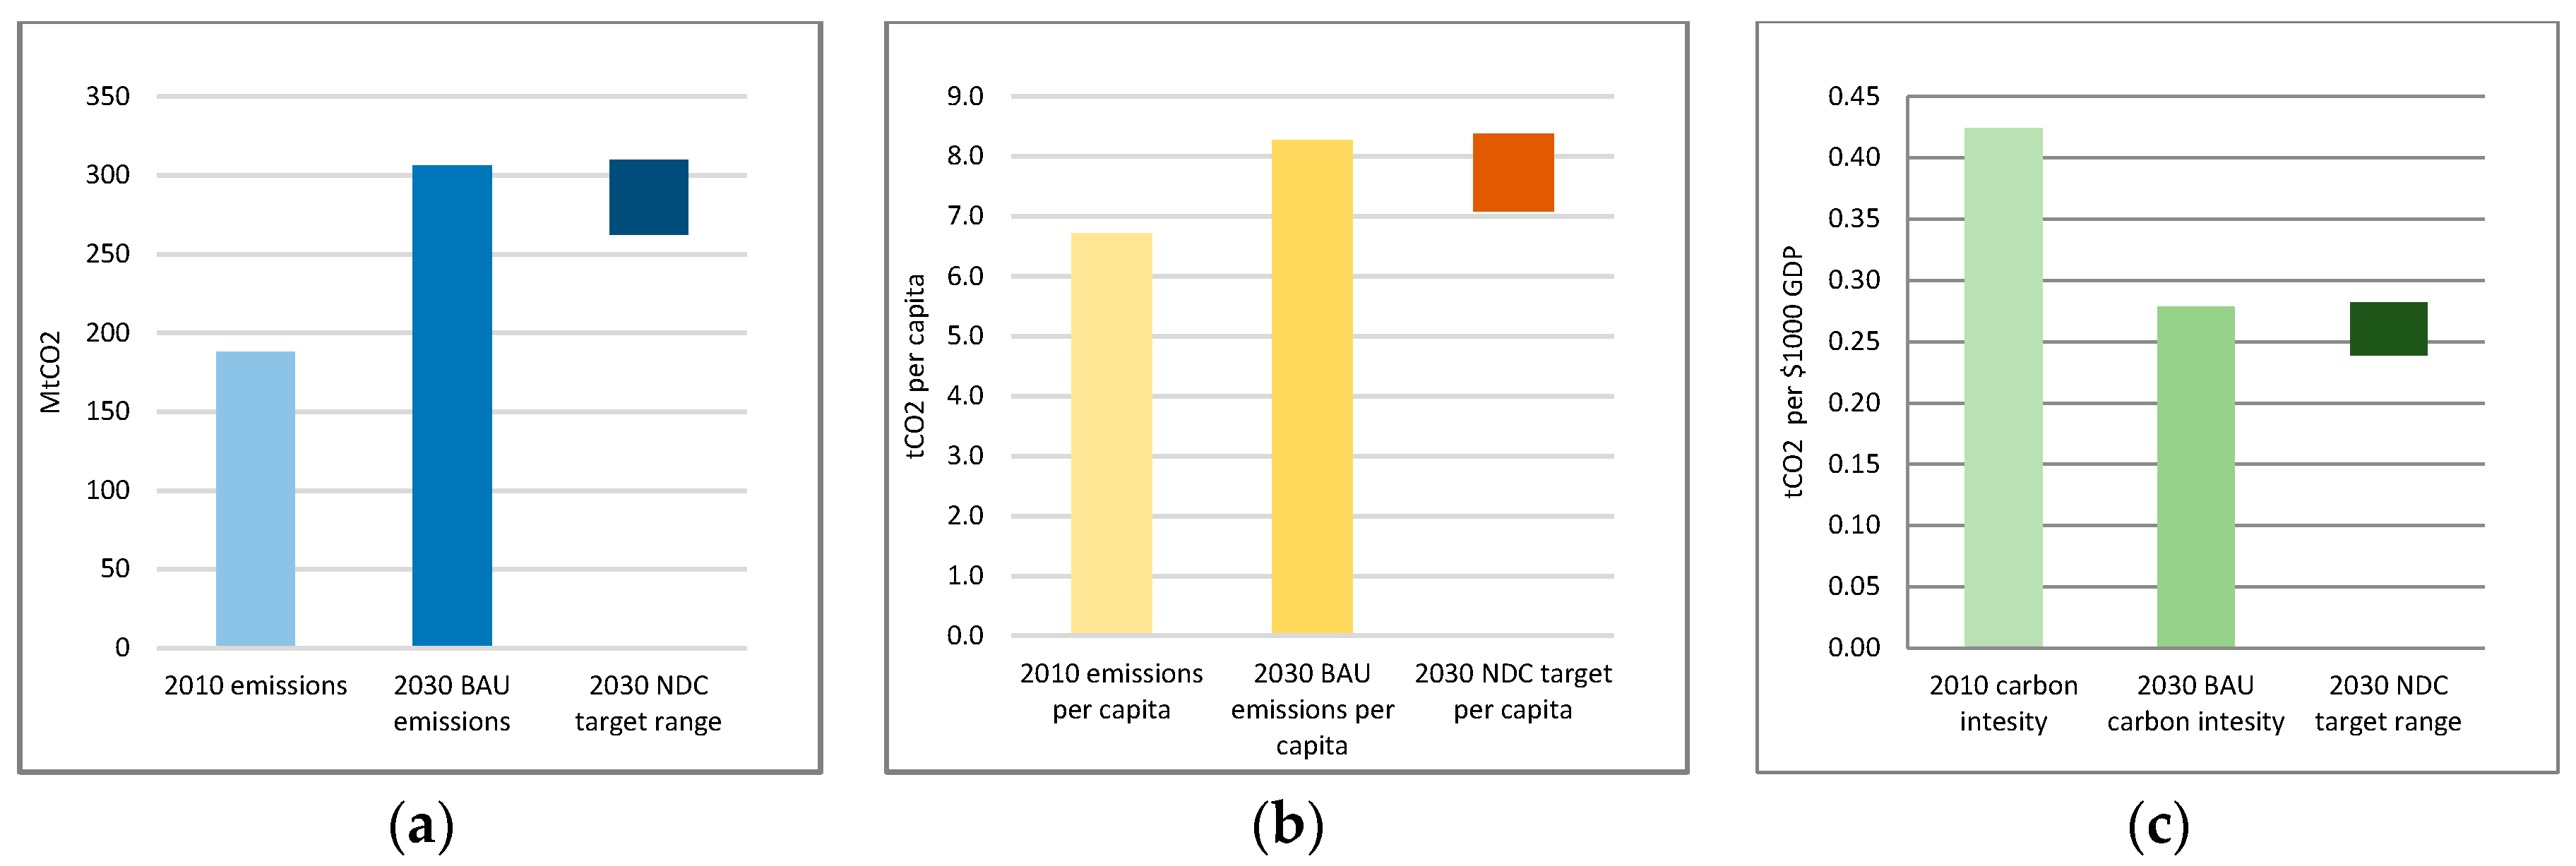
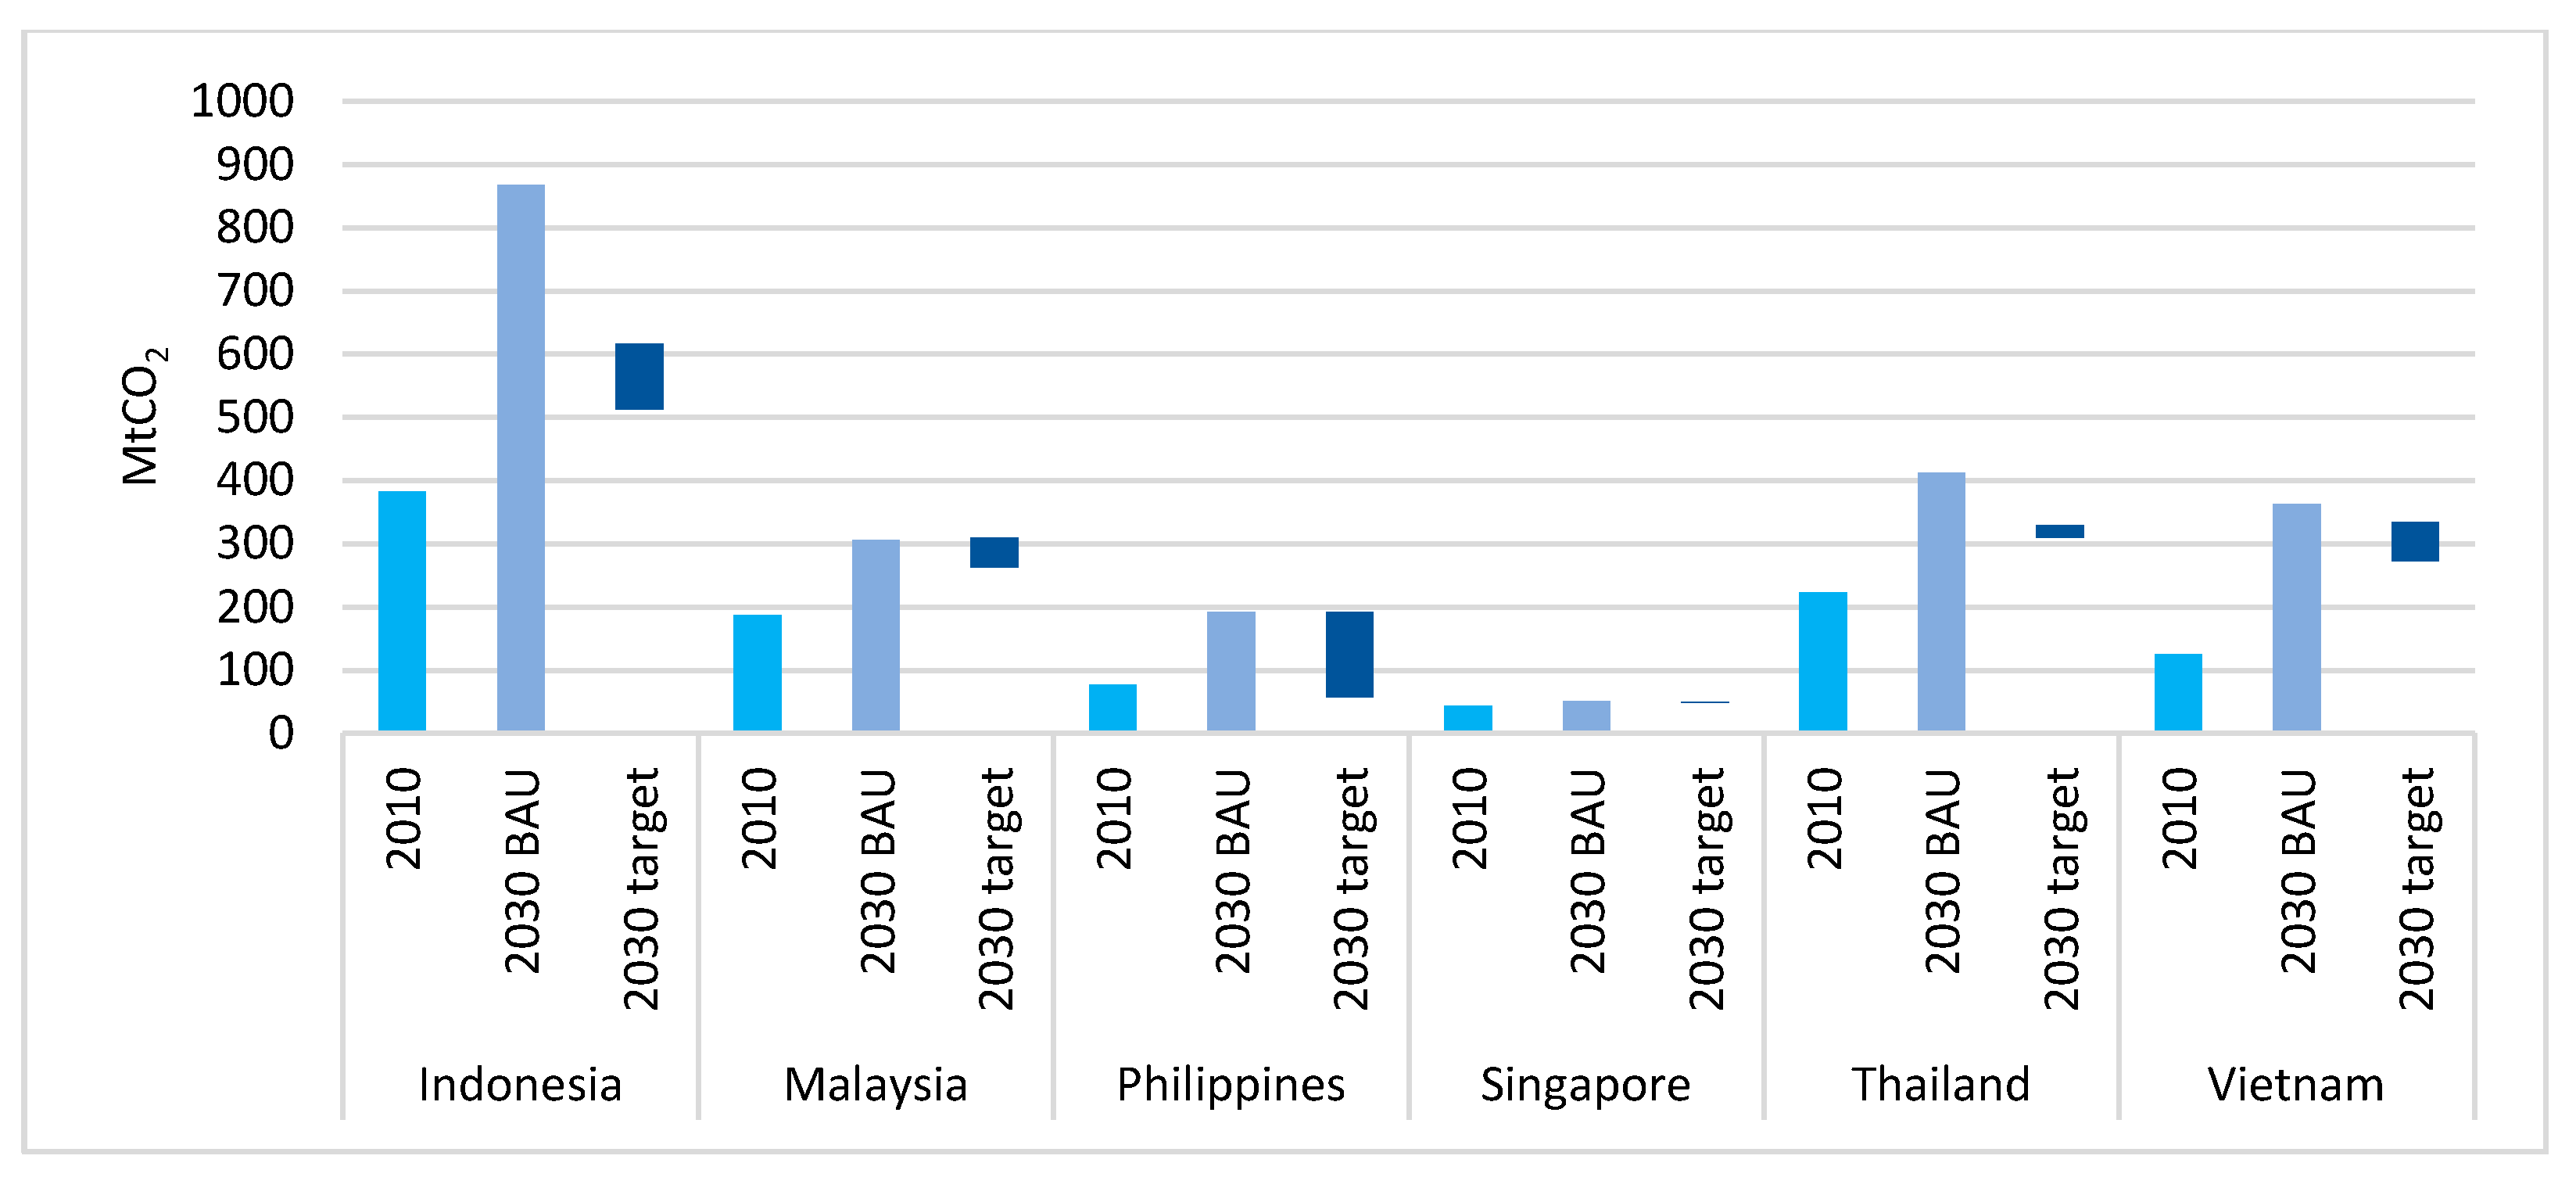
  • Most countries are expected to see rapid growth in energy-related CO2 emissions between 2010 and 2030 in a business as usual (BAU) projection, i.e., with no policy action. This ranges from more than a doubling (e.g., Indonesia, Philippines and Vietnam), to relatively small increases (Singapore).
  • The targeted reductions vary in terms of the size of the range of targets (which relate to various conditionalities put on achieving the targets, and/or an actual indicated range of targets), the position of this range relative to the BAU emissions in 2030 (and extent of reductions compared to 2030), and the position relative to 2010 emissions. Some countries (such as Indonesia and the Philippines) have targets that extend well below 2030 levels and even, in the case of the Philippines, reach their 2010 levels. Other countries have little or no reductions relative to the projected 2030 emissions.
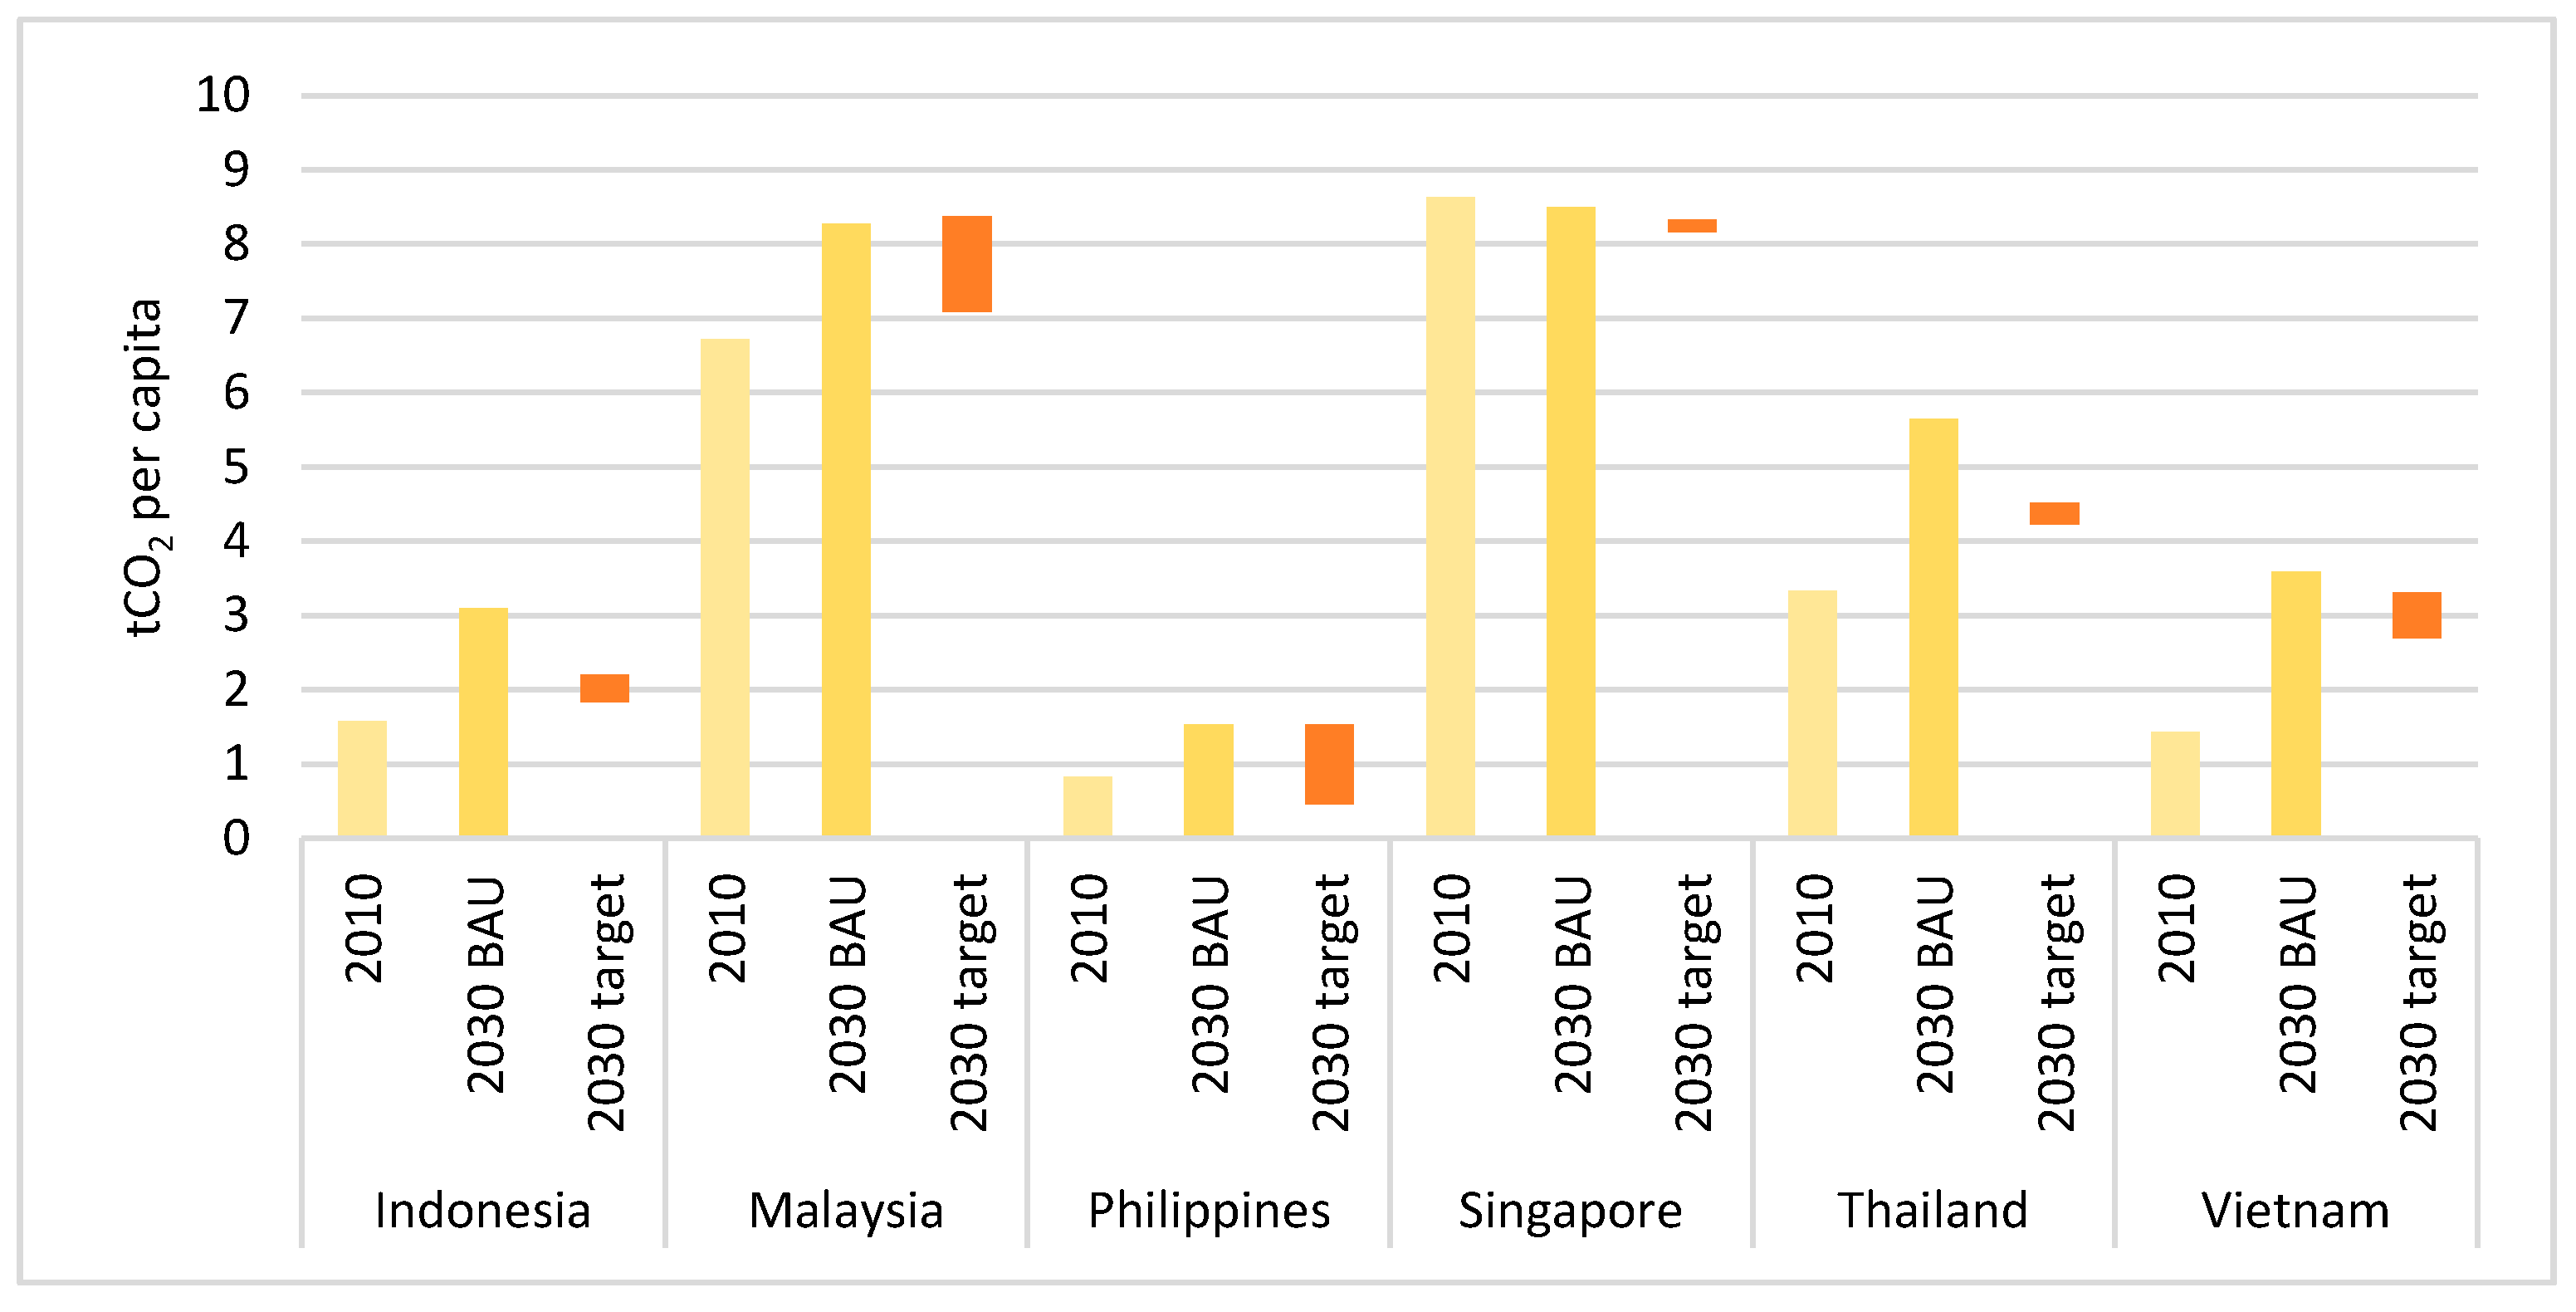
  • On a per-capita basis, the relative position of the bars is similar, but substantial differences in today’s and projected future emissions per person become evident. Some countries (Indonesia, Philippines, Vietnam) had very low per-capita emissions in 2010, while others had significantly higher per-capita emissions. Targeted emissions in 2030 also vary considerably per capita, with the Philippines being notable for a very low per-capita target.
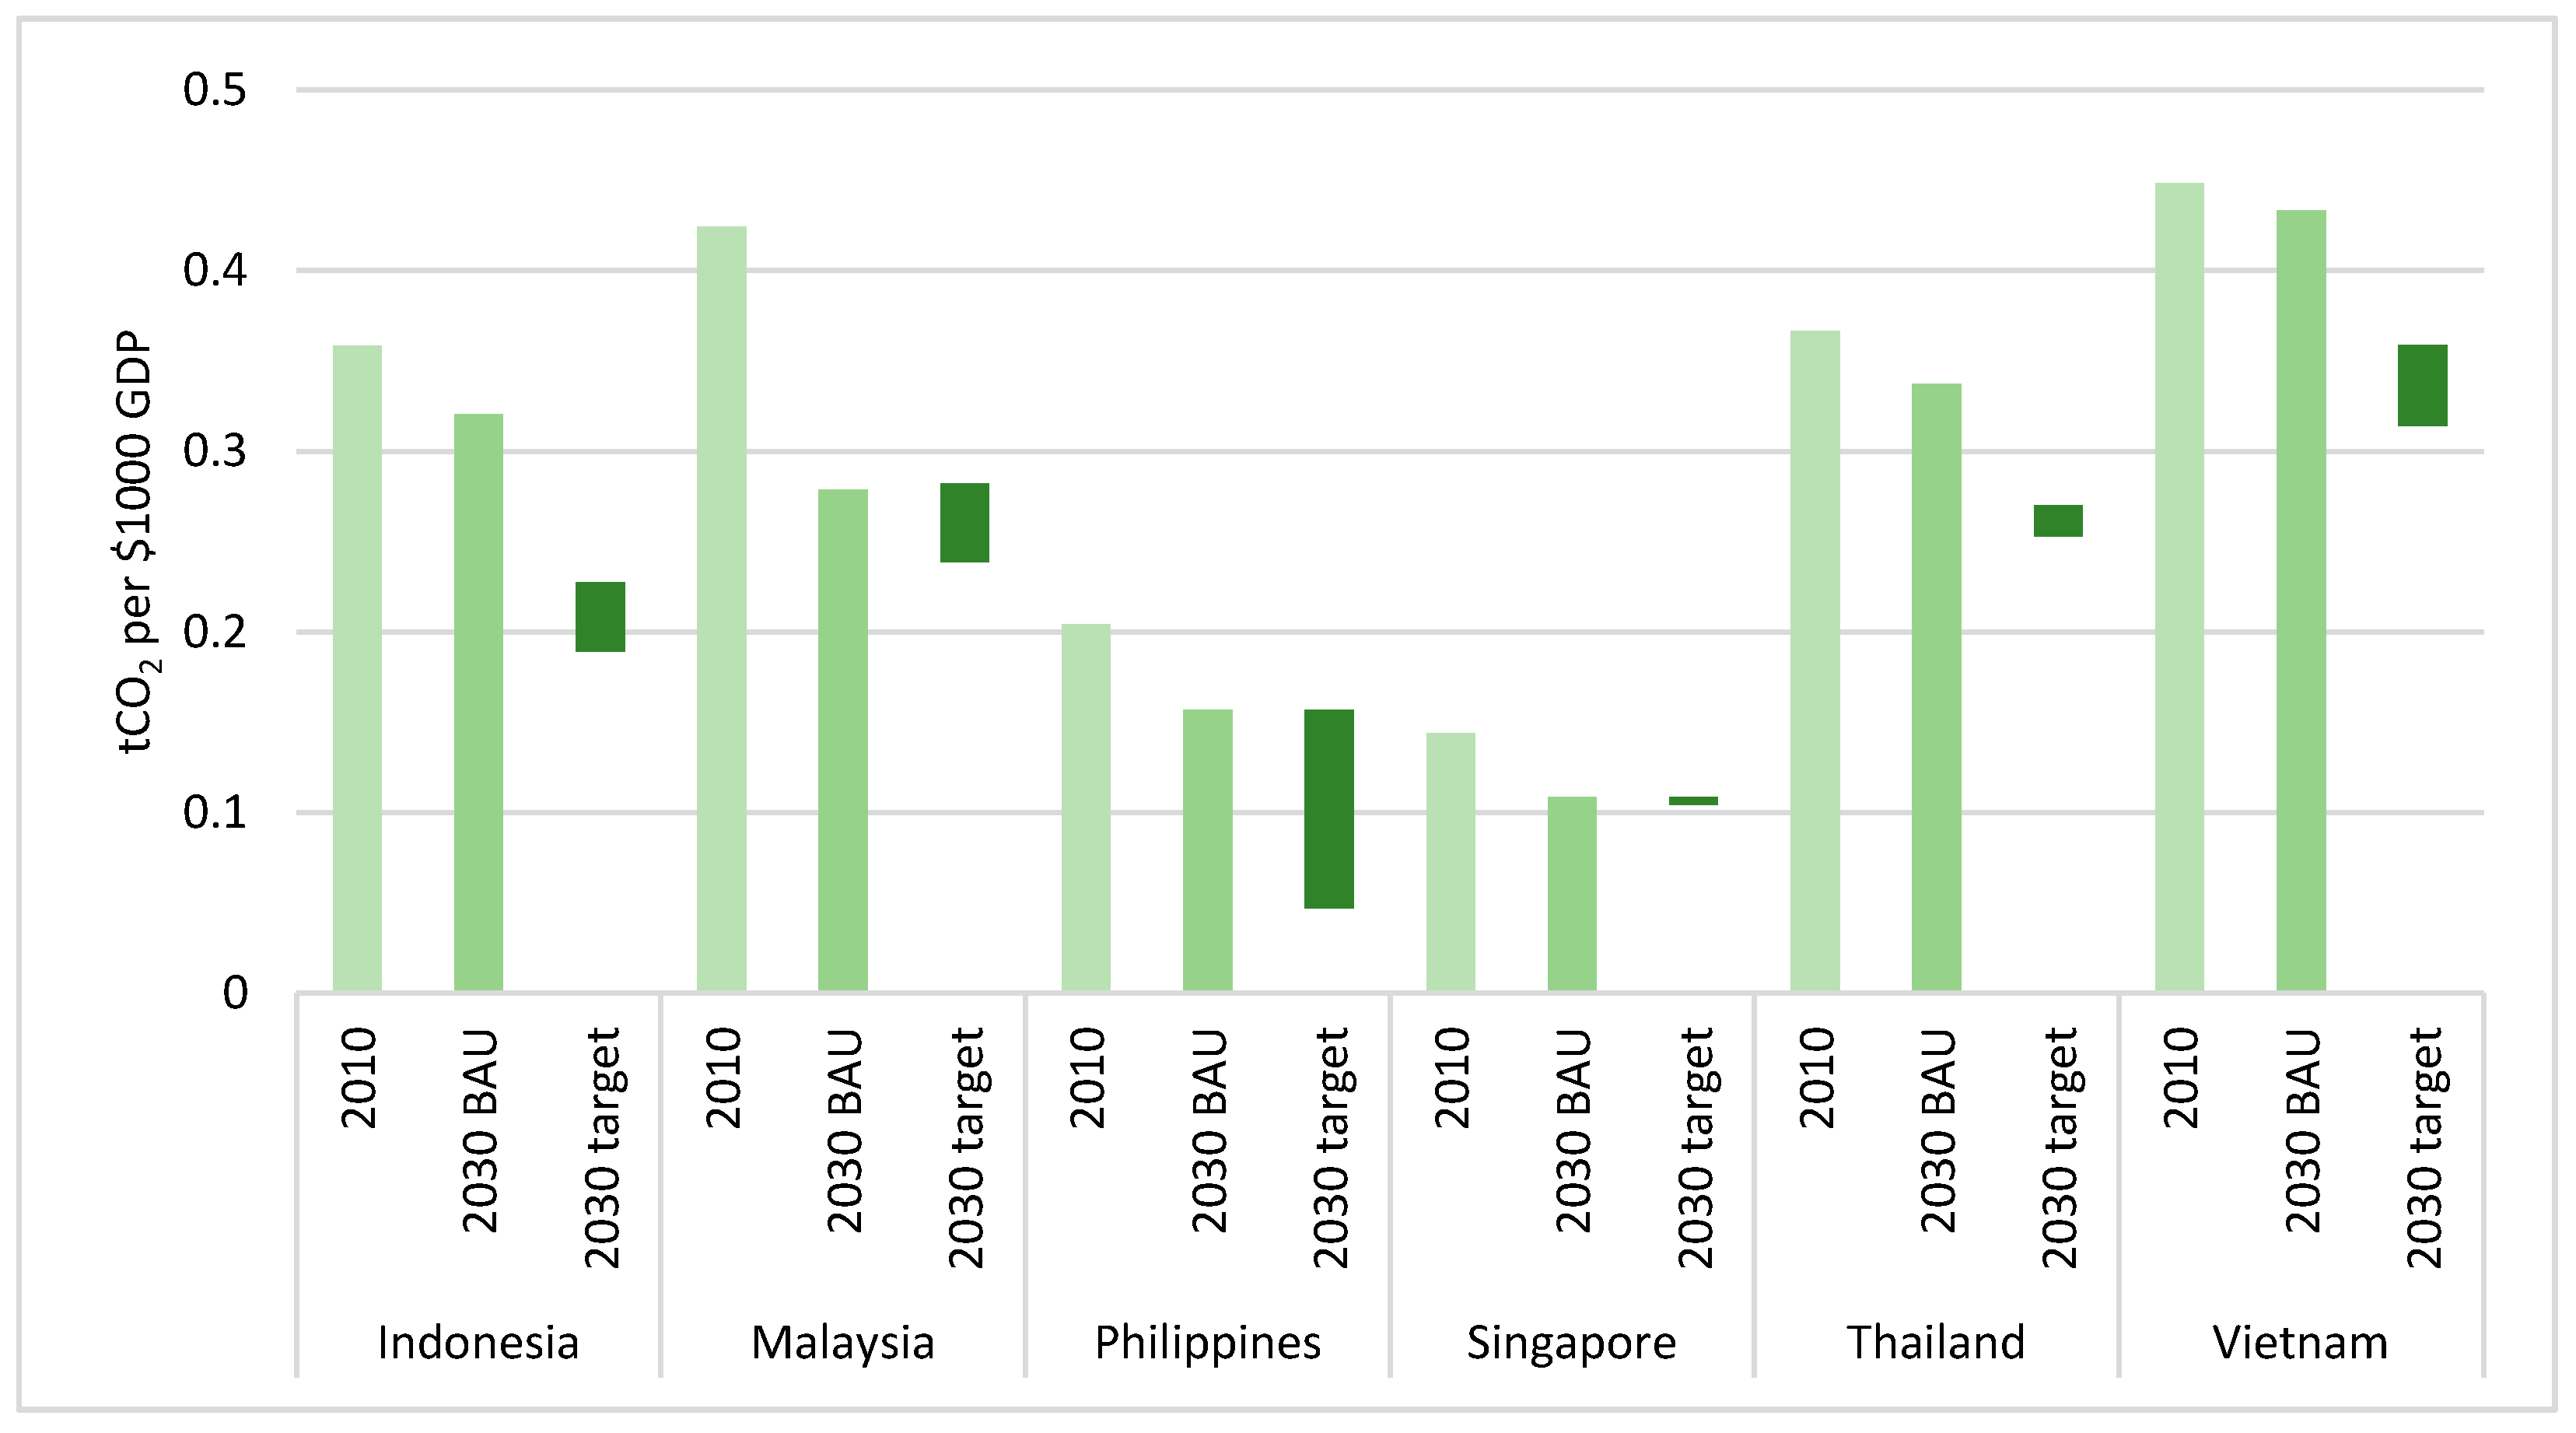
  • On a per-GDP basis (carbon intensity of economic output), variations are again quite significant, but the relative positions of different countries change considerably from a per-capita view. Singapore, with the highest 2010 per-capita emissions, and the lowest emissions per unit GDP.
Table 1 below summarizes the NDC targets of the selected countries and lists key policies that have been announced either in the NDC or in other recent policy documents and initiatives that may contribute to the stated CO2 reduction targets. All six countries mention some types of actions related to energy use, but there are relatively few specific policies in each country that have clear CO2-related targets, and even fewer where a clear link to expected CO2 reductions is made. Most of the countries have an energy efficiency target, either overall or for the power sector targets for the overall share of renewable energy sources are also common, including for electricity generation and biofuels for transportation. Few specific targets regarding end-use energy efficiency or behavior change are mentioned. Overall, none of the strategies is well-developed or presented as a comprehensive approach to cutting energy-related CO2 emissions across sectors.

5. Conclusions

This paper has reviewed the NDC plans of six Southeast Asian countries and compared their current and projected future CO2 levels across sectors, and their stated targets in the socio-economic context. This comparison reveals wide variations in targets, with the “ambition” level changing as the perspective changes from total CO2 to CO2/capita to CO2/unit GDP. The review of national plans as stated in NDCs found that while there are many types of policies listed, few measures are quantified with regard to their CO2 mitigation potential and no attempts are made to discuss the feasibility of the various proposed measures and the likelihood of achieving the stated targets.
The analysis presented in this paper shows that more analyses are needed to better understand what impacts current policies and plans are likely to have on CO2 emissions, and whether current plans are adequate to hit targets. In addition, without further alignment of targets, it appears likely that these countries (as other countries) will fail to transition towards a low-carbon development pathway that is in line with the Paris Agreement. As the national contributions to the Paris Agreement process evolve, a clearer vision for transition pathways for specific sectors and the associated costs, benefits and CO2 emission reduction potentials must be properly outlined to add credibility to the NDCs.
Future iterations of the NDCs will need to be more specific on sectoral actions to provide meaningful policy guidance, and requests for international assistance sought by the countries will need to be more targeted to specific focus area, especially for industrial and transport sectors as they are key sectors in ASEAN countries in terms of emissions in the future. Regional knowledge exchange and transfer of best practices could help to accelerate gains in efficiency and avoid costs.

Acknowledgments

Research for this paper has been carried out under the SOLUTIONS (604714), FUTURE RADAR (723970) and SUSTAIN EU-ASEAN (603218) projects funded from the European Union’s Sevens Framework Programme and Horizon 2020 (http://www.urban-mobility-solutions.eu, http://www.uemi.net and https://sustain-eu-asean.net).

Author Contributions

Alvin Mejia, Magdala Arioli and Kathleen Dematera collected the data. Lew Fulton and Magdala Arioli assessed the data and wrote the analysis with contributions from Oliver Lah.

Conflicts of Interest

The authors declare no conflict of interest.

References

  1. United Nations Framework Convention on Climate Change. UNFCCC Synthesis Report on the Aggregate Effect of Intended Nationally Determined Contributions. 2016. Available online: http://unfccc.int/resource/docs/2016/cop22/eng/02.pdf (accessed on 27 June 2017).
  2. Zhang, W.; Pan, X. Study on the demand of climate finance for developing countries based on submitted INDC. Adv. Clim. Chang. Res. 2016, 7, 99–104. [Google Scholar] [CrossRef]
  3. Fujimori, S.; Su, X.; Liu, J.Y.; Hasegawa, T.; Takahashi, K.; Masui, T.; Takimi, M. Implication of Paris Agreement in the context of long-term climate mitigation goals. SpringerPlus 2016, 5. [Google Scholar] [CrossRef]
  4. Lah, O. Continuity and Change: Dealing with Political Volatility to Advance Climate Change Mitigation Strategies—Examples from the Transport Sector. Sustainability 2017, 9, 959. [Google Scholar] [CrossRef]
  5. CAIT Climate Data Explorer. Available online: http://cait.wri.org (accessed on 14 December 2016).
  6. United Nations Framework Convention on Climate Change. INDCs as Communicated by Parties. Available online: http://www4.unfccc.int/submissions/indc/Submission%20Pages/submissions.aspx (accessed on 14 December 2016).
  7. Asia Pacific Economic Cooperation. APEC Energy Demand and Supply Outlook, 6th ed.; Asia Pacific Energy Research Centre (APERC): Tokyo, Japan, 2016. [Google Scholar]
  8. Climate and Development Knowledge Network (CDKN). Indonesian Feed-In Tariffs: Challenges & Options. Available online: http://cdkn.org/wp-content/uploads/2015/04/ECN-Policy-Brief-Indonesian-Feed-in-tariff-140304.pdf (accessed on 14 December 2016).
  9. Climata Action Tracker (CAT). Rapid Phase out of Coal Essential, but Not Enough to Hold Warming below 2 °C. 2014. Available online: http://climateactiontracker.org/assets/publications/briefing_papers/CAT_BKM_2014.09.22_PRESS_DISTRIBUTION_final.pdf (accessed on 27 June 2017).
  10. International Energy Agency. Policies & Measures Databases. Biofuel Blending (Ministry Regulation No. 25/2013). Available online: https://www.iea.org/policiesandmeasures/pams/indonesia/name-140193-en.php (accessed on 27 June 2017).
  11. International Energy Agency. Policies & Measures Databases. Transport Ministerial Regulation No. 201/2013. Available online: https://www.iea.org/policiesandmeasures/pams/indonesia/name-140152-en.php (accessed on 27 June 2017).
  12. United Nations Framework Convention on Climate Change. NS-89—Smart Street Lighting Initiative. Available online: http://www4.unfccc.int/sites/nama/_layouts/un/fccc/nama/NamaSeekingSupportForImplementation.aspx?ID=55&viewOnly=1 (accessed on 14 December 2016).
  13. United Nations Framework Convention on Climate Change. UNFCCC Public NAMA. NS-65—Sustainable Urban Transport Initiative. Available online: http://www4.unfccc.int/sites/nama/_layouts/un/fccc/nama/NamaSeekingSupportForImplementation.aspx?ID=43&viewOnly=1 (accessed on 27 June 2017).
  14. Ministry of Plantation Industries and Commodities Malaysia. National Biofuel Policy. Available online: http://www.e-kilangmpob.com.my/biodiesel/document/Malaysia%20Biofuel%20Policy.pdf (accessed on 14 December 2016).
  15. News Straits Times Press. Fuel Prices Go Up in October. Available online: http://www.nst.com.my/news/2016/09/177225/fuel-prices-go-october (accessed on 14 December 2016).
  16. Sustainable Energy Development Authority Malaysia. National Renewable Energy Policy and Action Plan (2009). Available online: http://www.seda.gov.my/?omaneg=00010100000001010101000100001000000000000000000000&s=31 (accessed on 14 December 2016).
  17. Lopez, G.; Laan, T. Biofuels—At what cost? Government Support for Biodiesel in Malaysia; International Institute for Sustainable Development: Geneva, Switzerland, 2008; Available online: https://www.iisd.org/gsi/sites/default/files/Final_Malaysia_2.pdf (accessed on 27 June 2017).
  18. National Climate Change Action Plan 2011–2028. Available online: http://faolex.fao.org/docs/pdf/phi152934.pdf (accessed on 14 December 2016).
  19. Department of Energy Republic of Philippines. National Renewable Energy Program (NREP). Available online: https://www.doe.gov.ph/national-renewable-energy-program (accessed on 14 December 2016).
  20. Department of Energy Republic of Philippines. Philippines Energy Plan 2012–2030. Available online: https://www.doe.gov.ph/sites/default/files/pdf/pep/2012–2030_pep.pdf (accessed on 14 December 2016).
  21. National Environmentally Sustainable Transport (EST) Strategy for the Philippines. Available online: http://www.uncrd.or.jp/index.php?page=view&type=13&nr=21&menu=232 (accessed on 14 December 2016).
  22. Hao, H.; Liu, Z.; Zhao, F.; Li, W. Natural gas as vehicle fuel in China: A review. Renew. Sustain. Energy Rev. 2016, 62, 521–533. [Google Scholar] [CrossRef]
  23. United Nations Framework Convention on Climate Change. UNFCCC Public NAMA. NS-246—People-Centred Urban Mobility in Thailand (Thailand Mobility NAMA). Available online: http://www4.unfccc.int/sites/nama/_layouts/un/fccc/nama/NamaSeekingSupportForImplementation.aspx?ID=167&viewOnly=1 (accessed on 14 December 2016).
  24. Vietnam’s Socio-Economic Development Strategy for the Period of 2011–2020. Available online: http://www.economica.vn/portals/0/maubieu/1d3f7ee0400e42152bdcaa439bf62686.pdf (accessed on 14 December 2016).
Figure 1. (a) Indonesia 2010, 2030 business-as-usual (BAU), and Nationally Determined Contribution (NDC) target CO2 emissions; (b) Indonesia 2010, 2030 BAU, and NDC target CO2 emissions per capita; (c) Indonesia 2010, 2030 BAU, and NDC target CO2 per $1000 GDP.
Sustainability 09 01160 g001
Figure 2. (a) Malaysia 2010, 2030 BAU, and NDC target CO2 emissions; (b) Malaysia 2010, 2030 BAU, and NDC target CO2 emissions per capita; (c) Malaysia 2010, 2030 BAU, and NDC target CO2 per GDP.
Sustainability 09 01160 g002
Figure 3. (a) Philippines 2010, 2030 BAU, and NDC target CO2 emissions; (b) Philippines 2010, 2030 BAU, and NDC target CO2 emissions per capita; (c) Philippines 2010, 2030 BAU, and NDC target CO2 per GDP.
Sustainability 09 01160 g003
Figure 4. (a) Singapore 2010, 2030 BAU, and NDC target CO2 emissions; (b) Singapore 2010, 2030 BAU, and NDC target CO2 emissions per capita; (c) Singapore 2010, 2030 BAU, and NDC target CO2 per GDP.
Sustainability 09 01160 g004
Figure 5. (a) Thailand 2010, 2030 BAU, and NDC target CO2 emissions; (b) Thailand 2010, 2030 BAU, and NDC target CO2 emissions per capita; (c) Thailand 2010, 2030 BAU, and NDC target CO2 per GDP.
Sustainability 09 01160 g005
Figure 6. (a) Vietnam2010, 2030 BAU, and NDC target CO2 emissions; (b) Vietnam 2010, 2030 BAU, and NDC target CO2 emissions per capita; (c) Vietnam 2010, 2030 BAU, and NDC target CO2 per GDP.
Sustainability 09 01160 g006
Figure 7. Energy-related CO2 emissions and targets by country.
Sustainability 09 01160 g007
Figure 8. Per-capita energy-related CO2 emissions and targets by country.
Sustainability 09 01160 g008
Figure 9. Per GDP energy-related CO2 emissions and targets by country.
Sustainability 09 01160 g009
Table 1. NDC targets and policies.
CountryINDC RatifiedEnergy Related Emissions (%) (2010)Targets (Unconditional-Conditional)Type of Target and Against What?Key Targets and Quantified Policies to Achieve TargetMain Policies Related to Energy Cited in the INDC
IndonesiaYes20%29–41%Absolute BAU 2030Increase of renewable energy to 23% of primary energy supply by 2025National Energy Policy, National Action Plan for Greenhouse Gas Emission Reduction, National Medium Term Development Plan 2015–2019,National Team for Biofuel Development and Biofuel Roadmap, Transport Ministerial Regulation No. 201
Major increases in biofuel blending in transport and electric sector
Sustainable urban transport initiative with avoid/shift/improve aspects
MalaysiaYes58%35–45%GHG intensity per GDP against 2005 levels (0.531 tons CO2e per thousand RM)Biodiesel blending targetsNational Biofuel Policy 2006, National Renewable Energy Policy and Action Plan, Eleventh Malaysia Plan 2016–2020, National Renewable Energy Policy and Action Plan, National Biofuel Policy 2006
Removal of energy subsidies
Renewables to reach 11% of electricity generation by 2030
Investments in rapid transit
Increase in natural gas vehicles
PhilippinesNo51%70% (conditional)Absolute BAU 203010% energy savings on total annual energy demand of all economic sectors by 2030National Climate Change Action Plan 2011–2028, National Renewable Energy Program, Biofuels Act of 2006, Renewable Energy Act of 2008, Philippine Energy Plan, National Environmentally Sustainable Transport Strategy 2010–2020, National Energy Efficiency and Conservation Program
30% of all public utility vehicles running on alternative fuels nationwide by 2030
Natural gas as a major alternative fuel for public transport; and addition of CNG refilling stations and LNG hub terminals
SingaporeYes77%36% (general)Emissions intensity reduction against 2005 levels (0.176 kgCO2e/S$ in 2005, 0.113 kgCO2e/S$ in 2030), and total emissions to peak by 2030Renewable energy to reach 8% of peak electricity demand by 2030Energy Conservation Act, Grant for Energy Efficient Technologies (GREET), Energy Efficiency Improvement Assistance Scheme (EASe), Building Control Act, Mandatory Energy Labelling Scheme (MELS)
Achieve “greening” of 80% of buildings by 2030
Length of rail network to be doubled by 2030
Vehicle and road taxes ongoing; CO2 based as of 2013
ThailandYes53%20–25%Absolute BAU 2030Increase to 30% renewable share of energy consumption in 2036Climate Change Master Plan 2015–2050, Energy Efficiency Plan 2015–2036, Alternative Energy Development Plan 2015–2036, Environmentally Sustainable Transport System Plan 2013–2030
Reduce the country’s energy intensity by 30% below the 2010 level in 2036
Master plan targets 7–20% reduction of GHG emission from energy and transport sector by 2020 relative to BAU.
Major improvements to transit systems and urban infrastructure to encourage modal shift to transit
VietnamYes41%8–25%Absolute BAU 2030; subgoals Emission intensity per unit of GDP will be reduced by 20–30% compared to the 2010 levelsAnnual energy consumption decreases at 2.5–3% of GDP. National Green Growth Strategy, National Climate Change Strategy, National Socio-economic Development Strategy, Renewable Energy Development Strategy 2016–2030
90% of industrial production facilities use cleaner technologies and save energies, fuels, and materials by 2020
20% of buses and taxis use CNG and LPG by 2020 and 80% by 2050

