Clean Technologies in Agriculture—How to Prioritise Measures?


1
Institute of Natural Resource Sciences, Zurich University of Applied Sciences, 8820 Wädenswil, Switzerland
2
Former Student at Institute of Natural Resource Sciences, Zurich University of Applied Sciences, 8820 Wädenswil, Switzerland
*
Author to whom correspondence should be addressed.
Sustainability 2017, 9(8), 1303; https://doi.org/10.3390/su9081303
Submission received: 19 May 2017
/
Revised: 14 July 2017
/
Accepted: 21 July 2017
/
Published: 26 July 2017
(This article belongs to the Special Issue 6th World Sustainability Forum - Selected Papers)
Abstract
:As agriculture continues to be under pressure due to its negative environmental impacts, resource-efficiency and the use of clean technologies gain importance. Meanwhile, there is an abundance of technological solutions that help “clean” agriculture’s hotspots, either by reducing inputs, by producing renewable energy or by protecting ecosystems. Decisions about clean technologies remain difficult due to the variety of options, difficulties in cost-benefit calculations, and potential trade-offs in sustainability. We therefore addressed the issue of decision-making regarding clean technologies in agriculture. A multi-criteria decision analysis (MCDA) was used to rank the most sustainable technologies. Evaluation of 17 selected clean technologies was based on literature information and expert opinion. Wireless sensor irrigation networks, frequency converters for vacuum pumps and stable air conditioning, PV electricity and drip irrigation were the five technologies with the highest sustainability scores, outperforming the 12 other clean technologies. When all sustainability dimensions and criteria were equally weighted, PV electricity was superseded by variable speed drive technology for irrigation in the top five. This paper shows that MCDAs are a useful method for choosing between sustainable clean technology options. By applying different weighting, the MCDA can reflect the priorities of the decision maker and provide customised results.
1. Introduction
Global agriculture is particularly challenged by the United Nations Sustainable Development Goals (SDG) for 2030 [1]. While agriculture should contribute towards SDG 1, 2, 3 (no poverty, zero hunger, good health and well-being), it has to support SDG 12, 13, 14 and 15 (responsible consumption and production, climate action, life below water, life on land) at the same time. In particular, agriculture is one of the most significant sectors in terms of climate and energy consumption. Globally, agriculture contributes 10%–12% of total anthropogenic greenhouse gas (GHG) emissions and 56% of the non-CO2 GHG emissions [2], mainly due to nitrous oxide emissions from soils and methane emissions from cattle [3]. In addition to greenhouse gas emissions and energy consumption, agriculture is the single largest consumer of water in most countries, and is accordingly also a significant source of water pollution. These dependencies and externalities force agriculture to improve its production and become cleaner by using fewer resources and causing fewer emissions. In addition, higher productivity is widely demanded from agriculture, in order to cope with an increasing world population and food demands [4]. That means two major goals have to be reached, ideally without trade-offs. A successful implementation of clean technologies, which are commonly defined as “means of providing a human benefit which, overall, uses less resources and causes less damage than alternative means with which it is economically competitive”, could support the transition of the global agricultural system towards these goals [5].
1.1. Examples of Clean Technologies in Agriculture
As the environmental protection agenda morphed into the more inclusive goal of sustainable development over the last four decades, clean technologies (CT) have become an important tool, including in agriculture. For example, integrated pest management is a cleaner production technology [6], developed for pollution prevention and control in agriculture in the 1970s [7]. Since then its usefulness has been demonstrated in most countries, for example with cost savings of 37%–53% in South Africa [8]. A further example is agricultural biogas, which became popular as a renewable form of energy production on a small-scale household-level in the 1970s in India and China [9,10] and on an industrial scale in the 1980s in Europe, particularly in Germany [11]. Biogas production from agricultural wastes, i.e., animal manure, harvest residues or slaughter wastes, combines waste treatment with energy production, which makes it very attractive for agriculture. More recently, the Clean Development Mechanism offers the possibility for developed countries to account reduced carbon emissions by implementing measures in less-developed and thus less-expensive countries. Dechezleprêtre, Glachant & Ménière [12] analysed Clean Development Mechanism projects and showed that in the agricultural sector, 105 projects, which transferred GHG emission reduction technology from industrial countries to less-developed countries, were registered by 2007. This number increased up to 959 projects by 2010, as reported in Larson, Dinar & Frisbie [13]. This development shows that there is a growing market for cleaner production in agriculture.
1.2. When Is a Technology a Clean Technology?
The world of technology and its use in socio-economic or socio-technical systems is complex. In production systems, such as agriculture, technologies are deployed to assist with the conversion of a set of inputs into a set of outputs. Whilst efficiency gains (and associated reductions in undesirable wastes and pollutants) may be clearly visible in some material flows, other effects may be less visible or their effects distant in space or delayed in time. Care should thus be taken when designating any technology as a clean one. A prime example is biofuels.
As fuel is essential in agricultural production, replacing fossil fuels is a logical mitigation approach. Biodiesel was one of the first biofuels on the market. Others, such as ethanol and bio-kerosene, followed. In the US, the use of biofuels was even enforced by law in 1990 and 1992 [14] and massively stimulated by the farm bill in 2002 [15]. Development of the biofuel market was remarkable, until researchers assessed the sustainability of biofuels and showed that some biofuels have a similar or even greater environmental impact than fossil fuels. For example, maize to ethanol was determined to have an energy return on investment (EROI) between 0.8:1 and 1.3:1 [16,17], meaning that only marginally less energy, or even more energy, is needed to produce ethanol from maize than the resulting ethanol delivers in return. Additionally, the carbon footprint of ethanol from maize e.g., is similar to that of gasoline [18] and first generation biofuels were described as generally lacking environmental advantages in comparison to fossil fuels [19]. However, Liska et al. [20] studied improved maize to ethanol systems and showed a 48%–53% lower carbon footprint compared to gasoline. While EROIs and carbon footprints may improve over time, there are already biofuels available that are ecologically more sustainable than fossil fuels, for example ethanol from wood or biogas from farmyard manure or biological wastes [18,19]. In addition, ethical concerns regarding competition with food production has led to a reduction of support, as well as subsidies, for first-generation biofuels [21].
1.3. Adoption of Clean Technologies
In a study on Integrated Pest Management (IPM) adoption with 148 rice farmers in Iran, Veisi [6] showed that “knowledge and experience of IPM” had significant effects with regard to farmers’ characteristics, “feasibility of IPM technologies” was significant for technology characteristics and “national and local policy and planning” was most significant with regards to external factors influencing adoption behaviour. Gender played a role in “knowledge and experience of IPM”, with male farmers being better informed and having better access to information than female rice farmers. Veisi [6] therefore suggested the encouragement of female farmer participation in IPM training. Additionally, Smulders, Bretschger & Egli [22] stated that for clean technologies “a new unregulated technology is available for adoption but its diffusion takes time, since adoption is costly. Adoption takes place only if the returns to the development of a blueprint for adopting (a clean technology) are large enough”. In their analysis on the adoption of clean technologies, they concluded that the process of adoption only takes place when political pressure on companies (such as through pollution taxes) is high or labour costs are low compared to existing technologies [22]. Adoption is therefore an important criterion to consider in clean technology assessments.
1.4. Knowledge Gap
After the initial criticism of clean technologies in the energy sector, other clean technologies also came under pressure to demonstrate that their use not only saves resources or causes fewer emissions but also that they do not lead to trade-offs in environmental pollution and have a positive sustainability evaluation throughout their product life cycle. Existing studies on clean technologies in agriculture focus primarily on cleaner energy use and production [23,24] or on climate change [25]. Kamel & Dahl [26], for example, analysed the economies of hybrid power production versus diesel-powered agriculture in Egypt’s deserts. They calculated that while initial costs are higher for the renewable energy technology, the operation and maintenance costs are lower. They concluded that because initial costs are very important to farmers, as well as to planners, it is necessary for the government to support the initial cost of hybrid power production, as no progress in the use of clean energy technologies would be possible in Egypt otherwise [26]. While energy demand is one of the most critical resource uses in agriculture, clean technologies for the improvement of other resource uses (like water, fertilisers and pesticides) and impacts should also be analysed for their sustainability from an environmental point of view. In order to avoid trade-offs with the use of clean technologies in economic, social or other environmental aspects, a holistic three-dimensional evaluation approach seems to be indicated. Despite the abundance of available clean technologies, existing studies have either assessed clean technologies with regards to only a single sustainability dimension or have considered only very few clean technologies in the agricultural context when assessing all three aspects of sustainability.
We therefore evaluated clean technologies for agriculture considering a broad range of economic, environmental and social impacts in order to develop recommendations and provide a methodological framework. This framework can be useful for policy decision makers when considering support programs for cleaner production, for farmers’ associations helping farmers prepare for future challenges and also for forward-thinking, sustainability-oriented farmers. Recommendations were based on a multi-criteria decision analysis (MCDA) method for evaluating ecological, economical and societal benefits of different clean technologies. Accordingly, it is best to invest in clean technologies which are beneficial when all three sustainability dimensions have been considered.
2. Materials and Methods
2.1. Selection of Clean Technologies
The clean technologies to be evaluated with the MCDA were selected according to a list of four criteria shown in Table 1. These criteria were selected by the authors of this study based on their experience in transdisciplinary sustainability science for agriculture and in order to enable an MCDA analysis specifically adapted for agriculture. The first criterion was chosen by identifying the most common farm specialisations in agriculture around the world. In order to choose clean technologies for the most common farming types, we decided on a concentrated list of five farming types specialising on different commodities [27,28] which can be found around the world. The clean technologies were thus selected to be useful in at least one of these five farming specialisations. The assignment to farming specialisations was also chosen in order to conduct the sustainability ranking within these specialisations. Secondly, in order to perform an MCDA, experience with the clean technologies, it is important to judge their sustainability performance. The technologies had therefore been tested and documentation on efficiency, advantages and disadvantages was available. The third criterion was worldwide utility, meaning that the clean technologies to be analysed in our MCDA should be relevant, at least potentially, for more than one region. While clean measures are definitely also very important, we decided to focus on technical solutions and excluding methods in order to narrow the potential candidates for our MCDA and made this decision as the fourth criterion.
According to these criteria, the authors, in discussion with a clean technology expert from AgroCleantech (Simon Gisler) and a sustainable development and renewable energy expert from Zurich University of Applied Sciences (Urs Hohl), selected 17 clean technologies to be analysed in the MCDA analysis of the current study (cf. Table 2). AgroCleantech is currently applying and testing several clean technologies in Swiss agriculture, e.g., heat recovery in milk production, automatic regulation of hay ventilation, frequency converters in vacuum pumping and stable air conditioning [29]. These clean technologies were therefore chosen to be analysed in this study, as experiences and data are available and as they are already in use. Additionally, experiences gained in a Swiss-South African joint research project, in which the environmental mitigation potential of South African agrifood products were assessed, were integrated in the selection. Frequency converters for example are already used in irrigation for fruit production and electricity saving in cold storage in South Africa [30] and were thus chosen as one clean technology. In addition, the use of photovoltaic electricity was also assessed to be very effective in irrigated arable farming in South Africa [31] and was thus selected for evaluation. The other clean technologies were selected according to literature review and the authors’ own knowledge and expertise.
2.2. Purposes and Properties of Selected Clean Technologies
As agriculture is a complex sector with a diversity of production types, there is a broad range of possible applications of clean technologies. The selected clean technologies correspond to five relevant mitigation purposes in agriculture: protection of water resources, reduction of inputs, climate change mitigation, efficient or reduced energy use and renewable energy production. The selected clean technologies shown in Table 2 are listed with a description of their properties. One clean technology appears three times, as its mitigation purpose and impact potential varies depending on the application: frequency converters can be used in a variety of electricity-driven processes, but seem to be very useful in vacuum pumping, stable climatisation and irrigation. While frequency converters in vacuum pumping and stable climatisation have particular use in electricity consumption reduction, its additional mitigation purpose in irrigation is the reduction of water use. From 17 clean technologies, between 6 to 9 of them are applicable in each of the five different farm types (arable farming, vegetable production, fruit production, viticulture, animal husbandry).
2.3. Design of the MCDA
In order to determine a sustainability ranking of the 17 clean technologies, a goal-matrix was set up according to the guidelines for MCDAs from Geldermann & Lerche [32]. Geldermann & Lerche describe the importance of realistic goals and relevant criteria as essential for an MCDA [32]. Accordingly, goal-matrices are important in MCDAs in order to be able to evaluate different alternatives, in our case clean technologies, according to these goals. We defined three primary goals in line with our study’s aim and corresponding to the three dimensions of sustainability: economic, ecological and social sustainability (Figure 1). For each of these goals, four to five criteria were defined, according to the main challenges in agricultural production from our point of view (the three authors): extensive energy use [21], economic constraints [33], scarce water resources [34], biodiversity loss [35], resource overuse [36,37], climate change [2], and shrinking land resources [38]. These challenges are mainly economic and environmental. In order to also evaluate the clean technologies from a social sustainability perspective, we chose acceptance to be the most important social criterion as it has been identified as the most relevant aspect in relation to adoption [6,39]. Other important socially relevant criteria in our view are the ease of application, the reduced workload offered by the technology and its future prospects, referring to the potential to meet future needs.
As far as possible, these criteria were selected to be independent of each other, neither influencing nor being influenced by other criteria. The criteria, also shown in Figure 1, were formulated as questions addressing the performance of the clean technologies. All MCDA tables are shown in the supplementary material.
The weighting of the main goals and criteria was done using the analytic hierarchy process (AHP) as developed by Saaty [40] and integrated in the template of SCB Associates Ltd. [41]. Hereby, the main goals and criteria were assessed in pairwise comparisons regarding their importance in achieving sustainability or the main-goals, respectively (see Tables S1–S4 for AHP tables). Scales of 1–9 for more important, or − for less important goals/criteria were used. Among the main goals, economic viability was considered most important for a clean technology to be considered successful and sustainable. Ecological performance was evaluated as second most important and social impacts were considered least important. The main goals thus resulted in weightings of 55%, 29% and 17% for economical, ecological and social sustainability, respectively (Figure 1). Underlying the foremost weighting of economic performance was the assumption that the decision to choose a specific clean technology in agriculture will primarily be economical. Ecology was considered to be more important than social criteria in order to achieve sustainable agriculture, since the challenges of agriculture addressed with clean technologies are mainly environmental. For economic, ecological and social criteria, the weighting was done in the same manner as for the main goals, classifying the importance of each criterion according to its importance in achieving the main goal. Results of this AHP analysis are also shown in Figure 1. The consistency ratios for the main goals and criteria were below 6% and therefore considered acceptable according to suggested maximum consistency ratios of 10% by Saaty [40].
2.4. Evaluation of Clean Technologies
Multiple attribute value theory (MAVT) was selected for evaluating the different clean technologies with regards to fulfilling the sustainability criteria. The following formula, as described in Santoyo-Castelazo & Azapagic [24], was used to calculate sustainability scores for the clean technologies:
where: V(ct) = global value function or total sustainability score for a clean technology ct; = weight of importance of main sustainability goals (economic, ecological, social); = weight of importance of criterion i (with economic, ecological, social goals); u(ct) = partial benefit value reflecting the performance of a clean technology on criterion I and I = total number of sustainability criteria.
When evaluating the clean technologies, their performance was compared to current technologies with regard to the different criteria, i.e., agricultural practices without clean technologies. For example, automatic regulation of hay drying was evaluated compared to manual regulation of hay drying and PV electricity was compared to electricity produced using fossil fuels. Hereby, partial benefit values were assigned for each technology and each criterion, corresponding to u(ct) in the formula. The benefit values were assigned according to previously defined score-scales (see Table 3) for the different criteria. These score-scales ranged from 1–10, with 1 being the lowest contribution and 10 being the maximum contribution. The benefit values categorisation for the clean technologies were assigned based on data and information from different literature sources shown in Table 4. We used scientific literature where possible, but often had to refer to technical reports, presentations, fact sheets and websites. For economic goals, quantitative data for energy savings, investment costs and amortisation times were used to define the scores of the clean technologies. For all other criteria, qualitative data from literature and expert opinions were used to determine benefit values. Benefit values of the different clean technologies assigned to the sustainability criteria were discussed with Simon Gisler from AgroCleantech AG, a company with consulting experience in cleantech solutions for agriculture in Switzerland and with Urs Hohl from ZHAW, a lecturer for sustainable development and renewable energy solutions. Both experts were asked whether they agree or disagree with the defined benefit values for the different clean technologies and adjustments were done accordingly. In total five individuals, the authors of this study and the aforementioned experts, were involved in determining the performance evaluation of the various clean technologies.
For some criteria and clean technologies, no data or validated information could be found and assumptions had to be made when setting the benefit values. This applies to the cells in Table 4 where “no data” is stated, indicating no available information from the literature. Each weighted score per criterion was subsequently added up for the corresponding main goals and ranked in comparison to the other clean technologies per farming type. Technologies which scored highest in the total, weighted benefit values were evaluated as most sustainable according to the defined goals and weighting factors.
Most clean technologies were assessed on their performance when applied on small to medium sized farms. The global average farm size is six hectares and we assessed WSIN, DI, ST and PVe with reference to a six hectare farm. The other technologies were not assessed with a reference to a specific farm size, but referred to one tractor (TH, GPS, DL, BFO), one drone (PF), one stable (SHD, AHD, HRm), small plants (WP, BGP), one unit (FC-P, FC-S; VSDi) or even general applications (GM, ESA). Referencing one particular farm size was not possible due to reliance on global literature data, dealing with a variety of farm sizes and experimental conditions. All literature used and references for the evaluation of the clean technologies are listed in Table 4.
2.5. Sensitivity Analysis
A sensitivity analysis was carried out to test the robustness of the clean technology ranking. Firstly, the main sustainability goals ws were weighted equally, with 33% for each goal. Secondly, all main goals and criteria were equally weighted in importance, corresponding to 25% weight for each of the economic and social criteria and 20% weight for each of the ecological criteria. Clean technologies were then evaluated again with the MAVT matrix and the sensitivity scores and ranks obtained were compared with the original MCDA evaluation for the 17 clean technologies.
3. Results
3.1. Sustainability Performance of Clean Technologies
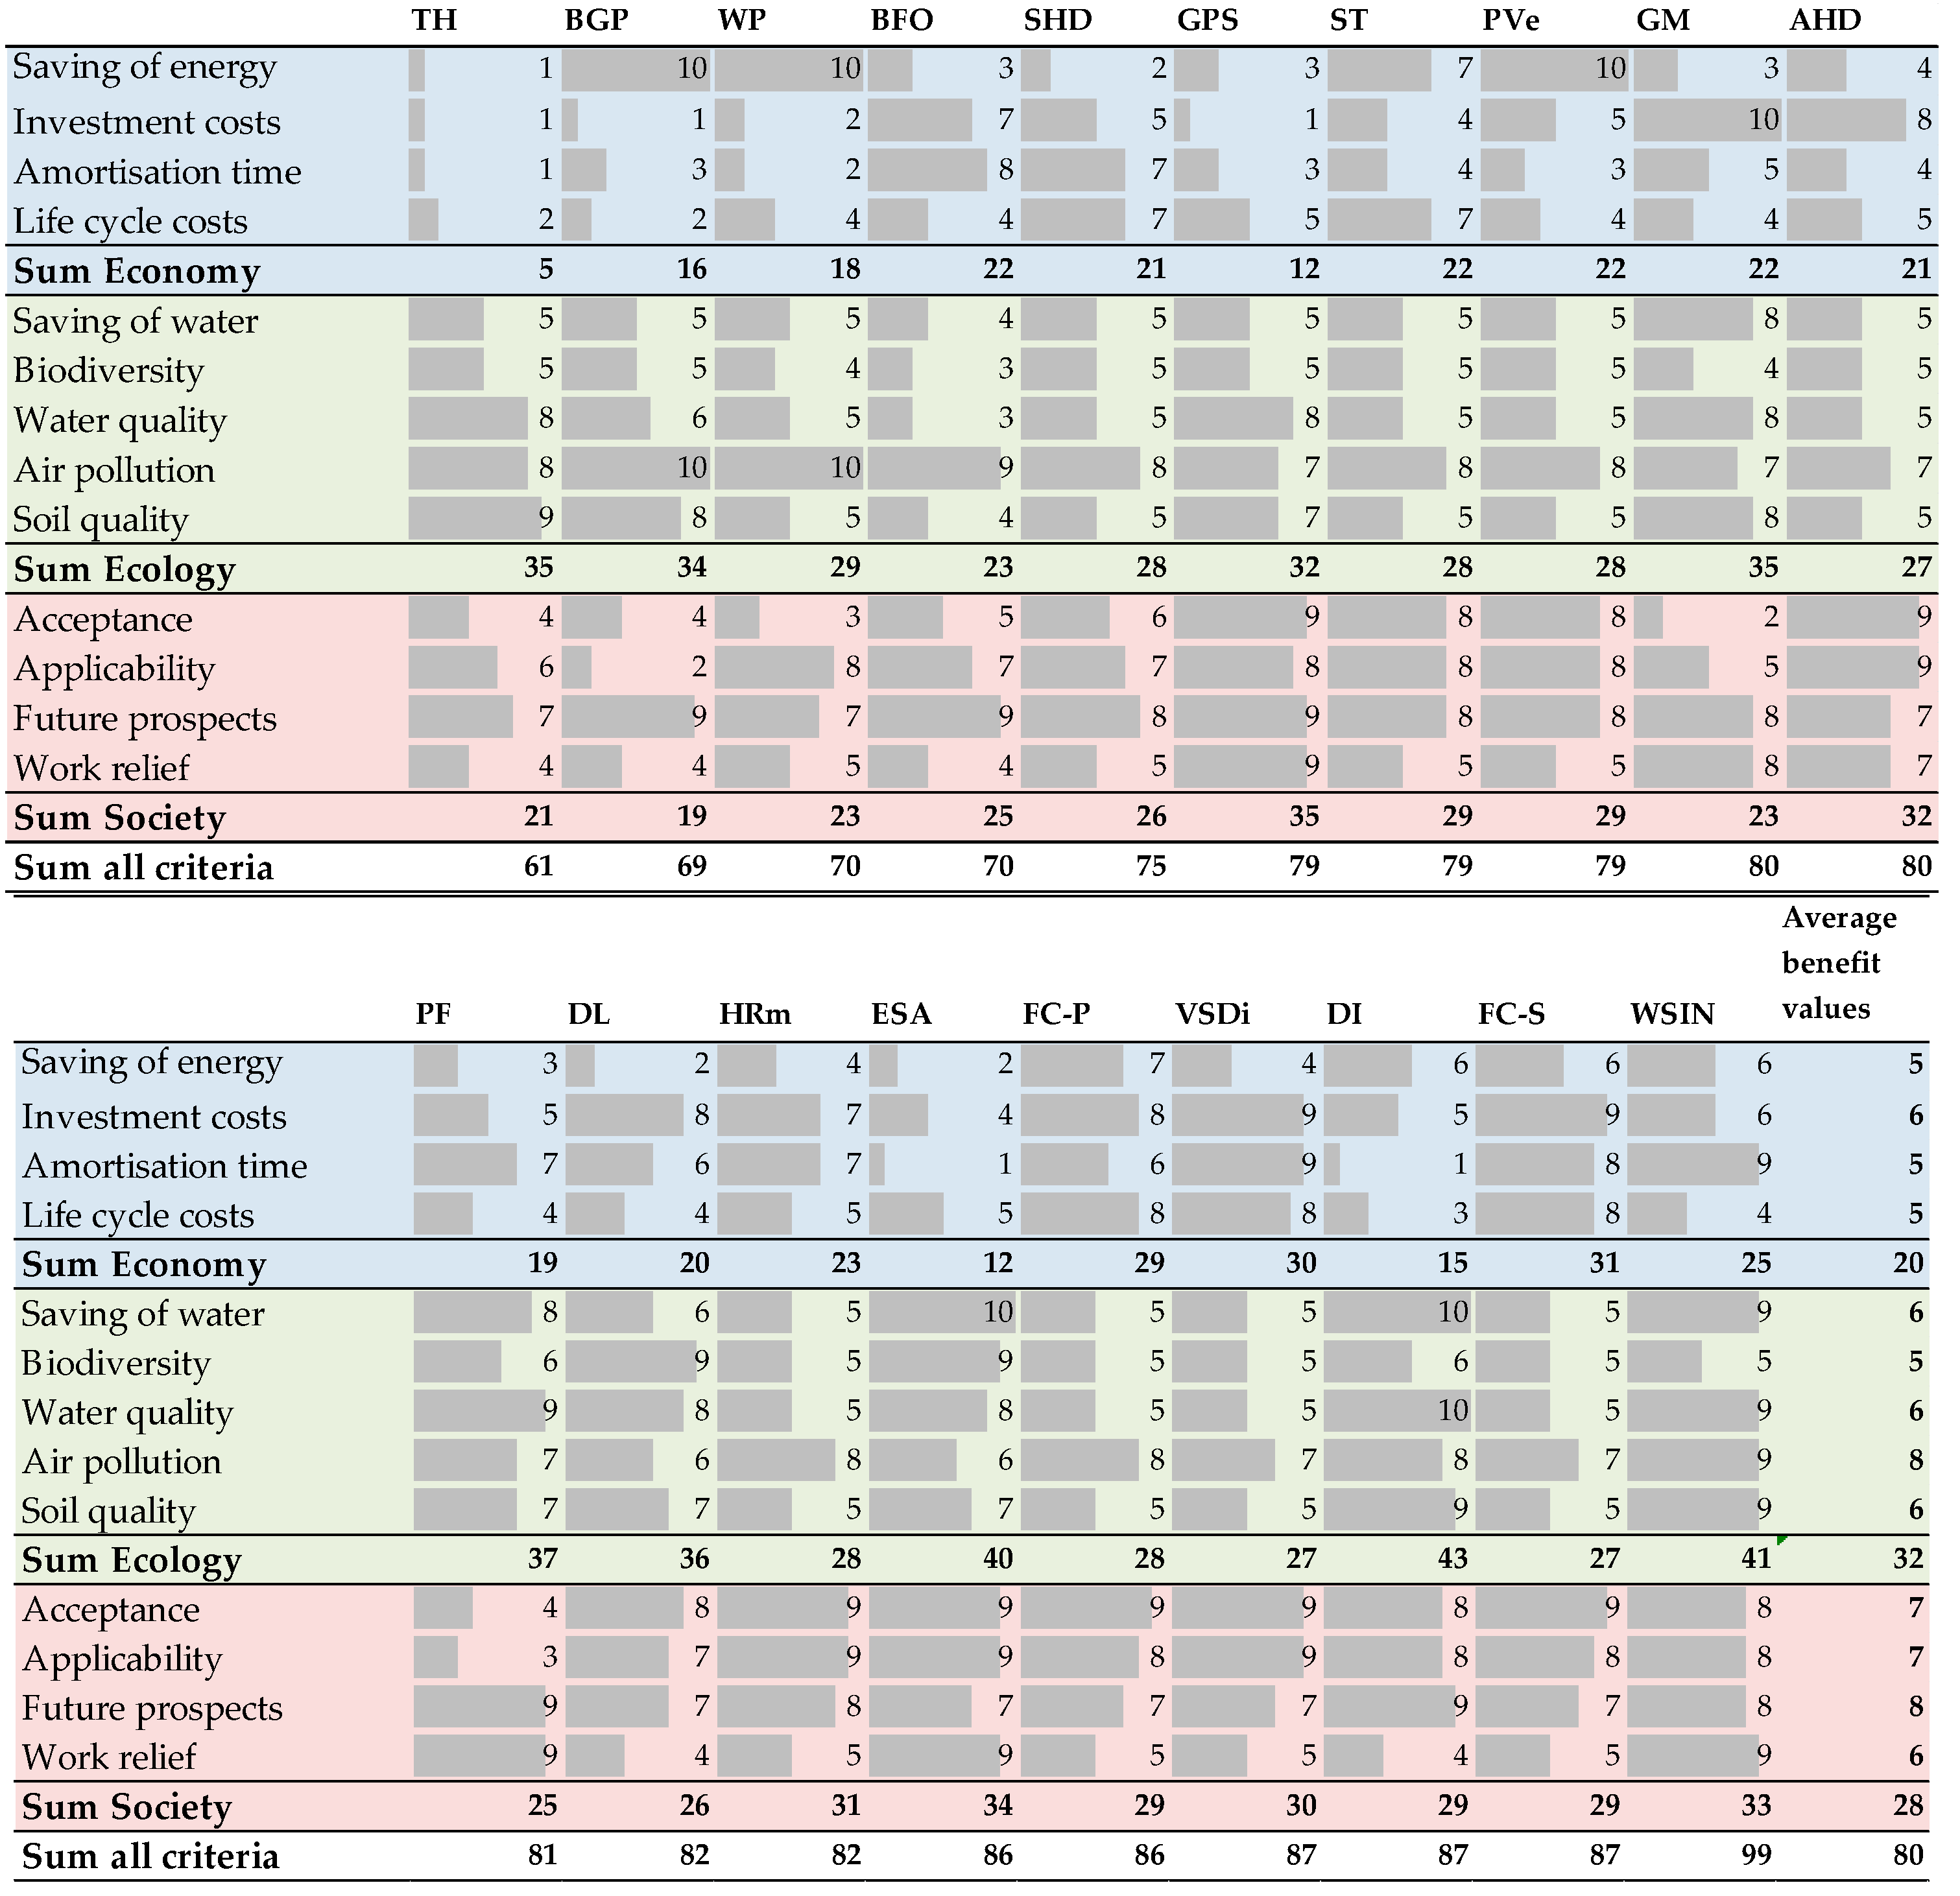
The unweighted benefit values of the 17 clean technologies ranged from a minimum score of 61 for the trail hose technology to a maximum score of 99 for WSIN (see Figure 2). This corresponds to 47% and 76% of the theoretical maximum of 130 for trail hose and WSIN applications, respectively. When considering the main goals: economy, ecology and society, the clean technologies reached, on average, 50% of the maximum economic benefit value (20 out of 40), 64% of the environmental (32 out of 50) and 70% of the social benefit value (28 out of 40). The average sum of benefit values for all criteria was 80, which corresponds to 62% of the total possible sum. The most economical CT, with a total of 31 out of 40, was the frequency converter used for stable air conditioning and the least economical, with a total of 5 out of 40 was the trail hose. The most environmentally beneficial CT, with a total of 43 out of 50, was drip irrigation, and the least environmental CT, with 25/50, were AHD, BFO, VSDi and FC-S. The most social CT, with 35/40 was the GPS assistance in driving and the least social CT, with 19/40 was the biogas plant.
3.2. MCDA Results
The MCDA analysis resulted in differentiated rankings for the 17 clean technologies (CT). Wireless sensor irrigation networks (WSIN) scored highest, followed by frequency converters for vacuum pumps in milk production as the second most sustainable clean technology solution. Frequency converters for stable air conditioning ranked third. The trail hose was determined to be the CT with the lowest overall sustainability, due to its high investment and life cycle costs, combined with no energy saving advantages. In addition, social aspects such as reduced workload and acceptance were not positively evaluated.
When regarding the different farming types, clean technologies were ranked as follows:
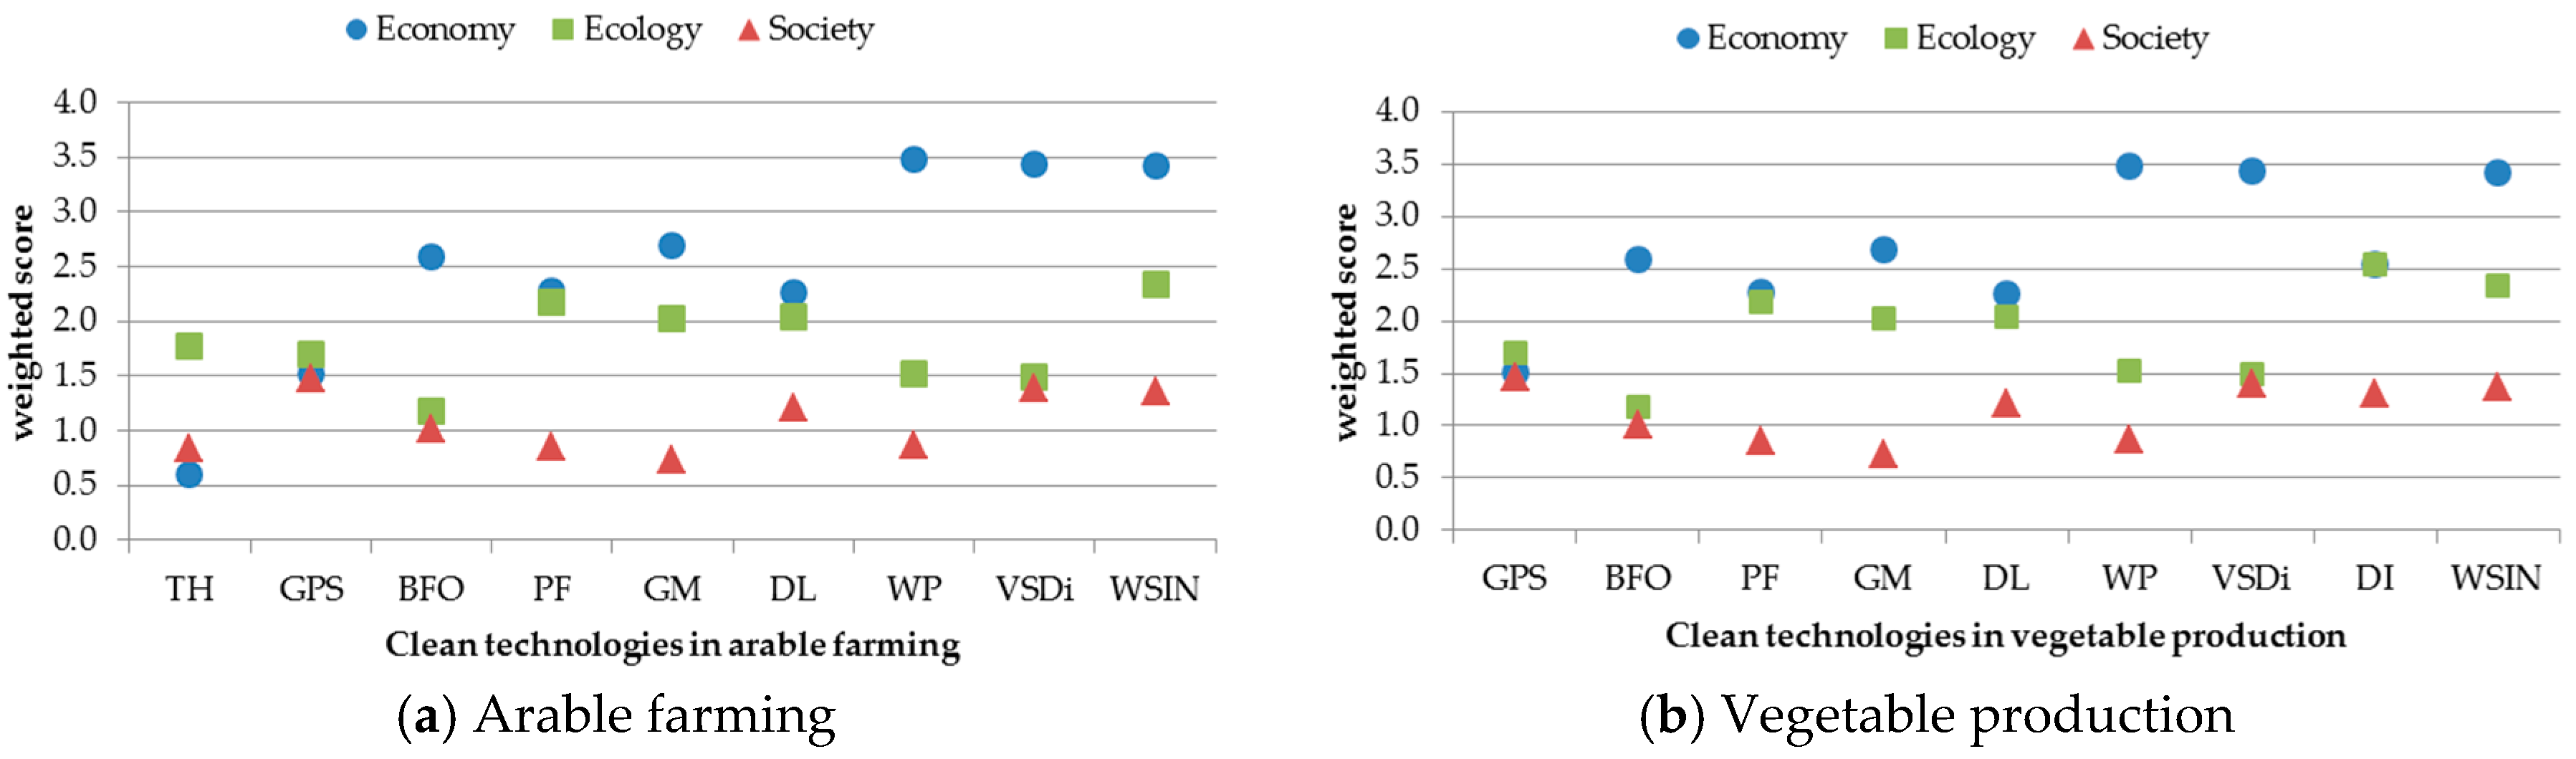
In arable farming, WSIN achieved the highest overall score with 7.1 out of 10 points, followed by VSDi with 6.3 points (see Figure 3a). Both technologies showed high economic weighted scores due to significant electricity reduction performance and short payback times (WSIN) and in the case of VSDi due to low investment and life cycle costs and also short payback times. The clean technologies WP, DL, GM, and PF also achieved high scores. However, GPS and TH achieved scores lower than 5 points. These clean technologies failed to score well in economical sustainability and also did not show significant social benefits. While PF also did not score highly economically due to low energy saving potential and moderate investment and life cycle costs, it showed high social and environmental sustainability and therefore reached a rather high overall ranking, with 5.3 points.
In vegetable production, WSIN also scored highest, as in arable farming (see Figure 3b). Drip irrigation was ranked second, with 6.4 points. DI scored less well economically than WSIN due to high investment costs and long payback times, but also scored high in environmental and social sustainability. VSDi was ranked third and almost all of the other clean technologies useful in vegetable production reached 50% or more of maximum possible scores. Only GPS, with 4.7 points, scored lower than 50% of the total achievable points.
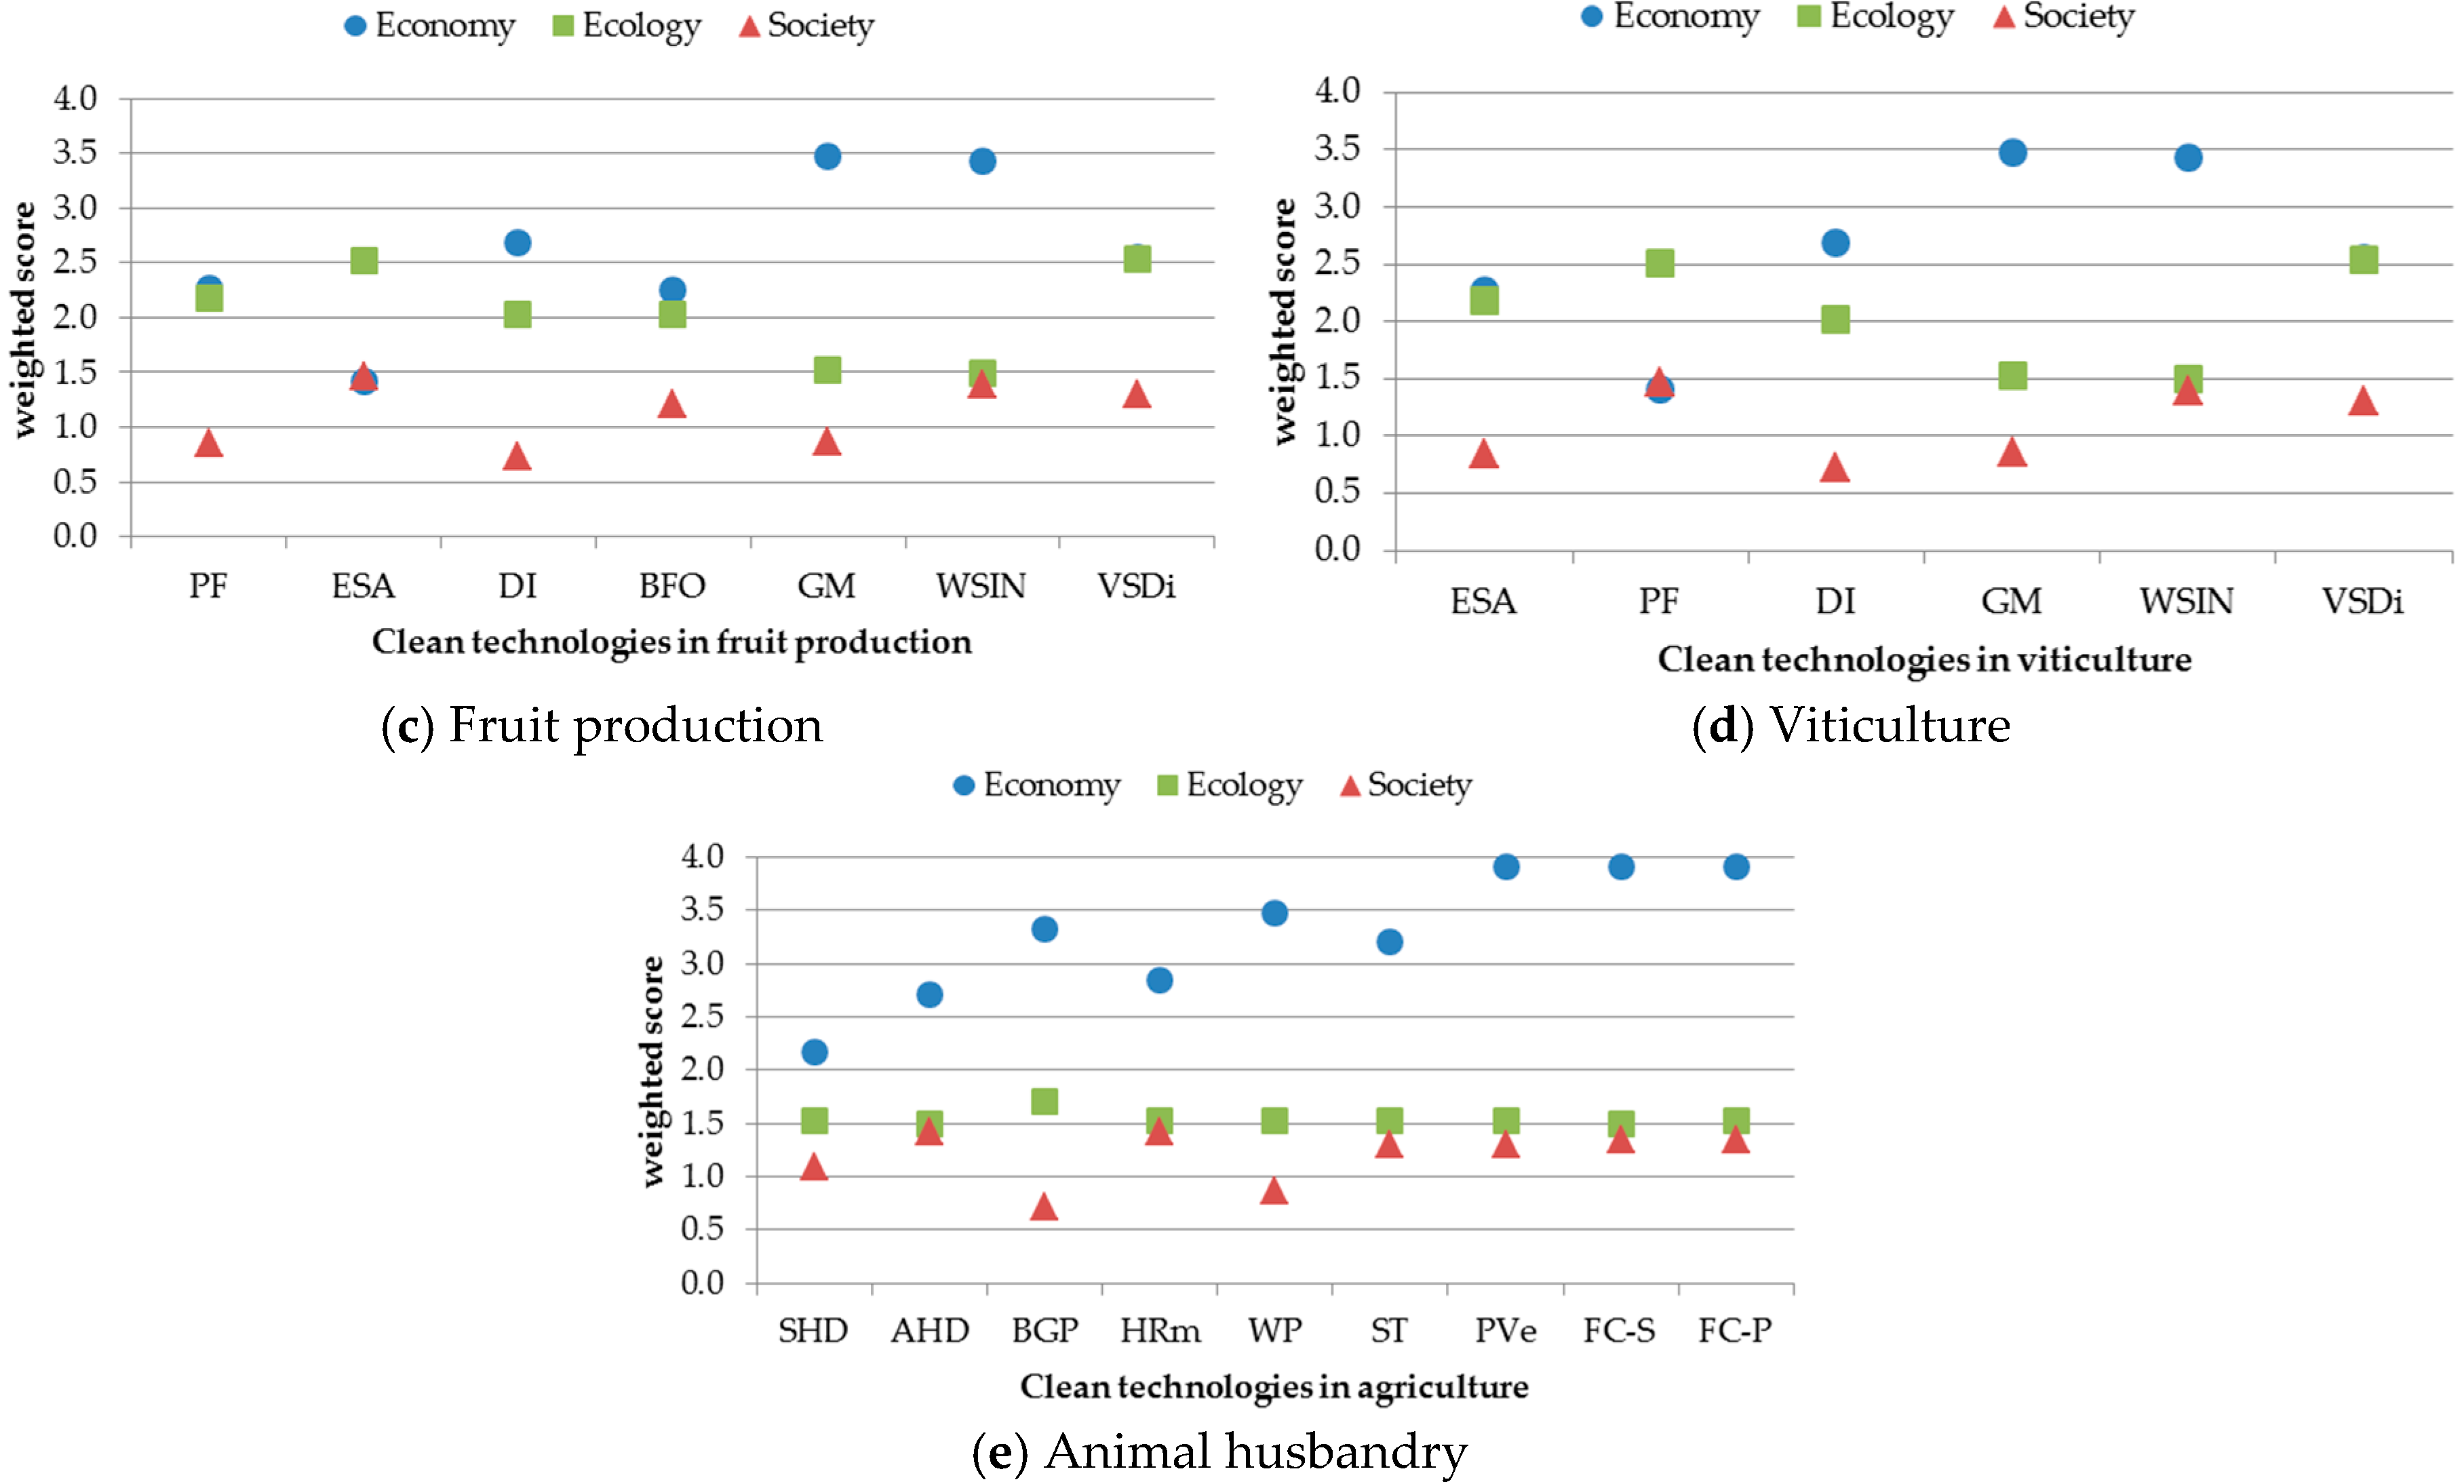
In fruit production, WSIN and DI were determined to be the most sustainable CT solutions, followed by VSDi, as in vegetable production (see Figure 3c). Since the other clean technologies in fruit production reached scores >5, none were determined to be unsustainable. However, ESA showed rather low economic benefits, BFO showed rather low environmental benefits and GM and PF showed rather low social sustainability.
In viticulture, WSIN also scored highest with a total of 7.1 points, followed by VSDi and DI, just as in vegetable production (see Figure 3d).
In animal husbandry, almost all clean technologies scored above 5 points, with FC-P and FC-S, scoring highest, with 6.8 points, followed by PVe with 6.7 points (see Figure 3e). Most of the nine technologies were well-evaluated in terms of economic sustainability, with scores between 3 and 4 points in the economic dimension. While scores for the ecological dimension (mean score of 1.53 points) were the lowest in comparison to the other production types (mean scores between 1.83 points in arable farming and 2.04 points in fruit production), the social benefits were well evaluated, with most CT scoring >1.25.
3.3. Sensitivity Analysis
The weighting factors defined in the MCDA matrix directly affect the outcome of the results (also see [102]). Economic aspects were more heavily weighted in this study than environmental and social criteria to prevent clean technologies from being an additional economic burden for farmers. This assumption, however, carries the risk of evaluating a clean technology as unsustainable due to economic constraints even though it addresses environmental problems effectively. We therefore conducted a sensitivity analysis and altered the weighting of the main goals and decision criteria. The first step of the sensitivity analysis involved all three main goals being weighted equally, i.e., one third for each result in economy, ecology and society. In a second step, all criteria were additionally weighted equally.
When applying equal weighting factors to the main goals, the ranks changed for almost all clean technologies. However, the originally highest ranking CTs did not change or only changed by one rank, meaning that WSIN and frequency converters for pumping and stable air conditioning remained among the most sustainable CT (Table 5). As a consequence of the equal weighting of the main goals, ESA and GPS improved their MCDA ranks by eight and six positions. Due to strong social benefits associated with ESA, this technology benefitted from a heavier weighting of the social goal. GPS particularly benefitted from the lower weighting of economic main goals. As negative consequences of the equal weighting, biogas plants and wind power plants were downgraded in rank by six and five positions, respectively. WP and BGP showed above average economic weighted scores with 3.5 and 3.3 compared to 2.75 due to their renewable energy production asset, but on the other hand below average social benefit values, which made these technologies lose ranks when economic sustainability was equally weighted with the other main goals.
In the second sensitivity analysis step, when equalling the weighting factors of the criteria within the main goals in addition, the ranks mainly improved for those CTs that benefitted from the first equalling of weightings and aggravated for those who lost ranks in the first round (Table 5). The five highest ranking CTs when all goals and criteria were equally weighted included four of the top five CTs from the original MCDA. Only PVe did not maintain its position, due to rather low ecological performance for criteria such as biodiversity and water use. WSIN, FC-S and VSDi achieved the highest three ranks. While WSIN and FC-S were amongst the highest ranked three CTs before, VSDi was not. The most positive changes were determined for ESA and PF with rank improvements of eight and five positions, respectively. The most negative changes were observed for WP and biogas plants, with a reduction of nine and eight ranks, respectively. WP electricity achieved a lower ranking mainly due to reduced weighting for energy saving (economic goal), where it had originally scored highly. Biogas plants were also affected by lower weighting factors for energy and in addition lost points due to lower weighting factors for acceptance, a social criterion.
4. Discussion
The top five clean technologies resulting from our MCDA were wireless sensor irrigation networks, frequency converter vacuum pumps, FC-S, PVe, and DI when economic main goals were weighted more heavily than environmental and social main goals. WSIN yielded the highest weighted score of 7.1 out of 10.0, even though its economic benefit values were not the highest of all clean technologies. The economic drawback of WSIN is in the high cost of investment: A WSIN system for six hectares costs $9800 for the equipment alone [71]. However, the payback time is rather short, at two to three years, due to electricity savings of up to 50% [57]. WSIN reduced water use by 25%, reduced fertiliser use and thus contribute to improved water quality [57], leading to high ecological sustainability scores. WSIN was also ranked highly in terms of social sustainability by saving farmers workload and time in decision making about when to irrigate and therefore achieved the highest rank. WSIN was evaluated as the most sustainable clean technology, even when equal weighting was applied in the sensitivity analysis. The situation was different for the frequency converters used in dairy vacuum pumping or stable air conditioning and PVe. They reached higher economic weighted scores than WSIN and DI, with 3.9 points, due to their electricity saving potentials of more than 50% [52,53] (see also S5). Yet, the environmental scores of these three technologies were relatively low with 1.5 points, which can be explained by the fact that they have only one main purpose—the saving of energy—which leaves other environmental criteria such as water saving and biodiversity unaffected. Nevertheless, these technologies were evaluated amongst the five most sustainable, and their importance can be demonstrated, for example in countries with carbon intensive electricity mixes, technologies like agricultural PVe have a very high greenhouse gas mitigation potential and therefore environmental relevance [31].
The five lowest ranks were occupied by PF, BFO, SHD, GPS and TH. Interestingly, these are all very different clean technologies, contributing to a reduction in inputs, mitigation of climate change, and sustainable energy use. TH scored lowest due to economic aspects, with high investment costs, high maintenance costs and an increase in fuel use instead of a reduction [42]. Even though TH scored well in some ecological sustainability criteria such as improvement of soil quality and reduction of ammonia emissions (reduced air pollution), it could not improve its overall rank during the sensitivity analysis and was always ranked last. On the other hand, BFO had an economic weighted score of 2.6, which is almost 50% of the maximum and could be considered acceptable. However, BFO scored lowest of all clean technologies in environmental sustainability due to agricultural land and water needed for production (reduction of biodiversity, no saving of water) [43,59] as well as huge eutrophication issues [18]. This difference showed that a moderate economic performance would need a strong environmental and social sustainability performance in order to score better.
When all economic, social and environmental sustainability main goals and criteria in the MCDA were weighted equally in the sensitivity analysis, PV electricity dropped out of the top five and ranked 11th due to the environmental sustainability criteria gaining more weight. Instead of PVe, variable speed drives for irrigation entered the top five clean technologies (cf. Table 5), mainly due to counterbalancing the loss of economical weighting with high social benefit values for acceptance and applicability [30]. This example clearly shows the importance of weighting in MCDA. The decision for economic main goals being weighted at 55% was taken due to the importance of economy in farmers’ decisions. According to Kamel & Dahl [26], it is the initial costs in particular that are important for farmers’ decisions. Farmers’ avoidance of expensive clean technologies can be influenced by political support systems, but subsidies for clean technologies cannot be expected in general, particularly not in developing countries. In order to be attractive to farmers, high investments need to be coupled with rather short payback times. The acceptance of payback times depends on the clean technology and in the case of PV electricity can be stretched to 13 years and still be convincing to farmers [97].
Santoyo-Castelazo & Azapagic [24] assessed the sustainability of energy scenarios with an MCDA also covering economic, ecological and social criteria. Some of our criteria correspond to their criteria, namely investment costs—comparable to capital costs, acceptance—comparable to public acceptability, air pollution, saving of water, water quality and soil quality—similar to global warming, resource depletion, eutrophication, freshwater toxicity and terrestrial toxicity. Yet, six criteria did not correspond, which shows that definition of criteria strongly depends on the attitude towards sustainability and also on the aim of the authors.
The results presented in this paper are the first comparing so many clean technologies for their use in agriculture. This study resulted from a research project dealing with mitigation potentials of environmental impacts of agrifood production in South Africa, where the question arose about how to choose effective clean technologies. As agricultural production and its sustainability impact are so diverse, clean technologies are also very diverse, from irrigation technologies to climate control in stables. The diversity of agricultural production and the diversity of clean technologies were also the main challenges for the MCDA. For example, differences in farm size and geographic location can have significant influence on the sustainability performance of different clean technologies. While we tried to consider literature from all around the world in order to have a globalised view on the performance of the clean technologies, many of the sources used for evaluation of the clean technology performance were from Europe and Switzerland. Additionally, there was no common reference farm size we could use for all clean technologies. While frequency converters can be used on a small scale, a professional biogas plant for example is very expensive and only farmers in a strong economic position or supported by political subsidiary schemes may consider the implementation of a biogas plant on their farm [58]. This situation provided advantages to clean technologies which are less expensive, such as frequency converters. However, PVe, ST and WP were amongst the top eight clean technologies in the original MCDA, showing that the strong weighting of energy saving balanced the weighting of investment costs and amortisation time. In the sensitivity analysis, however, with all criteria equally important, expensive technologies lost the most ranks (cf. Table 5). Another discussion point is the broadness of the MCDA criteria, which generally favoured clean technologies with positive effects on multiple criteria over technologies with positive effects on only a few criteria, even if the effect on these might be very high. However, this was clearly an intention of the study, in order to find out whether there are trade-offs from clean technologies which might be overlooked when only focusing on one aspect, e.g., saving energy. As we outlined in the introduction, holistic assessments of clean technologies were shown to be very important in the case of biofuels e.g., Another trade-off which is often encountered in agricultural production is the high production and high environmental pollution trade-off. While we did not take productivity into account in this study, we could show that single-focused clean technologies might not be overall sustainable. Another challenge of this MCDA was that studies or data were not available for all criteria and all clean technologies. Therefore, some evaluation scores had to be given based on expert opinion or estimations of the authors. All data and sources as well as assumptions are shown in the supplementary documents (S5–S8).
This MCDA study has shown to be useful in evaluating the sustainability of clean technologies and enabling recommendations for the use and support of clean technologies. Depending on farmers’ questions or the interests of agricultural extension services, this MCDA design could be adopted to evaluate other clean technologies or other criteria and could be adjusted with customised rankings. Due to trade-offs between different criteria, the outcome of the MCDA strongly depends on value choices and concept behind the weighting system. Since the full MCDA is published in the supplementary documents (S1–S8), we allow the reader to apply their own weighting system reflecting their personal values and to generate customised clean technology ranking for specific farm situations. For example, policy makers in the European Union could use the MCDA framework and adapt it for the specific farming conditions within the EU, applying their own weighting system based on their priorities. In contrast to the highly industrialised agriculture in Europe, a different application setting would be the use of the MCDA for policy making in developing countries where sustainable agriculture can be a way to reduce poverty. Therefore, applying different MCDA weighting sets allows local parameters for sustainable development to be acknowledged.
Supplementary Materials
The following are available online at www.mdpi.com/2071-1050/9/8/1303/s1.
Acknowledgments
This publication was realised under the Swiss-South African Joint Research Programme, funded by the Swiss National Science Foundation and the South African National Research Foundation, with additional funding from Zurich University of Applied Sciences. In cooperation between Zurich University of Applied Sciences and University of Cape Town, the project with the title “Applying Life Cycle Assessment for the mitigation of environmental impacts of South African agri-food products” was conducted in 2014–2017. This publication is a result of the project. The authors thank Harro von Blottnitz from the University of Cape Town, South Africa, for valuable comments on the manuscript and Karen Muir from the Zurich University of Applied Sciences, Switzerland, for proofreading.
Author Contributions
Deborah Scharfy and Matthias Stucki conceived the MCDA study; Norman Boccali primarily analysed the data and collected expert opinions; Deborah Scharfy wrote the paper.
Conflicts of Interest
The authors declare no conflict of interest. The founding sponsors had no role in the design of the study; in the collection, analyses, or interpretation of data; in the writing of the manuscript, and in the decision to publish the results.
References
- United Nations. Transforming Our World: The 2030 Agenda for Sustainable Development; United Nations: New York, NY, USA, 2015; pp. 1–41. [Google Scholar]
- Smith, P.; Bustamante, M.; Ahammad, H.; Clark, H.; Dong, H.; Elsiddig, E.A.; Haberl, H.; Harper, R.; House, J.; Jafari, M.; et al. Agriculture, Forestry and Other Land Use (AFOLU). In Climate Change 2014: Mitigation of Climate Change. Contribution of Working Group III to the Fifth Assessment Report of the Intergovernmental Panel on Climate Change; Edenhofer, O., Pichs-Madruga, R., Sokona, Y., Farahani, E., Kadner, S., Seyboth, K., Adler, A., Baum, I., Brunner, S., Eickemeier, P., et al., Eds.; Cambridge University Press: Cambridge, UK; New York, NY, USA, 2014; pp. 811–922. [Google Scholar]
- Morawicki, R.O. Handbook of Sustainability for the Food Sciences; John Wiley & Sons: West Sussex, UK, 2012. [Google Scholar]
- Wise, T.A. Can We Feed the World in 2050? A Scoping Paper to Assess the Evidence; Tufts University: Medford, OR, USA, 2013. [Google Scholar]
- Clift, R. Clean technology—An introduction. J. Chem. Technol. Biotechnol. 1995, 62, 321–326. [Google Scholar] [CrossRef]
- Veisi, H. Exploring the determinants of adoption behaviour of clean technologies in agriculture: A case of integrated pest management. Asian J. Technol. Innov. 2012, 20, 67–82. [Google Scholar] [CrossRef]
- Robertson, G.P.; Swinton, S.M. Reconciling agricultural productivity and environmental integrity: A grand challenge for agriculture. Front. Ecol. Environ. 2005, 3, 38–46. [Google Scholar] [CrossRef]
- Urquhart, P. IPM and the Citrus Industry in South Africa; International Institute for Environment and Development (IIED), Sustainable Agriculture and Rural Livelihoods Programme: London, UK, 1999; Volume Gatekeeper Series SA86. [Google Scholar]
- Abbasi, T.; Tauseef, S.; Abbasi, S. A Brief History of Anaerobic Digestion and “Biogas”. In Biogas Energy; Springer: New York, NY, USA, 2012; pp. 11–23. [Google Scholar]
- Bond, T.; Templeton, M.R. History and future of domestic biogas plants in the developing world. Energy Sustain. Dev. 2011, 15, 347–354. [Google Scholar] [CrossRef]
- Lebuhn, M.; Munk, B.; Effenberger, M. Agricultural biogas production in Germany-from practice to microbiology basics. Energy Sustain. Soc. 2014, 4, 1–21. [Google Scholar] [CrossRef]
- Dechezleprêtre, A.; Glachant, M.; Ménière, Y. The Clean Development Mechanism and the international diffusion of technologies: An empirical study. Energy Policy 2008, 36, 1273–1283. [Google Scholar] [CrossRef] [Green Version]
- Larson, D.F.; Dinar, A.; Frisbie, J.A. Agriculture and the clean development mechanism. Policy Res. Work. Pap. 2011, 5621, 1–42. [Google Scholar]
- Knothe, G.; Krahl, J.; Van Gerpen, J. The Biodiesel Handbook, 2nd ed.; Elsevier: Urbana, IL, USA, 2015. [Google Scholar]
- Duffield, J.A.; Collins, K. Evolution of Renewable Energy Policy. Choices 2006, 21, 9–14. [Google Scholar]
- Morawicki, R.O. A biobased economy. In Handbook of Sustainability for the Food Sciences; John Wiley & Sons: Chichester, UK, 2012; pp. 343–360. [Google Scholar]
- Randolph, J.; Masters, G.M. Energy for Sustainability: Technology, Planning, Policy; Island Press: Washington, DC, USA, 2008. [Google Scholar]
- Zah, R.; Böni, H.; Gauch, M.; Hischier, R.; Lehmann, M.; Wäger, P. Ökobilanz von Energieprodukten: Ökologische Bewertung von Biotreibstoffen; Bundesamt für Energie, Bundesamt für Umwelt, Bundesamt für Landwirtschaft: Bern, Switzerland, 2007. [Google Scholar]
- Russo, V.; Paola, L.D.; Piemonte, V.; Basile, A.; Falco, M.D.; Giuliani, A. Are biofuels sustainable? An LCA/multivariate perspective on feedstocks and processes. Asia-Pac. J. Chem. Eng. 2016, 11, 650–663. [Google Scholar] [CrossRef]
- Liska, A.J.; Yang, H.S.; Bremer, V.R.; Klopfenstein, T.J.; Walters, D.T.; Erickson, G.E.; Cassman, K.G. Improvements in life cycle energy efficiency and greenhouse gas emissions of corn-ethanol. J. Ind. Ecol. 2009, 13, 58–74. [Google Scholar] [CrossRef]
- Tilman, D.; Socolow, R.; Foley, J.A.; Hill, J.; Larson, E.; Lynd, L.; Pacala, S.; Reilly, J.; Searchinger, T.; Somerville, C.; et al. Energy. Beneficial biofuels—The food, energy, and environment trilemma. Science 2009, 325, 270–271. [Google Scholar] [CrossRef] [PubMed]
- Smulders, S.; Bretschger, L.; Egli, H. Economic Growth and the Diffusion of Clean Technologies: Explaining Environmental Kuznets Curves; ETH Eidgenössische Technische Hochschule Zürich: Zürich, Switzerland, 2005. [Google Scholar]
- Amer, M.; Daim, T.U. Selection of renewable energy technologies for a developing county: A case of Pakistan. Energy Sustain. Dev. 2011, 15, 420–435. [Google Scholar] [CrossRef]
- Santoyo-Castelazo, E.; Azapagic, A. Sustainability assessment of energy systems: Integrating environmental, economic and social aspects. J. Clean. Prod. 2014, 80, 119–138. [Google Scholar] [CrossRef]
- Ghoniem, A.F. Needs, resources and climate change: Clean and efficient conversion technologies. Prog. Energy Combust. Sci. 2011, 37, 15–51. [Google Scholar] [CrossRef]
- Kamel, S.; Dahl, C. The economics of hybrid power systems for sustainable desert agriculture in Egypt. Energy 2005, 30, 1271–1281. [Google Scholar] [CrossRef]
- Hoppe, R.A.; MacDonald, J.M. Updating the ERS Farm Typology; United States Department of Agriculture: Washington, DC, USA, 2013. [Google Scholar]
- Andersen, E.; Verhoog, A.D.; Elbersen, B.S.; Godeschalk, F.E.; Koole, B. A Multidimensional Farming System Typology; SEAMLESS Report No. 12, SEAMLESS Integrated Project, EU 6th Framework Programme; SEAMLESS: Wageningen, The Netherlands, 2006; pp. 1–30. [Google Scholar]
- AgroCleanTech AgroCleanTech. Energie und Klimaschutzagentur für die Landwirtschaft. Available online: http://www.agrocleantech.ch/de/ (accessed on 13 July 2017).
- Hardman, P.; Blignaut, A.; Fuller, S. Confronting Climate Change: Phase III begins. SA Fruit J. 2014, 13, 8–9. [Google Scholar]
- Wettstein, S.; Muir, K.; Scharfy, D.; Stucki, M. The environmental mitigation potential of photovoltaic-powered irrigation in the production of South African maize. 2017; submitted. [Google Scholar]
- Geldermann, J.; Lerche, N. Leitfaden zur Anwendung von Methoden der Multikriteriellen Entscheidungsunterstützung. Methode: Promethee; Georg-August-Universität Göttingen: Göttingen, Germany, 2014. [Google Scholar]
- Suri, K. Political economy of agrarian distress. Econ. Polit. Wkly. 2006, 41, 1523–1529. [Google Scholar]
- Postel, S.L. Entering an era of water scarcity: The challenges ahead. Ecol. Appl. 2000, 10, 941–948. [Google Scholar] [CrossRef]
- Krauss, J.; Bommarco, R.; Guardiola, M.; Heikkinen, R.K.; Helm, A.; Kuussaari, M.; Lindborg, R.; Öckinger, E.; Pärtel, M.; Pino, J. Habitat fragmentation causes immediate and time-delayed biodiversity loss at different trophic levels. Ecol. Lett. 2010, 13, 597–605. [Google Scholar] [CrossRef] [PubMed]
- Food and Agriculture Organization of the United Nations (FAO). The State of the World’s Land and Water Resources for Food and Agriculture (SOLAW): Managing Systems at Risk; Earthscan: London, UK, 2011. [Google Scholar]
- Gibbs, H.; Salmon, J. Mapping the world’s degraded lands. Appl. Geogr. 2015, 57, 12–21. [Google Scholar] [CrossRef]
- Godfray, H.C.J.; Beddington, J.R.; Crute, I.R.; Haddad, L.; Lawrence, D.; Muir, J.F.; Pretty, J.; Robinson, S.; Thomas, S.M.; Toulmin, C. Food security: The challenge of feeding 9 billion people. Science 2010, 327, 812–818. [Google Scholar] [CrossRef] [PubMed]
- Emmann, C.H.; Arens, L.; Theuvsen, L. Individual acceptance of the biogas innovation: A structural equation model. Energy Policy 2013, 62, 372–378. [Google Scholar] [CrossRef]
- Saaty, R.W. The analytic hierarchy process—What it is and how it is used. Math. Model. 1987, 9, 161–176. [Google Scholar] [CrossRef]
- Barnard, S. Analytic Hierarchy Process, AHP. Available online: http://www.scbuk.com/ahp.html (accessed on 1 August 2016).
- Sauter, J.; Moriz, C.; Honegger, S.; Anken, T.; Albisser, G. Schleppschlauch-und Breitverteiler im Vergleich; Forschungsanstalt Agroscope Reckenholz Tänikon: Ettenhausen, Switzerland, 2010; pp. 1–8. [Google Scholar]
- Schreiber, M. Kraftstoffverbrauch beim Einsatz von Ackerschleppern im Besonderen Hinblick auf CO2-Emissionen; Universität Hohenheim, Institut für Agrartechnik: Deutschland, Germany, 2006. [Google Scholar]
- Nydegger, F.; Wirleitner, G. Qualitätsheu Durch Effektive und Kostengünstige Belüftung; Forschungsanstalt Agroscope Reckenholz-Tänikon (ART): Tänikon, Switzerland, 2009. [Google Scholar]
- Wieviel Strom wird Eine Kleinwindkraftanlage Gegebener Leistung Erzeugen? Available online: https://www.klein-windkraftanlagen.com/strom-leistung-ertrag-kleinwindkraftanlage/ (accessed on 1 February 2017).
- Kuratorium für Technik und Bauwesen in der Landwirtschaft e.V. Landwirtschaft im Umbruch—Herausforderungen und Lösungen. KTBL-Vortragstagung vom 18. bis 19. März 2009 in Goslar; KTBL: Darmstadt, Germany, 2009. [Google Scholar]
- Meyer, M. Solarbauern-Solarrechner Thermisch. Available online: http://www.solarbauern.ch/solarrechner_thermie.php (accessed on 12 July 2017).
- Brookes, G.; Barfoot, P. Key environmental impacts of global genetically modified (GM) crop use 1996–2011. GM Crops Food 2013, 4, 109–119. [Google Scholar] [CrossRef] [PubMed]
- AgroCleanTech AG. Energieagentur St. Gallen, St. Galler Bauernverband Energieeffizienz in der Landwirtschaft. Steuerung bei der Heubelüftung. Available online: http://www.agrocleantech.ch/images/Energieeffizienz/Strom_sparen/Downloads/d/AD_Faktenblatt_FU_Heubelftung.pdf (accessed on 1 February 2017).
- Rüegg, J.; Total, R. Dropleg-Applikationstechnik für Zielgerichteten Pflanzenschutz in Reihenkulturen. Einführung und Hinweise für Produzenten und Berater; Agroscope: Wädenswil, Switzerland, 2013. [Google Scholar]
- AgroCleanTech AG. Wärmerückgewinnung aus der Milchkühlung. Available online: http://www.agrocleantech.ch/images/Energieeffizienz/Strom_sparen/Downloads/d/151103%20WRGM%20-%20Faktenblatt%20DE.pdf (accessed on 1 February 2017).
- AgroCleanTech AG. Leistungsgesteuerte Vakuumpumpen bei Melkmaschinen. Available online: http://www.agrocleantech.ch/images/Energieeffizienz/Strom_sparen/Downloads/d/150722%20Faktenblatt%20Leistungsgesteuerte%20Vakuumpumpe%20mit%20FU.pdf (accessed on 1 February 2017).
- Upton, J.; Murphy, M.; French, P.; Dillon, P. Dairy farm energy consumption. In Proceedings of the Teagasc National Dairy Conference 2010, Charleville and MullingarIreland, 17–18 December 2010; pp. 87–97. [Google Scholar]
- Hebeisen, T.; Ballmer, T. Potential der Tröpfchenbewässerung bei Kartoffeln. Available online: https://www.agroscope.admin.ch/dam/agroscope/de/dokumente/aktuell/Veranstaltungen/a-nachhaltigkeitstagung/2014/08-hebeisen.pdf.download.pdf/08_Praesentation_Thomas_Hebeisen_20140123.pdf (accessed on 1 February 2017).
- Teitel, M.; Levi, A.; Zhao, Y.; Barak, M.; Bar-lev, E.; Shmuel, D. Energy saving in agricultural buildings through fan motor control by variable frequency drives. Energy Build. 2008, 40, 953–960. [Google Scholar] [CrossRef]
- AgroCleanTech AG. Energieagentur St. Gallen, St. Galler Bauernverband Frequenzumformer bei der Stallklimatisierung. Available online: http://www.agrocleantech.ch/images/Energieeffizienz/Strom_sparen/Downloads/d/AD_Faktenblatt_FU_Stallklimatisierung.pdf (accessed on 1 February 2017).
- Majsztrik, J.C.; Price, E.W.; King, D.M. Environmental benefits of wireless sensor-based irrigation networks: Case-study projections and potential adoption rates. HortTechnology 2013, 23, 783–793. [Google Scholar]
- Ernst Basler + Partner AG. Finanzierung von Biogasanlagen in der Landwirtschaft. Finanzierungslösungen und Finanzierungsquellen; Ernst Basler + Partner AG: Zollikon, Switzerland, 2007; pp. 1–44. [Google Scholar]
- Breinesberger, J. Pflanzenöl-ein interessanter Treibstoff für die Landwirtschaft. In Biotreibstoffe auf dem Prüfstand; Österreichischer Biomasseverband: Vienna, Austria, 2012; pp. 48–51. [Google Scholar]
- Pöllinger, A. Heutrocknungsverfahren im Vergleich. Alpenländisches Expertenforum 2014, 19, 35–44. [Google Scholar]
- Preise für Kleinwindkraftanlagen—So Investiert Man Richtig. Available online: https://www.klein-windkraftanlagen.com/allgemein/preise-fuer-kleinwindkraftanlagen-fehlinvestitionen-vermeiden/ (accessed on 1 February 2017).
- Rüegg, J.; Total, R.; Holpp, M.; Bachmann, T. Satelliten-Gesteuerte Lenksysteme im Feldgemüsebau. Stand der Technik, Praktische Erfahrungen und Empfehlungen; Flugschrift GPS; Forschungsanstalt Agroscope Changins-Wädenswil ACW: Wädenswil, Switzerland, 2011; pp. 1–14. [Google Scholar]
- Bundesamt für Energie Wie viel Kostet Eine Solaranlage? Available online: https%3A%2F%2Fwww.energieschweiz.ch%2Fpage%2Fde-ch%2Fkosten-einer-solaranlage (accessed on 12 July 2017).
- O. KOHLER AG. Merkblatt Photovoltaik. Available online: http://www.kohler-ag.ch/bilder/Merkblatt_Photovoltaik.pdf (accessed on 1 February 2017).
- Schiefer, C.; Schubert, R.; Pölitz, B.; Kühne, A.; Westphal, K.; Steinhöfel, O.; Schaerff, A. Untersuchungen zum Anbau von GVO in Sachsen; Sächsische Landesanstalt für Landwirtschaft: Dresden, Germany, 2008; pp. 1–121. [Google Scholar]
- eBee: A $12,000 Foamie (!). Available online: http://www.modelairplanenews.com/ebee-12000-foamie/ (accessed on 1 February 2017).
- Dropleg Schlepprohre von Lechler. Available online: http://www.spritzenteile.de/Fluessigduengung/Schleppschlaeuche-Schlepprohr/Dropleg/ (accessed on 12 July 2017).
- Pregler, B. Product Review: Electrostatic Sprayers. Available online: https://www.winebusiness.com/content/file/Sep09_ElectroStatic-Spray.pdf (accessed on 12 July 2017).
- CONRAD Frequenzumrichter. Available online: http://www.conrad.ch/ce/de/overview/1101123/Frequenzumrichter (accessed on 12 July 2017).
- Belau, T.; Fröba, N. Investitionen und Verfahrenskosten für die Feldbewässerung—Ergebnisse der KTBL-Arbeitsgruppe,, Feldbewässerung “. Landbauforsch-Sonderheft 2009, 328, 69–72. [Google Scholar]
- Keshtgary, M.; Deljoo, A. An efficient wireless sensor network for precision agriculture. Can. J. Multimed. Wirel. Netw. 2012, 3, 1–5. [Google Scholar]
- Baumgartner, H. Gülle auf die Felder statt in die Luft. Umwelt Mag. 2014, 2, 22–27. [Google Scholar]
- Rechnet Sich Eine Kleinwindkraftanlage? Available online: https://www.klein-windkraftanlagen.com/allgemein/rechnet-sich-eine-kleinwindkraftanlage/ (accessed on 1 February 2017).
- Sidler, A.U.; Merz, A. Praktischer Leitfaden Solarenergie Landwirtschaft. Der Weg zur Nachhaltigen Nutzung Vorhandener EnergieRessourcen; Schweizerischer Bauernverband: Brugg, Switzerland, 2008; pp. 1–20. [Google Scholar]
- May, M.J. Economic consequences for UK farmers of growing GM herbicide tolerant sugar beet. Ann. Appl. Biol. 2003, 142, 41–48. [Google Scholar] [CrossRef]
- Seiler, E.; Bilitewski, B.; Woidasky, J. Recycling von Windkraftanlagen. Available online: https://www.ict.fraunhofer.de/content/dam/ict/de/documents/ue_klw_Poster_Recycling%20von%20Windkraftanlagen.pdf (accessed on 12 July 2017).
- Lutz, H.-P. Thermische Solaranlagen zur Warmwasserbereitung und Heizungsunterstützung; Wirtschaftsministerium Baden-Württemberg: Stuttgart, Deutschland, 2008; pp. 1–40. [Google Scholar]
- Solar Thermal Panels System Lifespan, Maintenance and Warranties. Available online: https://www.renewableenergyhub.co.uk/solar-thermal-information/solar-thermal-system-lifespan-maintenance-and-warranties.html (accessed on 12 July 2017).
- Der Bundesrat. Bericht zu Kosten-Nutzen von Gentechnisch Veränderten Pflanzen; Der Bundesrat: Berne, Switzerland, 2014; pp. 1–100. [Google Scholar]
- Inverters-FR-E700. Available online: https://gb3a.mitsubishielectric.com/fa/en/products/drv/inv/local/e700 (accessed on 12 July 2017).
- Kabashima, J.; Giles, D.; Parrella, M. Electrostatic sprayers improve pesticide efficacy in greenhouses. Calif. Agric. 1995, 49, 31–35. [Google Scholar] [CrossRef]
- Ballmer, T.; Hebeisen, T.; Wüthrich, R.; Gut, F. Potenzial der Tröpfchenbewässerung im Kartoffelbau bei veränderten Klimabedingungen. Agrar Schweiz 2012, 3, 244–251. [Google Scholar]
- Erickson, W.P.; Johnson, G.D.; David, P., Jr. A Summary and Comparison of Bird Mortality from Anthropogenic Causes with an Emphasis on Collisions; United States Department of Agriculture, Forest Service, Pacific Southwest Research Station: Albany, CA, USA, 2005. [Google Scholar]
- Kunz, T.H.; Arnett, E.B.; Erickson, W.P.; Hoar, A.R.; Johnson, G.D.; Larkin, R.P.; Strickland, M.D.; Thresher, R.W.; Tuttle, M.D. Ecological impacts of wind energy development on bats: Questions, research needs, and hypotheses. Front. Ecol. Environ. 2007, 5, 315–324. [Google Scholar] [CrossRef]
- Hilbeck, A. Implications of transgenic, insecticidal plants for insect and plant biodiversity. Perspect. Plant Ecol. Evol. Syst. 2001, 4, 43–61. [Google Scholar] [CrossRef]
- Postel, S.; Polak, P.; Gonzales, F.; Keller, J. Drip irrigation for small farmers: A new initiative to alleviate hunger and poverty. Water Int. 2001, 26, 3–13. [Google Scholar] [CrossRef]
- Möller, K.; Stinner, W. Effects of different manuring systems with and without biogas digestion on soil mineral nitrogen content and on gaseous nitrogen losses (ammonia, nitrous oxides). Eur. J. Agron. 2009, 30, 1–16. [Google Scholar] [CrossRef]
- Law, S.E. Agricultural electrostatic spray application: A review of significant research and development during the 20th century. J. Electrost. 2001, 51, 25–42. [Google Scholar]
- Hübener, R. Improved water application in irrigated agriculture. Verbesserte Methoden der Wasserverteilung im Bewässerungslandbau. Tropenlandwirt Z. Für Landwirtsch. Trop. Subtrop. 1988, 89, 143–163. [Google Scholar]
- Bundesamts für Umwelt. Leitfaden zur Vermeidung und Verringerung von Ammoniakemissionen aus landwirtschaftlichen Quellen; BAFU: Bern, Switzerland, 2014. [Google Scholar]
- Smith, P.; Martino, D.; Cai, Z.; Gwary, D.; Janzen, H.; Kumar, P.; McCarl, B.; Ogle, S.; O’Mara, F.; Rice, C.; et al. Greenhouse gas mitigation in agriculture. Philos. Trans. R. Soc. Lond. B Biol. Sci. 2008, 363, 789–813. [Google Scholar] [CrossRef] [PubMed]
- Beratergruppe Boden Dünguing Umwelt BDU; Beratungszentrale LBL; Lindau, Service romand de vulgarisation SRVA. Ammoniakverluste bei der Hofdünger-Ausbringung; UFA-Revue: Winterthur, Switzerland, 2005. [Google Scholar]
- Möller, K. Influence of different manuring systems with and without biogas digestion on soil organic matter and nitrogen inputs, flows and budgets in organic cropping systems. Nutr. Cycl. Agroecosyst. 2009, 84, 179–202. [Google Scholar] [CrossRef]
- Fargione, J.; Hill, J.; Tilman, D.; Polasky, S.; Hawthorne, P. Land clearing and the biofuel carbon debt. Science 2008, 319, 1235–1238. [Google Scholar] [CrossRef] [PubMed]
- Bell, D.; Gray, T.; Haggett, C. The “social gap” in wind farm siting decisions: Explanations and policy responses. Environ. Polit. 2005, 14, 460–477. [Google Scholar] [CrossRef]
- Rogers, A.L.; Manwell, J.F.; Wright, S. Wind Turbine Acoustic Noise. Renewable Energy Research Laboratory; University of Massachusetts at Amherst: Amherst, MA, USA, 2006. [Google Scholar]
- Brudermann, T.; Reinsberger, K.; Orthofer, A.; Kislinger, M.; Posch, A. Photovoltaics in agriculture: A case study on decision making of farmers. Energy Policy 2013, 61, 96–103. [Google Scholar] [CrossRef]
- Lucht, J.M. Public acceptance of plant biotechnology and GM crops. Viruses 2015, 7, 4254–4281. [Google Scholar] [CrossRef] [PubMed]
- Aubert, B.A.; Schroeder, A.; Grimaudo, J. IT as enabler of sustainable farming: An empirical analysis of farmers’ adoption decision of precision agriculture technology. Decis. Support Syst. 2012, 54, 510–520. [Google Scholar] [CrossRef]
- Patel, M.K. Technological improvements in electrostatic spraying and its impact to agriculture during the last decade and future research perspectives—A review. Eng. Agric. Environ. Food 2016, 9, 92–100. [Google Scholar] [CrossRef]
- Hoyer Alternative Kraftstoffe. Produktinformation. Available online: https://www.hoyer-energie.de/sitefiles/finke/downloads/prospekte/broschuere_pflanzenoel.pdf (accessed on 1 September 2016).
- Wang, J.-J.; Jing, Y.-Y.; Zhang, C.-F.; Zhao, J.-H. Review on multi-criteria decision analysis aid in sustainable energy decision-making. Renew. Sustain. Energy Rev. 2009, 13, 2263–2278. [Google Scholar] [CrossRef]
Figure 1.
Multi-criteria decision analysis (MCDA) matrix with main goals and criteria, weighting factors in % and questions for the evaluation of the sustainability of clean technologies in agriculture.
Figure 1.
Multi-criteria decision analysis (MCDA) matrix with main goals and criteria, weighting factors in % and questions for the evaluation of the sustainability of clean technologies in agriculture.
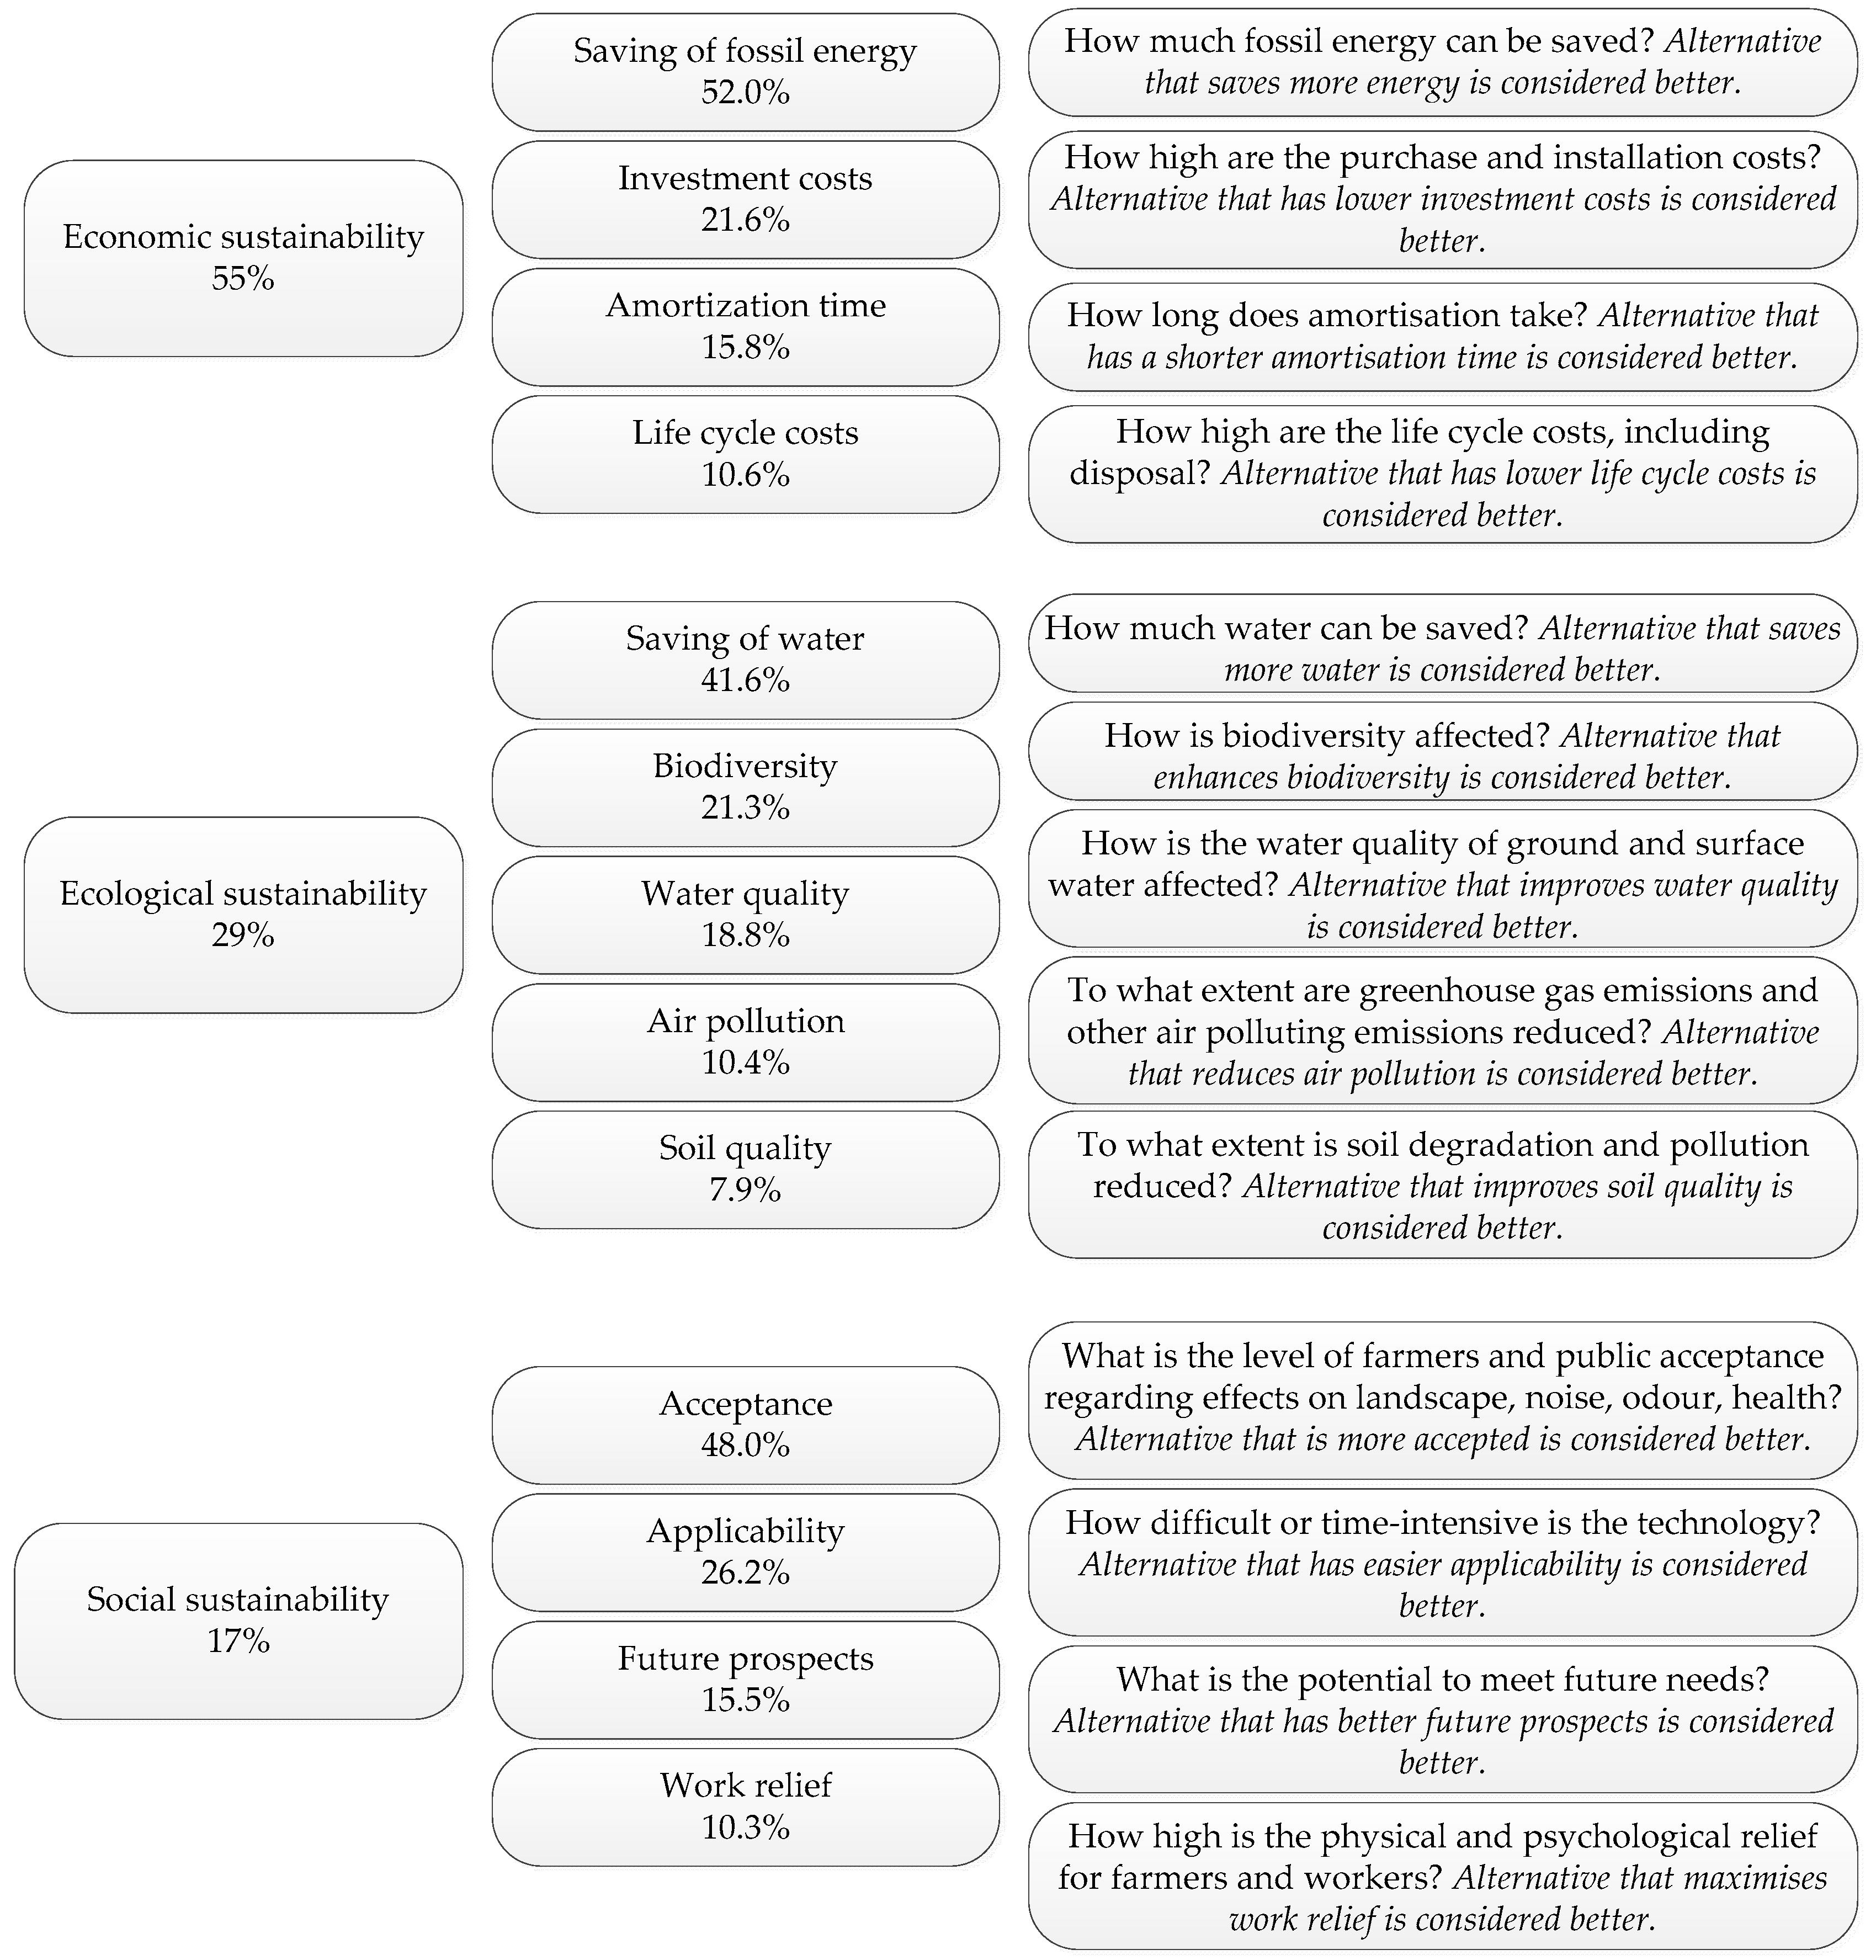
Figure 2.
Benefit values of selected clean technologies and average benefit values with regard to criteria defined in the MCDA, without weighting applied.
Figure 2.
Benefit values of selected clean technologies and average benefit values with regard to criteria defined in the MCDA, without weighting applied.

Figure 3.
Weighted scores of the evaluated 17 clean technologies according to the MCDA. High economical scores paired with high environmental and social scores result in high sustainability scores. Results are shown in the order of lowest (left) to highest (right) sustainability scores of clean technologies to be used in arable farming (a); vegetable production (b); fruit production (c); viticulture (d) and animal husbandry (e). For abbreviations of clean technologies, see Table 2.


Table 1.
Selection criteria for clean technologies analysed in the current study.
| Be useful in at least one of the farming specialisations: arable farming, vegetable production, fruit production, viticulture or animal husbandry |
| Established and already in use in agriculture |
| Potential to be deployed in large parts of the world |
| Technology in the meaning of a technical solution, excluding methods |
Table 2.
Overview of selected clean technologies for application in agriculture, their purpose, characteristics and the abbreviations used in this study.
Table 2.
Overview of selected clean technologies for application in agriculture, their purpose, characteristics and the abbreviations used in this study.
| Ain Purpose | Clean Technology | Abbreviation | Properties | Applied in |
|---|---|---|---|---|
| Reduced energy use; Sustainable energy use | Automatic regulation of hay ventilation | AHD | Producing quality hay needs a regulated drying process. With conventional drying installations, hay is ventilated for too long or initiated at the wrong time. Automatic control systems initiate ventilation depending on humidity and temperature thresholds, measured by sensors. Thereby electricity can be saved. | Animal husbandry |
| Solar collectors for warm air production in hay ventilation | SHD | Hay production is mostly carried out with ambient air ventilation. In order to accelerate the drying process and avoid mould growth, SHD can be instead of air heaters fuelled by heating oil. This enables drying when the ambient air is humid or even during the night. Air collectors beneath the roof transport the solar heated air to the ventilator. | Animal husbandry | |
| Frequency converter for vacuum pumps | FC-V | FC-V in dairy production reduces electricity demand. The frequency converter can be coupled with a vacuum sensor and adjust the pump motor speed according to the degree of vacuum needed. By adjusting the speed, electricity can be saved compared to constant speed pumping. | Animal husbandry | |
| Frequency converter for stable air conditioning | FC-S | Stable air conditioning refers to the control of temperature and humidity in stables, the supply of fresh air and the removal of exhaust air. In pig production in particular, ventilation is commonly controlled by transformers using maximum capacity. FC-S adjusts the speed of ventilation systems according to the need for air supply and removal. FC-S improves the electricity demand even when compared to on-off-control ventilation systems. | Animal husbandry | |
| Heat recovery from milk cooling | HRm | Cooling and cool storage of milk requires large quantities of energy. Fresh milk has a temperature of around 35 °C and needs to be cooled down to 4 °C. Installing a HRm system with a heat exchanger coupled to the cooling system generates warm water for direct use or in a boiler. Less energy is needed for hot water preparation, which is needed e.g., to clean the milking equipment. | Animal husbandry | |
| energy production, economic efficiency climate change | Photovoltaic plants | PVe | PVe modules can be installed on stable roofs or processing plant roofs. The generated electricity can be used for a variety of electricity needs in agriculture and, if financial reward systems exist, excess electricity can be fed into the grid. | Animal husbandry |
| Solar Thermal collectors | ST | ST modules can e.g., be installed on the farm house and the production of service water (warm water) can be used for house or stable heating or cleaning purposes on the farm. | Animal husbandry | |
| Wind energy plants | WP | WP plants can be used for electricity-intensive processes in agriculture. The generated electricity can be used for a variety of electricity needs in agriculture and, if financial reward systems exist and if regulations permitting it are in place, excess electricity can be fed into the grid, as is valid for PV electricity. | Animal husbandry, arable farming, vegetable production | |
| Agricultural biogas plants | BGP | Biomass from agricultural production can be used to produce biogas, either from so-called energy plants or from agricultural waste products (or both). Here we considered a BGP running on agricultural waste. Ideally, in a combined heat and power plant, heat as well as electricity can be produced. The biogas can be used as vehicle fuel, the heat and electricity as needed in farm processes. | Animal husbandry | |
| climate change, reduction of inputs | Direct use of plant oils as biofuel | BFO | The use of fossil fuels for machinery use in agriculture can be reduced with BFO produced from oil plants such as canola (Brassica napus), either by modifying agricultural machines with a tank for oil fuel and using diesel only to start machines or by directly using machines built for running on BFO. | arable farming, vegetable production, fruiticulture, viticulture |
| Trail hose | TH | Conventional slurry spreading can lead to nitrogen losses of up to 25% in the form of ammonia. Spreading manure with TH reduces ammonia emissions by evenly distributing the slurry and bringing it closer to the soil than with a baffle plate. | arable farming | |
| reduction of inputs; protection of water resources | Genetic Engineering | GM | GM crops such as cotton and maize can reduce pesticide applications and, by reducing these applications, also reduce fuel use. In addition, crop yields can be increased. | arable farming, vegetable production, fruiticulture |
| GPS Power steering | GPS | When applying fertiliser or plant protection products in agriculture, precision on the field is necessary. GPS power steering systems help the farmer stay in the correct lane and avoid overlaps by showing and correcting the route based on GPS data, thereby reducing inputs. | arable farming, vegetable production | |
| Precision farming | PF | PF can be practiced with GPS-steered drones. With these drones, aerial photographs can be taken of fields. When combined with infrared sensors and synchronised with normalised vegetation indices, reflection data of crops can indicate stress symptoms due to water or fertiliser shortage or pests and diseases. The stressed areas identified by the drone can then be inspected by the farmer. PF increases information reaching the farmer, enables the reduction of inputs and can help increase yields. | arable farming, vegetable production, fruiticulture, viticulture | |
| Dropleg application of plant protection products | DL | DL helps spray plant protection products (PPP) with higher efficiency rates. With DL, the application of PPP can be adjusted with flexible injectors, sprayed on leaf surfaces and additionally from the underside. Thereby the products adhere to the crops better and lower amounts are needed. Better yields can be achieved by higher efficiency in PPP application. | arable farming, vegetable production | |
| Electrostatic application of plant protection products | ESA | Electrostatic injectors generate an electrostatic field which helps to direct the PPP spray on the crops and distribute it more evenly. Reduced drift, fewer applications and reduced water demand are the environmental benefits. | fruiticulture, viticulture | |
| protection of water resources, reduced energy use | Drip irrigation | DI | Drip irrigation is based on pressure compensation, distributing water evenly in DI systems. PVC or PE tubes of relatively small diameters are equipped with drip heads, delivering small amounts of water constantly to the crops. Reduced water and energy demands, reduction of diseases, reduction of eutrophication and erosion through well-directed irrigation and fertilisation are among the benefits. | vegetable production, fruiticulture, viticulture |
| Wireless sensor irrigation networks | WSIN | WSIN is a sensor-based control system of water demand in crops. According to soil moisture measurements, irrigation can be initiated automatically or manually when the farmer analyses the sensor data. The benefits include reduced water and fertiliser use, reduced energy demand for irrigation pumps and reduced time investment due to remote control. | arable farming, vegetable production, fruiticulture, viticulture | |
| Frequency converter for irrigation pumps | VSDi | Irrigation pumps need large amounts of energy. VSDi reduces the energy demand of irrigation pumps by adjusting the speed drive and thereby also the water quantity. Reduced electricity demand and costs are further benefits. | arable farming, vegetable production, fruiticulture, viticulture |
Table 3.
Score-scale system for the performance evaluation and benefit value assignment of clean technologies contributing to criteria of the multi-criteria decision analysis (MCDA).
Table 3.
Score-scale system for the performance evaluation and benefit value assignment of clean technologies contributing to criteria of the multi-criteria decision analysis (MCDA).
| Benefit Value | Energy Saving Potential (%) | Investment Costs ($) | Amortisation Time (a) | Life Cycle Costs | Ecological & Social Criteria |
|---|---|---|---|---|---|
| 1 | 0–10 | >30,000 | >18 | Very high | Very negative impact |
| 2 | 10–20 | 25,000–30,000 | 16–18 | Markedly higher | |
| 3 | 20–30 | 20,000–25,000 | 14–16 | high | Negative impact |
| 4 | 30–40 | 15,000–20,000 | 12–14 | Slightly higher | |
| 5 | 40–50 | 10,000–15,000 | 10–12 | normal | No impact |
| 6 | 50–60 | 8000–10,000 | 8–10 | Slightly lower | Slightly better |
| 7 | 60–70 | 6000–8000 | 6–8 | Moderately lower | |
| 8 | 70–80 | 4000–6000 | 4–6 | lower | Positive impact |
| 9 | 80–90 | 2000–4000 | 2–4 | Markedly lower | |
| 10 | 90–100 | 0–2000 | 0–2 | Very low | Very positive impact |
Table 4.
Literature sources for data and information on the different clean technologies used for evaluation of the MCDA sustainability criteria. Where no impact is to be expected with the application of a clean technology, “No impact” was stated. Where no reference was found for evaluation criteria, “No data” was stated. For abbreviations of clean technologies, see Table 2. For technical and evaluative information regarding the literature sources given, please refer to Supplementary Table S5.
| TH | BGP | BFO | SHD | WP | GPS | ST | PVe | GM | AHD | PF | DL | HRm | ESA | FC-P | VSDi | DI | FC-S | WSIN | |
|---|---|---|---|---|---|---|---|---|---|---|---|---|---|---|---|---|---|---|---|
| Saving of fossil fuel energy | [42] | Energy production | [43] | [44] | Energy production [45] | [46] | [47] | Energy production | [48] | [49] | No data | [50] | [51] | No data | [52,53] | [30] | [54] | [55,56] | [57] |
| Investment costs | [42] | [58] | [59] | [60] | [61] | [62] | [63] | [64] | [65] | [49] | [66] | [67] | [51] | [68] | [52,53] | [69] | [70] | [56] | [71] |
| Amortisation time | [72] | [58] | [59] | [60] | [73] | No data | [74] | [74] | [75] | [49] | No data | No data | [51] | [68] | [52,53] | [30] | No data | [55] | [57] |
| Life cycle costs | [42] | [58] | [43] | [44] | [45,76] | No data | [77,78] | [74] | [79] | No data | No data | No data | No data | [68] | [80] | [80] | [54] | [80] | No data |
| Saving of water | No impact | No impact | No impact | No impact | No impact | No impact | No impact | No impact | [48] | No impact | No data | No data | No impact | [81] | No impact | No impact | [82] | No impact | [57] |
| Biodiversity | No impact | No impact | [59] | No impact | [83,84] | No impact | No impact | No impact | [85] | No impact | No data | No data | No impact | No data | No impact | No impact | [86] | No impact | No impact |
| Water quality | [42] | [87] | [18] | No impact | No impact | [46] | No impact | No impact | [48] | No impact | No data | [50] | No impact | [88] | No impact | No impact | [89] | No impact | [57] |
| Air pollution | [90] | [91] | [43] | [44] | [45] | [46] | [47] | [74] | [48] | [49] | No data | [50] | [51] | [68] | [52] | [30] | [54] | [55,56] | [57] |
| Soil quality | [92] | [93] | [43] | No impact | No impact | [46] | No impact | No impact | [48] | No impact | No data | [50] | No impact | [68] | No impact | No impact | [89] | No impact | [57] |
| Acceptance | [42] | [39] | [94] | No data | [95,96] | [46] | No data | [97] | [98] | [49] | [99] | [50] | [51] | No data | [52] | [30] | [70] | [55] | [57] |
| Applicability | [42] | [58] | [43,59] | No data | No data | [46,62] | [74] | [74,97] | No impact | [49] | [99] | [50] | [51] | [88] | [52] | No data | [86] | [56] | [57] |
| Future prospects | [42] | No data | No data | No data | No data | [62] | No data | No data | No data | No data | No data | [50] | No data | [100] | No data | No data | [86] | No data | [57] |
| Work relief | [42] | [58] | [101] | No impact | No impact | [62] | No impact | No impact | No data | [49] | [99] | [50] | No impact | [88] | No impact | No impact | [89] | No impact | [57] |
Table 5.
MCDA rank results for clean technologies with specific weighting (original) and equal weighting of main goals and criteria. Rank level changes are shown for the sensitivity analysis of main and criteria.
Table 5.
MCDA rank results for clean technologies with specific weighting (original) and equal weighting of main goals and criteria. Rank level changes are shown for the sensitivity analysis of main and criteria.
| Ranks | Rank Level Changes | ||||
|---|---|---|---|---|---|
| Clean Technology | MCDA Rank Original | MCDA Rank Sensitivity Main Goals | MCDA Rank Sensitivity Main and Criteria | MCDA Sensitivity Main Goals | MCDA Sensitivity Main and Criteria |
| WSIN | 1 | 1 | 1 | 0 | 0 |
| FC-P | 2 | 3 | 4 | −1 | −2 |
| FC-S | 3 | 4 | 3 | −1 | 0 |
| PVe | 4 | 5 | 11 | −1 | −7 |
| DI | 5 | 2 | 5 | +3 | 0 |
| VSDi | 6 | 7 | 2 | −1 | +4 |
| ST | 7 | 9 | 11 | −2 | −4 |
| WP | 8 | 13 | 17 | −5 | −9 |
| HRm | 9 | 8 | 7 | +1 | +2 |
| BGP | 10 | 16 | 18 | −6 | −8 |
| AHD | 11 | 10 | 9 | +1 | +2 |
| DL | 12 | 11 | 8 | +1 | +4 |
| GM | 13 | 15 | 13 | −2 | 0 |
| ESA | 14 | 6 | 6 | +8 | +8 |
| PF | 15 | 14 | 10 | +1 | +5 |
| BFO | 16 | 18 | 16 | −2 | 0 |
| SHD | 17 | 17 | 15 | 0 | +2 |
| GPS | 18 | 12 | 14 | +6 | +4 |
| TH | 19 | 19 | 19 | 0 | 0 |
© 2017 by the authors. Licensee MDPI, Basel, Switzerland. This article is an open access article distributed under the terms and conditions of the Creative Commons Attribution (CC BY) license (http://creativecommons.org/licenses/by/4.0/).
Share and Cite
MDPI and ACS Style
Scharfy, D.; Boccali, N.; Stucki, M. Clean Technologies in Agriculture—How to Prioritise Measures? Sustainability 2017, 9, 1303. https://doi.org/10.3390/su9081303
AMA Style
Scharfy D, Boccali N, Stucki M. Clean Technologies in Agriculture—How to Prioritise Measures? Sustainability. 2017; 9(8):1303. https://doi.org/10.3390/su9081303
Chicago/Turabian StyleScharfy, Deborah, Norman Boccali, and Matthias Stucki. 2017. "Clean Technologies in Agriculture—How to Prioritise Measures?" Sustainability 9, no. 8: 1303. https://doi.org/10.3390/su9081303
Note that from the first issue of 2016, this journal uses article numbers instead of page numbers. See further details here.