Differentiated Optimization of Sustainable Land Use in Metropolitan Areas: A Demarcation of Functional Units for Land Consolidation


1
Department of Land Management, School of Public Administration and Policy, Renmin University of China, 59 Zhongguancun Avenue, Beijing 100872, China
2
College of Urban and Environmental Sciences, Peking University, 5 Yiheyuan Street, Beijing 100872, China
3
Land and Resources Planning Institute, Chinese Academy of Land and Resource Economics, 689 Jingyu Street, Langfang 065201, China
*
Author to whom correspondence should be addressed.
Sustainability 2017, 9(8), 1356; https://doi.org/10.3390/su9081356
Submission received: 31 May 2017
/
Revised: 22 July 2017
/
Accepted: 24 July 2017
/
Published: 2 August 2017
(This article belongs to the Special Issue Sustainable Land Use in China)
Abstract
:In China, the combination of land supply finitude and land use inefficiency has become a barrier to sustainable development in urban society and the economy. Land consolidation has been widely implemented as a tool to improve the quality and quantity of land use, but is mainly limited to rural areas and focuses on farmland production, while not taking into consideration of aspects such as life, production, and ecology. Furthermore, contemporary research usually focuses on one land consolidation project, ignoring practical project arrangement at a regional macroscopic level and lacking specific differentiation in designing land consolidation projects. This study aims to create a method to determine functional units for land consolidation (FULC) in metropolitan areas to facilitate the sustainable use of land resources and improve the efficiency of land use. Moreover, a framework to assess the overall demarcation of FULC is developed. The proposed model considers the production, life, and ecology functions in the demarcation decisions regarding FULC. A typical metropolitan area, that is, Haidian District, Beijing, is used as a case study to demonstrate this framework. The analysis shows that the model can provide technical support and practical references for planners and executors to arrange different land consolidation projects at the macroscopic level. By taking all production, life, and ecological properties of the land parcels into consideration, the proposed model enables local governments to meet their sustainable development targets by managing specialized projects for FULC as a spatial governance platform.
1. Introduction
As one of the countries with the fastest urbanization rate, China is simultaneously experiencing increasing land demand and insufficient land supply [1,2]. Ironically, the major reason is the common urbanization pattern of the realization of rapid economic growth via extensive and inefficient land use [3]. From 2000 to 2010, the urbanization rate of land in China was 1.85 times that of its population rate. Furthermore, a total of 3.49 million ha of new construction land were added to the existing stock, thereby indicating that approximately 200,000 ha of cultivated land were lost annually during this period [4]. Aside from the unbalanced quantity problem between urban and rural areas, the decreasing quality of land use is also one of the most discussed resource issues. A large number of high-quality agricultural lands are facing significant losses because of urban and rural settlement expansion; moreover, most cultivated lands have problems, such as irregular shapes, fragmentation, low-efficiency irrigation, and reduced soil fertility [5,6]. Rural residential land is also plagued by a series of low-efficiency issues, such as scattered settlements, hollowed villages [7], or environmental deterioration [8,9]. In urban areas, megacities in China consistently face problems, such as low land use efficiency, widespread urban sprawl, and inefficient land spatial layout [10,11].
In this regard, the combination of land supply finitude and land use inefficiency has become a barrier to the sustainable development of urban society and economy; such a situation has resulted in calls for balanced and differentiated land optimization [12]. As an alternative to mainstream balanced development, land consolidation, which has been proven effective particularly in enhancing livelihood in rural and urban areas and improving the sustainable use of resources and public facilities, has been considered a particular type of land optimization method [7,13]. Generally, land consolidation can be defined as the process by which segmented land parcels are integrated to form centralized and continuous lands in areas where the lands are inefficiently used, misused, unused, or damaged by production, manufacturing, or natural disasters [14]. In China, land consolidation has been implemented since the mid-1990s and widely used to improve the quality and quantity of land use [14]. From 2011 to 2015, more than CNY 550 billion was invested in land consolidation and involved 35.33 million ha of agricultural land. As a result, 26.87 million ha of high-quality farmland have been established.
However, compared with the general definition of land consolidation, the ongoing land consolidation projects in China more strongly emphasize farmland and somehow ignore other aspects, such as urban land consolidation [4]. In other words, land consolidation in China has been widely regarded as a tool mainly for improving the effectiveness of land cultivation [15,16], but not as a tool for facilitating environmental management [17,18,19] or improving urban land use efficiency [20]. The concept of land consolidation should enlist the trinity of quantity control, quality management, and ecological management, as already raised by scholars [21,22]. The objectives of land consolidation in many countries have evolved to cover many wide ranges and include strategies, such as promoting rural development, facilitating non-agricultural uses of rural land, optimizing the layout of urban and rural land use, and protecting the environment [15,23,24,25]. These objectives have been adopted by the Chinese government [4]. On 20 February 2017, China launched a new “National Land Consolidation Plan (2016–2020)” with the aim of constructing 40 million ha of high-quality farmland, regenerating 400,000 ha of urban construction land, and consolidating 400,000 ha of rural residential land to differentiate land optimization. Nevertheless, contemporary studies continue to overlook practical project arrangements at a regional macroscopic level and lack specific differentiation in the design of land consolidation projects. Many case studies focus on only one land consolidation project rather than an overall arrangement of different projects that are based on properties of the land parcels [6]. Specifically, the development gradients among central urban areas, urban fringes, and rural areas, as well as land classification of the construction of agricultural and ecological lands, lead to differentiated demand for function, planning, and management of land consolidation at the macroscopic level [26]. In other words, no “one-size-fits-all” pattern of land consolidation exists for all areas in China, and this situation requires different functional units to match various patterns. However, studies on functional units mainly focus on the functional zoning of agricultural land remediation or landscape ecological improvement [27,28]. Numerous unit demarcation methods have been applied, such as comprehensive analysis, cluster analysis, constellation graphics, graphic overlay method, contingency table, and mutex matrix [29,30]; however, the targets of these methods are usually based on only one particular ecological function and coordination is not implemented [31]. Therefore, creating a method to determine functional units for land consolidation (FULC), which is the smallest unit divided by its main function in the whole area so that we can implement various land consolidation projects and meet the demands of different regions, in metropolitan areas is highly significant to facilitate the sustainable use of land resources and improve the efficiency of land use [32,33].
Land consolidation in China is mainly limited to rural areas that focus on farmland production rather than taking into consideration of aspects such as life, production, and ecology. Moreover, the current designs for land consolidation fail to consider the status quo, physical space functional planning demand, and social space functional positioning demand at the macroscopic operative level. To solve the functional simplification, project arrangement homogenization and lack of regional coordination, a framework to assess the overall demarcation of FULC is developed to bridge the gaps in the literature. The model considers production, life, and ecology functions involved in the demarcation decisions of FULC. The framework consists of five steps. First, functional areas for land consolidation are determined based on the spatially coordinated development degree and overall demand for future social economic structures. Second, a study area is divided into evaluation units. Third, a triangular pyramid indicator system is established for production-life-ecology function evaluation. Fourth, an indicator system is applied to evaluate functional capacity of the differentiated demands for land consolidation based on location quotient. Finally, FULCs are determined based on functional capacity. A typical metropolitan area, that is, Haidian District, Beijing, is used as a case study to demonstrate the implementation of this framework. The analysis shows that the model can provide technical support and practical references for planners and executors to arrange different land consolidation projects at the macroscopic level. By balancing production, life, and ecological needs, the model enables local governments to meet their sustainable development targets by managing specialized projects for FULC as a spatial governance platform.
2. Methodology for Demarcation of FULC
2.1. Definition of FULC
The FULC is the smallest unit implemented in land consolidation projects according to a vested function. The goal of FULC is the microcosmic and specific management of land consolidation in a land consolidation function area that can independently and stably exert specific functions. Moreover, the functional unit is the basic geographical unit for planning and implementing FULC, as well as the space carrier for the close combination of spatial planning, urban management, and land system reform. Further, the functional unit is a full-coverage basic network to guide the space from having low efficiency and being disordered to being organic, sustainable, and with a clear boundary, that is, not overlapped and crossed.
2.2. Demarcation Steps of FULC
The premise of dividing areas into FULC is to identify the leading functions of land consolidation based on the characteristics of a study area, that is, emphasizing a function for land consolidation, such as production, life, or ecology function. Based on regional land consolidation strategies, an evaluation unit is determined by dominant functional manifestations, coordinated multi-regulation, autonomous circulation operation, up and down two-way linkage, and implementation of management advantage as the principle. According to the principles and related planning, first, functional areas of land consolidation are determined. Second, the evaluation units are determined as the base units from which information is collected, on which analyses of the demarcation of FULC are conducted. Third, with regard to the evaluation units, an index system for production-life-ecology function evaluation is established according to local objectives, such as improving the quality of rural living conditions, upgrading the industries of the area, and protecting the ecological environment. Fourth, functional capacity evaluation is performed based on functional status endowment, physical space functional demand, and social space functional demand. For example, landscaping is important because endowment and historic preservation is necessary for the social function of historical relics. Finally, cluster analysis of the consolidation function is performed and a rose diagram of consolidation function is constructed to demarcate FULC. The dominant functions can be divided into several categories for different purposes, such as improving urban production, rural production, urban life, rural life, and ecology. The five demarcation steps are shown in Figure 1.
2.2.1. Determination of Functional Areas for Land Consolidation
The functional areas for land consolidation reflect the production-life-ecology spatial patterns of large areas. The determination of functional areas for land consolidation is mainly based on regional functional zoning and can be divided into three functional orientations, namely, production, life, and ecology functions. Generally, the functional areas for land consolidation can be determined based on the spatially coordinated development degree of functional areas and the overall demand of urban development for future social economic structures [28]. Moreover, the functional areas for land consolidation are specifically assessed by combining the positions of land use planning, urban planning, and national economy development planning.
2.2.2. Determination of Evaluation Unit
Based on internal homogeneity, external difference, consolidation independence, and evaluation operability of evaluation units, a subdistrict level is used as the unit to evaluate the built-up area, whereas a village or a national farmland is used as the unit outside the built-up area. The evaluation unit is labeled using the abbreviation of the functional area “abbreviation + code”.
2.2.3. Index System Construction of Production-Life-Ecology Function Evaluation
A sustainable pyramid model has been introduced to construct a pyramid of functional consolidation objectives [34]. As shown in Figure 2, the vertex of the pyramid represents the final goal of sustainable development. In addition, all points at the bottom of the pyramid represent the functional orientations of production, life, and ecology, as well as the core values of a production-life-ecology space [35]. All lines at the bottom of the pyramid represent the interaction within a production-life-ecology space. Side lines, especially dashed lines, represent the pathways of production, life, and ecology to achieve production-life-ecology integration. For example, in terms of living space, production-life-ecology integration can be achieved by partly readjusting residential area into park or cultivated land, thus the life function is transformed into ecological or production function.
The core value of overall production-life-ecology function planning is to decompose three dimensions, namely, production, life, and ecology, to determine the main indicators of all target orientations. Evaluation indicators are selected based on different target orientations of functional areas for land consolidation, as well as relevant literature (see Table 1). Production and life indicators, such as per capita gross domestic product (GDP) and proportion of urbanized population, in Table 1 are adopted from Leung (1999) ,and Xia and Yan (2006) [36,37]. Ecological indicators, such as forest coverage, air quality standards, sound quality standards, and PM2.5, are adopted from Alonso et al. (2017) [38]. Life indicators, such as per capita living space of urban residents, per capita living space of rural residents, and investment effect, are adopted from Han et al. (2015), and Xia and Yan (2006) [37,39].
2.2.4. Functional Capacity Evaluation of Land Consolidation
Based on the triangular pyramid target indicator, the evaluation unit Ui consists of three functional layers, namely, production, life, and ecology. Owing to the drastic demographic shift and social stratum differentiation, land resources endowment is not the only factor affecting the determination of land use functions. Social property and geographical characteristics should also be taken into consideration, while the two factors are frequently mismatched [40,41]. As a result, the production-life-ecology function should take all land endowment, physical and social space functions into consideration. Therefore, as shown in Figure 1 and Equation (1), the functional value of each stratified space is determined by the functional status endowment axis (x-axis), physical space functional objective axis (y-axis), and social space functional objective axis (z-axis). The Ui values of the evaluation unit are [Pi, , ] in the production function dimension; [Li, , ] in the life function dimension; and [Ei, , ] in the ecological dimension. In addition, the “0” above the evaluation unit values stands for values on physical space functional objective axis, while the stands for values on social space functional objective axis.
Determination of Land Function Endowment
Based on the characteristics of land use in metropolitan and surrounding areas and the studies by Yan (2012 and 2014) [4,14], we determine a correspondence relationship between land use status and production-life-ecology space classifications (as shown in Table 2). The location quotient theory has been adopted to perform quantitative evaluation of the space functional endowment of each evaluation unit [40,41].
The location quotient is commonly used to determine whether an industry constitutes a regional specialization in regional economics. In this study, the location quotient was used to measure the degree of dominance of production, life, or ecological function within a unit. The formula is expressed as:
where Pij (Lij, Eij) refers to the location quotient of space function i (production, life, and ecology) in the unit j, n refers to the number of functions in the same evaluation unit, m refers to the number of units in the same functional area for land consolidation, and qij refers to the scale of land function in Ui. The location quotient can be used to determine the dominant space function in this functional area unit for land consolidation. If the location quotient is more than 1, then the space function in this unit is dominant. If the location quotient is high, then the functional endowment is dominant.
Determination of Physical Space Function Target Value
Similar to the calculation of land functional endowment, the correspondence between land use planning classification and production-life-ecology space classification was determined (see Table 2). The location quotient theory was used to perform quantitative evaluation of land target functional values in each evaluation unit.
Determination of Social Space Target Value
For each unit, the value of each indicator need to be normalized to remove scaling issues. Specifically, we let be the th indicator of the th evaluation unit. Range normalization method is used to perform the nondimensionalized process of initial indices. The following formula is used to perform range normalization for large and optimal evaluation indicators:
The following formula is used to perform range normalization for small and optimal evaluation indicators:
where Xmax() and Xmin() are the maximum and minimum evaluation indicators of in the sample data, respectively. The calculated result shows that refers to the evaluation indicator in the range of [0, 1].
The analytic hierarchy process is mainly used to determine index weight . In determining the index weight, the effect of positioning the functional area on the weights of all indicators should be considered. Finally, the following equation is used to determine social target values :
2.2.5. Determination of FULC
Based on the production-life-ecology functional orientation, land consolidation can be divided into nine types including three single-function reinforcement types and six transformation types. The single-function reinforcement types include production function reinforcement, life function reinforcement and ecological function reinforcement types. In addition, the other six types are transformation types between production, life and ecology functions such as transformation from production to ecological function, transformation from life to production function, transformation from life to ecological function, etc. Each type has its corresponding standard cluster center. At consolidation unit point , the coordinate is (Pi, ) in the production function dimension, (Li, ) in the life function dimension, and (Ei, ) in the ecological dimension. At initial cluster center point , the coordinate is () in the production function dimension, () in the life function dimension, and (,) in the ecological dimension. The functional capacity of land consolidation ∆U (decomposed to be ∆P, ∆L, ∆E) is the Euclidean distance between consolidation unit and cluster center . The formula is expressed as:
The symbol is determined by the absolute difference from the consolidation unit and cluster center to the original point. If ∆U (∆P, ∆L, or ∆E) ≥ 0, then this function of land consolidation is considered reasonable. A large ∆U indicates high utility of the function and high consolidation advantage. If ∆U (∆P, ∆L, or ∆E) < 0, then this function of land consolidation is improper. A small ∆U indicates low utility of the function, but high consolidation disadvantage.
The U values of all functions of land consolidation (FLC) in each unit are expressed in the rose diagram. The orientation of the graph is the leading function of one unit in terms of land consolidation. The formula is expressed as:
U value = max (∆U).
Based on the functional orientation, the three functions, that is, production, life, and ecology, could be further divided into five categories, namely, agricultural production, industrial production, rural life, urban life, and ecology. Considering the significant gap between urban and rural lifestyles, as well as production modes, the production and life functions can be divided into two parts according to the regional properties of the units. The relative types of consolidation are presented in Figure 3.
3. A Case Study on Haidian, Beijing
3.1. General Situation of the Study Area
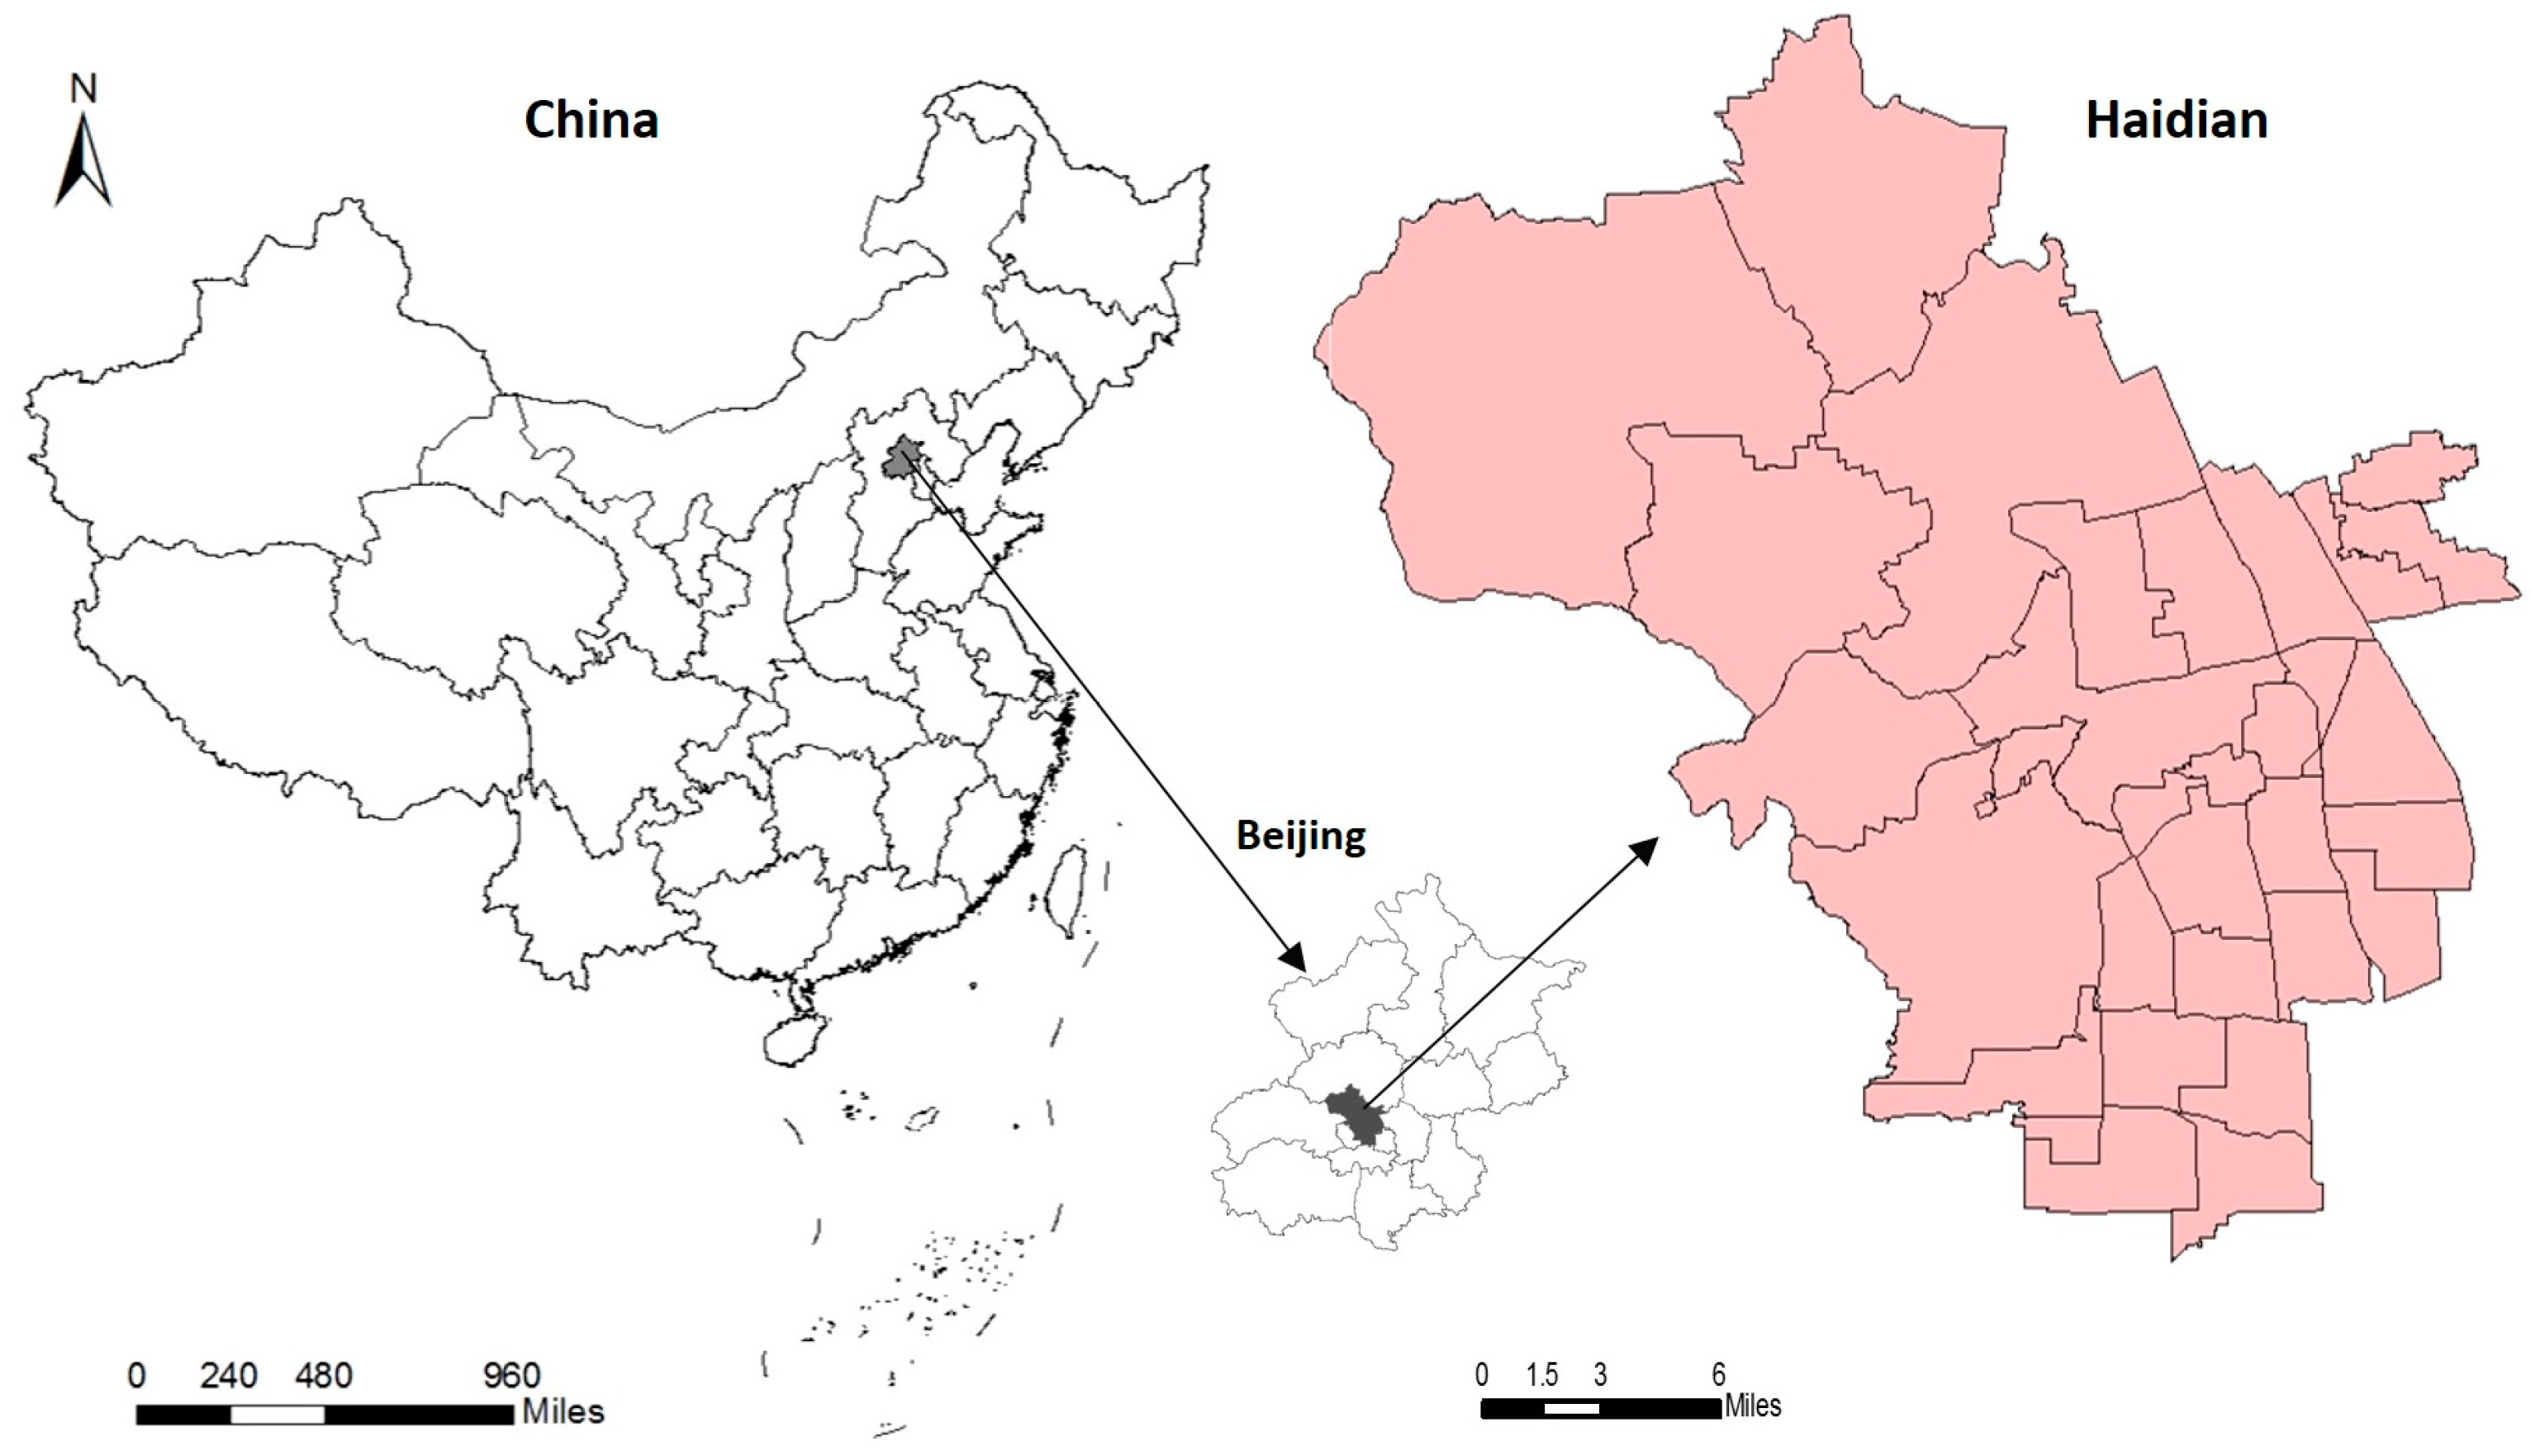
Haidian District is located northwest of Beijing and is an important area for the core functions of the capital, with a total of 22 subdistricts and 7 towns under its jurisdiction (as shown in Figure 4). As a technology innovation center with global influence, Haidian District is a historical and cultural area that reflects the national image and style and is a harmonious ecological civilization area in Beijing. Moreover, Haidian District is a pilot area for innovative land consolidation planning implementation mechanisms that are approved by the Ministry of Land and Resources at the county level for the first time as a good basis of land consolidation. With a total area of 430.8 km2, the district accounts for 2.6% of the total area of Beijing. The south area of Haidian District is urban area while the north area is rural area. In addition, its terrain is high in the east while low in the west. The plain areas in the east and south account for approximately 85% of the total area, with 91.20% of the population concentrated in this region.
3.2. Data Source
The data on land use status were obtained from the second national land survey data in Beijing. The update point is 2014. The data of future planning was based on the land use planning in Haidian District (2006–2020) and the overall planning results for land utilization in all its towns and subdistricts. Land slope map, quality grade, distribution and control of geological hazards, and other data were obtained from the Haidian Branch of the Beijing Land and Resources Bureau. Basic situation, economic population data, key construction project in Haidian District, and social economic development data were obtained from the 2015 Statistical Yearbook of Haidian District. Urban planning, national economic development planning, environmental and ecological planning, key construction project, and other data were provided by the associated bureau and towns (subdistricts) in the site survey. All the figures were generated by ArcGIS 10.0.
3.3. Demarcation Result of FULC
3.3.1. Orientation Result of Functional Areas for Land Consolidation
Through a comprehensive consideration of city function orientation, social economic development mode, land use pattern, and other factors in Haidian District, three functional areas for land consolidation were formed in Haidian District by integrating multiple planning objectives (see Figure 5). The production-oriented ecological science and technology zone in the north is positioned as a technological innovation base, a model region of urban-rural overall development, and a new district within a developing city with a leading ecological environment. Three ecologically oriented mountains and five gardens with historical and cultural scenic spots in the middle are positioned as centers of culture, historical relic protection, ancient capital representation, demonstration zones for the integration of science and technology and culture, and top world tourist destinations. The life-oriented Zhongguancun Science City in the south is positioned as a technological innovation and innovative service research area, growth pole region of leading national and regional innovation and development, and ecologically intelligent region of urban-rural integrated development. Moreover, the land consolidation strategy of northern intensification, central optimization, and southern potentiality exploitation has been implemented.
3.3.2. Determination of Evaluation Unit
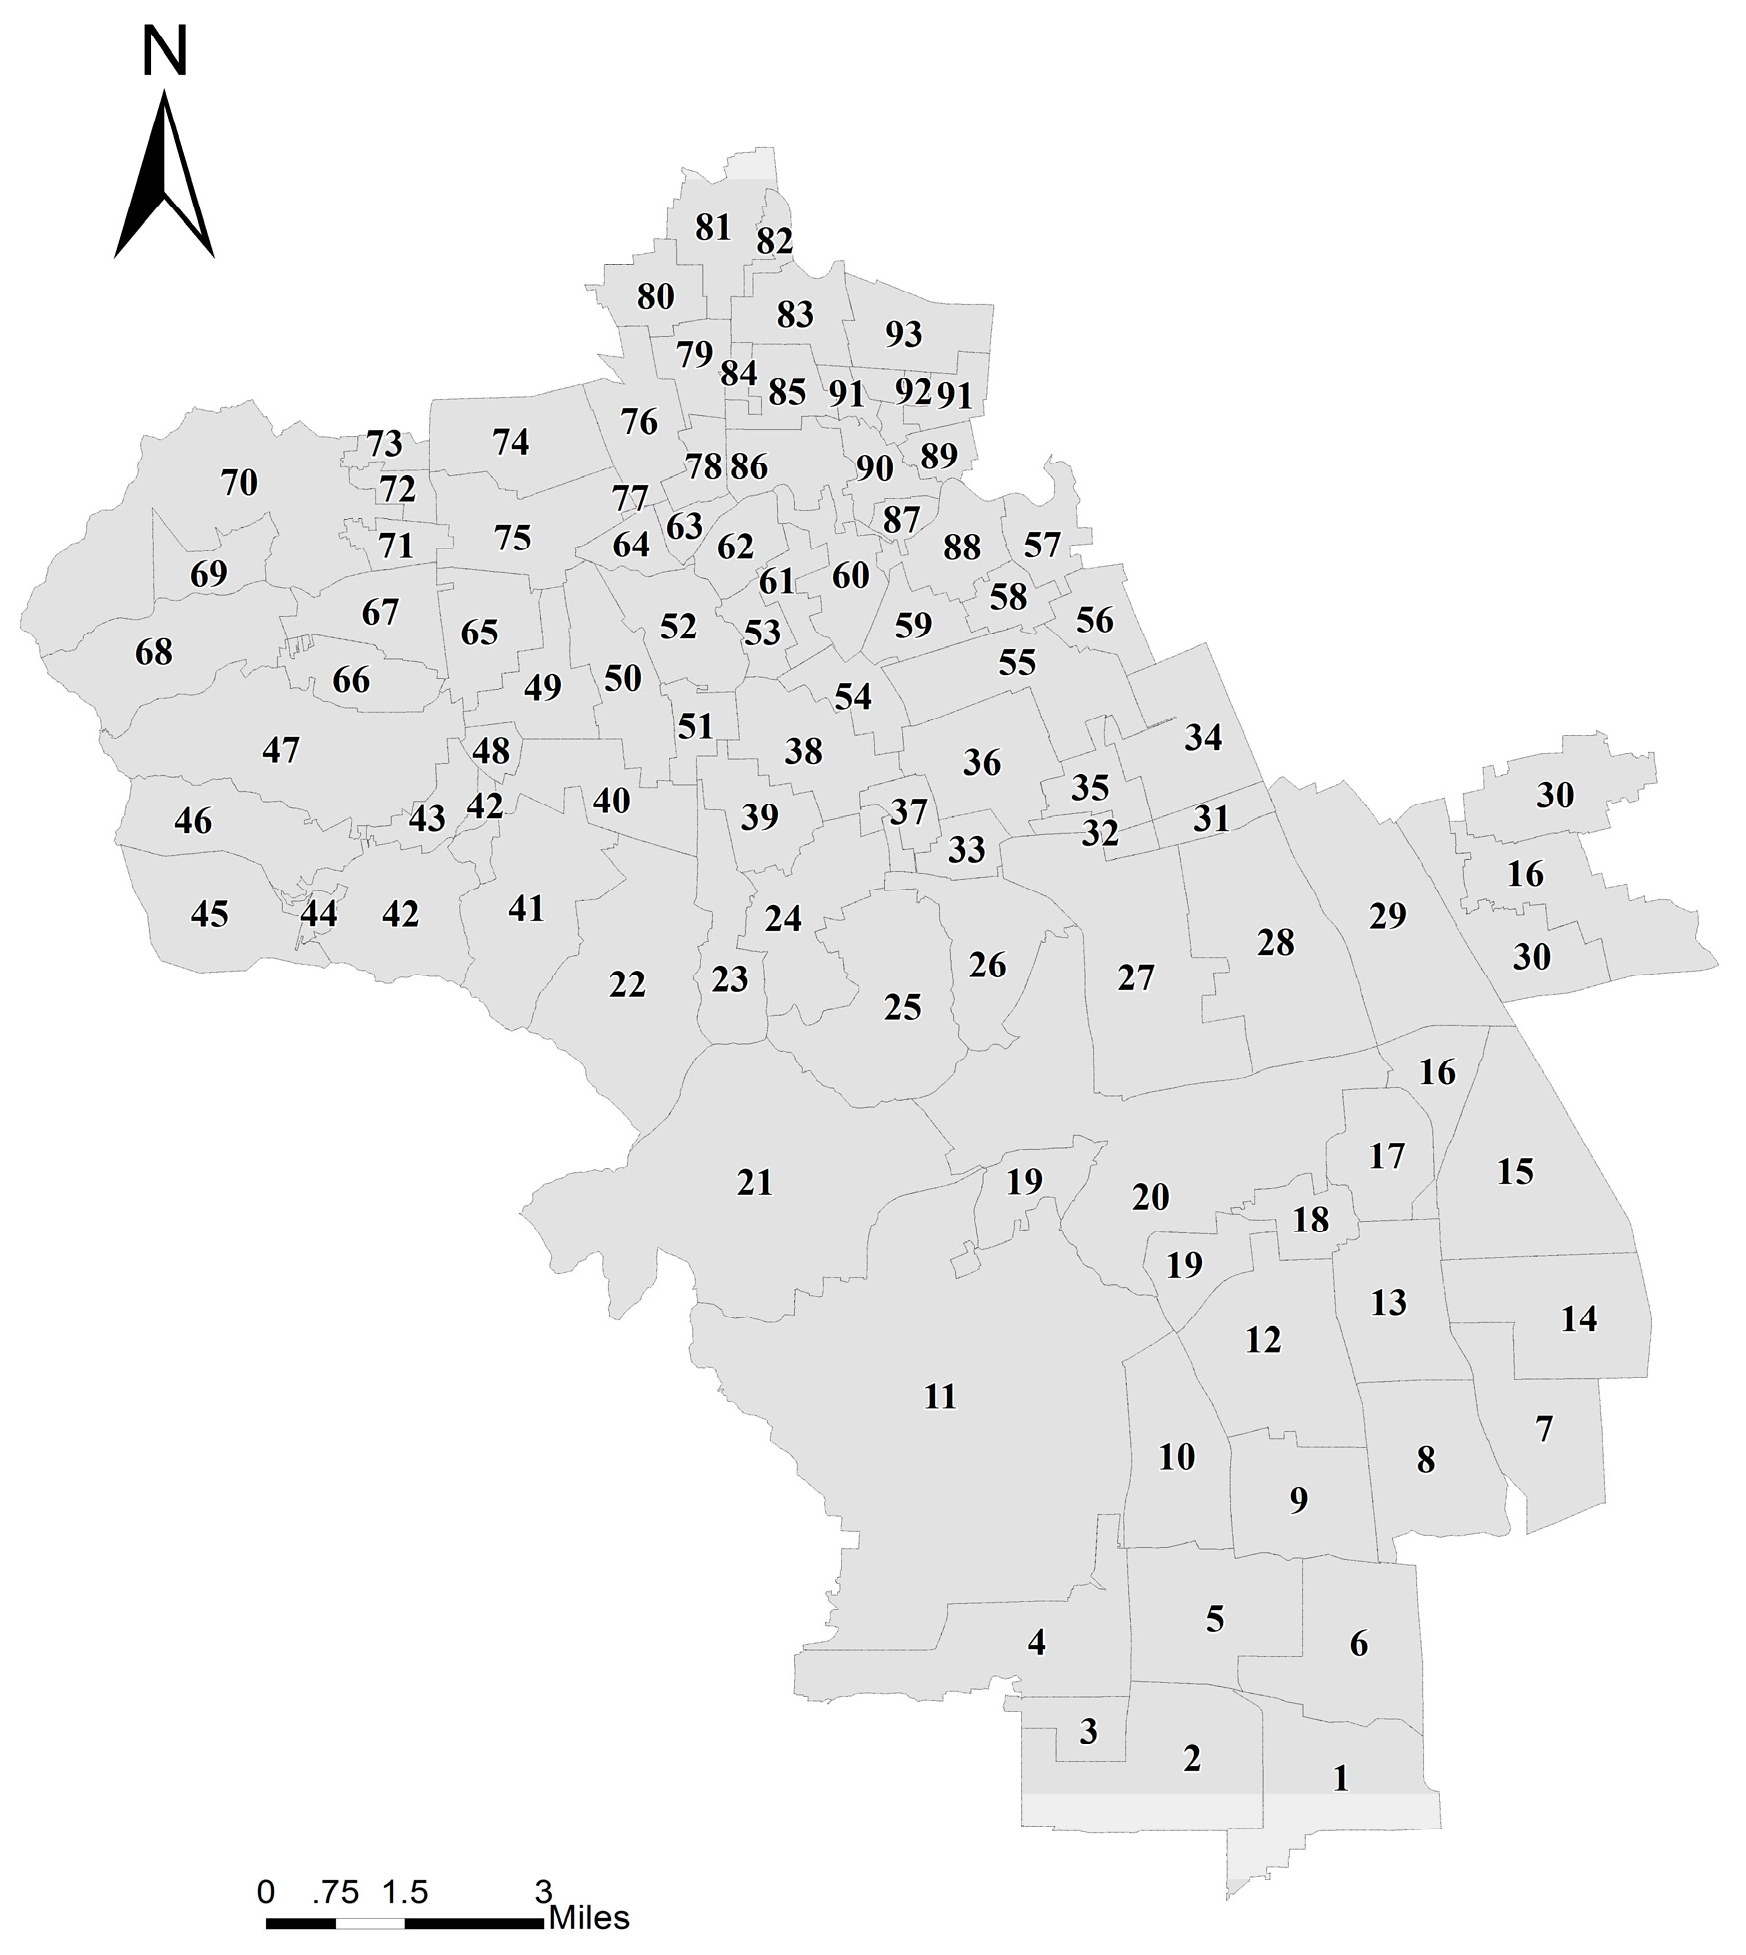
As shown in Figure 6, a total of 43,080.61 ha in Haidian District cover 93 evaluation units. The average area of the evaluation units is 463.23 ha. The 17 evaluation units in the south have an average area of 2304.96 ha, which can be numbered S1 to S17; the 5 evaluation units in the center have an average area of 997.38 ha, numbered M1 to M5; and the 71 evaluation units in the north have an average area of 332.71 ha, numbered N1 to N71. Among these evaluation units, the largest is No. 11 in the south, namely S11, with an area of 3952.52 ha, and the smallest is No. 77 (Sujiatuo Flower Company, Beijing, China) in the north (N77), with an area of 4.04 ha. As shown in Table 3, in the south of Haidian District, 17 evaluation units are present with an average area of 851.24 ha. Among them, the largest evaluation unit is 3952.52 ha, and the smallest unit is 178.55 ha, the standard deviation is 817.98 ha. 5 evaluation units are present in the center with an average area of 997.38 ha. Among them, the largest evaluation unit is 2069.24 ha, and the smallest unit is 197.29 ha, the standard deviation is 905.64 ha. In addition, in the north, 71 evaluation units are present with an average area of 332.71 ha. Among them, the largest evaluation unit is 1268.69 ha, and the smallest unit is 4.04 ha, the standard deviation is 274.77 ha.
3.3.3. Construction of Production-life-ecology Index System Function Evaluation
A differentiated production-life-ecology index system function evaluation was constructed to determine the functional position of each functional area. The method we used to calculate weights of indicators was used in the study of Xu et al., 2011 [42]. The weights of relative importance of each factor and subfactor are identified using a paired comparison. Their weights are decided according to their relative importance ranking with AHP. In our research, we designed a weight survey table for 50 experts who were familiar with functional area of Haidian Distrcit and asked them to assign a weight for each index according to their pact. Then we obtained the weight of each factor and subfactor by weighing the average of all the experts’ survey tables. The result of the indicators and weights are shown in Table 4 [36,42,43].
3.3.4. Functional Capacity Measurement of Land Consolidation
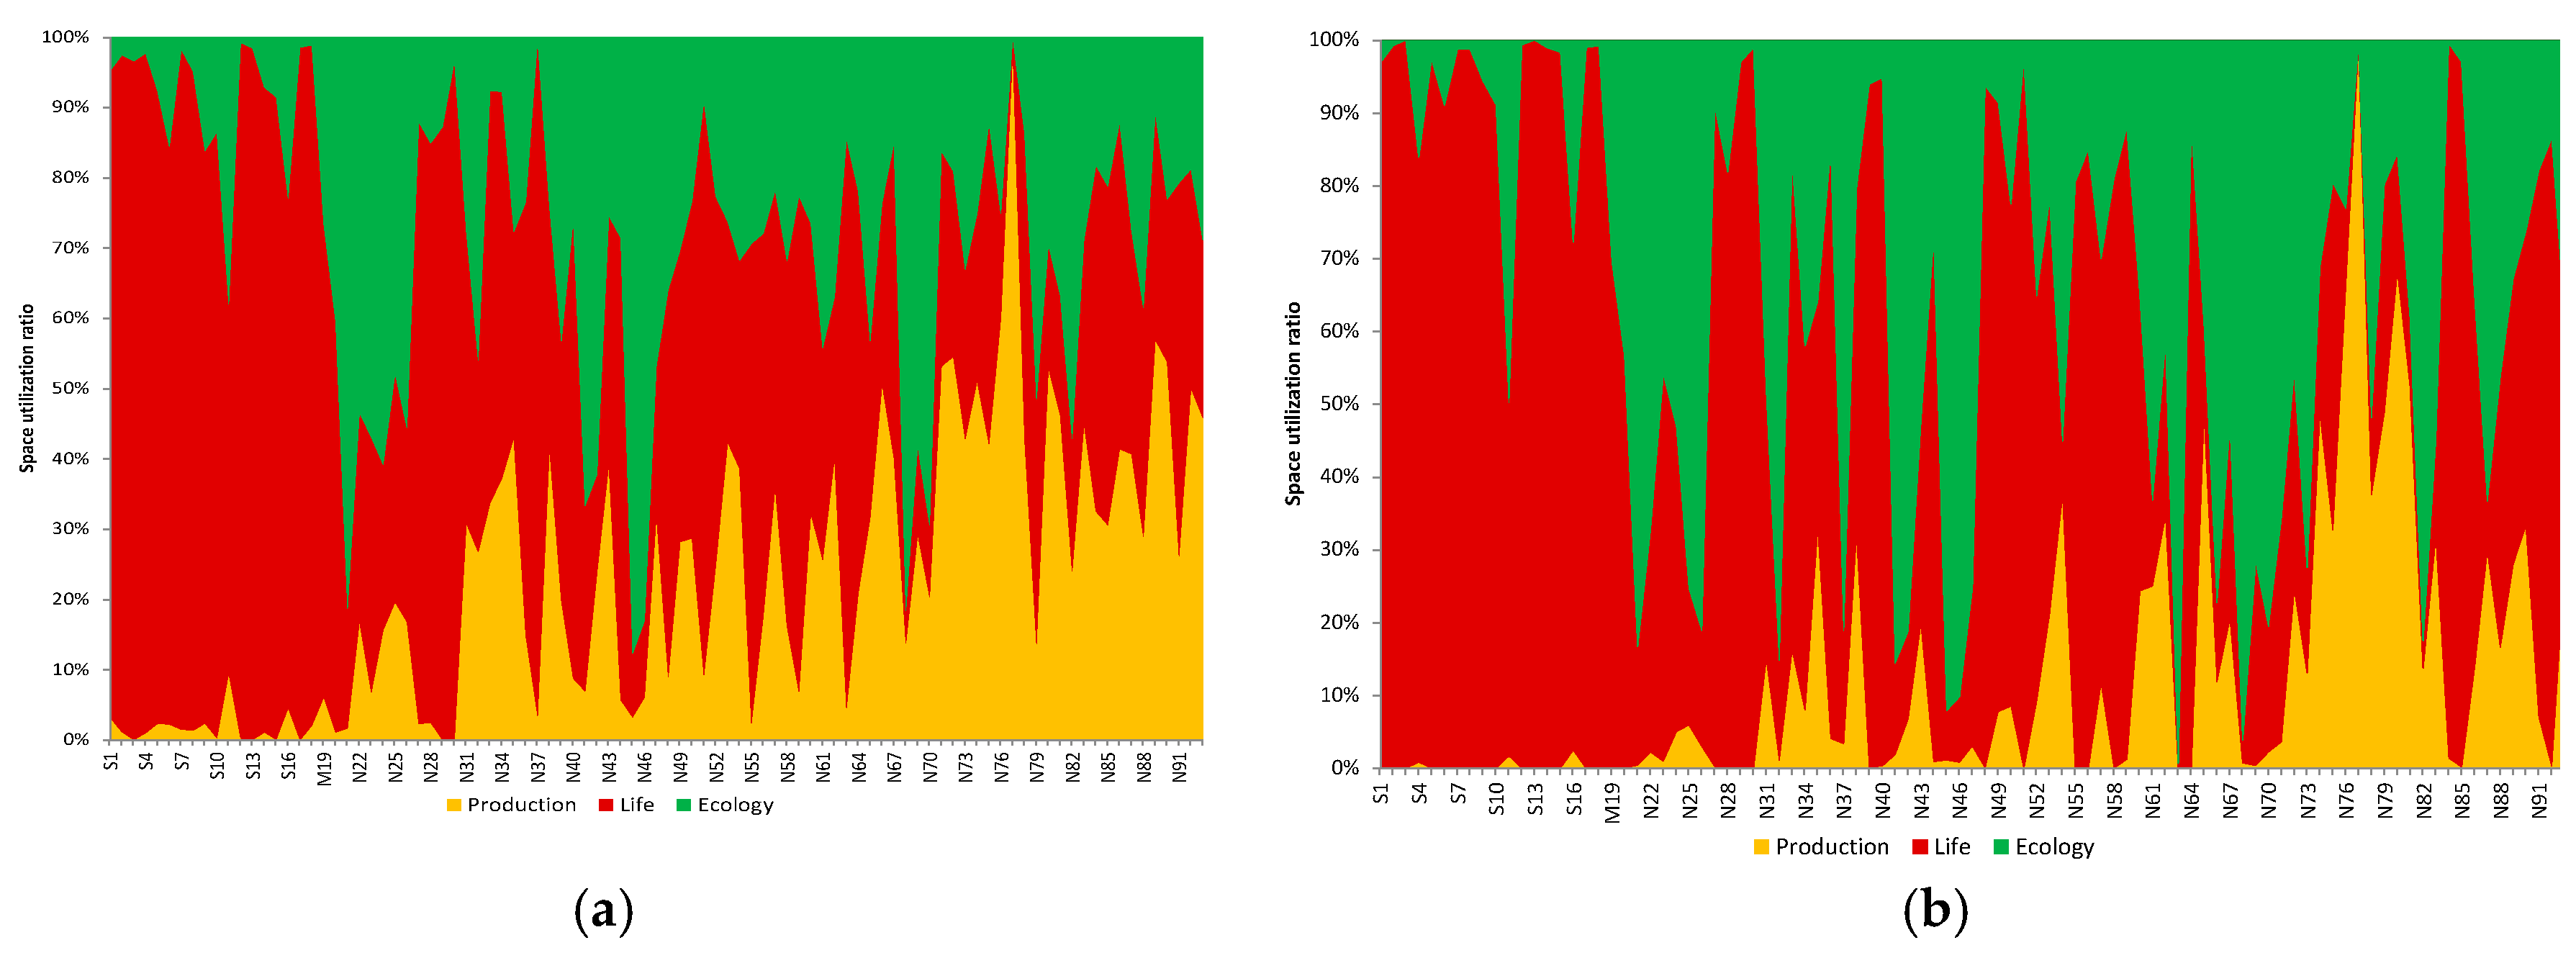
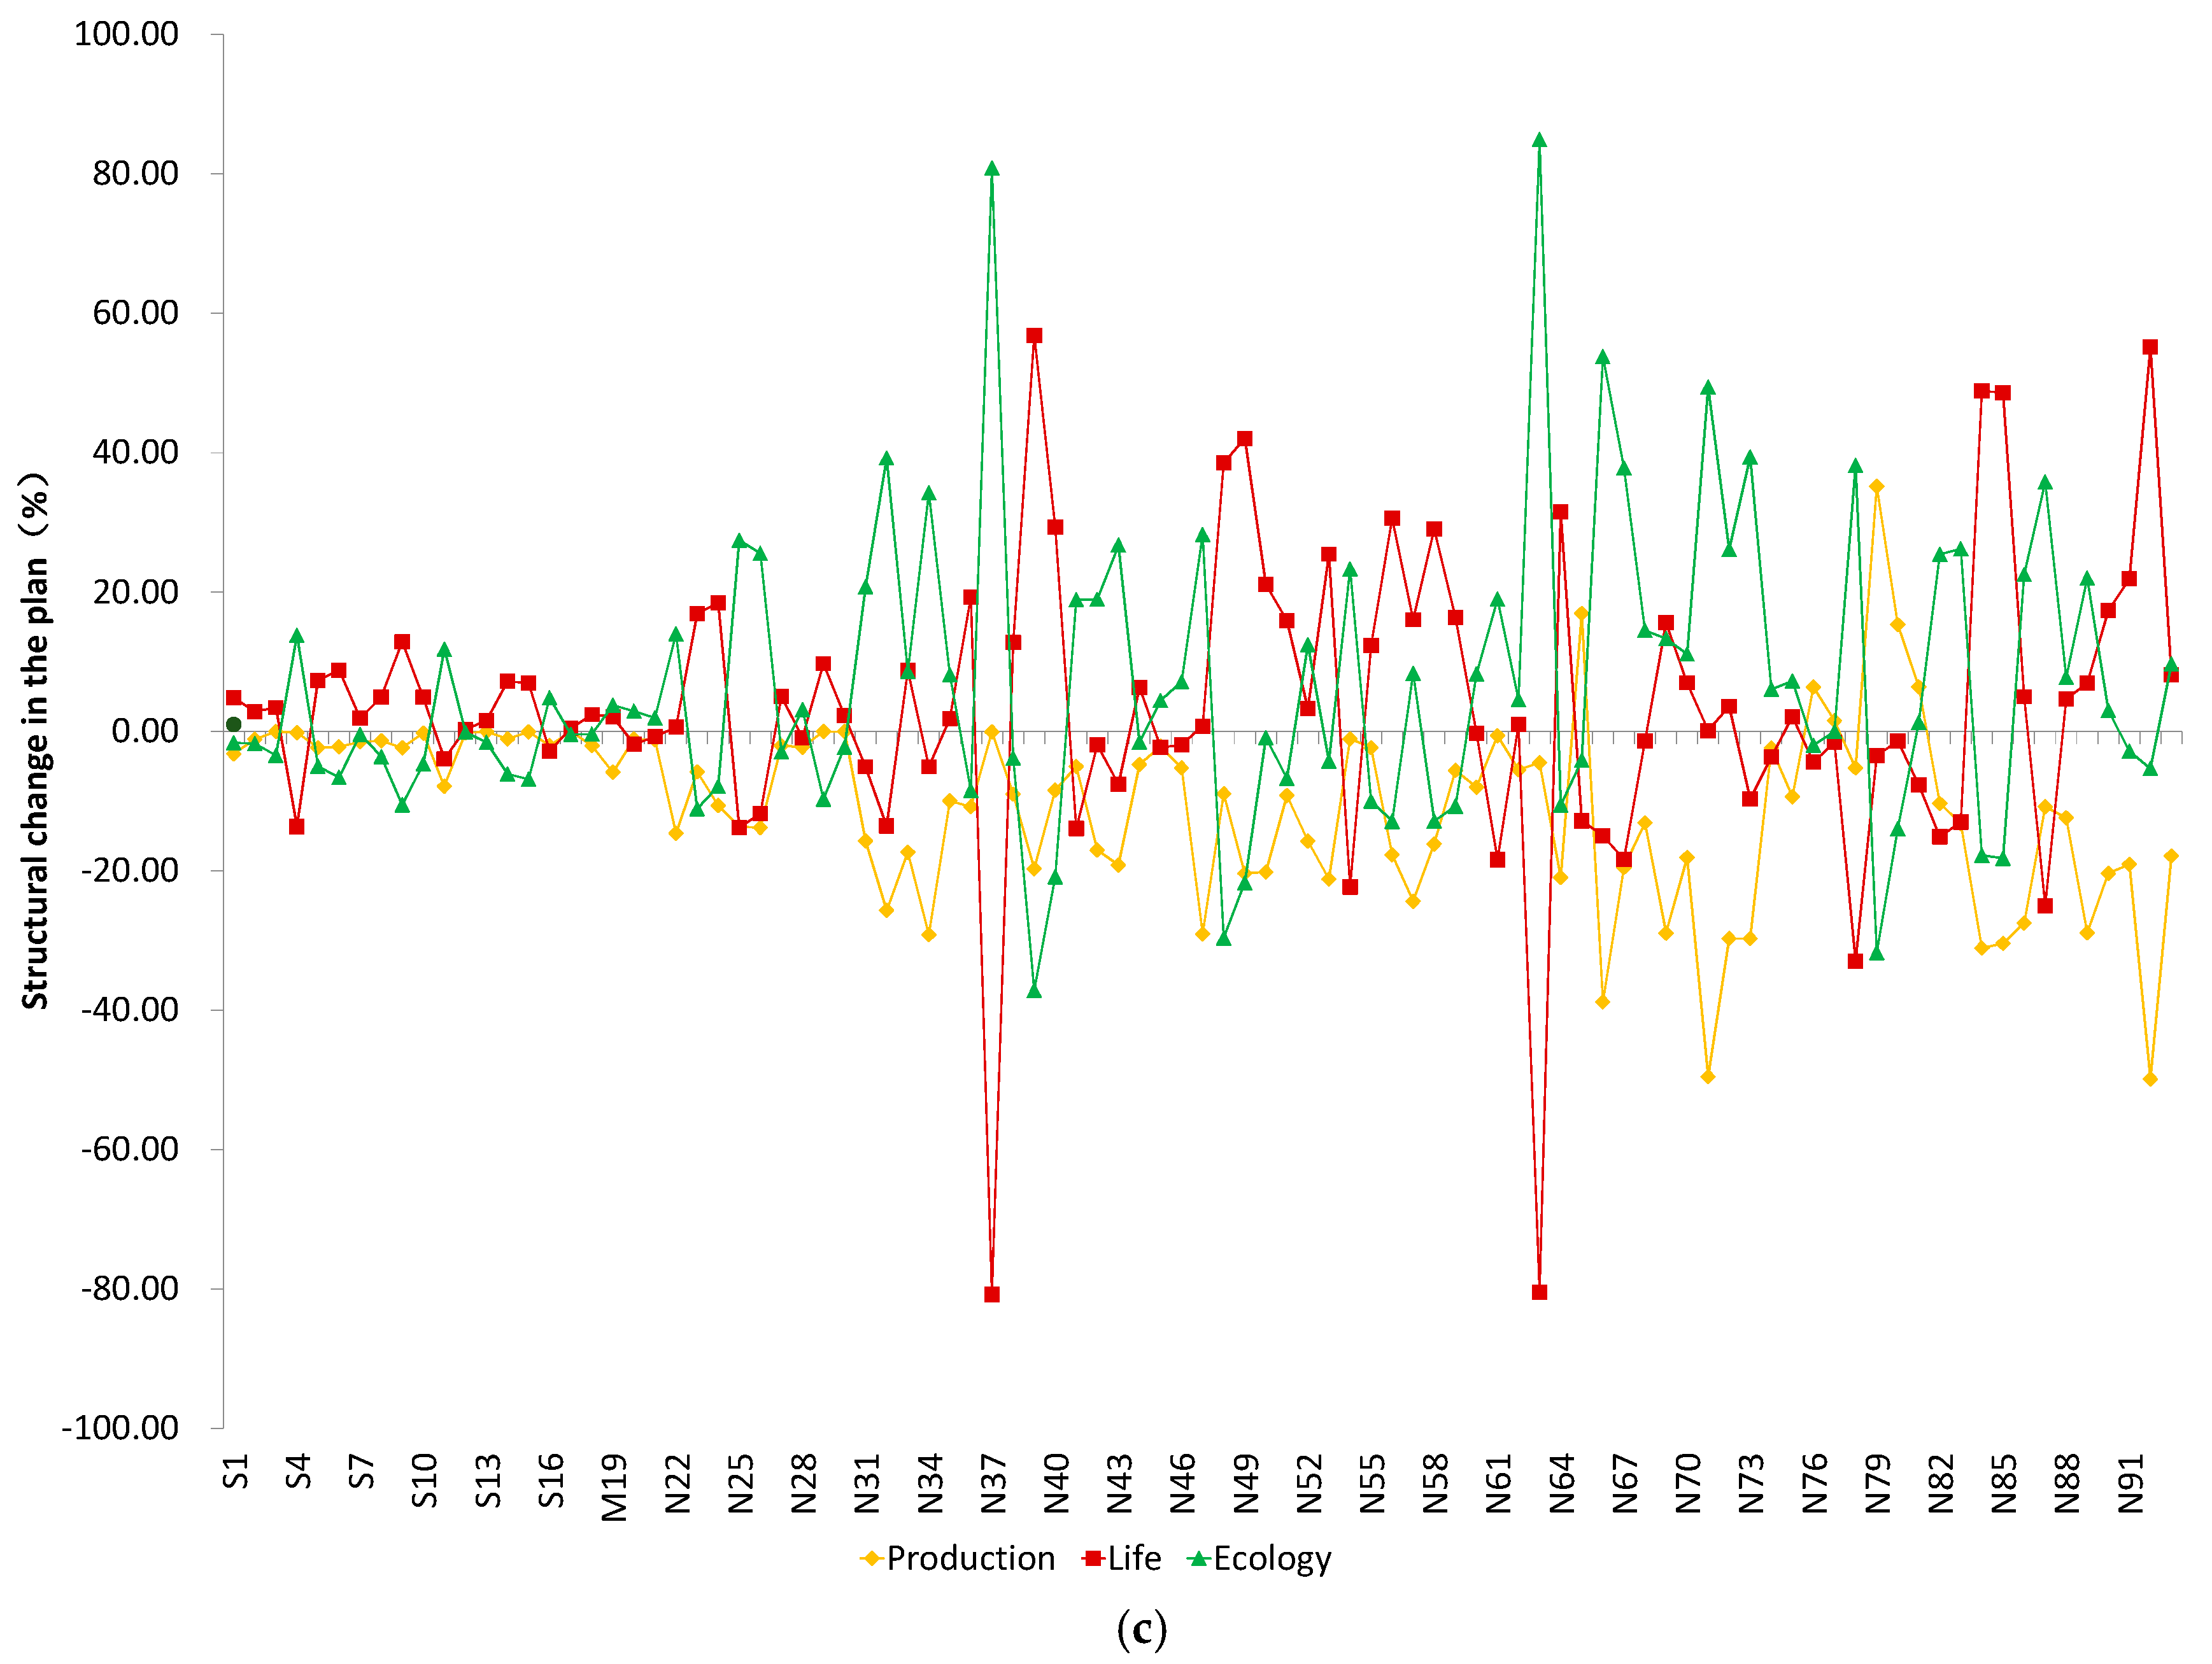
As shown in Figure 7, the horizontal axis represents the evaluation units arranged from south to north, whereas the vertical axis represents the proportion that accounts for the dominant space. Figure 7a shows the spatial-structure’s regional distribution of the current use of valuation units, whereas Figure 7b exhibits spatial-structure’s regional distribution of the planned use of valuation units. Thus, a difference value could be obtained by subtracting the dominant function proportions in Figure 7a,b. As shown in Figure 7c, the production-life-ecology disparities between status quo and planning are represented to reveal functional capacity demands of land consolidation for each evaluation unit. The analysis of spatial change in the current situation and the planning structure of production-life-ecology land utilization showed that life space will exhibit a declining trend in the evaluation units from south to north, whereas the ecological and production space will exhibit an increasing trend. Based on the analysis of the consolidation spatial variation trend, the production space showed an intensive conservation trend and the land use size reduction from south to north gradually increased. Moreover, the ecological space showed an increasing trend that peaked in the range of the natural ecological reserve and reached a high value in the ecological service zone distributed in the regional country park. Furthermore, life space increased in the middle, and the change was apparent in the production land.
3.3.5. Functional Unit Determination for Land Consolidation
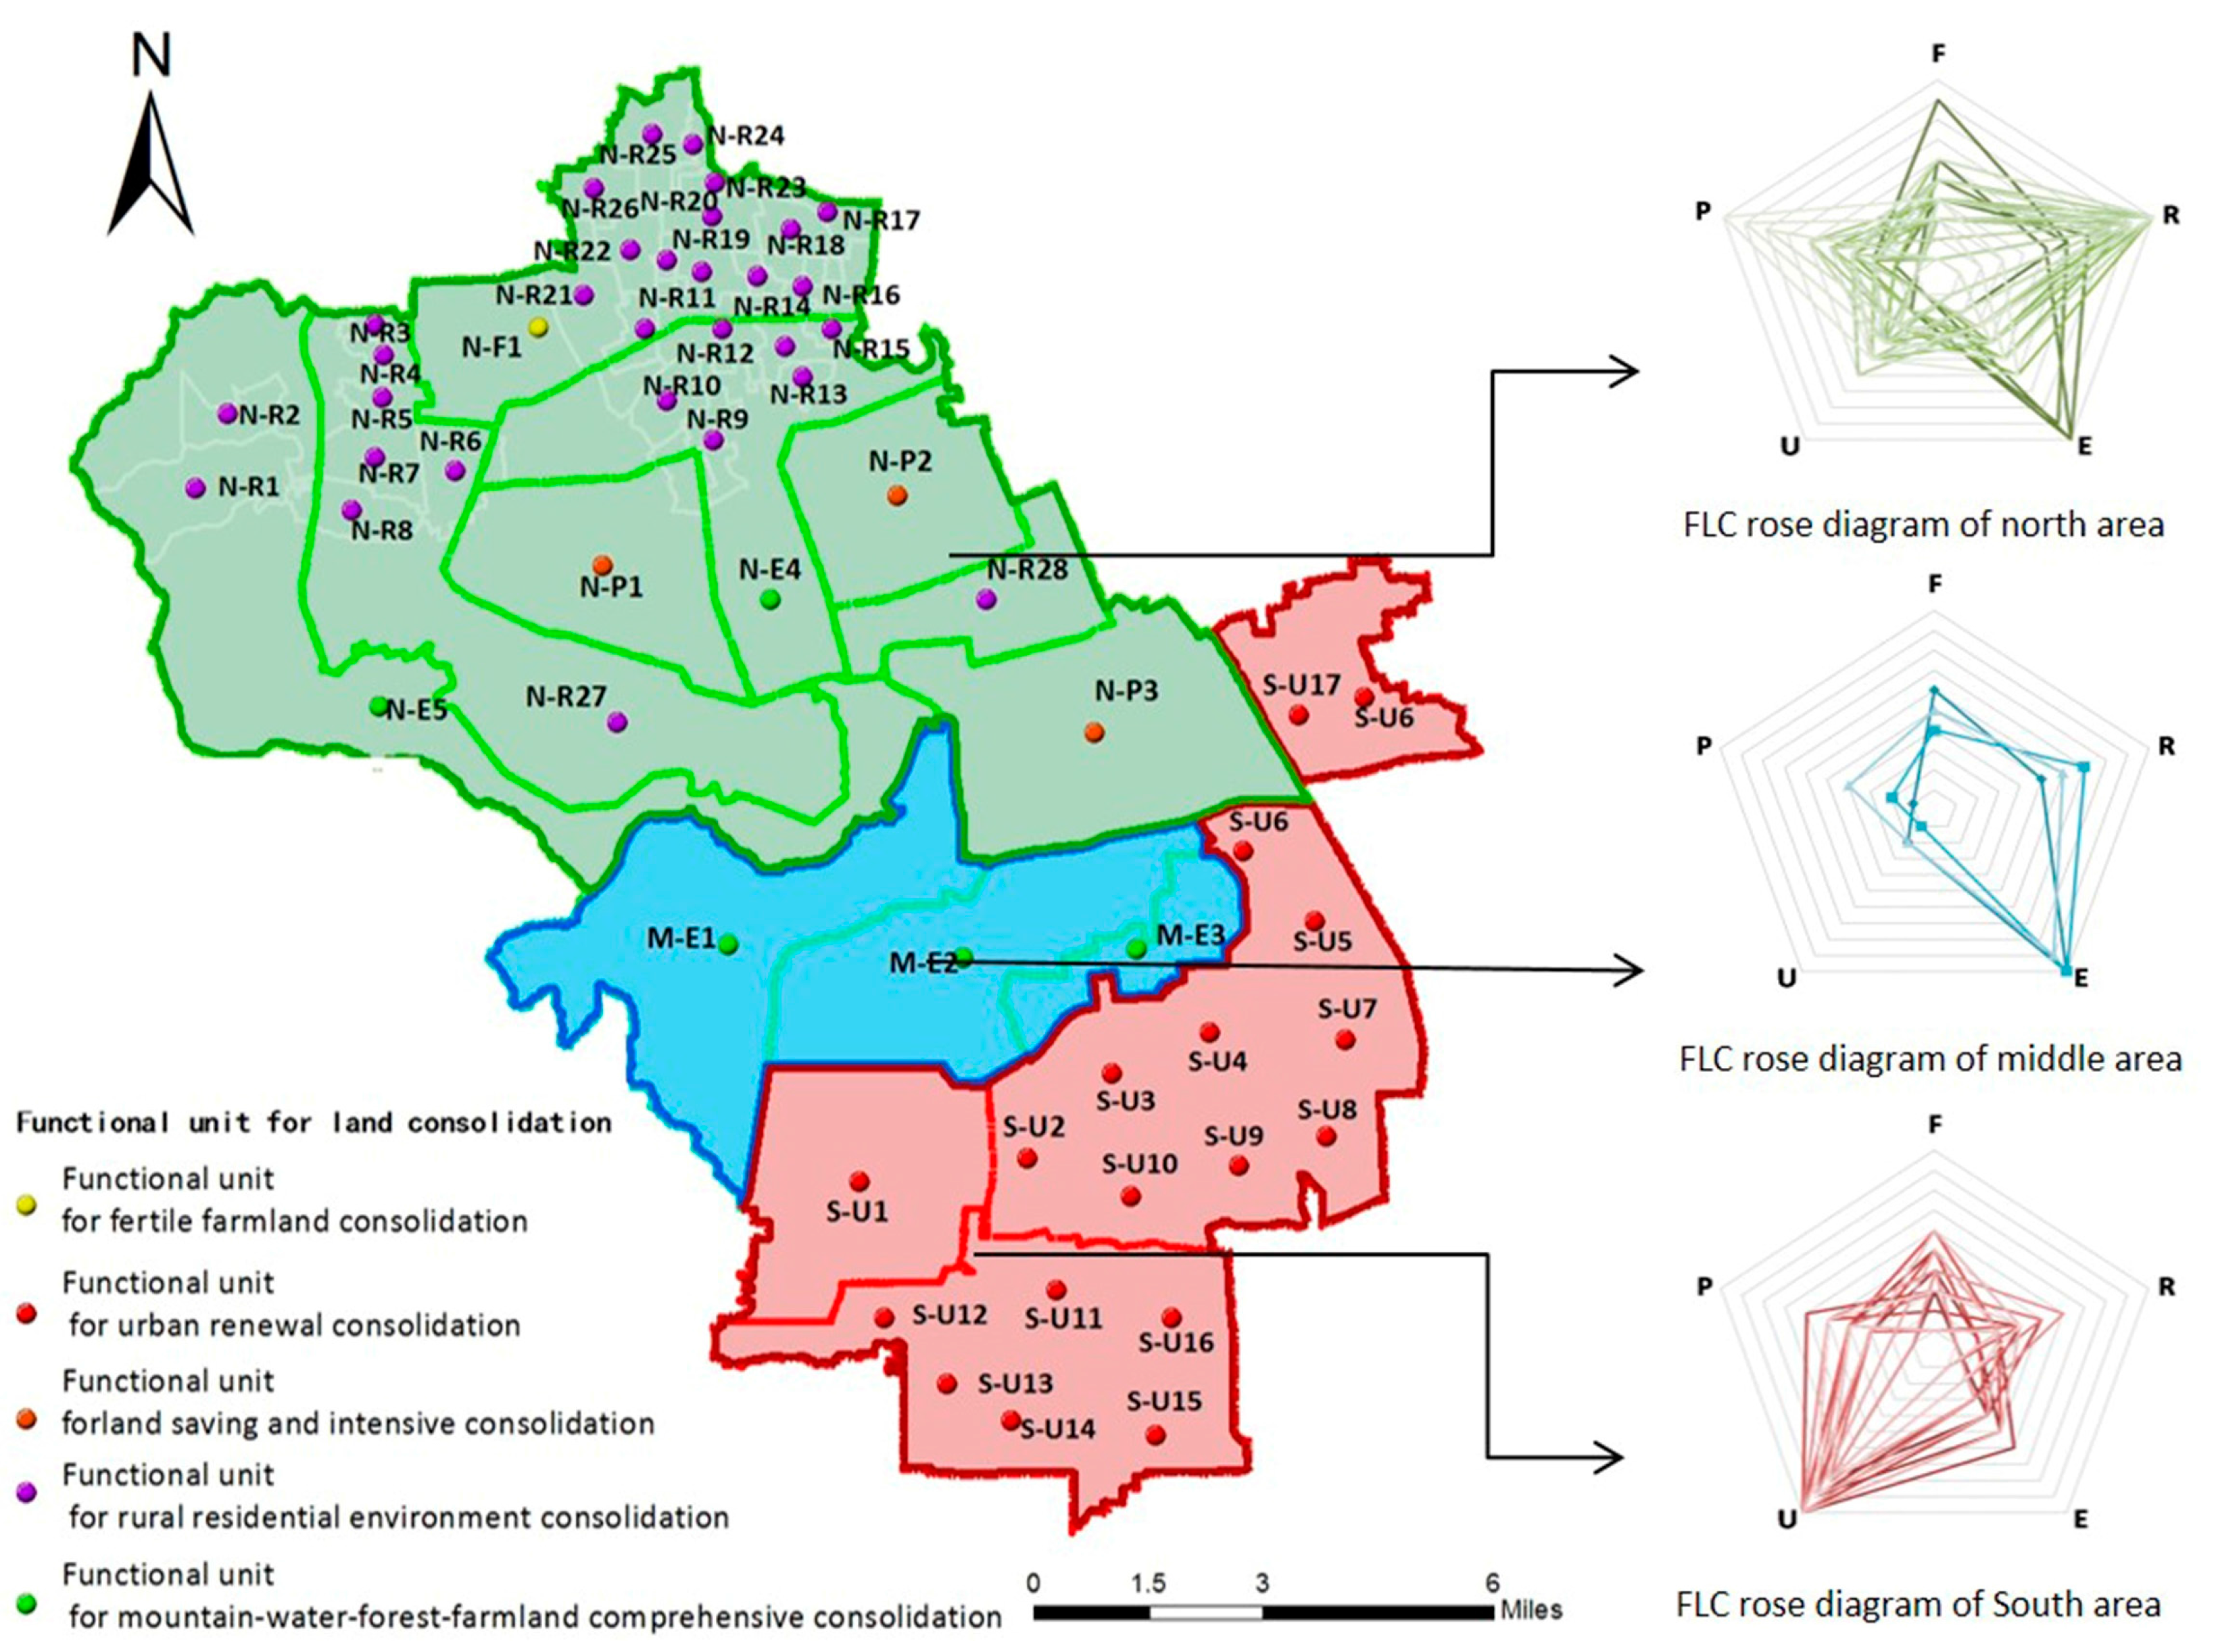
As shown in Figure 8, the 93 evaluation units in Haidian District can be integrated into 54 FULCs. In this graph, the first letter of each unit represents the three functional areas for land consolidation. “N” represents the production-oriented ecological science and technology zones in the north, “M” represents the historical and cultural scenic spots in the middle, and “S” represents the Zhongguancun Science City in the south. The second letter of each unit, namely, “F”, ”R”, ”E”, ”U”, and ”P”, are abbreviations of five functional categories for land consolidation units. Specifically, “F” denotes the functions of the rural production consolidation units that aim to increase the size of cultivated land and enhance agricultural production by improving agricultural infrastructure and constructing high-standard basic farmlands [4,44]. “R” denotes the rural life consolidation units that stress the improvement of farmers’ living environments. “E” denotes the ecological land consolidation units that focus on enhancing regional ecological quality [45]. “U” denotes the urban life consolidation units that focus on improving urban life quality and makes full use of stock construction land [45,46]. “P” denotes the urban production land consolidation units that aim to make full use of the agglomeration advantages and upgrade the industries.
After the demarcation, the specific land consolidation projects can be arranged to match every FULC. In Haidian District, one functional unit is used for fertile farmland consolidation that mainly covers reinforced land consolidation of agricultural production function by implementing projects for basic farmland constructions with high standards. A total of 28 functional units are used for rural residential environment consolidation that covers rural life function reinforcement by mainly implementing local transformation and autonomous renewal projects to make rural living conditions livable and distinctive. Five functional units are allocated for mountain-water-forest-farmland comprehensive consolidation that covers ecological transformation of rural life and ecological function reinforcement by mainly implementing resettlement projects for residential land in fragile ecological areas and the colorized project of the Daxishan Hills [46]. A total of 17 functional units are reserved for urban renewal consolidation that covers land consolidation of urban life function reinforcement and transformation from urban production function to life function by implementing potential projects for urban stock construction lands [46,47]. Three functional units are used for land saving and intensive consolidation in ecological and technological zones [48,49] that cover land consolidation of industry service function reinforcements, as well as the transformation from rural life to production function by mainly implementing intensive utilization projects for ecological and technological industrial parks.
4. Discussions
4.1. Mixture of the Bottom–Up and Top–Down Approaches
Generally, the function of land consolidation relates to a number of social, economic, national, and regional development strategies and policy factors, as well as their interactions. The proposed framework considers the preconditions of sustainable urban development, such as livability, production, and ecology, from a top–down perspective. Through the evaluation of production-life-ecology functions and location quotients, the model is capable of incorporating local particulars. Therefore, the model can be regarded as an intermediate toward the bottom–up approaches. As a result, the land consolidation projects can meet the demand of every FULC closely and are implemented efficiently in other areas. However, the FULC remains a new concept to the Chinese government and its performance still needs to be tested by following practices.
4.2. The Categories of FULCs and Implementation Mechanisms
In the proposed framework, the FULCs were divided into five categories, namely, functions of urban production, rural production, urban life, rural life, and ecology, which are only several possibilities among the numerous ways of classification. For instance, categories, such as functions of production–life, life–ecology, and production–ecology mixture, can be created. However, the goal of the categories is to make FULC a basic unit to arrange different land consolidation projects separately according to the local conditions. In this manner, the function categories are not fixed, but adjustable. Thus, the demarcation of FULC is flexible and can match the change of projects with actual situations as a minimum unit of project implementation.
4.3. The Explanations of More Disparities Found in the Rural Areas
As seen in Figure 7, compared with the evaluation units of central and southern part, the evaluation units in the northern parts show more disparities in terms of land consolidation demand. Differences distribute mainly in three kinds of FULC, namely R, P, E. The reasons may include the regional difference of nature endowment, geographical characteristics and social property. In fact, the northern part of Haidian is formed by the mountainous areas in the west and the plain region in the east. Mountainous areas have relatively less construction land. Thus, the land consolidation in northwest area mainly focus on ecological protection of status quo which result in less demand of land consolidation input, such as No. 44~46 units which are divided into class E. In accordance with the requirements of industrial development, part of the undeveloped land in the plain region need to be transformed into industrial parks, resulting in an increasing demand of construction land. Therefore, those evaluation units such as No. 48~52 need more land consolidation input for land use change. The other parts of plain regions are the rural residential areas, which are distributed scattered. To improve the living environment of villagers, some living space needs to be regulated into ecological land. Based on different requirements of the neighborhood, evaluation units such as No 37 and 64 are mainly divided into class R or E. Compared with rural area, the nature endowment, geographical characteristics and social property of urban areas are more homogenous and the requirements of land transformation and land consolidation input are relatively less.
4.4. The Reason of Case Selection and the Limitations of the Framework
As a case of metropolitan area, Haidian District is not only including urban area, however, large part of the district is rural area in the north. The reason we choose Haidian District to apply the demarcation steps of FULC is that we think metropolitan areas should also contain countryside, which plays various roles in terms of environment protection, regional coordination and other services supplementary. In addition, rural space in metropolitan areas also has its special development process. Thus, studying the case of Haidian can figure out the impact of urbanization process on the previous land consolidation limited by farmland production. As a result, the first demarcation steps of FULC is to determinate functional areas for land consolidation, namely of divide Haidian District into northern, central and southern functional areas for land consolidation. In this way, the demarcation of FULC can be applied in the whole metropolitan areas to meet the specific differentiated demand in the design of land consolidation projects. However, we mainly emphasize on the land consolidation demand of metropolitan areas, but fail to take other areas such as counter urbanization area and purely countryside into consideration. For those areas, determination of functional areas may be relatively harder due to regional homogeneity or some other reasons, which is the limitation of our framework.
5. Conclusions
This study clarified the definition of FULC and established the demarcation method of FULC. First, production-life-ecology function-oriented land consolidation function areas and evaluation units were divided. Then, the functional capacity of each unit was calculated based on the established index system for unit demarcation. After drawing a rose diagram, the leading function of each unit in terms of land consolidation was selected. The demarcation framework of FULC can also be considered a process of transformation from a macro production-life-ecology function, which is based on planning objectives and social and economic demand, among others, to micro land consolidation functions, which are implemented to achieve differentiated optimization for sustainable land use. Given that the demarcation framework of FULC already considers the geographical units, natural resource distribution, land consolidation potential, regional spatial structure, and internal mechanism of regional social and economic development, the implementation of FULC can effectively identify the dominant function of land consolidation in the regional space and decompose the regional development strategy. Through a well-organized land consolidation project arrangement, the implementation of FULC can optimize the land utilization structure and spatial layout at the macroscopic level, thereby resulting in the overall improvement of the production-life-ecology function coordination in a productive cycle.
Haidian District in Beijing is used as a case for empirical implementation. Based on the 93 evaluation units in Haidian District, an index system was established and the functional consolidation capacity was calculated, with production-life-ecology functions taken into consideration. The results showed that the FULCs in Haidian District are mainly divided into 5 categories, including 54 FULCs. Moreover, different land consolidation projects were separately designed for each FULC. For example, in terms of 28 FULCs for rural residential environment improvement, local transformation and autonomous renewal projects to make rural living conditions livable and distinctive have been arranged. Thus, the implementation policy for each FULC is formed and applied and its effect can be gradually revealed. At present, land consolidation projects in most Chinese areas are often crudely determined when one rule applies to a large region. This “one-pattern-fits-all” decision model inevitably overlooks unique local needs and consequently results in suboptimal solutions. The proposed FULC demarcation enables optimal land consolidation projects to be determined objectively on the disaggregate level. Thus, the results are sufficiently flexible to accommodate local needs. Moreover, the proposed FULC demarcation is capable of simultaneously incorporating a large amount of geological, geographical, economic, social, and environmental information, and more importantly, providing technical support and practical references for planners and executors to arrange different land consolidation projects at the macroscopic level. Thus, this study helps improve a land use structure and spatial layout that balances production, life, and ecological needs, as well as enables local governments to meet their sustainable land use targets.
Acknowledgments
This work was supported by the NSFC-RCUK_ESRC Collaborative Program (Grant No. 71661137009) and the Major Achievements Transformation Projects of Central University in Beijing. This work was also supported by the Special Research Fund Project for Public Welfare Industry of the Ministry of Land and Resources of China (Grant No. 201511003-2 and 201511010-04).The authors are grateful for the financial support from the China Postdoctoral Science Foundation and the Project of “first-class university and the first-class discipline construction” of Renmin University of China.
Author Contributions
Jinming Yan conceived and designed the research. Yue Shen developed the methodology for the demarcation of FULC and produced the tables and figures. Fangzhou Xia performed the case study and wrote the paper. All of the coauthors drafted and revised the article together. All of the authors read and made improvements to the manuscript.
Conflicts of Interest
The authors declare that they have no conflicts of interest.
References
- Pannell, C.W. China’s continuing urban transition. Environ. Plan. A 2002, 34, 1571–1590. [Google Scholar] [CrossRef]
- Wang, L.; Li, C.; Ying, Q.; Cheng, X.; Wang, X.; Li, X.; Hu, L.L.; Yu, L.; Huang, L.; Gong, H.P. China’s urban expansion from 1990 to 2010 determined with satellite remote sensing. Chin. Sci. Bull. 2012, 57, 2802–2812. [Google Scholar] [CrossRef]
- Chen, M.; Liu, W.; Tao, X. Evolution and assessment on China’s urbanization 1960–2010: Under-urbanization or over-urbanization? Habitat Int. 2013, 38, 25–33. [Google Scholar] [CrossRef]
- Yan, J.; Xia, F.; Bao, H.X.H. Strategic planning framework for land consolidation in China: Atop-level design based on SWOT analysis. Habitat Int. 2015, 48, 46–54. [Google Scholar] [CrossRef] [Green Version]
- Nguyen, T.; Cheng, E.; Findlay, C. Land fragmentation and farm productivity in China in the 1990. China Econ. Rev. 1996, 7, 169–180. [Google Scholar] [CrossRef]
- Zhang, Z.; Zhao, W.; Gu, X. Changes resulting from a land consolidation project (LCP) and its resource-environment effects: A case study in Tianmen City of Hubei Province, China. Land Use Policy 2014, 40, 74–82. [Google Scholar] [CrossRef]
- Li, Y.; Liu, Y.; Long, H.L.; Cui, W. Community-based rural residential land consolidation and allocation can help to revitalize hollowed villages in traditional agricultural areas of China: Evidence from Dancheng County, Henan Province. Land Use Policy 2014, 39, 188–219. [Google Scholar] [CrossRef]
- Liu, Y.S.; Liu, Y. Progress and prospect on the study of rural hollowing in China. Geogr. Res. 2010, 29, 35–42. (In Chinese) [Google Scholar]
- Wang, J.Y.; Liu, Y.S.; Chen, Y.F. Spatial expansion pattern and its dynamic mechanism of typical rural settlements in Huang-Huai-Hai Plain. Geogr. Res. 2010, 29, 1833–1840. (In Chinese) [Google Scholar]
- Lu, S. Spatio-Temporal Patterns and Policy Implications of Urban Land Expansion in Metropolitan Areas: A Case Study of Wuhan Urban Agglomeration, Central China. Sustainability 2014, 6, 4723–4748. [Google Scholar] [CrossRef]
- Zhang, Z.; Tang, W.; Gong, J.; Huan, J. Property rights of urban underground space in China: A public good perspective. Land Use Policy 2017, 65, 224–237. [Google Scholar] [CrossRef]
- Xia, F.Z.; Shen, Y.; Yan, J.M.; Bao, H.X.H. On the Potential of Urban Three-dimensional Space Development: The Case of Liuzhou, China. Habitat Int. 2016, 51, 48–58. [Google Scholar] [CrossRef]
- Miranda, D.; Crecente, R.; Alvarez, M.F. Land consolidation in inland rural Galicia, N.W. Spain, since 1950: An example of the formulation and use of questions, criteria and indicators for evaluation of rural development policies. Land Use Policy 2006, 23, 511–520. [Google Scholar] [CrossRef]
- Yan, J.; Xia, F.; Li, Q. Top strategy design of comprehensive land consolidation in China. Trans. Chin. Soc. Agric. Eng. 2012, 28, 1–9. (In Chinese) [Google Scholar]
- Sklenicka, P. Applying evaluation criteria for the land consolidation effect to three contrasting study areas in Czech Republic. Land Use Policy 2006, 23, 502–510. [Google Scholar] [CrossRef]
- Van, D.T. Complications for traditional land consolidation in Central Europe. Geoforum 2007, 38, 505–511. [Google Scholar]
- Lier, H.N.V. Land use planning and land consolidation in the future in Europe. Z. Fur Kult. Landentwickl. 2000, 41, 138–143. [Google Scholar]
- Gonzalez, X.P.; Alvarez, C.J.; Crecente, R. Evaluation of land distributions with joint regard to plot size and shape. Agric. Syst. 2004, 82, 31–43. [Google Scholar] [CrossRef]
- Crecente, R.; Alvarez, C.; Frau, U. Economic, social and environmental impact of land consolidation in Galicia. Land Use Policy 2002, 19, 135–147. [Google Scholar] [CrossRef]
- Wittlingerova, Z.; Kriz, L. The effect of anthropogenic activities on the chemical properties of ground waters. Rostl. Vyroba 1998, 44, 321–324. [Google Scholar]
- Zhou, J.; Qin, X.; Liu, L.; Hu, Y. A potential evaluation model for land consolidation in fragmental regions. Ecol. Indic. 2017, 74, 230–240. [Google Scholar] [CrossRef]
- Thapa, G.; Niroula, G. Alternative options of land consolidation in the mountains of Nepal: An analysis based on stakeholders’ opinions. Land Use Policy 2008, 25, 338–350. [Google Scholar] [CrossRef]
- Pasakarnis, G.; Maliene, V. Towards sustainable rural development in Central and Eastern Europe: Applying land consolidation. Land Use Policy 2010, 27, 545–549. [Google Scholar] [CrossRef]
- Brink, D.V. Land consolidation and the emergence of the metropolitan landscape. In Proceedings of the Symposium on Modern Land Consolidation, Volvic, France, 10–11 September 2004. [Google Scholar]
- Haldrup, N.O. Agreement based land consolidation-In perspective of new modes of governance. Land Use Policy 2015, 46, 163–177. [Google Scholar] [CrossRef]
- Lu, Y. Integrating Future Land Use Scenarios to Evaluate the Spatio-Temporal Dynamics of Landscape Ecological Security. Sustainability 2016, 8, 1242. [Google Scholar] [CrossRef]
- Porta, J.; Parapar, J.; Doallo, R.; Barbosa, V.; Santé, I.; Crecente, R.; Díaz, C. A population-based iterated greedy algorithm for the delimitation and zoning of rural settlements. Comput. Environ. Urban Syst. 2013, 39, 12–26. [Google Scholar] [CrossRef]
- Lu, W.; Liu, J.; Xiang, X.Q.; Song, W.L.; Mcilgorm, A. A comparison of marine spatial planning approaches in China: Marine functional zoning and the marine ecological red line. Mar. Policy 2015, 62, 94–101. [Google Scholar] [CrossRef]
- Schäfer, M.; Kröger, M. Joint problem framing in sustainable land use research: Experience with Constellation Analysis as a method for inter- and trans-disciplinary knowledge integration. Land Use Policy 2016, 57, 526–539. [Google Scholar] [CrossRef]
- Nackoney, J.; Rybock, D.; Dupain, J.; Facheux, C. Coupling participatory mapping and GIS to inform village-level agricultural zoning in the Democratic Republic of the Congo. Landsc. Urban Plan. 2013, 110, 164–174. [Google Scholar] [CrossRef]
- Fei, D.; Cheng, Q.; Mao, X.; Liu, F.; Zhou, Q. Land use zoning using a coupled gridding-self-organizing feature maps method: A Case Study in China. J. Clean. Prod. 2017, in press. [Google Scholar] [CrossRef]
- Rosa, M.D.; Knudsen, M.T.; Hermansen, J.E. A comparison of Land Use Change models: Challenges and future developments. J. Clean. Prod. 2016, 113, 183–193. [Google Scholar] [CrossRef]
- Wrbka, T.; Erb, K.H.; Schulz, N.B.; Peterseil, J.; Hahn, C.; Haberl, H. Linking pattern and process in cultural landscape. An empirical study based on spatially explicit indicators. Land Use Policy 2004, 21, 289–306. [Google Scholar] [CrossRef]
- Godschalk, D. Land use planning challenges: Coping with conflicts in sustainable development and livability community visions. J. Am. Plan. Assoc. 2004, 70, 5–13. [Google Scholar] [CrossRef]
- Huub, S. Challenges for Crop Production Research in Improving Land Use, Productivity and Sustainability. Sustainability 2013, 5, 1632–1644. [Google Scholar]
- Leung, H. Land Use Planning Made Plain; Ronald P. Frye & Company: Toronto, ON, Canada, 1999. [Google Scholar]
- Xia, C.; Yan, J. Indicator System of Implementation Evaluation for Land Use Planning. China Land Sci. 2006, 02, 19–23, (In Chinese with English Abstract). [Google Scholar]
- Alonso, A.; Monzón, A.; Wang, Y. Modelling Land Use and Transport Policies to Measure Their Contribution to Urban Challenges: The Case of Madrid. Sustainability 2017, 9, 378. [Google Scholar] [CrossRef]
- Han, H.; Yang, C.; Song, J. Scenario Simulation and the Prediction of Land Use and Land Cover Change in Beijing, China. Sustainability 2015, 7, 4260–4279. [Google Scholar] [CrossRef]
- Karyn, M. Producing regional production multipliers for Irish marine sector policy: A location quotient approach. Ocean Coast. Manag. 2014, 91, 58–64. [Google Scholar]
- Stephen, B.B.; Erik, B.J. The location quotient as an estimator of industrial concentration. Reg. Sci. Urban Econ. 2012, 42, 642–647. [Google Scholar]
- Xu, K.; Kong, C.; Li, J.; Zhang, L.; Wu, C. Suitability evaluation of urban construction land based on geo-environmental factors of Hangzhou, China. Comput. Geosci. 2011, 37, 992–1002. [Google Scholar] [CrossRef]
- Tang, X.; Pan, Y.; Liu, Y. Analysis and demonstration of investment implementation model and paths for China’s cultivated land consolidation. Appl. Geogr. 2017, 82, 24–34. [Google Scholar] [CrossRef]
- Demetriou, D.; Stillwell, J.; See, L. Land consolidation in Cyprus: Why is an Integrated Planning and Decision Support System required? Land Use Policy 2012, 29, 131–142. [Google Scholar] [CrossRef]
- Long, H.L. Land consolidation: An indispensable way of spatial restructuring in rural China. J. Geogr. Sci. 2014, 24, 211–225. [Google Scholar] [CrossRef]
- Jin, X.; Xu, X.; Xiang, X.; Bai, Q.; Zhou, Y. System-dynamic analysis on socio-economic impacts of land consolidation in China. Habitat Int. 2016, 56, 166–175. [Google Scholar] [CrossRef]
- Jiang, L.; Deng, X.; Seto, K.C. The impact of urban expansion on agricultural land use intensity in China. Land Use Policy 2013, 35, 33–39. [Google Scholar] [CrossRef]
- Zhang, X.; Du, S. A Linear Dirichlet Mixture Model for decomposing scenes: Application to analyzing urban functional zonings. Remote Sens. Environ. 2015, 169, 37–49. [Google Scholar] [CrossRef]
- Hughen, W.K.; Read, D.C. Read Analyzing form-based zoning’s potential to stimulate mixed-use development in different economic environments. Land Use Policy 2017, 61, 1–11. [Google Scholar] [CrossRef]
Figure 1.
Five demarcation steps of FULC.
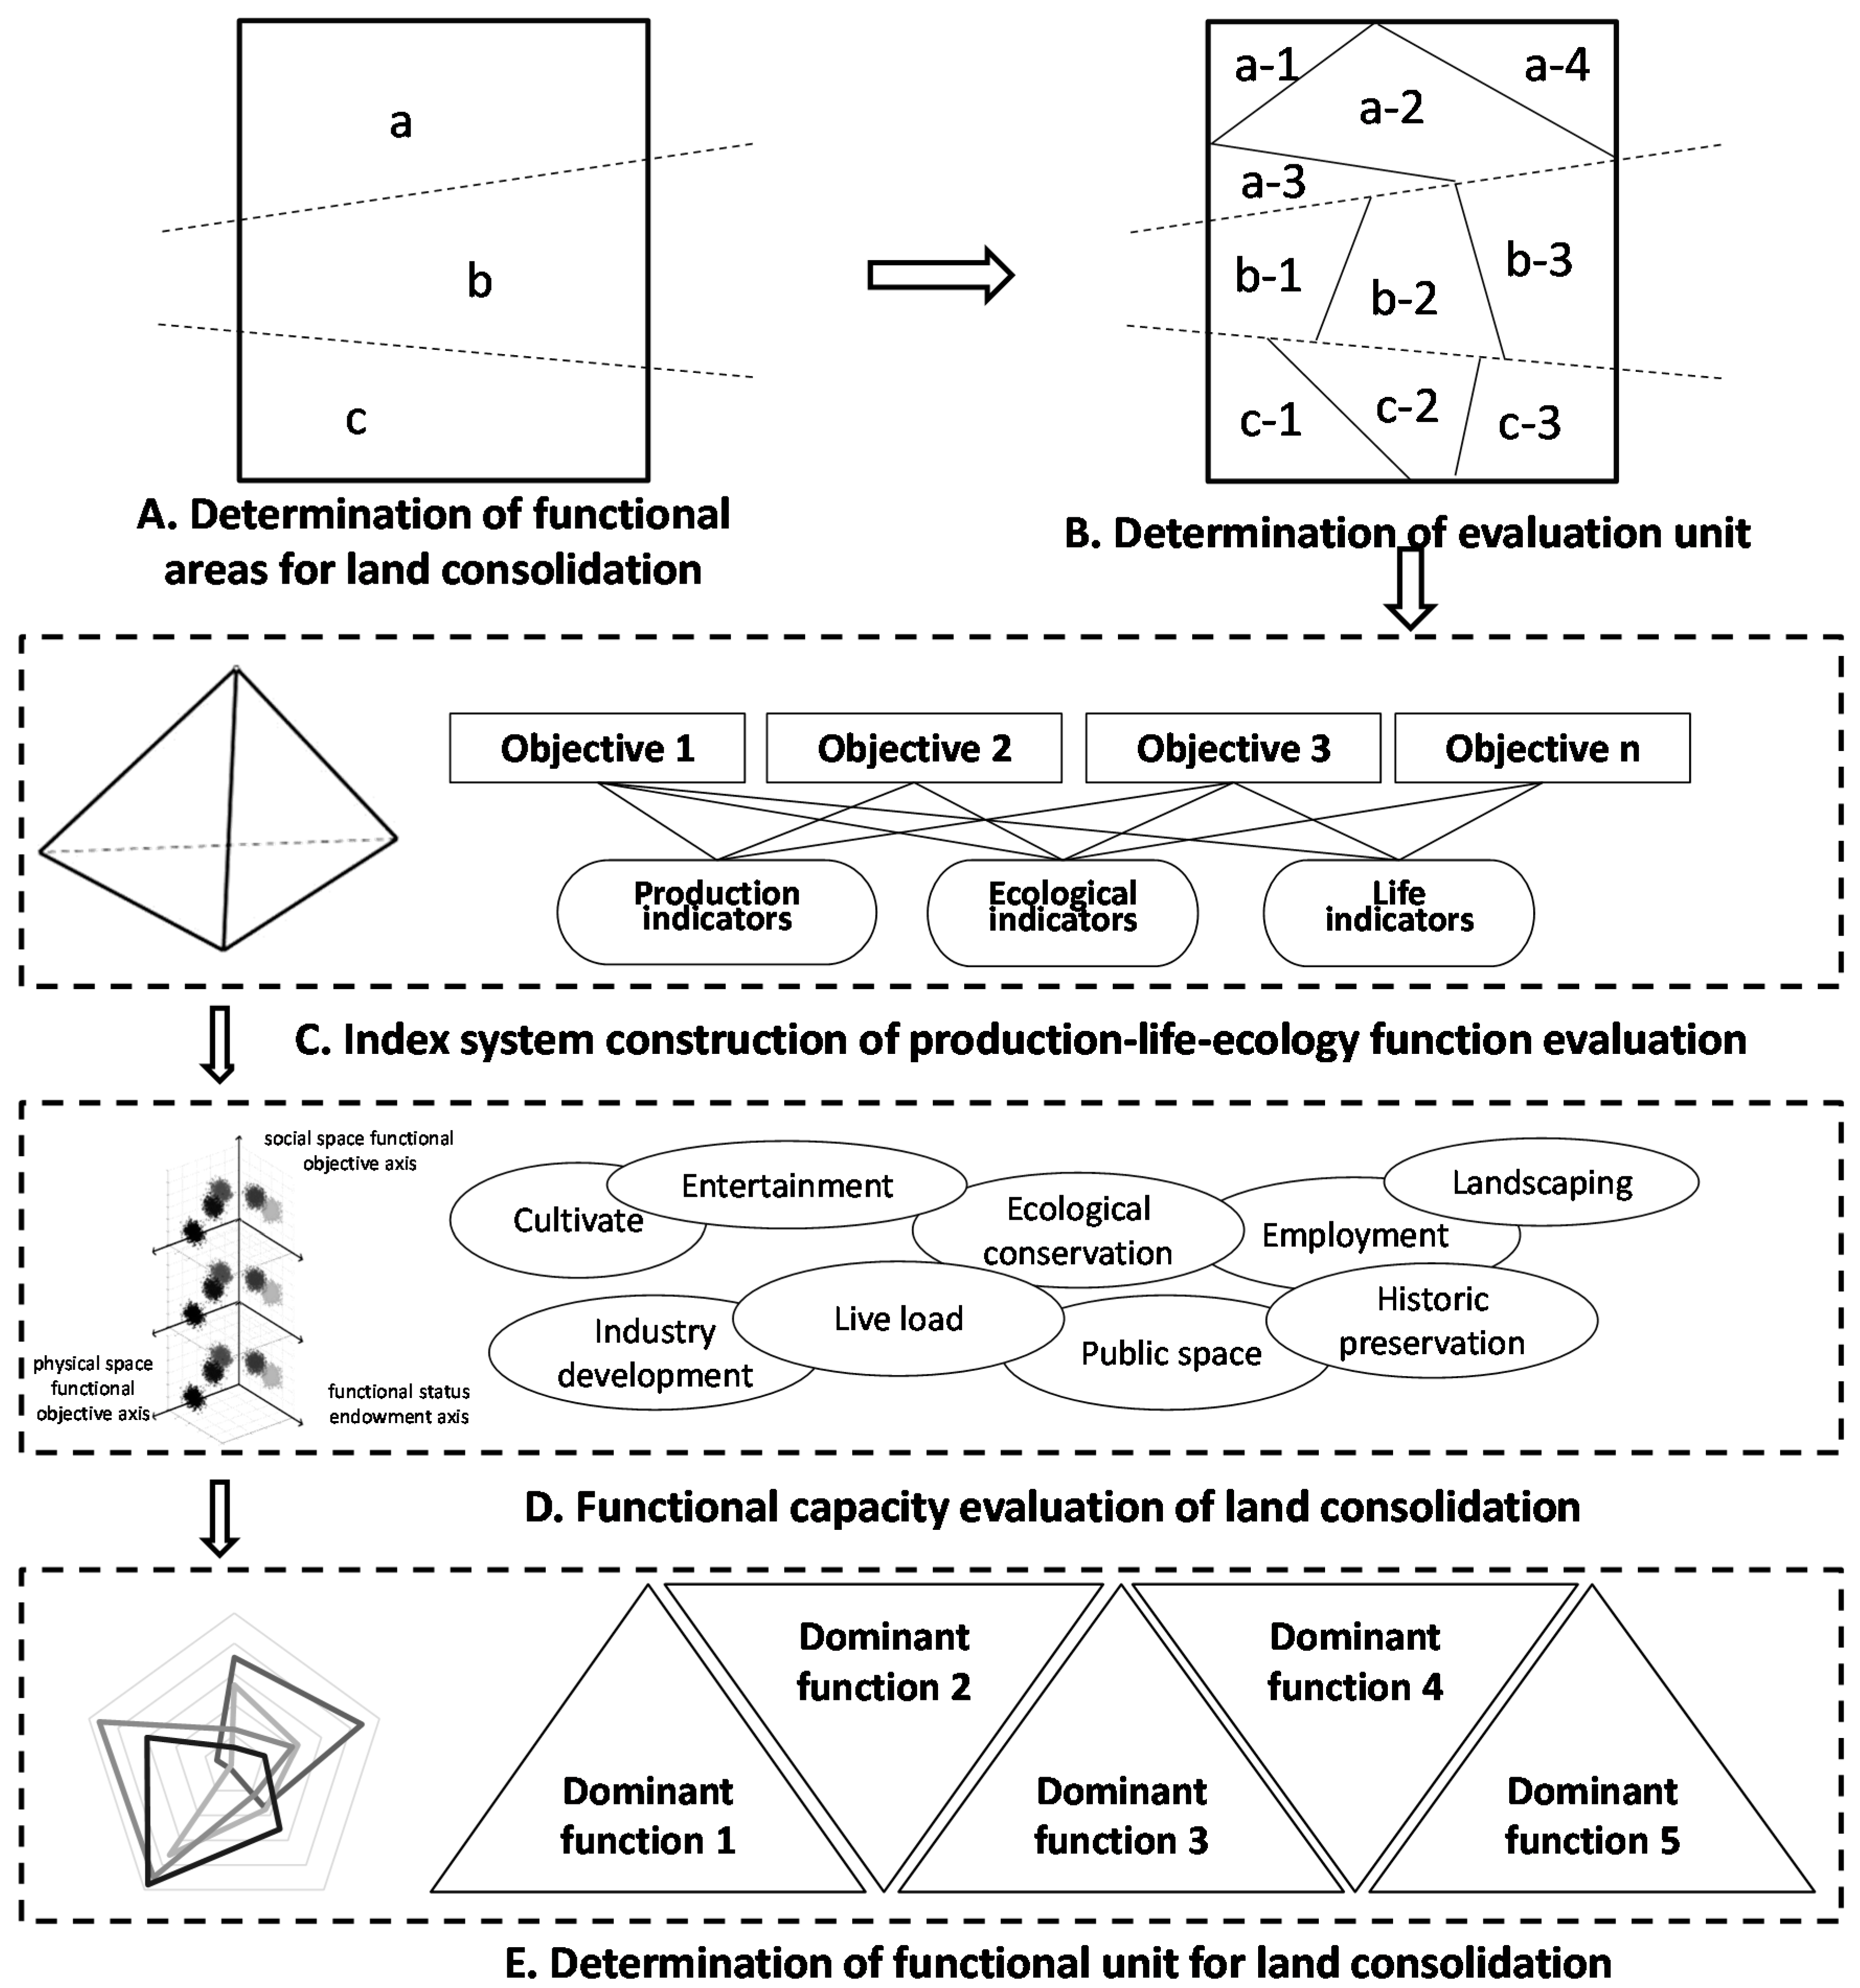
Figure 2.
The production-life-ecology triangular pyramid for sustainable development.
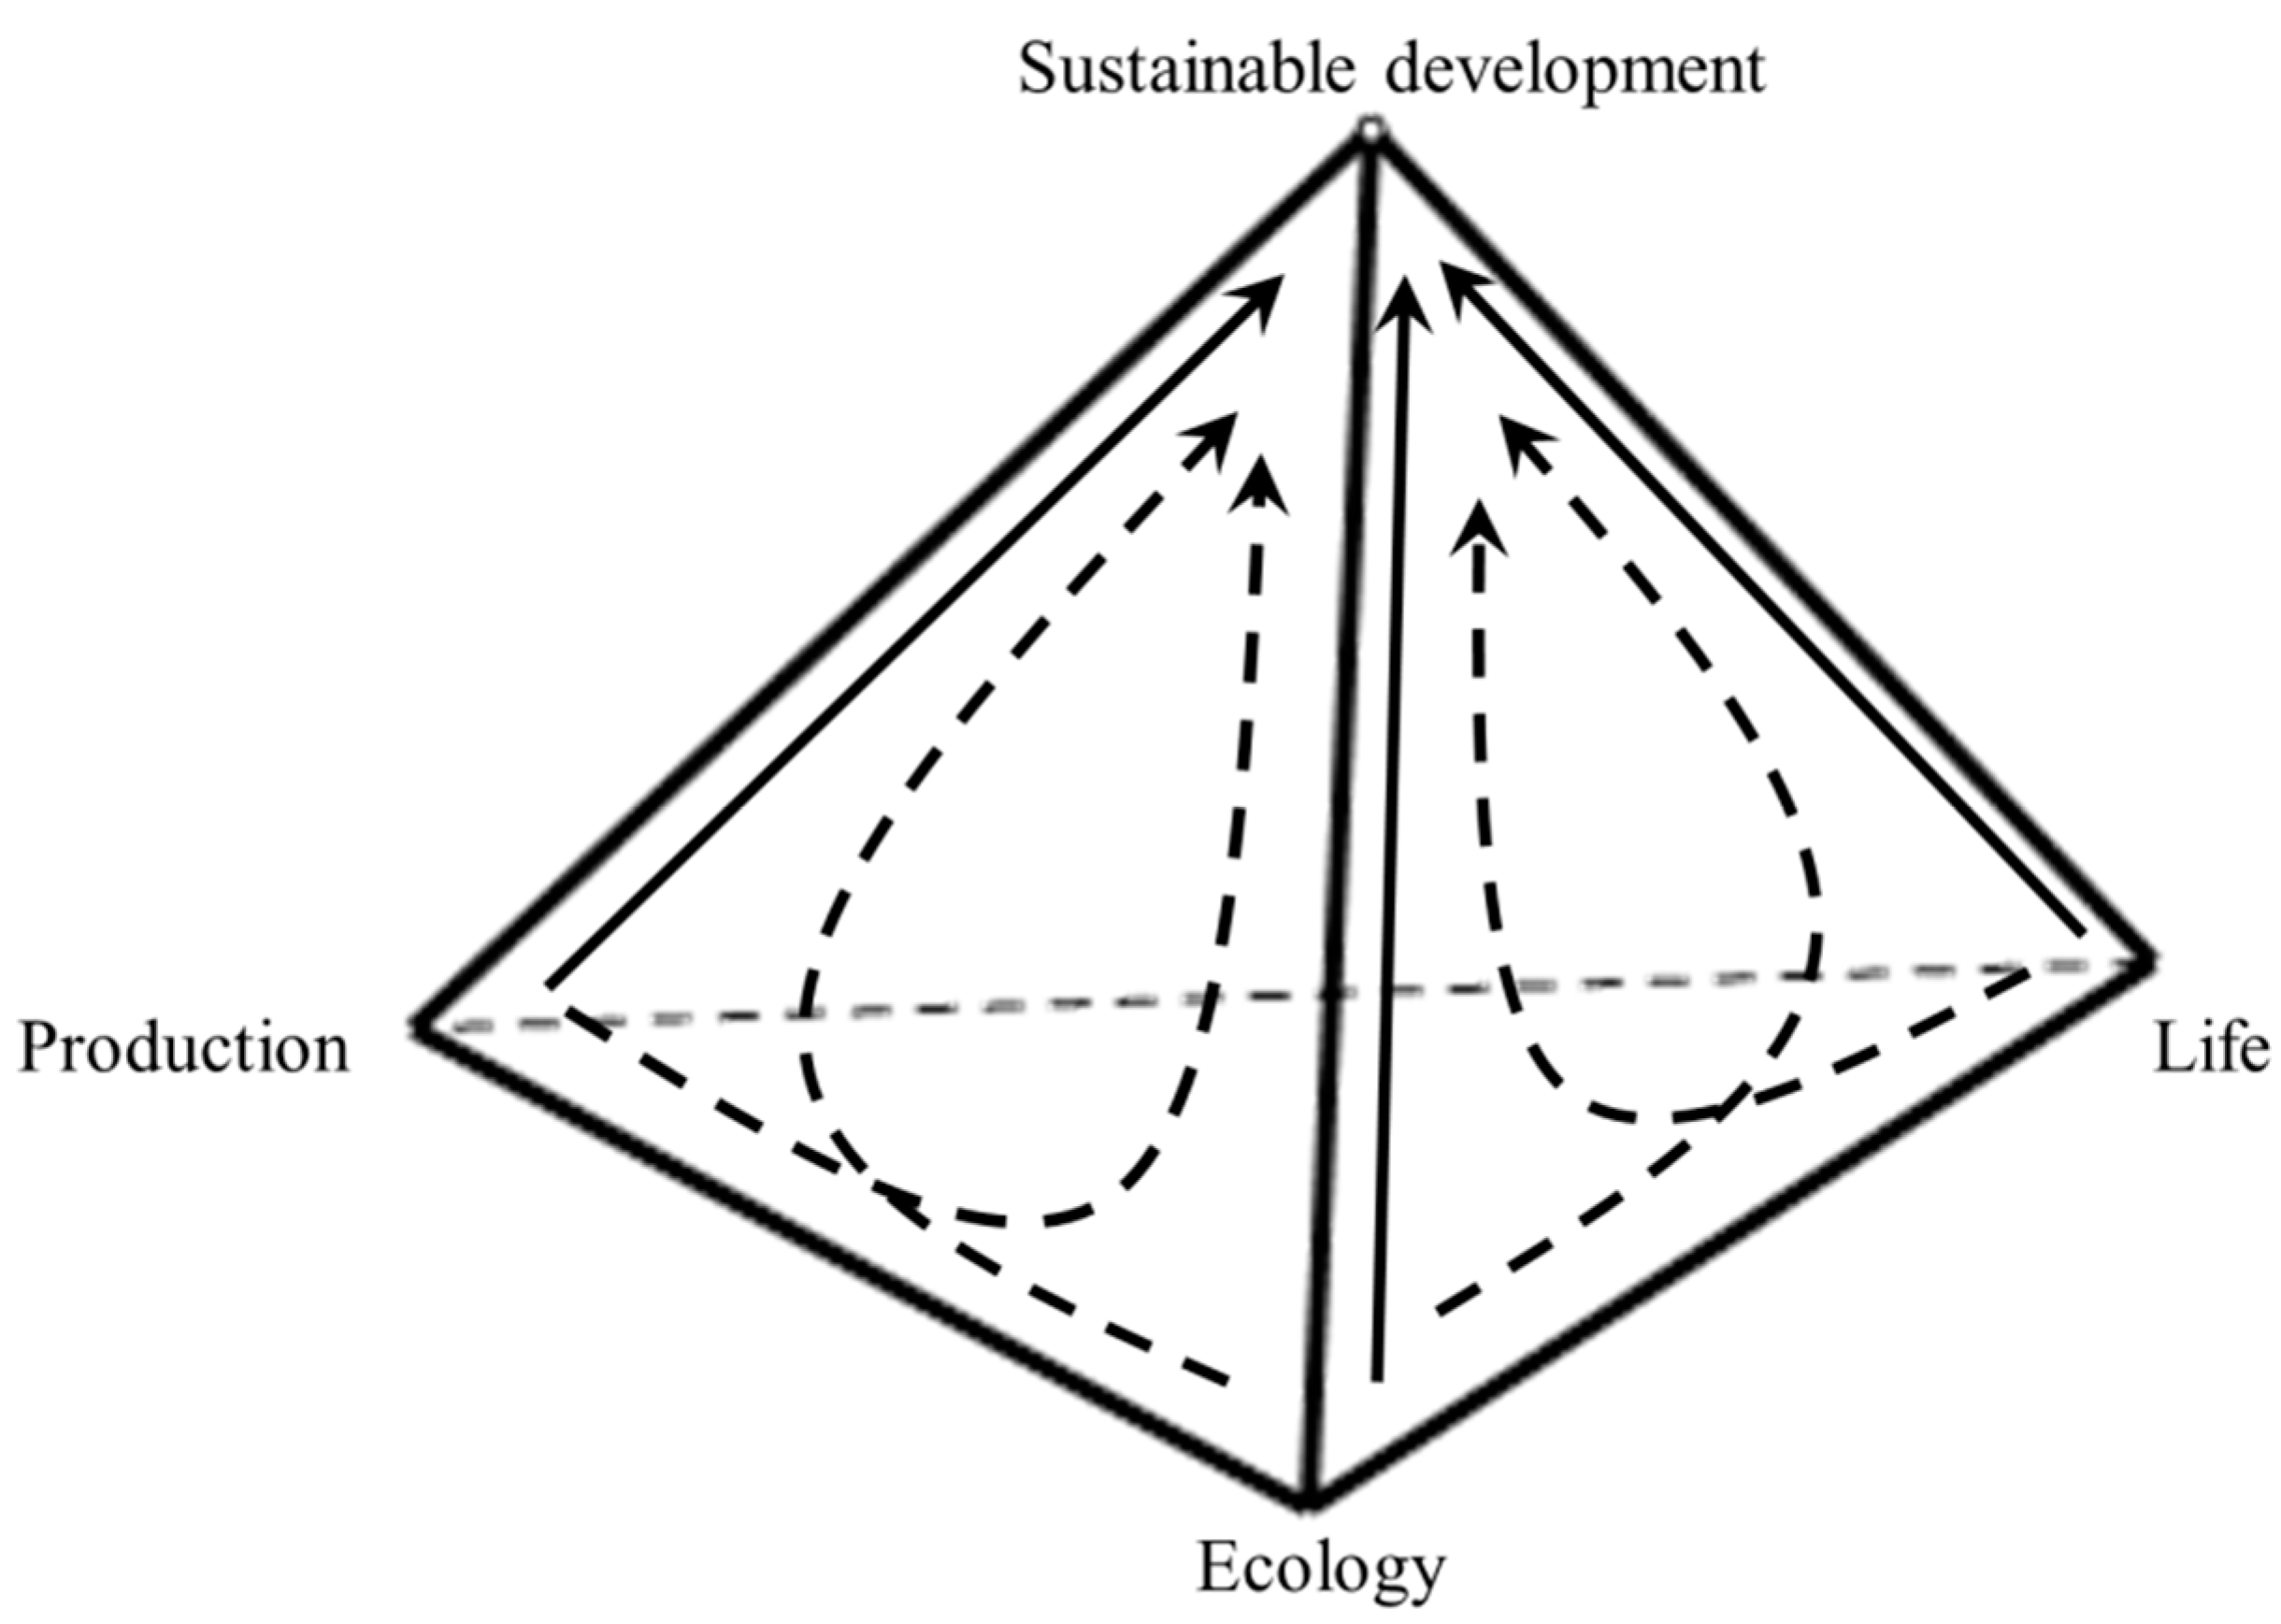
Figure 3.
Rose diagram for FLC (five categories).
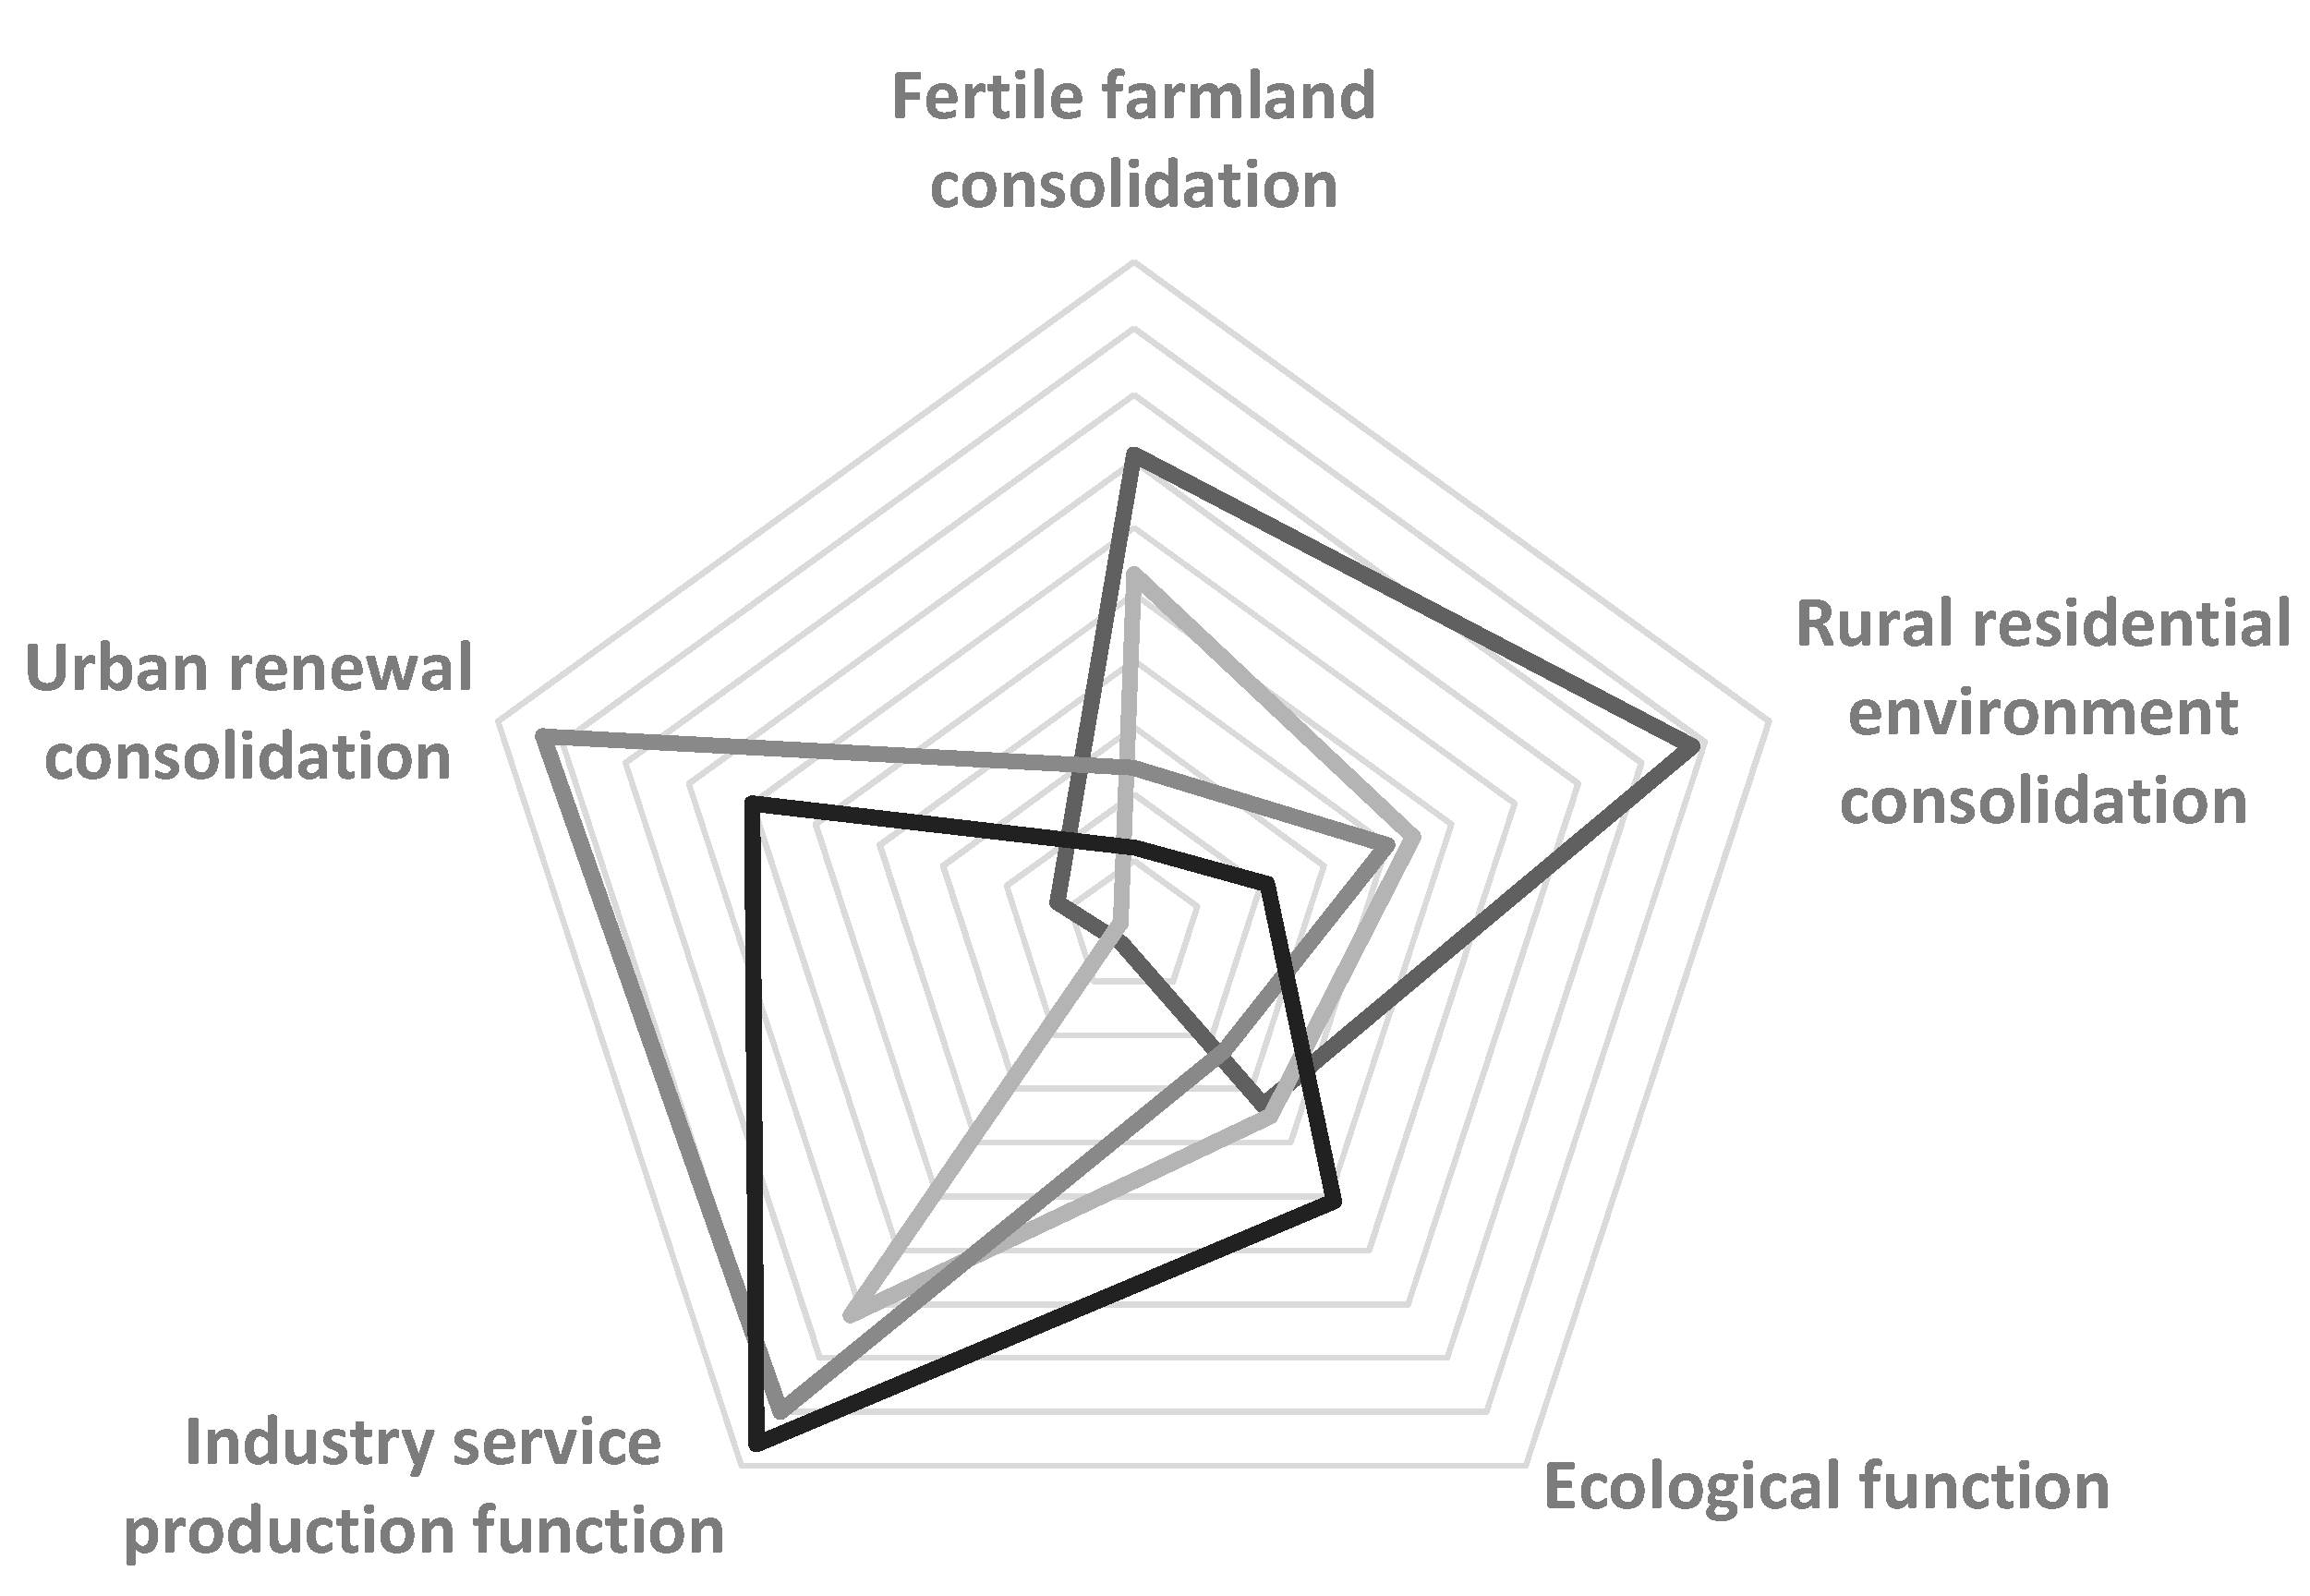
Figure 4.
Location of the study area, Haidian District, Beijing.

Figure 5.
Three functional areas for land consolidation in Haidian District.
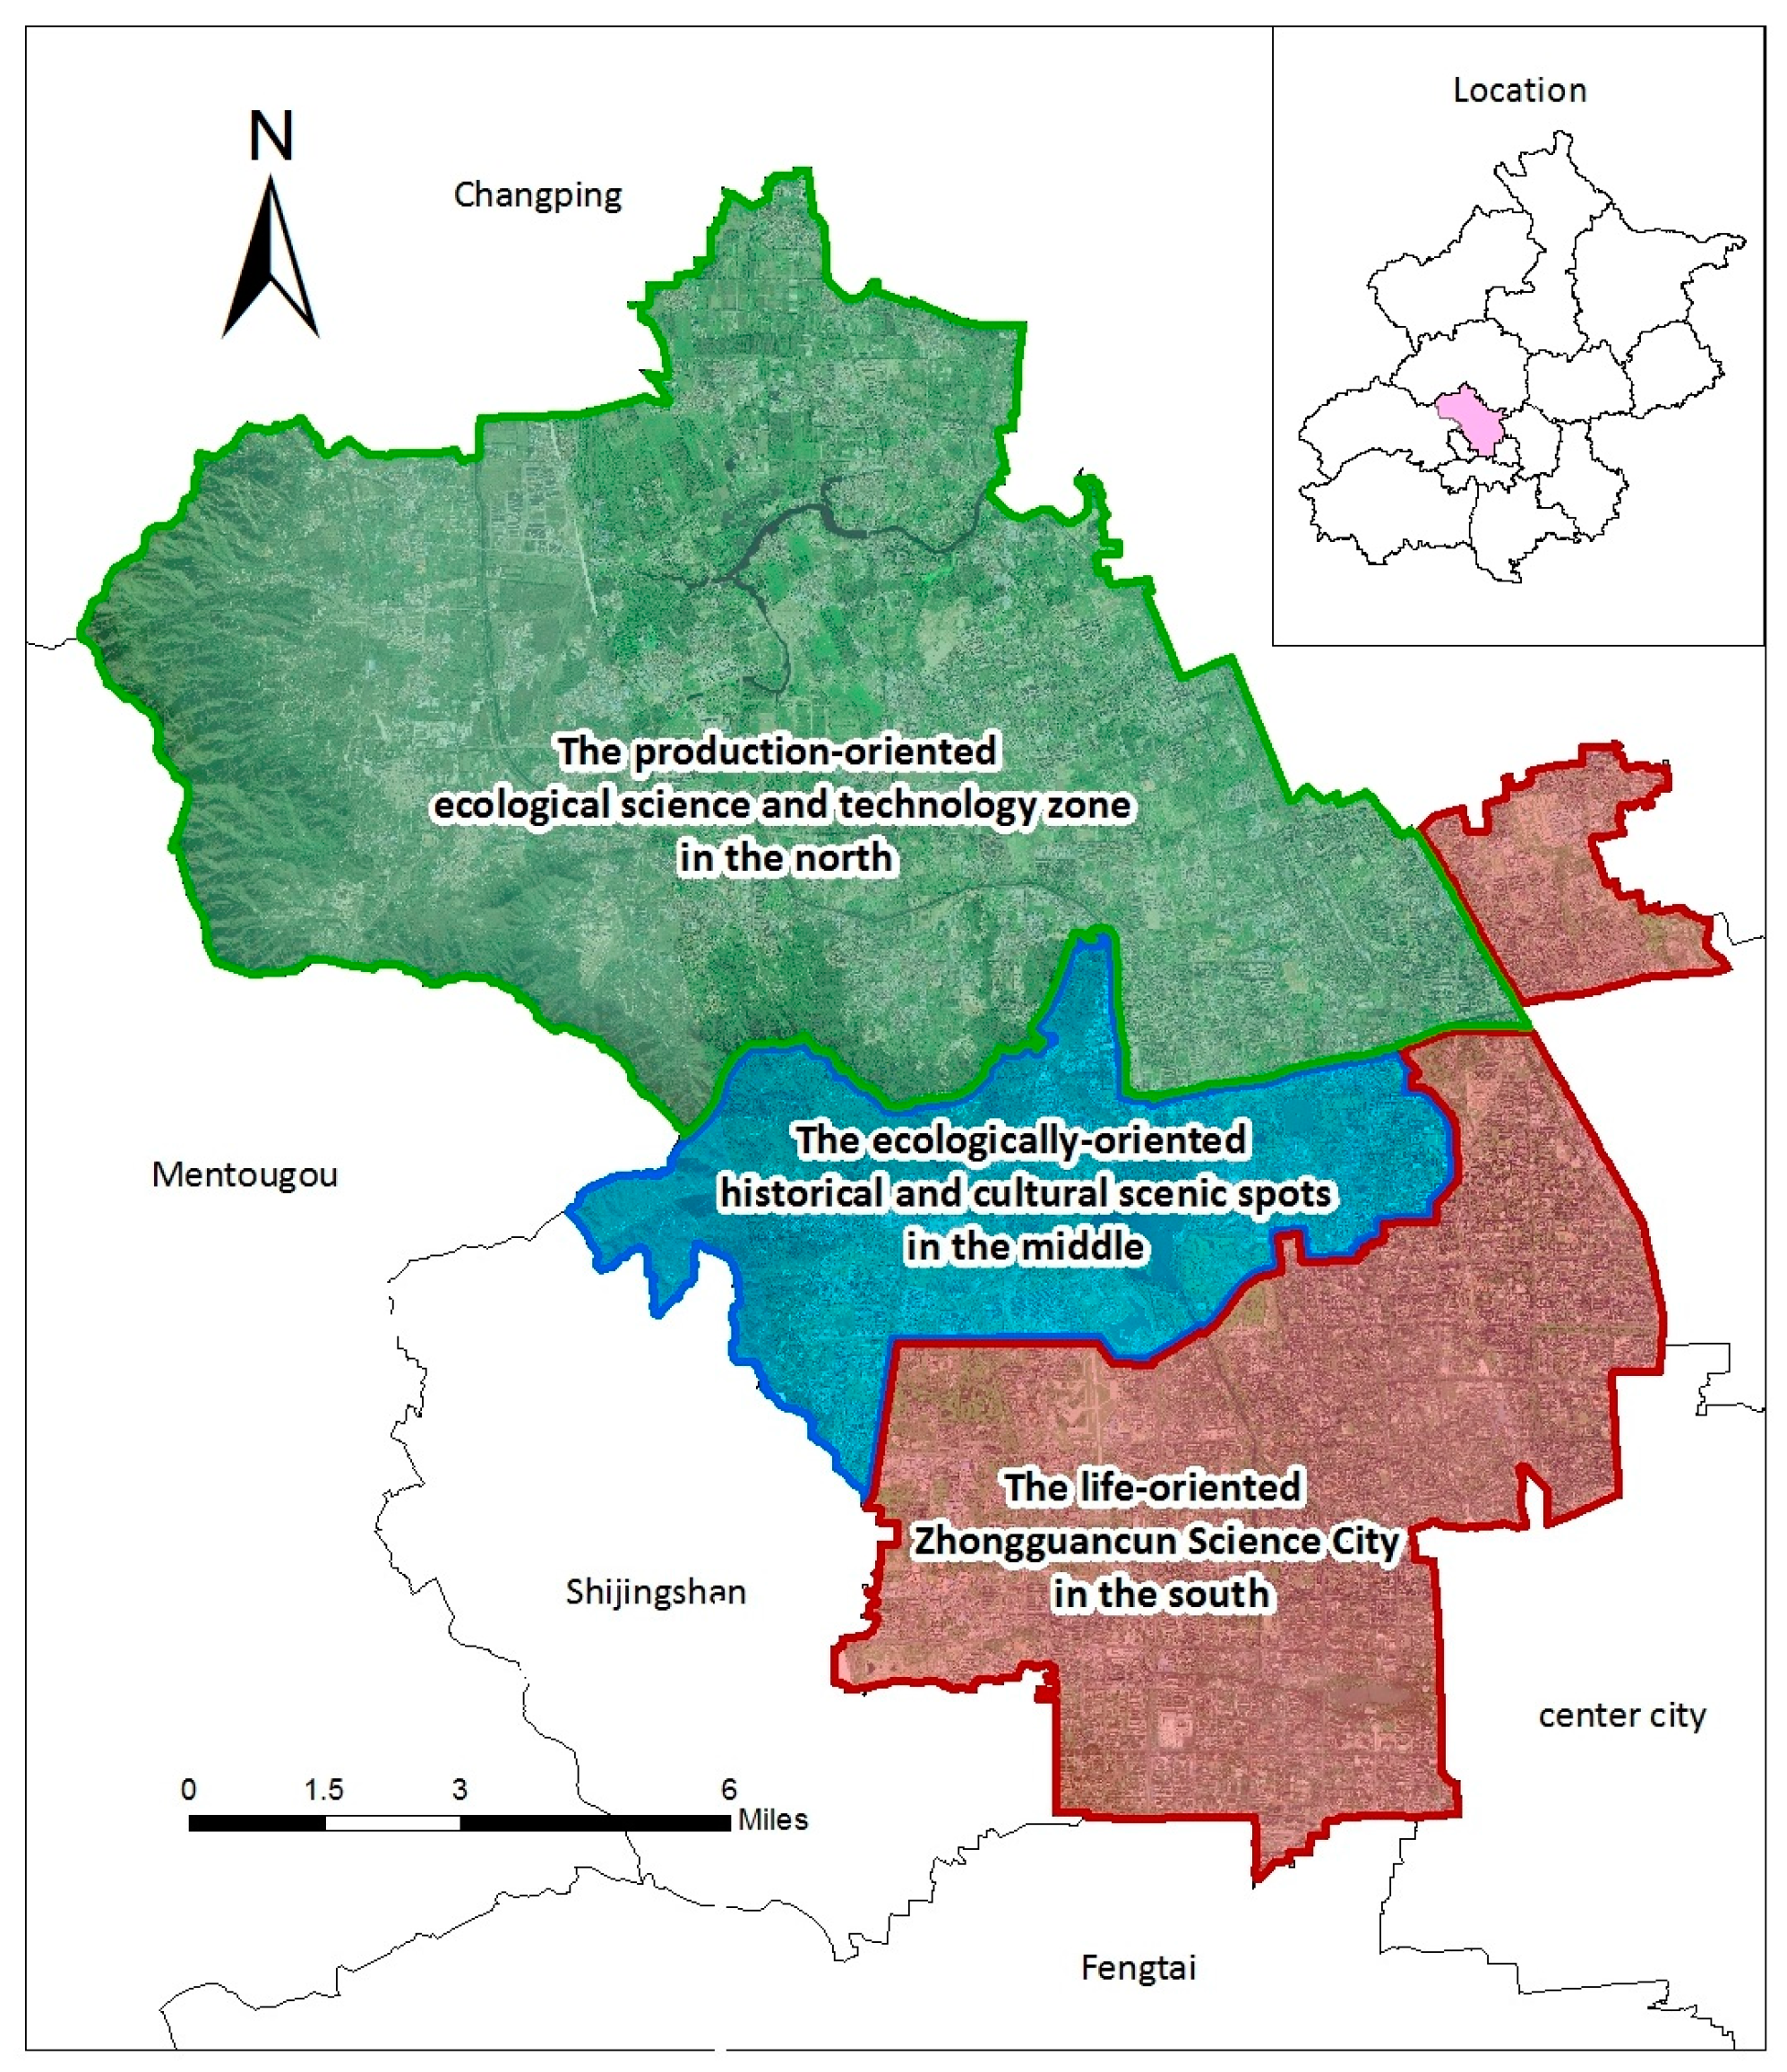
Figure 6.
Schematic of the evaluation units.

Figure 7.
Spatial variation and disparity of production-life-ecology change for 93 evaluation units. (a) Spatial variation of production-life-ecology change for 93 evaluation units (status quo); (b) Spatial variation of production-life-ecology change for 93 evaluation units (planning); (c) Production-life-ecology disparity between status quo and planning.


Figure 8.
Result of demarcation of FULCs in Haidian District.

Table 1.
Indicator system for the production-life-ecology triangular pyramid.
| Production Indicators | Ecological Indicators | Life Indicators |
|---|---|---|
| Profit per 10,000 output value | Area of vegetation restoration | Per capita living space of urban residents |
| Area per 10,000 output value | Ecological land scale | Per capita living space of rural residents |
| Energy consumption per 10,000 output value | Forest coverage | Average life expectancy |
| Expected benefit of low efficiency land redevelopment | Compliance level of water quality | National income per capita |
| GDP | Air quality standards | Proportion of communities from schools near 500 m |
| Per capita GDP | Sound quality standards | Improvement rate of city management system |
| Gross industrial output value | PM2.5 | Percentage of R&D investment for GDP |
| Gross agricultural output value | Soil quality standards | Proportion of scientific researchers per 10,000 persons |
| Total output value of tertiary industry | Improvement level of landscape function | Public satisfaction with planning |
| Ratio of output values among primary, secondary, and tertiary industries | Water resources per capita | Percentage of educational funds for GDP |
| Input-output rate of land use | Green area per capita | Road area per capita |
| Land economic density (net output value) | Treatment rate of land pollution | Housing price-to-income ratio |
| Land net income | Soil erosion degree | Green rate in built-up area |
| Investment effect coefficient of land use | Reuse rate of industrial wastewater | Unemployment rate |
| Payback period of land use | Investment in environmental population treatment per area | Coordination between architecture and environment |
| Proportion of low-yielding land | Percentage of environmental protection investment to GDP | Completeness of infrastructure |
| Land intensive use degree | Number of historical relics | Proportion of urbanized population |
| Land scale management degree | Water use per 10,000 output value | Ratio of per capita income in urban and rural areas |
Table 2.
Correspondence relationship between land use classification and land function.
| Class 1 Land | Class 2 Land | Class 3 Land | Refinement of Dominant Function | Functional Types |
|---|---|---|---|---|
| Agricultural land | Cultivated land | Cultivated land | Grain production | Production |
| Eco landscape | Ecology | |||
| sightseeing and experience of agriculture | Life | |||
| Garden plot | Garden plot | High-tech agricultural function | Production | |
| Eco landscape | Ecology | |||
| Forest land | Forest land | Eco landscape | Ecology | |
| Agricultural production | Production | |||
| Grassland | Grassland | Eco landscape | Ecology | |
| Other agricultural lands | Land for agricultural facilities | Agricultural production | Production | |
| Rural land | Residential supporting function | Life | ||
| Water level of pond | Agricultural production | Production | ||
| Water conservancy land and ridge of farmland | Agricultural production | Production | ||
| Land use for building | Rural–urban construction land | City | Residential, infrastructure, and other functions | Life |
| Parkland | Ecology | |||
| Organic town | Residential, infrastructure, and other functions | Life | ||
| Rural settlements | Residential function | Life | ||
| Other independent construction land | Industrial production | Production | ||
| Traffic and water conservancy land | Land use for railway, highway, and airport | Material flow connecting channel | Production | |
| Land use for pipeline transportation | Transportation | Production | ||
| Land use for water level of reservoir and hydraulic construction | Water supply or eco landscape | Ecology | ||
| Others | Land use for famous scenic site | Humanity and eco landscape | Ecology | |
| Special land use | Military, funeral, and other functions | Ecology | ||
| Others | Water land | Water land | Eco landscape | Ecology |
| Nature reserve | Nature reserve | Eco landscape | Ecology |
Table 3.
Descriptive statistics of 93 evaluation units
| Statistic | North (ha) | Middle (ha) | South (ha) | Total (ha) |
|---|---|---|---|---|
| Maximum | 1268.69 | 2069.24 | 3952.52 | 3952.52 |
| Minimum | 4.04 | 197.29 | 178.55 | 4.04 |
| Standard deviation | 274.77 | 905.64 | 817.98 | 515.69 |
| Average | 332.71 | 997.38 | 851.24 | 463.23 |
| Total | 23,622.70 | 4986.90 | 14,471.01 | 43,080.61 |
Table 4.
Results of weight calculation in function evaluation of land consolidation.
| Target Layer | Index Layer | Unit | Weight of Functional Area | ||
|---|---|---|---|---|---|
| N | M | S | |||
| Economic indicators () | Land occupation per 10,000 output value | hm2 (−) | (0.30, 0.21) | (0.20, 0.21) | (0.35, 0.21) |
| Land intensive utilization | % (−) | (0.30, 0.164) | (0.20, 0.164) | (0.35, 0.164) | |
| GDP | Hundred million yuan (+) | (0.30, 0.246) | (0.20, 0.246) | (0.35, 0.246) | |
| Total output value of the third industry | Hundred million yuan (+) | (0.30, 0.205) | (0.20, 0.205) | (0.35, 0.205) | |
| Output ratio of the third industry to the second industry | % (+) | (0.30, 0.175) | (0.20, 0.175) | (0.35, 0.175) | |
| Ecological indicators | Proportion of the ecological land scale | % (+) | (0.35, 0.21) | (0.50, 0.21) | (0.25, 0.21) |
| Number of historical relics | Pc (+) | (0.35, 0.154) | (0.50, 0.154) | (0.25, 0.154) | |
| Water resources per capita | m³ (+) | (0.35, 0.174) | (0.50, 0.174) | (0.25, 0.174) | |
| Green area per capita | m2 (+) | (0.35, 0.188) | (0.50, 0.188) | (0.25, 0.188) | |
| Ratio of environmental protection investment to GDP | % (+) | (0.35, 0.135) | (0.50, 0.135) | (0.25, 0.135) | |
| Improvement of landscape function | % (+) | (0.35, 0.139) | (0.50, 0.139) | (0.25, 0.139) | |
| Livable indicators | Ratio of green land in built-in area | % (+) | (0.35, 0.169) | (0.30, 0.169) | (0.40, 0.169) |
| Percentage of communities with schools within 500 m | % (+) | (0.35, 0.190) | (0.30, 0.190) | (0.40, 0.190) | |
| House price–income ratio | % (+) | (0.35, 0.177) | (0.30, 0.177) | (0.40, 0.177) | |
| Land use ratio of scientific research institutes | % (+) | (0.35, 0.168) | (0.30, 0.168) | (0.40, 0.168) | |
| Proportion of urbanized population | % (+) | (0.35, 0.173) | (0.30, 0.173) | (0.40, 0.173) | |
| Road area per capita | m2 (+) | (0.35, 0.123) | (0.30, 0.123) | (0.40, 0.123) | |
© 2017 by the authors. Licensee MDPI, Basel, Switzerland. This article is an open access article distributed under the terms and conditions of the Creative Commons Attribution (CC BY) license (http://creativecommons.org/licenses/by/4.0/).
Share and Cite
MDPI and ACS Style
Yan, J.; Shen, Y.; Xia, F. Differentiated Optimization of Sustainable Land Use in Metropolitan Areas: A Demarcation of Functional Units for Land Consolidation. Sustainability 2017, 9, 1356. https://doi.org/10.3390/su9081356
AMA Style
Yan J, Shen Y, Xia F. Differentiated Optimization of Sustainable Land Use in Metropolitan Areas: A Demarcation of Functional Units for Land Consolidation. Sustainability. 2017; 9(8):1356. https://doi.org/10.3390/su9081356
Chicago/Turabian StyleYan, Jinming, Yue Shen, and Fangzhou Xia. 2017. "Differentiated Optimization of Sustainable Land Use in Metropolitan Areas: A Demarcation of Functional Units for Land Consolidation" Sustainability 9, no. 8: 1356. https://doi.org/10.3390/su9081356
Note that from the first issue of 2016, this journal uses article numbers instead of page numbers. See further details here.