Directive 2014/95/EU: Are Italian Companies Already Compliant?


Department of Economic Sciences, University of the Salento, Lecce 73100, Italy
*
Author to whom correspondence should be addressed.
Sustainability 2017, 9(8), 1385; https://doi.org/10.3390/su9081385
Submission received: 10 July 2017
/
Revised: 24 July 2017
/
Accepted: 3 August 2017
/
Published: 5 August 2017
Abstract
:According to Directive 2014/95/EU on disclosure of non-financial information from 2017 onwards, large companies (exceeding 500 employees) headquartered in Member States will be required to provide a series of social, environmental, and governance statements. The Directive was transposed into Italian law by Legislative Decree 254 of 30 December 2016.The aim of this paper is to evaluate the information gap for Italian companies and, consequently, the adjustments required by the new Directive on non-financial information. In order to analyze the level of non-financial and diversity disclosure, we created an assessment model called “Non-financial information score”, which records the required information as a percentage. We apply it to a sample of 223 large companies. The results (with an average NFI score of about 49%) show that, in spite of what has previously emerged in the European debate about the application of the Directive on the part of large companies, an information gap remains, although the implementation of the directive should help to fill it in the coming years. In this sense, the potential contribution of the EU directive to non-financial disclosure in Italy appears to be greater than we had expected. Thus, in accordance with the literature, this paper appears to confirm the role of regulation in improving the quality of disclosure of non-financial information.
1. Introduction
European legislation regarding the disclosure of “non-financial and diversity information” [1,2,3,4] by large companies was adopted by the Italian Legislature on 30 December 2016 by means of Legislative Decree 254, which entered into force on 25 January 2017 (to be applied starting from the fiscal year 2017).
It should be noted that, in a break with normal practice in Italy, this decree adopted a Community norm in a not entirely faithful way, introducing modifications and additions. Specifically, these include differentiation of the degree of detail required in reporting depending on the type of entity, a mechanism for imposing sanctions on non-compliant entities, and a voluntary certification scheme for those entities that are not covered by the decree but seek to enhance their reputation.
Regarding the scope of the information to be disclosed, it should be noted that points 1 and 2 of Article 1 of this Directive amend Articles 19 and 20 of Directive 2013/34/EU on financial statements and consolidated financial statements, respectively. Specifically, point 1 adds a new Article (19a), which governs the content of non-financial statements, while point 2 adds a requirement to provide information about the undertaking’s diversity policy.
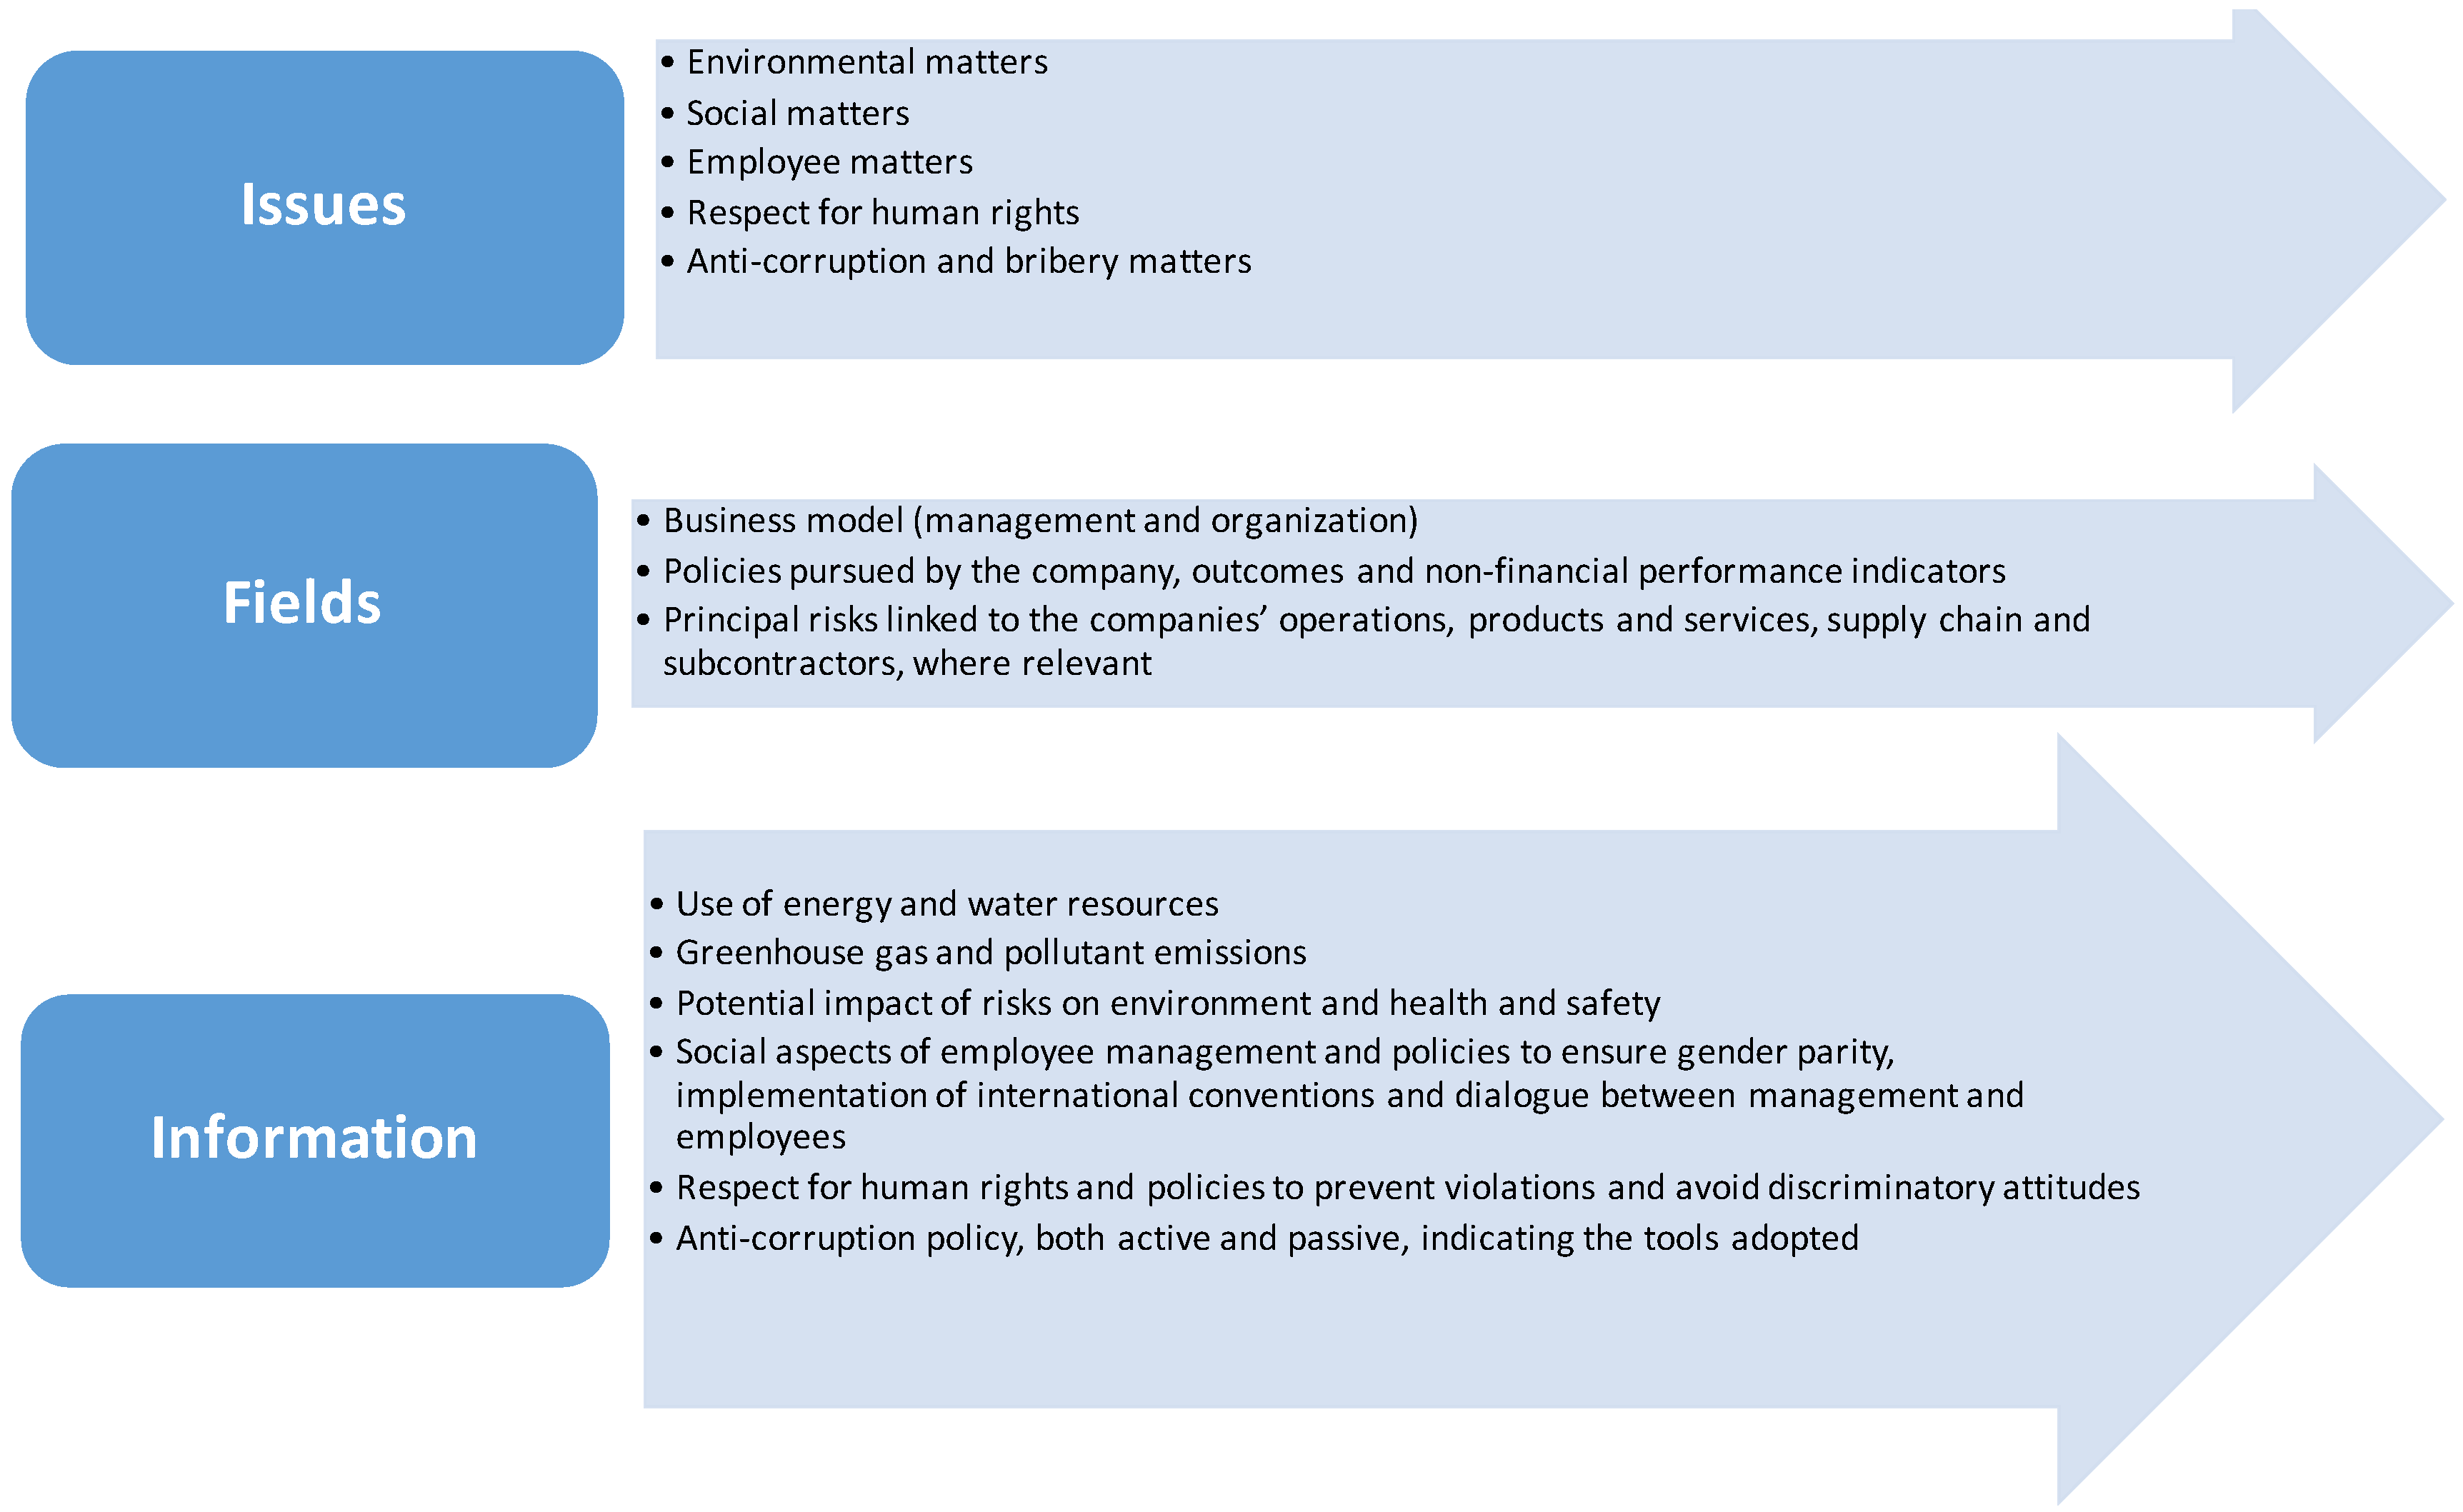
According to Directive 2014/95/EU, the non-financial information (NFI) to be included is essentially “information to the extent necessary for an understanding of the undertaking’s development, performance, position and impact of its activity, relating to, as a minimum, environmental, social and employee matters, respect for human rights, anti-corruption and bribery matters, including:
- (a)
- a brief description of the undertaking's business model;
- (b)
- a description of the policies pursued by the undertaking in relation to those matters, including due diligence processes implemented;
- (c)
- the outcome of those policies;
- (d)
- the principal risks related to those matters linked to the undertaking's operations including, where relevant and proportionate, its business relationships, products or services which are likely to cause adverse impacts in those areas, and how the undertaking manages those risks;
- (e)
- non-financial key performance indicators relevant to the particular business”.
Concerning diversity information, the Directive prescribes “...a description of the diversity policy applied in relation to the undertaking's administrative, management and supervisory bodies with regard to aspects such as, for instance, age, gender, or educational and professional backgrounds, the objectives of that diversity policy, how it has been implemented and the results in the reporting period. If no such policy is applied, the statement shall contain an explanation as to why this is the case”.
This clarification serves to understand the logical path followed by the Italian legislature when drawing up Article 3 of Legislative Decree No. 254/16, where, apart from the explicit reference to the type of information to be disclosed, there are some very clear indications of the principle of relevance or significance (According to Article 3 of the Decree, subparagraph 1: “To the extent necessary to ensure the understanding of the business activity, its performance, its outcomes and impact, the individual non-financial statement must cover the issues ... considered relevant to the specific business”), the well-known Community principle of “comply or explain (According to Article 3 of the Decree, subparagraph 6: “Where the undertaking does not pursue policies in relation to one or more of those matters, the non-financial statement shall provide a reasoned explanation for not doing so”)”, and the principle of comparability (According to Article 3 of the Decree, subparagraph 3: “The information referred to in subsection 1 and 2 must be accompanied by a comparison to the information provided in previous years”).
The information to be disclosed, as explained in Figure 1, is broken down by topic, scope, and type. Regardless of the reporting standards adopted, paragraph 2 of Article 3 establishes the minimum content of the non-financial disclosure.
The choice of reporting standards to be adopted reflects the performance indicators used to monitor and evaluate the activities, which must be:
- specified by the reporting standard chosen,
- representative of the different fields,
- consistent with the activity being carried out and the impacts generated by it.
If the company chooses to adopt an independent reporting methodology or if the indicators provided by the standard adopted are not suitable or appropriate to represent the activities and impacts of the enterprise, it shall identify them appropriately, specifying clearly the reasons behind the choice.
In this context, this study focuses on assessing the quality of non-financial information disclosure in companies obliged to follow this decree.
In order to evaluate the state of the art of non-financial information disclosure by large Italian companies, we provide a score, based on specific items concerning the requirements of the decree.
2. Literature Review
Over the years, the literature on non-financial disclosure has focused on the possibility of attributing a mandatory and/or voluntary character to these reporting processes. Moreover, the impact of this character on the quality of disclosure has been investigated.
The need to provide good quality non-financial information is important in order to overcome the main criticisms that have been directed at NFI, such as stakeholders’ lack of trust in the information disclosed. This lack of trust arises first of all from the tendency of managers to disclose activities in progress and their claimed results [5,6], as well as the phenomenon of greenwashing. The latter, defined as the gap between the results obtained and the results presented [7], in reference to environmental policies in particular, appears to be able to alter market conditions and consumer preferences as a result of the opportunistic behavior displayed by companies [8]. In this regard, it is therefore possible to assess the effectiveness of the information disclosed with reference to the quality of information [9].
Regarding the issue of “mandatory vs. voluntary”, it should be pointed out that most of the definitions of “Corporate Social Responsibility” (CSR) proposed by institutions and the literature are clearly based on a voluntary approach [10,11]. The assumption of voluntariness is also found throughout the analysis of the global spread of sustainability reporting over the years. This spread has occurred in the partial or total absence of regulatory provisions.
Several studies show that the development of CSR on a voluntary basis has been encouraged over time due to managers’ recognition of its strategic value. Specifically, this recognition has arisen from the growing attention paid by managers to new topics considered useful for the development of corporate reputation, such as stakeholder engagement processes [12,13,14].
This issue takes on even greater importance for listed companies in that, as evidenced by Wang [15], the quality of the NFI is positively correlated with the equity value of the company. The analysis conducted by Godfrey et al. [16] of the importance of NFI in regulated markets shows that the adoption of CSR practices by listed companies contributes positively to the growth of shareholder value. The consolidation of shareholder value is considered a fundamental goal by listed companies, since they need trust from investors both to receive capital and to contain the effects of any financially adverse events [17]. The effect on investors of CSR practices arises from the intrinsic characteristics of CSR, which, by adopting a proactive approach to non-financial issues, generates confidence among investors [18].
Concerning compulsory adoption, the idea that only regulation could improve the quality and comparability of non-financial information disclosure was initially widely accepted in the literature [19]. In this respect, according to a segment of the literature, regulation is preferable to voluntary disclosure, as the latter may lack completeness, accuracy, neutrality, objectivity, and comparability [20,21]. It is in this context that some European countries (Spain, France, Portugal, Finland, Sweden, and Denmark) have, over the years, introduced the obligation for companies to report on environmental and social issues.
Some cross-country studies have shown that in countries with regulation, such as France, disclosure is of higher quality than countries without regulation, such as the United States of America [22].
Further studies show that mandatory reporting, resulting from the imposition of specific rules by Member States, would result in the short-term standardization of practice because of its coercive nature [23]. As a consequence, there would be an increase in the number of reports produced, as well as best practices and benchmarking [24,25]. However, the quantitative increase would not be accompanied by a qualitative increase since the use of a standardized framework would penalize the use of company- and sector-specific indicators and information [26].
Indeed, other empirical studies show that regulation is not always associated with improvement in the quality of non-financial information [27,28,29], or at least that regulation alone cannot guarantee a better level of non-financial disclosure [30,31,2]. The study by Ioannou and Serafeim [32] of the Chinese and South African contexts produced controversial results.
As with regulation, the scientific debate has not led to a consensus regarding the voluntary adoption of non-financial disclosure. In order to overcome the criticisms of voluntary NFI disclosure, several studies have sought to identify the main aspects useful for measuring its degree of effectiveness. Studies have also responded by identifying solutions that can counteract the criticisms. Specifically, the literature cites the adoption of sustainability reports [33], guidelines [34], and third-party assurance [35].
Over time, the evolution of the concept of corporate social responsibility has fostered the emergence and subsequent spread of reporting models in which financial data is supplemented by other types of information to varying degrees [36,37]. The purpose of these reports is to explain to stakeholders the qualitative and quantitative aspects of specific sustainability practices implemented during the year by management [38,39]. The newer models have abandoned the classical approach, which separates financial information from non-financial aspects, in favor of integrated models (such as Integrated Reports) that contain both types of information in order to provide stakeholders with summary data on the various aspects of business performance [40].
Over time, the increasing attention paid by shareholders to non-financial KPIs has generated a need to make business performance measurable and comparable through the use of common standards [41]. An analysis of the literature also shows that, similar to studies of the application of international accounting standards, harmonization of non-financial reporting has a high strategic value as part of investors’ decision-making processes [42,43]. In this regard, over the years, paradigms aimed at bringing such practices into the mainstream have been developed, including the standard Global Reporting Initiative (GRI). This standard has recently been modified in order to incorporate key aspects related to the various facets of sustainability and to make its coverage more complete [44]. The current version (GRI G-4) includes anti-corruption policies and gender policies and places great emphasis on materiality.
The issue of gender policies can be analyzed both internally, by introducing diversity policies, and externally, by analyzing relationships with communities [45,46,47]. As regards the internal aspect, the literature shows how the implementation of these practices is one of the most effective moves in terms of value creation thanks to the positive correlation between board heterogeneity and results [48,49].
Lastly, the literature emphasizes assurance procedures in sustainability reporting in order to grant credibility to non-financial disclosure. Indeed, it shows that assurance of sustainability reporting is comparable, in terms of its effects on stakeholders, to the financial statements certification process [50,51]. According to Bagnoli et al. [52], by means of the assurance process, managers determine ex ante their level of social responsibility, entrusting the assurer with the certification of the actual level achieved. Via these activities, managers aim to eliminate negative perceptions, for example arising from greenwashing, thus reinforcing the confidence and loyalty of shareholders [44,53].
3. The Sample
The analysis was carried out on a sample of 223 large companies considered entities of public interest in accordance with Article 16 subparagraph 1 of Legislative decree 39/10, including listed companies, banks, and insurance companies with more than 500 employees. Specifically, there are 168 listed companies (source: www.borsaitaliana.it), 41 banks (source: bankscope) and 14 insurance companies (source: www.ania.it).
Our analysis is based on non-financial information disclosed in consolidated or individual financial statements on 31.12.2015 (the Decree stipulates that public-interest entities have to disclose non-financial information in an individual statement (or a consolidated statement in the case of a group)), or, where present, in social, sustainability, and integrated reports available on websites. The analysis did not consider other information on sustainability present on specific sections of company websites. For comparison, Table 1 presents the sample divided into national and multinational companies and by business sector as follows: basic materials, consumer goods, consumer services, financial, health care, industrial, oil and gas, and telecommunications.
The sampling distribution is not uniform in terms of national and multinational companies. Eighty-two percent of national companies in our sample have fewer than 10,000 employees, and about 76% have fewer than 5000, whereas multinational companies tend to be much larger. However, we decided to include multinational companies in our sample in order to better understand the effect on disclosure quality in companies belonging to different social and cultural contexts.
4. The Methodology Used: The Non-Financial Information Score
The present study focuses on the non-financial information disclosed in the mandatory and voluntary reports of the companies in the sample. The quality of NFI disclosure is assessed by means of content analysis, an established method used to analyze disclosure quality. However, the content analysis was performed manually, without the use of specific software, because of the need to interpret certain aspects of non-financial information. Indeed, the analysis was essentially of a qualitative nature, based on the interpretation of information presented in the reports. We decided not to use common content analysis tools since the information to be evaluated is highly heterogeneous and, as such, is not always present in the standard sections of the analyzed reports. In contrast, we performed an integral reading of the documents, with subsequent interpretation of the information present.
In order to analyze the level of non-financial and diversity disclosure, we created an assessment tool, called a “Non-financial score”, which records fulfilment of the specific requirements set out in the guidelines of the CNDEC (the Italian National Institute of Accountants), published in June 2016, as a percentage. To this aim, five different assessment grids were developed for the following categories (or dimensions) of information:
- −
- business model
- −
- sustainability policies
- −
- sustainability risks
- −
- KPIs (key performance indicators)
- −
- diversity.
Each grid specifies the content required by Legislative Decree 254/16. For each grid, a compliance percentage is calculated by evaluating the presence of specific items.
The Table 2, Table 3, Table 4, Table 5 and Table 6 below detail the content of the information grids used to determine each company's score.
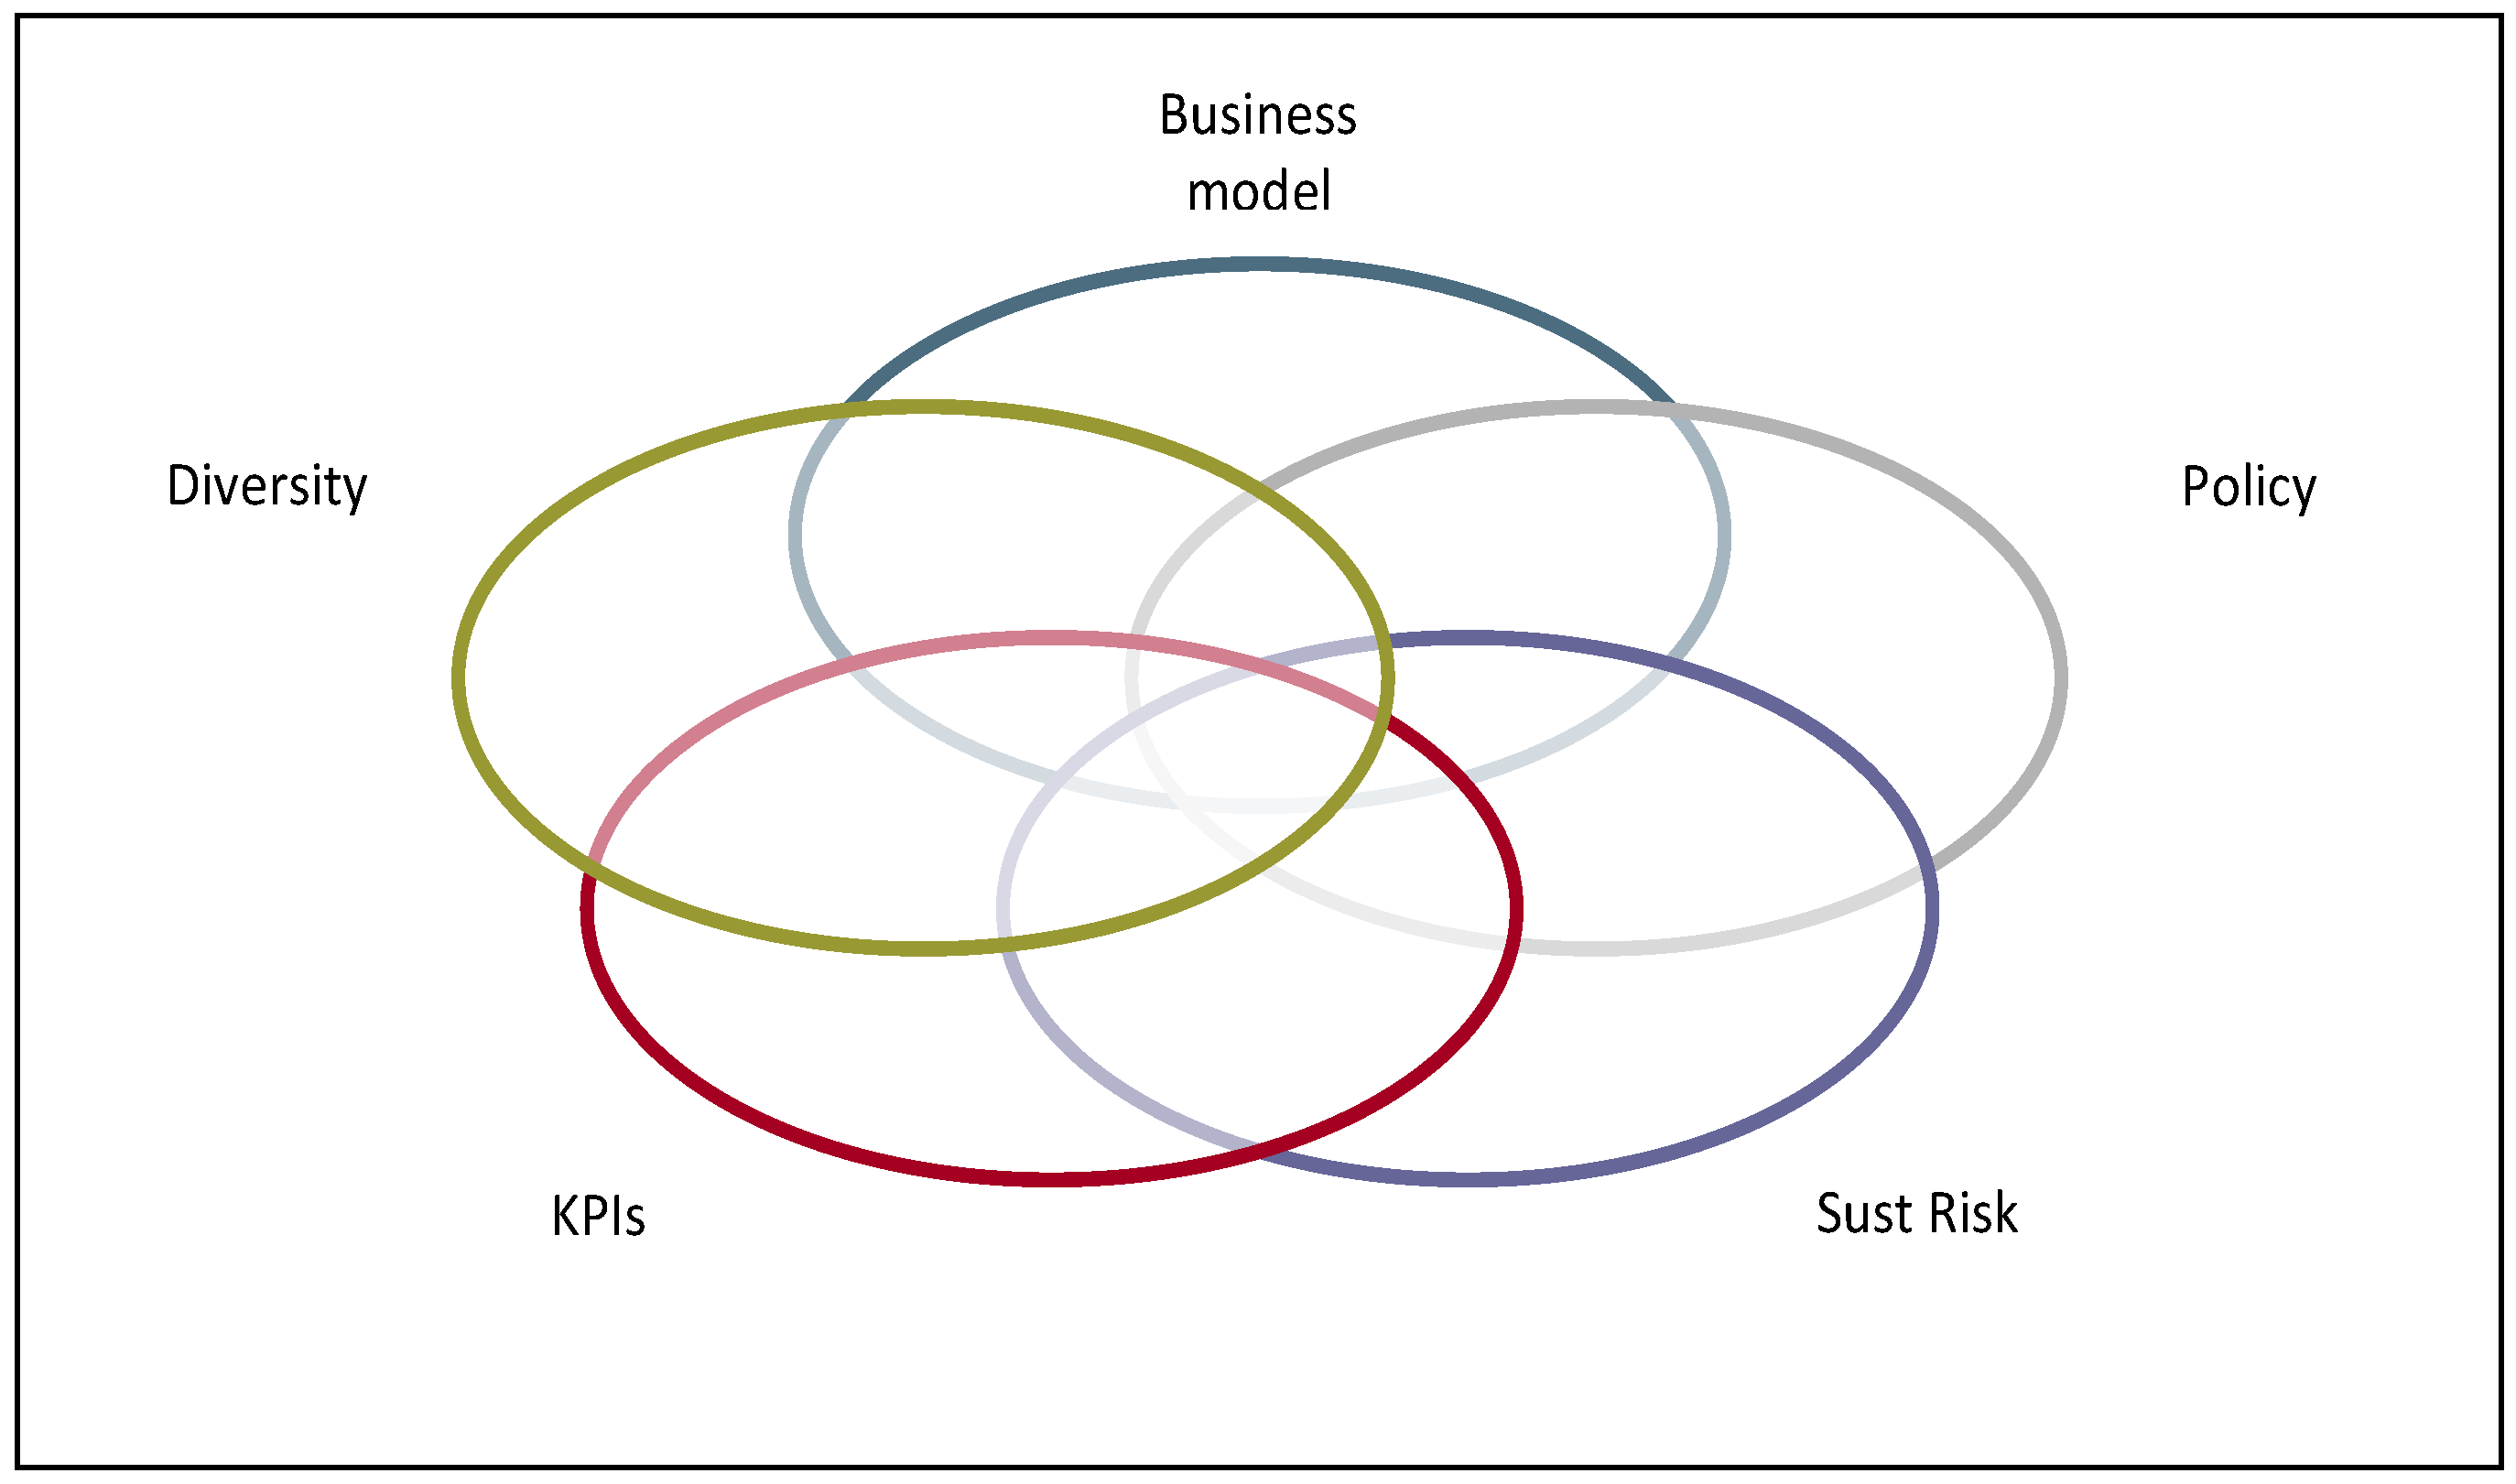
The disclosure level was verified for each section and points were assigned to reflect the degree of completeness of disclosure found in the related reports. A rating scale from 0 to 2 (where 0 indicates the absence of disclosure, 1 indicates incomplete disclosure, and 2 indicates full disclosure) was used to assign a specific score to each section and generate an overall completeness rating for the non-financial disclosure in each of the three types of report (annual report, sustainability report, and integrated report). The overall rating was calculated as a percentage by dividing the point score for each specific disclosure section by the maximum possible score for the section. This generated an overall compliance level based on five different dimensions of measurement (Figure 2).
The compliance level calculated for each dimension of disclosure (business model, policy, sustainability risks, KPIs, and diversity) is an aggregation of the scores assigned to each specific disclosure section listed above and is expressed as a percentage.
5. Results
In Appendix A we present the compliance levels of the Italian companies analyzed. Specifically, we present the NFI score, which is the result of compliance in the areas of business model, policy, sustainability risks, key performance indicators, and diversity.
The results show (Table 7) an average NFI score of about 49%. The highest scores were achieved with regard to the business model; this result confirms a market orientation towards the shareholder and rarely towards other stakeholders (as required by the IIRC framework).
The poor quality of information in the field of diversity is due to the reluctance of company management to engage with diversity, especially compared to other countries [54].
Similarly, the negative results for performance indicators are due to the lack, in most companies in the sample, of a sustainability control system.
The breakdown of disclosure compliance by sectors (financial vs. non-financial), by kinds of disclosure (mandatory vs. voluntary) and by the presence/absence of independent assurance is also interesting.
The data in Table 8 show a better score in the financial sector, where the diversity, risk, and KPI values are higher than those for the sample as a whole. The result is not surprising given the greater “risk culture” in banking companies and the greater confidence in financial risk assessment compared to non-financial risk.
Table 11 highlights the higher degree of disclosure compliance in multinational companies than in national ones for all variables. This result seems to confirm the responsible approach of multinational companies to sustainability issues, probably because these companies are more likely to consider the effects of these aspects on their reputation.
The Student’s t-test performed on the comparison of means shows significant differences for the data in Table 8 regarding the business model and diversity variables, for Table 9 regarding all variables except the business model and NFI score, for Table 10 regarding all variables except the business model and policy, and for Table 11 regarding all variables.
We analyzed the correlations between the five disclosure dimensions, NFI score and four independent variables: type of report (mandatory/voluntary), number of employees, assurance/non-assurance of non-financial information, and relative experience in sustainability reporting. The analysis shows a statistically significant positive correlation between all the independent variables except assurance and all five disclosure dimensions in addition to the NFI score itself.
The quality of voluntary information disclosure is much higher than the mandatory, while the quality of assured reporting is higher than non-assured. This is because companies that have not embraced the theme of sustainability reporting are at a disadvantage.
In the light of these results, six different regression analyses were performed (Table 12), where the NFI score and the percentage data for the five disclosure dimensions (dependent variables) were correlated with the following independent variables:
- mandatory or voluntary reporting
- number of employees
- presence of independent assurance
- experience of ESG reporting.
In all regressions, the very low value of the first parameter of significance (attributed to the regression model) confirms the statistical significance of the results and is supported by the high R2 values (adjusted), which specify the ability of a regression model to explain the variance of the results. Specifically, the results show that the significance of the voluntary reporting variable can be found in all six models, while the assurance variable affects all models except for sustainability risks. The data on experience seem to have no direct relation to the level of information: this result is not aligned with what is shown in Table 13. Lastly, the importance of business size (number of employees) is in line with the literature [55,56,57,58], according to which large companies have a higher quality of non-financial information disclosure than smaller ones.
6. Conclusions
This research represents a preliminary critical analysis of the impact of the EU Directive in Italy. European debate has highlighted the limited utility of the directive if applied only to large companies [59], which are already considered sensitive to the issue of non-financial information. However, the results of this study show that there is still an important information gap to fill even among large entities, with the exception of multinational companies. From this perspective, the potential contribution of the EU directive to non-financial disclosure in Italy appears to be greater than we had expected.
This allows us to assume, in contrast to part of the literature, that regulation could improve the quality of information disclosure by large companies, which at this time stands at unsatisfactory levels.
The Public Interest Entities’ pathway towards ESG reporting needs action in the field of governance, specifically policy, risk assessment, and diversity, and in the field of social and environmental accounting, specifically KPIs. These actions need to be combined with best practices in CSR.
Indeed, the best results in terms of NFI score and all dimensions of this study were achieved by companies already involved in CSR practices, such as assured and voluntary sustainability reports.
Indeed, these approaches to CSR explain the results of multinational companies, whose large size and weight in international markets encourage them to pay more attention to their global reputation deriving from the quality of their non-financial information.
Future studies should on the one hand investigate the evolutionary path of non-financial information from the 2016 to the 2017 reports, when Public Interest Entities will be called upon to adhere strictly to Legislative Decree 254/16, and on the other hand determine the qualitative differences in terms of information disclosure between Italy and other Member States that have adopted Directive 2014/95.
Author Contributions
All authors wrote the paper, but their primary individual contributions are reflected as follows: Section 1 and Section 6 are to be ascribed to Simona Cosma; Section 2 is to be ascribed to Rossella Leopizzi; Section 3 is to be ascribed to Simone Pizzi; Section 4 is to be ascribed to Andrea Venturelli and Section 5 is to be ascribed to Fabio Caputo.
Conflicts of Interest
The authors declare no conflict of interest.
Appendix A.

Table A1.
The non-financial score: composition.
| Firm | Business Model | Policy | Sust. Risks | KPIs | Diversity | NFI Score |
|---|---|---|---|---|---|---|
| 1 | 0.8333 | 0.8571 | 0.8333 | 0.1000 | 0.5000 | 0.6248 |
| 2 | 0.9000 | 0.9286 | 0.6667 | 1.0000 | 0.7778 | 0.8546 |
| 3 | 0.6000 | 0.5714 | 0.6667 | 0.2000 | 0.0000 | 0.4076 |
| 4 | 0.3333 | 0.1429 | 0.0000 | 0.0000 | 0.0000 | 0.0952 |
| 5 | 0.7667 | 0.8571 | 0.6667 | 0.4000 | 0.0000 | 0.5381 |
| 6 | 0.7000 | 0.6429 | 0.6667 | 0.1000 | 0.0000 | 0.4219 |
| 7 | 0.7667 | 0.6429 | 0.8333 | 1.0000 | 0.7778 | 0.8041 |
| 8 | 0.2667 | 0.0000 | 0.3333 | 0.0000 | 0.2222 | 0.1644 |
| 9 | 0.9667 | 0.8571 | 0.7500 | 1.0000 | 0.8333 | 0.8814 |
| 10 | 0.9333 | 0.8571 | 0.7500 | 1.0000 | 0.8333 | 0.8748 |
| 11 | 0.2000 | 0.2857 | 0.0833 | 0.0000 | 0.0000 | 0.1138 |
| 12 | 0.2667 | 0.2857 | 0.0833 | 0.0000 | 0.0000 | 0.1271 |
| 13 | 0.6333 | 0.5000 | 0.6667 | 0.6000 | 0.4444 | 0.5689 |
| 14 | 0.3333 | 0.3571 | 0.3333 | 0.0000 | 0.0000 | 0.2048 |
| 15 | 0.4000 | 0.0714 | 0.0000 | 0.0000 | 0.0000 | 0.0943 |
| 16 | 0.5000 | 0.0714 | 0.1667 | 0.0000 | 0.0000 | 0.1476 |
| 17 | 0.4667 | 0.0714 | 0.0000 | 0.0000 | 0.0000 | 0.1076 |
| 18 | 0.4000 | 0.1429 | 0.0000 | 0.0000 | 0.0000 | 0.1086 |
| 19 | 1.0000 | 0.4286 | 0.6667 | 0.6000 | 0.5556 | 0.6502 |
| 20 | 0.5333 | 0.0714 | 0.0000 | 0.0000 | 0.0000 | 0.1210 |
| 21 | 0.4000 | 0.0000 | 0.6667 | 0.0000 | 0.0000 | 0.2133 |
| 22 | 0.6667 | 0.0000 | 0.0000 | 0.0000 | 0.0000 | 0.1333 |
| 23 | 0.7000 | 0.5714 | 0.6667 | 0.2000 | 0.6667 | 0.5610 |
| 24 | 0.3333 | 0.5714 | 0.3333 | 0.0000 | 0.0000 | 0.2476 |
| 25 | 0.3333 | 0.0714 | 0.3333 | 0.0000 | 0.0000 | 0.1476 |
| 26 | 0.8000 | 0.5714 | 0.6667 | 0.6000 | 0.0000 | 0.5276 |
| 27 | 0.2667 | 0.0714 | 0.0833 | 0.0000 | 0.0000 | 0.0843 |
| 28 | 0.2667 | 0.0714 | 0.0833 | 0.2000 | 0.2222 | 0.1687 |
| 29 | 0.9667 | 0.7143 | 0.6667 | 1.0000 | 0.6667 | 0.8029 |
| 30 | 0.5667 | 0.0000 | 0.0000 | 0.0000 | 0.0000 | 0.1133 |
| 31 | 1.0000 | 0.8571 | 0.7500 | 1.0000 | 0.9444 | 0.9103 |
| 32 | 0.9333 | 0.7143 | 0.7500 | 0.8000 | 0.7778 | 0.7951 |
| 33 | 0.5333 | 0.7143 | 0.4167 | 0.0000 | 0.0000 | 0.3329 |
| 34 | 0.3667 | 0.7143 | 0.4167 | 0.0000 | 0.2222 | 0.3440 |
| 35 | 0.3667 | 0.5714 | 0.5833 | 0.0000 | 0.0000 | 0.3043 |
| 36 | 0.3667 | 0.5714 | 0.5833 | 0.2000 | 0.0000 | 0.3443 |
| 37 | 0.4667 | 0.0000 | 0.0000 | 0.0000 | 0.0000 | 0.0933 |
| 38 | 0.8667 | 0.0000 | 0.4167 | 0.0000 | 0.0000 | 0.2567 |
| 39 | 0.8667 | 0.5714 | 0.4167 | 0.6000 | 0.4444 | 0.5798 |
| 40 | 1.0000 | 0.8571 | 0.7500 | 1.0000 | 0.8889 | 0.8992 |
| 41 | 0.5333 | 0.0714 | 0.0000 | 0.0000 | 0.0000 | 0.1210 |
| 42 | 0.5333 | 0.4286 | 0.2500 | 0.0000 | 0.0000 | 0.2424 |
| 43 | 0.4667 | 0.1429 | 0.0000 | 0.0000 | 0.0000 | 0.1219 |
| 44 | 0.9333 | 0.8571 | 0.6667 | 1.0000 | 1.0000 | 0.8914 |
| 45 | 0.7333 | 0.7143 | 0.6667 | 0.5000 | 1.0000 | 0.7229 |
| 46 | 0.9333 | 0.9286 | 0.6667 | 1.0000 | 1.0000 | 0.9057 |
| 47 | 1.0000 | 1.0000 | 0.8333 | 1.0000 | 0.9444 | 0.9556 |
| 48 | 0.9333 | 0.6429 | 0.6667 | 1.0000 | 0.7778 | 0.8041 |
| 49 | 0.6333 | 0.6429 | 0.5833 | 0.2000 | 0.7778 | 0.5675 |
| 50 | 0.5667 | 0.0000 | 0.0000 | 0.0000 | 0.0000 | 0.1133 |
| 51 | 0.5667 | 0.5714 | 0.6667 | 0.0000 | 0.0000 | 0.3610 |
| 52 | 0.5333 | 0.0000 | 0.0000 | 0.0000 | 0.0000 | 0.1067 |
| 53 | 0.4667 | 0.0000 | 0.0000 | 0.0000 | 0.0000 | 0.0933 |
| 54 | 0.8000 | 0.6429 | 0.6667 | 1.0000 | 0.5556 | 0.7330 |
| 55 | 0.5667 | 0.4286 | 0.0000 | 0.0000 | 0.0000 | 0.1990 |
| 56 | 0.6333 | 1.0000 | 0.6667 | 0.0000 | 0.0000 | 0.4600 |
| 57 | 0.4667 | 0.0000 | 0.0000 | 0.0000 | 0.0000 | 0.0933 |
| 58 | 0.6333 | 0.7143 | 0.1667 | 0.0000 | 0.0000 | 0.3029 |
| 59 | 0.6667 | 0.2857 | 0.1667 | 0.0000 | 0.0000 | 0.2238 |
| 60 | 0.6000 | 0.2143 | 0.0000 | 0.0000 | 0.0000 | 0.1629 |
| 61 | 0.8333 | 0.7143 | 0.6667 | 0.0000 | 0.2222 | 0.4873 |
| 62 | 0.8667 | 0.7143 | 0.6667 | 1.0000 | 0.7778 | 0.8051 |
| 63 | 0.8667 | 0.7143 | 0.6667 | 1.0000 | 0.9444 | 0.8384 |
| 64 | 0.8333 | 0.7143 | 0.6667 | 1.0000 | 0.8889 | 0.8206 |
| 65 | 0.6667 | 0.6429 | 0.5000 | 0.0000 | 0.2222 | 0.4063 |
| 66 | 0.8667 | 0.8571 | 0.6667 | 1.0000 | 0.6111 | 0.8003 |
| 67 | 0.3333 | 0.0714 | 0.0000 | 0.0000 | 0.0000 | 0.0810 |
| 68 | 1.0000 | 0.7857 | 0.6667 | 1.0000 | 0.7778 | 0.8460 |
| 69 | 0.5333 | 0.0000 | 0.0000 | 0.0000 | 0.0000 | 0.1067 |
| 70 | 0.5333 | 0.5714 | 0.0000 | 0.0000 | 0.0000 | 0.2210 |
| 71 | 0.9333 | 0.5714 | 0.6667 | 1.0000 | 1.0000 | 0.8343 |
| 72 | 0.5667 | 0.7143 | 0.3333 | 0.0000 | 0.0000 | 0.3229 |
| 73 | 0.8000 | 0.7143 | 0.5833 | 1.0000 | 0.0000 | 0.6195 |
| 74 | 0.4333 | 0.1429 | 0.0000 | 0.0000 | 0.2222 | 0.1597 |
| 75 | 1.0000 | 0.9286 | 0.7500 | 1.0000 | 1.0000 | 0.9357 |
| 76 | 0.9667 | 0.8571 | 0.6667 | 1.0000 | 0.8333 | 0.8648 |
| 77 | 0.5333 | 0.2143 | 0.0000 | 0.0000 | 0.2222 | 0.1940 |
| 78 | 0.5000 | 0.2143 | 0.0000 | 0.0000 | 0.2222 | 0.1873 |
| 79 | 0.5000 | 0.6429 | 0.3333 | 0.2000 | 0.2222 | 0.3797 |
| 80 | 0.2667 | 0.0714 | 0.0000 | 0.0000 | 0.0000 | 0.0676 |
| 81 | 0.4667 | 0.0714 | 0.0000 | 0.0000 | 0.0000 | 0.1076 |
| 82 | 0.6000 | 0.7143 | 0.6667 | 0.2000 | 0.4444 | 0.5251 |
| 83 | 0.6000 | 0.7857 | 0.6667 | 1.0000 | 1.0000 | 0.8105 |
| 84 | 0.6000 | 0.7143 | 0.6667 | 0.0000 | 0.0000 | 0.3962 |
| 85 | 0.9667 | 0.7143 | 0.6667 | 1.0000 | 0.7778 | 0.8251 |
| 86 | 0.9667 | 0.7143 | 0.6667 | 1.0000 | 0.7222 | 0.8140 |
| 87 | 0.4333 | 0.0000 | 0.0000 | 0.0000 | 0.0000 | 0.0867 |
| 88 | 0.5000 | 0.0000 | 0.0000 | 0.0000 | 0.1667 | 0.1333 |
| 89 | 0.5000 | 0.0000 | 0.0000 | 0.0000 | 0.3889 | 0.1778 |
| 90 | 0.2667 | 0.0000 | 0.0000 | 0.0000 | 0.0000 | 0.0533 |
| 91 | 0.6000 | 0.2143 | 0.5000 | 0.2000 | 0.4444 | 0.3917 |
| 92 | 1.0000 | 1.0000 | 0.6667 | 1.0000 | 0.8889 | 0.9111 |
| 93 | 0.5333 | 0.3571 | 0.3333 | 0.0000 | 0.0000 | 0.2448 |
| 94 | 0.4667 | 0.0000 | 0.0000 | 0.0000 | 0.0000 | 0.0933 |
| 95 | 0.6667 | 0.7143 | 0.6667 | 0.0000 | 0.0000 | 0.4095 |
| 96 | 0.6667 | 0.0000 | 0.0000 | 0.0000 | 0.0000 | 0.1333 |
| 97 | 0.9333 | 0.6429 | 0.6667 | 1.0000 | 0.7778 | 0.8041 |
| 98 | 0.7000 | 0.6429 | 0.0000 | 0.0000 | 0.0000 | 0.2686 |
| 99 | 0.4000 | 0.2857 | 0.0000 | 0.0000 | 0.0000 | 0.1371 |
| 100 | 0.4667 | 0.5714 | 0.6667 | 0.0000 | 0.0000 | 0.3410 |
| 101 | 0.4000 | 0.5714 | 0.6667 | 0.0000 | 0.0000 | 0.3276 |
| 102 | 0.4000 | 0.4286 | 0.0000 | 0.0000 | 0.0000 | 0.1657 |
| 103 | 0.6000 | 0.5714 | 0.4167 | 0.0000 | 0.0000 | 0.3176 |
| 104 | 1.0000 | 0.7143 | 0.6667 | 1.0000 | 0.6667 | 0.8095 |
| 105 | 0.5000 | 0.5714 | 0.3333 | 0.0000 | 0.0000 | 0.2810 |
| 106 | 0.9000 | 0.7143 | 0.6667 | 1.0000 | 0.7778 | 0.8117 |
| 107 | 0.9667 | 0.5714 | 0.6667 | 1.0000 | 0.7778 | 0.7965 |
| 108 | 0.9667 | 0.7143 | 0.6667 | 1.0000 | 0.8889 | 0.8473 |
| 109 | 1.0000 | 0.7143 | 0.6667 | 1.0000 | 0.7778 | 0.8317 |
| 110 | 0.5333 | 0.7143 | 0.3333 | 0.0000 | 0.0000 | 0.3162 |
| 111 | 0.9667 | 0.7143 | 0.6667 | 1.0000 | 0.5556 | 0.7806 |
| 112 | 0.9667 | 0.7143 | 0.6667 | 1.0000 | 0.8889 | 0.8473 |
| 113 | 0.3667 | 0.2857 | 0.3333 | 0.0000 | 0.0000 | 0.1971 |
| 114 | 0.7333 | 0.5714 | 0.6667 | 1.0000 | 0.7778 | 0.7498 |
| 115 | 0.8000 | 0.7143 | 0.6667 | 1.0000 | 0.8889 | 0.8140 |
| 116 | 0.6000 | 0.7143 | 0.0000 | 0.0000 | 0.0000 | 0.2629 |
| 117 | 0.8667 | 0.5714 | 0.6667 | 1.0000 | 0.7778 | 0.7765 |
| 118 | 0.5000 | 0.0714 | 0.0000 | 0.0000 | 0.0000 | 0.1143 |
| 119 | 0.9667 | 1.0000 | 0.6667 | 1.0000 | 1.0000 | 0.9267 |
| 120 | 0.4333 | 0.1429 | 0.0000 | 0.0000 | 0.1111 | 0.1375 |
| 121 | 0.4333 | 0.4286 | 0.0000 | 0.0000 | 0.0000 | 0.1724 |
| 122 | 0.3333 | 0.7143 | 0.1667 | 0.0000 | 0.0000 | 0.2429 |
| 123 | 1.0000 | 1.0000 | 0.6667 | 1.0000 | 1.0000 | 0.9333 |
| 124 | 0.9667 | 0.9286 | 0.7500 | 1.0000 | 1.0000 | 0.9290 |
| 125 | 0.4333 | 0.2857 | 0.0000 | 0.0000 | 0.2222 | 0.1883 |
| 126 | 0.3667 | 0.1429 | 0.0000 | 0.0000 | 0.0000 | 0.1019 |
| 127 | 0.6000 | 0.5714 | 0.0833 | 0.2000 | 0.1111 | 0.3132 |
| 128 | 0.3000 | 0.0714 | 0.0000 | 0.0000 | 0.0000 | 0.0743 |
| 129 | 0.3333 | 0.5714 | 0.3333 | 0.0000 | 0.1111 | 0.2698 |
| 130 | 0.3333 | 0.1429 | 0.0000 | 0.0000 | 0.0000 | 0.0952 |
| 131 | 1.0000 | 0.8571 | 0.7500 | 1.0000 | 0.9444 | 0.9103 |
| 132 | 0.5000 | 0.7143 | 0.5000 | 0.0000 | 0.2778 | 0.3984 |
| 133 | 0.4333 | 0.2143 | 0.0000 | 0.0000 | 0.0000 | 0.1295 |
| 134 | 0.2333 | 0.0714 | 0.0000 | 0.0000 | 0.0000 | 0.0610 |
| 135 | 1.0000 | 0.9286 | 0.9167 | 1.0000 | 0.9444 | 0.9579 |
| 136 | 1.0000 | 0.8571 | 0.9167 | 1.0000 | 1.0000 | 0.9548 |
| 137 | 1.0000 | 0.8571 | 0.9167 | 1.0000 | 0.8889 | 0.9325 |
| 138 | 1.0000 | 0.8571 | 0.8333 | 1.0000 | 0.9444 | 0.9270 |
| 139 | 1.0000 | 0.8571 | 0.8333 | 1.0000 | 0.8889 | 0.9159 |
| 140 | 1.0000 | 0.8571 | 0.9167 | 1.0000 | 0.6667 | 0.8881 |
| 141 | 1.0000 | 0.8571 | 0.8333 | 1.0000 | 0.6111 | 0.8603 |
| 142 | 0.9667 | 0.7857 | 0.8333 | 1.0000 | 0.8333 | 0.8838 |
| 143 | 0.9333 | 0.9286 | 0.7500 | 1.0000 | 0.7222 | 0.8668 |
| 144 | 0.9333 | 0.7143 | 0.6667 | 0.8000 | 0.6667 | 0.7562 |
| 145 | 0.9000 | 0.7143 | 0.8333 | 1.0000 | 0.5556 | 0.8006 |
| 146 | 0.9000 | 0.5714 | 0.2500 | 1.0000 | 0.3889 | 0.6221 |
| 147 | 0.8667 | 0.7857 | 0.6667 | 0.8000 | 0.6667 | 0.7571 |
| 148 | 0.8333 | 0.8571 | 0.6667 | 0.7000 | 0.9444 | 0.8003 |
| 149 | 0.7667 | 0.9286 | 0.8333 | 1.0000 | 0.5000 | 0.8057 |
| 150 | 0.7333 | 1.0000 | 0.8333 | 1.0000 | 0.4444 | 0.8022 |
| 151 | 0.7000 | 0.2857 | 0.5833 | 0.6000 | 0.2222 | 0.4783 |
| 152 | 0.6667 | 0.8571 | 0.6667 | 0.8000 | 0.8889 | 0.7759 |
| 153 | 0.6000 | 0.2857 | 0.1667 | 0.6000 | 0.5556 | 0.4416 |
| 154 | 0.5000 | 0.2857 | 0.5000 | 0.4000 | 0.2778 | 0.3927 |
| 155 | 0.3667 | 0.5714 | 0.3333 | 0.0000 | 0.6667 | 0.3876 |
| 156 | 0.3333 | 0.1429 | 0.1667 | 0.0000 | 0.4444 | 0.2175 |
| 157 | 0.3333 | 0.0000 | 0.1667 | 0.1000 | 0.0000 | 0.1200 |
| 158 | 0.3333 | 0.0000 | 0.1667 | 0.0000 | 0.0000 | 0.1000 |
| 159 | 0.3000 | 0.3571 | 0.5833 | 0.0000 | 0.1111 | 0.2703 |
| 160 | 0.3000 | 0.0000 | 0.1667 | 0.0000 | 0.2222 | 0.1378 |
| 161 | 0.3000 | 0.0000 | 0.1667 | 0.0000 | 0.0000 | 0.0933 |
| 162 | 0.2667 | 0.1429 | 0.1667 | 0.2000 | 0.3333 | 0.2219 |
| 163 | 0.2667 | 0.2857 | 0.1667 | 0.0000 | 0.3333 | 0.2105 |
| 164 | 0.2667 | 0.2857 | 0.1667 | 0.0000 | 0.0000 | 0.1438 |
| 165 | 0.2667 | 0.0000 | 0.1667 | 0.0000 | 0.2222 | 0.1311 |
| 166 | 0.2667 | 0.0000 | 0.1667 | 0.0000 | 0.0000 | 0.0867 |
| 167 | 0.2667 | 0.0000 | 0.1667 | 0.0000 | 0.0000 | 0.0867 |
| 168 | 0.2333 | 0.0714 | 0.1667 | 0.0000 | 0.0000 | 0.0943 |
| 169 | 0.2333 | 0.0000 | 0.1667 | 0.0000 | 0.0000 | 0.0800 |
| 170 | 0.2000 | 0.0000 | 0.1667 | 0.0000 | 0.3333 | 0.1400 |
| 171 | 0.2000 | 0.0000 | 0.1667 | 0.0000 | 0.2222 | 0.1178 |
| 172 | 0.2000 | 0.0000 | 0.1667 | 0.0000 | 0.0000 | 0.0733 |
| 173 | 0.2000 | 0.0000 | 0.1667 | 0.0000 | 0.0000 | 0.0733 |
| 174 | 0.0000 | 0.0000 | 0.1667 | 0.0000 | 0.1111 | 0.1222 |
| 175 | 0.6333 | 0.4286 | 0.3333 | 0.8000 | 0.2222 | 0.4835 |
| 176 | 0.8667 | 0.8571 | 0.8333 | 0.9000 | 0.9444 | 0.8803 |
| 177 | 0.8000 | 1.0000 | 0.8333 | 0.8000 | 0.9444 | 0.8756 |
| 178 | 1.0000 | 0.7143 | 0.8333 | 1.0000 | 0.7778 | 0.8651 |
| 179 | 0.9667 | 0.7143 | 0.6667 | 1.0000 | 0.7222 | 0.8140 |
| 180 | 0.9000 | 0.7143 | 0.8333 | 1.0000 | 0.5556 | 0.8006 |
| 181 | 0.7333 | 0.7143 | 0.8333 | 0.4000 | 0.5556 | 0.6473 |
| 182 | 0.6000 | 0.7143 | 0.3333 | 0.6000 | 0.5000 | 0.5495 |
| 183 | 0.6667 | 0.4286 | 0.6667 | 0.4000 | 0.5556 | 0.5435 |
| 184 | 0.8000 | 0.6429 | 0.6667 | 0.2000 | 0.3333 | 0.5286 |
| 185 | 0.4667 | 0.4286 | 0.3333 | 0.6000 | 0.2222 | 0.4102 |
| 186 | 0.3667 | 0.0000 | 0.3333 | 0.0000 | 0.0000 | 0.1400 |
| 187 | 0.2667 | 0.0000 | 0.3333 | 0.0000 | 0.0000 | 0.1200 |
| 188 | 0.2667 | 0.0000 | 0.1667 | 0.0000 | 0.0000 | 0.0867 |
| 189 | 0.1667 | 0.0000 | 0.1667 | 0.0000 | 0.0000 | 0.0667 |
| 190 | 0.8000 | 0.9286 | 0.6667 | 0.8000 | 0.5556 | 0.7502 |
| 191 | 0.9333 | 0.9286 | 0.7500 | 1.0000 | 0.8333 | 0.8890 |
| 192 | 0.7000 | 0.7857 | 0.6667 | 0.8000 | 0.0000 | 0.5905 |
| 193 | 1.0000 | 0.9286 | 0.6667 | 1.0000 | 0.8889 | 0.8968 |
| 194 | 1.0000 | 1.0000 | 0.7500 | 1.0000 | 0.8333 | 0.9167 |
| 195 | 0.9667 | 1.0000 | 0.7500 | 1.0000 | 0.9444 | 0.9322 |
| 196 | 0.8667 | 0.7857 | 0.7500 | 0.8000 | 0.7778 | 0.7960 |
| 197 | 0.8667 | 0.8571 | 0.6667 | 1.0000 | 1.0000 | 0.8781 |
| 198 | 0.7667 | 0.7143 | 0.3333 | 0.0000 | 0.1111 | 0.3851 |
| 199 | 0.9000 | 0.8571 | 0.6667 | 1.0000 | 1.0000 | 0.8848 |
| 200 | 0.7333 | 0.6429 | 0.6667 | 0.1000 | 0.5556 | 0.5397 |
| 201 | 0.9333 | 1.0000 | 0.6667 | 0.8000 | 1.0000 | 0.8800 |
| 202 | 0.8000 | 0.7143 | 0.6667 | 1.0000 | 0.7778 | 0.7917 |
| 203 | 0.9667 | 0.7143 | 0.6667 | 1.0000 | 0.6667 | 0.8029 |
| 204 | 0.5667 | 0.1429 | 0.0833 | 0.0000 | 0.0000 | 0.1586 |
| 205 | 0.8000 | 0.7143 | 0.5833 | 1.0000 | 1.0000 | 0.8195 |
| 206 | 0.6667 | 0.7143 | 0.5000 | 0.2000 | 0.7778 | 0.5717 |
| 207 | 1.0000 | 1.0000 | 0.6667 | 1.0000 | 1.0000 | 0.9333 |
| 208 | 0.9667 | 0.8571 | 0.6667 | 1.0000 | 0.7778 | 0.8537 |
| 209 | 0.6333 | 0.8571 | 0.6667 | 0.6000 | 0.2222 | 0.5959 |
| 210 | 0.9667 | 0.7857 | 0.6667 | 0.9000 | 0.7778 | 0.8194 |
| 211 | 0.6000 | 1.0000 | 0.6667 | 1.0000 | 1.0000 | 0.8533 |
| 212 | 0.9333 | 0.7143 | 0.6667 | 1.0000 | 0.7778 | 0.8184 |
| 213 | 1.0000 | 1.0000 | 0.7500 | 1.0000 | 0.9444 | 0.9389 |
| 214 | 0.9667 | 0.7143 | 0.6667 | 1.0000 | 0.7778 | 0.8251 |
| 215 | 0.5000 | 0.5714 | 0.6667 | 0.0000 | 0.4444 | 0.4365 |
| 216 | 0.9667 | 0.5714 | 0.6667 | 1.0000 | 0.7778 | 0.7965 |
| 217 | 1.0000 | 1.0000 | 0.7500 | 1.0000 | 1.0000 | 0.9500 |
| 218 | 0.9000 | 0.7857 | 0.6667 | 0.8000 | 0.5556 | 0.7416 |
| 219 | 0.9333 | 0.7143 | 0.6667 | 1.0000 | 1.0000 | 0.8629 |
| 220 | 0.3333 | 0.5714 | 0.3333 | 0.0000 | 0.0000 | 0.2476 |
| 221 | 1.0000 | 1.0000 | 0.7500 | 1.0000 | 0.8889 | 0.9278 |
| 222 | 1.0000 | 1.0000 | 0.8333 | 1.0000 | 1.0000 | 0.9667 |
| 223 | 0.7333 | 0.7143 | 0.6667 | 0.0000 | 0.8333 | 0.5895 |
References
- Johansen, T.R. EU regulation of corporate social and environmental reporting. Soc. Environ. Account. J. 2016, 36, 1–9. [Google Scholar] [CrossRef]
- Luque-Vilchez, M.; Larrinaga, C. Reporting Models do not Translate Well: Failing to Regulate CSR Reporting in Spain. Soc. Environ. Account. J. 2016, 36, 56–75. [Google Scholar] [CrossRef]
- Monciardini, D. The ‘Coalition of the Unlikely’ Driving the EU Regulatory Process of Non-Financial Reporting. Soc. Environ. Account. J. 2016, 36, 76–89. [Google Scholar] [CrossRef]
- Ogrean, C. The Directive 2014/95/Eu—Is There A “New” Beginning For Csr In Romania? Stud. Bus. Econ. 2017, 12, 141–147. [Google Scholar] [CrossRef]
- Castaldo, S.; Perrini, F.; Misan, N.; Tencati, A. The missing link between corporate social responsibility and consumer trust: The case of fair trade products. J. Bus. Ethics 2009, 84, 1–15. [Google Scholar] [CrossRef]
- Fonseca, A.; McAllisterand, M.L.; Fitzpatrick, P. Sustainability reporting among mining corporations: A constructive critique of the GRI approach. J. Clean. Prod. 2014, 84, 70–83. [Google Scholar] [CrossRef]
- Walker, K.; Wan, F. The harm of symbolic actions and green-washing: Corporate actions and communications on environmental performance and their financial implications. J. Bus. Ethics 2012, 109, 227–242. [Google Scholar] [CrossRef]
- Siano, A.; Vollero, A.; Conte, F.; Amabile, S. “More than words”: Expanding the taxonomy of greenwashing after the Volkswagen scandal. J. Bus. Res. 2017, 71, 27–37. [Google Scholar] [CrossRef]
- Michelon, G.; Pilonato, S.; Ricceri, F. CSR reporting practices and the quality of disclosure: An empirical analysis. Crit. Perspect. Account. 2015, 33, 59–78. [Google Scholar] [CrossRef] [Green Version]
- Dahlsrud, A. How corporate social responsibility is defined: An analysis of 37 definitions. Corp. Soc. Responsib. Environ. Manag. 2008, 15, 1–13. [Google Scholar] [CrossRef]
- Okoye, A. Theorising corporate social responsibility as an essentially contested concept: Is a definition necessary? J. Bus. Ethics 2009, 89, 613–627. [Google Scholar] [CrossRef]
- Neville, B.A.; Bell, S.J.; Mengüç, B. Corporate reputation, stakeholders and the social performance financial performance relationship. Eur. J. Mark. 2005, 39, 1184–1198. [Google Scholar] [CrossRef]
- Prado-Lorenzo, J.M.; Gallego-Alvarez, I.; Garcia-Sanchez, I.M. Stakeholder engagement and corporate social responsibility reporting: The ownership structure effect. Corp. Soc. Responsib. Environ. Manag. 2009, 16, 94–107. [Google Scholar] [CrossRef]
- Sierra-García, L.; Zorio-Grima, A.; García-Benau, M.A. Stakeholder engagement, corporate social responsibility and integrated reporting: An exploratory study. Corp. Soc. Responsib. Environ. Manag. 2015, 22, 286–304. [Google Scholar] [CrossRef]
- Wang, K.T.; Li, D. Market reactions to the first-time disclosure of corporate social responsibility reports: Evidence from China. J. Bus. Ethics 2015, 138, 1–22. [Google Scholar] [CrossRef]
- Godfrey, P.C.; Merrill, C.B.; Hansen, J.M. The relationship between corporate social responsibility and shareholder value: An empirical test of the risk management hypothesis. Strateg. Manag. J. 2009, 30, 425–445. [Google Scholar] [CrossRef]
- Academy of Management Proceedings. Available online: http://proceedings.aom.org/ (accessed on 5 August 2017).
- Carroll, A.B.; Shabana, K.M. The business case for corporate social responsibility: A review of concepts, research and practice. Int. J. Manag. Rev. 2010, 12, 85–105. [Google Scholar] [CrossRef]
- Deegan, C. Introduction: The legitimizing effect of social and environmental disclosures—A theoretical foundation. Account. Audit. Account. J. 2002, 15, 282–311. [Google Scholar] [CrossRef]
- Adams, C. The Ethical, Social and Environmental Reporting-performance gap. Account. Audit. Account. J. 2004, 17, 731–757. [Google Scholar] [CrossRef]
- Beets, S.D.; Souther, C.C. Corporate Environmental Reports: The need for standards and an environmental assurance service. Account. Horiz. 1999, 13, 129–145. [Google Scholar] [CrossRef]
- Crawford, E.P.; Williams, C.C. Should corporate social reporting be voluntary or mandatory? Evidence from the banking sector in France and the United States. Corp. Gov. 2010, 10, 512–526. [Google Scholar] [CrossRef]
- Husted, B.W.; de Jesus Salazar, J. Taking Friedman seriously: Maximizing profits and social performance. J. Manag. Stud. 2006, 43, 75–91. [Google Scholar] [CrossRef]
- Hess, D. Social reporting and new governance regulation: The prospects of achieving corporate accountability throgh transparency. Bus. Ethics Q. 2007, 17, 453–476. [Google Scholar] [CrossRef]
- Hess, D.; Dunfee, T.W. The Kasky-Nike threat to corporate social reporting: Implementing a standard of optimal truthful disclosure as a solution. Bus. Ethics Q. 2007, 17, 5–32. [Google Scholar] [CrossRef]
- Brown, H.S.; de Jongand, M.; Levy, D.L. Building institutions based on information disclosure: Lessons from GRI's sustainability reporting. J. Clean. Prod. 2009, 17, 571–580. [Google Scholar] [CrossRef]
- Bebbington, J.; Kirk, E.A.; Larrinaga, C. The production of normativity: A comparison of reporting regimes in Spain and the UK. Account. Organ. Soc. 2012, 2, 78–94. [Google Scholar] [CrossRef]
- Chauvey, J.; Giordano-Spring, S.; Choand, C.H.; Patten, D.M. The normativity and legitimacy of CSR disclosure: Evidence from France. J. Bus. Ethics 2015, 130, 789–803. [Google Scholar] [CrossRef]
- Lock, I.; Seele, P. The credibility of CSR (corporate social responsibility) reports in Europe. Evidence from a quantitative content analysis in 11 countries. J. Clean. Prod. 2016, 122, 186–200. [Google Scholar] [CrossRef]
- Delbard, O. CSR legislation in France and the European regulatory paradox: An analysis of EU CSR policy and sustainability reporting practice. Corp. Gov. 2008, 8, 397–405. [Google Scholar] [CrossRef]
- Costa, E.; Agostini, M. Mandatory disclosure about Environmental and Employee Matters in the Reports of Italian- listed corporate groups. Soc. Environ. Account. J. 2016, 36, 10–33. [Google Scholar] [CrossRef]
- Ioannou, I.; Serafeim, G. The consequence of mandatory corporate sustainability reporting: Evidence from four countries. In Harvard Business School Research Working Paper; Harvard Business School: Boston, MA, USA, 2014; pp. 11–100. [Google Scholar]
- Patten, D.M.; Ren, Y.; Zhao, N. Standalone Corporate Social Responsibility Reporting in China: An Exploratory Analysis of its Relation to Legitimation. Soc. Environ. Account. J. 2015, 35, 17–31. [Google Scholar] [CrossRef]
- Miles, M.P.; Munilla, L.S. The potential impact of social accountability certification on marketing: A short not. J. Bus. Ethics 2004, 50, 1–11. [Google Scholar] [CrossRef]
- Pflugrath, G.; Roebuck, P.; Simnett, R. Impact of assurance and assurer's professional affiliation on financial analysts’ assessment of credibility of corporate social responsibility information. Audit. J. Pract. Theory 2011, 30, 239–254. [Google Scholar] [CrossRef]
- Daub, C.H. Assessing the quality of sustainability reporting: An alternative methodological approach. J. Clean. Prod. 2007, 15, 75–85. [Google Scholar] [CrossRef]
- Maas, K.; Liket, K. Talk the walk: Measuring the impact of strategic philanthropy. J. Bus. Ethics 2011, 100, 445–464. [Google Scholar] [CrossRef]
- Kolk, A. A decade of sustainability reporting: Developments and significance. Int. J. Environ. Sustain. Dev. 2004, 3, 51–64. [Google Scholar] [CrossRef]
- Daub, C.H.; Scherrer, Y.M. Doing the right thing right: The role of sociological research and consulting for corporate engagement in development cooperation. J. Bus. Ethics 2009, 85, 573–584. [Google Scholar] [CrossRef]
- Maas, K.; Schalteggerand, S.; Crutzen, N. Integrating corporate sustainability assessment, management accounting, control, and reporting. J. Clean. Prod. 2016, 136, 237–248. [Google Scholar] [CrossRef]
- Dissanayake, D.; Tilt, C.; Xydias-Lobo, M. Sustainability reporting by publicly listed companies in Sri Lanka. J. Clean. Prod. 2016, 129, 169–182. [Google Scholar] [CrossRef]
- Fortanier, F.; Kolk, A.; Pinkse, J. Harmonization in CSR reporting. Manag. Int. Rev. 2011, 51, 665–696. [Google Scholar] [CrossRef]
- Tschopp, D.; Nastanski, M. The harmonization and convergence of corporate social responsibility reporting standards. J. Bus. Ethics 2014, 125, 147–162. [Google Scholar] [CrossRef]
- Fonseca, A.M.L. How credible are mining corporations’ sustainability reports? A critical analysis of external assurance under the requirements of the international council on mining and metals. Corp. Soc. Responsib. Environ. Manag. 2010, 17, 355–370. [Google Scholar] [CrossRef]
- Perez, F.; Sanchez, L.E. Assessing the evolution of sustainability reporting in the mining sector. Environ. Manag. 2009, 43, 949–961. [Google Scholar] [CrossRef] [PubMed]
- Tschopp, D.; Huefner, R.J. Comparing the evolution of CSR reporting to that of financial reporting. J. Bus. Ethics 2015, 127, 565–577. [Google Scholar] [CrossRef]
- Bhaduri, S.N.; Selarka, E. Corporate Governance and Corporate Social Responsibility of Indian Companies; Springer: Singapore, 2016. [Google Scholar]
- Tang, Z.; Hull, C.E.; Rothenberg, S. How corporate social responsibility engagement strategy moderates the CSR–financial performance relationship. J. Manag. Stud. 2012, 49, 1274–1303. [Google Scholar] [CrossRef]
- Rao, K.; Tilt, C. Board composition and corporate social responsibility: The role of diversity, gender, strategy and decision making. J. Bus. Ethics 2015, 138, 327–347. [Google Scholar] [CrossRef]
- Hay, D.; Davis, D. The voluntary choice of an auditor of any level of quality. Audit. J. Pract. Theory 2004, 23, 37–53. [Google Scholar] [CrossRef]
- Moroney, R.; Windsor, C.; Aw, Y.T. Evidence of assurance enhancing the quality of voluntary environmental disclosures: An empirical analysis. Account. Financ. 2012, 52, 903–939. [Google Scholar] [CrossRef]
- Bagnoli, M.; Watts, S.G. Voluntary assurance of voluntary CSR disclosure. J. Econ. Manag. Strateg. 2016, 26, 205–230. [Google Scholar] [CrossRef]
- Coram, P.J.; Monroe, G.S.; Woodliff, D.R. The value of assurance on voluntary nonfinancial disclosure: An experimental evaluation. Audit. J. Pract. Theory 2009, 28, 137–151. [Google Scholar] [CrossRef]
- Venturelli, A.; Caputo, F.; Leopizzi, R.; Pizzi, S. The EU Directive on non-financial and diversity disclosure: Constraint or opportunity? In Proceedings of the EURAM Conference 2017, Glasgow, Scotland, 21–24 June 2017. [Google Scholar]
- Zorio, A.; García-Benau, M.A.; Sierra, L. Sustainability Development and the Quality of Assurance Reports: Empirical Evidence. Bus. Strateg. Environ. 2013, 22, 484–500. [Google Scholar] [CrossRef]
- Sierra, L.; Zorio, A.; García-Benau, M.A. Sustainable Development and Assurance of Corporate Social Responsibility Reports Published by Ibex-35 Companies. Corp. Soc. Responsib. Environ. Manag. 2013, 20, 359–370. [Google Scholar] [CrossRef]
- Udayasankar, K. Corporate Social Responsibility and Firm Size. J. Bus. Ethics 2008, 83, 167–175. [Google Scholar] [CrossRef]
- Perrini, F.; Russo, A.; Tencati, A. CSR Strategies of SMEs and Large Firms. Evidence from Italy. J. Bus. Ethics 2007, 74, 285–300. [Google Scholar] [CrossRef]
- European Commission. Feedback Statement on the Public Consultation on the Non-Binding Guidelines for Reporting on Non-Financial Information by Companies Having Taken Place from 15 January to 15 April 2016. Available online: http://ec.europa.eu/finance/consultations/2016/non-financial-reporting-guidelines/docs/summary-of-responses_en.pdf (accessed on 4 August 2017).
Figure 1.
Information to be disclosed.

Figure 2.
Compliance level in non-financial scores.

Table 1.
Sampling.
| Sectors | National | Multinational | National | Multinational |
|---|---|---|---|---|
| Number of Companies | Average Number of Employees * | |||
| Basic materials | 4 | 1 | 1372 | 155,407 |
| Consumer goods | 13 | 4 | 9658 | 89,628 |
| Consumer services | 22 | 4 | 1974 | 105,832 |
| Health care | 11 | 5 | 12,387 | 62,818 |
| Industrial | 52 | 16 | 7466 | 426,075 |
| Oil & Gas | 14 | 3 | 9929 | 92,331 |
| Telecommunications | 18 | 1 | 17,899 | 4880 |
| Banks and Financial services | 41 | 0 | 8560 | 0 |
| Insurance | 14 | 0 | 24,660 | 0 |
| Total | 189 | 34 | 9821 | 133,839 |
* date 31 December 2015.
Table 2.
The business model
| Disclosure |
|---|
| Clear identification of the key elements of the business model |
| Diagram highlighting key elements |
| Logical descriptive flow for specific aspects of the company |
| Identification of key stakeholders and factors influencing the internal and external contexts |
| Links between strategic aspects, risks, opportunities and performance |
| Management declaration on the sustainability of the company |
| Description of key impacts of the company regarding sustainability |
| Description of main processes adopted to achieve performance aims and relevant changes |
| Description of main risks and opportunities regarding sustainability issues and their trends |
| Hierarchy of key aspects regarding sustainability |
| Concise description of governance mechanism adopted by company to manage risks and opportunities |
| Principal brands, products and services of the company |
| Countries where the company operates or which are relevant to it in terms of sustainability |
| Markets served, including the kinds of clients and beneficiaries of the company |
| Description of the supply chain |
Table 3.
Sustainability policies and processes.
| Disclosure |
|---|
| Description of sustainability policy (regarding economic, environmental, social and employee matters, respect for human rights, anti-corruption and bribery issues |
| List of all entities affected by sustainability policy |
| Identification of subjects/committees responsible for decision-making on sustainability policy |
| Reference to specific rules and standards concerning sustainability policy |
| First-time adoption or revision of sustainability policy |
| Qualitative and quantitative proxies able to represent specific targets in sustainability policy |
| Period within which the organization aims to meet its targets |
Table 4.
Sustainability risks.
| Disclosure |
|---|
| Explanation of sustainability risks |
| Probability of risk situations occurring |
| Internal and external impacts |
| Policies and procedures required |
| Role of the board and other company bodies in risk management |
| Business risk appetite |
Table 5.
Performance indicators.
| Disclosure |
|---|
| Environmental indicators |
| Social indicators |
| Personnel indicators |
| Human right indicators |
| Anti-corruption and bribery indicators |
Table 6.
Diversity.
| Disclosure |
|---|
| Explanation of diversity policy |
| List of all entities involved in diversity policy |
| Identification of subjects/committees responsible for decision-making on diversity policy |
| Reference to specific rules and standards concerning diversity policy |
| First-time adoption or revision of diversity policy |
| Qualitative and quantitative proxies able to represent specific targets in diversity policy |
| Period within which the organization aims to meet its targets |
| Representation of diversity on the board |
| Representation of diversity in the organization as a whole |
Table 7.
The non-financial score.
| Minimum | Maximum | Mean | Standard Dev. | |
|---|---|---|---|---|
| Business Model | 0.0000 | 1.0000 | 0.652916 | 0.2632303 |
| Policy | 0.0000 | 1.0000 | 0.516655 | 0.3374185 |
| Sustainability risks | 0.0000 | 0.9167 | 0.444699 | 0.3014955 |
| Performance Indicators | 0.0000 | 1.0000 | 0.437668 | 0.4605304 |
| Diversity | 0.0000 | 1.0000 | 0.401843 | 0.3884941 |
| NFI SCORE | 0.0533 | 0.9667 | 0.491054 | 0.3199115 |
Table 8.
Financial sector vs. non-financial sector.
| Business Model | Policy | Sustainability Risks | Performance Indicators | Diversity | NFI SCORE | ||
|---|---|---|---|---|---|---|---|
| Non-financial | Mean | 0.676589 | 0.541241 | 0.432546 | 0.427976 | 0.396825 | 0.495034 |
| N | 168 | 168 | 168 | 168 | 168 | 168 | |
| St Dev. | 0.2404427 | 0.3226272 | 0.3020506 | 0.4676256 | 0.4043505 | 0.3162082 | |
| Financial | Mean | 0.580606 | 0.441558 | 0.481818 | 0.467273 | 0.417172 | 0.478897 |
| N | 55 | 55 | 55 | 55 | 55 | 55 | |
| St Dev | 0.3146421 | 0.3721937 | 0.2994727 | 0.4409815 | 0.3384168 | 0.3336526 | |
| Total | Mean | 0.652916 | 0.516655 | 0.444699 | 0.437668 | 0.401843 | 0.491054 |
| N | 223 | 223 | 223 | 223 | 223 | 223 | |
| St Dev. | 0.2632303 | 0.3374185 | 0.3014955 | 0.4605304 | 0.3884941 | 0.3199115 | |
Table 9.
Mandatory vs. voluntary reports.
| Business Model | Policy | Sustainability Risks | Performance Indicators | Diversity | NFI SCORE | ||
|---|---|---|---|---|---|---|---|
| Mandatory | Mean | 0.439757 | 0.262777 | 0.205658 | 0.043119 | 0.078489 | 0.206573 |
| N | 109 | 109 | 109 | 109 | 109 | 109 | |
| St Dev. | 0.1720434 | 0.2721470 | 0.2297883 | 0.1535789 | 0.1704314 | 0.1460331 | |
| Voluntary | Mean | 0.856726 | 0.759398 | 0.673254 | 0.814912 | 0.711015 | 0.763058 |
| N | 114 | 114 | 114 | 114 | 114 | 114 | |
| St Dev. | 0.1486732 | 0.1768267 | 0.1424695 | 0.3168519 | 0.2673227 | 0.1672621 | |
| Total | Mean | 0.652916 | 0.516655 | 0.444699 | 0.437668 | 0.401843 | 0.491054 |
| N | 223 | 223 | 223 | 223 | 223 | 223 | |
| St Dev. | 0.2632303 | 0.3374185 | 0.3014955 | 0.4605304 | 0.3884941 | 0.3199115 | |
Table 10.
Assured vs. non-assured reports.
| Business Model | Policy | Sustainability Risks | Performance Indicators | Diversity | NFI SCORE | ||
|---|---|---|---|---|---|---|---|
| Non-assured | Mean | 0.555729 | 0.449777 | 0.449223 | 0.398438 | 0.356771 | 0.443029 |
| N | 64 | 64 | 64 | 64 | 64 | 64 | |
| St Dev | 0.2733362 | 0.3482300 | 0.2456086 | 0.4180424 | 0.3242161 | 0.2862375 | |
| Assured | Mean | 0.692035 | 0.543575 | 0.442877 | 0.453459 | 0.419985 | 0.510385 |
| N | 159 | 159 | 159 | 159 | 159 | 159 | |
| St Dev | 0.2494007 | 0.3302652 | 0.3219548 | 0.4769072 | 0.4110906 | 0.3313904 | |
| Total | Mean | 0.652916 | 0.516655 | 0.444699 | 0.437668 | 0.401843 | 0.491054 |
| N | 223 | 223 | 223 | 223 | 223 | 223 | |
| St Dev | 0.2632303 | 0.3374185 | 0.3014955 | 0.4605304 | 0.3884941 | 0.3199115 | |
Table 11.
National vs. multinational companies.
| Business Model | Policy | Sustainability Risks | Performance Indicators | Diversity | NFI SCORE | ||
|---|---|---|---|---|---|---|---|
| National | Mean | 0.618520 | 0.465230 | 0.408736 | 0.379894 | 0.344503 | 0.443728 |
| N | 189 | 189 | 189 | 189 | 189 | 189 | |
| St Dev | 0.2626337 | 0.3333746 | 0.3087331 | 0.4501985 | 0.3730832 | 0.3141655 | |
| Multinational | Mean | 0.844118 | 0.802521 | 0.644608 | 0.758824 | 0.720588 | 0.754131 |
| N | 34 | 34 | 34 | 34 | 34 | 34 | |
| St Dev | 0.1695152 | 0.1827932 | 0.1411068 | 0.3830639 | 0.3144141 | 0.2051018 | |
| Total | Mean | 0.652916 | 0.516655 | 0.444699 | 0.437668 | 0.401843 | 0.491054 |
| N | 223 | 223 | 223 | 223 | 223 | 223 | |
| St Dev | 0.2632303 | 0.3374185 | 0.3014955 | 0.4605304 | 0.3884941 | 0.3199115 | |
Table 12.
Regression analyses.
| Regr. 1 | Regr. 2 | Regr. 3 | Regr. 4 | Regr. 5 | Regr. 6 | |||||||
|---|---|---|---|---|---|---|---|---|---|---|---|---|
| Dependent variable | NFI Score | Business model | Policy | Sustainability risks | KPIs | Diversity | ||||||
| Adjusted R square | 0.821 | 0.759 | 0.612 | 0.646 | 0.741 | 0.715 | ||||||
| Sign. | 0.000 | 0.000 | 0.000 | 0.000 | 0.000 | 0.000 | ||||||
| Variables | Beta | Sign. | Beta | Sign. | Beta | Sign. | Beta | Sign. | Beta | Sign. | Beta | Sign. |
| Constant | 0.000 | 0.000 | 0.000 | 0.000 | 0.000 | 0.000 | ||||||
| Mandatory or voluntary reporting | 0.026 | 0.493 | −0.066 | 0.128 | −0.111 | 0.042 | 0.087 | 0.980 | 0.081 | 0.070 | 0.077 | 0.104 |
| Size (employees) | 0.123 | 0.001 | 0.086 | 0.035 | 0.144 | 0.005 | 0.121 | 0.015 | 0.081 | 0.051 | 0.134 | 0.003 |
| Assurance | 0.162 | 0.000 | 0.265 | 0.000 | 0.101 | 0.050 | 0.070 | 0.160 | 0.157 | 0.000 | 0.163 | 0.000 |
| Experience | 0.002 | 0.966 | −0.064 | 0.181 | 0.107 | 0.074 | 0.170 | 0.774 | −0.053 | 0.281 | 0.007 | 0.891 |
Table 13.
Correlation matrix.
| Business Model | Policy | SR | KPI | Diversity | NFI Score | Report Type | Size | Assurance | Experience | ||
|---|---|---|---|---|---|---|---|---|---|---|---|
| Business Model | Pearson’s correlation | 1 | 0.787 ** | 0.768 ** | 0.856 ** | 0.795 ** | 0.912 ** | 0.794 ** | 0.316 ** | 0.235 ** | 0.537 ** |
| Sign. | 0.000 | 0.000 | 0.000 | 0.000 | 0.000 | 0.000 | 0.000 | 0.000 | 0.000 | ||
| Policy | Pearson’s correlation | 0.787 ** | 1 | 0.831 ** | 0.742 ** | 0.729 ** | 0.886 ** | 0.737 ** | 0.366 ** | 0.126 * | 0.575 ** |
| Sign. | 0.000 | 0.000 | 0.000 | 0.000 | 0.000 | 0.000 | 0.000 | 0.030 | 0.000 | ||
| SR | Pearson’s correlation | 0.768 ** | 0.831 ** | 1 | 0.777 ** | 0.757 ** | 0.897 ** | 0.777 ** | 0.315 ** | −0.010 | 0.559 ** |
| Sign. | 0.000 | 0.000 | 0.000 | 0.000 | 0.000 | 0.000 | 0.000 | 0.444 | 0.000 | ||
| KPI | Pearson’s correlation | 0.856 ** | 0.742 ** | 0.777 ** | 1 | 0.872 ** | 0.943 ** | 0.840 ** | 0.303 ** | 0.054 | 0.571 ** |
| Sign. | 0.000 | 0.000 | 0.000 | 0.000 | 0.000 | 0.000 | 0.000 | 0.210 | 0.000 | ||
| Diversity | Pearson’s correlation | 0.795 ** | 0.729 ** | 0.757 ** | 0.872 ** | 1 | 0.920 ** | 0.816 ** | 0.365 ** | 0.074 | 0.593 ** |
| Sign. | 0.000 | 0.000 | 0.000 | 0.000 | 0.000 | 0.000 | 0.000 | 0.136 | 0.000 | ||
| NFI score | Pearson’s correlation | 0.912 ** | 0.886 ** | 0.897 ** | 0.943 ** | 0.920 ** | 1 | 0.871 ** | 0.364 ** | 0.095 | 0.623 ** |
| Sign. | 0.000 | 0.000 | 0.000 | 0.000 | 0.000 | 0.000 | 0.000 | 0.078 | 0.000 | ||
| Report type | Pearson’s correlation | 0.794 ** | 0.737 ** | 0.777 ** | 0.840 ** | 0.816 ** | 0.871 ** | 1 | 0.287 ** | −0.105 | 0.681 ** |
| Sign. | 0.000 | 0.000 | 0.000 | 0.000 | 0.000 | 0.000 | 0.000 | 0.059 | 0.000 | ||
| Size | Pearson’s correlation | 0.316 ** | 0.366 ** | 0.315 ** | 0.303 ** | 0.365 ** | 0.364 ** | 0.287 ** | 1 | 0.109 | 0.268 ** |
| Sign. | 0.000 | 0.000 | 0.000 | 0.000 | 0.000 | 0.000 | 0.000 | 0.052 | 0.000 | ||
| Assurance | Pearson’s correlation | 0.235 ** | 0.126 * | −0.010 | 0.054 | 0.074 | 0.095 | −0.105 | 0.109 | 1 | 0.048 |
| Sign. | 0.000 | 0.030 | 0.444 | 0.210 | 0.136 | 0.078 | 0.059 | 0.052 | 0.238 | ||
| Experience | Pearson’s correlation | 0.537 ** | 0.575 ** | 0.559 ** | 0.571 ** | 0.593 ** | 0.623 ** | 0.681 ** | 0.268 ** | 0.048 | 1 |
| Sign. | 0.000 | 0.000 | 0.000 | 0.000 | 0.000 | 0.000 | 0.000 | 0.000 | 0.238 | ||
*. Correlation is significant at the 0.05 level (2-tailed). **. Correlation is significant at the 0.01 level (2-tailed).
© 2017 by the authors. Licensee MDPI, Basel, Switzerland. This article is an open access article distributed under the terms and conditions of the Creative Commons Attribution (CC BY) license (http://creativecommons.org/licenses/by/4.0/).
Share and Cite
MDPI and ACS Style
Venturelli, A.; Caputo, F.; Cosma, S.; Leopizzi, R.; Pizzi, S. Directive 2014/95/EU: Are Italian Companies Already Compliant? Sustainability 2017, 9, 1385. https://doi.org/10.3390/su9081385
AMA Style
Venturelli A, Caputo F, Cosma S, Leopizzi R, Pizzi S. Directive 2014/95/EU: Are Italian Companies Already Compliant? Sustainability. 2017; 9(8):1385. https://doi.org/10.3390/su9081385
Chicago/Turabian StyleVenturelli, Andrea, Fabio Caputo, Simona Cosma, Rossella Leopizzi, and Simone Pizzi. 2017. "Directive 2014/95/EU: Are Italian Companies Already Compliant?" Sustainability 9, no. 8: 1385. https://doi.org/10.3390/su9081385
Note that from the first issue of 2016, this journal uses article numbers instead of page numbers. See further details here.