The Factors Affecting Electricity Consumption and the Consumption Characteristics in the Residential Sector—A Case Example of Taiwan

Department of Health Care Management, National Taipei University of Nursing and Health Sciences, 89 Nei-Chiang St. Wan-Hua District, Taipei 108, Taiwan
Sustainability 2017, 9(8), 1484; https://doi.org/10.3390/su9081484
Submission received: 11 July 2017
/
Revised: 10 August 2017
/
Accepted: 13 August 2017
/
Published: 21 August 2017
(This article belongs to the Section Environmental Sustainability and Applications)
Abstract
:This article attempts to examine the factors affecting residential electricity consumption through two approaches, a socioeconomic perspective and a direct use perspective. The results of this study find that gross domestic product (GDP), employment rates, residential space, and the implementation of energy labeling schemes provide significant impacts on residential electricity consumption. However, the impacts of electricity price and the energy efficiency standards do not receive significant support. The analysis of the direct use approach finds that air conditioners consume the largest portion of electricity, amounting to 1470 kWh for each household and accounting for 26.81% except for lighting. Refrigerators and rice cookers follow, consuming 815.83 kWh (14.88%) and 343.85 kWh (6.27%) of electricity. The correlation analysis reveals that GDP keeps a high relationship with the installation of electrical appliances and eventually leads to an increase in residential electricity consumption. By integrating the results obtained from these two approaches, this paper also discusses some improvement strategies. The results, derived from the case example of Taiwan’s residential electricity consumption, may provide valuable information for policy-making involving green labeling, energy standards, and electricity prices.
1. Introduction
In order to mitigate CO2 emissions, many researchers analyze the electricity consumption in households by various methods. For example, Lü et al. [1] adopted a physical model to characterize the underlying physical mechanism of energy flows and then forecast the energy consumption of buildings in consideration of different weather conditions. Verdejo et al. [2] applied the statistic parametric linear model to predict the residential electricity consumption in Chile. Aydinalp et al. [3] examined the residential electricity consumption at the national and regional levels by the neural network (NN) method. Fan et al. [4] adopted the divisia decomposition method to explore the effect of urbanization on the changes of residential electricity consumption and analyzed the factors that affect the residential electricity consumption. Swan and Ugursal [5] provided an overview of various modeling techniques for the electricity consumption in the residential sector. Zhang et al. [6] adopted input–output analysis and ecological network analysis to calculate the direct and indirect electricity consumption, and employed the carbon footprint technique to investigate the electricity consumption structure of 28 sectors in Beijing. Kondo [7] examined the energy and exergy (i.e., available energy) efficiencies of Japan’s residential/commercial sectors and found a large difference between the overall energy and exergy efficiencies in the residential (60.12%, 6.33%)/commercial sectors (51.78%, 5.74%) in 2006. The results of Dintchev et al. [8] showed that the education of electricity saving has a significant influence on the energy-efficient behavior and awareness.
Until now, electricity is still an essential input for all manufacturing systems and a necessity for all households today. Electricity consumption may cause not only an improved living style but also aggravated impacts on the environment due to inappropriate use [9]. Hence, relevant energy policies are required to induce efficient electricity consumption in the residential sector in many countries due to global warming effects and security of energy supply [10]. As the electricity consumption in the residential sector accounts for about one third of the total electricity consumption in the world [11], this implies that the electricity consumption characteristics in the residential sector should be focused. In 2015, Taiwan’s residential sector consumed 44,882 GWh of electricity, accounting for 17.96% of total electricity consumption [12]. In contrast, the service sector and the industrial sector consumed 48,316 GWh (19.33%), and 133,302 GWh (53.34%), respectively. Both the service sector and the industrial sector may seek cost minimization by improving the efficiency of electricity consumption voluntarily. This implies that the energy policy should focus on the residential sector for energy savings. Fu et al. [13] indicated that the electricity consumption resulting from residents in city becomes a growing issue.
Thus, this paper first aims to examine the factors affecting power consumption in the residential sector using panel data from a socioeconomic perspective. Secondly, the impact of socioeconomic variables on the installation of electrical appliances is examined. From the direct use perspective, the impact of the installation rate for each electrical appliance on residential electricity consumption is also investigated. By integrating the results from the above analyses, this paper presents several improvement strategies for the saving of electricity consumption. This paper suggests that the information release of energy efficiency through the implementation of energy labeling schemes may reduce residential electricity consumption. Electrical appliances consuming more electricity, such as room air conditioners, may be granted priority for energy conservation programs. The results derived from this paper may provide some valuable information for policy-making involving energy labeling, energy standards, and electricity prices to reduce residential electricity consumption.
2. Materials and Methods
This paper considers two perspectives which affect residential electricity consumption, including the socioeconomic perspective and the direct use perspective. First, the socioeconomic variables, including gross domestic product (GDP), electricity price, employment rate, residential space, the implementation of energy labels, and the implementation of energy efficiency standards are included in a regression model to identify the factors affecting residential electricity consumption. Secondly, the electricity consumption characteristics of electrical appliances are analyzed through a theoretical calculation. The high electricity-consuming appliances are selected as the focus group for electricity saving. The impact of socioeconomic variables on the installation of electrical appliances is examined through a correlation test between the installation rate of selected electrical appliances and socioeconomic variables. The relationship between the installation rate for selected appliances and residential electricity consumption is also analyzed. The electrical appliance with high correlation coefficient is regarded as more important and prior for the improvement of electricity saving. The detailed analysis is listed below.
2.1. The Socioeconomic Perspectives
Many researchers have attempted to identify the factors affecting electricity consumption based on a regression analysis using historic aggregate data. The per capita electricity consumption is employed as a dependent variable and the key explanatory variables include GDP, electricity price, employment rate, residential space, implementation of the energy label scheme and implementation of energy efficiency standards. For example, Paatero and Lund [14] presented a model to predict the total electricity consumption using household incomes, household appliances, area, and power prices as explainable variables. O’Doherty et al. [15] found that the explanatory variables of income have a significant impact on electricity consumption. Bélaïd and Abderrahmani [16] analyzed the consumption characteristics and indicated that a causal relationship exists between electricity consumption and GDP in the residential sector. McLoughlin et al. [17] incorporated the variables of disposable income, dwelling type and number of bedrooms that are used as a proxy for residential space to explain the electricity consumption in the household. In addition, a great number of studies have focused on the use of aggregate nationwide or state-level data to estimate the energy demand elasticity with respect to energy price using panel data [18,19]. Runa [20] analyzed the impacts of energy prices on energy consumption and finds that energy price sensitivity in residential energy consumption is higher for high-income households than low-income households. Jamil and Ahmad [21] found that growth in private expenditure is the cause of rising electricity consumption in the residential sector, and concluded that electricity production and management needs to be better integrated with overall economic planning exercises. Two previous studies, Zhang and Peng [22] and Rahman and Miah [23], proposed that the price of electricity is an important factor which affects electricity consumption. Santos et al. [24] indicated that energy policies are important tools to improve the utilization efficiency of energy. Fuks and Salazar [25] also incorporated income and residential space into the ordinal logistic regression model to explain the household electricity consumption.
The rapid growth in residential electricity consumption has resulted in a great concern regarding the exhaustion of energy resources [26], and thus the regulation of energy efficiency standards is believed to be an effective tool for energy policy at national levels [26]. Since 1999, Taiwan has implemented the regulation of national energy efficiency standards for a great number of household appliances. The fluorescent lamp is the first energy-consuming household product to be regulated for energy efficiency standards. After that, many household appliances, such as refrigerators, freezers, air conditioners, and dehumidifiers, have been regulated. Revisions to set the value of energy efficiency standards also took effect for several products. In the past few years, efficiency standards have stimulated product re-design, and energy efficiency has been improved for new products due to technology improvements. Table 1 shows the relevant energy standards relating to the residential electricity consumption that has been enacted in Taiwan.
In contrast, energy labels are also believed to play a major role in reducing energy demand in residential sectors [26]. In 2006, the “directive for the promotion of energy labels” was issued, and subsidy programs for labeled products followed. Considering several factors which affect electricity consumption which were revealed by previous studies, we employ the following model to explain the factors affecting electricity consumption.
where represents per capita electricity consumption in the residential sector, denotes per capita gross domestic products, is electricity price, stands for employment rate, and is residential space, defined as the average residential area for each household and the sub-script denotes the year. Both and are two dummy variables, where = 1 represents the implementation of the energy label scheme and = 1 for the implementation of energy efficiency standards, otherwise they are zeros. The data adopted in this paper cover the period from 1987 to 2015.
2.2. The Direct Use Perspective
In contrast, the direct use of electrical appliances is intuitively seen as the major source of residential electricity consumption. Currently, various electrical appliances, such as air conditioners, refrigerators, rice cookers, and etc., are popularly installed in Taiwan’s households. Theoretically, the electricity consumption of the ith electrical appliance is calculated by
where represents the installation rate of the ith electrical appliance for each household, denotes the electricity consumption per hour for the ith electrical appliance, and is the working hours per year. And thus, the total electrical consumption for each household is calculated by
The share of electricity consumption for ith electrical appliance is calculated by Equation (4). The data of power consumption for various electric appliances and the average working hours for each appliance are suggested and provided by Taiwan Power Company [27]. The top ten high electricity-consuming appliances are selected as the representative of the electrical appliances popularly utilized in households.
In addition, a correlation test between market penetration for the top ten consuming electrical appliances and socioeconomic variables is conducted. The market penetration for an electrical appliance is defined as the percentage of households using it. The test attempts to investigate the causal effect of GDP, electricity price, employment rate and residential space on the installation of electrical appliances. Furthermore, the impact of market penetration for each electrical appliance on residential electricity consumption is also conducted through a correlation test. A high positive relationship between the penetration and residential electricity consumption for an electrical appliance suggests that more installations lead to higher residential electricity consumption; therefore, the improvement strategy may focus on the electrical appliances with high correlation coefficients with residential electricity consumption.
2.3. Data
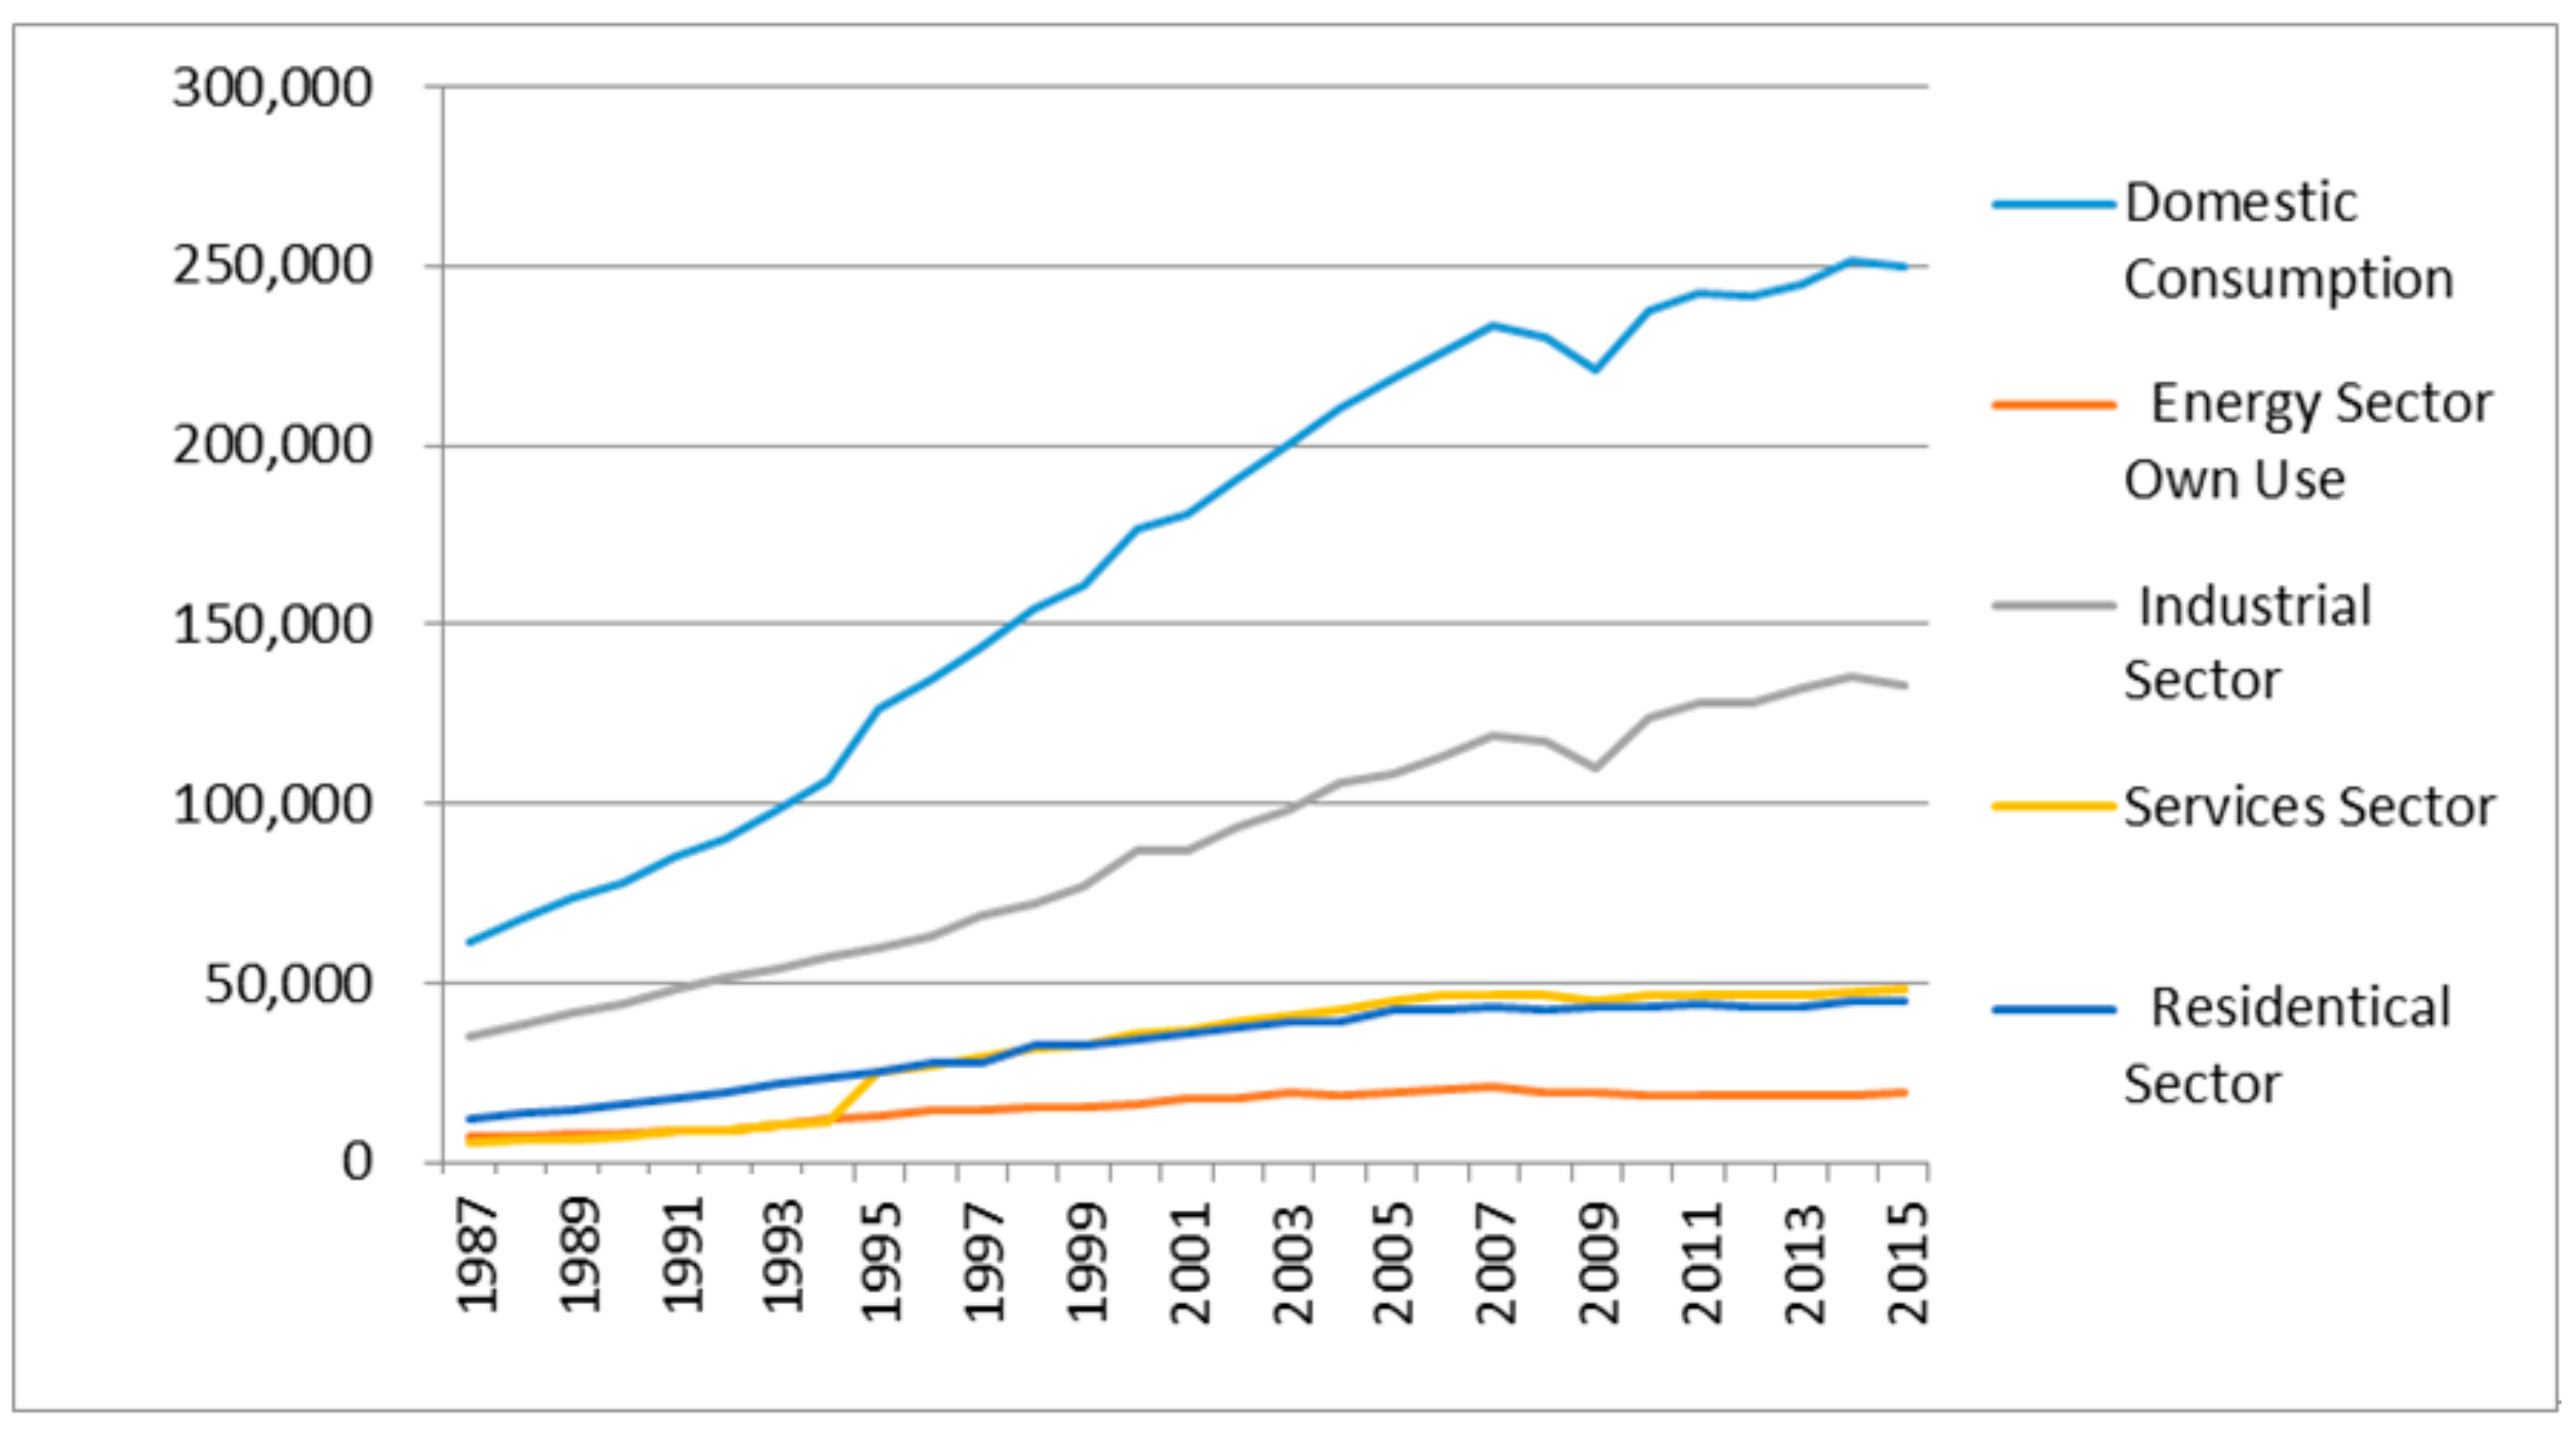
The data of the residential electricity consumption and electricity prices in Taiwan is provided by the Bureau of Energy (BOE) [12]. Figure 1 demonstrates the growth of Taiwan’s electricity consumption in each sector during the period of 1987–2015. The domestic electricity consumption in Taiwan rose from 61,764 GWh in 1987 to 230,763 GWh in 2015 with a 3.73-fold growth rate over this period. In contrast, the electricity consumption of the residential sector increased from 11,907 GWh in 1987 to 44,882 GWh in 2015 with a 3.77-fold growth rate. Compared to other sectors, the residential sector consumes almost the same amount as the service sector, more than the energy sector, but much less than industrial sector.
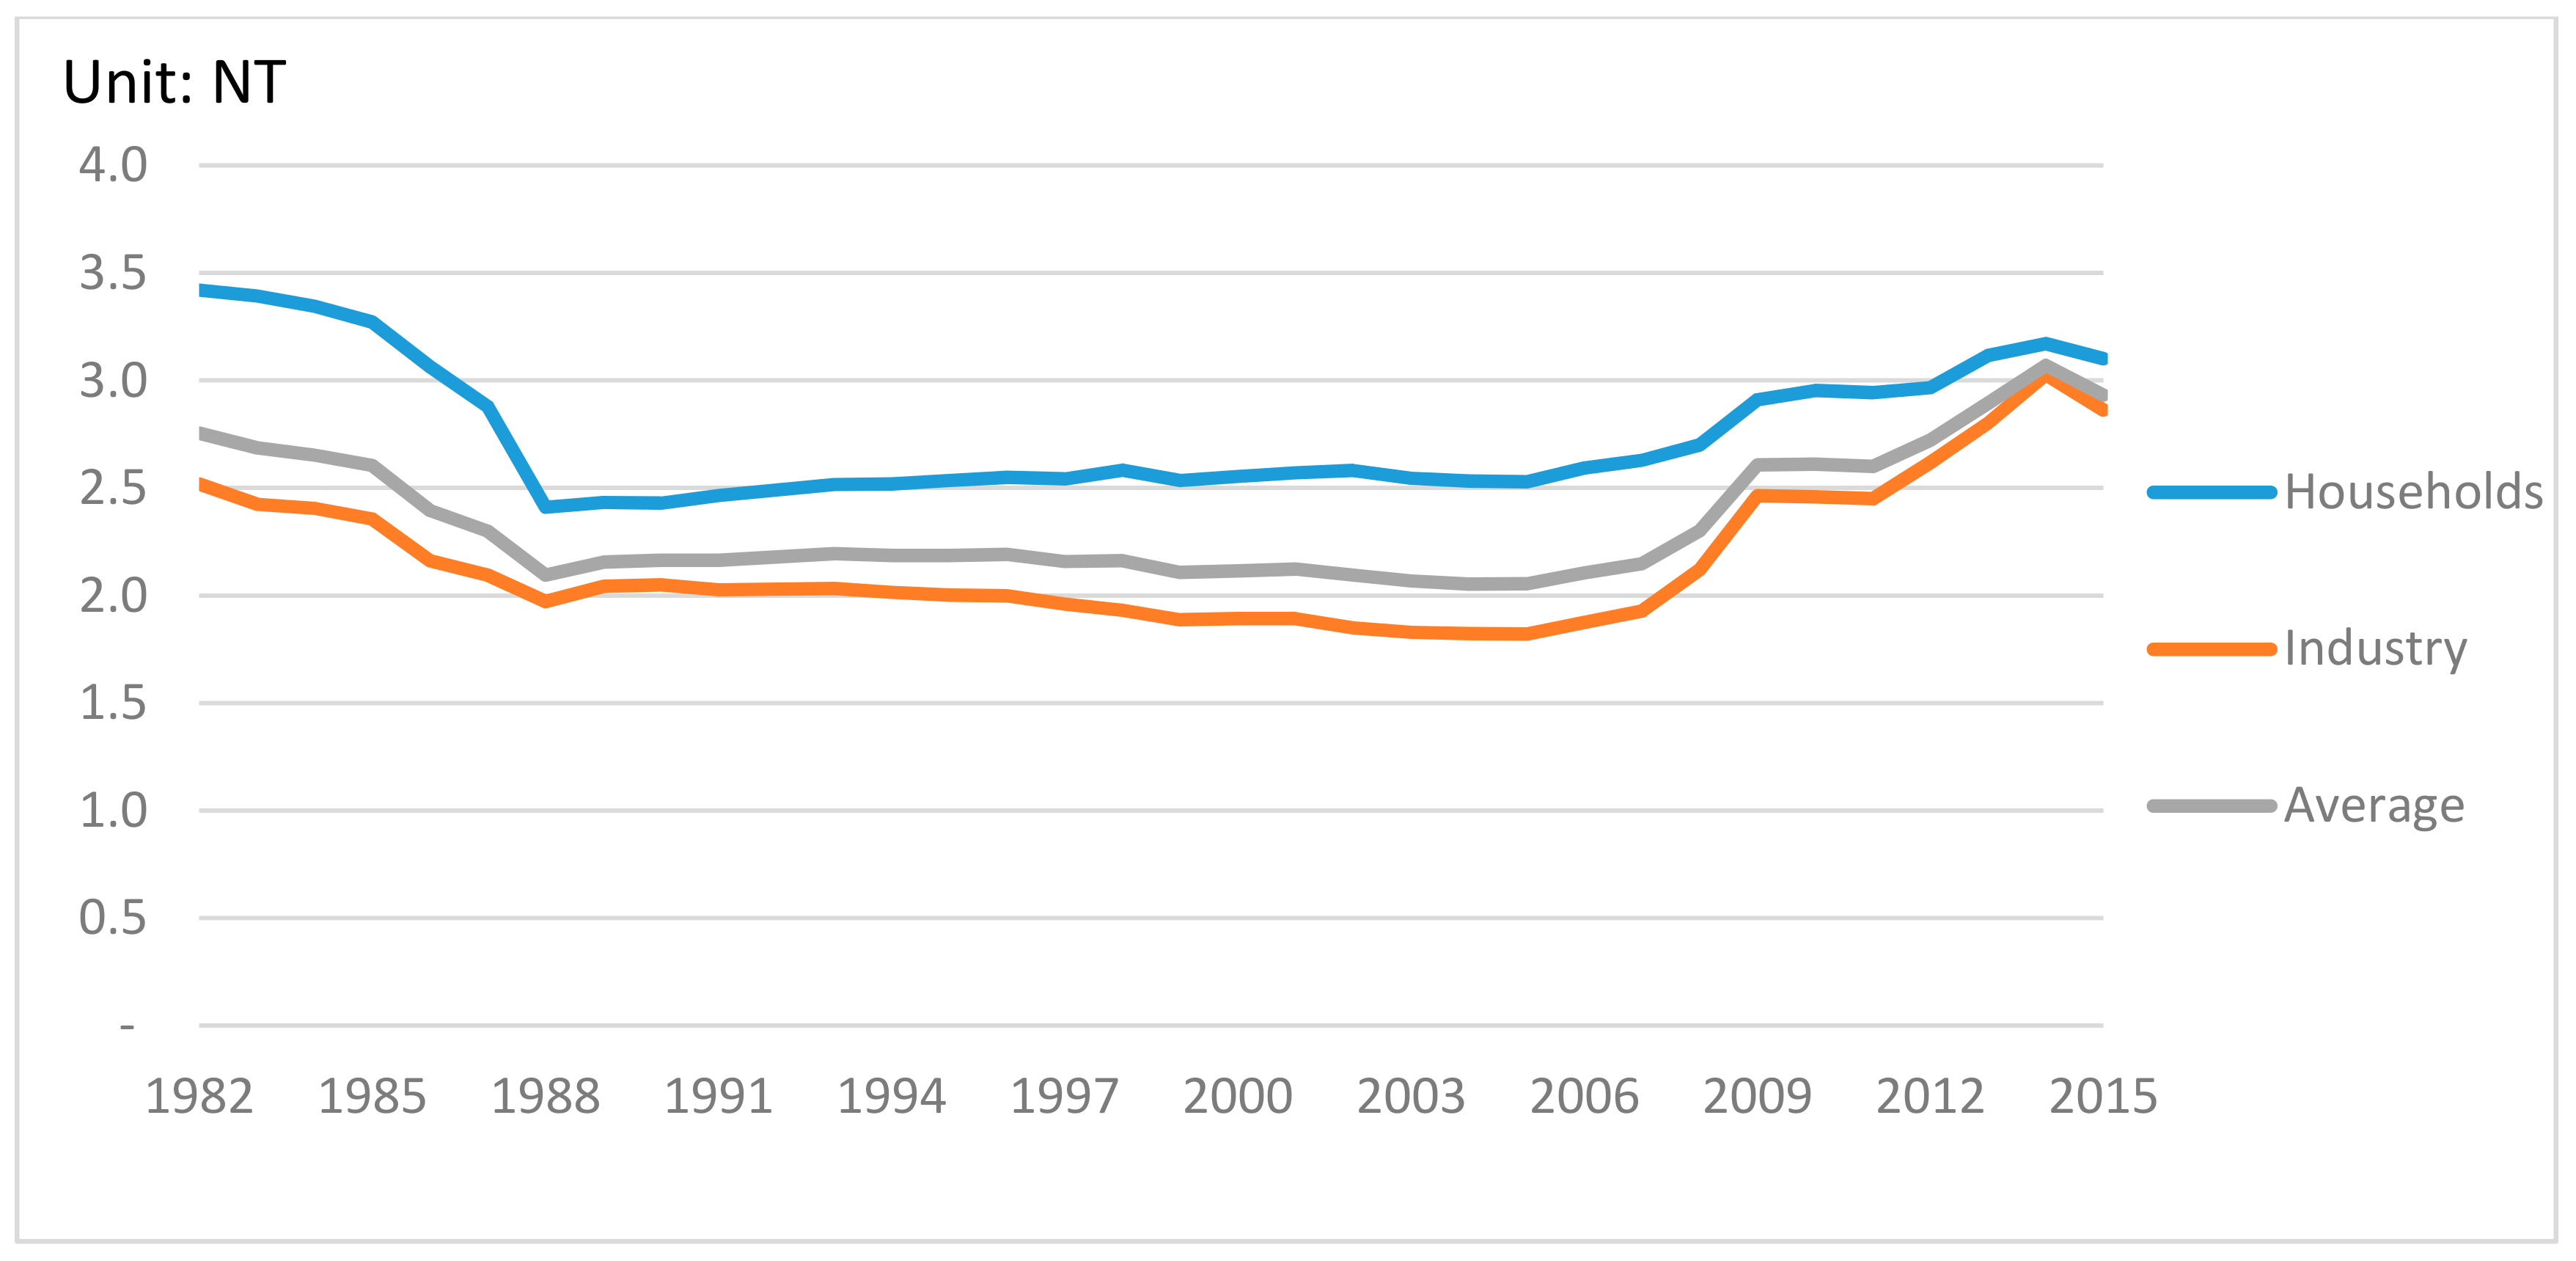
Since 1999, the privatization of the electrical utility industry has been implemented with the aim of improve power generation efficiencies in Taiwan. However, all the electricity produced by private firms must be sold to Taiwan Power Company (the public monopoly) at a regulated (contracted) price. The selling price of electricity is still determined by Taiwan Power Company on behalf of the government. Figure 2 shows the trend of Taiwan’s electricity price. This figure indicates that Taiwan’s electricity price kept a reducing trend from 1982 to 1987, then became flat during the period of 1987–2006, and started to rise during 2007–2015.
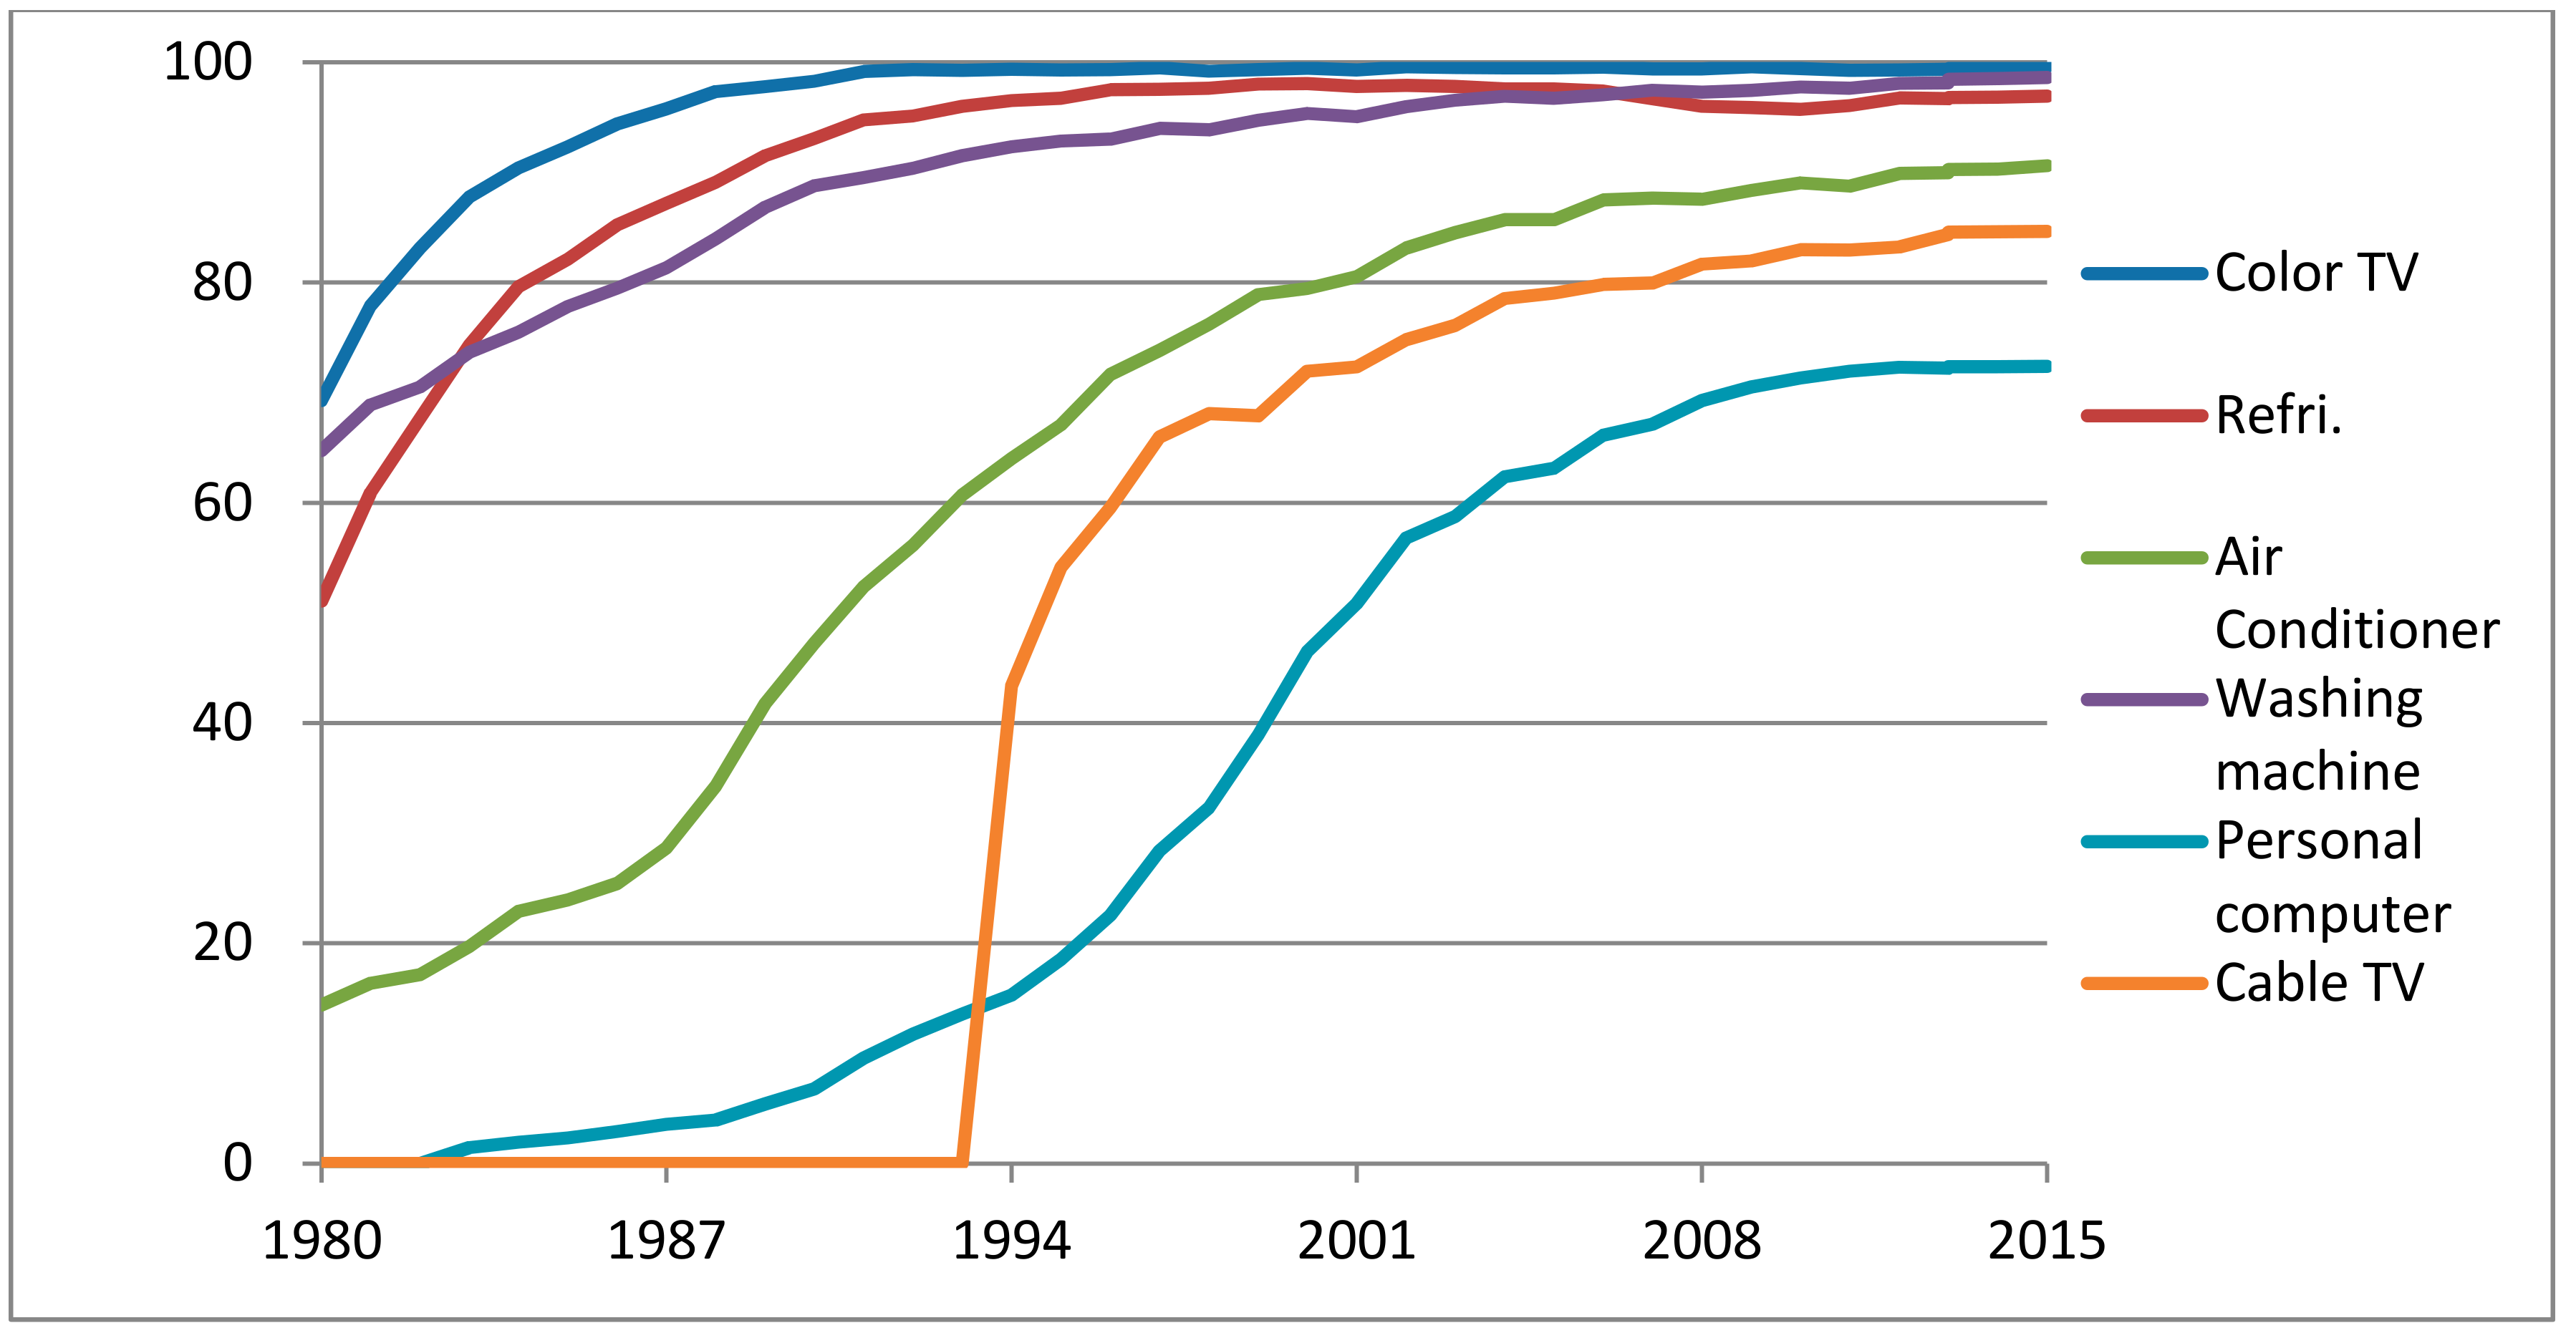
The installation rate of each appliance, residential space, the employment rate, the population, and per capita GDP are collected from the Directorate-General of Budget, Accounting and Statistics, Executive Yuan (2017). The average residential space is measured by the square meter for each household. According to the statistics of “Family Income and Expenditure Survey, 2015” published by the Directorate-General of Budget [28], TV sets, refrigerators and washing machines have been used in almost all households. As shown in Figure 3, the market penetration of these appliances increased from 77.9%, 60.93% and 68.88% in 1981 to 99.61%, 96.92%, and 98.61% in 2015 for TV, refrigerators, and washing machines, respectively. In 2015, each household in Taiwan on average owns 2.04 units of air conditioners, 1.53 units of TV, and 1.26 units of refrigerators. In contrast, the market penetration of air conditioners, personal computers, and cable TV has not managed to fill the needs for all households. Figure 3 indicates the penetration rates of electrical appliances from 1980 to 2015. We observed that the penetration rates of air conditioners increased from 14.40% in 1980 to 90.6% in 2015. In addition, only 1.46% of households owned personal computers (PC) in 1983, and 43.37% of households were equipped with cable TV in 1994. In 2015, 72.38% and 84.62% of households own PC and cable TV, respectively.
3. Results
3.1. The Factors Affecting Residential Electricity Consumption Based on Socioeconomic Perspective
The regression results for Equation (1) shown in Table 2 illustrate that the coefficients of all explanatory variables are statistically significant with expected signs, except for electricity prices and energy efficiency standards. Per capita GDP, employment rates, and residential space influence the per capita electricity consumption in a positive way, while the implementation of energy labeling schemes has a negative impact. An increase in each dollar of per capita GDP causes an additional electricity consumption of 0.06 kWh for each person. These results are in line with the results from the earlier literature. For example, Sarwar et al. [29] suggested that economic growth may promote electricity consumption in cities. The empirical study of Jamil and Ahmad [21] found that a growth in private expenditure causes the rising of electricity consumption in residential sectors. Yoo [30] investigated the causal relationship between electricity consumption and economic growth using the data of four countries—namely Indonesia, Malaysia, Singapore, and Thailand—for the period of 1971–2002 and found that economic growth may affect electricity consumption directly in these countries.
The variable of employment rates is also found to have a positive impact on per capita electricity consumption. This result coincides with some previous studies. For example, Gurgul and Lach [31] investigated the causal interdependences between electricity consumption and GDP in Poland using data from the period 2000–2009. They found that a causal relationship exists between total electricity consumption and GDP, as well as between total electricity consumption and employment. Narayan and Smyth [32] examined the relationship between electricity consumption, employment and real income in Australia and found that per capita GDP and employment have a positive impact on per capita electricity consumption. In addition to the study of Gurgul and Lach [31] and Narayan and Smyth [32], many researchers [33,34,35] also confirmed that the variable of the employment is also an important factor to affect energy consumption.
The variable of residential space is also found to have a positive influence on per capita consumption. Basically, bigger residential space implies bigger family sizes and, thus, the electricity demand for air-conditioning, cooking and cleaning is higher. The newly-built apartment buildings in Taiwan have resulted in many skyscrapers with more than 20 floors. Such kinds of buildings emphasize the importance of privacy, with high, sound-proof windows, which therefore requires a stronger cooling system. Some previous studies have found that the dwelling type [17,35,36,37] and the number of bedrooms [17,35] have a significant influence over residential electricity consumption.
The insignificant impact of electricity price on the electricity consumption also coincides with the findings of Jamil and Ahmad [21]. However, the result of the insignificant relationship between electricity price and consumption also contradicts some previous studies. For example, Ferreira et al. [38] examined the dynamic interaction among the energy prices of the competitor energy sources in a liberalized market using the data from the United Kingdom market and confirmed the existence of long-run relationships between energy prices before and after the liberalization. Sadorsky [39] developed a model to estimate the impacts of renewable energy price on consumption by the data from the Group of Seven (G7) countries and found that an increase in oil price has a small impact on renewable energy consumption. Kamerschen and Porter [40] found that the short-run price elasticity of electricity demand in the US residential sector ranged from −0.20 to −0.35 and the long-run price elasticity ranged from −0.3 to −0.8.
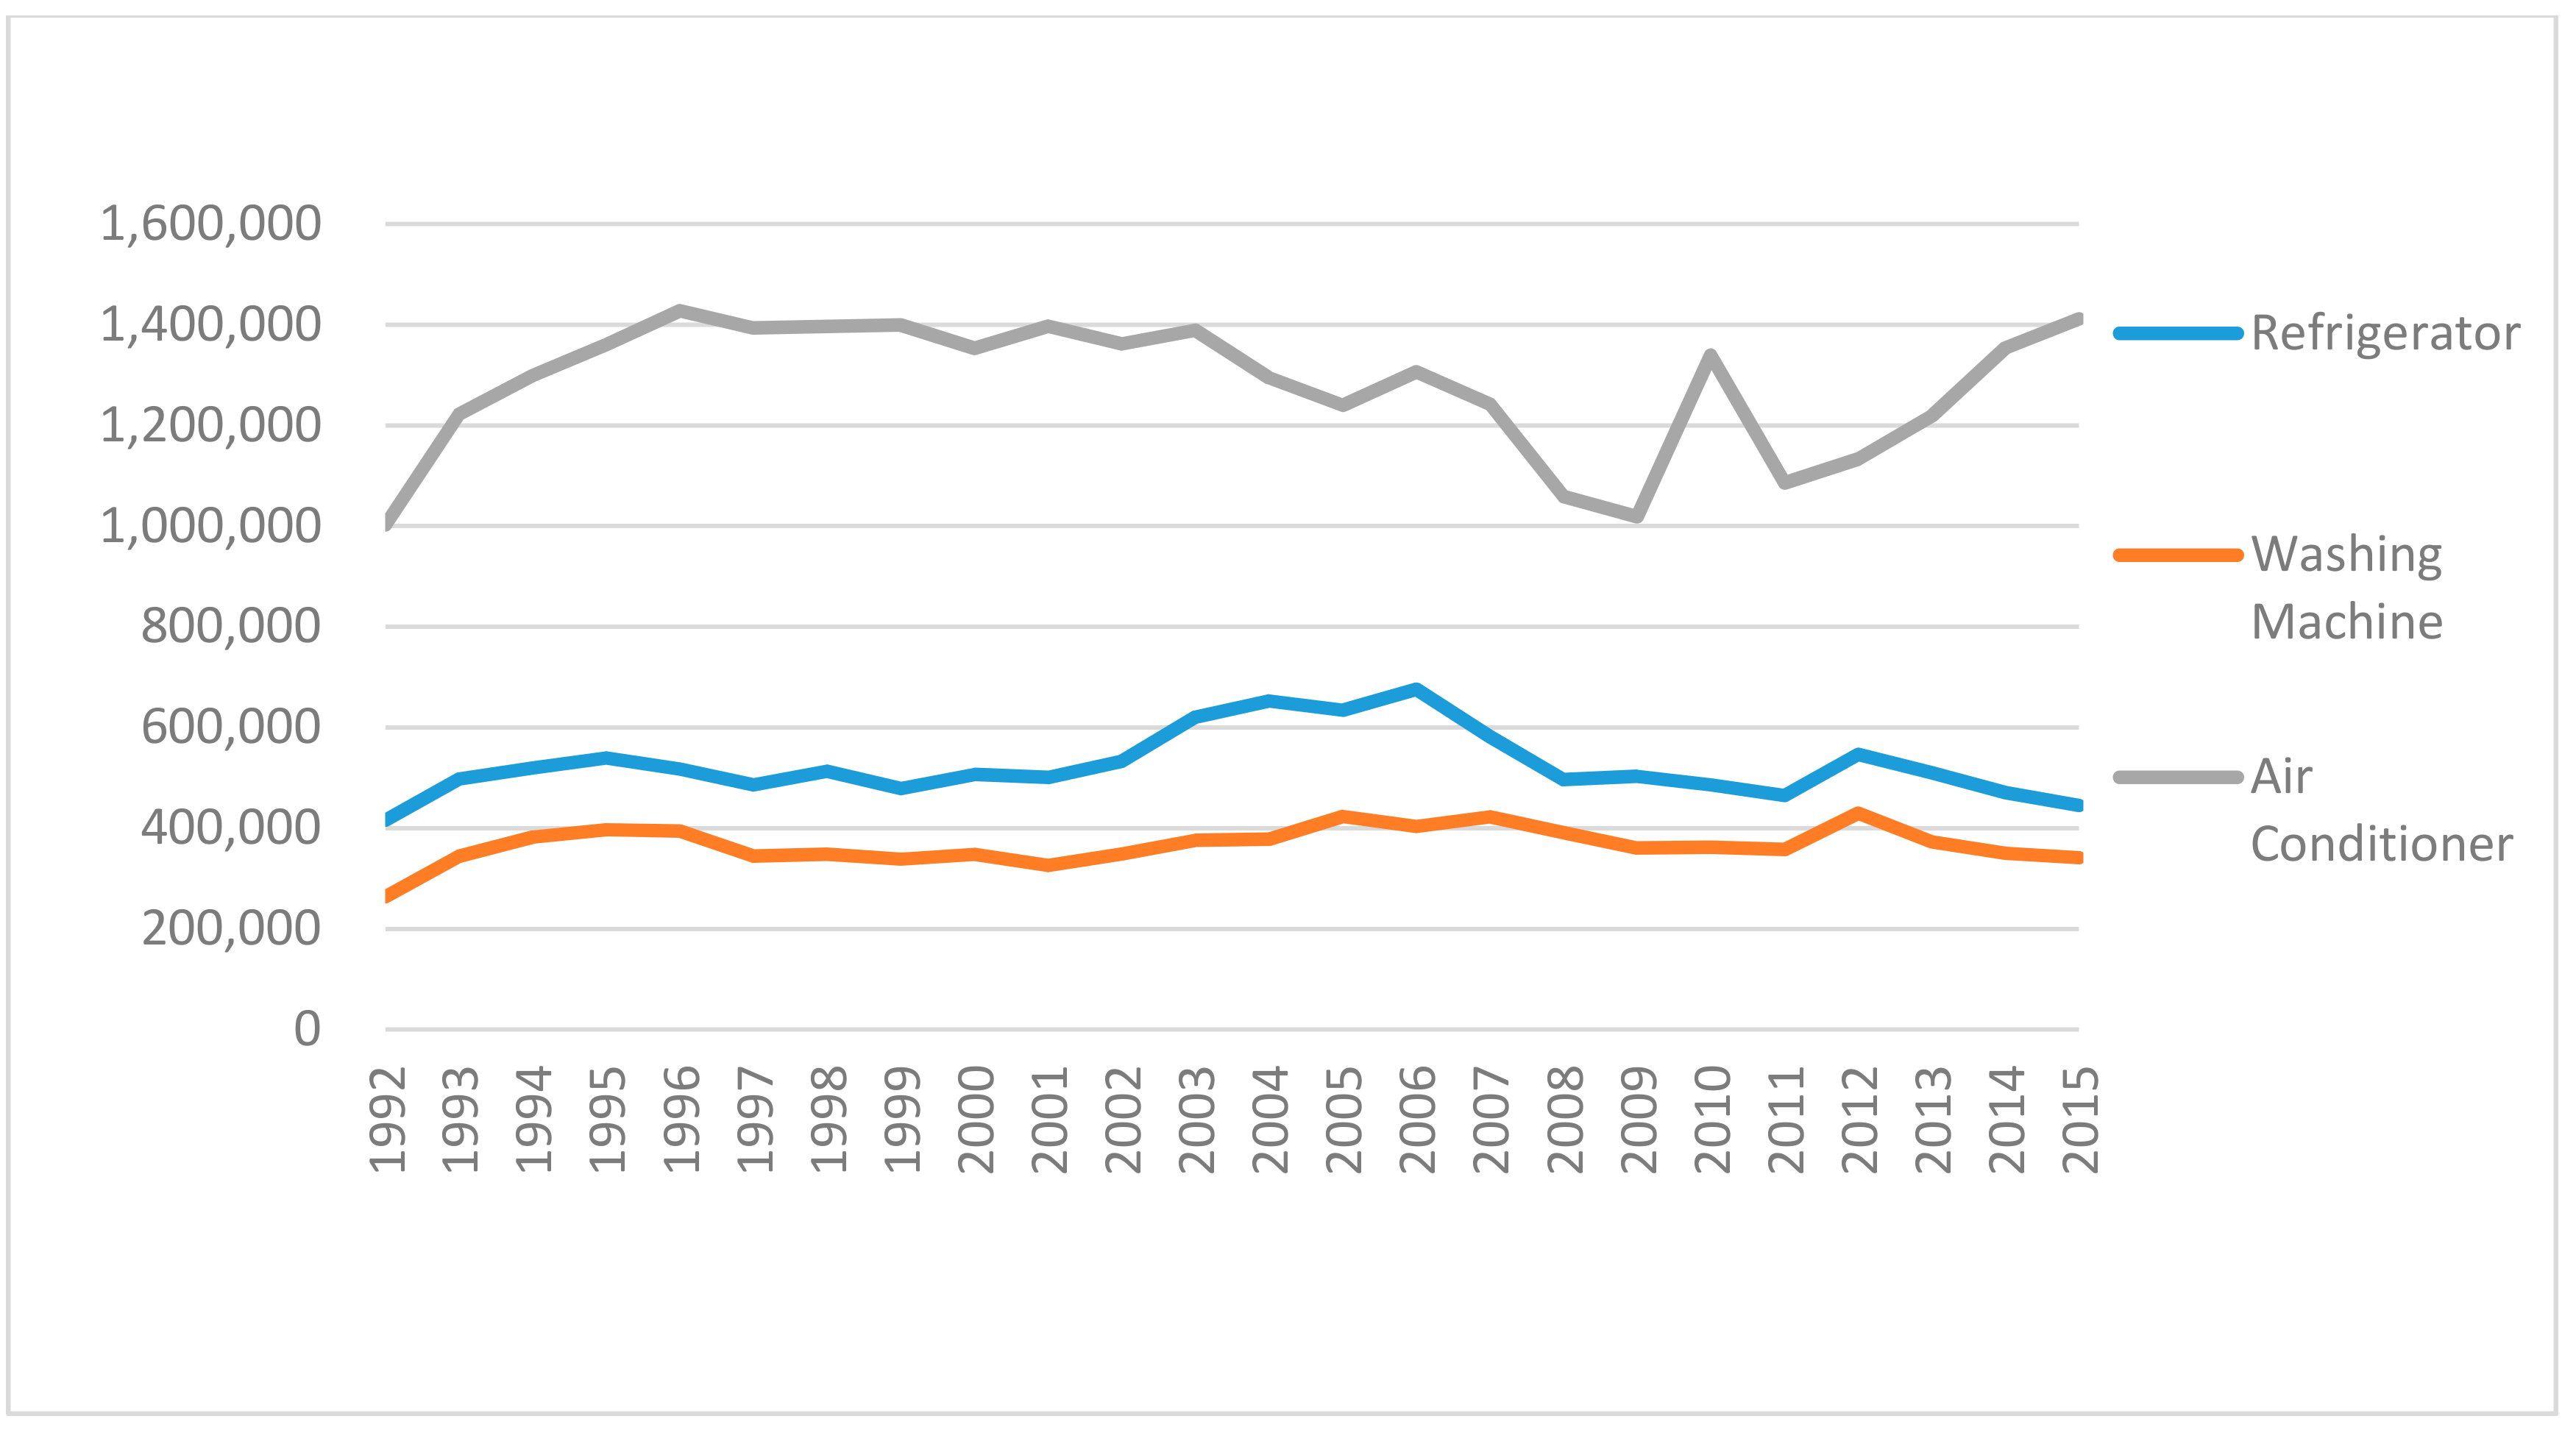
Comparisons of the trend of electricity consumption with the electricity price are shown in Figure 1 and Figure 2, respectively. We find that the electricity consumption kept a continual rising pattern but that the electricity price was more flat in the past two decades. It seems that electricity consumption in residential sectors is independent of electricity price. In other words, Taiwan’s electricity demand in residential sectors is more or less inelastic because of the limited choice of alternative fuels for household use. Some previous studies have found that electricity prices are commonly believed to influence the purchase timing of durable household appliances, such as air-conditioning and refrigerators [40]. However, as shown in Figure 4, the installation of household appliances including refrigerators, washing machines, and air conditioners in Taiwan are not found to have a significant relationship with electricity price. This is also an important reason to explain the insignificant role of electricity price to affect electricity consumption in Taiwan. The installations of refrigerators, washing machines, and air conditioners were 486,123 sets, 408,389 sets, and 458,273 sets in 1987, respectively [12]. In 2015, the number of installations of air conditioners were doubled to 1,365,122 sets, while that of washing machines slightly reduced to 316,232 sets, and that of refrigerators slightly increased to 428,005 sets.
In fact, the adjustment of electricity price is almost subject to political considerations, and electricity price is monopolized by the government in negligence of market mechanisms in Taiwan. It is therefore very difficult to employ electricity price as a tool to encourage energy-saving behaviors.
The implementation of energy labeling schemes is found to significantly encourage the reduction of electricity consumption of the residential sector. The Bureau of Energy (BOE), Ministry of Economic Affairs initiated the voluntary “Energy Label” program in 2006 to promote the deployment of a mechanism for energy efficiency technologies and to encourage manufacturers to invest in the research and development of high energy efficiency products through the application of market incentives. The energy labeling scheme currently operated in Taiwan depends on a voluntary commitment to engage in green consumption stemming from environmental concerns, and thus it may create competition among the manufacturers. Basically, it compares the energy efficiency of household appliances on a fair and equitable basis, and provides the resultant information for the potential buyer. The energy labeling scheme provides clear information for purchasing reference and thus encourage energy efficiency improvements. Currently, 36 product categories are available for appliances including TVs, washing machines, clothes dryers, air conditioners, fans, dehumidifiers, rice cookers, and fluorescent lamps, etc. A total of 5473 products with 339 brand names are available for selection [41].
On the other hand, the regulation of energy efficiency standards is found not have a high correlation with electricity consumption, although energy efficiency standards have been accepted as an effective tool in promoting energy efficiency of end users since the end of 1999 in Taiwan. Mekhilef et al. [42] indicated that energy efficiency is a way to achieve the goal of energy saving and it played a vital role by setting minimum requirements for the energy-efficient design of household appliances. The results, however, showed that the implementation of energy efficiency standards did not have a significant impact on electricity consumption. Energy efficiency standards are currently used to encourage the innovative redesign of household appliances in Taiwan. The application of energy efficiency standards has to establish the test procedure for rating based on technical considerations. In practice, the timing of the regulation of energy efficiency standards, in general, falls behind the diffusion and maturation of technology. This may explain why the regulation of energy efficiency standards does not affect energy consumption significantly.
3.2. The Results Based on the Direct Use Perspective
The calculation for the electricity consumption of each electrical appliance is ranked in Table 3. The results indicate that electricity consumption for lighting ranks first, followed by air-conditioning, cooking. and living recreation activities. In practice, lighting systems in the building consume 27.12% of residential electricity consumption. Room air conditioners, refrigerators, and rice cookers follow, accounting for 26.81%, 14.88% and 6.27% of residential electricity consumption, respectively.
Among the electrical appliances, each household installs 1180 W of lighting systems on average, including fluorescent lamps, table lamps, and incandescent lamps with working time of 3.5 h. The installation rate of fans and air conditioners are the top two highest. Each household installs 3.51 sets of fans and 2.04 sets of room air conditioners. As the temperature in a summer time reaches to 33–37 degree Celsius in Taiwan, comfort cooling is required in summer, and thus air conditioners and fans are popularly used in households. Following air conditioners, refrigerators, rice cookers and water dispensers rank third, fourth, and fifth as the highest electricity consumers, accounting for 14.88%, 6.27% and 5.69% of total residential electricity consumption, respectively. In addition, the wide use of information and communication technologies also affects electricity consumption profoundly, and thus the electricity consumption of PCs ranks at sixth highest. Currently, each household in Taiwan is equipped with 0.98 sets of PCs.
The top ten electricity-consuming appliances listed in Table 3, consisting of room air conditioners, refrigerators, rice cookers, water dispensers, TV sets, range hoods, fans, PCs, water heaters, and clothes washing machines, consume more than 70.24% of residential electricity consumption, and more than 97.36% if lighting systems is included (see Table 3). Therefore, the conservation strategy for electrical appliances may focus on the top 10 electrical appliances. The correlations between the installation rates of the top 10 electricity-consuming appliances and the residential electricity consumption, GDP, electricity price, employment rate and residential space are listed in Table 4.
The correlation coefficients between GDP and the market penetration of air conditioners, fan and the penetration rate of PCs and washing machines are positive. This implies that the increase in GDP may stimulate more installations of these appliances. In fact, the penetration of air conditioners, fans and PCs kept growing in the past decades. In contrast, the coefficients for some appliances are negative or even close to zero, such as TV sets, refrigerators, water dispensers, and range hoods. This result may be explained by the fact that the market penetration of these electrical appliances had reached to their saturation points before the end of last century. For example, the penetration rate of TV sets reached 99.29% in 1995 and remained between 99.17% and 99.55% during 1995–2015, as shown in Figure 3.
The correlation coefficient with electricity prices and employment rates are positive for some electrical appliances, including air conditioners, but are negative for some others, like range hoods. This implies that employment rates may provide little force to affect the installations of electrical appliances. Household space may play a positive role in affecting the installation of electrical appliances in households as most electrical appliances keep a positive relationship with household space.
Table 4 also indicates that the penetration of air conditioners, personal computers and washing machines have strong relationships with residential electricity consumption (i.e., higher than 0.9287). This implies that the installation of these three electrical appliances continues to grow. The government has to focus on these appliances and present programs to curb the growth of the three electrical appliances or to reduce their working time. The correlation coefficients of some electrical appliances, such as TV sets, refrigerators, rice cookers, and water dispensers, are very low, or even near zero. This implies that the installations of these electrical appliances are independent of residential electricity consumption due to a saturated installation and almost a fixed working time. The market for TV sets, refrigerators, rice cookers and water dispensers is maturated and difficult to grow. Considering the consumption characteristics, this paper suggests that the improvement strategy for electricity saving should focus on air conditioners, washing machines and PCs.
4. Discussion
The results of the correlation test find that more GDP and bigger residential space may lead to higher living standards and a higher rate of installation of electrical appliances, and eventually result in more residential electricity consumption. The results revealed by the regression model of the socioeconomic perspective also support the significantly positive impact of GDP, employment rates, and residential space on residential electricity consumption. Integrating the two perspectives, this paper suggests that the development in socioeconomic status causes rises in living standards, and eventually stimulates an increased electricity demand, especially if alternative energy at home is not available. This implies that life-style, due to the economic affluence of households, may play a vital role in the demand of electricity. The findings of this paper coincide with some previous studies, as many researchers also indicate that the amount of household appliances may play an important role in affecting electricity consumption in the residential sector [43,44,45].
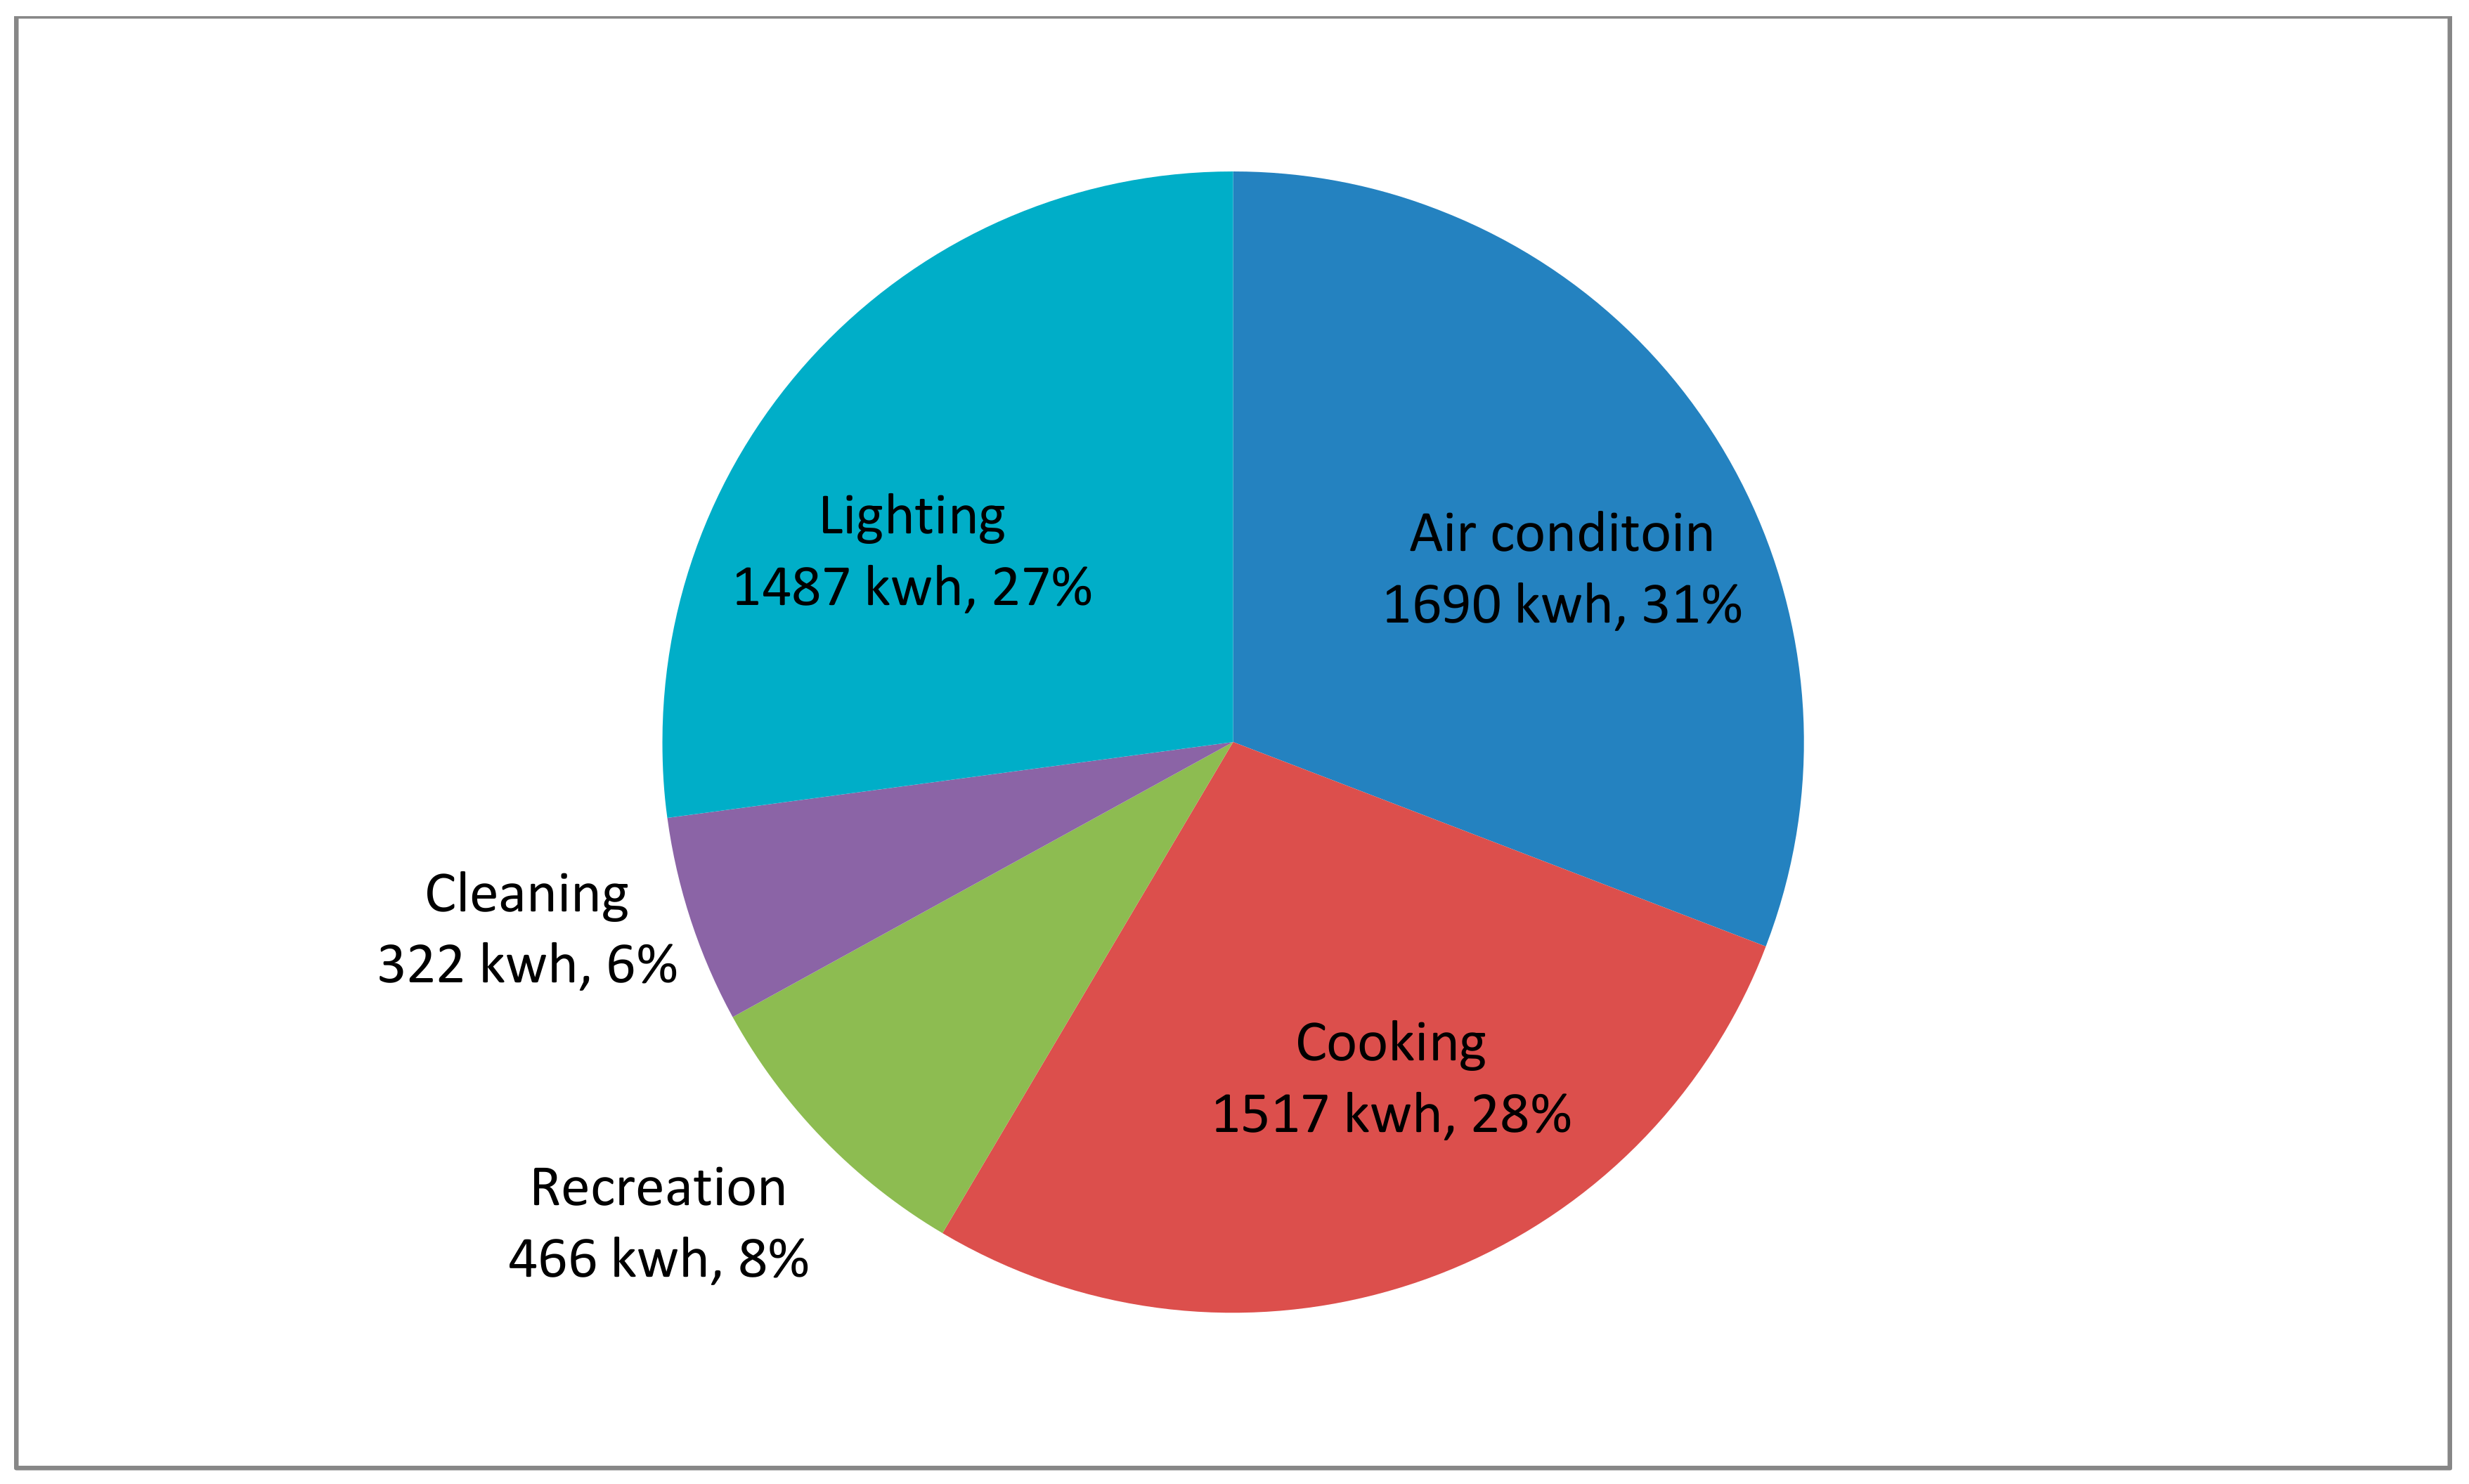
In addition, this paper divides appliances into five patterns including (1) comfort, (2) lighting, (3) cooking, (4) recreation, and (5) cleaning, according to the function of household appliances. The electricity consumption for each pattern of electrical appliances is depicted in Figure 5.
- (1)
- The appliances for comfort consist of room air conditioners, de-humidifiers, air cleaners, and fans. This pattern of appliances aims to reduce the room temperature as well as air infiltration/ventilation to maintain the living space at a comfortable temperature and air quality. The electricity consumption for air conditioning use is estimated to be 1690 kWh per year for each household in the residential sector, accounting for 30.83% of residential electricity consumption.
- (2)
- The appliances for cooking include refrigerators, rice cookers, micro ovens, toasters, juicers, and water dispensers and consume 1517 kWh (27.66%) each year for each household, ranking second highest for electricity consumption among the five patterns. The electricity consumption of refrigerators and rice cookers accounts for 14.88% and 6.27% of residential energy consumption, contributing to about 77% of energy consumption for cooking.
- (3)
- Lighting systems provide adequate lighting, including fluorescent lamps and light emitting diode (LED) lamps. The energy consumption for lighting reaches 1487 kWh per year for each household, accounting for 27% of total residential energy consumption. Taiwan has implemented a policy to stop the production of incandescent lamps and encourage consumers to use energy saving lamps such as LED lamps, thereby aiming to reduce energy consumption for lighting by 30–80%. The new regulation on the lighting efficiency of incandescent lamps was enacted from January 2012. As incandescent lamps are extremely energy inefficient, almost all Organization for Economic Co-operation and Development (OECD) governments and many non-OECD countries have adopted a policy to stop producing standard incandescent lamps since the end of 2006 [46].
- (4)
- Recreational appliances include personal computers (PC), TV, and audio equipment, consuming 466 kWh for each household each year and accounting for 8.50% of residential electricity consumption. The gradual decreasing costs for using network systems increase the working hours of PCs. More and more people use the Internet with personal computers, which are quite commonly seen now.
- (5)
- Cleaning-use products include washing machines, range hoods, clothes dryers, dish dryers, electric iron, and water heaters. The installation rates of washing machines and dryers are 1.0 and 0.17 units/household in 2015 in Taiwan, respectively. The operation rate is very low for the cleaning-use appliances, and thus the electricity consumption for this pattern of appliances is only 322 kWh per year, accounting for 5.89% of residential electricity consumption.
Among the five patterns, the electricity consumption of electrical appliances for comfort ranked top. As the penetration of these appliances maintains a high positive relationship with both GDP and residential electricity consumption, it may potentially grow in installation and electricity consumption. The electrical appliances for cooking, lighting systems and cleaning uses are necessities for modern societies, but the potential for these appliances to grow is low, as their relationships with socioeconomic variables and residential electricity consumption are low. The electricity consumption of recreational appliances ranks fourth among the five patterns, accounting for 8% only. Thus, this paper suggests that the electricity saving program may select this pattern of electrical appliances as the priority for future improvement in both the installation and energy efficiency. Based on individual appliances, this paper suggests that air conditioners, washing machines and PCs may be selected as the top priority for electricity saving due to their high positive relationship with residential electricity consumption. Incentive programs may be imposed to improve the purchase of energy efficiency products through relevant energy labeling schemes.
Energy efficiency standards and energy labeling schemes, together with incentive mechanisms, have been used to encourage green consumption and innovative redesign of household appliances in many countries [47]. Currently, Taiwan has employed a great number of policy instruments including electricity price adjustment, the implementation of energy labeling schemes, and the regulation of efficiency standards. Purchasers are granted to receive a rebate for some categories of selected, labeled products, including air conditioners, washing machines, and refrigerators in a given period. For example, TV purchasers will receive a rebate of NT 2000 for each set. As energy label system is found to have a significant impact on residential electricity consumption, this paper suggests that the government may consider to promote the uses of labeling systems for more electrical appliances without sacrificing the living standard.
5. Conclusions
Due to climate changes and limited supplies of exhaustible energy resources, the energy policies in many countries have focused on the efficient use of electricity in the residential sector. In general, the adjustment of electricity price is employed to encourage energy saving behavior. This paper, however, finds that the electricity price does not significantly affect per capita electricity consumption. In contrast, the implementation of energy labeling schemes provides a significant reduction in electricity consumption, while GDP, employment rates, and residential space may lead to an increase in residential electricity consumption. As the energy label system may provide useful information to identify energy efficiency products for purchasing references, the promotion of the energy label system may offset the rising demand from the increased living standards involving economic aspects.
The energy label system currently operating in Taiwan is a voluntary scheme, and there is no pressure on electrical appliance manufacturers to apply. In order to increase the market shares of labeled household appliances, we suggest that mandatory energy-saving measures including mandatory labeling schemes may encourage the renovation of electrical appliances together with subsidies for products that are certified and labeled with a certificate. These measures would encourage conservation or energy efficiency investments.
Furthermore, the promotion of the energy label is required to reinforce its validity and to attract purchasers’ trust. The relevant information revealed by the energy label should be perceived as trustworthy. Comprehensive and quantitative information is required to trigger a positive purchase behavior of green consumption. The energy label system may need to revise its marketing techniques to provide more detailed information on the labeled stick, and to publish the pamphlet involving the labeled products for purchasing references; for example, a refrigerator with an energy label is at least 15% more efficient than the regulated standard. Such information may attract consumers to engage in green consumption.
This study provides some information on domestic electricity usage patterns and examines the factors affecting Taiwan’s domestic electricity consumption. Results from this study find that the implementation of labeling schemes significantly affects the electricity consumption. The results derived in this paper may serve as an important reference material for the government to develop its energy conservation policy, integrating with regulations of energy efficiency standards and energy labeling schemes.
Conflicts of Interest
The author declares no conflict of interest.
References
- Lü, X.; Lu, T.; Kibert, C.J.; Viljanen, M. Modeling and forecasting energy consumption for heterogeneous buildings using a physical-statistical approach. Appl. Energy 2015, 144, 261–275. [Google Scholar] [CrossRef]
- Verdejo, H.; Awerkin, A.; Becker, C.; Olguin, G. Statistic linear parametric techniques for residential electric energy demand forecasting. A review and an implementation to Chile. Renew. Sustain. Energy Rev. 2017, 74, 513–521. [Google Scholar] [CrossRef]
- Aydinalp, M.; Ugursal, V.I.; Fung, A.S. Modeling of the appliance, lighting, and spacecooling energy consumptions in the residential sector using neural networks. Appl. Energy 2002, 71, 87–110. [Google Scholar] [CrossRef]
- Fan, J.; Zhang, Y.; Wang, B. The impact of urbanization on residential energy consumption in China: An aggregated and disaggregated analysis. Renew. Sustain. Energy Rev. 2017, 75, 220–233. [Google Scholar] [CrossRef]
- Swan, L.G.; Ugursal, V.I. Modeling of end-use energy consumption in the residential sector: A review of modeling techniques. Renew. Sustain. Energy Rev. 2009, 13, 1819–1835. [Google Scholar] [CrossRef]
- Zhang, Y.; Zhang, H.; Yang, Z.; Li, J.; Yin, X.; Liu, G.; Su, M. Analysis of urban energy consumption in carbon metabolic processes and its structural attributes: A case study for Beijing. J. Clean. Prod. 2015, 103, 884–897. [Google Scholar] [CrossRef]
- Kondo, K. Energy and exergy utilization efficiencies in the Japanese residential/commercial sectors. Energy Policy 2009, 37, 3475–3483. [Google Scholar] [CrossRef]
- Dintchev, O.D.; Calmeyer, J.E.; Delport, G.J. Efficient and sustainable usage of electricity in South Africa: The role of the tertiary education institutions. Eng. Sci. Educ. J. 2000, 9, 53–59. [Google Scholar] [CrossRef]
- Zhang, C.; Zhou, K.; Yang, S.; Shao, Z. On electricity consumption and economic growth in China. Renew. Sustain. Energy Rev. 2017, 76, 353–368. [Google Scholar] [CrossRef]
- Zhang, C.; Zhang, M.; Zhang, N. CO2 Emissions from the Power Industry in the China’s Beijing-Tianjin-Hebei Region: Decomposition and Policy Analysis. Pol. J. Environ. Stud. 2017, 26, 903–916. [Google Scholar] [CrossRef]
- Nilsson, A.; Stoll, P.; Brandt, N. Assessing the impact of real-time price visualization on residential electricity consumption, costs, and carbon emissions. Resour. Conserv. Recycl. 2017, 124, 152–161. [Google Scholar] [CrossRef]
- Bureau of Energy MOEA (BOE). Energy Statistic Handbook 2015; BOE, MOEA: Taipei, Taiwan, 2017.
- Fu, K.S.; Allen, M.R.; Archibald, R.K. Evaluating the relationship between the population trends, price, heat waves, and the demand of energy consumption in cities. Sustainability 2015, 7, 15284–15301. [Google Scholar] [CrossRef]
- Paatero, J.V.; Lund, P.D. A model for generating household electricity load profiles. Int. J. Energy Res. 2005, 30, 273–290. [Google Scholar] [CrossRef]
- O’Doherty, J.; Lyons, S.; Tol, R. Energy-using appliances and energy-saving features: Determinants of ownership in Ireland. Appl. Energy 2008, 85, 650–662. [Google Scholar] [CrossRef]
- Bélaïd, F.; Abderrahmani, F. Electricity consumption and economic growth in Algeria: A multivariate causality analysis in the presence of structural change. Energy Policy 2013, 55, 286–295. [Google Scholar] [CrossRef]
- McLoughlin, F.; Duffy, A.; Conlon, M. Characterising domestic electricity consumption patterns by dwelling and occupant socio-economic variables: An Irish case study. Energy Build. 2012, 48, 240–248. [Google Scholar] [CrossRef]
- Dahlquist, E.; Vassileva, I.; Thorin, E.; Wallin, F. How to save energy to reach a balance between production and consumption of heat, electricity and fuels for vehicles. Energy 2012, 46, 16–20. [Google Scholar] [CrossRef]
- Bernstein, R.; Madlener, R. Short- and long-run electricity demand elasticities at the subsectoral level: A cointegration analysis for German manufacturing industries. Energy Econ. 2015, 48, 178–187. [Google Scholar] [CrossRef]
- Runa, N. Price sensitivity of residential energy consumption in Norway. Energy Econ. 1999, 21, 493–515. [Google Scholar]
- Jamil, F.; Ahmad, E. The relationship between electricity consumption, electricity prices and GDP in Pakistan. Energy Policy 2010, 38, 6016–6025. [Google Scholar] [CrossRef]
- Zhang, Y.; Peng, H. Exploring the direct rebound effect of residential electricity consumption: An empirical study in China. Appl. Energy 2017, 196, 132–141. [Google Scholar] [CrossRef]
- Rahman, S.M.; Miah, M.D. The impact of sources of energy production on globalization: Evidence from panel data analysis. Renew. Sustain. Energy Rev. 2017, 74, 110–115. [Google Scholar] [CrossRef]
- Dos Santos, A.H.C.; Fagá, M.T.W.; dos Santos, E.M. The risks of an energy efficiency policy for buildings based solely on the consumption evaluation of final energy. Int. J. Electr. Power Energy Syst. 2013, 44, 70–77. [Google Scholar] [CrossRef]
- Fuks, M.; Salazar, E. Applying models for ordinal logistic regression to the analysis of household electricity consumption classes in Rio de Janeiro, Brazil. Energy Econ. 2008, 30, 1672–1692. [Google Scholar] [CrossRef]
- Saidur, R. Energy consumption, energy savings, and emission analysis in Malaysian office buildings. Energy Policy 2009, 37, 4104–4113. [Google Scholar] [CrossRef]
- Taiwan Power Company. 2017. Available online: http://www.taipower.com.tw/ (accessed on 1 March 2017).
- Directorate-General of Budget, Accounting & Statistics. The Survey of Household Income and Expenditure in 2015. 2017. Available online: http://eng.stat.gov.tw/np.asp?ctNode=1542 (accessed on 15 March 2017).
- Sarwar, S.; Chen, W.; Waheed, R. Electricity consumption, oil price and economic growth: Global perspective. Renew. Sustain. Energy Rev. 2017, 76, 9–18. [Google Scholar] [CrossRef]
- Yoo, S.H. The causal relationship between electricity consumption and economic growth in the ASEAN countries. Energy Policy 2006, 34, 3573–3582. [Google Scholar] [CrossRef]
- Gurgul, H.; Lach, L. The electricity consumption versus economic growth of the Polish economy. Energy Econ. 2012, 34, 500–510. [Google Scholar] [CrossRef] [Green Version]
- Narayan, P.K.; Smyth, R. Electricity consumption, employment and real income in Australia: Evidence from multivariate Granger causality tests. Energy Policy 2005, 33, 1109–1116. [Google Scholar] [CrossRef]
- Niederjohn, M.S. The effect of regulatory reform on employment and earnings in the U.S. electricity sector. Electr. J. 2004, 17, 76–86. [Google Scholar] [CrossRef]
- Shahbaz, M.; Tang, C.F.; Shabbir, M.S. Electricity consumption and economic growth nexus in Portugal using cointegration and causality approaches. Energy Policy 2011, 39, 3529–3536. [Google Scholar] [CrossRef] [Green Version]
- Jones, R.V.; Lomas, K.J. Determinants of high electrical energy demand in UK homes: Socio-economic and dwelling characteristics. Energy Build. 2015, 101, 24–34. [Google Scholar] [CrossRef] [Green Version]
- Kavousian, A.; Rajagopal, R.; Fischer, M. Determinants of residential electricity consumption: Using smart meter data to examine the effect of climate, building characteristics, appliance stock, and occupants’ behavior. Energy 2013, 55, 184–194. [Google Scholar] [CrossRef]
- Baker, K.J.; Rylatt, R.M. Improving the prediction of UK domestic energy-demand using annual consumption-data. Appl. Energy 2008, 85, 475–482. [Google Scholar] [CrossRef]
- Ferreira, P.; Soares, I.; Madalena, A. Liberalisation, consumption heterogeneity and the dynamics of energy prices. Energy Policy 2005, 33, 2244–2255. [Google Scholar] [CrossRef] [Green Version]
- Sadorsky, P. Renewable energy consumption, CO2 emissions and oil prices in the G7 countries. Energy Econ. 2009, 31, 456–462. [Google Scholar] [CrossRef]
- Kamerschen, D.R.; Porter, D.V. The demand for residential, industrial, and total electricity, 1973–1998. Energy Econ. 2004, 26, 87–100. [Google Scholar] [CrossRef]
- Energy Label. What Is Energy Label? 2017. Available online: http://www.energylabel.org.tw/intro_en/dept1/list.asp (accessed on 1 March 2017).
- Mekhilef, S.; Saidur, R.; Sais, S.M.; Hong, P.H.; Islam, M.R. Techno-economic evaluation of energy efficiency measures in high rise residential buildings in Malaysia. Clean Technol. Environ. Policy 2014, 16, 23–35. [Google Scholar] [CrossRef]
- Kavousian, A.; Rajagopal, R.; Fischer, M. Ranking appliance energy efficiency in households: Utilizing smart meter data and energy efficiency frontiers to estimate and identify the determinants of appliance energy efficiency in residential buildings. Energy Build. 2015, 99, 220–230. [Google Scholar] [CrossRef]
- Liao, H.; Liu, Y.; Gao, Y.; Hao, Y.; Ma, X.W.; Wang, K. Forecasting residential electricity demand in provincial China. Environ. Sci. Pollut. Res. 2017, 24, 6414–6425. [Google Scholar] [CrossRef] [PubMed]
- Gajowniczek, K.; Zabkowski, T. Electricity forecasting on the individual household level enhanced based on activity patterns. PLoS ONE 2017, 12. [Google Scholar] [CrossRef] [PubMed]
- Waide, P. Phase out of Incandescent Lamps: Implications for International Supply and Demand for Regulatory Compliant Lamps; International Energy Agency: Paris, France, 2010; pp. 1–86. [Google Scholar]
- Abbaspour, M.; Karbassi, A.; Asadi, M.K.; Moharamnejad, N.; Khadivi, S.; Moradi, M.A. Energy Demand Model of the Household Sector and Its Application in Developing Metropolitan Cities (Case Study: Tehran). Pol. J. Environ. Stud. 2013, 22, 319–329. [Google Scholar]
Figure 1.
Taiwan’s electricity consumption (1987–2015), unit: GWh.

Figure 2.
The trend of electricity price in Taiwan, unit: NT.

Figure 3.
Penetration rates of electrical appliances, unit: %.

Figure 4.
The installations of home appliances in Taiwan (1992–2015), unit: set.

Figure 5.
The composition of yearly electricity consumption per household in the residential sector by the pattern of end-use.
Figure 5.
The composition of yearly electricity consumption per household in the residential sector by the pattern of end-use.


Table 1.
Energy efficiency standards of the selected electrical appliances.
| End-Use | Date Issued | Date Enacted | Technology for Standards |
|---|---|---|---|
| Fluorescent lamps | December 1999 | January 2001 | Lighting efficiency is regulated and ranges from 44 lm/W to 91 lm/W. |
| Refrigerator | December 1999 | January 2001 (First stage) | The energy factor (EF) is regulated. |
| -fan type | E.F. = V/(0.061V + 40) | ||
| -direct cooling | E.F. = V/(0.053V + 30.9) | ||
| -for refrigeration only | E.F. = V/(0.053V + 24.7) | ||
| Refrigerator | December 1999 | January 2003 (second stage) | The EF is regulated. |
| <400 L, fan type | E.F. = V/(0.058V + 38.3) | ||
| ≥400 L, fan type | E.F. = V/(0.053V + 35.2) | ||
| <400 L, direct cooling | E.F. = V/(0.050V + 29.6) | ||
| ≥400 L, direct cooling | E.F. = V/(0.046V + 27.2) | ||
| For refrigeration only | E.F. = V/(0.050V + 23.7) | ||
| Refrigerator | January 2006 | January 2011 | The EF is updated and marked up. |
| <400 L, fan type | E.F. = V/(0.037V + 24.3) | ||
| ≥400 L, fan type | E.F. = V/(0.031V + 21.0) | ||
| <400 L, direct cooling | E.F. = V/(0.033V + 19.7) | ||
| ≥400 L, direct cooling | E.F. = V/(0.029V + 17.0) | ||
| For refrigeration only | E.F. = V/(0.033V + 15.8) | ||
| Freezer, water cooled | September 2001 | January 2003 | The energy efficiency ratio (EER) is regulated. |
| -compressed compressor | |||
| <150 RT | EER = 3.50 | ||
| ≥150 RT, ≤500 RT | EER = 3.60 | ||
| >500 RT | EER = 4.0 | ||
| Freezer, water cooled | September 2001 | January 2003 | The EER is regulated. |
| -centrifugal compressor | |||
| <150 RT | EER = 4.30 | ||
| ≥150 RT, ≤300 RT | EER = 4.77 | ||
| >300 RT | EER = 4.77 | ||
| Freezer, air-cooled | September 2001 | January 2003 | EER = 2.40 |
| Freezer, water cooled | September 2001 | January 2005 | The value of EER is marked up. |
| -compressed compressor | |||
| <150 RT | EER = 3.83 | ||
| ≥150 RT, ≤500 RT | EER = 4.21 | ||
| >500 RT | EER = 4.73 | ||
| Freezer, water cooled | September 2001 | January 2005 | The value of EER is marked up. |
| -centrifugal compressor | |||
| <150 RT | EER = 4.30 | ||
| ≥150 RT, ≤300 RT | EER = 4.77 | ||
| >300 RT | EER = 5.25 | ||
| Freezer, air-cooled | September 2001 | January 2005 | EER = 2.40 |
| Wall type air conditioner | September 2001 | January 2002 | The energy efficiency ratio (EER) is |
| -single type | regulated. | ||
| <2.3 kw | EER = 2.71 | ||
| ≥2.3 kw, ≤4.1 kw | EER = 2.77 | ||
| >4.1 kw | EER = 2.60 | ||
| Wall type air conditioner | September 2001 | January 2002 | The EER is regulated. |
| -separate type | |||
| ≤4.1 kw, general | EER = 2.97 | ||
| ≤4.1 kw, frequency inverter | EER = 2.77 | ||
| >4.1 kw | EER = 2.73 | ||
| Box type air conditioner | September 2001 | January 2002 | The EER is regulated. |
| -air-cooled | EER = 2.84 | ||
| -water cooled | EER = 3.69 | ||
| Dehumidifier | March 2008 | March 2011 | The energy factor is regulated. |
| Rated capacity | |||
| <6 L/day | 1.1 L/kwh | ||
| ≥6 L/day, ≤12 L/day | 1.2 L/kwh | ||
| >12 L/day | 1.4 L/kwh |
Table 2.
Estimation results of Equation (1).
| Coefficient | Standard Error | T Statistics | p-Value | |
|---|---|---|---|---|
| −1082.59 | 743.54 | −1.46 | 0.16 | |
| (GDP) | 0.06 *** | 0.01 | 4.27 | 0.00 |
| (ele. price) | −172.71 | 171.80 | −1.01 | 0.33 |
| (employment) | 0.70 ** | 0.30 | 2.30 | 0.03 |
| (household size) | 55.73 ** | 22.10 | 2.52 | 0.02 |
| (label system) | −194.92 ** | 76.42 | −2.55 | 0.02 |
| (eff. standard) | −69.60 | 80.27 | −0.87 | 0.40 |
| Observation no. | 29 | |||
| R square | 0.779 | |||
| Adjusted R square | 0.771 |
*** Statistically significant at the 1% level; ** Statistically significant at the 5% level.
Table 3.
The share of electricity consumption for the selected household appliance.
| Install. Rate Each h # | Power Consump. Per Unit | Working Time | Elec. Consump. Each h # | Share | |
|---|---|---|---|---|---|
| Units | Set | kWh | h/Year | kWh/Year | % |
| Lighting systems | 1 | 1.18 | 1260 | 1486.80 | 27.12 |
| Room air conditioner | 2.04 | 0.90 | 800 | 1470.10 | 26.81 |
| Refrigerator | 1.26 | 0.15 | 4320 | 815.83 | 14.88 |
| Rice cooker | 1.19 | 1.20 | 240 | 343.87 | 6.27 |
| Water dispenser | 0.54 | 0.80 | 720 | 311.79 | 5.69 |
| TV | 1.54 | 0.14 | 1440 | 311.09 | 5.67 |
| Range hood | 0.97 | 0.35 | 540 | 182.95 | 3.34 |
| Fan | 3.51 | 0.07 | 720 | 166.80 | 3.04 |
| PC | 0.98 | 0.12 | 1200 | 141.16 | 2.57 |
| Water heater | 0.22 | 4.50 | 60 | 60.48 | 1.10 |
| Washing machine | 1.00 | 0.80 | 60 | 47.85 | 0.87 |
| De-humidifier | 0.36 | 0.29 | 420 | 42.94 | 0.78 |
| Micro oven | 0.45 | 1.20 | 60 | 32.12 | 0.59 |
| Dish dryer | 0.44 | 0.20 | 180 | 15.66 | 0.29 |
| audio | 0.80 | 0.05 | 360 | 14.40 | 0.26 |
| toaster | 0.63 | 0.80 | 24 | 12.08 | 0.22 |
| Air cleaner | 0.11 | 0.35 | 280 | 11.21 | 0.20 |
| Electric iron | 0.30 | 0.80 | 36 | 8.55 | 0.16 |
| Clothes dryer | 0.17 | 1.20 | 33 | 6.74 | 0.12 |
| Juicer | 0.29 | 0.21 | 12 | 0.73 | 0.01 |
# h is the abbreviation of “household”.
Table 4.
The correlation coefficients of GDP, electricity price, employment rate, residential space, and residential electricity consumption with selected electrical appliances.
Table 4.
The correlation coefficients of GDP, electricity price, employment rate, residential space, and residential electricity consumption with selected electrical appliances.
| GDP | Electricity Price | Employment Rate | Residential Space | Residential Electricity Consumption | |
|---|---|---|---|---|---|
| Air conditioner | 0.9585 | 0.6793 | 0.8528 | 0.9572 | 0.9815 |
| Refrigerator | 0.2636 | 0.3185 | 0.2633 | 0.2689 | 0.2545 |
| Rice cooker | 0.1859 | 0.1644 | −0.1652 | 0.2086 | 0.1871 |
| Water dispenser | −0.3262 | −0.2413 | 0.5007 | 0.2891 | −0.0715 |
| TV | −0.0857 | −0.2821 | 0.3539 | 0.5919 | 0.0659 |
| Range hoods | −0.5061 | −0.5772 | −0.1701 | −0.4206 | −0.4228 |
| Fan | 0.4093 | 0.5311 | 0.5852 | 0.4804 | 0.4364 |
| Personal computer | 0.7608 | 0.6636 | 0.8817 | 0.9668 | 0.9287 |
| Washing machine | 0.8219 | 0.7117 | 0.8336 | 0.9733 | 0.9559 |
© 2017 by the author. Licensee MDPI, Basel, Switzerland. This article is an open access article distributed under the terms and conditions of the Creative Commons Attribution (CC BY) license (http://creativecommons.org/licenses/by/4.0/).
Share and Cite
MDPI and ACS Style
Chen, Y.-T. The Factors Affecting Electricity Consumption and the Consumption Characteristics in the Residential Sector—A Case Example of Taiwan. Sustainability 2017, 9, 1484. https://doi.org/10.3390/su9081484
AMA Style
Chen Y-T. The Factors Affecting Electricity Consumption and the Consumption Characteristics in the Residential Sector—A Case Example of Taiwan. Sustainability. 2017; 9(8):1484. https://doi.org/10.3390/su9081484
Chicago/Turabian StyleChen, Yi-Tui. 2017. "The Factors Affecting Electricity Consumption and the Consumption Characteristics in the Residential Sector—A Case Example of Taiwan" Sustainability 9, no. 8: 1484. https://doi.org/10.3390/su9081484
Note that from the first issue of 2016, this journal uses article numbers instead of page numbers. See further details here.