A Simple Algorithm for Large-Scale Mapping of Evergreen Forests in Tropical America, Africa and Asia

 ,
, 

Abstract
:1. Introduction
2. Satellite Imagery and Mapping Algorithm
2.1. MODIS Land Surface Reflectance Data and Vegetation Indices
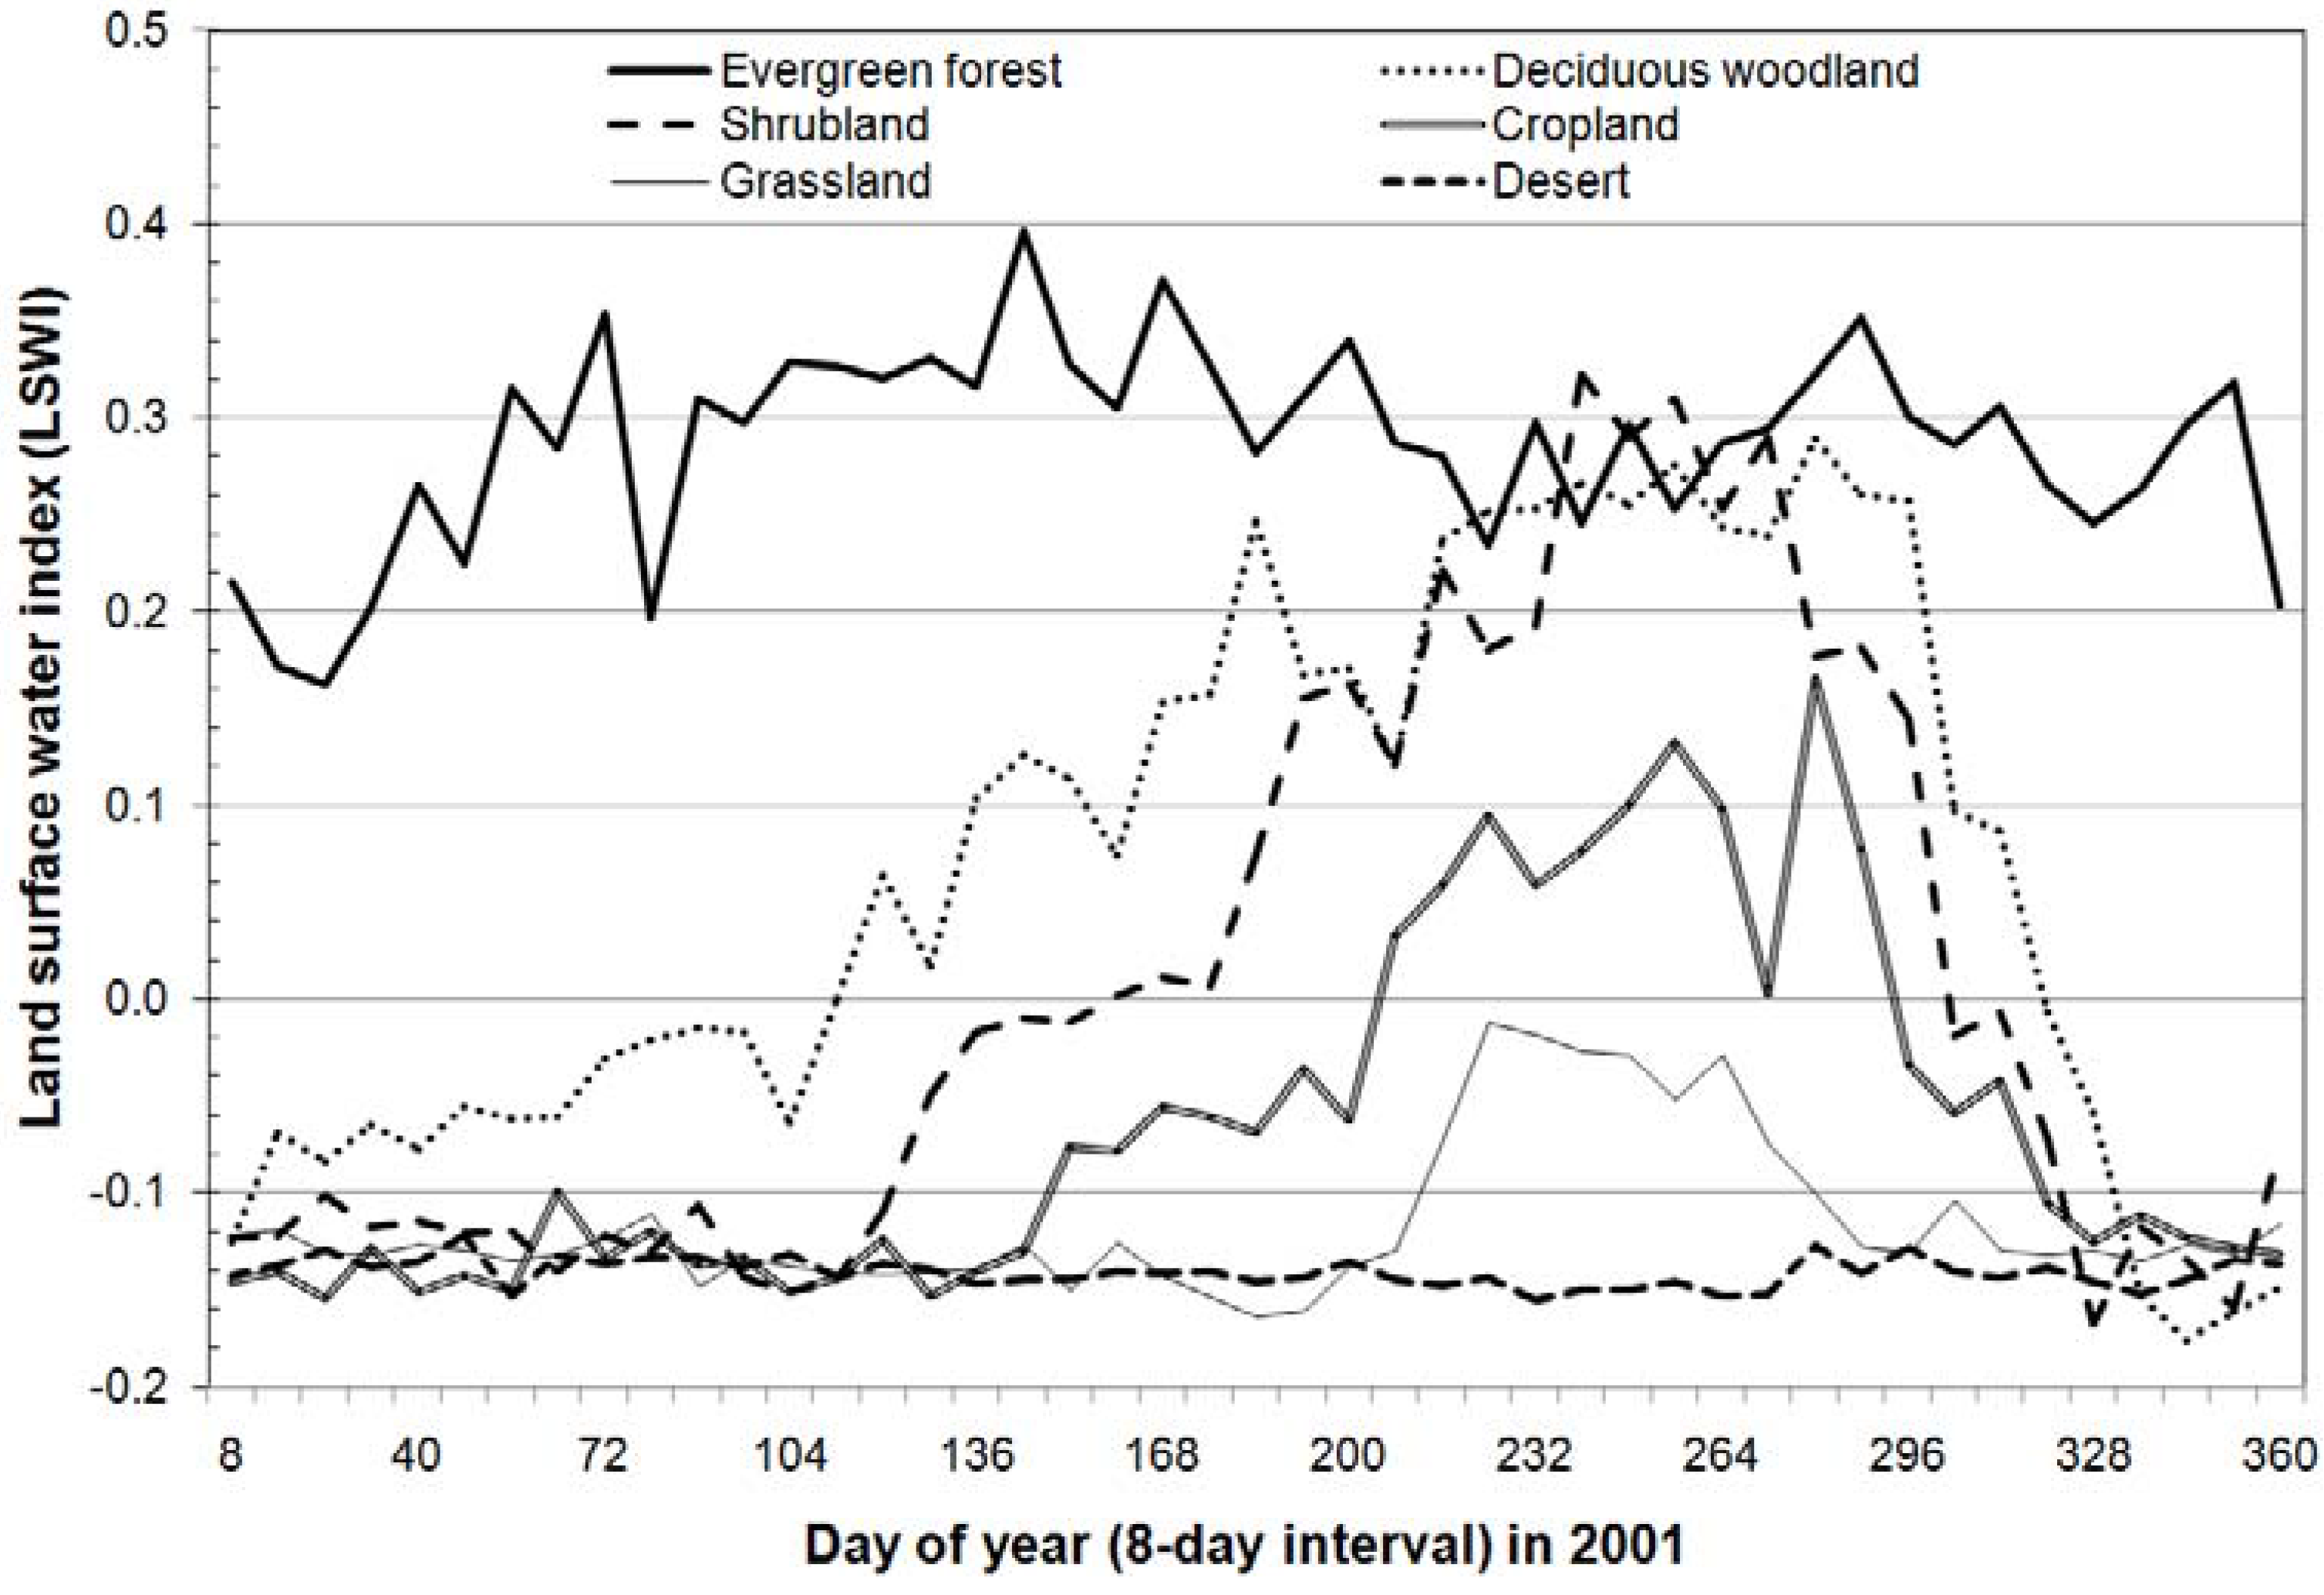
2.2. Temporal Profile Analysis for Identifying and Mapping Evergreen Forests
3. Ancillary Data for Inter-Comparison
3.1. The MODIS Land Cover Product (MOD12Q1)

| Input data | Source |
|---|---|
| Deep Water Mask | |
| Nadir BRDF-adjusted Reflectance (NBARs) | MOD43B4; MODIS Land Bands (1-7) |
| Spatial Texture (Red Band) (1-km resolution) | MODAGTEX |
| Directional reflectance information (1-km resolution, 16-day composites) | MOD43B1 |
| Enhanced Vegetation Index (EVI) (1-km resolution, 16-day composites) | MOD13 |
| Snow Cover (500-m resolution, 8-day composites) | MOD10 |
| Land Surface Temperatures (1-km resolution, 8-day composites) | MOD11 |
| Terrain elevation information | MOD03 |
3.2. The Global Land Cover 2000 (GLC2000)
3.3. The FAO Forest Statistics
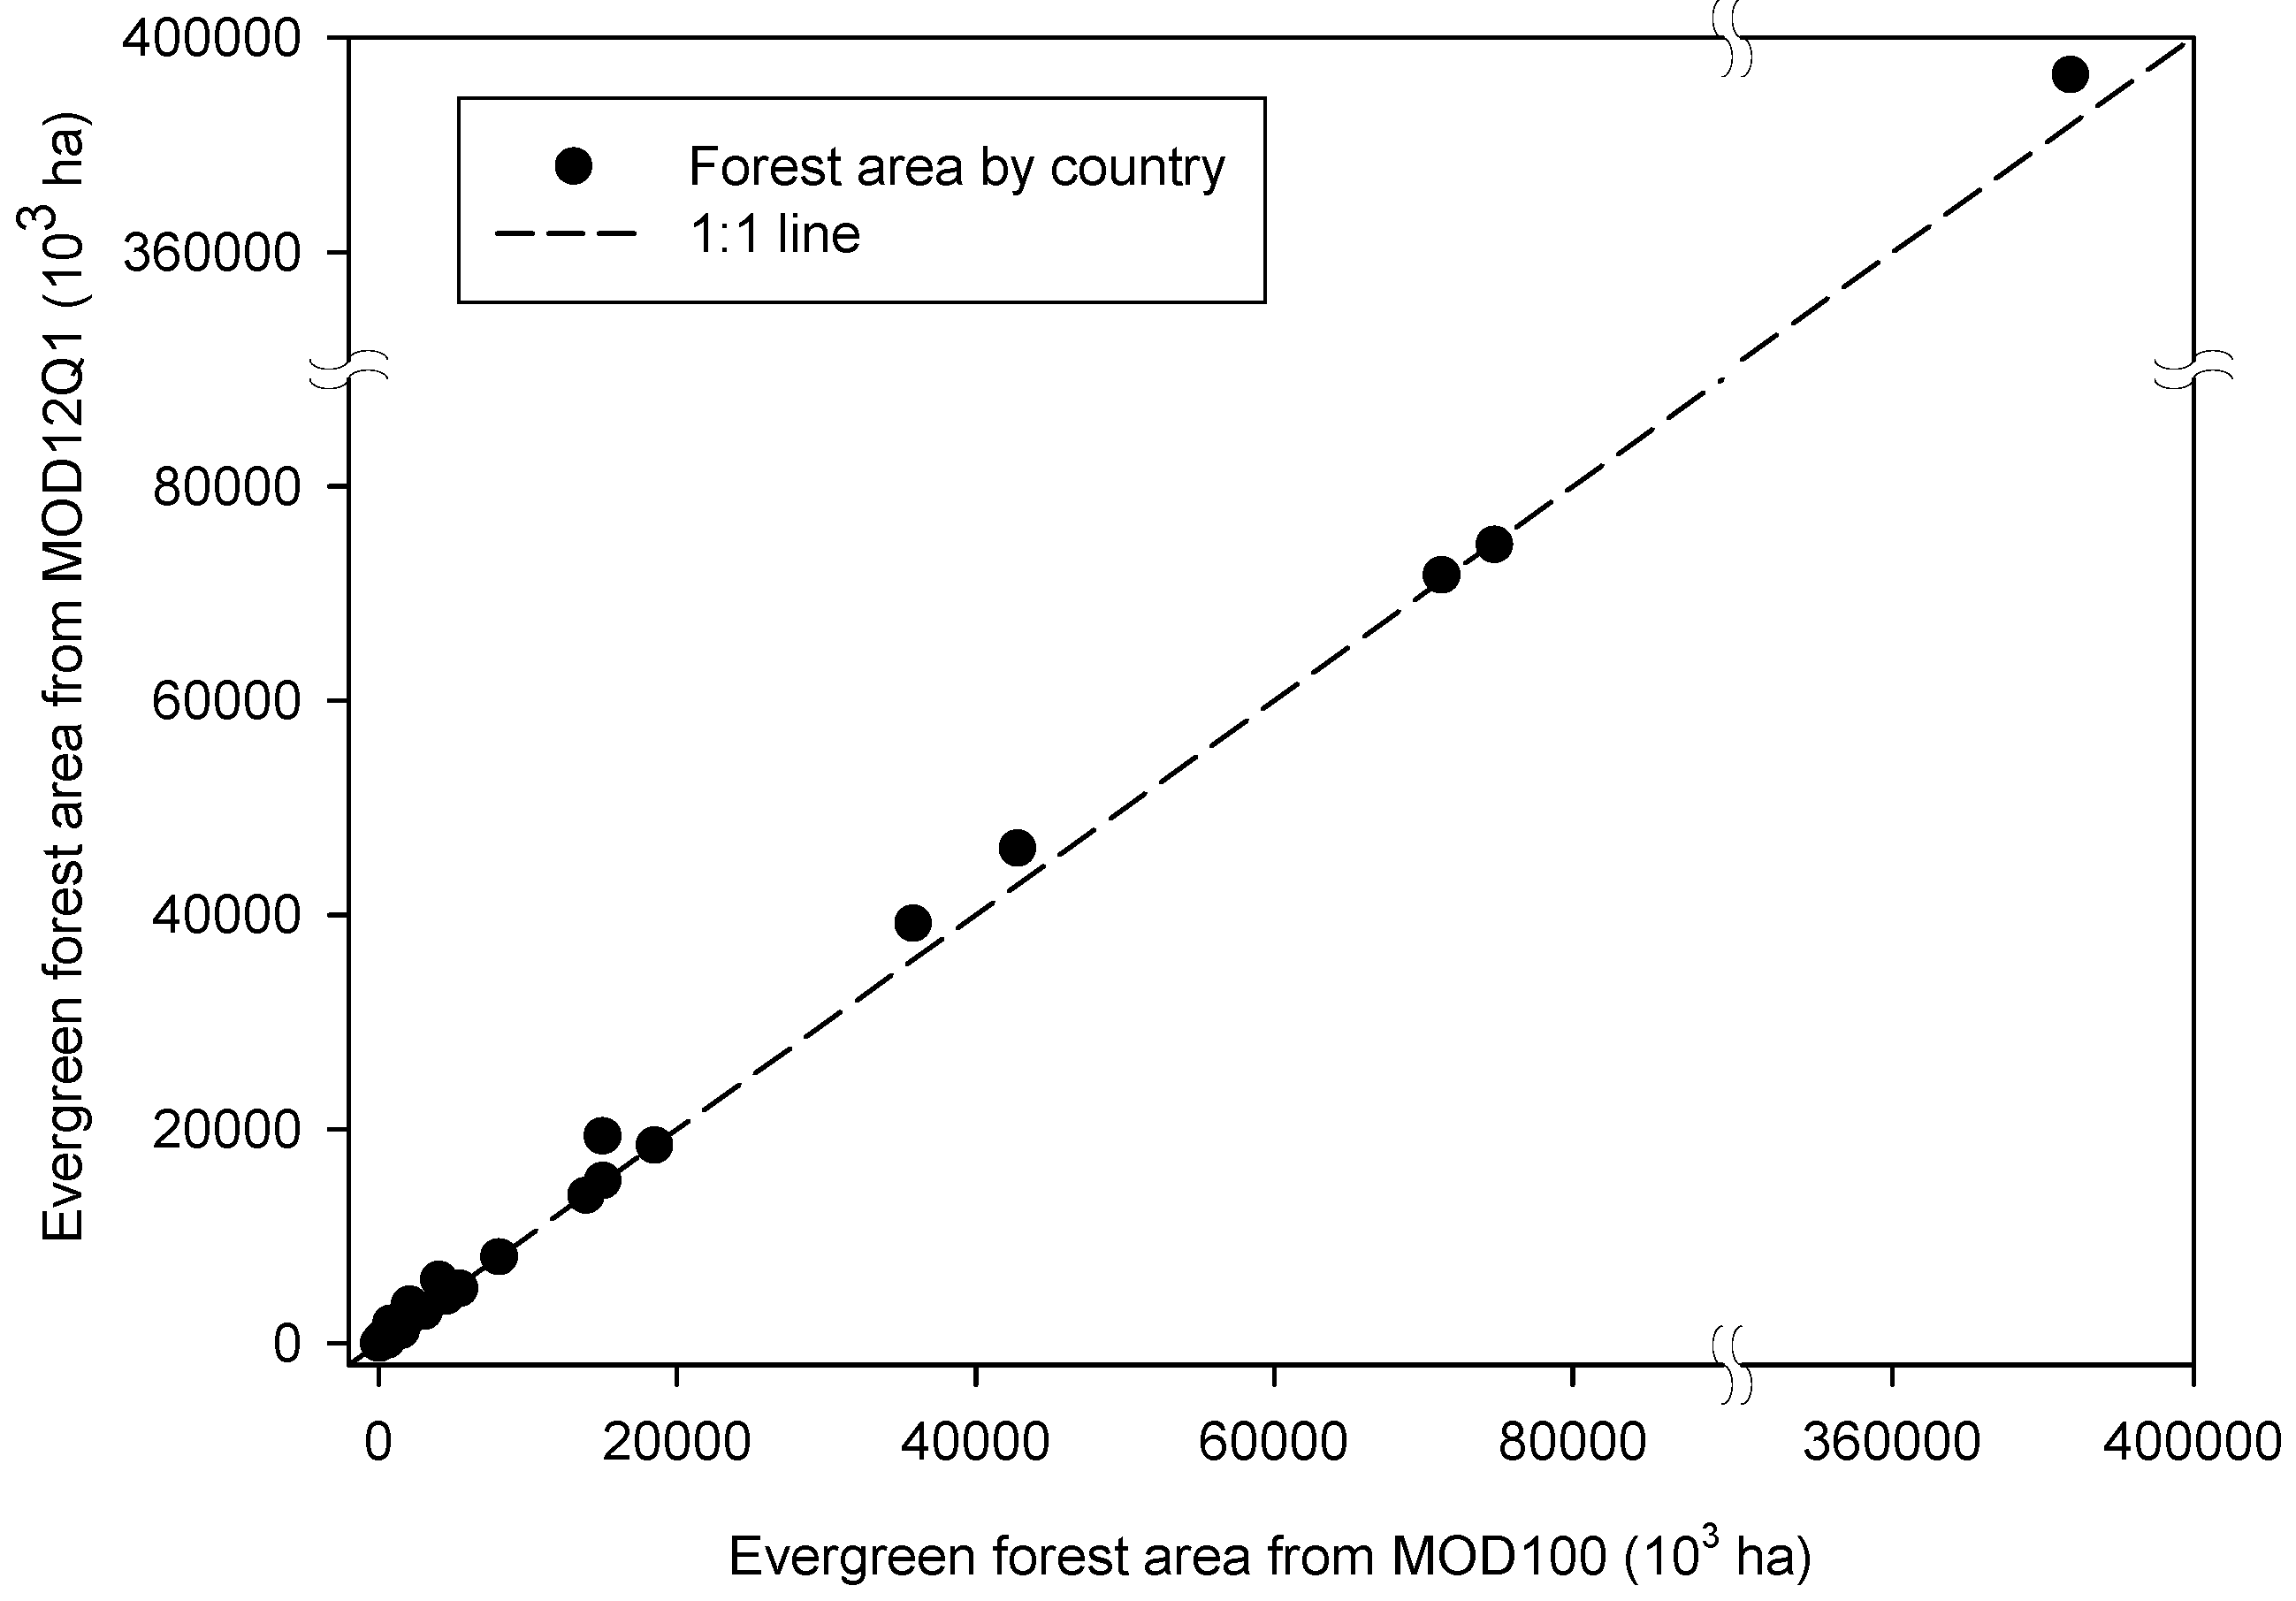
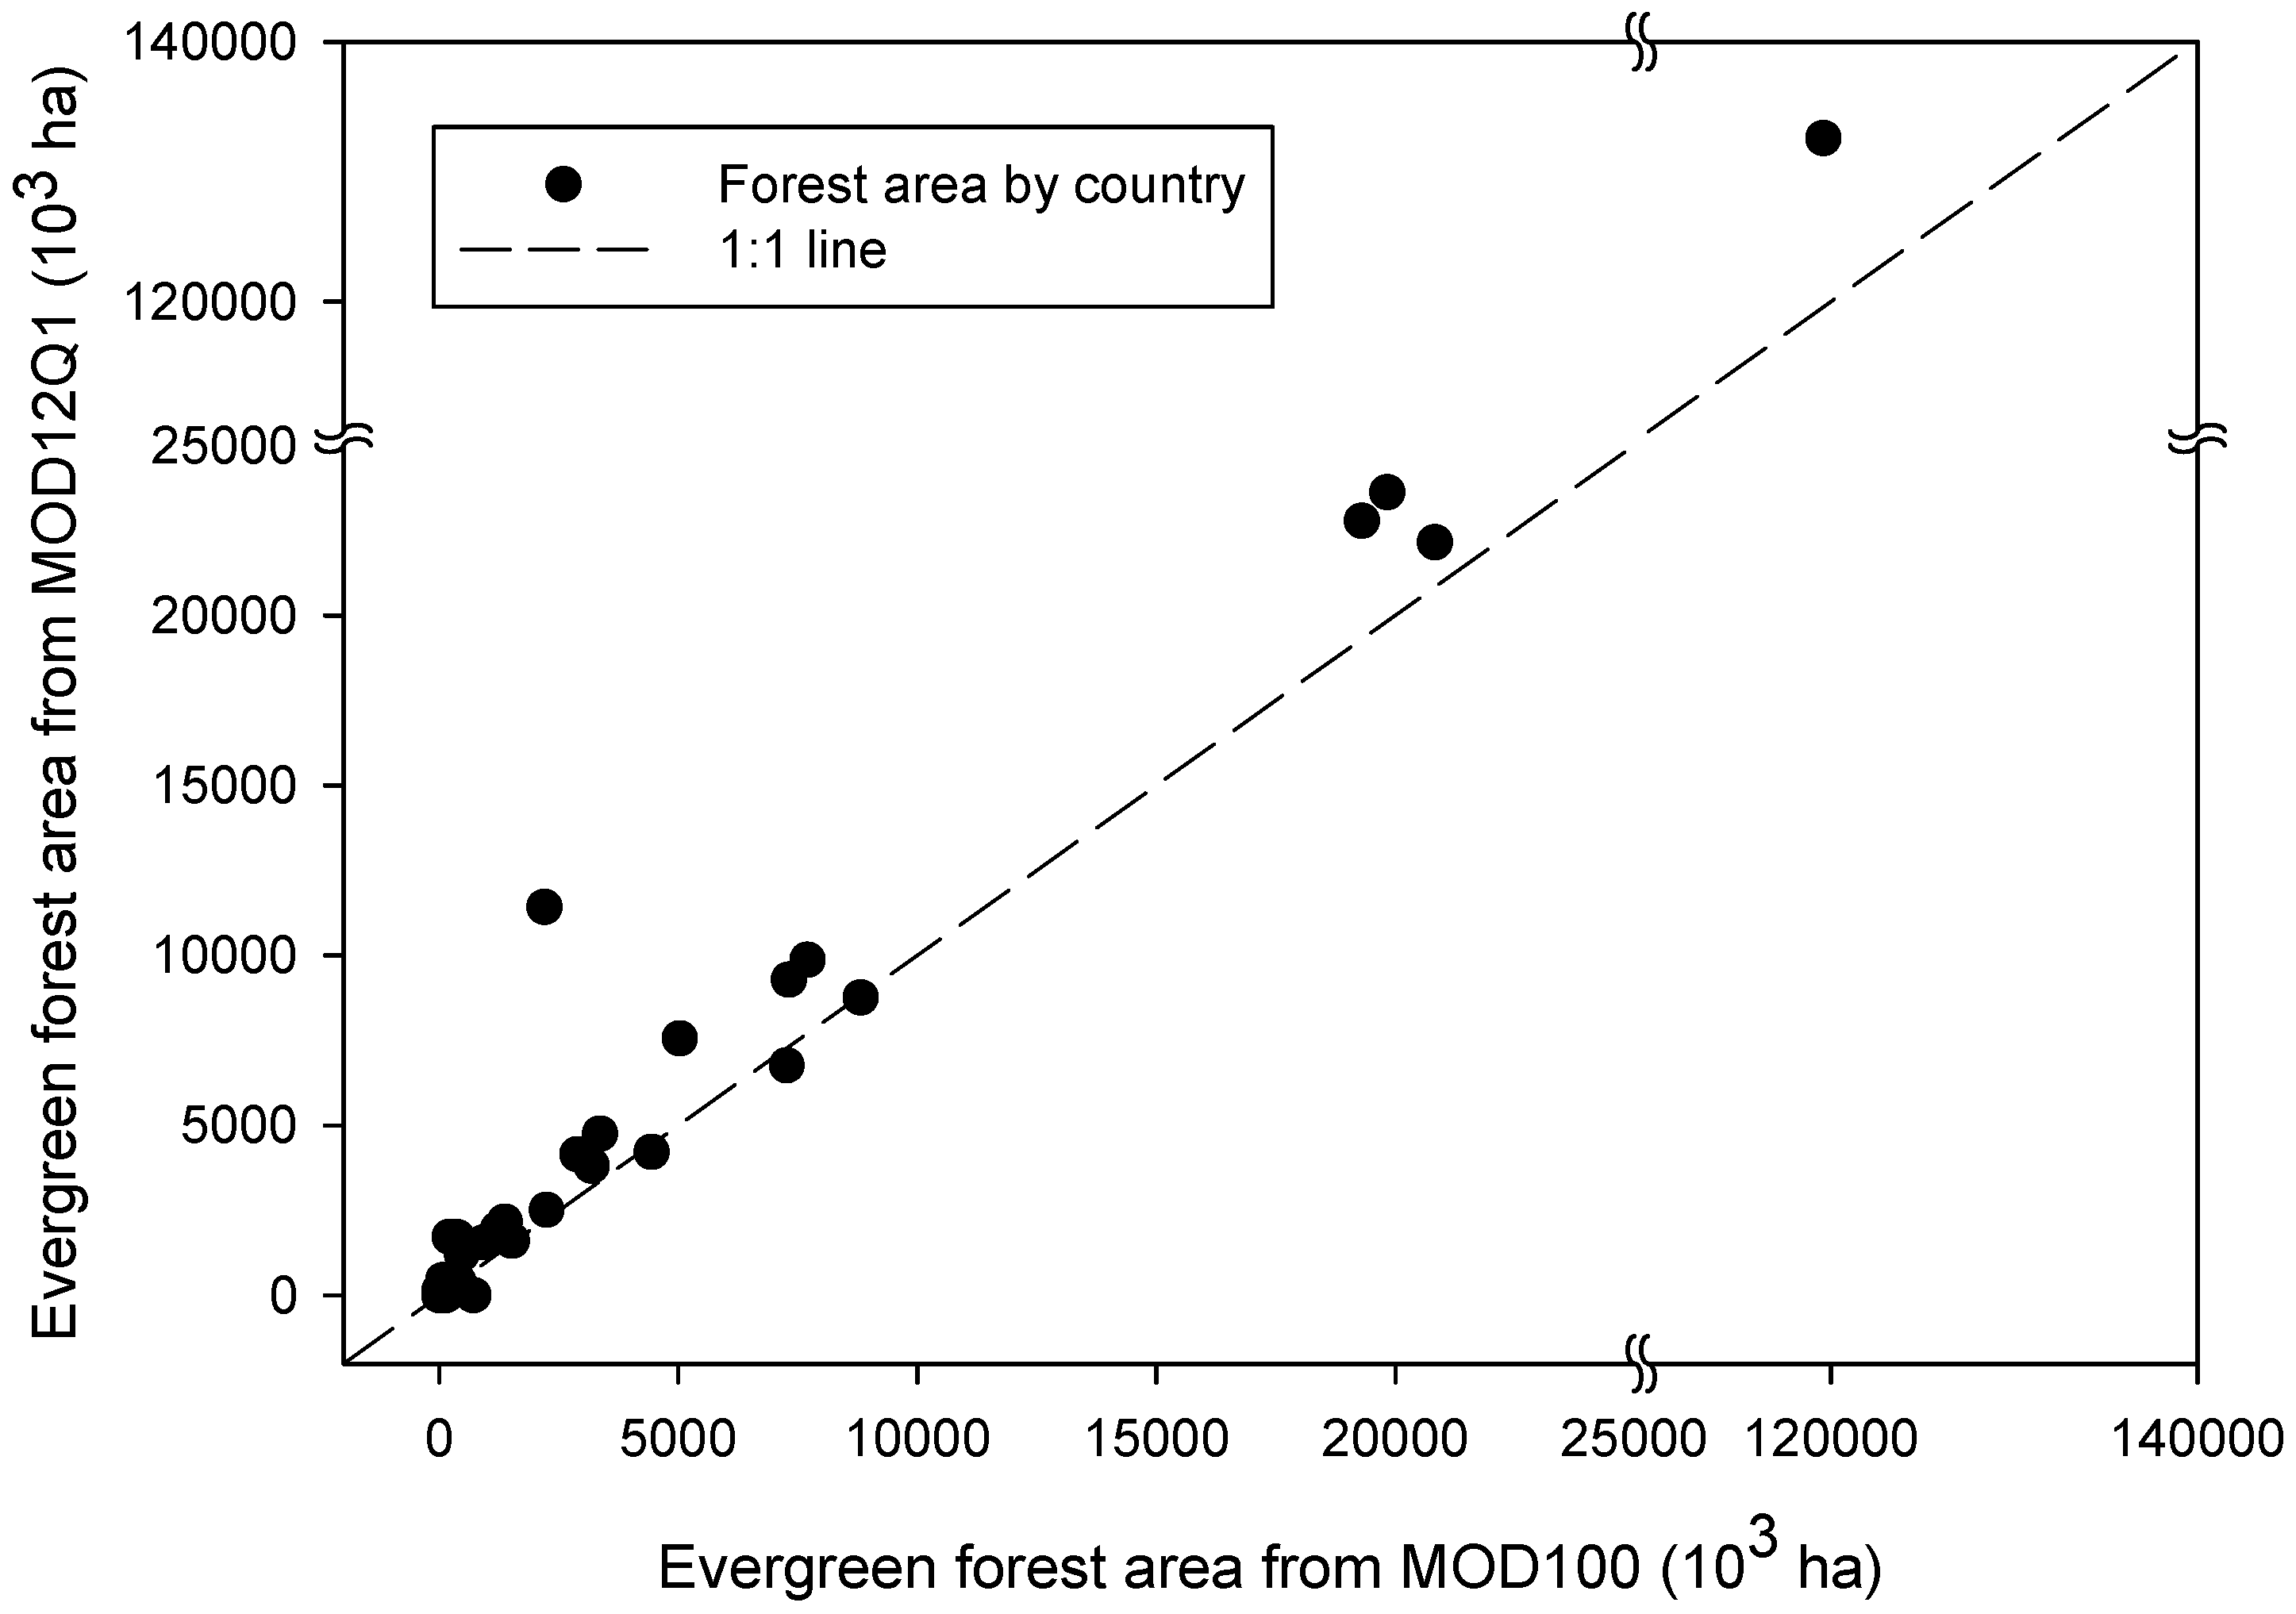
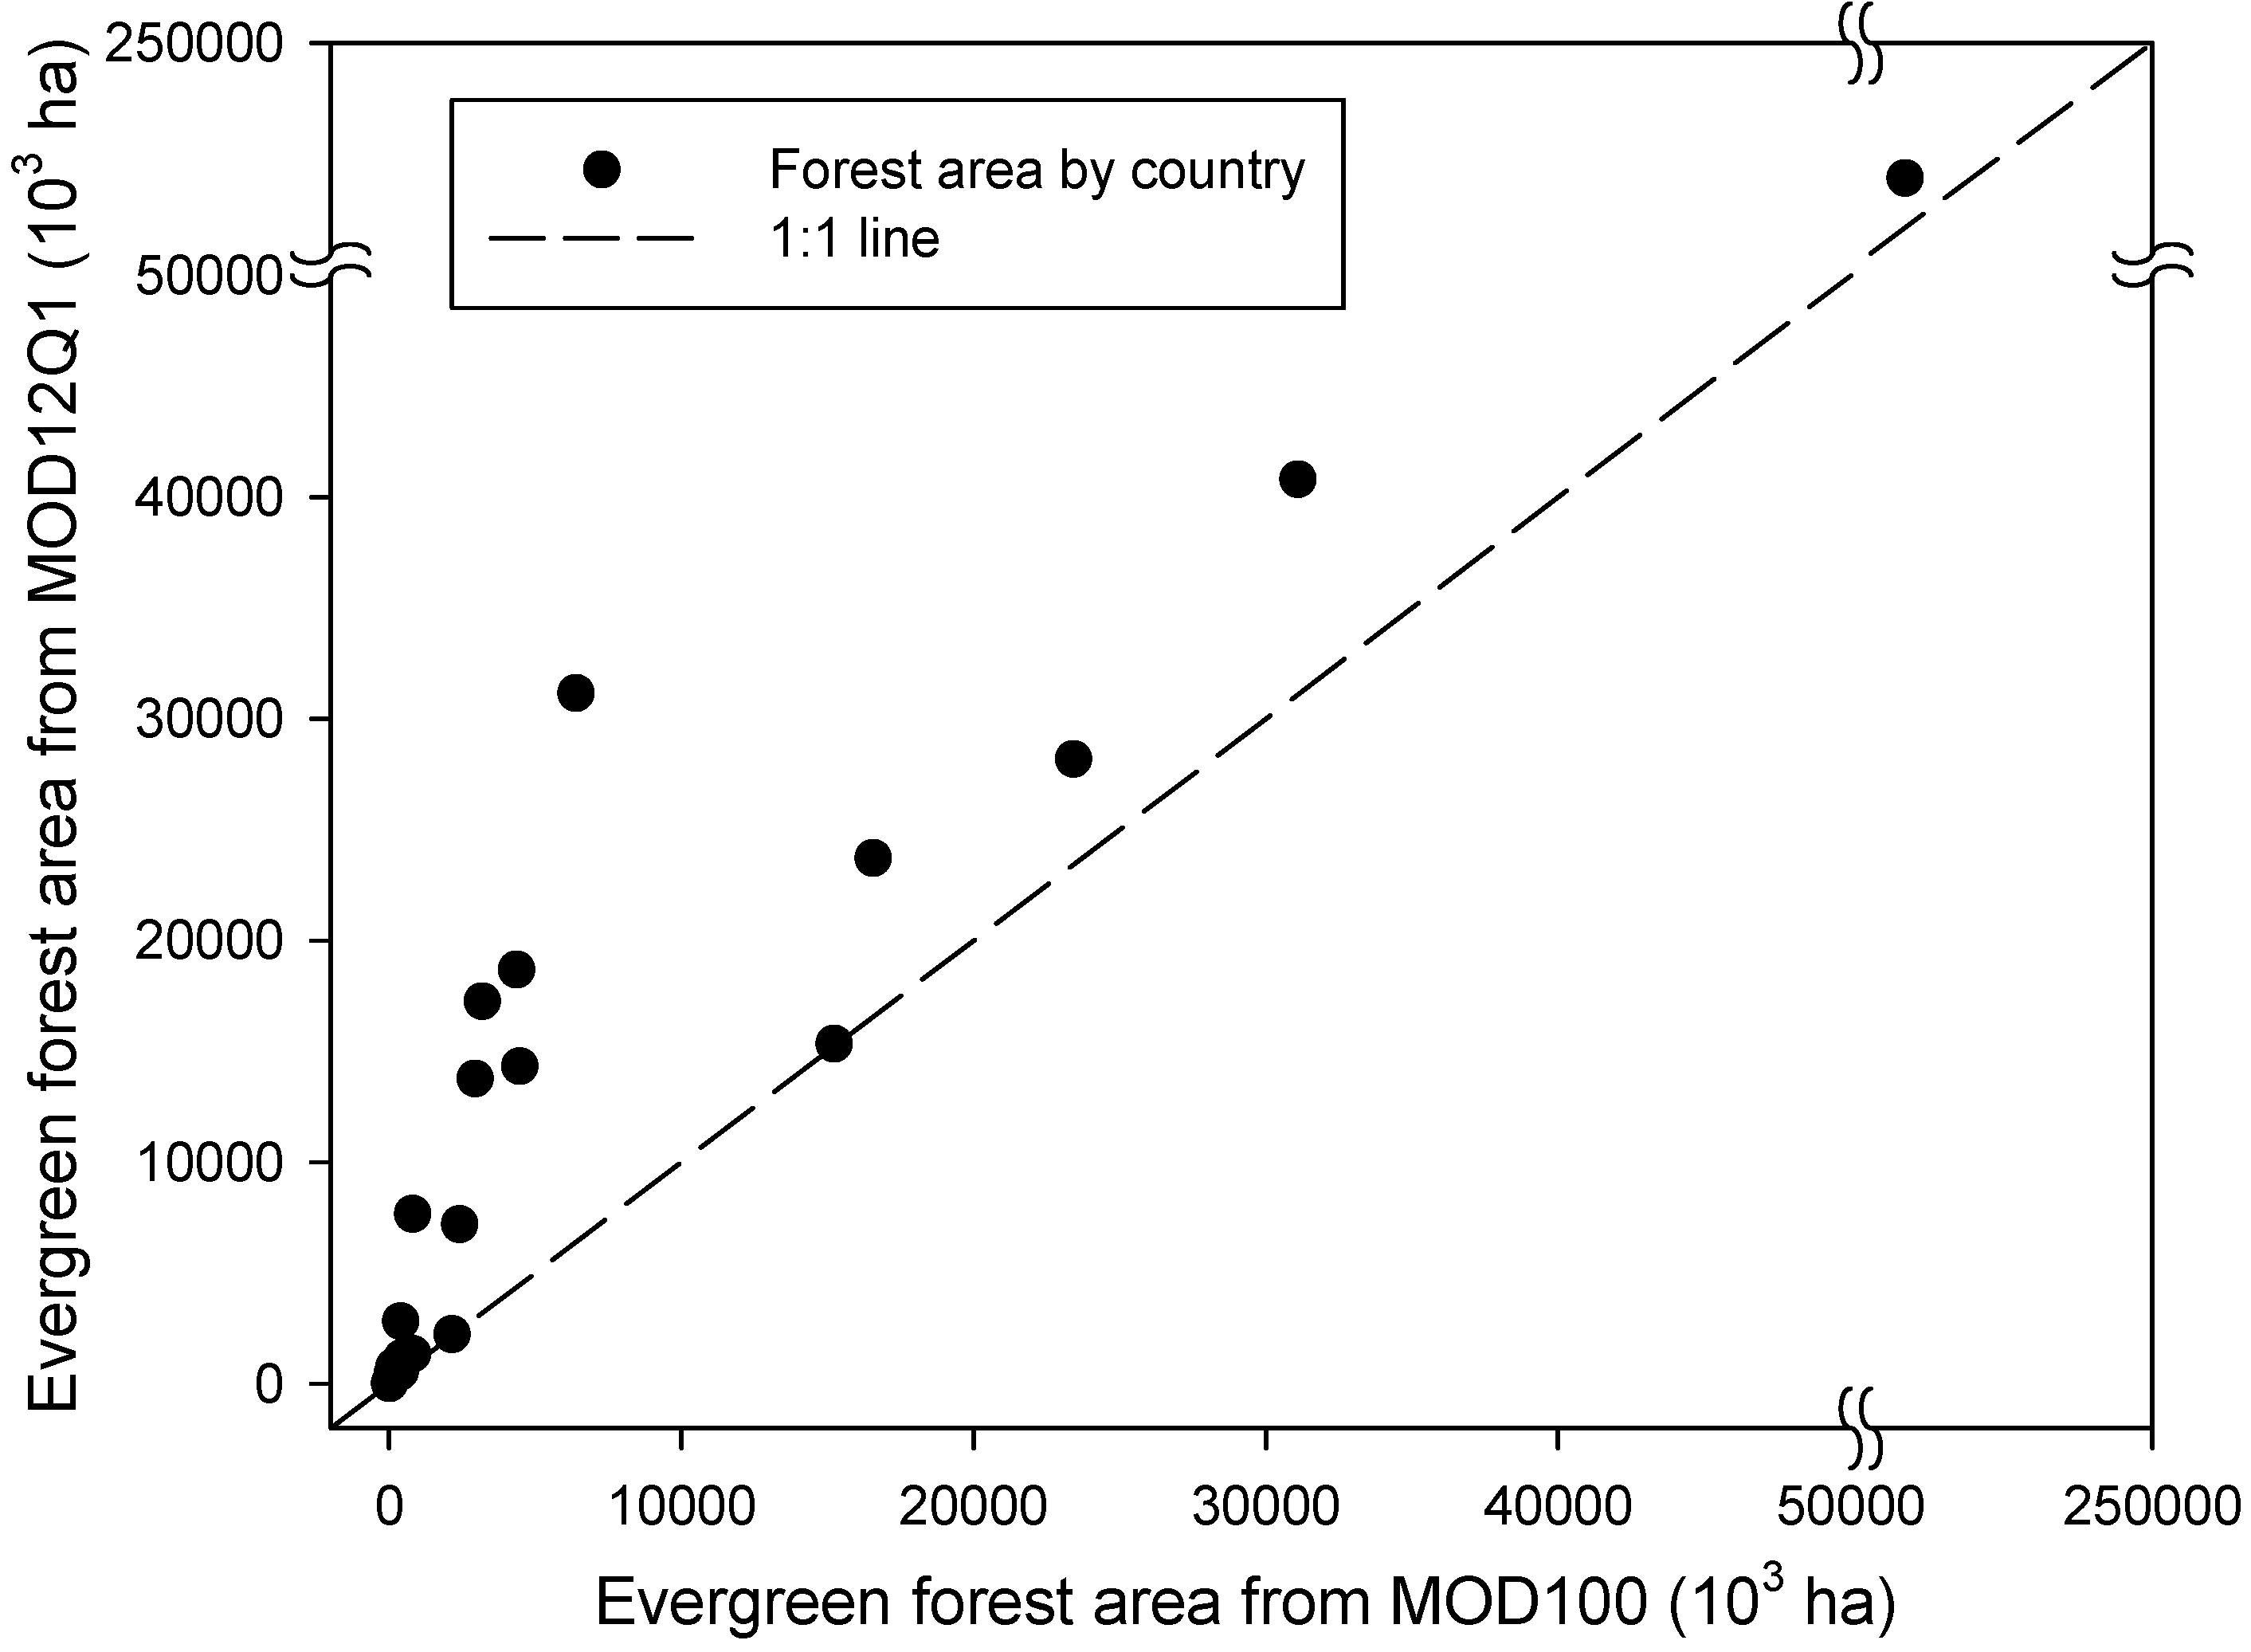
4. Results and Discussion
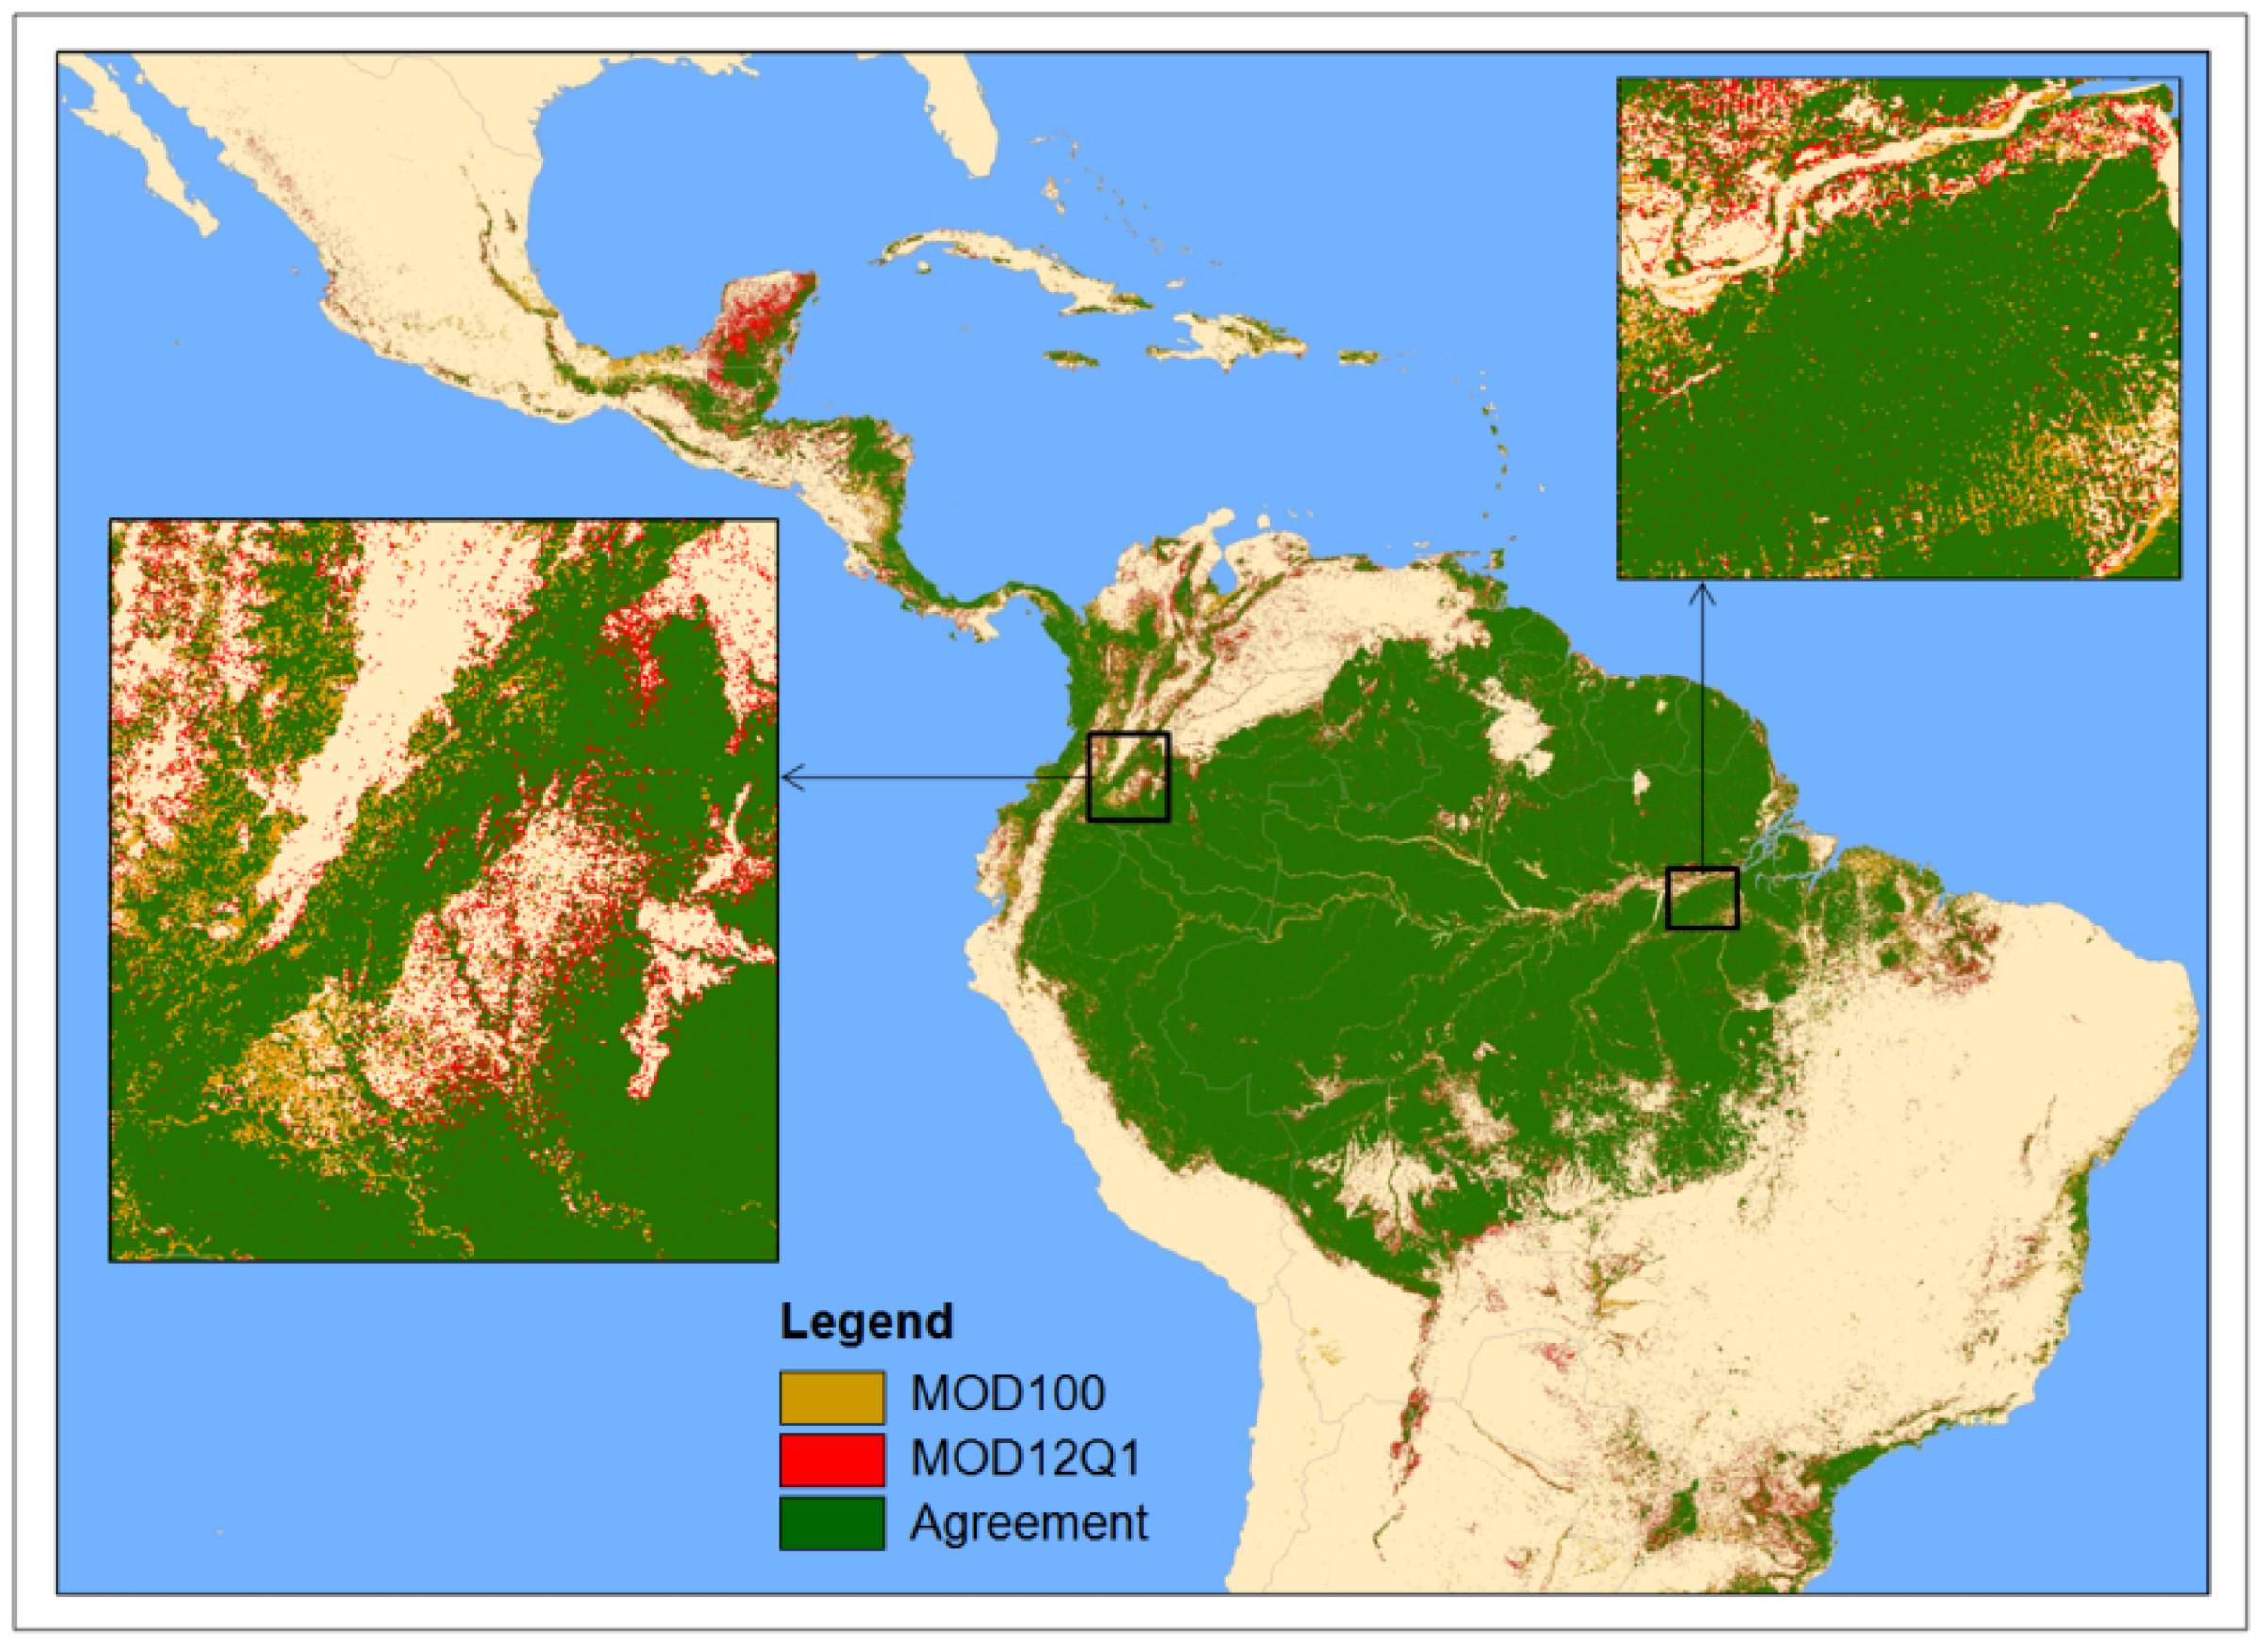
4.1. The Area and Spatial Distribution of Evergreen Forests in Tropical America
| Name of the country | Total geographical area (103 ha) | FRA 2000 (103 ha) | GLC 2000 (103 ha) | MOD12Q1 (103 ha) | MOD100 (103 ha) | MOD100 forest to geographical area (%) |
|---|---|---|---|---|---|---|
| Anguilla | 9 | 0 | 0 | 1 | 0 | 0.0 |
| Antigua & Barbuda | 54 | 6 | 15 | 6 | 0 | 0.7 |
| Argentina | 89774 | 8184 | 4580 | 5930 | 3977 | 4.4 |
| Barbados | 45 | 2 | 51291 | 4 | 1 | 2.2 |
| Belize | 2209 | 1585 | 1247 | 1698 | 1481 | 67.0 |
| Bolivia | 108661 | 41777 | 33957 | 39207 | 35369 | 32.6 |
| Brazil | 836427 | 357522 | 339455 | 392987 | 382456 | 45.7 |
| British Virgin Islands | 12 | 3 | 0 | 6 | 2 | 15.4 |
| Cayman Islands | 21 | 10 | 0 | 8 | 11 | 50.7 |
| Chile | 26973 | 1 | 3631 | 5 | 81 | 0.3 |
| Colombia | 113517 | 49150 | 2004 | 71708 | 69216 | 61.0 |
| Costa Rica | 5108 | 2299 | 3060 | 2980 | 3012 | 59.0 |
| Cuba | 10921 | 3230 | 688 | 2260 | 1718 | 15.7 |
| Dominica | 77 | 60 | 4 | 60 | 67 | 86.6 |
| Dominican Republic | 4837 | 2112 | 0 | 1225 | 1530 | 31.6 |
| Ecuador | 25531 | 12580 | 10511 | 15207 | 15991 | 62.6 |
| El Salvador | 2057 | 833 | 301 | 373 | 187 | 9.1 |
| French Guiana | 8359 | 8077 | 7854 | 8076 | 8105 | 97.0 |
| Grenada | 35 | 25 | 17 | 21 | 21 | 61.0 |
| Guadeloupe | 165 | 70 | 66 | 68 | 62 | 37.4 |
| Guatemala | 10902 | 6331 | 4220 | 5246 | 4214 | 38.7 |
| Guyana | 21059 | 17338 | 17043 | 18506 | 18586 | 88.3 |
| Haiti | 2717 | 426 | 0 | 263 | 294 | 10.8 |
| Honduras | 11221 | 6559 | 4632 | 5368 | 4321 | 38.5 |
| Jamaica | 1104 | 552 | 0 | 642 | 732 | 66.3 |
| Martinique | 115 | 38 | 1 | 52 | 66 | 57.1 |
| Mexico | 176897 | 42608 | 53623 | 19365 | 13403 | 7.6 |
| Montserrat | 11 | 6 | 4 | 3 | 2 | 17.7 |
| Netherlands Antilles | 79 | 1 | 0 | 3 | 0 | 0.0 |
| Nicaragua | 12811 | 5392 | 5879 | 5143 | 5711 | 44.6 |
| Panama | 7414 | 2685 | 2988 | 4382 | 4563 | 61.5 |
| Paraguay | 39881 | 2815 | 2901 | 3647 | 1870 | 4.7 |
| Peru | 129086 | 58956 | 67071 | 74548 | 75077 | 58.2 |
| Puerto Rico | 915 | 307 | 5 | 318 | 553 | 60.5 |
| St. Kitts & Nevis | 20 | 4 | 5 | 6 | 5 | 27.8 |
| St. Lucia | 64 | 36 | 0 | 34 | 39 | 61.6 |
| St. Vincent & the Grenadines | 34 | 12 | 0 | 20 | 27 | 80.3 |
| Suriname | 14499 | 13132 | 12927 | 13799 | 13864 | 95.6 |
| The Bahamas | 1214 | 206 | 233 | 308 | 167 | 13.7 |
| Trinidad & Tobago | 501 | 18 | 260 | 319 | 323 | 64.4 |
| Turks & Caicos Islands | 30 | 3 | 0 | 13 | 9 | 28.8 |
| Venezuela | 91086 | 36910 | 38504 | 46237 | 42544 | 46.7 |
| Virgin Islands | 30 | 8 | 1 | 10 | 6 | 20.6 |
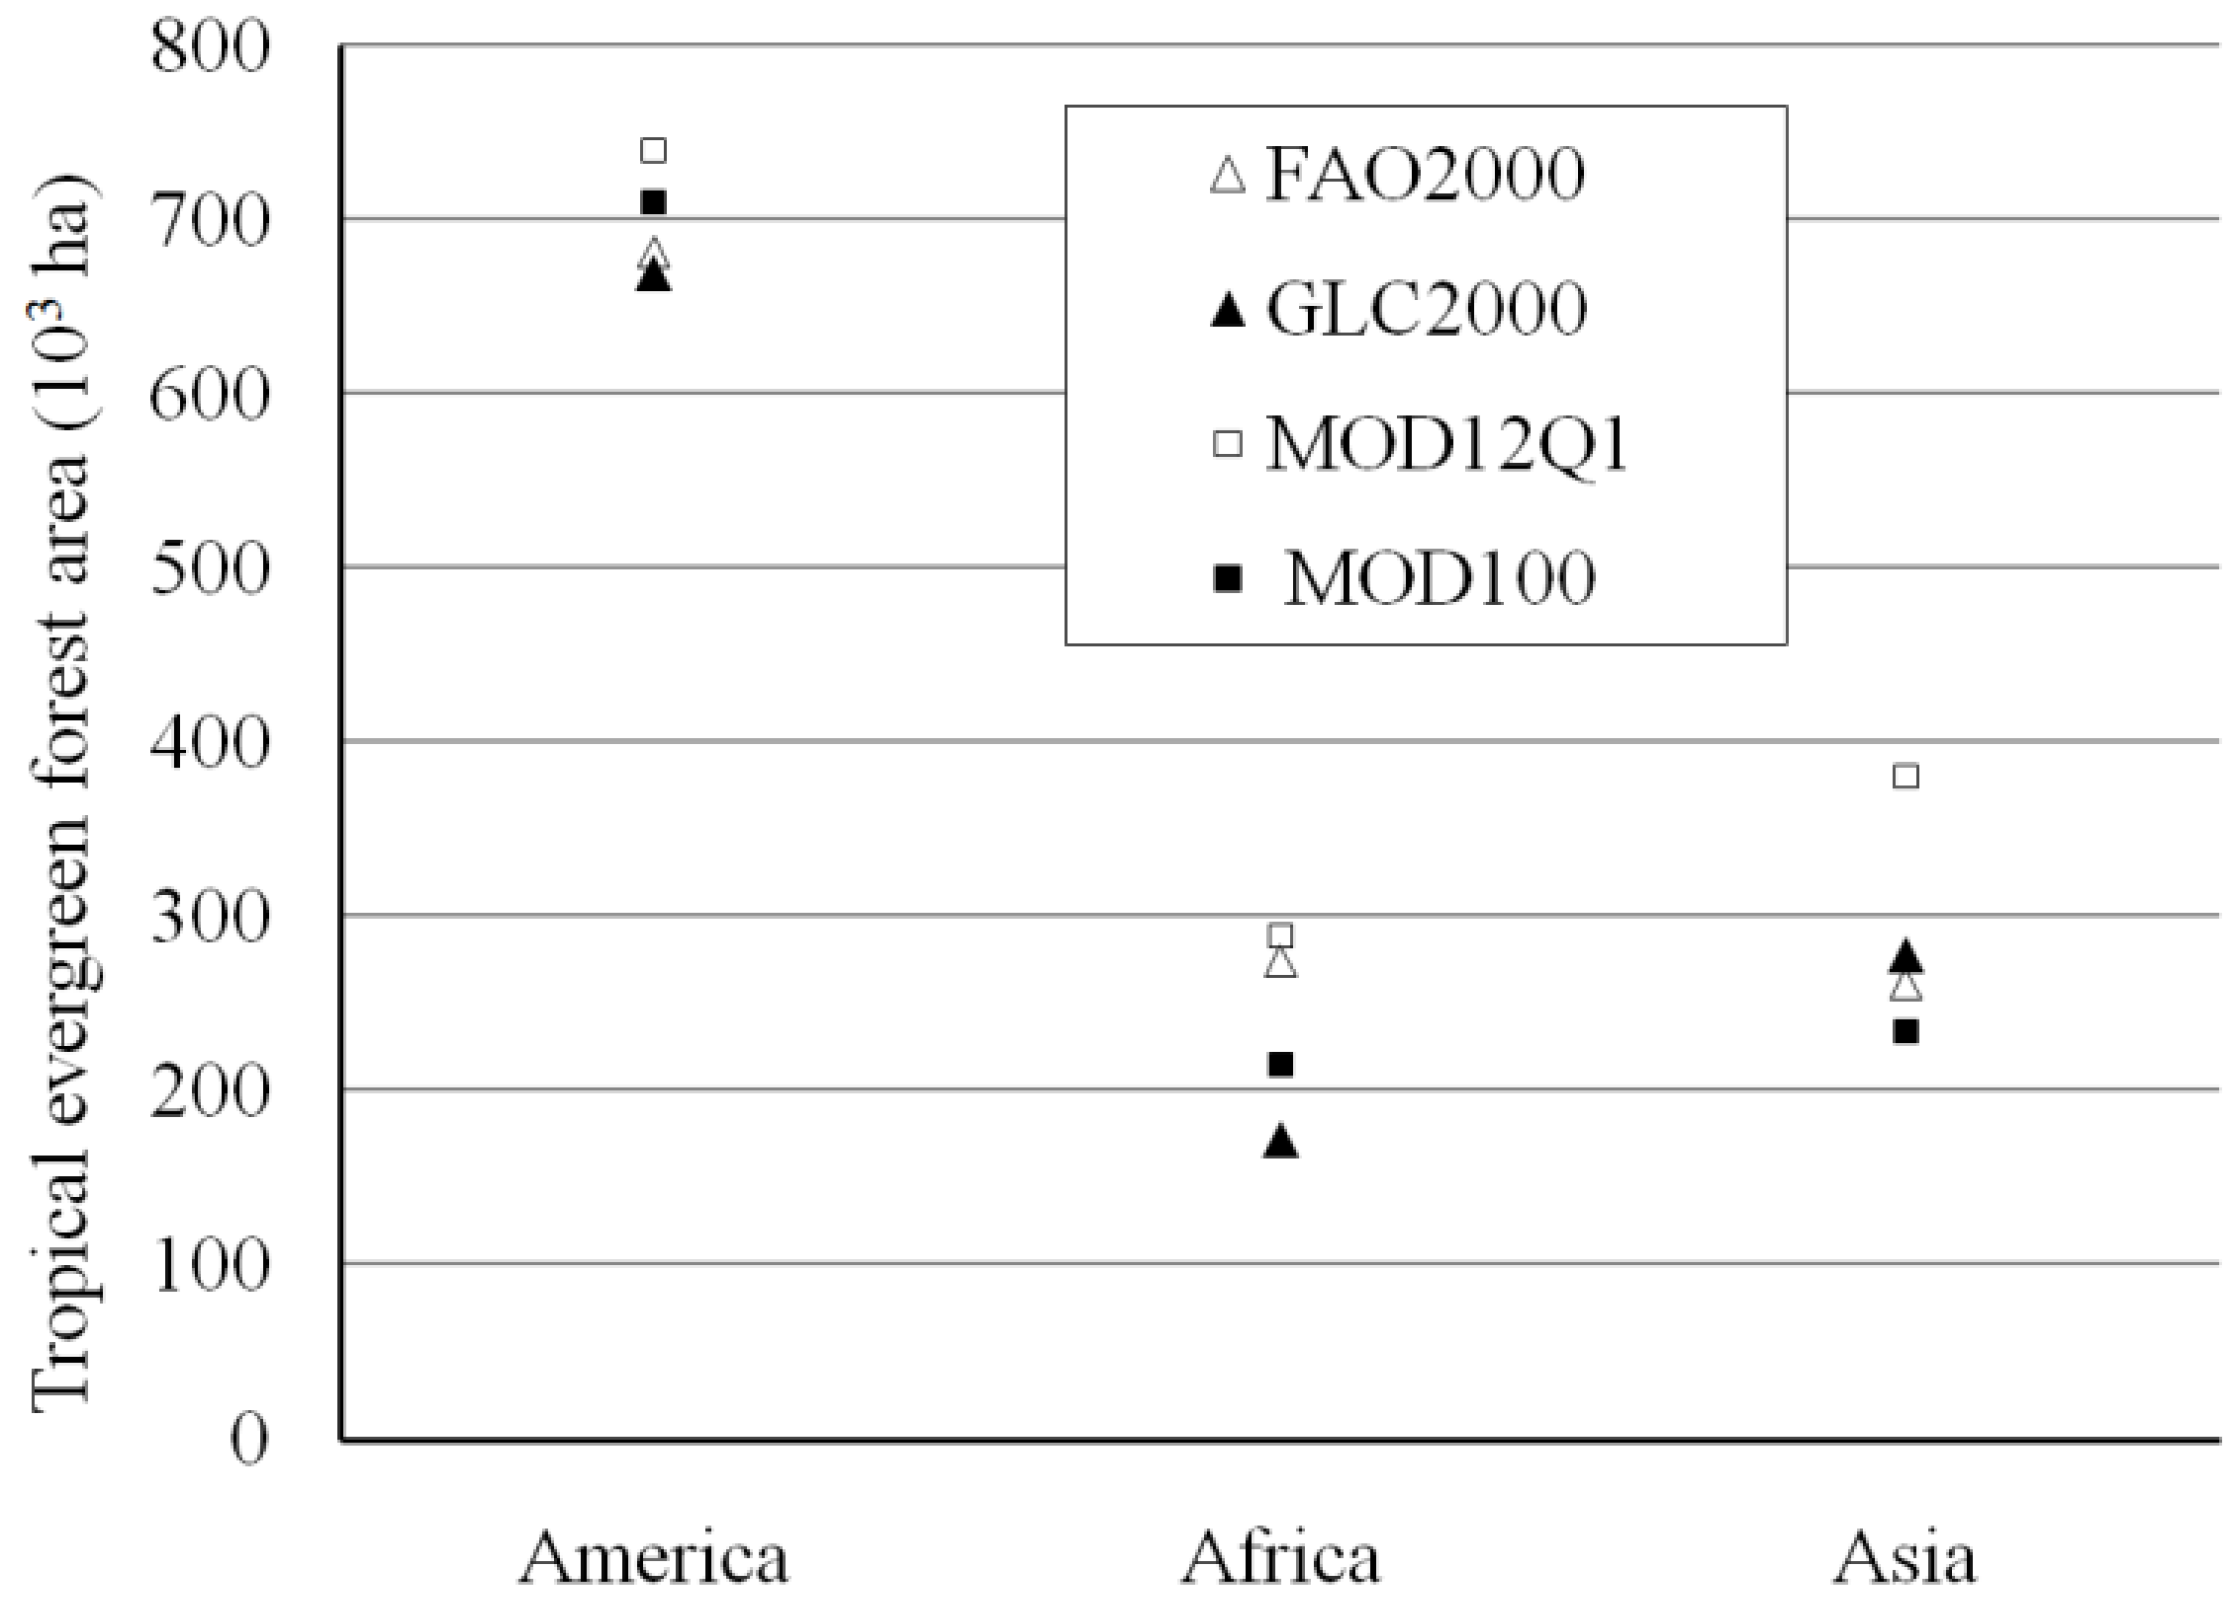
| Total America | 1756477 | 681869 | 668977 | 740063 | 709660 | 40.4 |


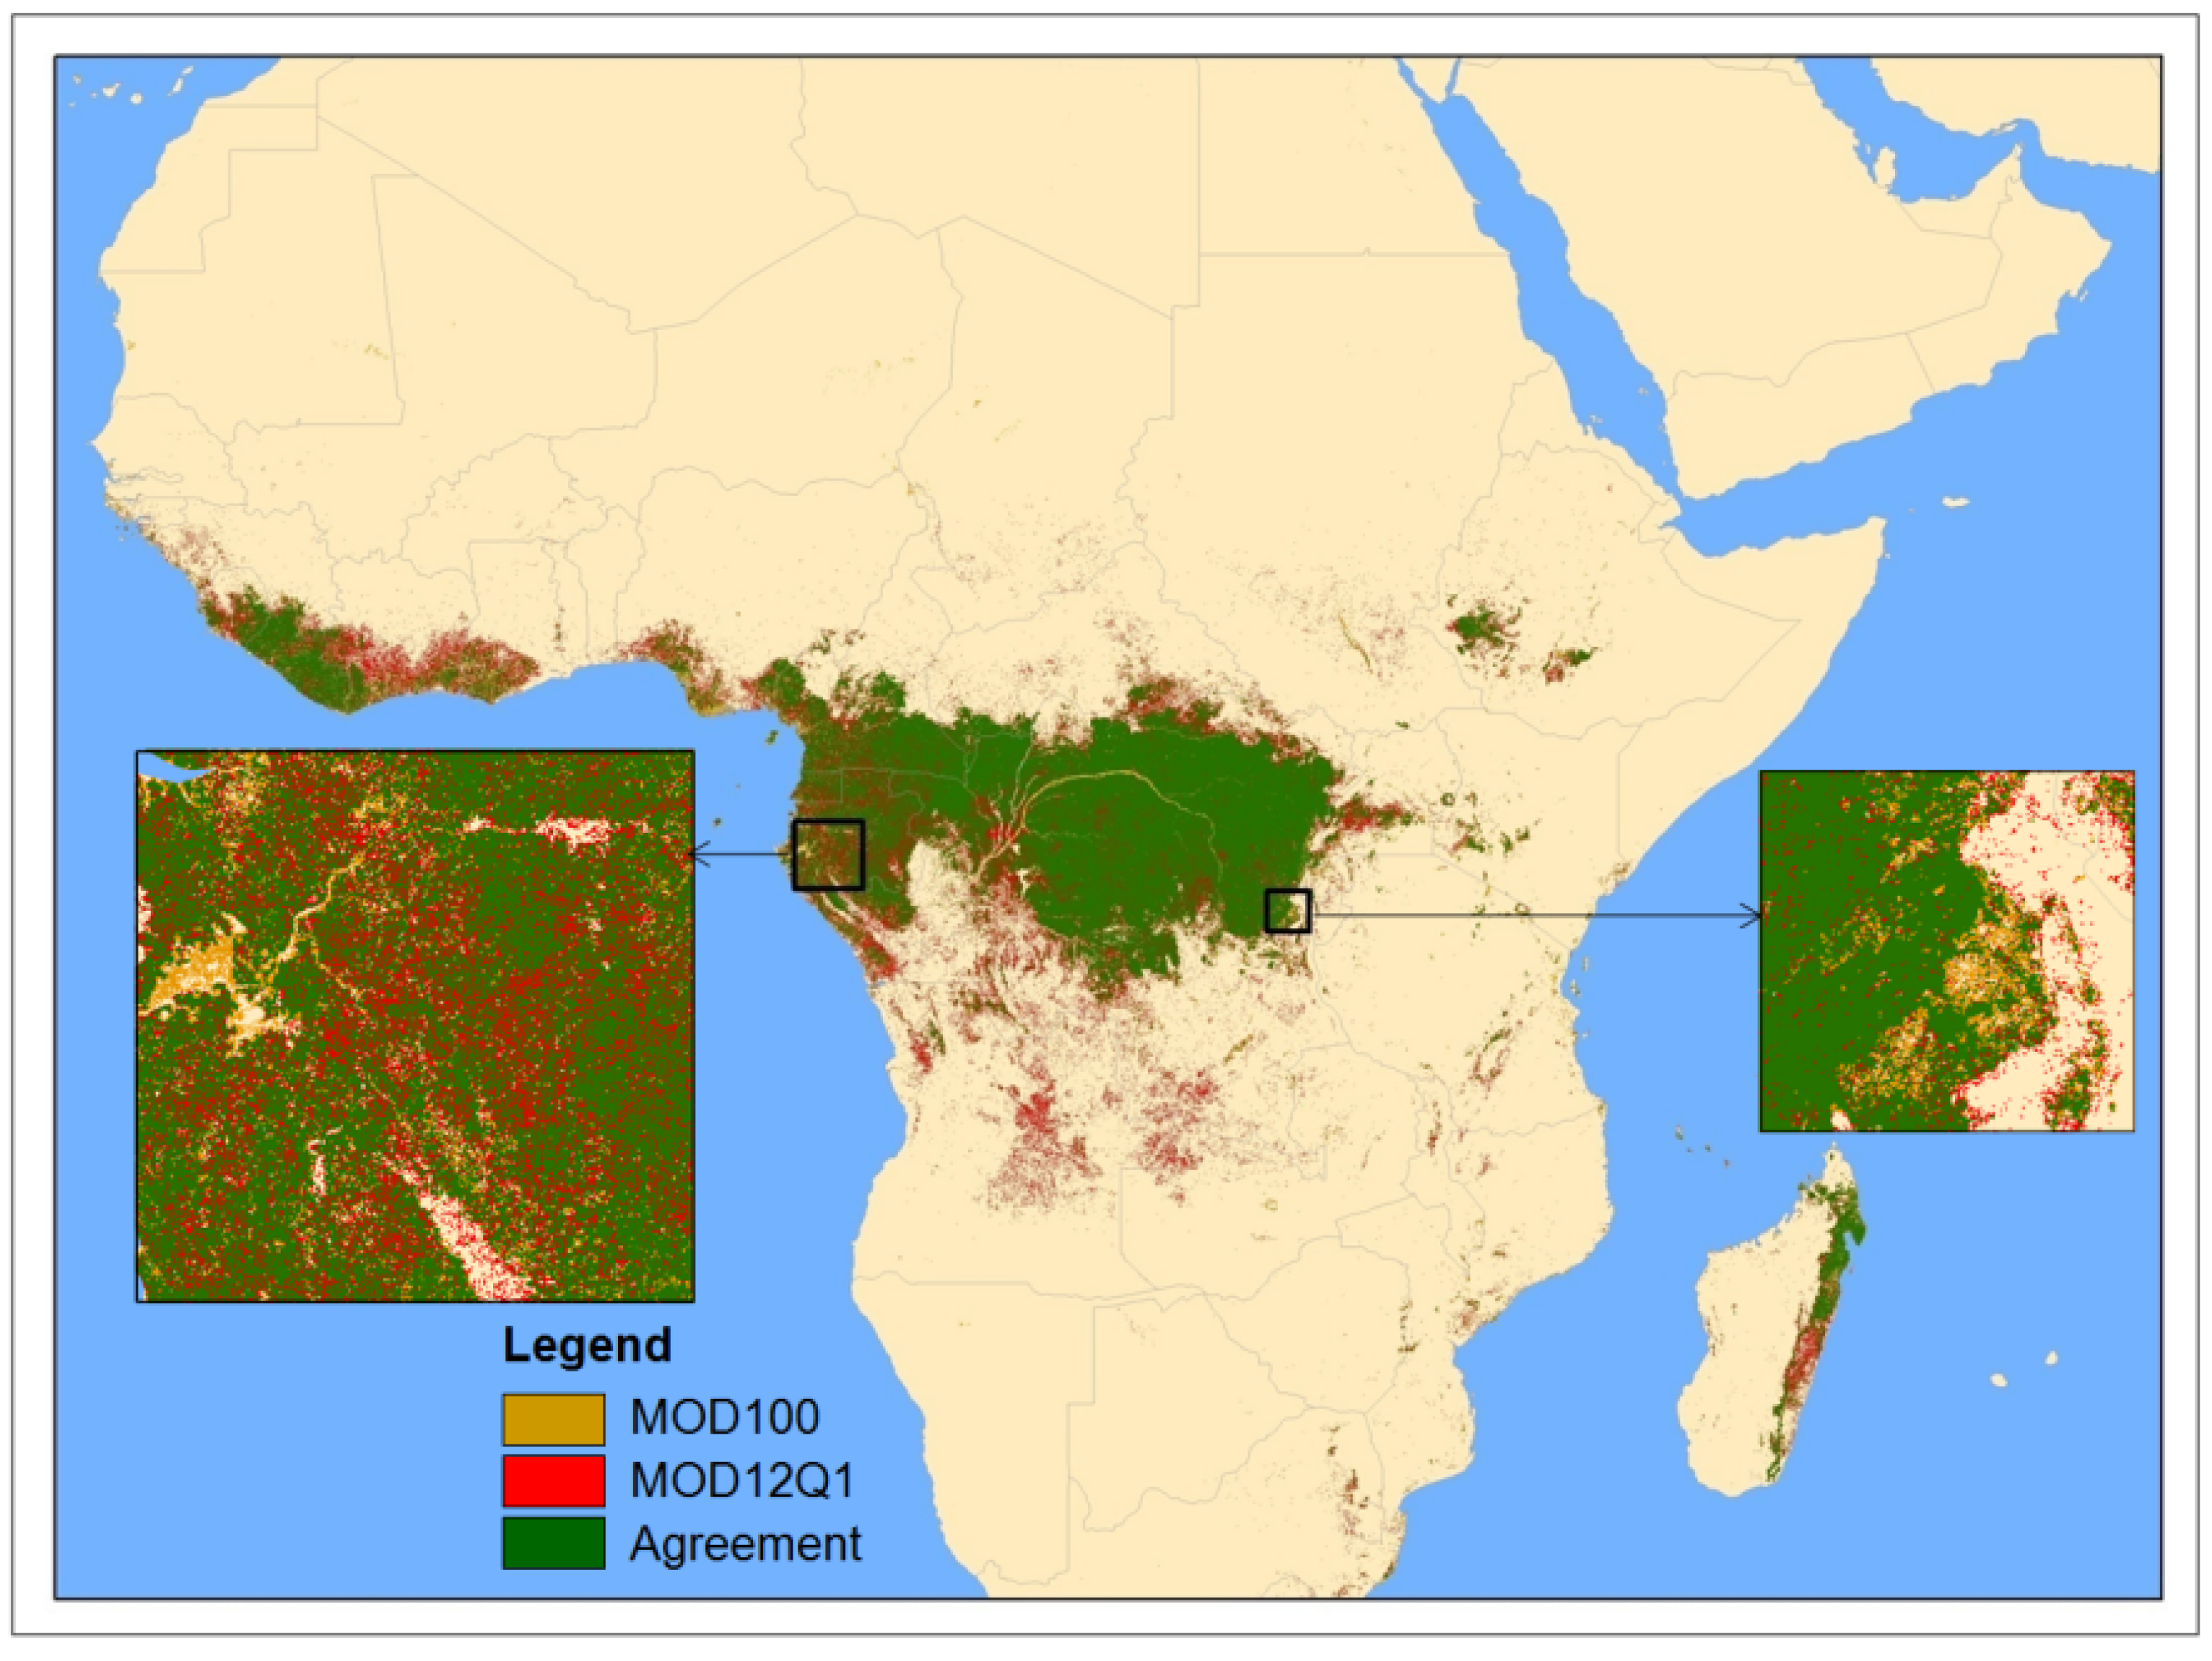
4.2. The Area and Spatial Distribution of Evergreen Forests in Tropical Africa
| Name of the country | Total geographical area (103 ha) | FFRA 2000 (103 ha) | GLC 2000 (103 ha) | MOD12Q1 (103 ha) | MOD100 (103 ha) | MOD100 forest to geographical area (%) |
|---|---|---|---|---|---|---|
| Angola | 124737 | 17714 | 2114 | 11413 | 1586 | 1.3 |
| Benin | 11618 | 1652 | 0 | 90 | 9 | 0.1 |
| Botswana | 57834 | 30 | 0 | 52 | 5 | 0.0 |
| Burkina Faso | 27234 | 731 | 0 | 61 | 0 | 0.0 |
| Burundi | 2719 | 1 | 5 | 210 | 84 | 3.1 |
| Cameroon | 46476 | 16079 | 18158 | 22143 | 18391 | 39.6 |
| Central African Republic | 61864 | 9713 | 8171 | 7559 | 4686 | 7.6 |
| Chad | 127186 | 76 | 1 | 451 | 65 | 0.1 |
| Comoros | 172 | 39 | 47 | 101 | 77 | 44.8 |
| Congo | 34402 | 20381 | 19247 | 23612 | 18471 | 53.7 |
| Congo (DRC) | 232662 | 115560 | 85339 | 132539 | 110135 | 47.3 |
| Cote d'Ivoire | 32133 | 9034 | 1244 | 9280 | 4564 | 14.2 |
| Djibouti | 2144 | 0 | 0 | 2 | 0 | 0.0 |
| Equatorial Guinea | 2692 | 1778 | 2031 | 2508 | 2032 | 75.5 |
| Eritrea | 12090 | 2 | 0 | 3 | 1 | 0.0 |
| Ethiopia | 112754 | 2835 | 323 | 4756 | 3037 | 2.7 |
| Gabon | 26069 | 19399 | 22575 | 22763 | 17526 | 67.2 |
| Ghana | 23904 | 3639 | 1201 | 4219 | 2644 | 11.1 |
| Guinea | 24505 | 5752 | 282 | 1938 | 972 | 4.0 |
| Guinea-Bissau | 3326 | 1364 | 6 | 328 | 253 | 7.6 |
| Kenya | 58185 | 965 | 397 | 1601 | 1399 | 2.4 |
| Lesotho | 2408 | 0 | 0 | 50 | 0 | 0.0 |
| Liberia | 9600 | 5991 | 2714 | 8755 | 8015 | 83.5 |
| Madagascar | 59300 | 8359 | 1434 | 9870 | 7448 | 12.6 |
| Malawi | 11849 | 402 | 88 | 330 | 133 | 1.1 |
| Mali | 125229 | 1916 | 1 | 52 | 12 | 0.0 |
| Mauritania | 103849 | 2 | 0 | 2 | 112 | 0.1 |
| Mayotte | 45 | 9 | 16 | 27 | 15 | 33.3 |
| Mozambique | 78634 | 5344 | 1633 | 1490 | 729 | 0.9 |
| Namibia | 82476 | 15 | 0 | 2 | 15 | 0.0 |
| Niger | 118201 | 0 | 0 | 0 | 101 | 0.1 |
| Nigeria | 90853 | 8374 | 2886 | 6756 | 4501 | 5.0 |
| Rwanda | 2514 | 2 | 0 | 395 | 287 | 11.4 |
| Sao Tome & Principe | 114 | 0 | 25 | 83 | 69 | 60.3 |
| Senegal | 19602 | 1238 | 37 | 108 | 90 | 0.5 |
| Seychelles | 38 | 0 | 0 | 12 | 24 | 64.7 |
| Sierra Leone | 7249 | 2455 | 352 | 3804 | 2593 | 35.8 |
| Somalia | 63629 | 46 | 41 | 22 | 17 | 0.0 |
| South Africa | 74514 | 503 | 389 | 1211 | 440 | 0.6 |
| St. Helena | 13 | 0 | 0 | 1 | 13 | 99.2 |
| Sudan | 248694 | 603 | 178 | 1709 | 298 | 0.1 |
| Swaziland | 1711 | 28 | 40 | 86 | 34 | 2.0 |
| Tanzania | 94139 | 3956 | 523 | 2162 | 1449 | 1.5 |
| The Gambia | 1072 | 57 | 1 | 19 | 20 | 1.9 |
| Togo | 5712 | 831 | 57 | 88 | 19 | 0.3 |
| Uganda | 24208 | 134 | 80 | 4152 | 2555 | 10.6 |
| Western Sahara | 26902 | 0 | 0 | 0 | 5 | 0.0 |
| Zambia | 75192 | 6481 | 0 | 1721 | 163 | 0.2 |
| Zimbabwe | 38986 | 464 | 55 | 154 | 88 | 0.2 |
| Total Africa | 2391438 | 273954 | 171691 | 288690 | 215184 | 9.0 |

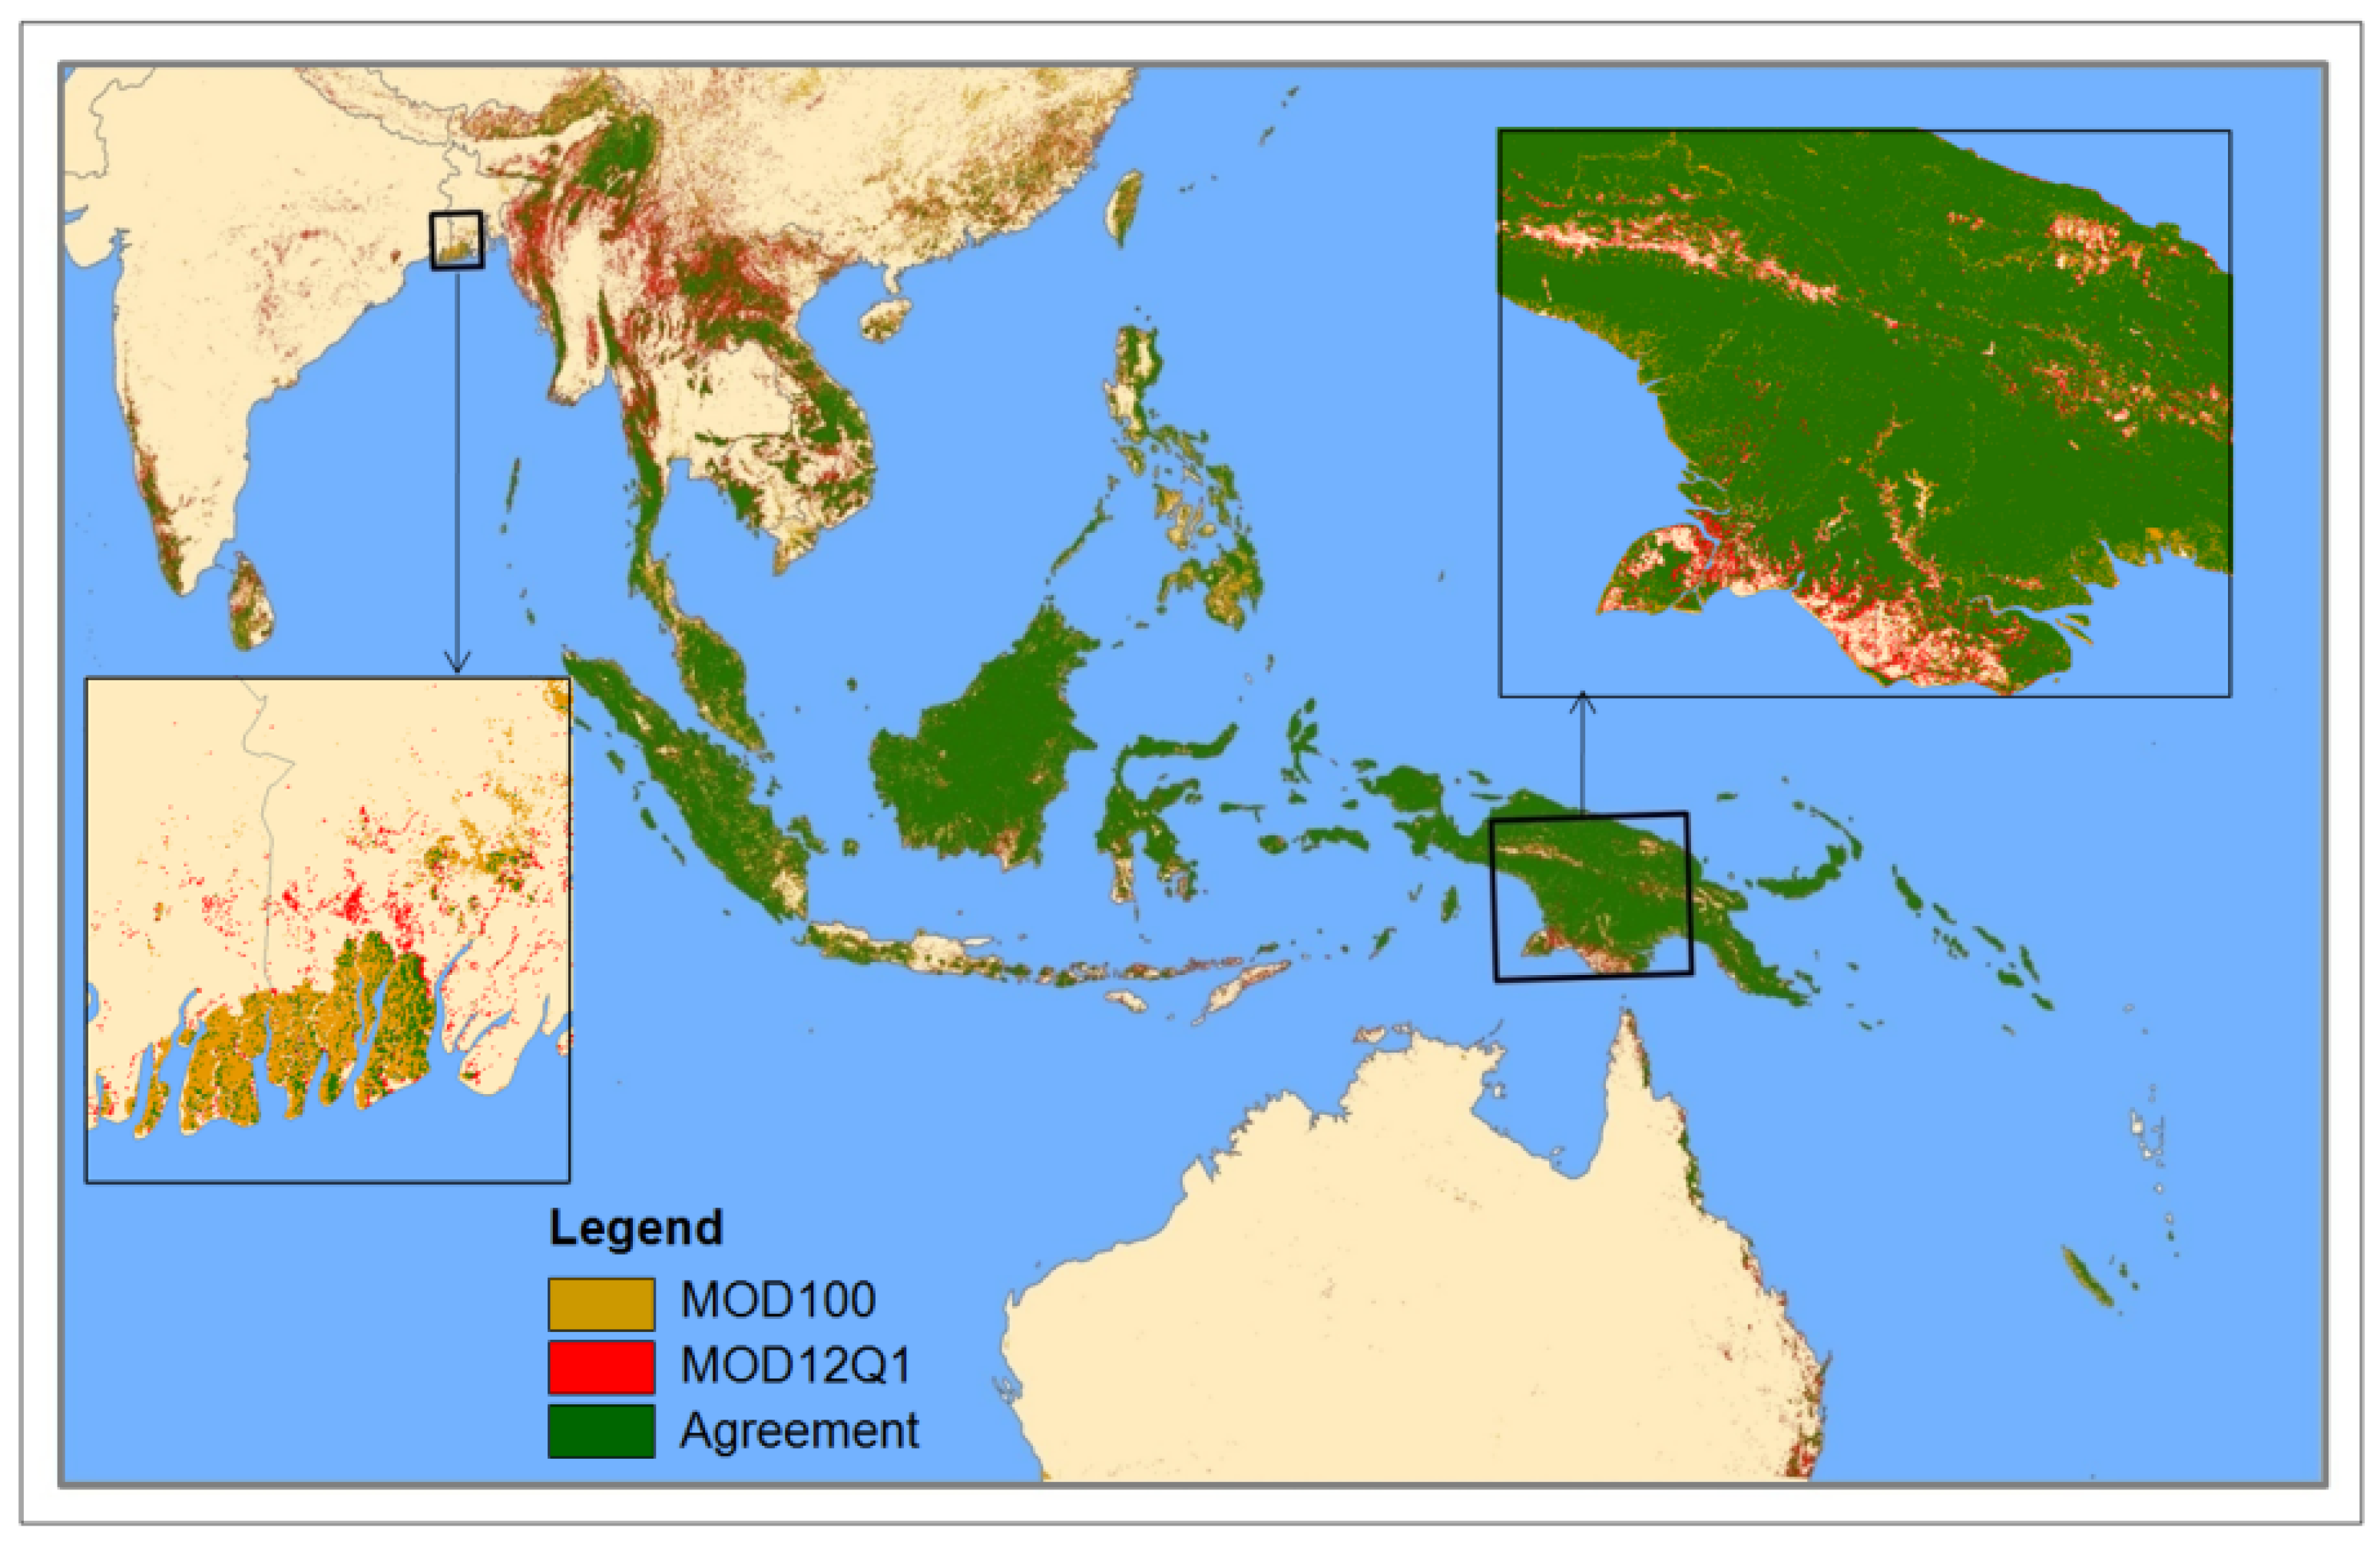
4.3. The Area and Spatial Distribution of Evergreen Forests in Tropical Asia


| Name of the country | Total geographical area (103 ha) | FRA 2000 (103 ha) | GLC 2000 (103 ha) | MOD12Q1 (103 ha) | MOD100 (103 ha) | MOD100 forest to geographical area (%) |
|---|---|---|---|---|---|---|
| Australia | 576175 | 11409 | 3519 | 7654 | 807 | 0.1 |
| Bangladesh | 13788 | 1079 | 407 | 1157 | 459 | 3.3 |
| Bhutan | 3984 | 2062 | 464 | 1332 | 802 | 20.1 |
| Brunei | 575 | 464 | 349 | 530 | 394 | 68.5 |
| Cambodia | 18174 | 6706 | 3909 | 7191 | 2417 | 13.3 |
| China | 208109 | 2985 | 87915 | 23701 | 14566 | 7.0 |
| India | 290417 | 34039 | 4371 | 18671 | 4355 | 1.5 |
| Indonesia | 187876 | 90742 | 93121 | 153364 | 118262 | 62.9 |
| Laos | 22989 | 11827 | 4132 | 17243 | 3188 | 13.9 |
| Malaysia | 32850 | 15920 | 17813 | 28166 | 23425 | 71.3 |
| Myanmar | 66706 | 26553 | 13162 | 31160 | 6393 | 9.6 |
| Nepal | 14335 | 3103 | 1 | 734 | 159 | 1.1 |
| Papua New Guinea | 46204 | 31639 | 29025 | 40792 | 31092 | 67.3 |
| Philippines | 29241 | 4164 | 7249 | 15336 | 15236 | 52.1 |
| Singapore | 55 | 0 | 2 | 10 | 22 | 39.7 |
| Solomon Is. | 2698 | 2250 | 1957 | 2229 | 2160 | 80.1 |
| Sri Lanka | 6604 | 1375 | 838 | 2805 | 401 | 6.1 |
| Thailand | 51228 | 6135 | 4443 | 14309 | 4473 | 8.7 |
| Timor Leste | 1504 | 164 | 169 | 463 | 106 | 7.1 |
| Vietnam | 32428 | 8538 | 5170 | 13761 | 2941 | 9.1 |
| Total | 1605939 | 261155 | 278016 | 380606 | 231659 | 14.4 |
| America | % | Africa | % | Asia | % | World | % | |
|---|---|---|---|---|---|---|---|---|
| MOD100 | 2446968 | 7 | 903025 | 6 | 2839807 | 14 | 6189800 | 9 |
| MOD12Q1 | 3515233 | 10 | 4001688 | 28 | 3789844 | 18 | 11306765 | 16 |
| Agreement | 30617252 | 84 | 9295988 | 65 | 13961799 | 68 | 53875039 | 75 |
| Total | 36579453 | 100 | 14200701 | 100 | 20591450 | 100 | 71371604 | 100 |
5. Summary
Acknowledgements
References and Notes
- Tucker, C.J.; Townshend, J.R.G.; Goff, T.E. African land-cover classification using satellite data. Science 1985, 227, 369–375. [Google Scholar] [CrossRef] [PubMed]
- Laporte, N.T.; Goetz, S.J.; Justice, C.O.; Heinicke, M. A new land cover map of central Africa derived from multi-resolution, multi-temporal AVHRR data. Int. J. Remote Sens. 1998, 19, 3537–3550. [Google Scholar] [CrossRef]
- Stone, T.A.; Schlesinger, P.; Houghton, R.A.; Woodwell, G.M. A map of the vegetation of South America based on satellite imagery. Photogramm. Eng. Remote Sens. 1994, 60, 541–551. [Google Scholar]
- Hansen, M.C.; Townshend, J.R.G.; Defries, R.S.; Carroll, M. Estimation of tree cover using MODIS data at global, continental and regional/local scales. Int. J. Remote Sens. 2005, 26, 4359–4380. [Google Scholar] [CrossRef]
- Hansen, M.C.; DeFries, R.S. Detecting long-term global forest change using continuous fields of tree-cover maps from 8-km advanced very high resolution radiometer (AVHRR) data for the years 1982-99. Ecosystems 2004, 7, 695–716. [Google Scholar] [CrossRef]
- Eva, H.D.; Belward, A.S.; De Miranda, E.E.; Di Bella, C.M.; Gond, V.; Huber, O.; Jones, S.; Sgrenzaroli, M.; Fritz, S. A land cover map of South America. Glob. Change Biol. 2004, 10, 731–744. [Google Scholar] [CrossRef]
- FAO. Global Forest Resources Assessment 2000; Food and Agriculture Organization of the United Nations: Rome, Italy, 2001; p. 511. [Google Scholar]
- FAO. Global Forest Resources Assessment 2005; Food and Agriculture Organization of the United Nations: Rome, Italy, 2005. [Google Scholar]
- Skole, D.; Tucker, C. Tropical deforestation and habitat fragmentation in the Amazon - Satellite data from 1978 to 1988 (Vol 260, Pg 1909, 1993). Science 1993, 261, 1104–1104. [Google Scholar]
- Achard, F.; Eva, H.D.; Stibig, H.J.; Mayaux, P.; Gallego, J.; Richards, T.; Malingreau, J.P. Determination of deforestation rates of the world's humid tropical forests. Science 2002, 297, 999–1002. [Google Scholar] [CrossRef] [PubMed]
- Mayaux, P.; Bartholome, E.; Fritz, S.; Belward, A. A new land-cover map of Africa for the year 2000. J. Biogeogr. 2004, 31, 861–877. [Google Scholar] [CrossRef]
- Hansen, M.C.; DeFries, R.S.; Townshend, J.R.G.; Sohlberg, R.; Dimiceli, C.; Carroll, M. Towards an operational MODIS continuous field of percent tree cover algorithm: examples using AVHRR and MODIS data. Remote Sens. Environ. 2002, 83, 303–319. [Google Scholar] [CrossRef]
- Loveland, T.R.; Belward, A.S. The IGBP-DIS global 1 km land cover data set, DISCover: first results. Int. J. Remote Sens. 1997, 18, 3291–3295. [Google Scholar] [CrossRef]
- Bartholome, E.; Belward, A.S. GLC2000: a new approach to global land cover mapping from Earth observation data. Int. J. Remote Sens. 2005, 26, 1959–1977. [Google Scholar] [CrossRef]
- Friedl, M.A.; McIver, D.K.; Hodges, J.C.F.; Zhang, X.Y.; Muchoney, D.; Strahler, A.H.; Woodcock, C. E.; Gopal, S.; Schneider, A.; Cooper, A.; Baccini, A.; Gao, F.; Schaaf, C. Global land cover mapping from MODIS: algorithms and early results. Remote Sens. Environ. 2002, 83, 287–302. [Google Scholar] [CrossRef]
- Vermote, E.F.; Vermeulen, A. Atmospheric correction algorithm: Spectral reflectance (MOD09), MODIS Algorithm Technical Background Document, version 4.0; University of Maryland: College Park, MA, USA, 1999; p. 107. [Google Scholar]
- Vermote, E.F.; El Saleous, N.Z.; Justice, C.O. Atmospheric correction of MODIS data in the visible to middle infrared: first results. Remote Sens. Environ. 2002, 83, 97–111. [Google Scholar] [CrossRef]
- Tucker, C.J. Red and photographic infrared linear combinations for monitoring vegetation. Remote Sens. Environ. 1979, 8, 127–150. [Google Scholar] [CrossRef]
- Huete, A.R.; Liu, H.Q.; Batchily, K.; vanLeeuwen, W. A comparison of vegetation indices over a global set of TM images for EOS-MODIS. Remote Sens. Environ. 1997, 59, 440–451. [Google Scholar] [CrossRef]
- Xiao, X.; Boles, S.; Frolking, S.; Salas, W.; Moore, B.; Li, C.; He, L.; Zhao, R. Observation of flooding and rice transplanting of paddy rice fields at the site to landscape scales in China using VEGETATION sensor data. Int. J. Remote Sens. 2002, 23, 3009–3022. [Google Scholar] [CrossRef]
- Tucker, C.J. Remote-sensing of Leaf Water-Content in the near-infrared. Remote Sens. Environ. 1980, 10, 23–32. [Google Scholar] [CrossRef]
- Xiao, X.M.; Zhang, Q.Y.; Braswell, B.; Urbanski, S.; Boles, S.; Wofsy, S.; Moore, B.; Ojima, D. Modeling gross primary production of temperate deciduous broadleaf forest using satellite images and climate data. Remote Sens. Environ. 2004, 91, 256–270. [Google Scholar] [CrossRef]
- Ceccato, P.; Flasse, S.; Gregoire, J.M. Designing a spectral index to estimate vegetation water content from remote sensing data - Part 2. Validation and applications. Remote Sens. Environ. 2002, 82, 198–207. [Google Scholar] [CrossRef]
- Ceccato, P.; Flasse, S.; Tarantola, S.; Jacquemoud, S.; Gregoire, J.M. Detecting vegetation leaf water content using reflectance in the optical domain. Remote Sens. Environ. 2001, 77, 22–33. [Google Scholar] [CrossRef]
- Ceccato, P.; Gobron, N.; Flasse, S.; Pinty, B.; Tarantola, S. Designing a spectral index to estimate vegetation water content from remote sensing data: Part 1 - Theoretical approach. Remote Sens. Environ. 2002, 82, 188–197. [Google Scholar] [CrossRef]
- Xiao, X.; Boles, S.; Liu, J.; Zhuang, D.; Liu, M. Characterization of forest types in Northeastern China, using multi-temporal SPOT-4 VEGETATION sensor data. Remote Sens. Environ. 2002, 82, 335–348. [Google Scholar] [CrossRef]
- Chen, D.Y.; Huang, J.F.; Jackson, T.J. Vegetation water content estimation for corn and soybeans using spectral indices derived from MODIS near- and short-wave infrared bands. Remote Sens. Environ. 2005, 98, 225–236. [Google Scholar] [CrossRef]
- Maki, M.; Ishiahra, M.; Tamura, M. Estimation of leaf water status to monitor the risk of forest fires by using remotely sensed data. Remote Sens. Environ. 2004, 90, 441–450. [Google Scholar] [CrossRef]
- Xiao, X.M.; Zhang, Q.Y.; Hollinger, D.; Aber, J.; Moore, B. Modeling gross primary production of an evergreen needleleaf forest using MODIS and climate data. Ecol. Appl. 2005, 15, 954–969. [Google Scholar] [CrossRef]
- Xiao, X.M.; Boles, S.; Liu, J.Y.; Zhuang, D.F.; Frolking, S.; Li, C.S.; Salas, W.; Moore, B. Mapping paddy rice agriculture in southern China using multi-temporal MODIS images. Remote Sens. Environ. 2005, 95, 480–492. [Google Scholar] [CrossRef]
- Boles, S.; Xiao, X.; Liu, J.; Zhang, Q.; Munkhtuya, S.; Chen, S.; Ojima, D. Land cover characterization of Temperate East Asia using multi-temporal VEGETATION sensor data. Remote Sens. Environ. 2004, 90, 477–489. [Google Scholar] [CrossRef]
- Sakamoto, T.; Van Nguyen, N.; Kotera, A.; Ohno, H.; Ishitsuka, N.; Yokozawa, M. Detecting temporal changes in the extent of annual flooding within the Cambodia and the Vietnamese Mekong Delta from MODIS time-series imagery. Remote Sens. Environ. 2007, 109, 295–313. [Google Scholar] [CrossRef]
- Delbart, N.; Kergoat, L.; Le Toan, T.; Lhermitte, J.; Picard, G. Determination of phenological dates in boreal regions using normalized difference water index. Remote Sens. Environ. 2005, 97, 26–38. [Google Scholar] [CrossRef]
- Delbart, N.; Le Toan, T.; Kergoat, L.; Fedotova, V. Remote sensing of spring phenology in boreal regions: a free of snow-effect method using NOAA-AVHRR and SPOT-VGT data (1982-2004). Remote Sens. Environ. 2006, 101, 52–62. [Google Scholar] [CrossRef]
- Xiao, X.M.; Zhang, Q.Y.; Saleska, S.; Hutyra, L.; De Camargo, P.; Wofsy, S.; Frolking, S.; Boles, S.; Keller, M.; Moore, B. Satellite-based modeling of gross primary production in a seasonally moist tropical evergreen forest. Remote Sens. Environ. 2005, 94, 105–122. [Google Scholar] [CrossRef]
- Mahadevan, P.; Wofsy, S.C.; Matross, D.M.; Xiao, X.M.; Dunn, A.L.; Lin, J.C.; Gerbig, C.; Munger, J.W.; Chow, V.Y.; Gottlieb, E.W. A satellite-based biosphere parameterization for net ecosystem CO2 exchange: Vegetation Photosynthesis and Respiration Model (VPRM). Global Biogeochem. Cycle 2008, 22, G01002. [Google Scholar] [CrossRef]
- Xiao, X.M.; Zhang, Q.Y.; Braswell, B.; Urbanski, S.; Boles, S.; Wofsy, S.; Berrien, M.; Ojima, D. Modeling gross primary production of temperate deciduous broadleaf forest using satellite images and climate data. Remote Sens. Environ. 2004, 91, 256–270. [Google Scholar] [CrossRef]
- Wu, J.B.; Xiao, X.M.; Guan, D.X.; Shi, T.T.; Jin, C.J.; Han, S.J. Estimation of the gross primary production of an old-growth temperate mixed forest using eddy covariance and remote sensing. Int. J. Remote Sens. 2009, 30, 463–479. [Google Scholar] [CrossRef]
- Wu, W.; Wang, S.; Xiao, X.; Yu, G.; Fu, Y.; Li, Z.; Chen, B.; Song, T.; Hao, Y. Modeling gross primary production of a temperate grassland ecosystem in Inner Mongolia, China, using MODIS imagery and climate data. Sci. China Ser. D. 2008, 51, 1–12. [Google Scholar] [CrossRef]
- Yan, H.M.; Fu, Y.; Xiao, X.; Huang, H.; He, H.; Yu, G. Modeling gross primary productivity of winter wheat and maize double-cropping system, using MODIS time series imergy and CO2 eddy flux data. Agr. Ecosyst. Environ. 2009, 129, 391–400. [Google Scholar] [CrossRef]
- Xiao, X.M.; Boles, S.; Frolking, S.; Li, C.S.; Babu, J.Y.; Salas, W.; Moore, B. Mapping paddy rice agriculture in South and Southeast Asia using multi-temporal MODIS images. Remote Sens. Environ. 2006, 100, 95–113. [Google Scholar] [CrossRef]
- Sims, D.A.; Rahman, A.F.; Cordova, V.D.; El-Masri, B.Z.; Baldocchi, D.D.; Bolstad, P.V.; Flanagan, L.B.; Goldstein, A.H.; Hollinger, D.Y.; Misson, L.; Monson, R.K.; Oechel, W.C.; Schmid, H.P.; Wofsy, S.C.; Xu, L. A new model of gross primary productivity for North American ecosystems based solely on the enhanced vegetation index and land surface temperature from MODIS. Remote Sens. Environ. 2008, 112, 1633–1646. [Google Scholar] [CrossRef]
- Sims, D.A.; Rahman, A.F.; Cordova, V.D.; El-Masri, B.Z.; Baldocchi, D.D.; Flanagan, L.B.; Goldstein, A.H.; Hollinger, D.Y.; Misson, L.; Monson, R.K.; Oechel, W.C.; Schmid, H.P.; Wofsy, S.C.; Xu, L.K. On the use of MODIS EVI to assess gross primary productivity of North American ecosystems. J. Geophys. Res-Biogeosci. 2006, 111, G04015. [Google Scholar] [CrossRef]
- Xiao, X.M.; Hagen, S.; Zhang, Q.Y.; Keller, M.; Moore, B. Detecting leaf phenology of seasonally moist tropical forests in South America with multi-temporal MODIS images. Remotee Sens. Environ. 2006, 103, 465–473. [Google Scholar] [CrossRef]
- Mayaux, P.; Eva, H.; Gallego, J.; Strahler, A.H.; Herold, M.; Agrawal, S.; Naumov, S.; De Miranda, E.E.; Di Bella, C.M.; Ordoyne, C.; Kopin, Y.; Roy, P.S. Validation of the global land cover 2000 map. IEEE Tran. Geosci. Remot. Sen. 2006, 44, 1728–1739. [Google Scholar] [CrossRef]
- Strahler, A.; Muchoney, D.; Borak, J.; Friedl, M.; Lambin, E.F.; Moody, A. MODIS Land Cover Product Algorithm Theorectical Basis Document (ATBD), Version 5.0, MODIS Land Cover and Land-Cover Change; Department of Geography, Boston University: Boston, MA, USA, 1999; p. 66. [Google Scholar]
- Herold, M.; Woodcock, C.E.; di Gregorio, A.; Mayaux, P.; Belward, A.S.; Latham, J.; Schmullius, C.C. A joint initiative for harmonization and validation of land cover datasets. IEEE Tran. Geosci. Remot. Sen. 2006, 44, 1719–1727. [Google Scholar] [CrossRef]
- Giri, C.; Zhu, Z.L.; Reed, B. A comparative analysis of the Global Land Cover 2000 and MODIS land cover data sets. Remote Sens. Environ. 2005, 94, 123–132. [Google Scholar] [CrossRef]
- Fritz, S.; Lee, L. Comparison of land cover maps using fuzzy agreement. Int. J. Geogr. Inf. Sci. 2005, 19, 787–807. [Google Scholar] [CrossRef]
- Loveland, T.R.; Reed, B.C.; Brown, J.F.; Ohlen, D.O.; Zhu, Z.; Yang, L.; Merchant, J.W. Development of a global land cover characteristics database and IGBP DISCover from 1 km AVHRR data. Int. J. Remote Sens. 2000, 21, 1303–1330. [Google Scholar] [CrossRef]
- Gilbert, M.; Xiao, X.M.; Pfeiffer, D.U.; Epprecht, M.; Boles, S.; Czarnecki, C.; Chaitaweesub, P.; Kalpravidh, W.; Minh, P.Q.; Otte, M.J.; Martin, V.; Slingenbergh, J. Mapping H5N1 highly pathogenic avian influenza risk in Southeast Asia. Proc. Nat. Acad. Sci. USA. 2008, 105, 4769–4774. [Google Scholar] [CrossRef] [PubMed]
© 2009 by the authors; licensee Molecular Diversity Preservation International, Basel, Switzerland. This article is an open-access article distributed under the terms and conditions of the Creative Commons Attribution license (http://creativecommons.org/licenses/by/3.0/).
Share and Cite
Xiao, X.; Biradar, C.M.; Czarnecki, C.; Alabi, T.; Keller, M. A Simple Algorithm for Large-Scale Mapping of Evergreen Forests in Tropical America, Africa and Asia. Remote Sens. 2009, 1, 355-374. https://doi.org/10.3390/rs1030355
Xiao X, Biradar CM, Czarnecki C, Alabi T, Keller M. A Simple Algorithm for Large-Scale Mapping of Evergreen Forests in Tropical America, Africa and Asia. Remote Sensing. 2009; 1(3):355-374. https://doi.org/10.3390/rs1030355
Chicago/Turabian StyleXiao, Xiangming, Chandrashekhar M. Biradar, Christina Czarnecki, Tunrayo Alabi, and Michael Keller. 2009. "A Simple Algorithm for Large-Scale Mapping of Evergreen Forests in Tropical America, Africa and Asia" Remote Sensing 1, no. 3: 355-374. https://doi.org/10.3390/rs1030355
APA StyleXiao, X., Biradar, C. M., Czarnecki, C., Alabi, T., & Keller, M. (2009). A Simple Algorithm for Large-Scale Mapping of Evergreen Forests in Tropical America, Africa and Asia. Remote Sensing, 1(3), 355-374. https://doi.org/10.3390/rs1030355