Article

Integrated Methodology for Estimating Water Use in Mediterranean Agricultural Areas

1
Laboratory of Remote Sensing and GIS, School of Agriculture, Aristotle University of Thessaloniki, Univ. Box 259, Thessaloniki 54124, Greece
2
Hellenic Ministry of Rural Development and Food, Directorate of Water Reclamation and Soil-Water Resources Planning, Serafi 60 & Liosion, Athens 10445, Greece
3
Laboratory of Applied Soil Science, School of Agriculture, Aristotle University of Thessaloniki, Thessaloniki 54124, Greece
*
Author to whom correspondence should be addressed.
Remote Sens. 2009, 1(3), 445-465; https://doi.org/10.3390/rs1030445
Submission received: 20 May 2009 / Revised: 10 July 2009 / Accepted: 3 August 2009 / Published: 20 August 2009

Abstract

:
Agricultural use is by far the largest consumer of fresh water worldwide, especially in the Mediterranean, where it has reached unsustainable levels, thus posing a serious threat to water resources. Having a good estimate of the water used in an agricultural area would help water managers create incentives for water savings at the farmer and basin level, and meet the demands of the European Water Framework Directive. This work presents an integrated methodology for estimating water use in Mediterranean agricultural areas. It is based on well established methods of estimating the actual evapotranspiration through surface energy fluxes, customized for better performance under the Mediterranean conditions: small parcel sizes, detailed crop pattern, and lack of necessary data. The methodology has been tested and validated on the agricultural plain of the river Strimonas (Greece) using a time series of Terra MODIS and Landsat 5 TM satellite images, and used to produce a seasonal water use map at a high spatial resolution. Finally, a tool has been designed to implement the methodology with a user-friendly interface, in order to facilitate its operational use.

Graphical Abstract

1. Introduction

The world is facing a freshwater crisis and irrigated agriculture creates a high pressure as it is the single largest freshwater consumer on a global scale [1,2]. Although driven by the need for increased production, the freshwater exploitation is frequently unsustainable, leading to depletion and deterioration of water resources [3]. To alleviate these threats, the European Commission [4] has initiated the Water Framework Directive (WFD), with the general objectives of improving water quality, guaranteeing provision of sufficient quantities of good quality water for all purposes, and avoiding any long-term deterioration. Among others, the WFD demands identification of pressures from agriculture and estimation of water abstractions, with the overall aim of recovering the costs of water services, including environmental and resource costs. The WFD dictates that monitoring should be performed at the basin level. Although scale specifications are not defined, detailed mapping is required in the fragmented Mediterranean agricultural environment, thereby increasing the cost of monitoring [5].
Despite exceeding 80% of the total use in the Mediterranean, agricultural water use is difficult to estimate in large irrigation systems, especially due to the presence of private pumps with no water meters. Numerous methods have been developed to estimate this important, yet often unknown, part of the water cycle. Ground based measurement methods employ specialized instruments such as lysimeters, scintillometers, and eddy covariance meters to estimate, directly or indirectly, the water loss through evapotranspiration [6,7]. They provide an accurate estimation of evapotranspiration at a specific location, but because of their high cost they are limited for use in local validation of other methods. The water balance methods use hydrological models, such as Soil Water Atmosphere Plant – SWAP [8], Semi-distributed Land Use-based Runoff Processes–SLURP [9], and Simulation of the Water Balance of a Cropped Soil - SWBACROS [9,10,11], to estimate the components of the water cycle. However, the substantial data requirements for such methods can be prohibitive in ungauged basins. An important milestone in the category of meteorological based methods is the publication of FAO 56 method [12], which has since been considered the standard method for estimating crop evapotranspiration and subsequently crop water use. However, the spatial component of the FAO 56 method was originally missing and thus the crop-coefficient remote sensing methods have combined FAO 56 with satellite earth observation [13,14]. Despite their simplicity, the crop-coefficient remote sensing methods may overestimate evapotranspiration at the basin level, as they frequently assume optimal and homogeneous growing of each crop, because it is not feasible to account for the specific conditions (growth stage, nutrient deficiencies, stresses, etc.) at the field level.
Extensive overviews of remote sensing methods for estimating evapotranspiration have been published [15,16,17], within which the energy balance methods stand out because of their advantages: the Surface Energy Balance Index–SEBI [18], Surface Energy Balance System–SEBS [17] and Surface Energy Balance Algorithms for Land–SEBAL [19] take into account the crop growing conditions and do not require a satellite-based crop classification, while the Two-Source Model–TSM [20], Disaggregated Atmosphere Land Exchange Inverse model–DisALEXI [21] and Dual-Temperature Difference–DTD [22] do not require local data or the identification of extreme conditions. These algorithms have been designed to calculate the energy balance at the regional scale, however, local parameterization can improve the accuracy of the model [23,24]. Customizations of the above mentioned methods offering solutions to specific conditions of Mediterranean irrigated basins have been suggested in western Turkey [25], France [26,27,28] and Spain [29]. But an integrated top-to-bottom remote sensing approach is missing. The aim of this work is to present an integrated methodology for the improved estimation of agricultural water use in Greek basins using satellite earth observation. The specific objectives are: (i) to improve existing methods for operation in Greek river basins and integrate them into an operational methodology, (ii) evaluate the methodology during its application in an irrigated river basin, and (iii) design and implement a user-friendly tool for further use of the methodology by the water managers.

2. Materials and Methods

2.1. Description of Study Area

The study area is the Greek part of the Strimonas river basin (Figure 1). The total basin of the trans-boundary river covers an area of 17,250 km2, with its upstream areas situated in Bulgaria (65% of total area). A large reservoir (artificial Lake Kerkini) was constructed in the 1930s immediately upstream of the Strimonas plain in Greece, to store water for irrigation and to prevent flood events. With progressive drainage networks, agricultural land has been reclaimed from the wetlands and temporary lakes that had dominated the flood plain of Strimonas. By the 1960’s, an extended irrigation system (the largest in Greece) had been developed in the plain, which taps water from the reservoir and river diversion dams. Water is distributed mainly by open canals, which are predominantly lined but often badly maintained, thus offering low conveyance efficiencies. Local groundwater pumping stations provide supplementary water to account for the inefficient operation of the irrigation system. The large quantities of drainage water are reused for irrigating downstream regions. The total irrigated area is estimated in excess of 800 km2, including the areas irrigated by privately operated pump wells (upper reaches) [30]. The main agricultural crops are irrigated maize, cotton, rice, beetroot, alfalfa, and rain-fed winter cereals. Agricultural and livestock production are the main economic activities in the site. Water is managed by 14 Local Water Organizations, which are divided according to canal command areas. They undertake the tasks of water distribution, fees collection from farmers based on their irrigated area, and canal maintenance.
Figure 1. Location of the study area.
Remotesensing 01 00445 g001
Several environmental problems are reported to be connected to the unwise management of irrigation water. Due to Lake Kerkini’s operation as an irrigation reservoir, its water level fluctuates by 5 m during the irrigation season (May to September) and its surface decreases from 75 km2 in spring to 50 km2 in early autumn. As a result, the riparian forest and other key habitats of this wetland of international importance have decreased drastically. Also the river's estuary suffers from low water quality due to agricultural drainage and low discharge during the irrigation season, which is not sufficient to sustain the coastal ecosystem. Finally, salinization and sodification have been reported in areas where upstream drainage water is the main source of irrigation or where the water table is high.

2.2. Data Description

The changing spatial pattern of irrigated crops during the irrigation season in the study area (from beginning of May to end of September) was provided by frequent, free of charge acquisitions from the Terra/MODIS sensor. Three Terra/MODIS products were required for SEBAL implementation: Surface Reflectance (MOD09Q1 at 250 m and MOD09A1 at 500 m resolution) and Land Surface Temperature (LST) and Emissivity products (MOD11A2 at 1 km resolution). All products have a level 3 of processing and provide 8-day composite images. MODIS images are acquired daily and the data quality may be affected by the cloud cover and variable viewing angle, thus decreasing the quality of the outputs. For this reason, low quality pixels (e.g., cloud affected) are substituted with other unaffected pixels of the same location but from another date within the 8-day period. The day of acquisition of each pixel is recorded in the product files. Altogether, 23 layers were downloaded for each of the 14 dates necessary to cover the irrigation season using the Earth Observing System (EOS) data gateway of the Land Processes Distributed Active Archive Center [31].
Daily meteorological data were required for water use estimation. These were extreme air temperature (Tmin and Tmax) and wind speed and relative humidity at the satellite overpass time acquired from three automatic meteorological stations located in the irrigated area. Instantaneous air temperatures (Ta) were also collected from the same stations in order to derive the LST to Ta relation and thus produce a Ta map of the area. Daily ETo values were estimated using the FAO 56 method [12] to describe the fluctuation of evapotranspiration from day to day. Due to the close proximity of the stations it was not possible to perform spatial interpolation, thus the readings were averaged and meteorological conditions were considered uniform across the study area. Data from these meteorological stations were available only for the period starting from June 2007, due to late installation of the systems.
One Landsat 5 TM image (acquired on 19/07/2007) was required to cover the spatial extent of the study area. The Landsat TM sensor provides data at high multispectral content (blue, green, red, near infrared, middle infrared, thermal infrared and short wave infrared bands), at a spatial resolution of 30 m (120 m for the thermal band). Being based on archived data collected every 16 days, it was possible to select an image strategically acquired at the peak of the irrigation season, therefore representative of the spatial distribution of the highest water consumption.

2.3. Integrated Methodology Customized for Greek Conditions

An integrated methodology for the production of a high-resolution water use map of Greek river basin is presented, incorporating existing methods, after customization to the local conditions of Greece. The methodology consists of the following components.

2.3.1. Estimating surface energy fluxes

The Surface Energy Balance Algorithm for Land (SEBAL) model aims at the empirical determination of the actual evapotranspiration (ETa) by solving the Energy Balance equation:
λE = Rn - G0 - H
The latent heat flux (λE) once divided by the latent heat of vaporization (λ) provides an evapotranspiration approximation.
In SEBAL, the net radiation Rn is computed from satellite-measured broad-band reflectance and surface temperature, while the soil heat flux G0 is estimated from Rn, the surface temperature, and vegetation indices. The sensible heat flux H, is considered proportional to the ratio between the surface-air temperature difference (dT) and the bulk aerodynamic resistance (rah) [19].
SEBAL uses the partitioning of H and λE as described in [19], where the evaporative fraction (Λ) is calculated as:
Remotesensing 01 00445 i001
The underlying assumption is that Λ is constant over the day, or said differently: the instantaneous partition of λE and H is equal to the average diurnal partitioning ratio. The difference between Λ at the moment of satellite overpass and Λ derived from the 24-hour integrated energy balance has been considered as non significant [32].
The latent heat flux was calculated based on Λ, multiplied by the diurnal net radiation at earth surface (Rnday) that is itself retrieved spatially from the surface broadband Αlbedo (α) and the single-way transmissivity of the atmosphere (τsw).
Remotesensing 01 00445 i002
The implementation of SEBAL requires multi-spectral remote sensing data (blue, green, red, near infrared, shortwave infrared, and thermal infrared bands), meteorological data (instantaneous wind speed, instantaneous relative humidity, and extreme air temperatures), meteorological station characteristics (height of wind measurement and vegetation height around met station), and topological data (elevation). Although SEBAL has been developed for instantaneous data at the time of image overpass, 8-day composite images can be used as long as the date and time of each pixel's acquisition is incorporated into the algorithm, and SEBAL is applied at the pixel level.
SEBAL provides a good estimation of λE in flat agricultural areas. It has been tested extensively under several climatic conditions at both field and regional scales. High accuracy of results has been reported [33]. Regarding Mediterranean areas, SEBAL has been validated in the South-East of France [28] and in the Gediz river basin in western Turkey [25]. Several customizations are proposed hereafter to provide optimum performance of SEBAL in the local conditions.

2.3.2. Customization of Albedo (α) estimation

Albedo, which is input to SEBAL and represents the shortwave surface reflectance in the range of 0.3–3 μm, was calculated from band-wise surface reflectance (SR). Then, a specific histogram stretching method was designed for each type of input imagery conditions and characteristics. The histogram stretching method was different in calibration for Landsat 5 TM and Terra MODIS, since spatial resolution, atmospheric and geographical conditions are different from one to another. For Terra MODIS, although surface reflectance products were already available by the MODIS Science Team [31], it was found useful to standardize their response inside image time series acquired under different atmospheric conditions/corrections performed by the automated algorithm [34]. Available Landsat 5 TM data [35] were top-of-atmosphere readings without any atmospheric correction. We used a specific histogram stretch to produce surface albedo without an atmospheric correction model.
Considering Figure 2, the algorithm first identifies the three highest points (Top: 1, 2, 3) and the six bottom points (bottom: 1a, 1b, 2a, 2b, 3a, 3b). It then stretches the Landsat 5 TM histogram in order to achieve an output Top1 albedo value to 0.05 and Bottom2b albedo value to 0.36, thus forcing the median of water histogram to become 0.05 and the sand median to be 0.36, both values being helpful to SEBAL iteration stability response. For MODIS, the algorithm sets Bottom1a albedo value to 0.05 and Bottom2b albedo value to 0.36, thus stretching with a linear function the whole histogram, thus forcing the water histogram to values higher than or equal to those that correspond to the expected range of water albedo (>0.05). This configuration is necessary for correcting surface albedo of the two input datasets, taking into account their pre-processing steps.
Figure 2. Albedo histogram stretching.
Remotesensing 01 00445 g002

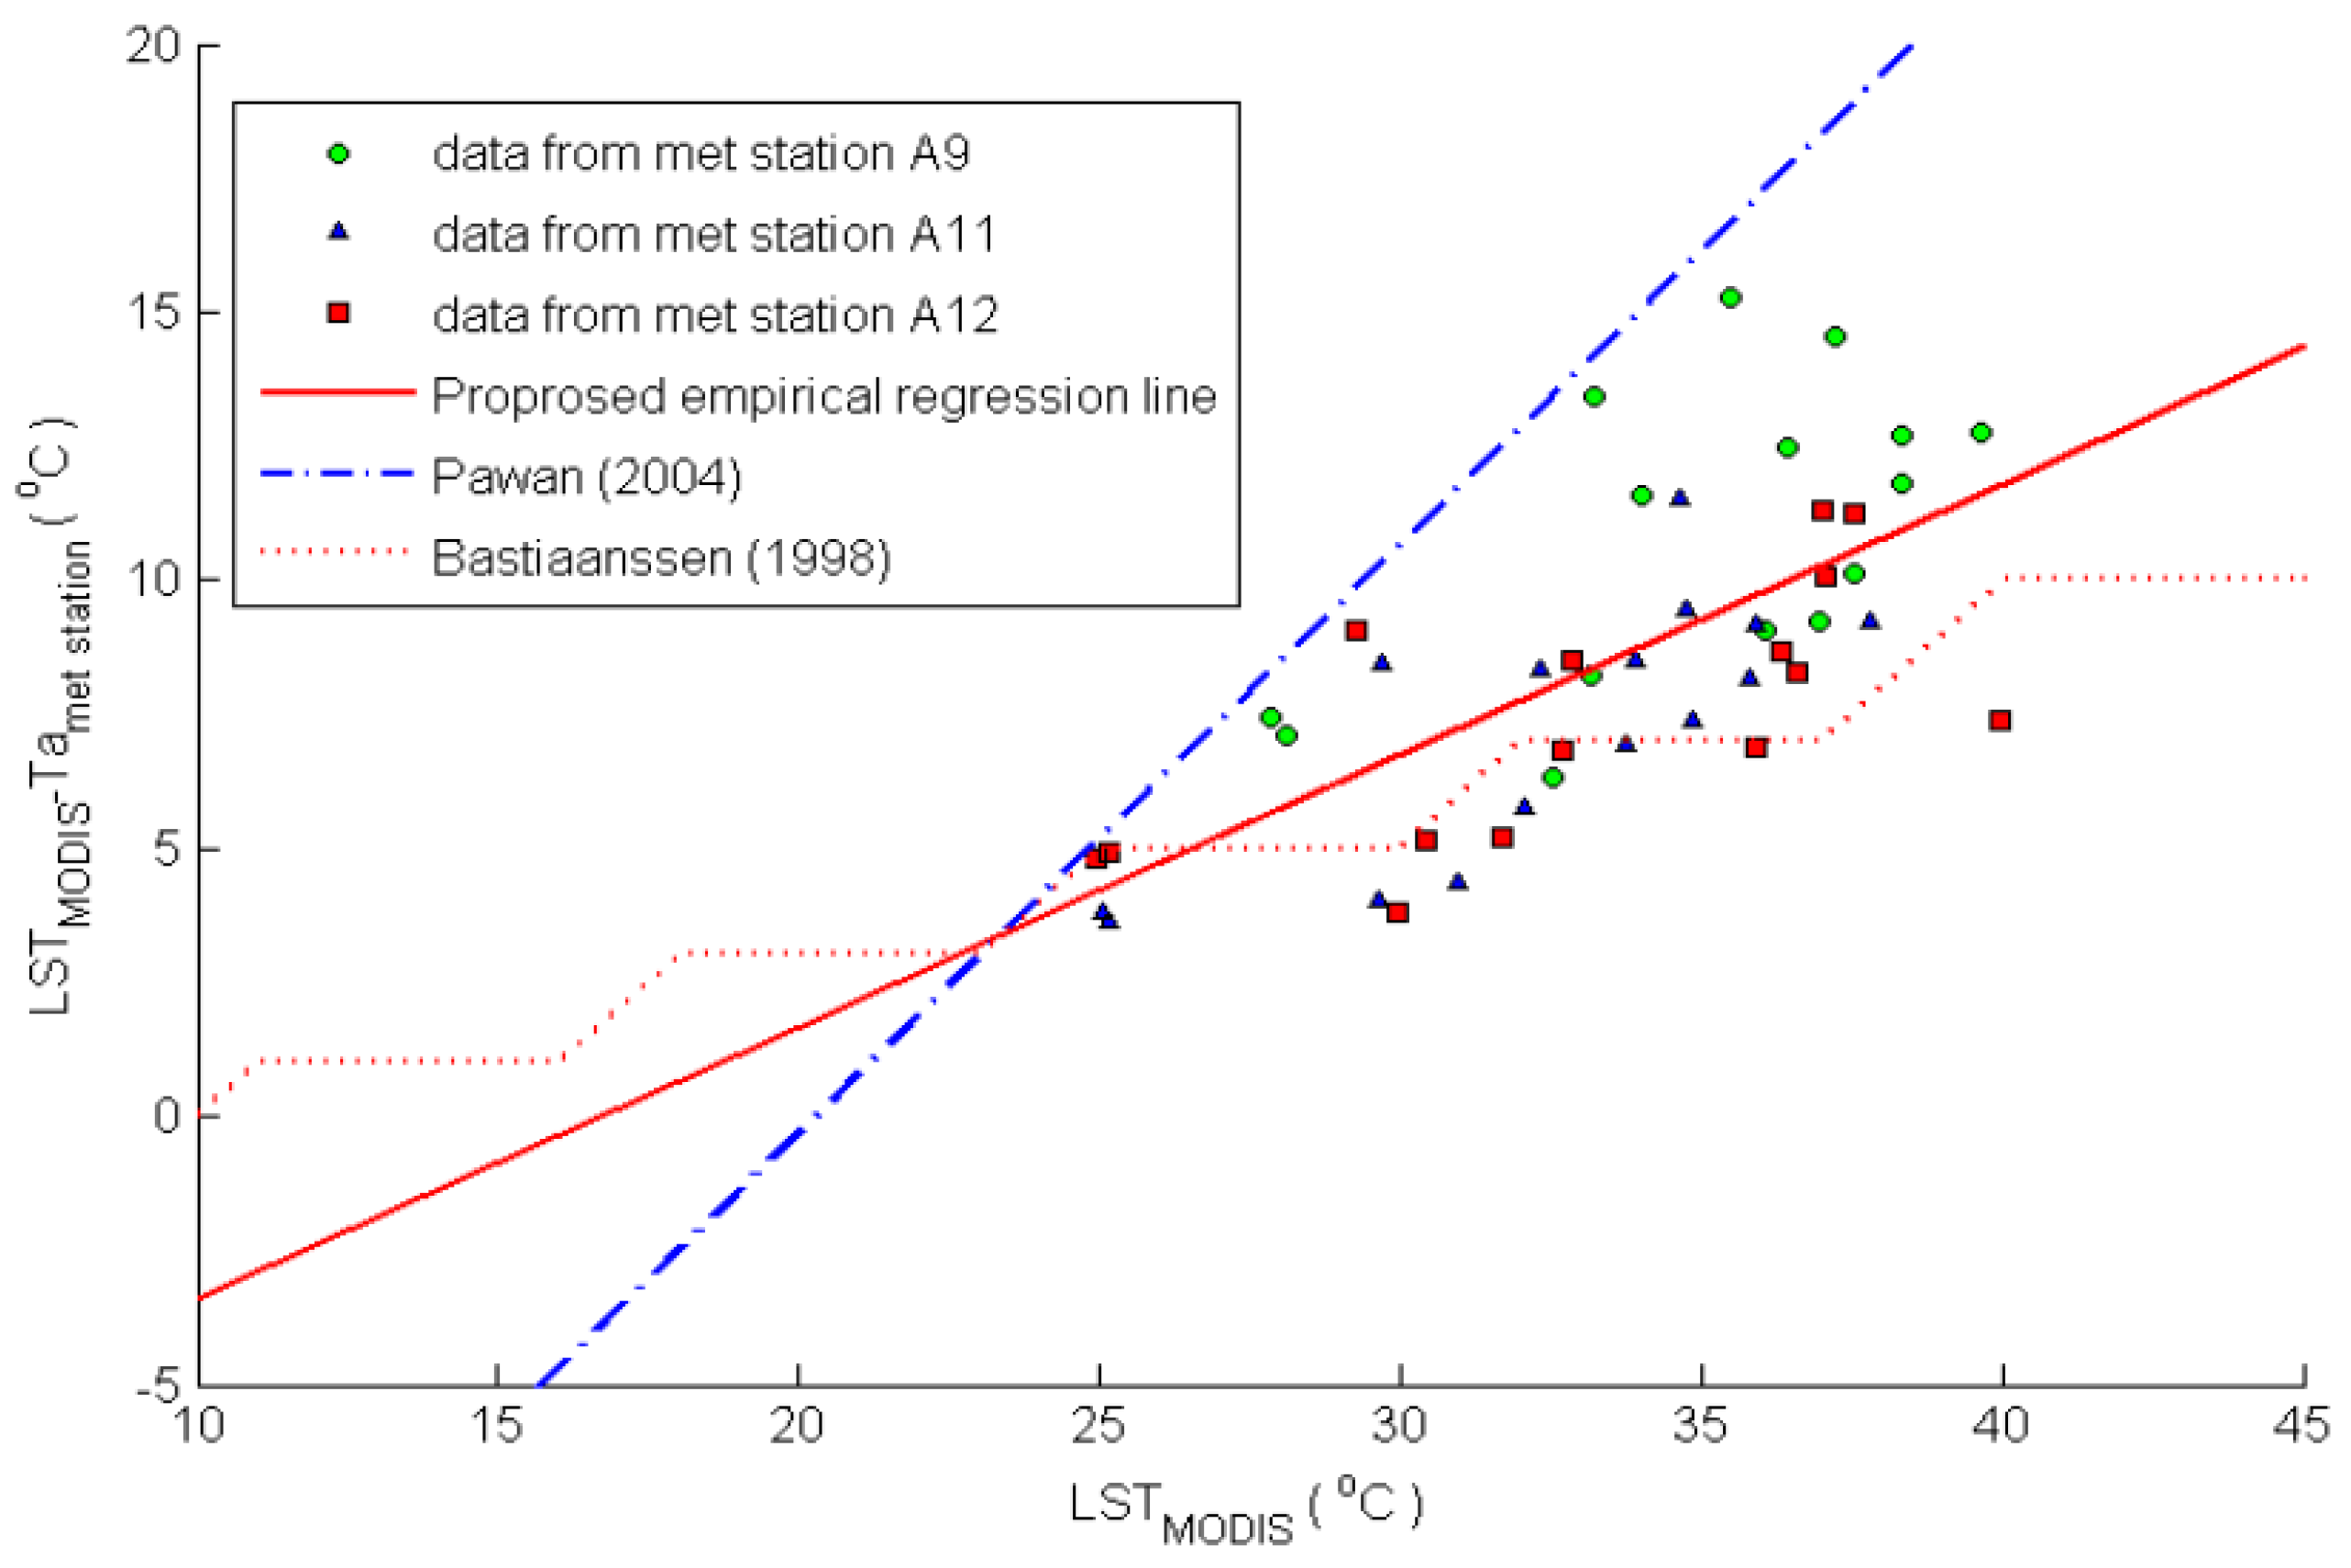
2.3.3. Customization of air temperature (Ta) estimation

Air temperature is required at various processing stages for SEBAL implementation (e.g., Rn, H), either as Ta or dT input, dT being the difference between the surface temperature (Ts) and Ta. Rn is estimated from the incoming longwave radiation Lin that is a function of Ta:
Remotesensing 01 00445 i003
Therefore, the accuracy of the Ta estimation is essential for an optimum accuracy in solving the energy balance equation. However, for the H term:
Remotesensing 01 00445 i004
An initial value of dT is first inserted (use of the radiometric surface temperature as a surrogate for the aerodynamic surface temperature To), which is further adjusted with a set of iterations of estimating H.
A linear relation between dT and Ts has been proposed [36], while others [37] used a step function to retrieve Ta from Ts values. In this study, a regression analysis was performed using the Ta values available from the three meteorological stations and the radiometric LST provided by the MODIS product. The resulting linear equation for the whole irrigation season is the following:
Remotesensing 01 00445 i005
According to Figure 3, the Pawan [36] equation overestimates the LST to Ta temperature difference, while the equation proposed by Bastiaanssen et al. [19] provides closer estimations of the air temperatures. Since ground data are available, the use of the empirical linear relation is advantageous to allow modelling of the local weather conditions in a more realistic way.
As a result, the pixel based assessment of Ta with the SEBAL method of linear relationship between dT and LST provides a Ta map with information on the energy balance variations that point-based air temperature from meteorological stations fail to supply.
Figure 3. Three alternative equations relating surface temperature (Ts) to the air to surface temperature difference (dT).
Remotesensing 01 00445 g003

2.3.4. Considerations in extreme pixel selection

A fundamental advantage of SEBAL is the calibration of the result using pixels of extreme meteorological conditions: a very wet pixel with negligible H (Hwet ~ 0) and a very dry pixel with negligible λE (λEdry ~ 0). Under the Mediterranean semi-arid summer conditions, the wet pixel during the irrigation season is usually a very well irrigated homogeneous patch (rice fields or other water demanding crop). Thus, the wet pixel was selected following the criteria: low temperature, low albedo, and high NDVI. For the dry pixel, it has been suggested to select a patch of desert, burned area, or the outskirts of a densely populated settlement [16]. In the absence of desert or burned areas during the irrigated season in Greece, the dry pixel was searched for in poorly-vegetated areas or harvested winter cereals (low NDVI) presenting a high temperature value and a high albedo.

2.3.5. Integrating over the temporal dimension

The SEBAL and other suggested methods for ETa estimation on certain sample dates during the cropping season give a very good indication of its spatial distribution, but cannot be used directly in water balance studies. The reason behind this is the wide fluctuation of ETa from day to day, depending on meteorological conditions, availability of water, and plant growth (phenological stage). Therefore, in order to obtain an accurate estimation of the seasonal ETa, daily values have to be simulated.
In recent literature [38,39] a method for temporal integration was suggested, in which the fraction ETrFj = ETaj/EToj (where j refers to the satellite image acquisition date and EToj to the potential evapotranspiration for day j) was considered constant for the time period between two consecutive satellite images, and the seasonal ETa (termed ETs) could be simulated with the following equation:
Remotesensing 01 00445 i006
where tj and tj+1 delimit a short time period around the acquisition date j.
The above mentioned equation integrates the time component (ETo, estimated with the FAO 56 method [12]) and the spatial component (ETrF) to describe successfully the daily fluctuation of ETa across the study area. ETa also depends on the availability of water. Spatial variation of water availability can be described by the [tj, tj+1] time interval of the satellite images, which were assumed representative for each period.
This temporal integration method was applied to the MODIS data. Since input images were composites, the day of acquisition could differ from one pixel to another, thus the integration was performed at the pixel level. Despite the use of composite images, data could carry some null values due to cloudy conditions or low-quality data [40]. The appearance of these null values even in a single composite product could influence the result in the whole irrigation season; therefore a dynamic selection of the integration period was designed. The start (resp. end) of the integration period for a certain pixel was designed to be in the middle of the period between this pixel and the temporally preceding (resp. following) pixel with non-null value in the same location. This dynamic selection is based on the assumption that the pixel acquired in the preceding or the following composite is the closest match for a missing pixel value.

2.3.6. Improving spatial resolution

The spatial resolution of ETs described above is limited by the resolution of the sensor (e.g., MODIS: 250–1000 m at nadir). Considering the small parcel sizes in Greece, the detailed crop pattern, and the interspersion of irrigated with non-irrigated fields on the fringe of the irrigated area, it is suggested that a high resolution ETs map is required to adequately describe the pattern of irrigation water use. In such cases, downscaling for higher resolution results can be achieved by merging high resolution data of similar content.
Merging high and low resolution images has been achieved at the pixel, feature or decision level [41]. The resolution (or scale) of several hydrologic parameters has been improved in recent literature, such as precipitation from the TRMM sensor [42], soil moisture from MODIS data [43], and thermal infrared images [44]. In similar studies [39,45] ETs estimated from NOAA AVHRR images (at 1.1 km resolution) were merged with a single day ETa estimated from a Landsat ETM+ image (30–60 m resolution) using the modified Brovey method.
The proposed methodology incorporated the modified Brovey method [39,45] to improve the resolution of the ETs map using higher resolution maps of similar content, such as ETa-Landsat at 30 m. According to this method, the detailed pattern of the ETa map was used as a weight to spatially redistribute the ETs calculated for each 1.21 km2 pixel of the NOAA AVHRR satellite using the formula:
Remotesensing 01 00445 i007
Where Remotesensing 01 00445 i008 is the average of the values of ETETM+ (Landsat) that occupy a pixel of ETs (NOAA). Using this proportional distribution method, the total ETs value calculated for each area of 1.21 km2 was preserved, but redistributed according to the detailed pattern of ETa derived from the ETM+ image. The advantage of the method is that it minimizes the influence of the high-resolution image induced in the methods found in literature (IHS and PC transformation).
The detailed spatial content of these satellite images is sufficient to cover the specific conditions of Greek irrigated river basins. However, care should be given to the selection of their acquisition date. A single date image may be selected, provided that it is representative of the spatial distribution of the seasonal water use, otherwise, if spatial distribution of the irrigation and crop patterns varies over time, several images scattered within the irrigation season should be used.

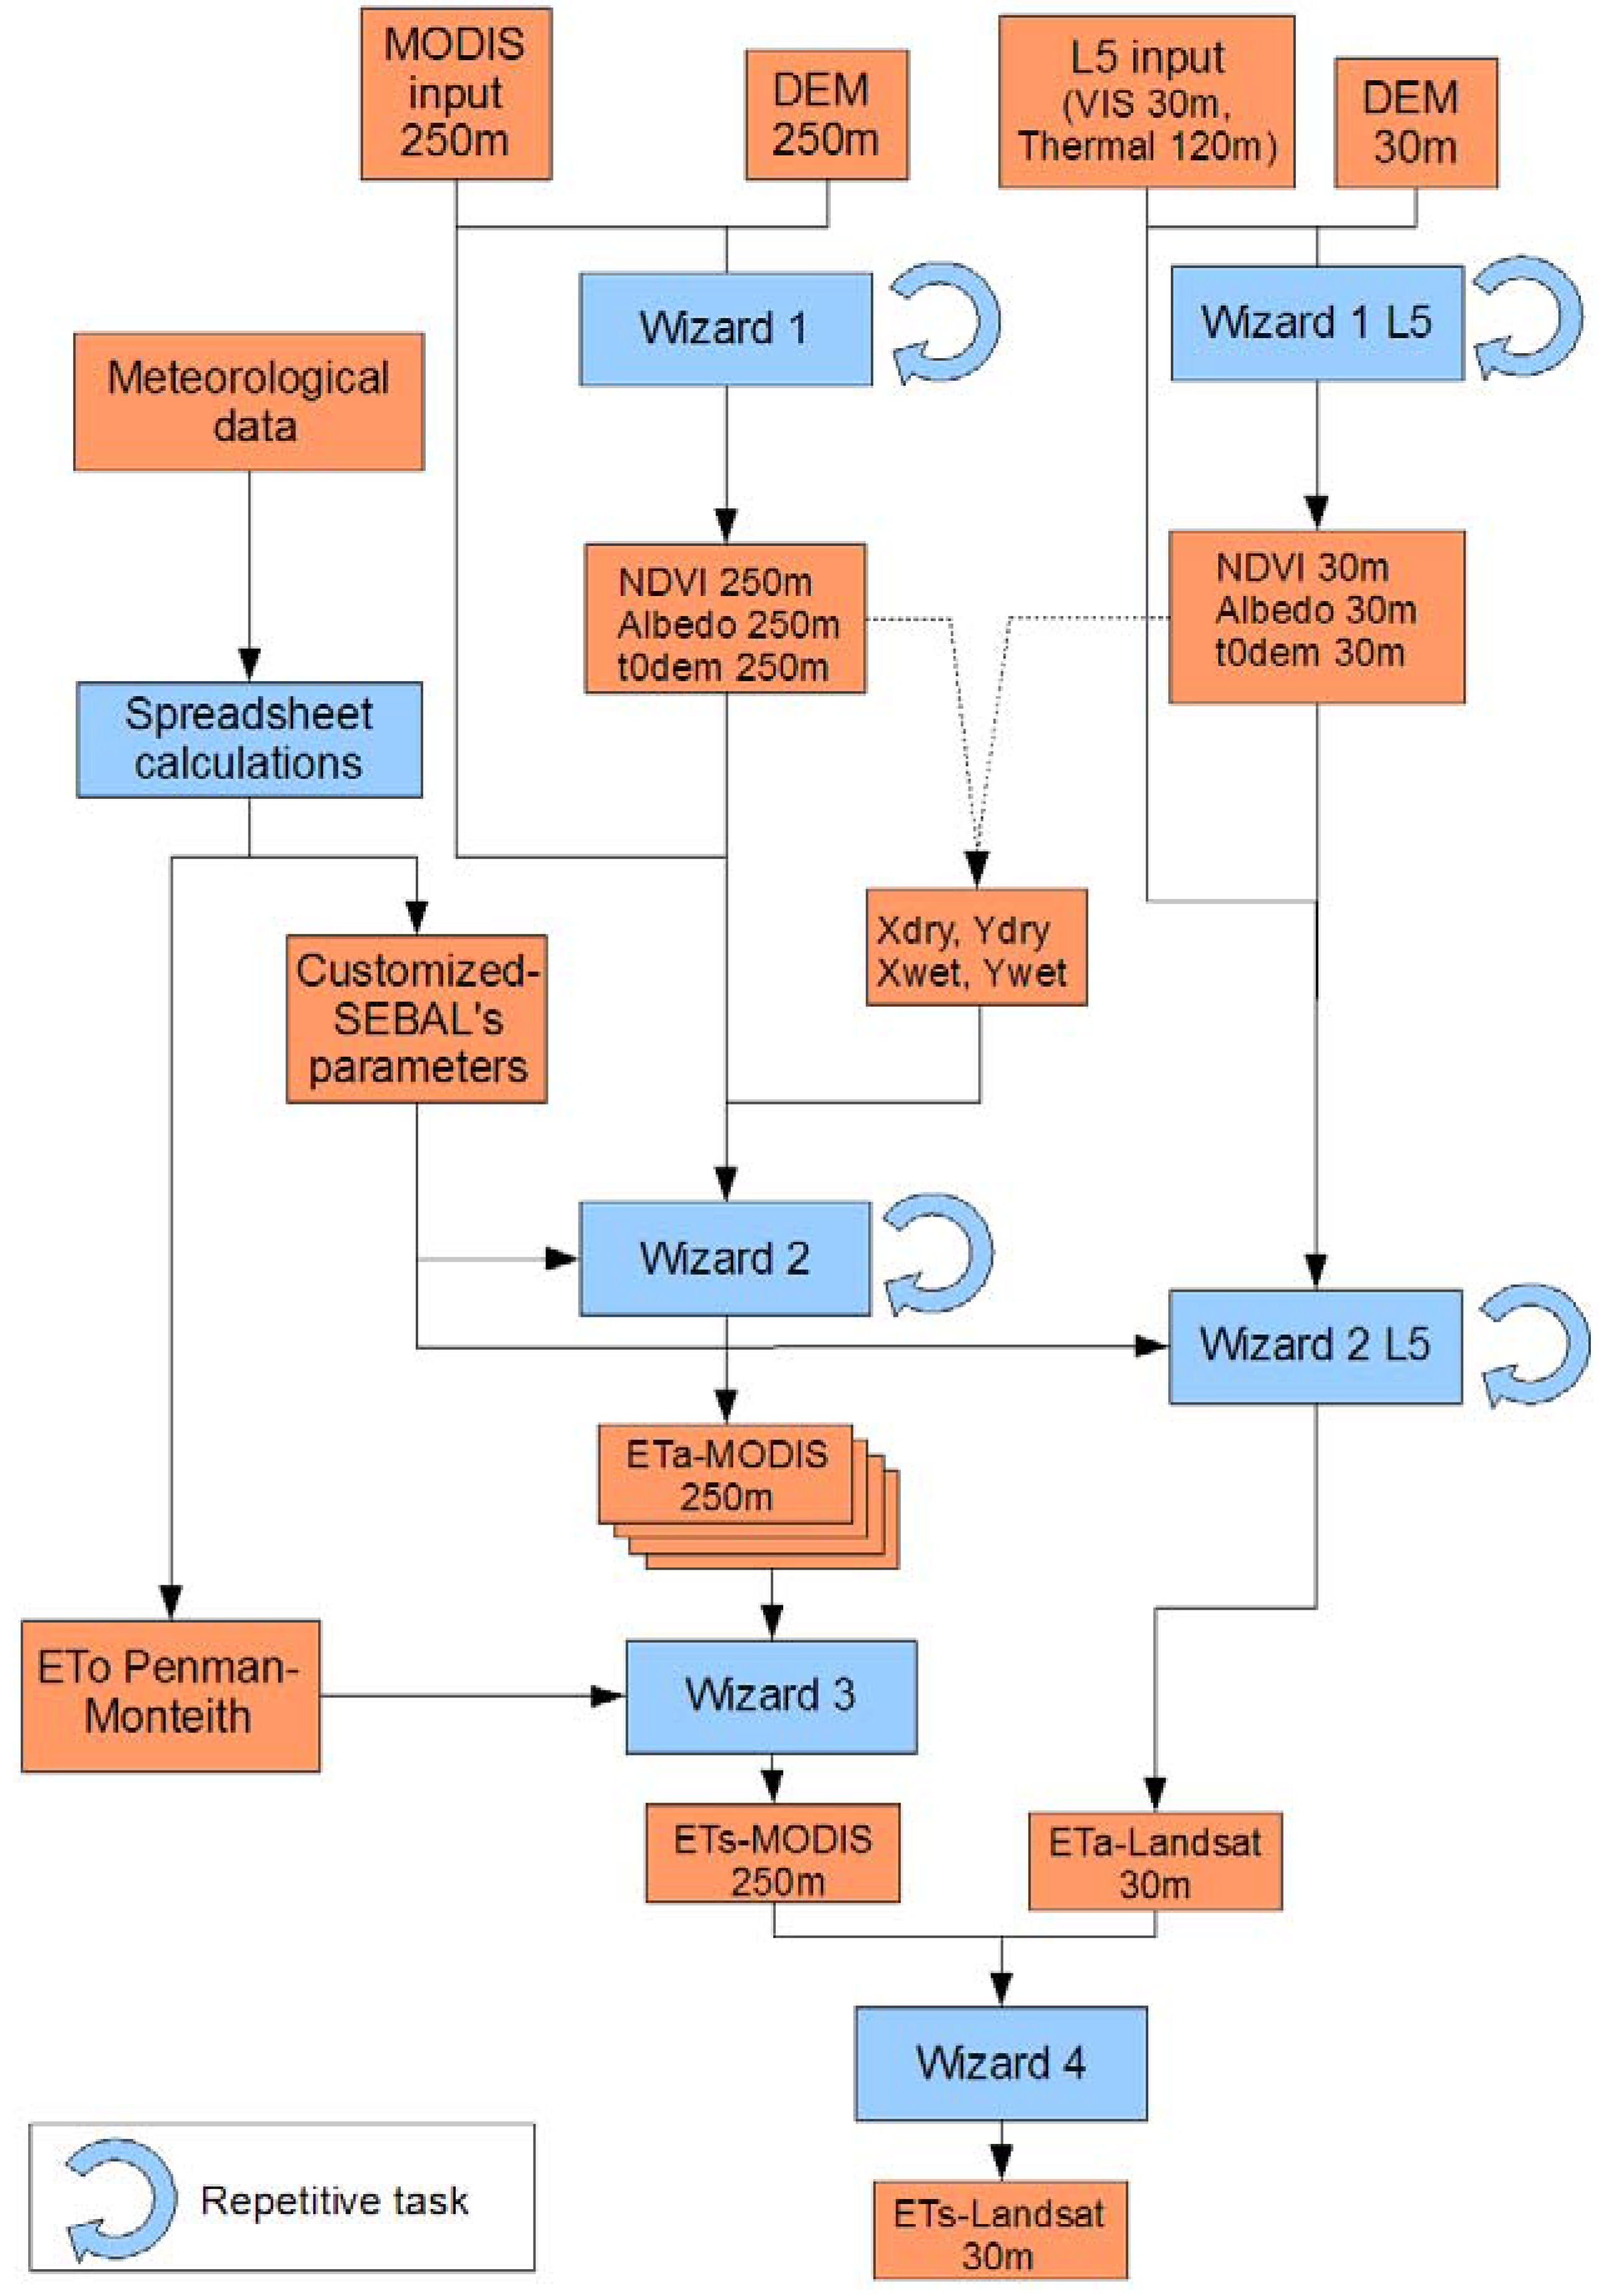
2.4. Development of the ITA-Water Tool

A stand alone tool, named ITA-Water tool (Integrated Thermodynamic Algorithms for Estimating Agricultural Water Use), has been developed in order to facilitate the implementation of the proposed methodology. The ITA-Water tool presents four separate parts:
- Wizard 1 (resp. Wizard 1 L5): Generation of intermediate input maps (NDVI, albedo, Ts) for Terra/MODIS (resp.Landsat 5 TM) input data.
- Wizard 2 (resp. Wizard 2 L5): Generation of the individual ETa maps using the customized SEBAL-based approach for Terra/MODIS (resp. Landsat 5 TM) input data.
- Wizard 3: Generation of the ETs-MODIS low-resolution map through temporal integration of ETa-MODIS and daily ETo data.
- Wizard 4: Generation of ETs-Landsat map through resolution improvement of ETs-MODIS with ETa-Landsat maps.
Each wizard offers a user-friendly interface that is accessible through an initial launching wizard. The downloading and pre-processing of MODIS, Landsat 5, and meteorological data is a pre-requisite for the use of the ITA-Water tool. In order to generate a high-resolution ETs map from the various input data the operation scheme presented in Figure 4 should be followed.
Figure 4. Operation scheme of the ITA-Water tool.
Remotesensing 01 00445 g004
For wider access and increased flexibility, the same functionalities have been made available in GRASS GIS v6.3 or v6.4 as add-ons [46], in GRASS GIS v7 as generic modules [47] and in R statistical language through the "RemoteSensing" plug-in package [48]. The availability of these free-of charge tools guarantees their wide use by interested researchers or water managers.

3. Results and Discussion

3.1. Experimental Results in Strimonas River Basin

The application of the integrated methodology in Strimonas river basin using the ITA-Water tool has provided the high resolution ETs-Landsat map (Figure 5). It has to be noted that results have not been provided for May 2007 because of missing meteorological data. Using standard overlay geographic analysis, mean ETs per irrigation district was estimated (labels on Figure 5). The total water consumption for irrigation over the period June to September 2007 in the Strimonas river basin is estimated at 365.49 × 10⁶ m3. The spatial distribution reveals a pattern of higher water use closer to the lake and the river. The main branches of the conveyance network are fed by these water bodies, which being unlined, are responsible for significant water losses. Another reason for the high levels of ETs in this area is the cultivation of paddy rice, which not only requires high water input, but also synchronized irrigation applications, which is translated to low distribution efficiency of the irrigation network [49]. Despite the improper agricultural water management in the area, water deficiencies have not been reported due to the low water utilization in the upstream Bulgarian territory. However, this could change as water development may be implemented there in the near future.
Figure 5. Agricultural water use map (ETs-Landsat) from June to September 2007 in the agricultural area of Strimonas river basin. Labels indicate mean seasonal water use (mm) per irrigation district.
Remotesensing 01 00445 g005
Figure 6. Temporal variation of ETa for irrigated rice and corn, and rain-fed wheat pixels from June to September 2007.
Remotesensing 01 00445 g006
Time series at three pixels located in rice, corn and wheat fields have been generated in order to visualize the temporal variation of ETa values in the dominant crop types in the study area (Figure 6). The curves’ trend is coherent with the expected temporal evolution of evapotranspiration in the Mediterranean region, taking into account the seasonality of ETo and the rare rain events in the semi-arid summer, which are minimal as compared to irrigation applications. Evapotranspiration is increasing while progressing into the hot and dry summer months, and peaks in mid July (doy 190–200). The existence of the two abrupt changes for rice and corn in mid June (doy 169) and mid September (doy 249) may be related to extreme meteorological conditions or low quality satellite data. For the rain-fed wheat pixel, the decrease of ETa in June (from doy 160) is in accordance with the crop’s maturation and harvest season. During the following months, the wheat's low fluctuation of 1–2 mm/day represents ETa from weeds and other natural vegetation which nourish on soil moisture replenished by short summer storms.

3.2. Elements of Validation

3.2.1. Quality assessment breakpoints

Various Quality Assessment (QA) breakpoints were set throughout the processing chain. Two of the QA breakpoints concerned the albedo and the Rn to G0 ratio. For these two terms, a few sample pixels were selected for various cover types (e.g., corn field, clay, water, etc) and the value obtained at the pixel location was checked against the typical range proposed in Waters et al. [38]. The values of albedo and Rn to G0 ratio at the selected pixels were within the reported range, or else the source of error was searched in the input parameters. The third QA breakpoint was related to the comparison of SEBAL ETo at the meteorological station location against the values obtained using the FAO 56 Penman-Monteith method [12]. The error in ETo estimation was 14.7% (DF = 41, t = 6.252, P < 0.0001).

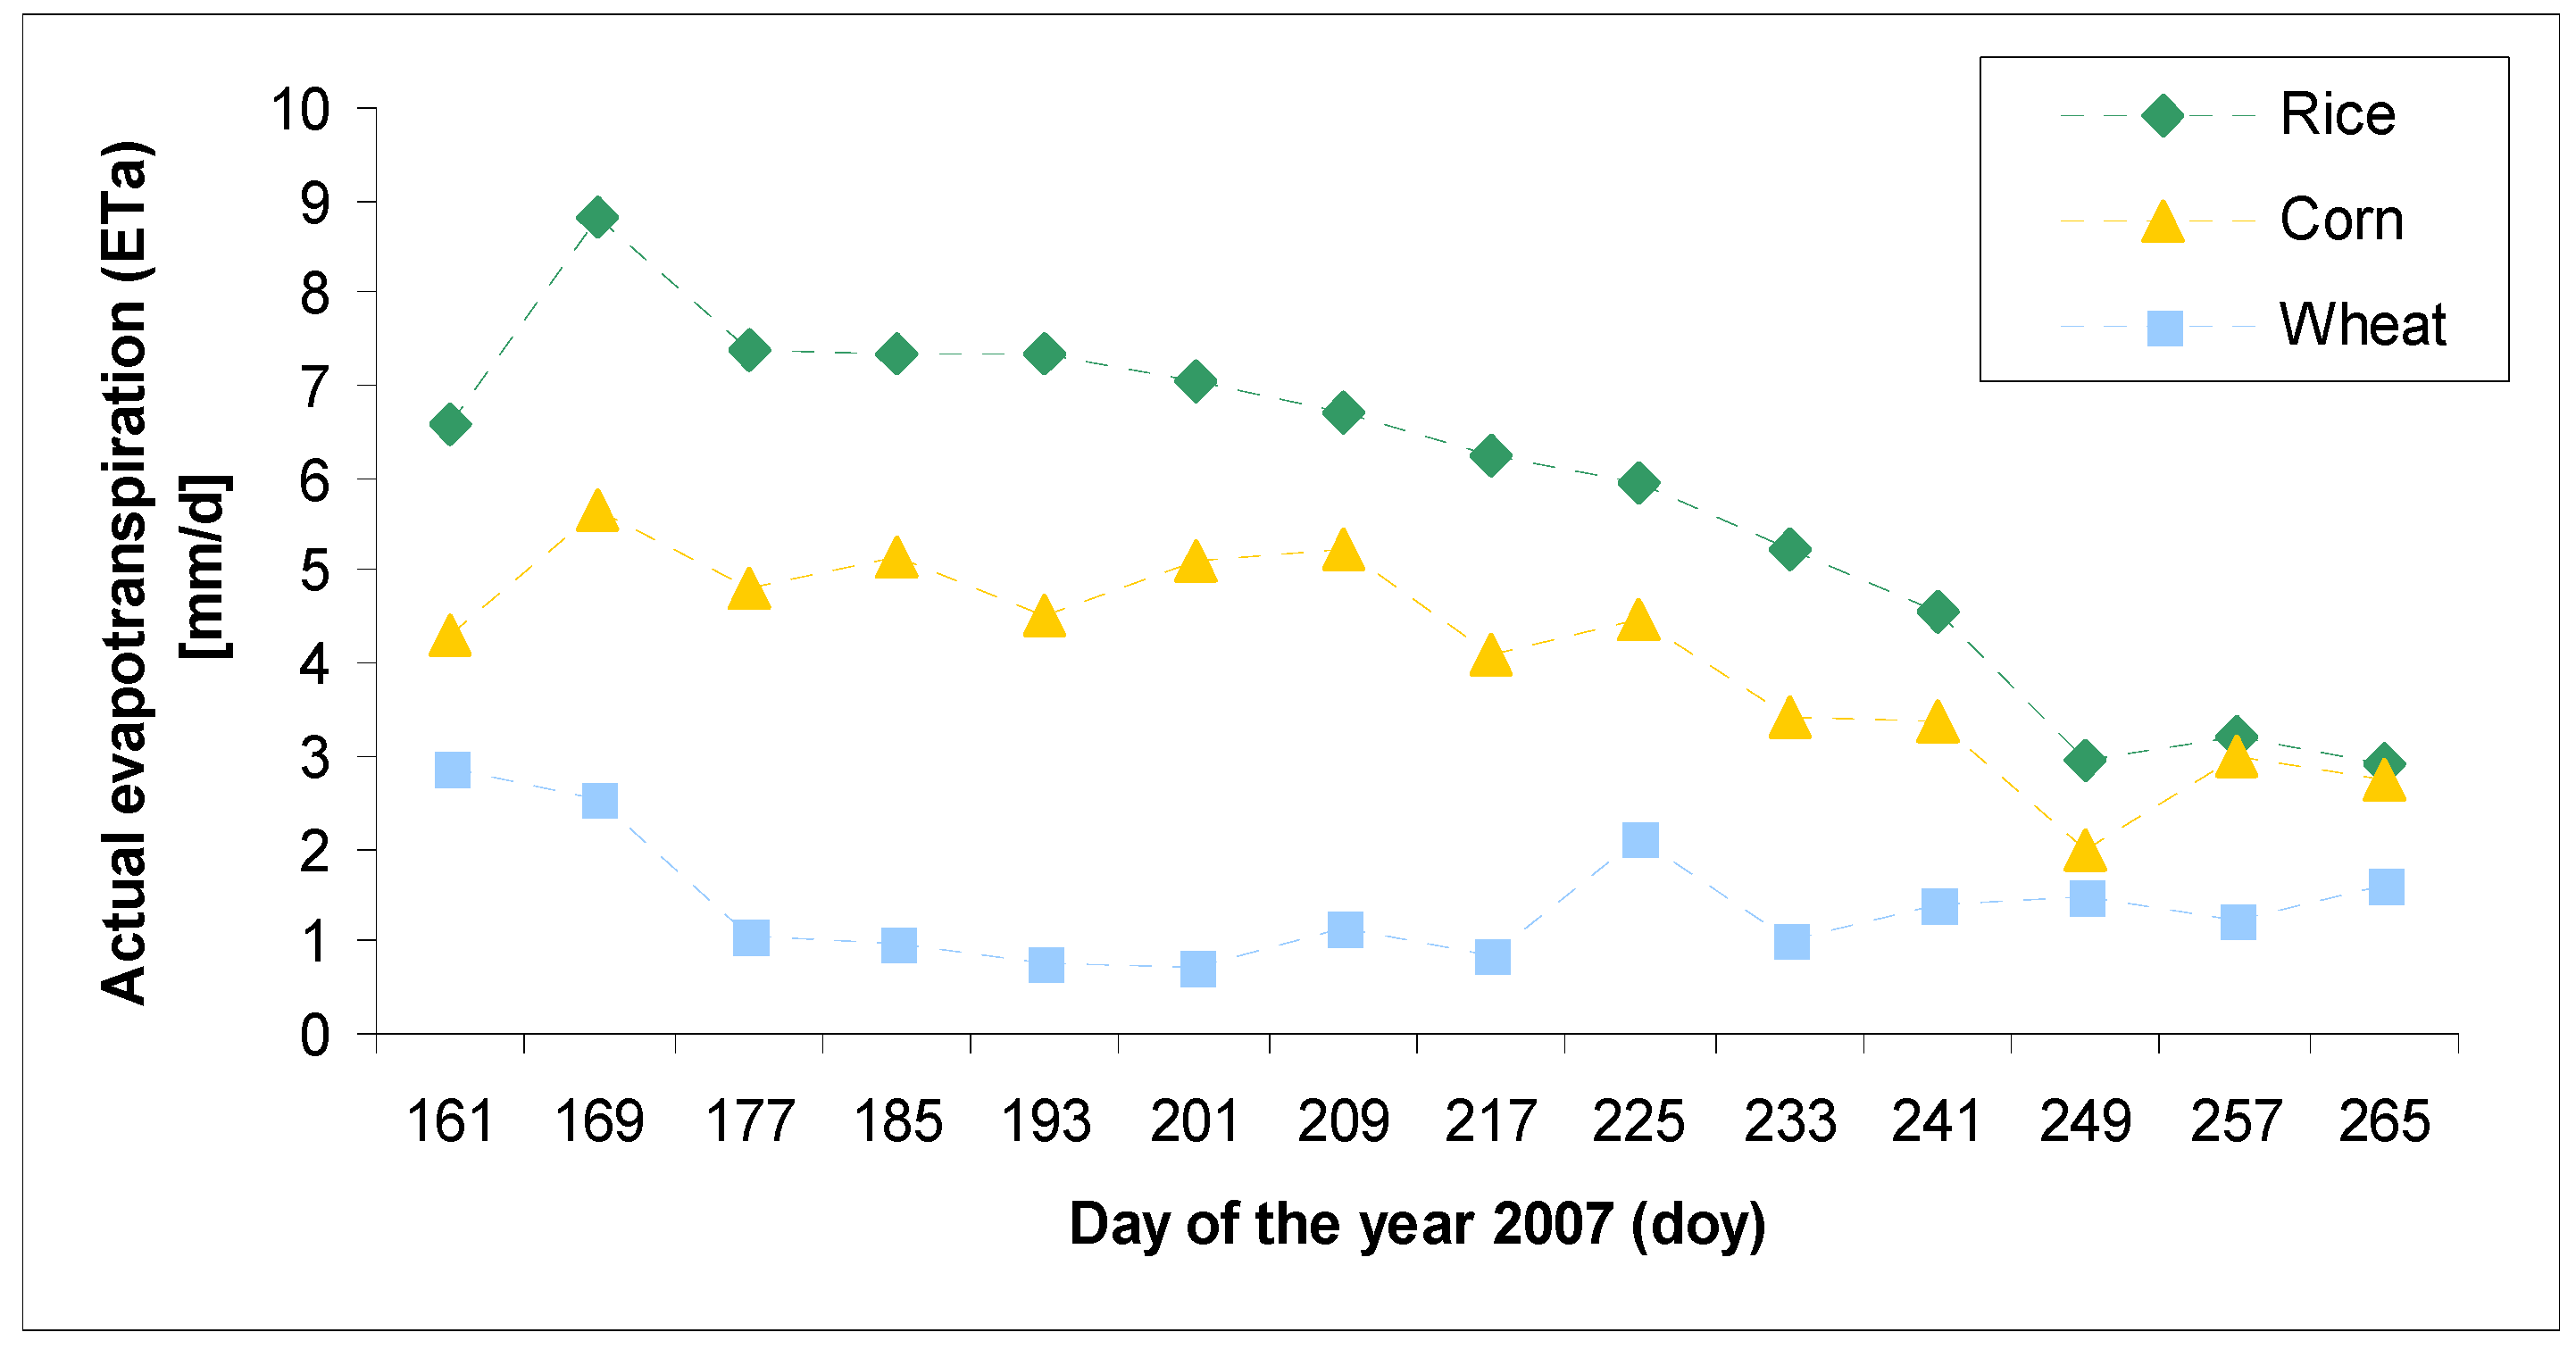
3.2.2. Validation of ETa-MODIS maps using ETc meteorological data

The validation of ETa-MODIS maps was performed using the crop evapotranspiration (ETc) values at the meteorological stations. The ETc values were calculated using the FAO 56 method [12] as the product of the ETo and the crop coefficients (Kc). The Kc accounts for elements that characterize each crop's evapotranspiration from the reference crop's evapotranspiration (grass): the crop height, the albedo (reflectance) of the crop-soil surface, the canopy resistance, and the evaporation from soil. Therefore, the FAO 56 is a standard approach for the determination of Kc according to the crop type, the climate, the soil evaporation, and the crop growth stage. The main advantage of this method is that it is considered as standard, thus it has been widely used leading to a subsequent availability of support material and results for comparison purposes.
Since corn (resp. cotton) fields surround the meteorological station(s) A9 (resp. A11 and A12), the Kc values relative to these two crop types were calculated in order to derive the ETc values at the meteorological stations. The average difference between the ETc values and the ETa estimations over the whole irrigation season at the three stations was 19.3% (DF = 36, t = 0.949, P = 0.348). This rate is satisfactory considering that the Kc coefficient method does not account for water stress factors, meaning that ETc represents an accurate estimation of ET only under good irrigation conditions. Also, ETa values were extracted from low spatial resolution maps (250 m), where the crop distribution over such large area may not be homogeneous.

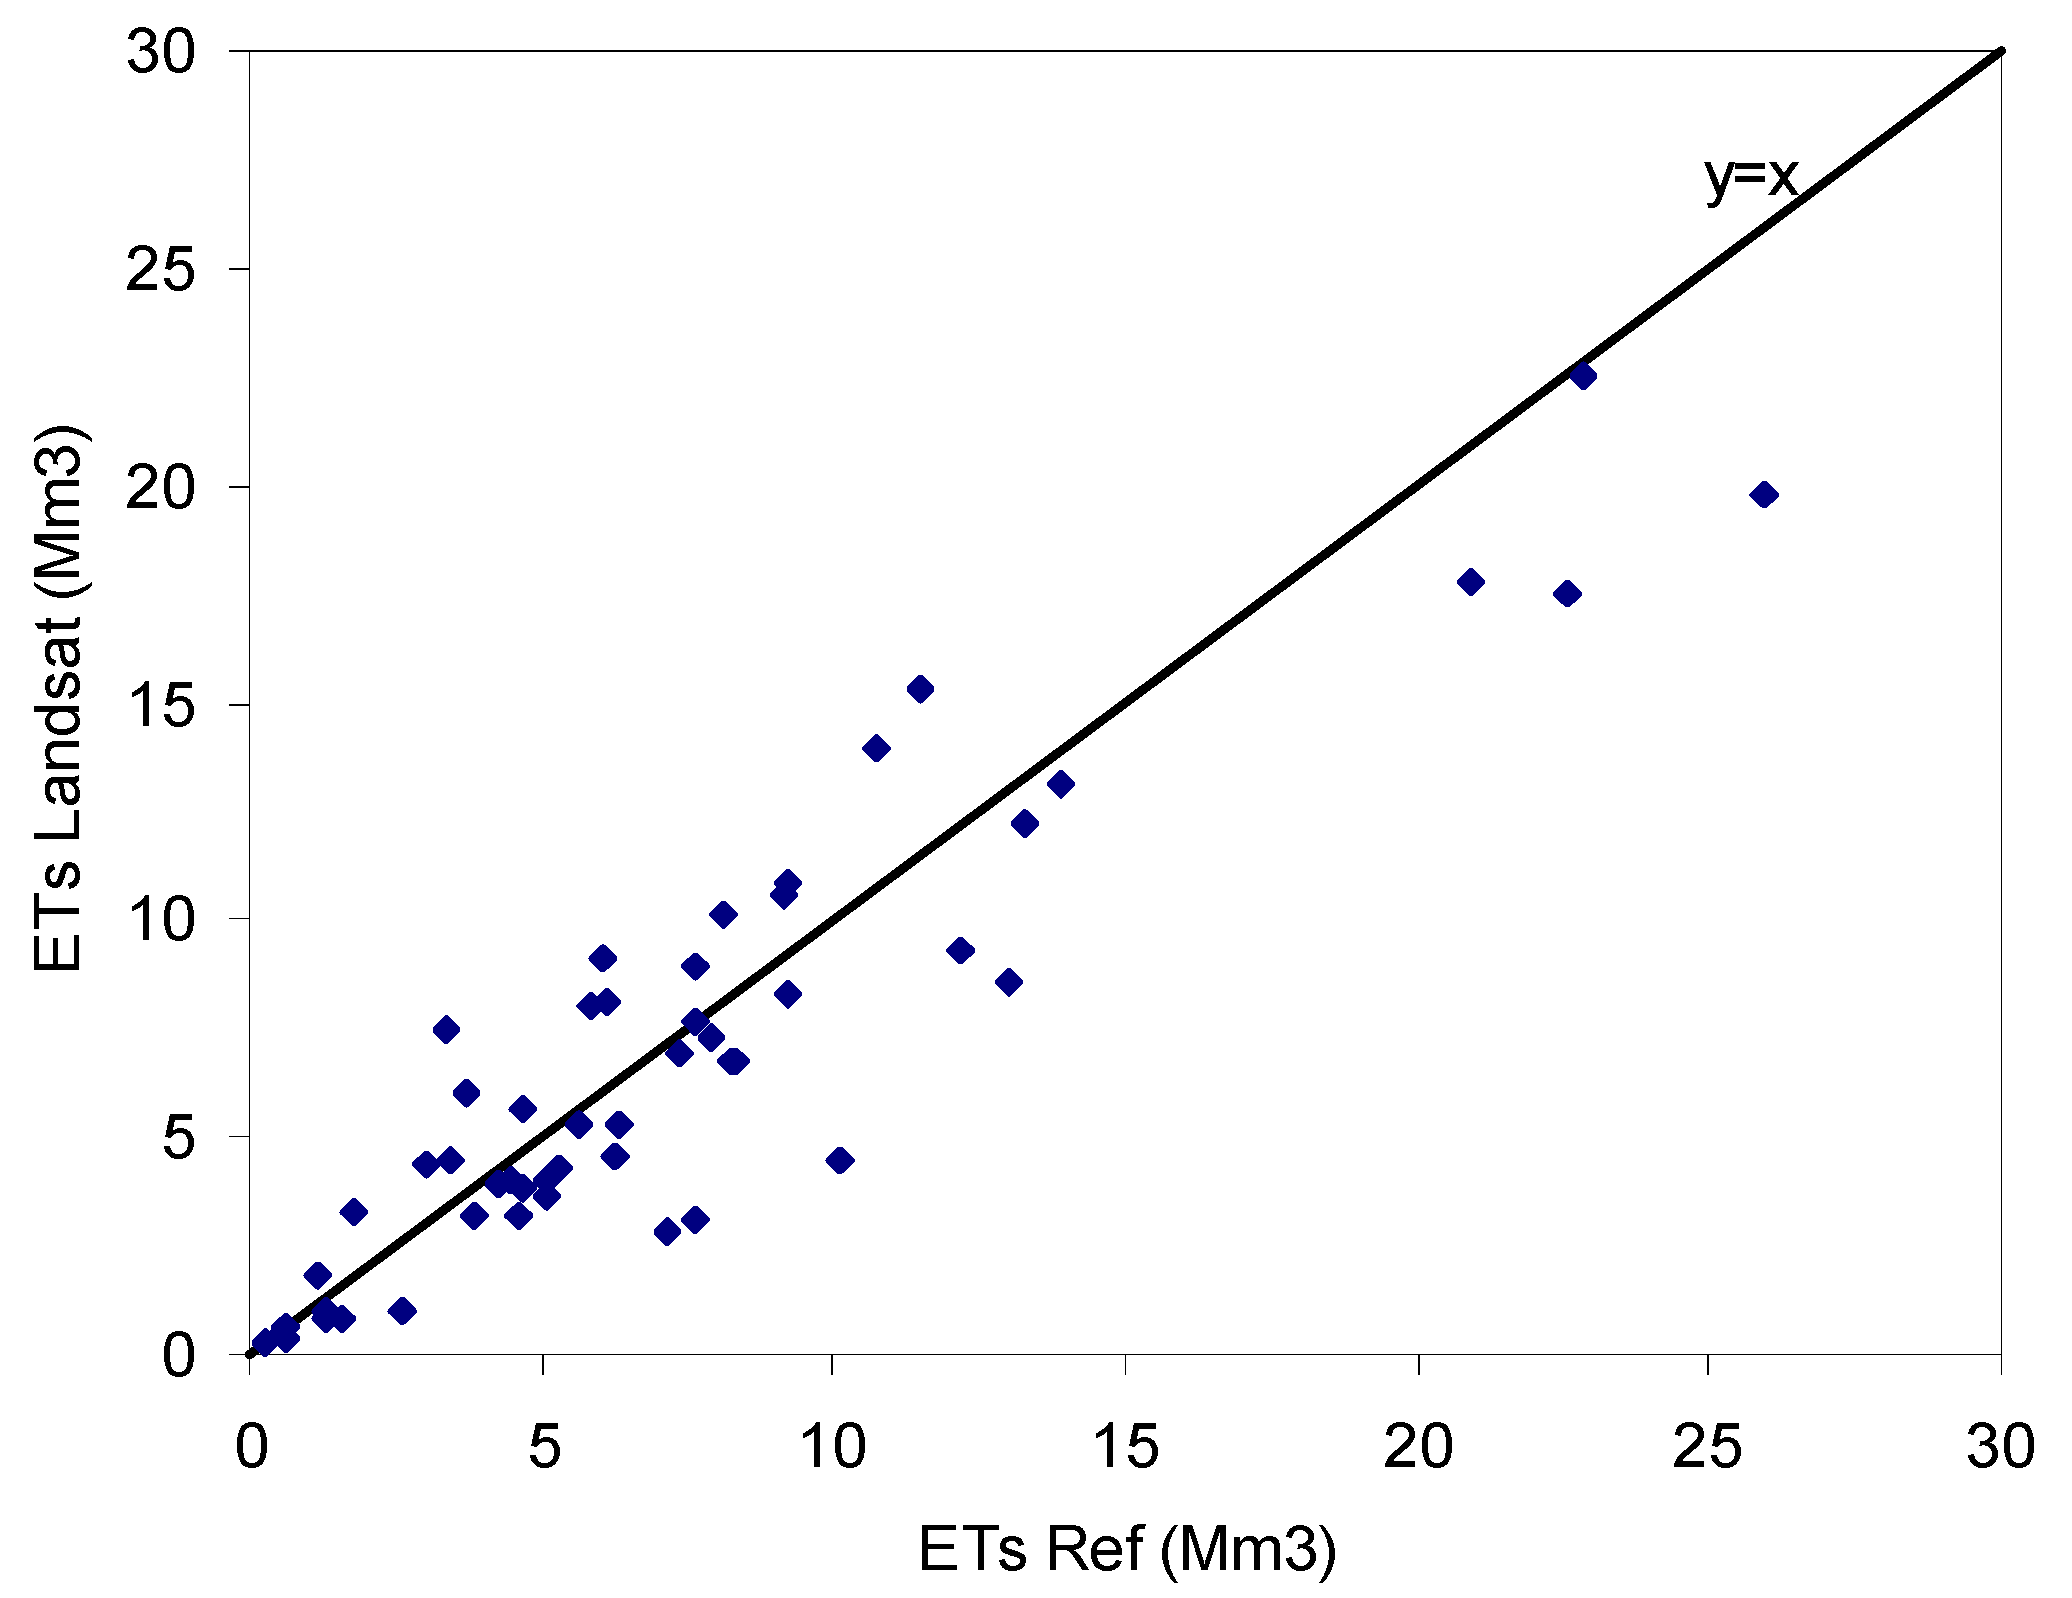
3.2.3. Validation of ETs-Landsat map using reference water supply data

The final resulting map (ETs-Landsat) was compared against water supply data, reported by the Directorate of Water Resources of Serres, which oversees the Local Water Organizations in the floodplain of Strimonas basin [49]. These have been collected daily by noting the gates opening at the head of each main canal, and calibrated regularly using a propeller current meter.
Figure 7. Comparison of ETs Landsat with reference data in Strimonas river basin, per month and per canal command area.
Remotesensing 01 00445 g007
The water released in each canal command area was converted to monthly evapotranspiration using the general irrigation efficiencies reported for each irrigation canal type. ETs' from reference datasets can be estimated using the formula: ETs' = a × WS, where a is the efficiency of the irrigation system and WS is the supplied water. This reference dataset was compared with the area averaged ETs per month and per canal command area (Figure 7). A slight tendency for underestimating ETs with the proposed methodology was noted in the high end values. However, the mean difference of –0.25Mm3 was not statistically significant (paired T-test, t = –0.57, DF = 51, P = 0.5712).

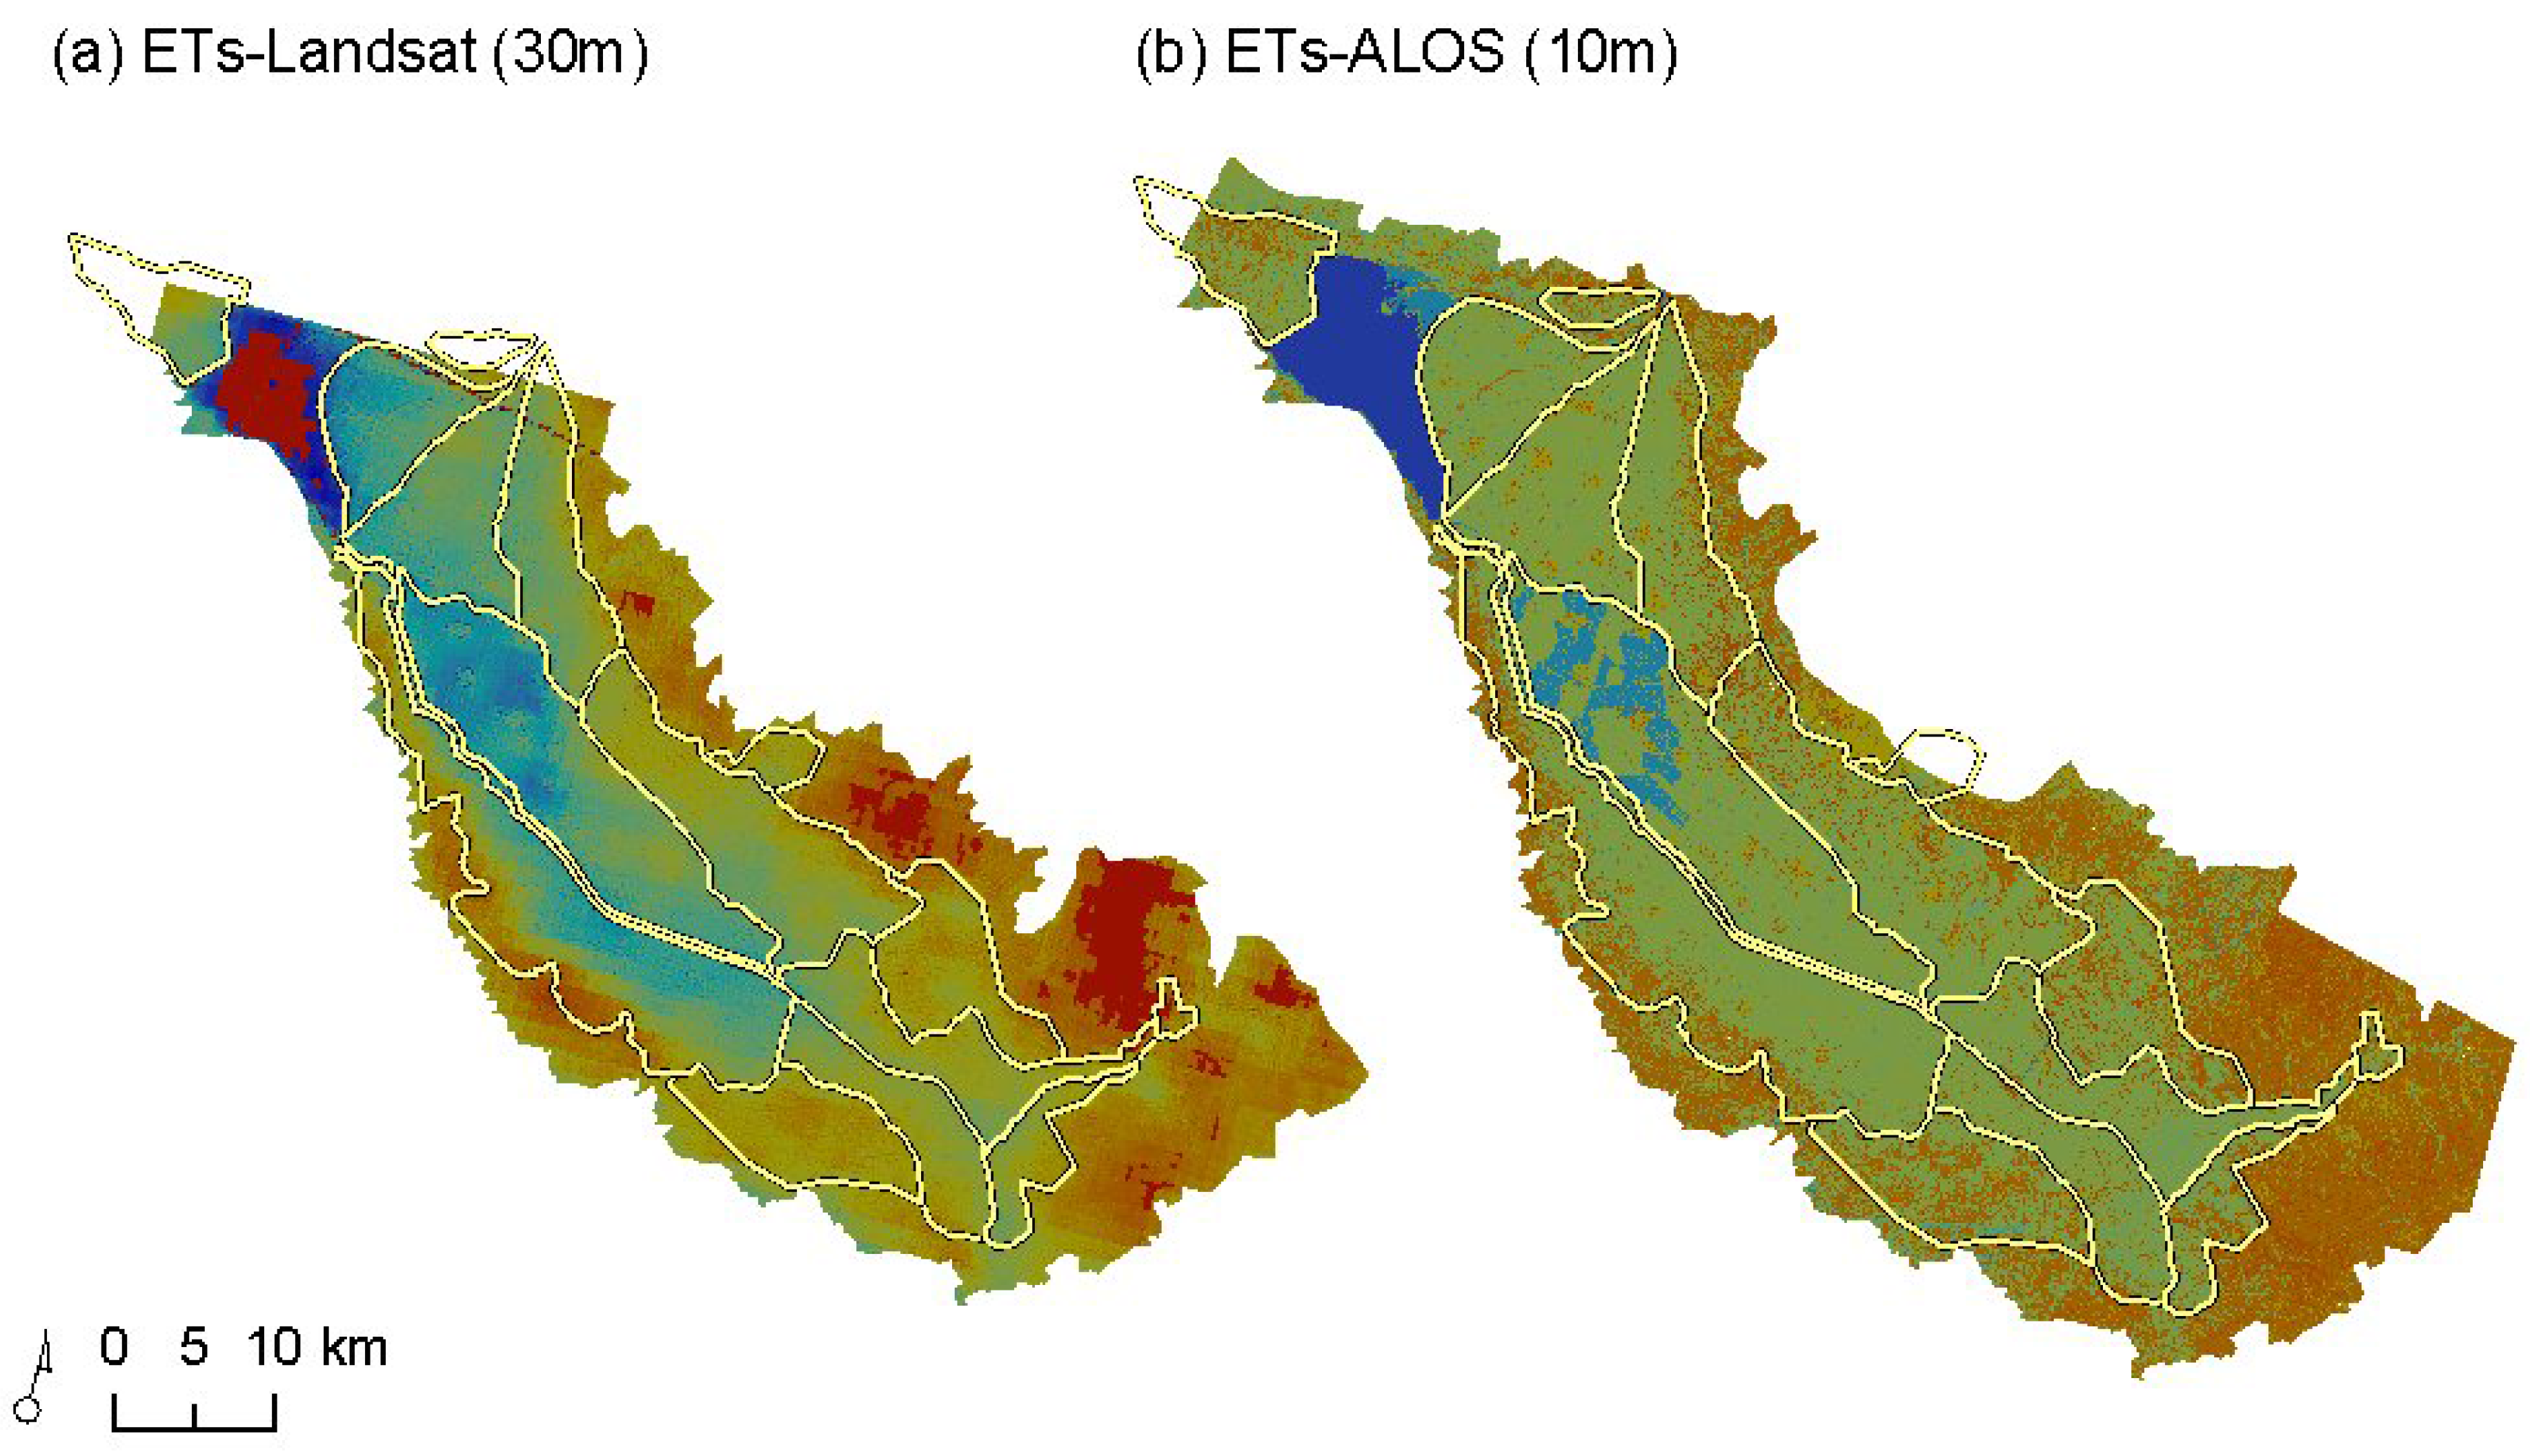
3.2.4. Validation of the spatial resolution improvement method

The resolution improved ETs using a Landsat TM image (ETs-Landsat at 30m) was compared against the resolution improved ETs using an existing map of the Strimonas river basin termed ETs-ALOS (10m) [50]. The ETs-ALOS map was derived from ALOS AVNIR-2 data by applying the Kc method. According to this method, the ALOS AVNIR-2 image was subjected to a maximum likelihood spectral classification, using field surveyed training data in order to produce a crop distribution map with the required spatial distribution of Kc. The classes of the crop map were assigned to ETs for each crop, which had been estimated using the FAO 56 method in a worksheet, taking into account meteorological data and crop type [50].
The resolution improvement of the ETs-MODIS map using the detailed spatial pattern provided by: (a) ETa-Landsat or (b) ETs-ALOS is displayed in Figure 8. Visual assessment did not reveal any differences, and the two products were compared (i) on a pixel level, using a random dataset of 1,000 points, and (ii) on an irrigation district area level, using a polygon vector dataset. Statistical comparison was performed with paired T-test and correlation analysis.
Figure 8. Comparison of ETs-Landsat (a) against ETs-ALOS (b).
Remotesensing 01 00445 g008
Pixel level comparison revealed that the mean difference between the two sampled datasets was not statistically significant (mean difference of 2.34 mm, DF = 849, t = 0.8396, P = 0.4013), and displayed a strong positive correlation (r = 0.86). Area based comparison of the canal command area level revealed that the mean difference between the two datasets was not statistically significant (mean difference of 77 Mm3, DF = 10, t = 0.3268, P = 0.7505), and displayed a very strong positive correlation (r = 0.99). This proves that resolution improvement with a single Landsat 5 TM image was successful in describing the spatial pattern of water use during the irrigation season.

3.3. Discussion

3.3.1. Advantages of the methodology

The advantages of the proposed methodology are: (i) the use of MODIS remotely sensed data that cover the study area every eight days guarantees that the factors which affect the spatial distribution of energy balance (crop phenology, plants stress, water availability) are updated frequently enough for the changing Mediterranean pattern [51], (ii) the use of daily meteorological data guarantees that the factors which affect the temporal variation of evapotranspiration (temperature, relative humidity, wind speed) are described frequently enough [12], (iii) the resolution improvement guarantees that the detailed crops pattern of Greek agricultural landscapes is adequately described to avoid the “oasis effect” which appears when irrigated fields are interspersed within non irrigated fields [52], (iv) using a single Landsat 5 TM image is sufficient to describe the spatial pattern of seasonal water use, thus minimizing the need to process multiple high resolution datasets which is time consuming, and (v) the cost of data acquisition is minimal by using free of charge (Terra MODIS, Landsat 5 TM) or low cost satellite images (ALOS AVNIR-2).
Based on the validation with reference datasets, the customized SEBAL approach proved to perform well with multi-spatial resolution input data (Terra MODIS at 250 m, 500 m and 1 km; Landsat 5 TM at 30 m and 120 m). The spatio-temporal integration using ETo-driven heuristics is a major asset for overcoming the unavailability of spatially distributed data on a daily basis. In addition, the use of multi-source data for ETs resolution improvement has been successfully validated. Consequently, the proposed methodology can be positively extended to use alternative combinations of data for water use mapping (TIR: AATSR, AVHRR, METEOSAT, ASTER; VNIR/SWIR: MERIS, ASTER, ALOS, SPOT, AVHRR, METEOSAT, and other upcoming missions). The fact that MODIS data are provided free of charge and that all Landsat imagery is freely available for download (since April 2009) were major motives for the selection of this specific satellite data combination. However, the use of alternative data may be dictated by specific needs such as higher-resolution, more frequent data availability or ad-hoc geographical coverage.

3.3.2. Regionalization and implications for water management

The Mediterranean region is characterized by small to medium sized river basins with conditions similar to the study area: arid summers, mild topographic relief, small agricultural field sizes or crop patterns with high spatial distribution, and lack of detailed datasets. Most of them face similar problems related to the unwise management of water resources: depleted aquifers [53], increased concentration of nitrogen and other pollutants [54,55], saltwater intrusion [56,57], and degradation of nearby natural environment [58,59,60]. The changing climate is only expected to exacerbate the problems, adding the risk of desertification in these areas [61]. Monitoring these areas is difficult because of the scattered dissimilar environment and the lack of adequate facilities, even a network of meteorological stations.
The proposed methodology can be applied in these Mediterranean regions providing considerable benefits. Through the user-friendly interface (ΙΤΑ-Water), and using low cost data, water managers and decision makers can produce actual water consumption thematic maps over the entire irrigated basin. Thus, an often unknown part of the agricultural water cycle may be accurately estimated and reporting to cover national and regional legislative requirements may be facilitated. Also, in having this information, several other secondary information may be calculated, such as irrigation system performance indicators, water valuation parameters, design of water savings measures, and desertification risk assessment, all of which allow for added value of water services. In addition, it can be applied to previous years to identify temporal changes using archived satellite images, even when field surveys had not been conducted. However, more sophisticated methodologies may be required for monitoring water use of large basins expanding in several agro-climatic zones, due to the inconsistent crop cycles [62,63].

4. Conclusions

An integrated methodology has been presented for improved estimation of agricultural water use in Greek basins using satellite earth observation. Several improvements on existing methods have been implemented to achieve a high performance under Greek conditions: higher spatial accuracy of surface energy fluxes estimation, consideration of variable Mediterranean agricultural pattern, and tailored to the low availability of datasets. All together, these methods have been embedded in an integrated methodology, which was rendered operational because it: accepts input from multiple data sources, offers options for alternative methods, and is implemented with a user friendly tool for further use of the methodology by the water managers. The proposed methodology has been tested in an irrigated river basin of 800 km2. The validation shows high accuracy, when compared to alternative methods and available reference datasets.

Acknowledgments

Landsat and MODIS data were provided by the United States Geological Survey (USGS). ALOS data were provided by the European Space Agency (ESA). The meteorological data were provided by the Water Directorate of the Region of Central Macedonia. The work presented was supported by the extension of ESA's GSE-Land project in Greece. The authors are grateful to the anonymous reviewers for their constructive comments.

References and Notes

  1. Seckler, D.; Barker, R.; Amarasinghe, U. Water scarcity in the twenty-first century. Int. J. Water Resour. 1999, 15, 29–42. [Google Scholar] [CrossRef]
  2. Shiklomanov, I.A. Appraisal and assessment of world water resources. Water Int. 2000, 25, 11–32. [Google Scholar] [CrossRef]
  3. FAO; IFAD. Water for food, agriculture and rural livelihoods. In: The United Nations world water development report 2: Water, a shared responsibility; UNESCO and Berghahn Books: Paris and New York, 2006; Available online: http://unesdoc.unesco.org/images/0014/001454/145405E.pdf (accessed on November 27, 2007).
  4. EC Directive 2000/60/EC of the European Parliament and of the Council of 23 October 2000 establishing a framework for Community action in the field of water policy. Off. J. Europ. Union 2000, 1–73.
  5. Lianos, T.P.; Parliarou, D. Farm size structure in Greek agriculture. Eur. Rev. Agric. Econ. 1986, 13, 233–248. [Google Scholar] [CrossRef]
  6. Meijninger, W.M.L.; De Bruin, H.A.R. The sensible heat fluxes over irrigated areas in western Turkey determined with a large aperture scintillometer. J. Hydrol. 2000, 229, 42–49. [Google Scholar] [CrossRef]
  7. Su, H.; McCabe, M.F.; Wood, E.F.; Su, Z.; Prueger, J.H. Modeling evapotranspiration during SMACEX: Comparing two approaches for local- and regional-scale prediction. J. Hydrometeor. 2005, 6, 910–922. [Google Scholar] [CrossRef]
  8. van Dam, J.C.; Huygen, J.; Wesseling, J.G.; Feddes, R.A.; Kabat, P.; van Walsum, P.E.V.; Groenendijk, P.; van Diepen, C.A. Theory of SWAP version 2.0. Simulation of water flow, solute transport and plant growth in the Soil-Water-Atmosphere-Plant environment; Report 71; Subdep. Water Resources, Wageningen University, Technical document 45, Alterra Green World Research: Wageningen, The Netherlands, 1997. [Google Scholar]
  9. Kite, G. Using a basin-scale hydrological model to estimate crop transpiration and soil evaporation. J. Hydrol. 2000, 229, 59–69. [Google Scholar] [CrossRef]
  10. Babajimopoulos, C.; Budina, A.; Kalfountzos, D. SWBACROS: a model for the estimation of the water balance of a cropped soil. Environ. Softw. 1995, 10, 211–220. [Google Scholar] [CrossRef]
  11. Droogers, P.; Bastiaanssen, W.G.M.; Beyazgul, M.; Kayam, Y.; Kite, G.W.; Murray-Rust, H. Distributed agro-hydrological modeling of an irrigation system in western Turkey. Agr. Water. Manage. 2000, 43, 183–202. [Google Scholar] [CrossRef]
  12. Allen, R.G.; Pereira, L.S.; Raes, D.; Smith, M. Crop evapotranspiration: Guidelines for computing crop water requirements; Food and Agriculture Organization of the United Nations: Rome, Italy, 1998. [Google Scholar]
  13. Er-Raki, S.; Chehbouni, A.; Guemouria, N.; Duchemin, B.; Ezzahar, J.; Hadria, R. Combining FAO-56 model and ground-based remote sensing to estimate water consumptions of wheat crops in a semi-arid region. Agr. Water. Manage. 2007, 87, 41–54. [Google Scholar] [CrossRef]
  14. Michael, M.G.; Bastiaanssen, W.G.M. A new simple method to determine crop coefficients for waterallocation planning from satellites: Results from Kenya. Irrig. Drain. Syst. 2000, 14, 237–256. [Google Scholar] [CrossRef]
  15. Gowda, P.; Chavez, J.; Colaizzi, P.; Evett, S.; Howell, T.; Tolk, J. ET mapping for agricultural water management: present status and challenges. Irrigation Sci. 2008, 26, 223–237. [Google Scholar] [CrossRef]
  16. Bastiaanssen, W.G.M.; Sakthivadivel, R.; Van Dellen, A. Spatially delineating actual and relative evapotranspiration from remote sensing to assist spatial modeling of non-point source pollutants; Corwin, D., Ed.; American Geophysical Union: Washington, DC, USA, 1999; pp. 179–196. [Google Scholar]
  17. Su, Z. The Surface Energy Balance System (SEBS) for estimation of turbulent heat fluxes. Hydrol. Earth Syst. Sc. 2002, 6, 85–99. [Google Scholar] [CrossRef]
  18. Menenti, M.; Choudhury, B.J. Parameterization of land surface evaporation by means of location dependent potential evaporation and surface temperature range. In Proceedings of the Exchange processes at the land surface for a range of space and time scales, Yokohama, Japan, 13–16 July, 1993; pp. 561–568.
  19. Bastiaanssen, W.G.M.; Menenti, M.; Feddes, R.A.; Holtslag, A.A.M. A remote sensing surface energy balance algorithm for land (SEBAL): 1. Formulation. J. Hydrol. 1998, 212-213, 198–212. [Google Scholar] [CrossRef]
  20. Kustas, W.P.; Norman, J.M. Evaluation of soil and vegetation heat flux predictions using a simple two-source model with radiometric temperatures for partial canopy cover. Agr. Forest Meteorol. 1999, 94, 13–29. [Google Scholar] [CrossRef]
  21. Norman, J.M.; Anderson, M.C.; Kustas, W.P.; French, A.N.; Mecikalski, J.; Torn, R.; Diak, G.R.; Schmugge, T.J.; Tanner, B.C.W. Remote sensing of surface energy fluxes at 101-m pixel resolutions. Water Resour. Res. 2003, 39, SWC91–SWC917. [Google Scholar] [CrossRef]
  22. Norman, J.M.; Kustas, W.P.; Prueger, J.H.; Diak, G.R. Surface flux estimation using radiometric temperature: A dual-temperature-difference method to minimize measurement errors. Water Resour. Res. 2000, 36, 2263–2274. [Google Scholar] [CrossRef]
  23. Duchemin, B.; Hadria, R.; Erraki, S.; Boulet, G.; Maisongrande, P.; Chehbouni, A.; Escadafal, R.; Ezzahar, J.; Hoedjes, J.C.B.; Kharrou, M.H.; Khabba, S.; Mougenot, B.; Olioso, A.; Rodriguez, J.C.; Simonneaux, V. Monitoring wheat phenology and irrigation in Central Morocco: On the use of relationships between evapotranspiration, crops coefficients, leaf area index and remotely-sensed vegetation indices. Agr. Water. Manage. 2006, 79, 1–27. [Google Scholar] [CrossRef]
  24. Teixeira, A.H.D.C.; Bastiaanssen, W.G.M.; Ahmad, M.D.; Bos, M.G. Reviewing SEBAL input parameters for assessing evapotranspiration and water productivity for the Low-Middle Sao Francisco River basin, Brazil. Part A: Calibration and validation. Agr. Forest Meteorol. 2009, 149, 462–476. [Google Scholar] [CrossRef] [Green Version]
  25. Kite, G.W.; Droogers, P. Comparing evapotranspiration estimates from satellites, hydrological models and field data. J. Hydrol. 2000, 229, 3–18. [Google Scholar] [CrossRef]
  26. Alexandridis, Τ.Κ.; Cayrol, P.; Moreno, J.G.; Cherif, I.; Chemin, Y.; de la Vega, C.M.; Escudero, R.; Galanis, G.; Tsakoumis, G.; Silleos, N.; Stavrinos, E.; Zalidis, G.; Duthil, P. Agricultural Water Consumption Services for Southern European Basin. In Poster presented at the 5th World Water Forum "Bridging Divides for Water", Istanbul, Turkey, March 16-22, 2009.
  27. Giménez Moreno, J.; Martin de la Vega Padorno, C.; Porcel Prado, P.; Escudero Barbero, R. Use of MERIS imagery for the estimation of water abstraction due to irrigation. Rev. Asoc. Esp. Teledetección 2008, 29, 52–66. [Google Scholar]
  28. Jacob, F.; Olioso, A.; Gu, X.F.; Su, Z.; Seguin, B. Mapping surface fluxes using airborne visible, near infrared, thermal infrared remote sensing data and a spatialized surface energy balance model. Agronomie 2002, 22, 669–680. [Google Scholar] [CrossRef]
  29. Ramos, J.G.; Cratchley, C.R.; Kay, J.A.; Casterad, M.A.; Martνnez-Cob, A.; Domνnguez, R. Evaluation of satellite evapotranspiration estimates using ground-meteorological data available for the Flumen District into the Ebro Valley of N.E. Spain. Agr. Water. Manage. 2009, 96, 638–652. [Google Scholar] [CrossRef]
  30. Alexandridis, Τ.K.; Zalidis, G.C.; Silleos, N.G. Mapping irrigated area in Mediterranean basins using low cost satellite Earth Observation. Comput. Electron. Agr. 2008, 64, 93–103. [Google Scholar] [CrossRef]
  31. LPDAAC Land Processes Distributed Active Archive Center. Available online: http://edcimswww.cr.usgs.gov/pub/imswelcome/ (accessed on September 30, 2008).
  32. Brutsaert, W.; Sugita, M. Application of self-preservation in the diurnal evolution of the surface energy budget to determine daily evaporation. J. Geophys. Res. 1992, 97, 18377–18382. [Google Scholar] [CrossRef]
  33. Bastiaanssen, W.G.M.; Noordman, E.J.M.; Pelgrum, H.; Davids, G.; Thoreson, B.P.; Allen, R.G. SEBAL model with remotely sensed data to improve water-resources management under actual field conditions. J. Irrig. Drain. E.-ASCE 2005, 131, 85–93. [Google Scholar] [CrossRef]
  34. Vermote, E.F.; Vermeulen, A. Algorithm Technical Background Document, Atmospheric Correction Algorithm: Spectral Reflectances (MOD09). Available online: http://modis.gsfc.nasa.gov/data/atbd/atbd_mod08.pdf (accessed on March 28, 2005).
  35. USGS Landsat 5TM product page. Available online: http://edc.usgs.gov/products/satellite/tm.php. (accessed on May 5, 2009).
  36. Pawan, K.S. Diagnosing Irrigation Water Resources with Multi-sensor Remote Sensing and GIS Techniques (A Case Study of the Roxo Dam Irrigation System, Portugal). MSc Thesis, ITC, Amsterdam, The Netherlands, 2004. [Google Scholar]
  37. Chemin, Y. The application of the surface energy balance algorithm for land (SEBAL) for estimating daily evaporation - A handbook of published methodologies. Version 0.6.7; International Water Management Institute: Colombo, Sri Lanka, 2001. [Google Scholar]
  38. Waters, R.; Allen, R.; Tasumi, M.; Trezza, R.; Bastiaanssen, W.G.M. SEBAL (Surface Energy Balance Algorithms for Land): Advanced Training and Users Manual; Idaho Department of Water Resources: Boise, ID, USA, 2002; p. 98. [Google Scholar]
  39. Chemin, Y.; Alexandridis, T. Improving spatial resolution of et seasonal for irrigated rice in Zhanghe, China. Asian J. Geoinf. 2004, 5, 3–11. [Google Scholar]
  40. van Leeuwen, W.J.D.; Huete, A.R.; Laing, T.W. MODIS vegetation index compositing approach: A prototype with AVHRR data. Remote Sens. Environ. 1999, 69, 264–280. [Google Scholar] [CrossRef]
  41. Pohl, C.; Van Genderen, J.L. Multisensor image fusion in remote sensing: Concepts, methods and applications. Int. J. Remote Sens. 1998, 19, 823–854. [Google Scholar] [CrossRef]
  42. Immerzeel, W.W.; Rutten, M.M.; Droogers, P. Spatial downscaling of TRMM precipitation using vegetative response on the Iberian Peninsula. Remote Sens. Environ. 2009, 113, 362–370. [Google Scholar] [CrossRef]
  43. Merlin, O.; Walker, J.P.; Chehbouni, A.; Kerr, Y. Towards deterministic downscaling of SMOS soil moisture using MODIS derived soil evaporative efficiency. Remote Sens. Environ. 2008, 112, 3935–3946. [Google Scholar] [CrossRef] [Green Version]
  44. Liu, D.; Pu, R. Downscaling thermal infrared radiance for subpixel land surface temperature retrieval. Sensors 2008, 8, 2695–2706. [Google Scholar] [CrossRef] [PubMed]
  45. Chemin, Y.; Alexandridis, T. Water productivity at different geographical scales in Zhanghe Irrigation District, China. Int. J. Geoinf. 2006, 2, 9–19. [Google Scholar]
  46. Chemin, Y. GRASS Add-ons: GRASS Image Processing Environment (GIPE). Available online: http://grass.osgeo.org/wiki/GRASS_AddOns#GIPE (accessed on May 20, 2009).
  47. GRASS GIS v7 download. Available online: http://grass.itc.it/download/index.php (accessed on July 9, 2009).
  48. Rforge. Rforge-Project. Available online: http://r-forge.r-project.org/projects/remotesensing/ (accessed on May 20, 2009).
  49. Mertzianis, C. Management of water for Strimonas river and lake Kerkini during the irrigation season of 2007; Annual report; Prefectural Authority of Serres, Directorate of Water Resources: Serres, Greece, 2007. [Google Scholar]
  50. Alexandridis, T.K.; Chemin, Y.; Cherif, I.; Tsakoumis, G.; Galanis, G.; Arampatzis, G.; Zalidis, G.C.; Silleos, N.G.; Stavrinos, E. Improving spatial resolution of agricultural water use estimation using ALOS AVNIR-2 imagery. In Proceedings of the ALOS Principal Investigators Symposium 2008, Rhodes, Greece, November 03–07, 2008.
  51. Alexandridis, T.K.; Gitas, I.Z.; Silleos, N.G. An estimation of the optimum temporal resolution for monitoring vegetation condition on a nationwide scale using MODIS/Terra data. Int. J. Remote Sens. 2008, 29, 3589–3607. [Google Scholar] [CrossRef]
  52. Potchter, O.; Goldman, D.; Kadish, D.; Iluz, D. The oasis effect in an extremely hot and arid climate: The case of southern Israel. J. Arid Environ. 2008, 72, 1721–1733. [Google Scholar] [CrossRef]
  53. Garcia, C.; Servera, J. Impacts of tourism development on water demand and beach degradation on the island of Mallorca (Spain). Phy. Geog. 2003, 85, 287–300. [Google Scholar] [CrossRef]
  54. Coskun, H.G.; Tanik, A.; Alganci, U.; Cigizoglu, H.K. Determination of environmental quality of a drinking water reservoir by remote sensing, GIS and regression analysis. Water Air Soil Poll. 2008, 194, 275–285. [Google Scholar] [CrossRef]
  55. Butturini, A.; Bernal, S.; Nin, E.; Hellin, C.; Rivero, L.; Sabater, S.; Sabater, F. Influences of the stream groundwater hydrology on nitrate concentration in unsaturated riparian area bounded by an intermittent Mediterranean stream. Water Resour. Res. 2003, 39, SBH121–SBH1213. [Google Scholar] [CrossRef]
  56. Lentini, A.; Kohfahl, C.; Benavente, J.; Garcia-Arostegui, J.L.; Vadillo, I.; Meyer, H.; Pekdeger, A. The impact of hydrological conditions on salinisation and nitrate concentration in the coastal Velez River aquifer (southern Spain). Environ. Geol. 2009, 1–11. [Google Scholar] [CrossRef]
  57. Demirel, Z. The history and evaluation of saltwater intrusion into a coastal aquifer in Mersin, Turkey. J. Environ. Manage. 2004, 70, 275–282. [Google Scholar] [CrossRef] [PubMed]
  58. Ortega, M.; Velasco, J.; Millan, A.; Guerrero, C. An ecological integrity index for littoral wetlands in agricultural catchments of semiarid mediterranean regions. Environ. Manage. 2004, 33, 412–430. [Google Scholar] [CrossRef] [PubMed]
  59. Kilic, S.; Evrendilek, F.; Berberoglu, S.; Demirkesen, A.C. Environmental monitoring of land-use and land-cover changes in a Mediterranean Region of Turkey. Environ. Monit. Assess. 2006, 114, 157–168. [Google Scholar] [CrossRef] [PubMed]
  60. Brinson, M.M.; Malvarez, A.I. Temperate freshwater wetlands: Types, status, and threats. Environ. Conserv. 2002, 29, 115–133. [Google Scholar] [CrossRef]
  61. van Schaik, H.; Tyagi, A.; Kasten, T. Global changes and risk management: Adaptation to climate change. Theme 1 Report; 5th World Water Forum: Istanbul, Turkey, 2009. [Google Scholar]
  62. Droogers, P. Global irrigated area mapping: Overview and recommendations, Working Paper 36; International Water Management Institute: Colombo, Sri Lanka, 2002; p. 54. [Google Scholar]
  63. Thenkabail, P.S.; Schull, M.; Turral, H. Ganges and Indus river basin land use/land cover (LULC) and irrigated area mapping using continuous streams of MODIS data. Remote Sens. Environ. 2005, 95, 317–341. [Google Scholar] [CrossRef]

