Article

Hyperspectral Reflectance and Fluorescence Imaging to Detect Scab Induced Stress in Apple Leaves

1
VITO, Flemish Institute for Technological Research, Boeretang 200, BE-2400, Mol, Flanders, Belgium
2
Crop Bio-engineering, Katholieke Universiteit Leuven, W. de Croylaan 42, 3001 Heverlee, Flanders, Belgium
3
M3-BIORES, Katholiek Universiteit Leuven, W. de Croylaan 34, BE-3001, Flanders, Belgium
4
Laboratory of Molecular and Physical Plant Physiology, Centre for Environmental Sciences, Hasselt University, Agoralaan, Bldg D, 3590 Diepenbeek, Flanders, Belgium
5
Centro de Estudios Avanzados en Zonas Aridas, Universidad de la Serena Benavente 980, Casilla 599, 172-0170 La Serena, Chile
*
Author to whom correspondence should be addressed.
Remote Sens. 2009, 1(4), 858-874; https://doi.org/10.3390/rs1040858
Submission received: 14 September 2009 / Revised: 28 October 2009 / Accepted: 2 November 2009 / Published: 6 November 2009

Abstract

:
Apple scab causes significant losses in the production of this fruit. A timely and more site-specific monitoring and spraying of the disease could reduce the number of applications of fungicides in the fruit industry. The aim of this leaf-scale study therefore lies in the early detection of apple scab infections in a non-invasive and non-destructive way. In order to attain this objective, fluorescence- and hyperspectral imaging techniques were used. An experiment was conducted under controlled environmental conditions, linking hyperspectral reflectance and fluorescence imaging measurements to scab infection symptoms in a susceptible apple cultivar (Malus x domestica Borkh. cv. Braeburn). Plant stress was induced by inoculation of the apple plants with scab spores. The quantum efficiency of Photosystem II (PSII) photochemistry was derived from fluorescence images of leaves under light adapted conditions. Leaves inoculated with scab spores were expected to have lower PSII quantum efficiency than control (mock) leaves. However, besides scab-induced, also immature leaves exhibited low PSII quantum efficiency. Therefore, this study recommends the simultaneous use of fluorescence imaging and hyperspectral techniques. A shortwave infrared narrow-waveband ratio index (R1480/R2135) is presented in this paper as a promising tool to identify scab stress before symptoms become visible to the naked eye. Low PSII quantum efficiency attended by low narrow waveband R1480/R2135 index values points out scab stress in an early stage. Apparent high PSII quantum efficiency together with high overall reflectance in VIS and SWIR spectral domains indicate a severe, well-developed scab infection.

Graphical Abstract

1. Introduction

Apple scab, caused by the fungus Venturia inaequalis (Cooke) Wint, is a major problem for apple growers in many parts of the world. It causes significant economic losses due to fruit quality reduction, early fruit drop, and tree vigor reduction [1]. In spring, the ascospores in the overwintering pseudothecia are dispersed by wind to susceptible young leaves, sepals and young fruits where they can cause infections. Ascospores germinate and subsequently penetrate the cuticle by the germ tube. The growth of hyphae between the cuticle and epidermal cell wall over several days result in the development of stroma and finally in the development of conidiophores and conidia that rupture the cuticle. When this occurs, a scab lesion is clearly visible macroscopically [1]. Consequently, when left untreated, scab infection can cause severe damage to leaves and sepals, but also to fruit, petioles, blossoms, young shoots and budscales. To date, many breeding programs aim at developing new scab resistant cultivars with good fruit quality. However, so far, cultivars with genetic resistance to scab do not meet the expectations of growers in terms of yield, fruit quality, and flavor [2]. Therefore, consumers still prefer apple cultivars susceptible to apple scab implying larger production cost due to the need of intensive treatments with fungicides. The protection of apple trees against apple scab infections demands a considerable cost per hectare and has also negative impact on the beneficial fauna [3]. Hence, it is of great interest that scab infection could be detected nondestructively and in an early stage such that sprayings can be limited and applied more time- and site-specifically. Recent research efforts have shown the potential of hyperspectral and chlorophyll fluorescence (CF) techniques to early detect biotic and abiotic stresses in crops [4,5,6,7,8,9]. With the development of hyperspectral technology, the spectral resolution of hyperspectral sensors have reached less than 10 nm, which is sufficient for creating a continuous spectral curve from 350–2,500 nm to detect subtle changes in the spectral behavior of various biochemicals with different contents [10]. The plant state as such can be deduced from the plants’ spectral signature. This spectral signature is a measure of reflected and absorbed electromagnetic radiation at varying wavelengths in the visible, near-infrared, and shortwave-infrared range of the electromagnetic spectrum. Changes in the absorption of incident light allow the identification of plant stress. Most of the spectral stress-related studies described in literature focused on physiological changes and how these changes alter the interaction of light with the foliar medium [11,12]. Consequently, the most common and widespread change occurs in the proportion of light-absorbing pigments [13]. Chlorophylls absorb light energy and transfer it into the photosynthetic apparatus. Excess energy can be dissipated as heat or re-emitted as light at longer wavelength, i.e. chlorophyll fluorescence (CF) [14,15,16]. The increase in efficiency of one of these three processes (absorption, fluorescence and thermal emission) will result in a decrease in yield of the other two. As such, the relative intensities of CF are strongly related to the efficiency of photochemistry and heat dissipation [17] and may provide additional data to detect apple scab stress in an early stage. Leaf level CF measurements utilizing pulse amplitude modulating fluorometers have been applied with varying degrees of success to estimate plant stress, quantum yield, Photosystem II (PS II) efficiency, and electron transport rates. Flexas et al. [18] showed that steady-state fluorescence (Fs) exhibits a strong positive correlation with diurnal variations of gas exchange based parameters such as water content, stomatal conductance, and to a lesser extent, CO2 assimilation influenced by variable irradiance conditions and water stress. Gielen et al. [6] stated that much more information could be obtained from fluorescence imaging than from gas exchange measurements and nonimaging fluorescence measurements with a fluorometer. They investigated the effect of different ozone stress treatments on leaf glucosinolate concentrations by using images related to the quantum efficiency of PSII photochemistry (ΦPSII). These images were derived from a pixel-per-pixel calculation of ΦPSII = (Fm’ − Fs)/Fm’, with Fm’ representing the maximum fluorescence under light-adapted conditions [19]. This ΦPSII parameter actually measures the proportion of absorbed light by chlorophyll associated with PSII that is used in photochemistry [17]. Changes in chlorophyll functioning frequently precede changes in chlorophyll content implying that changes in CF can be seen before it is possible to detect chlorotic lesions macroscopically [4]. Apart from variations in chlorophyll content, variations in other pigments such as carotenoids and anthocyanins may also provide information concerning the physiological state of leaves. Carotenoids absorb energy in a spectral region complementary to that of chlorophylls, and transfer energy to the major pigments, i.e., chlorophylls. Besides light-harvesting, they also have a photoprotective role in which they quench the excited triplet state of chlorophylls [20]. Anthocyanins may also have a protective role against excessive light and UV irradiation [21,22] and may serve as scavengers of reactive oxygen intermediates or as antifungal compounds [23].
The main objective of this study is to evaluate the potential of nondestructive chlorophyll fluorescence and hyperspectral sensors for early detection of scab infections caused by Venturia inaequalis (Cooke) Wint in a susceptible apple cultivar, Braeburn. This study further evaluates the added value of the simultaneous use of both techniques.

2. Materials and Methods

2.1. Plant Material and Infections

Fifty apple plants (Malus x domestica cv. 'Braeburn') grafted on M9 rootstock were grown in 2.5 L pots in the greenhouse of the Faculty of Bioscience Engineering (Heverlee, Flanders, Belgium). They were irrigated using a computer-based drip system to maintain favorable soil moisture conditions. The 50 experimental trees were arranged in a randomized block design, with 25 trees treated with water (control) and 25 trees inoculated with V. inaequalis spores. Plants were in their first leaf and actively growing (plastochron of four days) at the time of treatment (±25 cm high), with more than four unfolded leaves. For infection studies, plants were inoculated with a suspension of 200,000 conidiospores per milliliter and kept in darkness at 100% relative humidity conditions for 48 hours. Afterwards, the plants were replaced in a greenhouse environment with a relative humidity of approximately 60% and a temperature of 28 °C. Hyperspectral as well as fluorescence measurements were repeated approximately daily until scab symptoms were clearly visible to the naked eye and continued thereafter at longer intervals (3, 4, 5, 6, 7, 10, 12, 14, 17 days after inoculation). The two youngest and most susceptible leaves from each plant were labeled at the start of the experiment for further spectral measurements, scab symptom assessment and analyses purposes. To reduce the effect of diurnal changes in plant processes such as photosynthesis, all measurements were performed between 8:00 and 10:00 AM.

2.2. Symptom Assessment

Starting from the moment of inoculation, the level of infection by apple scab was recorded at regular time intervals using Chevalier scores [24]. Scores from zero to four were assigned, where four equals heavy infection, and zero equals minimal infection (see also Table 1). Additionally, chlorosis was observed on the leaves considered in this study as a percentage of yellow leaf area (0 = no symptoms, 1 = 0%–25%, 2 = 25%–50%, 3 = 50%–75%, 4 = 75%–100%). When scab lesions were present, the percentage of leaf area with sporulating lesions was scored using an ordinal scale adapted from [25] and modified by [26] (0 = no sporulation, 1 = 0%–1%, 2 = 1%–5%, 3 = 5%–10%, 4 = 10%–25%, 5 = 25%–50%, 6 = 50%–75%, 7 = 75%–100%).

2.3. Chlorophyll Fluorescence Imaging

The Fluorescence Imaging System (FIS) used in this experiment is a portable device developed in the laboratory of Molecular and Physical Plant Physiology at the University of Hasselt. The excitation unit contains six lamps (3 × 20W, 3 × 50W). A blue cut-off low pass glass filter (BG39) and an infrared filter are mounted in front of the lamps. The detection unit consists of a CCD camera (PVCM 3405) equipped with a red cut off (650 nm) high pass filter. The system takes two 8-bit images: a L-image (corresponds to Fs) and H-image (corresponds to Fm’) after illumination with respectively actinic (I= 300 μmol m−2s−1) and saturating light (I= 1,200 μmol m−2s−1) intensities, without dark adaptation of the plant material (leaves were light adapted in the presence of actinic light). Software for recording and the processing of the images has been developed by [7]. After correction of the images, a false color, based on the SA-pseudo color scale, is applied to enhance visualization and highlight details of the fluorescence image. In our study no correction factor was used to rescale the quantum efficiency of PS II to more common values. This was due to software limitations and since only relative measurements are considered in this study, this artifact does not affect the final conclusions.

2.4. Hyperspectral Measurements

Hyperspectral measurements were carried out using a portable spectroradiometer (FieldSpec ProJR spectroradiometer, ASD inc., USA) operating in the 350–2,500 nm spectral range. To ensure optimal environmental conditions for leaf reflectance measurements, a plant probe and leaf clip assembly device was attached to the spectroradiometer. This device contains a 100 W halogen reflectorized lamp and offers a 10 mm diameter spot size. Therefore, two samples at different positions on the leaves were taken to obtain an adequate representation of the whole leaf. A Spectralon reference panel was used to adjust the sensitivity of the instrument detector according to the specific illumination conditions. Each scan represented an average of ten reflectance spectra.

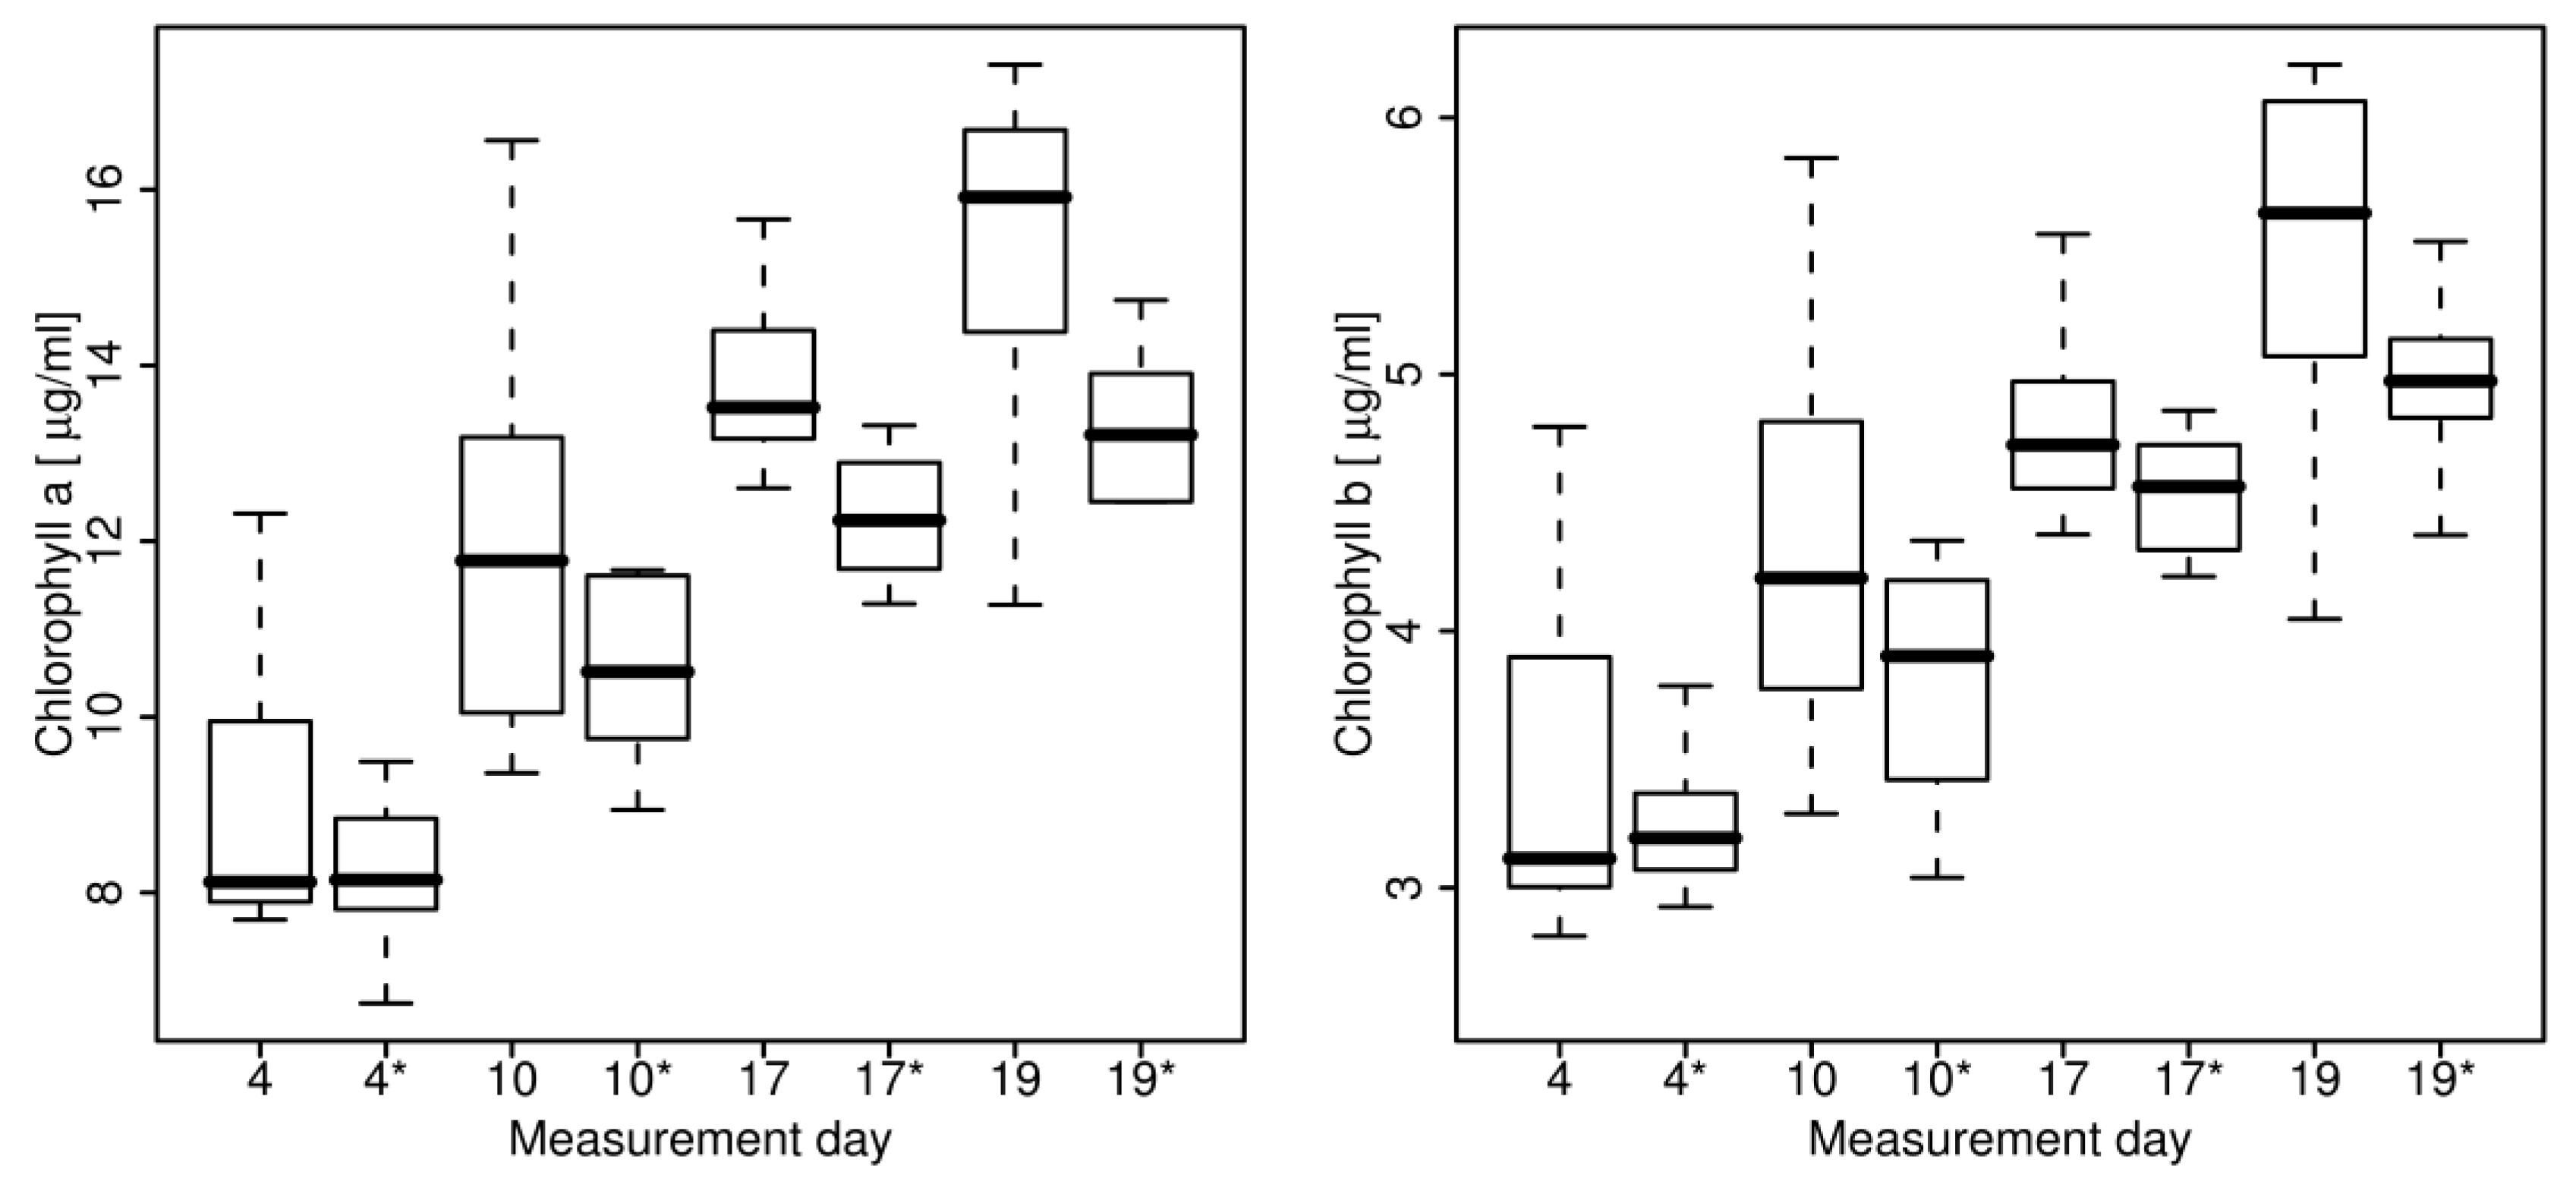
2.5. Chlorophyll Extraction

In order to get a better interpretation of the spectral data related to the processes of plant leaves under stress, destructive chlorophyll a and b extraction was performed on eight infected and mock infected leaves at regular time intervals (2, 8, 15, 17 and 22 days after inoculation). According to the method proposed by [23], circular samples (0.65 cm²) were excised from the leaves and subsequently used for extraction of chlorophyll a and b. The tissue samples were pulverized with a pestle and ground for a short time with some quartz sand. Per leaf punch, 2 mL acetone/Tris buffer (80:20, vol:vol, pH = 7.8) was added and placed in a vortex for one minute.
Subsequently, the samples were placed in a centrifuge (3,000 R.P.M., 5 min, 5 °C) to remove particulates and the supernatant was diluted to a final volume of 25 mL with the acetone/Tris buffer. Each sample for pigment analysis was placed in a cuvette and the absorbance of the extract solutions was measured with a Perkin Elmer LAMBDA 12 UV-VIS spectrophotometer (Perkin-Elmer, Inc., Boston, USA). The absorbance was measured at 537 nm, 647 nm, and 663 nm. Chlorophyll a and chlorophyll b concentrations were calculated using the equations derived by [23] which include a correction for the absorption by anthocyanins:
Chla = 0.01373 A663 − 0.000897 A537 − 0.003046 A647
Chlb = 0.02405 A647 − 0.004305 A537 − 0.005507 A663
where Ax is the absorbance of the extract solution in a 1 m path length cuvette at wavelength x.

3. Data Analysis

3.1. Chlorophyll Fluorescence Imaging

The Genty parameter (Fm' − Fs)/Fm' [19] was calculated as a measure of the proportion of the light absorbed by PSII that is used in photochemistry. The distribution of (Fm' − Fs)/Fm' values within scab-induced and control leaves were compared with the two sample Kolmogorov-Smirnov statistic for each measurement day. More detailed analyses on the pixel distributions were performed based on visual prospects of the distribution of the pixel values of (Fm' − Fs)/Fm'.

3.2. Hyperspectral Measurements

Because of the large amount of research studies available focusing on the VIS spectral domain, this paper aims at getting better insight in the SWIR spectral domain (1,300–2,500 nm). The VIS spectral domain is moreover not the most suited to early detect stresses because changes in the VIS spectral domain are mainly linked to the appearance of stress symptoms. The continuum removal technique was applied on the SWIR spectral region in order to get better insight in the overall absorption behavior in this spectral domain [27,28]. This technique is based on the fitting of a continuum line on the reflectance spectra. The reflectance at the continuum line is then divided by the absolute reflectance at the corresponding wavelength resulting in values between 0 and 1. Continuum removal as such normalizes the reflectance spectra in the SWIR domain to allow comparison of the overall SWIR absorption from a common baseline. The technique moreover enhances the absorption characteristics in this region. The area under the continuum removed reflectance curve was calculated as a measure of absorption in the SWIR region. As such, it was possible to consider the whole SWIR spectral region at once.
Binary classification was performed by logistic regression [8]. In a previous study aiming to detect scab stress [29], all possible ratio indices were investigated using equation (3):
R I = λ i λ j
where λ i and λ j are the reflectance values at wavelength i and j, respectively, with i and j ranging from 400–2,500 nm. These derived ratio indices were used as independent variables in a logistic regression analysis. The area under the receiver operator characteristic curve (c-values) was calculated and used as a statistical measure for the evaluation and comparison of the discriminatory performance of the different ratio indices. A random classifier has an area or c-value of 0.5, while and ideal one has an area of 1. Based on the results of this study, a closer look was taken at the SWIR based ratio index consisting of wavelengths 1,480 and 2,135 nm.
In addition, two indices known to be closely related to plant physiological properties were evaluated. The Photochemical Reflectance Index (PRI, (R531-R570)/(R531+R570)) [30] is recognized to be associated with plant photosynthetic status and the Normalized Phaeophytinization Index (NPQI, (R415 − R435)/(R415 + R435)) [31] has proven to be a good measure for chlorophyll degradation. NPQI was linked directly to mite-induced stress by [43] and has also been shown as a strong detector of early stress by [44,45].
To establish a link between hyperspectral and fluorescence techniques, Fluorescence Ratio Indices (FRI) were calculated as well as R690/R600 and R740/R800 [32]. Since fluorescence is related to chlorophyll a content, the Pigment Specific Simple Ratio (PSSRa) (R800/R680), developed by [33] to determine chlorophyll a content of deciduous tree leaves at various stages of senescence and insensitive to species type, was applied as well.

4. Results

4.1. Fluorescence Imaging

Four leaves were chosen as good representatives for the variation observed in the whole dataset and their symptom scores are specified in Table 1. No visual symptoms were observed on the host tissue until 12 days after inoculation.
Results show that the amount of pixels with high quantum yield efficiency increases in the reference leaf throughout the experiment as the young leaves become more mature. However, tissue damaged by V. inaequalis also show very high ΦPSII values at the end of the experiment, although in a more irregular pattern and exhibiting higher values than control leaves. There is a large variability of ΦPSII pixel values found within a leaf and it therefore is recommended to consider the distribution of ΦPSII values throughout the full fluorescence image. To conveniently represent this distribution, histograms were constructed for each measurement day in Figure 1. The histogram of the control leaves (black) was overlaid by this of the scab inoculated leaves (grey).
Table 1. Symptom assessment of three scab inoculated leaves with different levels of symptoms (L1–L3) and one control leaf (L4) based on the Chevalier scale (S1; 0–5 scale), sporulation scale (S2; 0–7 scale) and chlorosis scale (S3; 0–4 scale).
12 days after inoculation14 days after inoculation17 days after inoculation
S1S2S3S1S2S3S1S2S3
L1201201431
L2311441451
L3431452562
L4000000000
Figure 1. Histograms depicting the distribution of the ΦPSII pixel values throughout time for all measured scab inoculated (grey) and control leaves (black). Histograms were constructed for images taken at 3, 4, 5, 6, 7, 10, 14 and 17 days after inoculation.
Remotesensing 01 00858 g001
From Figure 1 it is clear that the distribution of ΦPSII pixel values differed in control and scab inoculated leaves. The Kolmogorov-Smirnov two sample test statistic proved that the distributions between the ΦPSII values of scab inoculated and control leaves differed significantly (p < 0.001). More ΦPSII values around 0.92–0.97 can be found in the control leaves compared to the scab inoculated leaves, while the opposite can be seen for the values ranging from 0.76 to 0.85. With the intention of amplifying these findings, a ratio dividing the amount of pixels having ΦPSII values between the above considered ranges, was investigated. Logistic regression applied on these ratios resulted in c-values of 0.96, 0.83 and 0.96 respectively for the third, fourth and fifth day after inoculation.

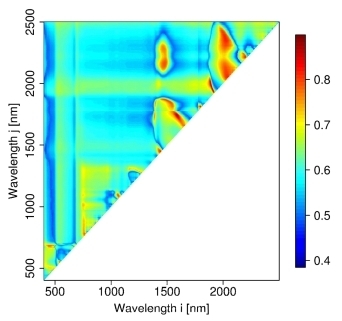
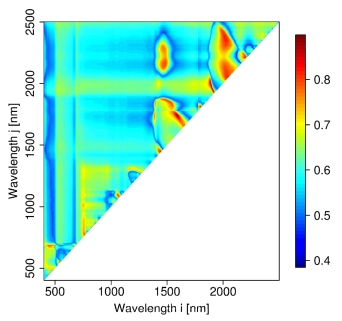
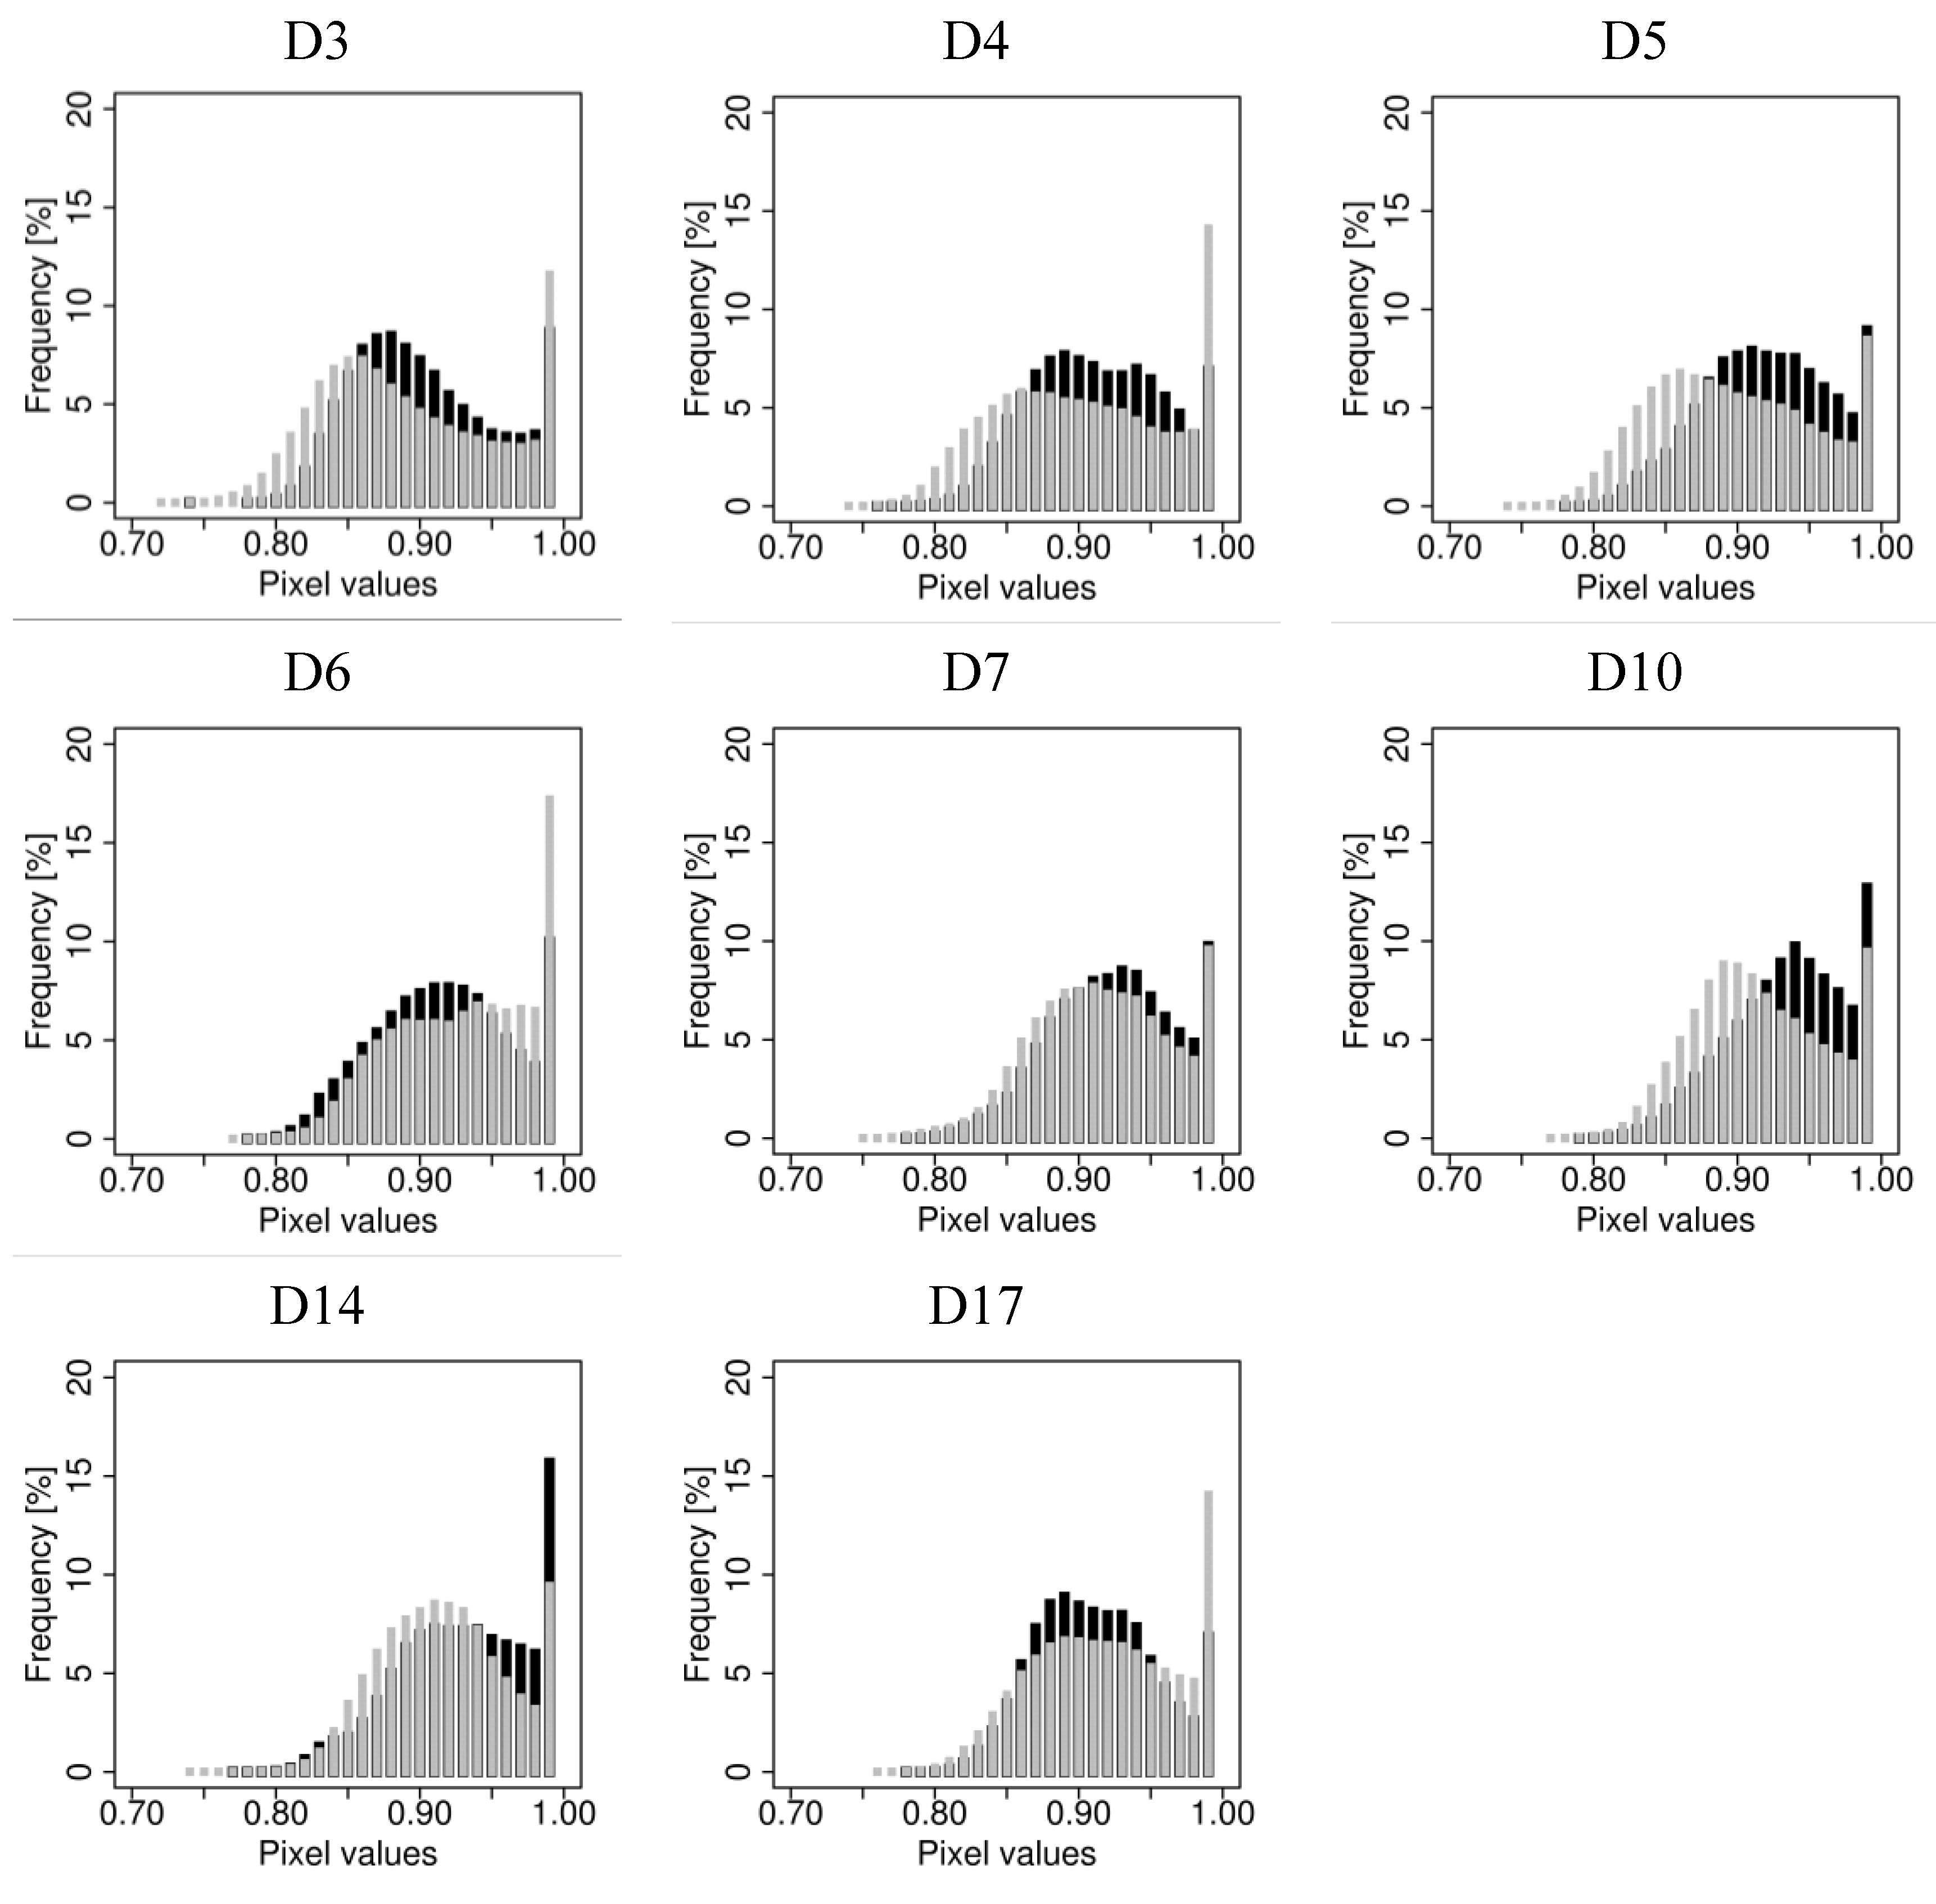
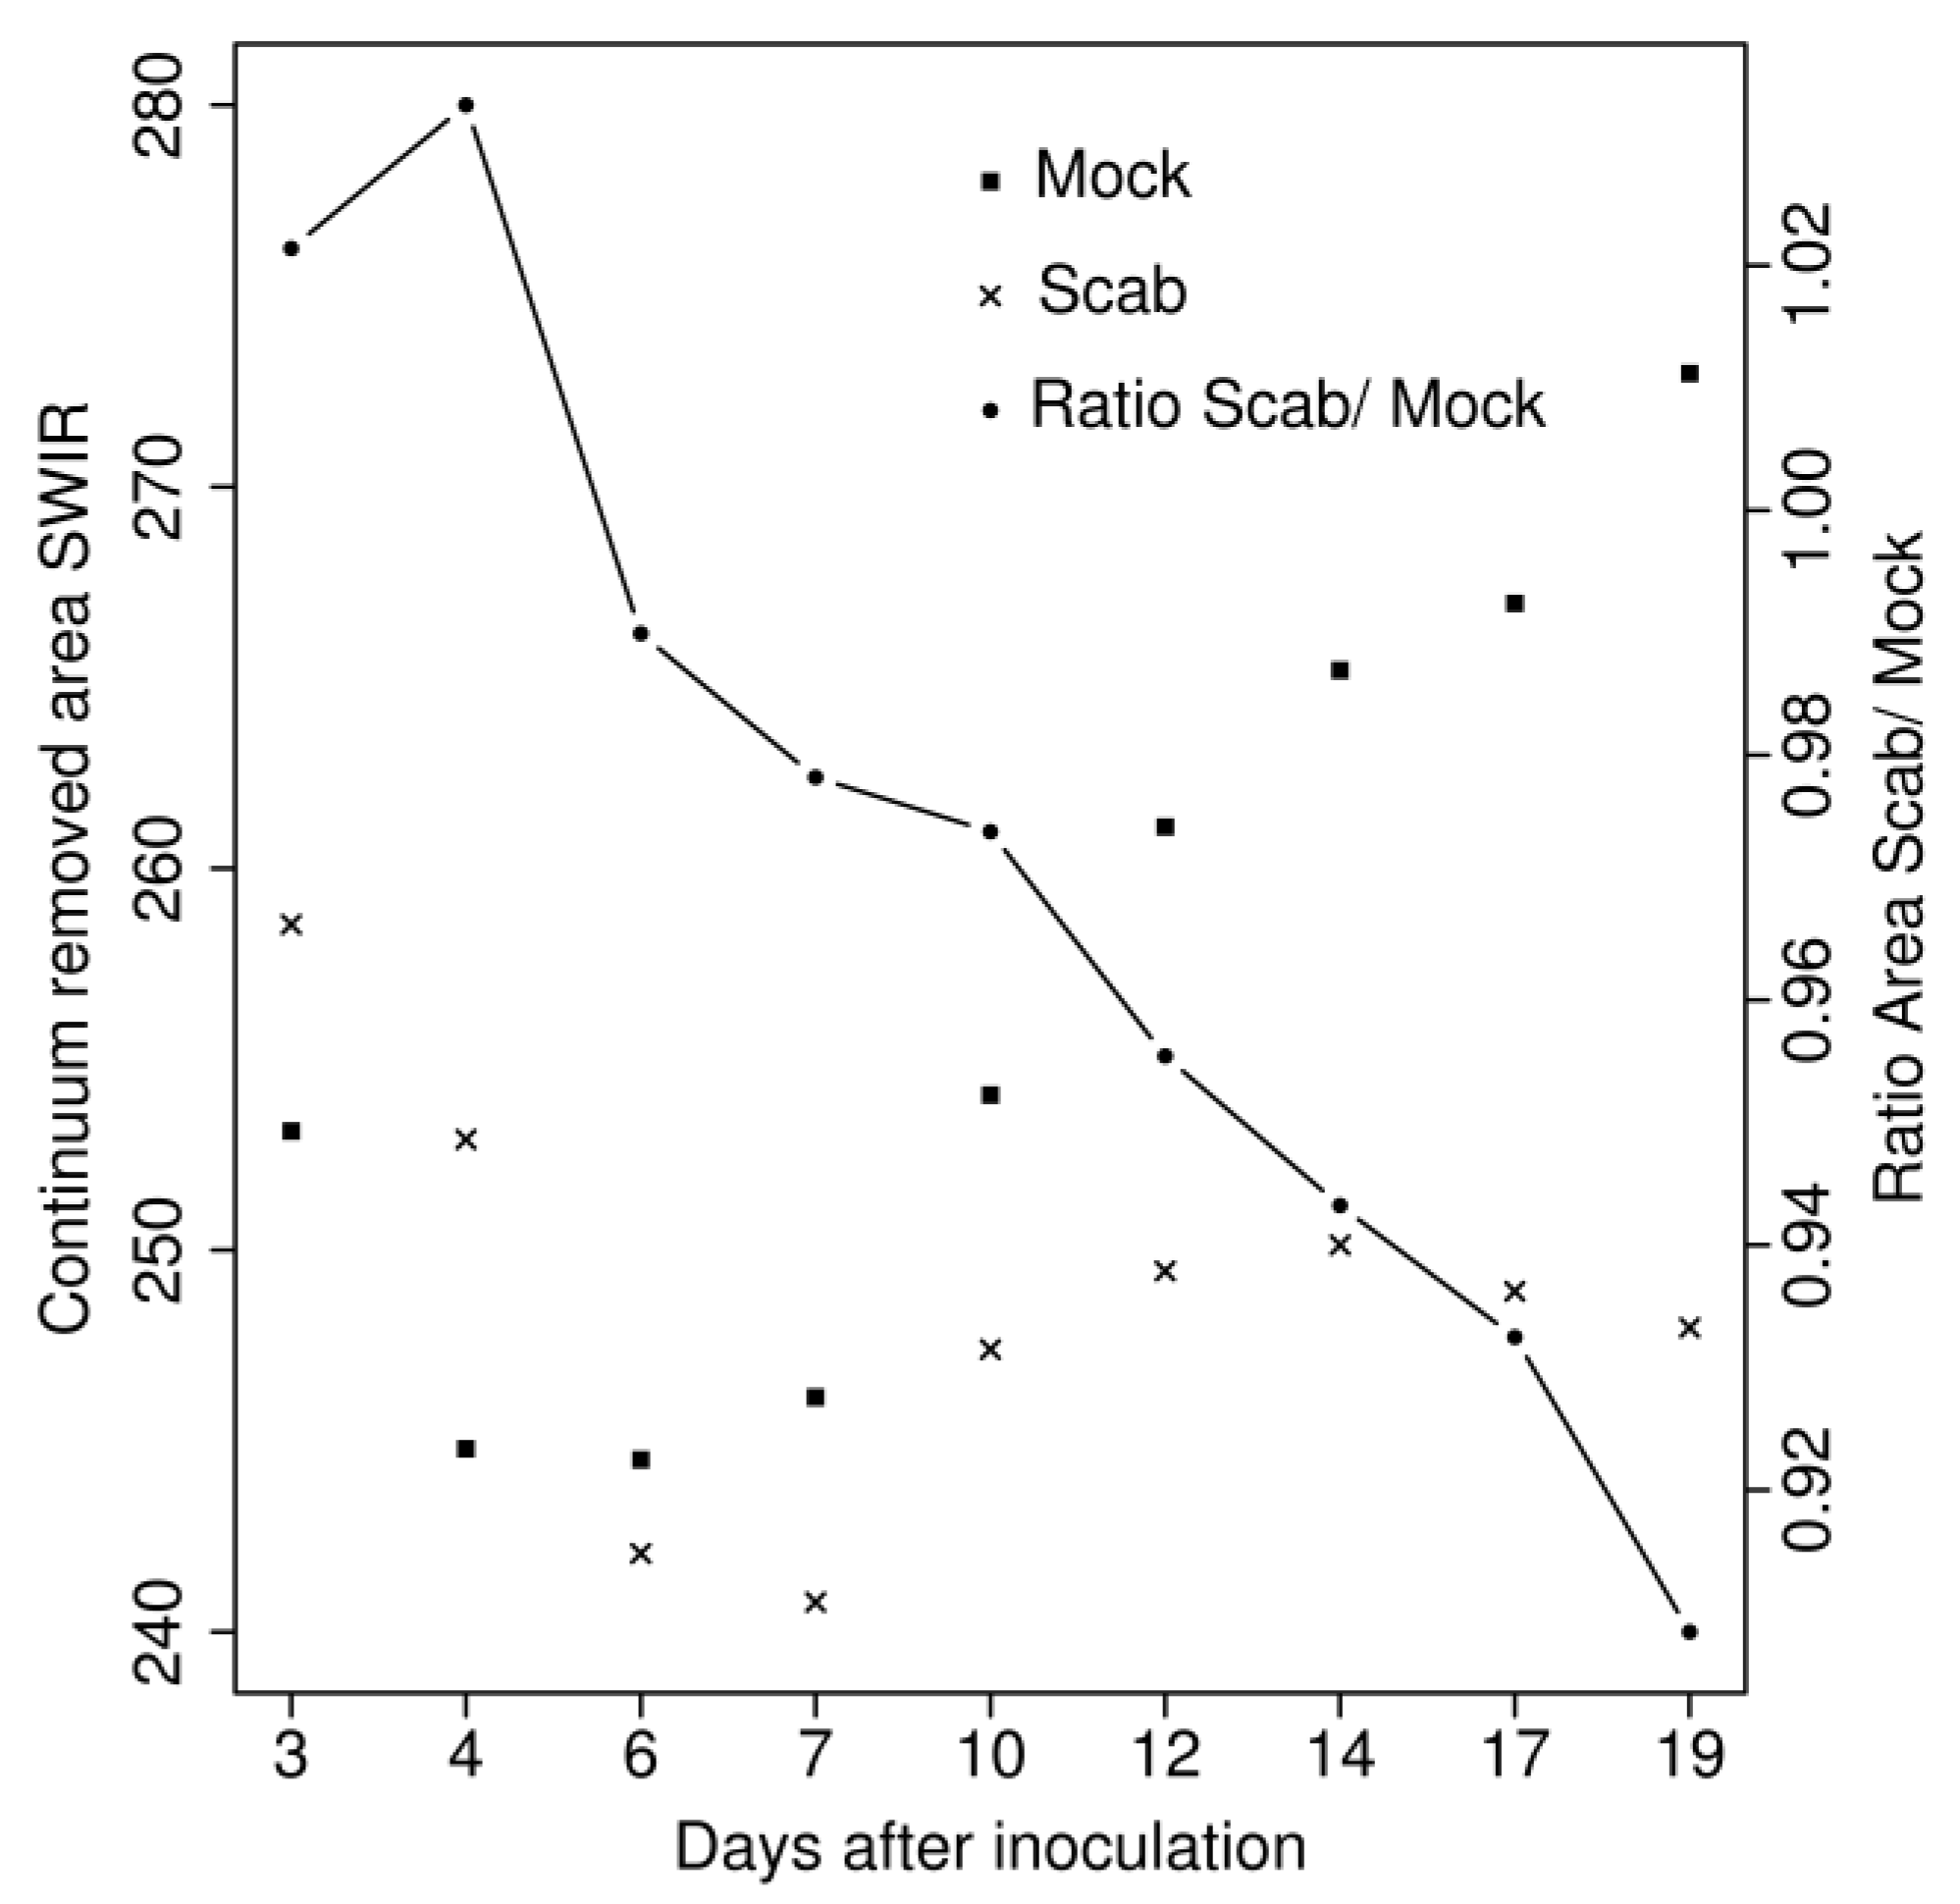
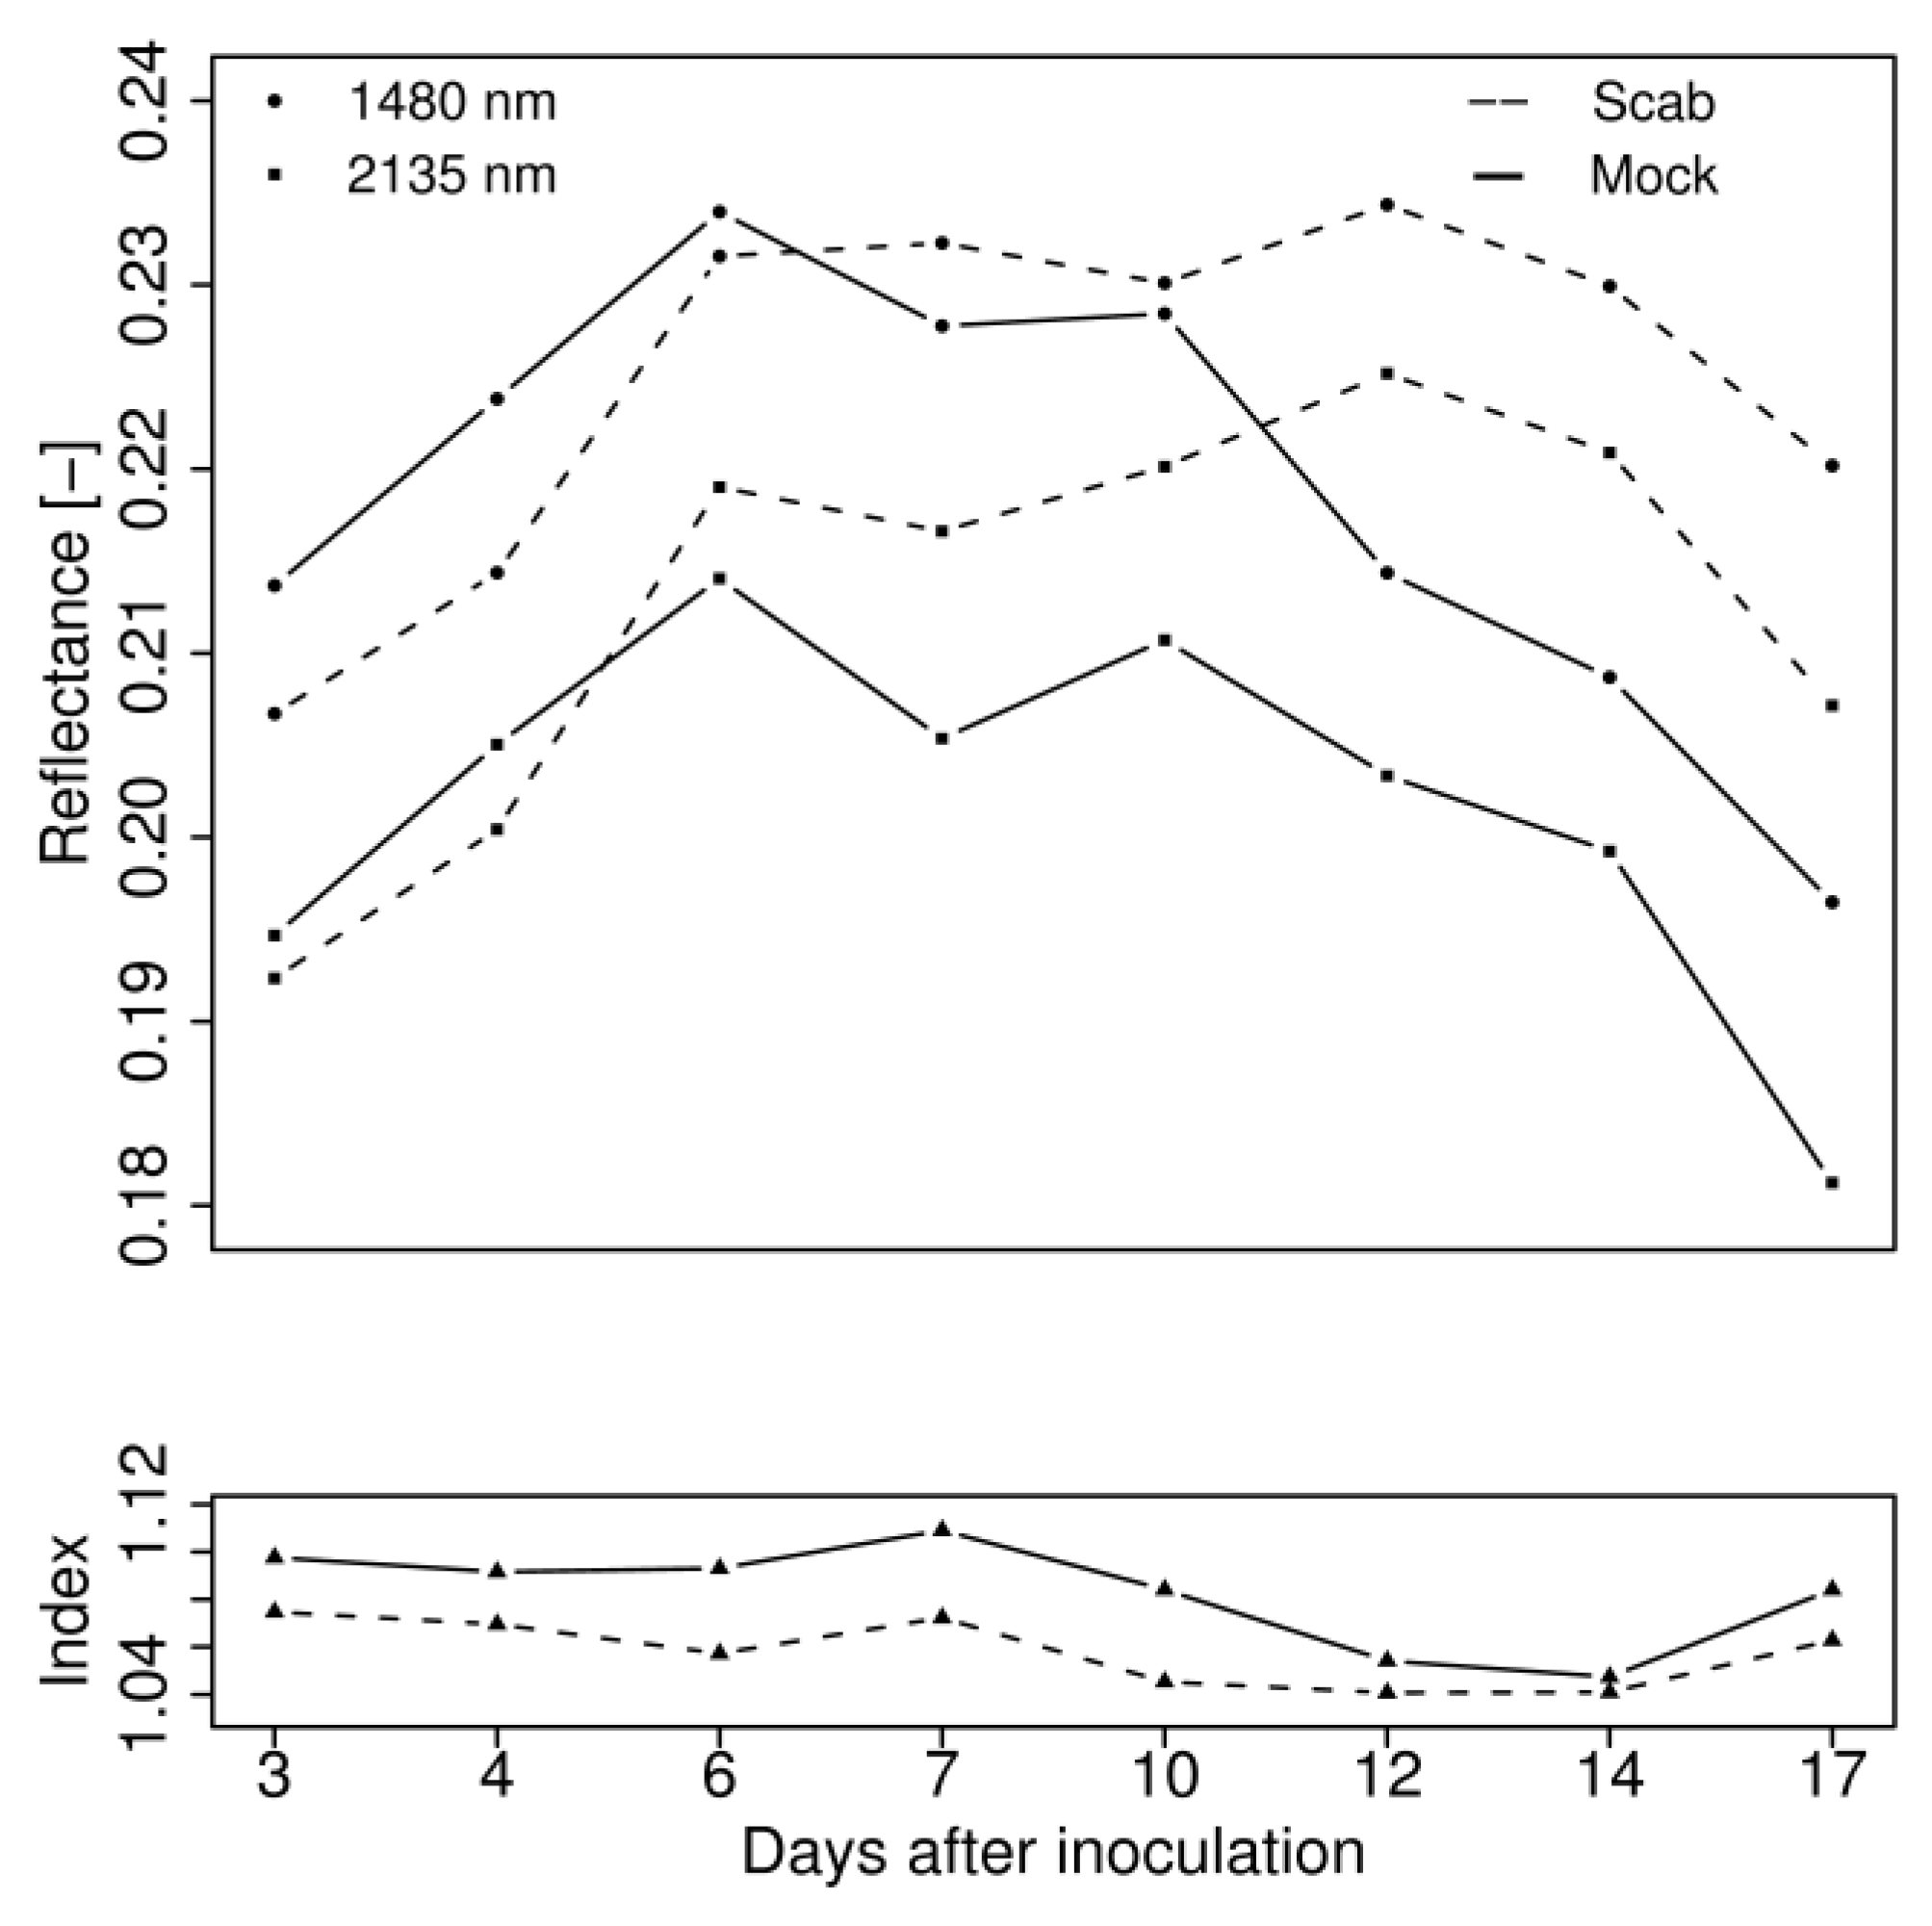
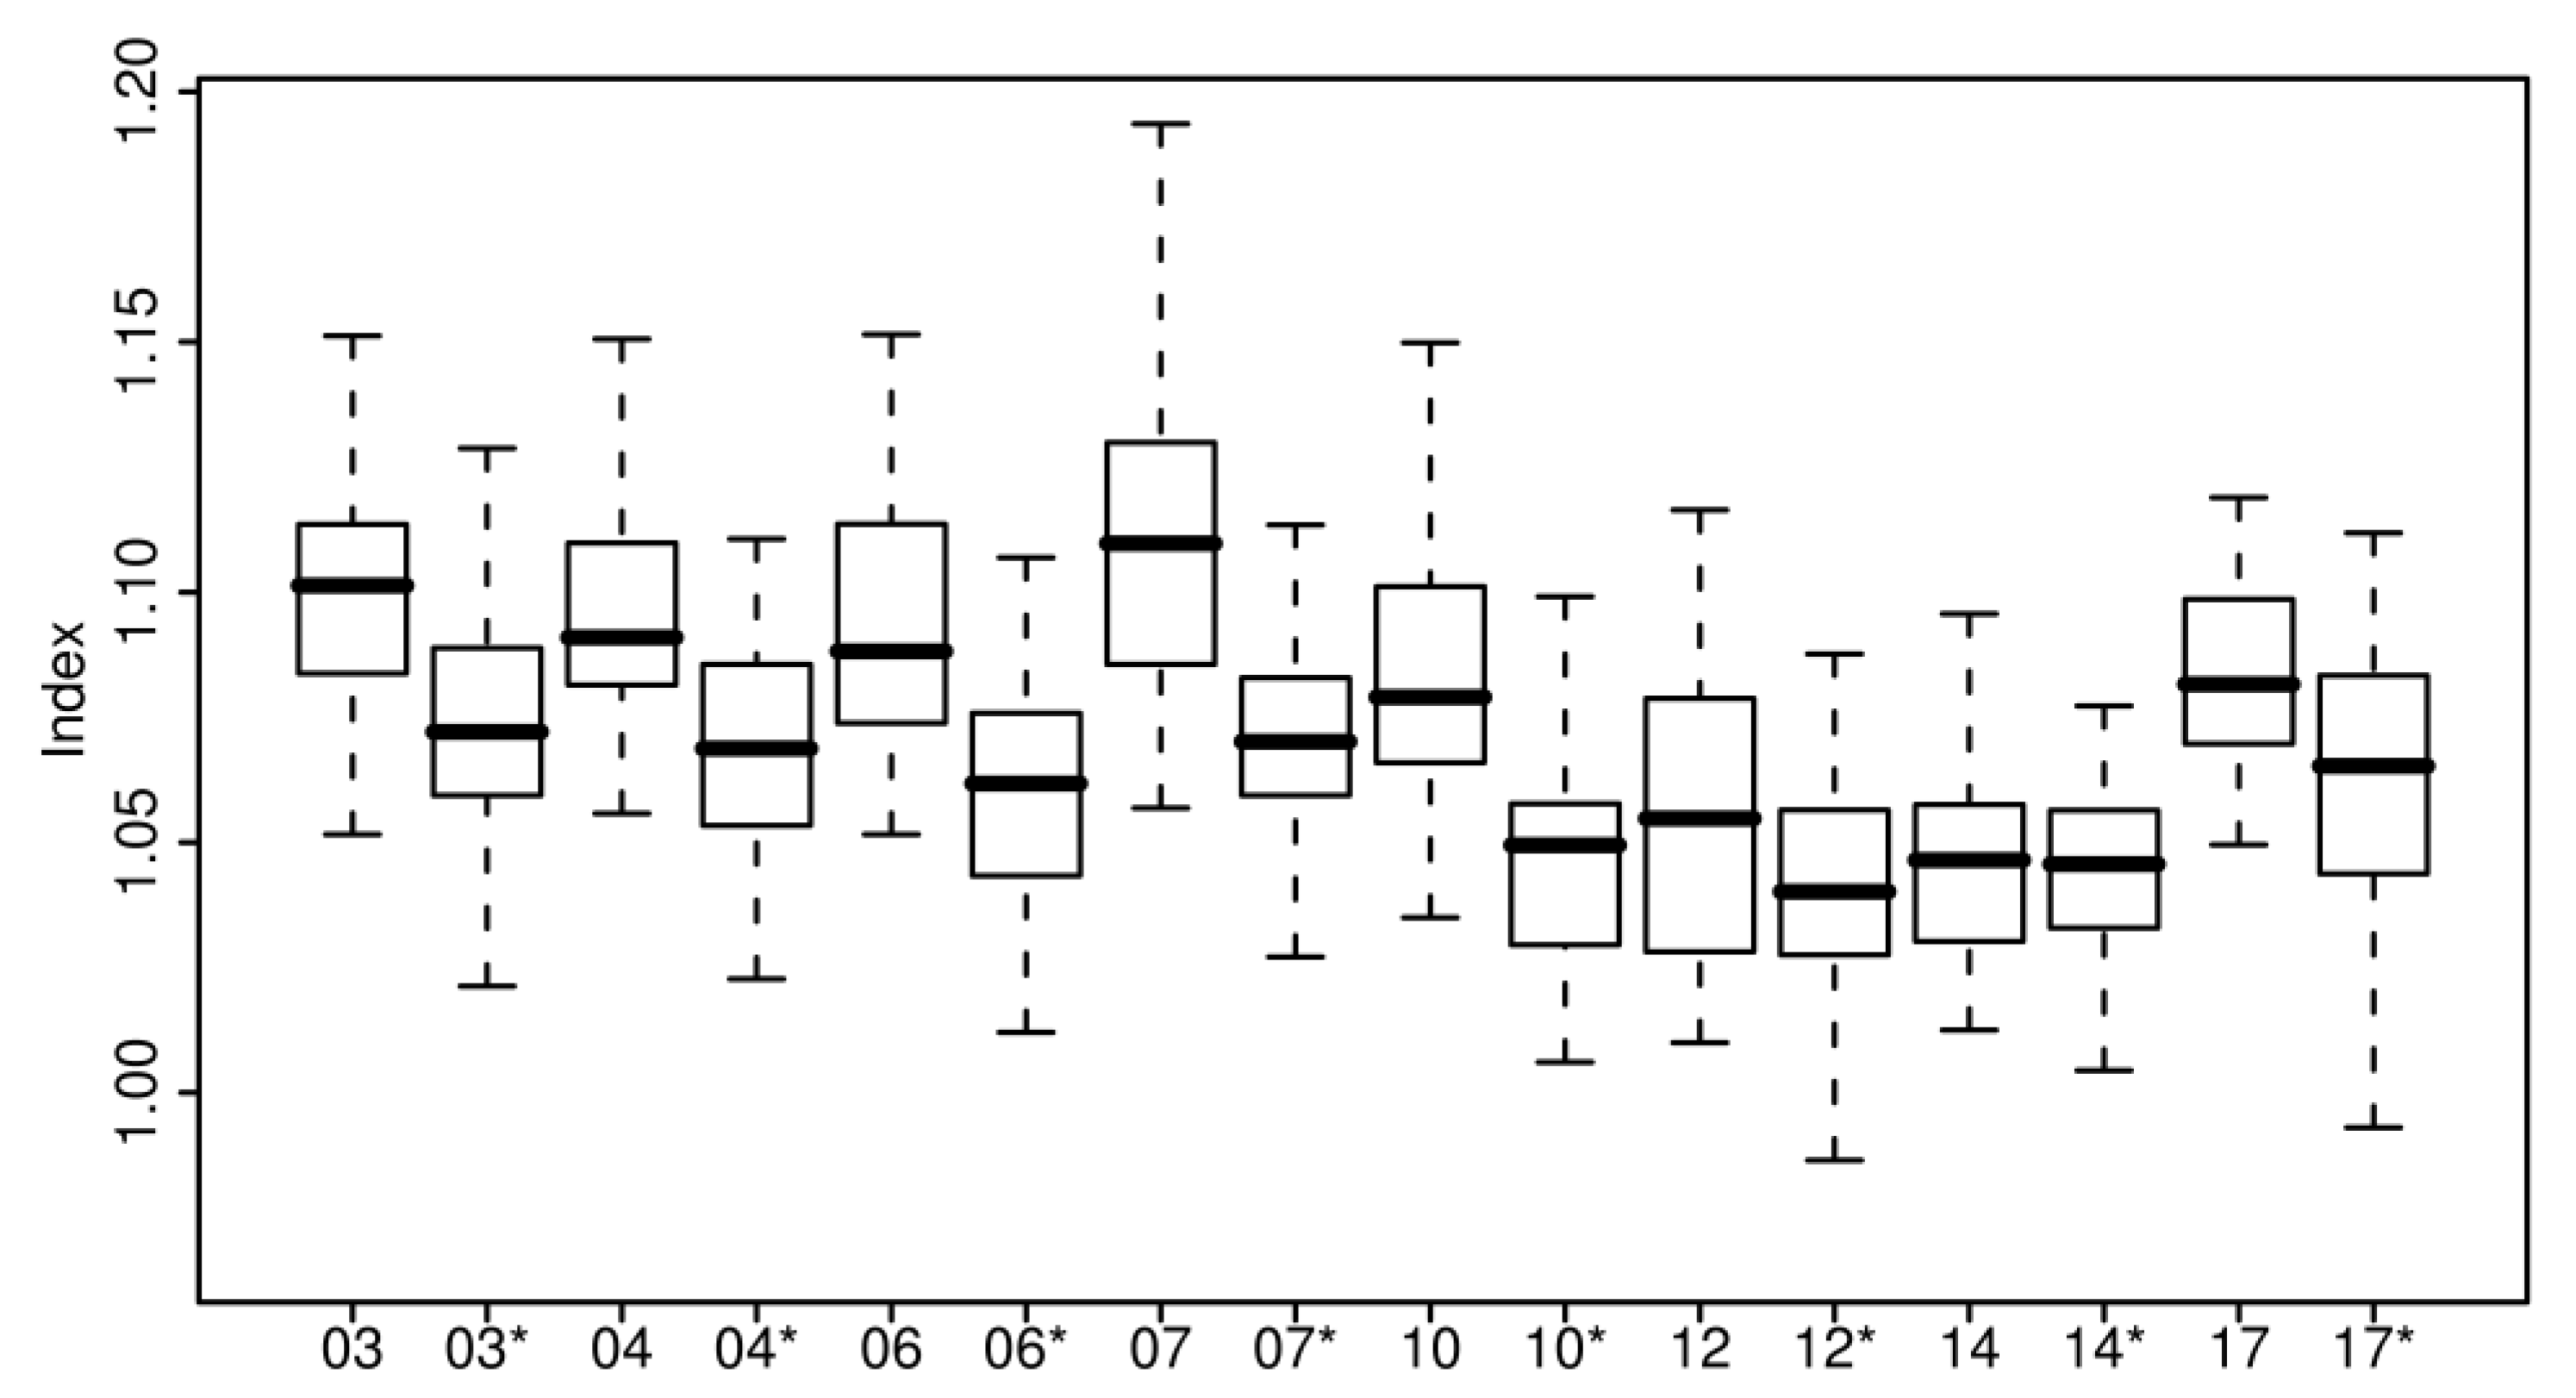
4.2. Hyperspectral Analysis

The averages of the areas under the continuum removed SWIR spectral region for each measurement day for scab-inoculated and control leaves, depicted in Figure 2, reveal that leaves inoculated with scab spores are likely to have a larger SWIR absorption area on the third and fourth day after inoculation compared to the control leaves, while an opposite trend could be found in later infection stages.
Figure 2. The average of the continuum removed SWIR areas for each measurement day for scab-inoculated (×) and control (mock) (▪) leaves. Ratio of the average areas of both treatments were plotted on the right Y-axis and represented by connected dots.
Remotesensing 01 00858 g002
However, binary classification by logistic regression resulted in significant differences (c-values > 0.8) only from 12 days after inoculation onwards.
Subsequently, a ratio index consisting of wavelengths 1,480 and 2,135 nm was selected for further analysis. The discriminatory performance of the index under consideration throughout time and of the other indices used in this study is represented by their c-values in Table 2 c-values above 0.8 represent significant differences.
Table 2. Discriminatory performances of the indices considered in this research to discriminate between scab-inoculated and control leaves (c-values above 0.8 are considered to be significant).
DAIc-values of considered indices
R1480/R2135PSSRaPRINPQIR690/R600R740/R800
30.780.520.530.590.520.68
40.820.580.580.800.730.84
60.850.620.590.580.520.74
70.850.600.560.640.650.59
100.890.720.570.670.660.53
120.660.780.590.620.790.53
140.640.850.790.730.750.62
170.530.860.670.710.570.65
In Figure 3 the average spectral behavior of both wavelengths separately as well as combined in a ratio index has been plotted throughout time for the scab inoculated and reference leaves.
Again, a tendency towards lower reflectance values of the scab inoculated leaves can be observed on the third and fourth day after inoculation for both wavelengths. At a later period, reflectance values of scab inoculated leaves are likely to increase more than control leaves at both wavelengths. The selected ratio provided lower values for the scab inoculated leaves than for the control leaves when looking at the average temporal profiles. However, boxplots in Figure 4 and c-values in Table 2 show that the selected index has good discriminative power to distinguish between scab inoculated and reference leaves only in the first 10 days after inoculation.
Figure 3. (top) The average spectral behavior of wavelengths 1,480 nm and 2,135 nm for scab inoculated (––) and mock leaves (-) as obtained from the first until the 17th day after inoculation. (bottom) The average spectral behavior of ratio 1480/2135 for the scab inoculated (––) and mock leaves (-) as obtained from the first until the 17th day after inoculation.
Remotesensing 01 00858 g003
Figure 4. Boxplots representing the behavior of the index R1480/R2135 for each measurement day. The measurement days are shown on the X-axis with * representing measurements on scab inoculated leaves and without * the control leaves.
Remotesensing 01 00858 g004
The PRI, NPQI and both fluorescence ratio indices (R690/R600 and R740/R800) did not perform well in early detecting scab stress except for respectively the 12th and 4th day after inoculation as can be seen in Table 2. The chlorophyll a related Pigment Specific Simple Ratio (PSSRa) (R800/R680), has proven to be a good discriminative tool to discern control from scab inoculated leaves in a well-developed infection stage.

5. Discussion and Conclusions

5.1. Fluorescence Imaging

The PSII quantum efficiency (Fm' − Fs)/Fm' or ΦPSII is affected by the level of electron acceptors, usually NADP+, available at the acceptor side of PSI. Consequently, ΦPSII decreases in situations with limiting consumption of NADPH, for example at low internal CO2 concentration [34]. Changes in (Fm' − Fs)/Fm' can be attributed to differences in the electron flux reduction capacity of PSII, but also to the down-regulation of PSII. It is a measure of the rate of linear electron transport and as such an indication of overall photosynthesis. Images of ΦPSII per pixel (not shown) indicate that there are more low pixel values for scab inoculated leaves compared to control leaves. Consequently, it can be concluded from preceding theory that the PSII quantum efficiency decreased in many pixels of the scab inoculated leaves. A ratio dividing the amount of pixels with values between 0.92–0.97 and the amount of values between 0.76 and 0.85 has been proven a very efficient tool to early detect scab stress in young apple leaves. However, at a well-developed infection stage, when symptoms are already visible, scab-inoculated leaves apparently become photosynthetic more efficient than mock leaves. This can be explained by the fact that different combinations of Fm' and Fs can result in the same ΦPSII (i.e., (Fm' − Fs)/Fm') parameter value. For example, in an ideal situation the leaf pixels have high Fm’ and low Fs values, resulting in a ΦPSII value close to one. However, inactivation of a cell will result in pixel values of Fm’ and Fs close to zero, which will also result in a ratio value close to one. Hence, cells that became inactive due to damage by V. inaequalis established high ΦPSII values. Histograms confirmed this hypothesis with many pixel values close to one in healthy as well as infected leaves (Figure 1). The inconsistency on the sixth day after inoculation showing high photosynthetic efficiency in the scab inoculated leaves could be attributed to the activation of specific steps in the defense mechanism. However, also the environmental greenhouse conditions on day 5 might have been responsible for this inconsistency. Due to failure of the automatic climate steering system in the greenhouse, temperatures of 39 °C and relative humidity of 30% were recorded in the afternoon.

5.2. Hyperspectral Analysis

A short discussion is presented regarding the results obtained in the hyperspectral study in context of existing physiological knowledge. However, identification of exact physiological mechanisms behind the detected differences cannot be given since biochemical data such as protein, lignin and cellulose were not available. The SWIR region is known to be influenced by cellular and cell wall structure and water absorption. Lignin and cellulose are the main chemical compounds of cell walls of plants. Lignin absorptions appear at 1,120, 1,200, 1,420, 1,450, 1,690, and 1,940 nm. Cellullose absorptions appear at 1,200, 1,490, 1,780, 1,820, 1,940, 2,100, 2,270, 2,280, 2,340, and 2,350 nm. Nitrogen contained in protein shows absorptions at 1,510, 1,690, 1,940, 1,980, 2,060, 2,180, 2,240, 2,300, and 2,350 nm [35]. From the continuum removal technique it was shown that leaves inoculated with scab spores were likely to have a larger SWIR absorption area on the third and fourth day after inoculation compared to the reference leaves, while an opposite trend could be found in a later infection stage. This corroborated the significant differences in reflectance found at wavelengths 1,480 nm and 2,135 nm between control and scab inoculated leaves for the first week after inoculation (Table 2). The stronger absorption of electromagnetic radiation in the SWIR spectral domain of the scab inoculated leaves could be attributed to a less effective removal of excessive water during inoculation. However, since the ratio of both wavelengths was found to be significantly lower in scab inoculated compared to control leaves during the first week after inoculation, it is more probable that changes occurred in lignin, cellulose, or protein content since they also have major absorption features in these spectral regions [36]. The similar tendency in the behavior of the ratio index due to protein variations related to altered physiological processes supports this hypothesis (Figure 5).
In Figure 5a, the convenience of all possible two-band ratio indices to detect scab stress in an early infection stage tested by use of logistic regression was represented by their c-values. Figure 5b, shows the R² values of linear models fitted through all possible two-band ratio indices and protein content. Data were derived from the Leaf Optical Properties Experiment (LOPEX) [37] dataset. This LOPEX dataset obtained by the Joint Research Center (JRC), Ispra, Italy, has been made available online for public use ftp://ftp-gvm.jrc.it/verstmi/lopex. Extension of these results to the life cycle of V. inaequalis suggests that the penetration of the spores into the cuticle, and the growth of a mycelium between the cuticle and the epidermal cell walls, have an influence on the selected ratio index. Alterations in the cell wall in direct contact with the fungal stroma were believed to be caused by cell wall degrading enzymes [1]. Win et al. [38] reported the isolation of a protein fraction produced by V. inaequalis in liquid culture. From 12 days after inoculation onwards, no significant differences in ratio values of the scab inoculated and control leaves were perceived. However, from that day onwards, significant lower total absorption of the SWIR domain in the scab inoculated leaves was found compared to that in reference leaves via the continuum removal technique. Since the SWIR domain is mainly dominated by the absorption of water and by the cellular structure, an overall change in structure and water loss is the most plausible explanation for this. This water loss at a well-developed infection stage corroborated the findings of [1] who noted the profound effect of V. inaequalis on the distribution pattern of water and dissolved solutes within leaf veins. Water loss from lesions has been proposed by [1] as a factor in a solute transport system by which V. inaequalis acquires nutrients for growth under the cuticle. Germinating conidia produce melanoproteins that spread outwards within the leaf to create a solute transport system of preferred routes to the infection site. This specialized transport system restricts the export of nutrients from the infected leaf and provides means for accumulating nutrients at a developing lesion. Eruption of the cuticle by conidiophores and conidia causes an increase in water loss, thereby creating water potential differences which direct nutrients to the lesions [1]. Conversely, although the total absorption in the SWIR domain is higher in the infected leaves than in the healthy leaves, a decreasing trend is observed in Figure 3 at the end of the experiment. It has to be reconsidered, however, that on the 12th day after inoculation the first lesions became visible to the naked eye. Moreover, results of destructive chlorophyll analyses represented in Figure 6 have shown that from then on scab inoculated leaves contained less chlorophyll pigments than control leaves. Due to a lack of destructive data on the 12th day after inoculation, conclusions could only be made for pigment determinations on the 17th day after inoculation.
Figure 5. (a) c-Values representing the discriminatory performance of all possible two spectral ratio indices throughout the full spectral region (extracted from [29]). Logistic regression was used for binary classification of scab-inoculated and control leaves. (b) Determination coefficients of linear models fitted through protein content and all possible two spectral ratio indices. Data taken from LOPEX.
Remotesensing 01 00858 g005
From these findings, the inefficacy of the hyperspectral ratio index from the 12th day after inoculation onwards should also be attributed to the decrease of chlorophyll pigments. Though, remote sensing community has established a long time ago that chlorophyll pigments have no direct effect on reflectance spectra in shortwave infrared. Subsequently, the decrease in reflectance of both wavelengths considered in the ratio (Figure 5) must have its origin elsewhere. By recalling previous results and the visual inspection of not only chlorotic, but also necrotic lesions, the answer on this issue can be formulated. Chevalier et al. [24] stated that epidermal cells collapsed in necrotic lesions, leading to less vacuolation and therefore less multiple scattering, i.e., less reflection. The use of chlorophyll and structure related indices will therefore be more appropriate and easier to interpret in this later stage of infection.
In previous research it was demonstrated that the use of the Pigment Specific Simple Ratio (PSSRa) (R800/R680), developed by [33] to determine chlorophyll a content of deciduous tree leaves at various stages of senescence and insensitive to species type, performed excellent as classification tool to make a distinction between control and scab infected leaves from 12 days after inoculation onwards (Table 2; [29]). Although PRI has been related to xanthophyll cycle pigments and is as such considered as a good measure for the photosynthetic light use efficiency even when rapid changes in pigment content occur [30,39,40,41], the index did not perform well in discriminating scab from healthy leaves in the first 17 days after inoculation (Table 2). This corroborated the study of [42] in which no changes in PRI were found when fast leaf dehydratation was applied, even though a decrease of photosynthetic light use efficiency was observed.
Figure 6. Boxplots depicting the outcomes of the destructive pigment extraction on different measurement days. Measurement days indicated with * represent results of scab inoculated leaves and without * the control leaves.
Remotesensing 01 00858 g006
Changes in PRI only could be observed when strong inhibition of photosynthetic activity took place due to prolonged drying of olive leaves which led to a decrease in chlorophyll concentration and to a simultaneous increase in the carotenoid to chlorophyll ratio. This latter could be derived from the NPQI index, which also did not show good discriminatory performance to discern control from scab inoculated leaves except for the fourth day after inoculation (Table 2). Given that this was also the only day that the FRI R690/R600 showed significant differences these observations could probably been attributed to the activation of a defense mechanism in the plant. Although [32] concluded that the FRI indices, calculated in the red-edge spectral region, showed superior results as compared with the PRI indices for tracking plant stress and photosynthetic status, the indices did not perform well in detecting scab stress.
Additional destructive carotenoid and anthocyanin analyses (from 17 to 22 days after infection) were performed according to the method of [23]. Significant higher amounts of these pigments in scab infected leaves were found compared to those in healthy leaves. Indices such as PRI could therefore most probably be useful in more developed infection stages. Additional gas exchange measurements were also performed with a portable photosynthetic system LCA-4 (Analytical Development Company Ltd., Hoddesdon, England), but no significant statistical differences were found between scab inoculated and healthy leaves.
In this study, the potential of the early detection of scab stress in apple leaves using noninvasive and nondestructive techniques was investigated. Fluorescence imaging as well as hyperspectral sensors came out as valuable tools for extracting information regarding the plant physiological reaction on stress induced by the apple pathogen Venturia inaequalis. The simultaneous use of both techniques provided an even better insight in the physiological processes involved in early stress reaction of scab inoculated plants. Overall, low PSII quantum efficiency indicates a leaf under stress or an immature stage of the leaf. The combination of low PSII quantum efficiency and low narrow waveband R1480/R2135 index values filters out the phenological status and points out scab stress at an early stage. Fluorescence imaging as applied in this study does not allow the detection of scab stress in a well developed infection stage, since nonphotosynthetic and very well functioning tissue behave similarly. However, severe scab infection is characterized by a decrease in chlorophyll and water content, resulting in higher overall reflectance in the VIS and SWIR spectral domains. As such, apparent high PSII quantum efficiency together with high overall reflectance in VIS and SWIR spectral domains indicate a severe, well-developed scab infection.
The results of this study are promising. However, since measurements were done under a controlled environment with favorable water and soil moisture conditions, further research is needed to test and validate the findings to plants grown under natural conditions. Further research is moreover recommended to expand the knowledge of this study to make it relevant in large-scale applications. Airborne and spaceborne sensors will enable frequent hyperspectral coverage of large areas, thereby making continuous monitoring of the overall plant state possible in commercially important fruit production systems. By mounting in situ sensors randomly in several orchard trees, additional information about the leaf state could be collected based on above-mentioned leaf-level vegetation indices and PSII data. The combination of airborne or satellite hyperspectral sensors together with in situ sensors enables further intensification of the fruit production market. Evaluation and optimization of developed vegetation indices to monitor the leaf and plant state can as such contribute to more efficient automated management strategies.

Acknowledgements

This project was funded by the Katholieke Universiteit Leuven, Department of Biosystems (Stephanie Delalieux) and the Flemish Institute for Innovation, Science and Technology-IWT (Annemarie Auwerkerken). The authors further would like to acknowledge Pieter Vandenbempt and Lieve Vanhoucke for helping gathering the data. We extend our gratitude to the Joint Research Centre of the European Commission (Ispra, Italy) for providing free access to their LOPEX database.

References and Notes

  1. MacHardy, W.E. Physiological responses to infections. In Apple Scab: Biology, Epidemiology, and Management; APS Press: St. Paul, MN, USA, 1996; pp. 152–165. [Google Scholar]
  2. Szklarz, M. Evaluation of apple cultivars’resistance to apple scab (Venturia inaequalis Che.). J. Fruit Ornam. Plant Res. 2006, 14, 183–188. [Google Scholar]
  3. Brun, L.; Didelot, F.; Parisi, L. Effects of apple cultivar susceptibility to Venturia inaequalis on scab epidemics in apple orchards. Crop Prot. 2008, 27, 1009–1019. [Google Scholar] [CrossRef]
  4. Zarco-Tejada, P.J.; Miller, J.R.; Mohammed, G.H.; Noland, T.L.; Sampson, P.H. Chlorophyll fluorescence effects on vegetation apparent reflectance: II. Laboratory and airborne canopy-Level measurements with hyperspectral data. Remote Sens. Environ. 2000, 74, 596–608. [Google Scholar] [CrossRef]
  5. Chaerle, L.; Hagenbeek, D.; De Bruyne, E.; Valcke, R.; Van Der Straeten, D. Thermal and chlorophyll-fluorescence imaging distinguish plant–pathogen interactions at an early stage. Plant Cell Physiol. 2004, 45, 887–896. [Google Scholar] [CrossRef] [PubMed]
  6. Gielen, B.; Vandermeiren, K.; Horemans, N.; D’Haese, D.D.; Serneels, R.; Valcke, R. Clorophyll a fluorescence imaging of ozone-sressed Brassica napus L. plants differing in glucosinolate concentrations. Plant Biol. 2006, 8, 698–705. [Google Scholar] [CrossRef] [PubMed]
  7. Ciscato, M.; Valcke, R. Chlorophyll fluorescence imaging of heavy metal-treated plants. In Photosynthesis: Mechanisms and Effects; Garab, G., Ed.; Kluwer Academic: Dordrecht, The Netherlands, 1998; Volume 4, pp. 2661–2663. [Google Scholar]
  8. Delalieux, S.; van Aardt, J.A.N.; Keulemans, W.; Schrevens, E.; Coppin, P. Detection of biotic stress (Venturia inaequalis) in apple trees using hyperspectral data: Non-parametric statistical approaches and physiological implications. Eur. J. Agron. 2007, 27, 130–143. [Google Scholar] [CrossRef]
  9. Suárez, L.; Zarco-Tejada, P.J.; Sepulcre-Cantó, G.; Pérez-Priego, O.; Millar, J.R.; Jiménez-Muñoz, J.C.; Sobrino, J. Assessing canopy PRI for water stress detection with diurnal airborne imagery. Remote Sens. Environ. 2008, 112, 560–575. [Google Scholar] [CrossRef]
  10. Shi, R.H.; Zhuang, D.F.; Niu, Z. Physical investigation on biochemical prediction using continuum removal. Int. Geosci. Remote Sens. Symp. 2004, 2, 1463–1466. [Google Scholar]
  11. Gausman, H. Plant leaf optical parameters in visible and near-infrared light. Graduate Studies, Texas Tech University, Lubbock, TX, USA, 1985; p. 78. [Google Scholar]
  12. Merzlyak, M.; Gitelson, A.; Chivkunova, A.; Pogosyan, S. Application of reflectance spectroscopy for analysis of higher plant pigments. Russ. J. Plant Physl. 2003, 50, 704–710. [Google Scholar] [CrossRef]
  13. Zarco-Tejada, P.J.; Miller, J.; Morales, A.; Berjon, A.; Agüera, J. Hyperspectral indices and model simulation for chlorophyll estimation in open canopy tree crops. Remote Sens. Environ. 2004, 90, 463–476. [Google Scholar] [CrossRef]
  14. Lichtenthaler, H.K.; Miehe, J.A. Fluorescence imaging as a diagnostic tool for plant stress. Trends Plant Sci. 1997, 2, 316–320. [Google Scholar] [CrossRef]
  15. Lichtenthaler, H.K.; Wenzel, O.; Bushmann, C.; Gitelson, A. Plant stress detection by reflectance and fluorescence. Annals NY Acad. Sci. 1998, 851, 271–285. [Google Scholar] [CrossRef]
  16. Papageorgiou, G.C.; Govindjee, J. Chlorophyll a fluorescence, a signature of photosynthesis. In Advances in Photosynthesis and Respiration; Springer: Dordrecht, The Netherlands, 2004. [Google Scholar]
  17. Maxwell, K.; Johnson, G.N. Chlorophyll fluorescence—a practical guide. J. Exp. Bot. 2000, 51, 659–668. [Google Scholar] [CrossRef] [PubMed]
  18. Flexas, J.; Briantais, J.M.; Cerovic, Z.; Medrano, H.; Moya, I. Steady-state and maximum chlorophyll fluorescence responses to water stress in grapevine leaves: a new remote sensing system. Remote Sens. Environ. 2000, 73, 283–297. [Google Scholar] [CrossRef]
  19. Genty, B.; Briantais, J.M.; Baker, N.R. The relationship between quantum yield of photosynthetic electron transport and quenching of chlorophyll fluorescence. Acta Bioch. Biophys. 1989, 990, 87–92. [Google Scholar] [CrossRef]
  20. Fraser, N.J.; Hashimoto, H.; Richard, C. Carotenoids and bacterial photosynthesis: the story so far. Photosynth. Res. 2001, 70, 249–256. [Google Scholar] [CrossRef] [PubMed]
  21. Dodd, I.C.; Critchley, C.; Woodall, G.S.; Stewart, G.R. Photoinhibition in differently coloured juvenile leaves of Syzygium species. J. Exp. Bot. 1998, 49, 1437–1445. [Google Scholar] [CrossRef]
  22. Mendez, M.; Gwynn, J.D.; Manetas, Y. Enhanced UV-B radiation under field conditions increases anthocyanin and reduces the risk of photoinhibition but does not affect growth in the carnivorous plant Pinguicula vulgaris. New Phytol. 1999, 144, 275–282. [Google Scholar] [CrossRef]
  23. Sims, D.A.; Gamon, J.A. Relationships between leaf pigment content and spectral reflectance across a wide range of species, leaf structures and developmental stages. Remote Sens. Environ. 2002, 81, 337–354. [Google Scholar] [CrossRef]
  24. Chevalier, M.; Lespinasse, Y.; Renaudin, S. A microscopic study of the different classes of symptoms coded by the Vf gene in apple for resistance to scab (Venturia inaequalis). Plant Pathol. 1991, 40, 249–256. [Google Scholar] [CrossRef]
  25. Croxall, H.E.; Gwynne, D.C.; Jenkins, J.E.E. The rapid assessment of apple scab in leaves. Plant Pathol. 1952, 1, 39–41. [Google Scholar] [CrossRef]
  26. Parisi, L.; Lespinasse, Y.; Guillaumès, J.; Krüger, J. A new race of Venturia inaequalis virulent to apples with resistance due to Vf gene. Phytopathology 1993, 83, 533–537. [Google Scholar] [CrossRef]
  27. Kokaly, R.F.; Clark, R.N. Spectroscopic determination of leaf biochemistry using band-depth analysis of absorption features and stepwise multiple linear regression. Remote Sens. Environ. 1999, 67, 267–287. [Google Scholar] [CrossRef]
  28. Kokaly, R.F. Investigating a physical basis for spectroscopic estimates of leaf nitrogen concentration. Remote Sens. Environ. 2001, 75, 153–161. [Google Scholar] [CrossRef]
  29. Delalieux, S.; Somers, B.; Verstraeten, W.W.; van Aardt, J.A.N.; Keulemans, W.; Coppin, P. Hyperspectral indices to diagnose leaf biotic stress of apple plants considering leaf phenology. Int. J. Remote Sens. 2009, 30, 1887–1912. [Google Scholar] [CrossRef]
  30. Gamon, J.A.; Peñuelas, J.; Field, C.B. A narrow-waveband spectral index that tracks diurnal changes in photosynthetic efficiency. Remote Sens. Environ. 1992, 41, 35–44. [Google Scholar] [CrossRef]
  31. Barnes, J.D. A reappraisal of the use of DMSO for the extraction and determination of chlorophylls a and b in lichens and higher plants. Environ. Exp. Bot. 1992, 2, 85–100. [Google Scholar] [CrossRef]
  32. Dobrowsky, S.Z.; Pushnik, J.C.; Zarco-Tejada, P.J.; Ustin, S.L. Simple reflectance indices track heat and water stress-induced changes in steady-state chlorophyll fluorescence at the canopy scale. Remote Sens. Environ. 2005, 97, 403–414. [Google Scholar] [CrossRef]
  33. Blackburn, G.A. Spectral indices for estimating photosynthetic concentrations: a test using senescent tree leaves. Int. J. Remote Sens. 1998, 19, 657–675. [Google Scholar] [CrossRef]
  34. Baker, N.R.; Rosenqvist, E. Applications of chlorophyll fluorescence can improve crop production strategies: an examination of future possibilities. J. Exp. Bot. 2004, 55, 1607–1621. [Google Scholar] [CrossRef] [PubMed]
  35. Takahashi, T.; Yasuoka, Y.; Fujii, T. Hyperspectral remote sensing of riparian vegetation and leaf chemistry contents. In 23rd Asian Conference on Remote Sensing 2003; Kathmandu, Nepal.
  36. Kumar, L.; Schmidt, K.S.; Dury, S.; Skidmore, A.K. Imaging spectrometry and vegetation science. In Imaging Spectrometry; van de Meer, F., de Jong, S.M., Eds.; Kluwer Academic: Dordrecht, The Netherlands, 2001. [Google Scholar]
  37. Jacquemoud, S.; Ustin, S.L.; Verdebout, J.; Schmuck, G.; Andreoli, G.; Hosgood, B. Estimating leaf biochemistry using the PROSPECT leaf optical properties model. Remote Sens. Environ. 1996, 56, 194–202. [Google Scholar] [CrossRef]
  38. Win, J.; Greenwood, D.R.; Plummer, K.M. Characterisation of a protein from Venturia inaequalis that induces necrosis in Malus carrying the Vm resistance gene. Physiol. Mol. Plant P. 2003, 62, 193–202. [Google Scholar] [CrossRef]
  39. Gamon, J.A.; Serrano, L.; Surfus, J.S. The photochemical reflectance index: an optical indicator of photosynthetic radiation use efficiency across species, functional types, and nutrient levels. Oecologia 1997, 112, 492–501. [Google Scholar] [CrossRef]
  40. Peñuelas, J.; Filella, I.; Gamon, J.A. Assessment of photosynthetic radiation-use efficiency with spectral reflectance. New Phytol. 1995, 131, 291–296. [Google Scholar] [CrossRef]
  41. Peñuelas, J.; Llusia, J.; Pinol, J.; Filella, I. Photochemical reflectance index and leaf photosynthetic radiation-use-efficiency assessment in Mediterranean trees. Int. J. Remote Sens. 1997, 18, 2863–2868. [Google Scholar] [CrossRef]
  42. Sun, P.; Grignetti, A.; Liu, S.; Casaccia, R.; Salvatori, R.; Pietrini, F.; Loreto, F.; Centritto, M. Associated changes in physiological parameters and spectral reflectance indices in omiv (Olea europea L.) leaves in response to different levels of water stress. Int. J. Remote Sens. 2008, 29, 1725–1743. [Google Scholar] [CrossRef]
  43. Penuelas, J.; Filella, I.; Lloret, P.; Munoz, F.; Vilajeliu, M. Reflectance assessment of mite effects on apple-trees. Int. J. Remote Sens. 1995, 16, 2727–2733. [Google Scholar] [CrossRef]
  44. Lorenzen, B.; Jensen, A. Changes in leaf spectral properties induced in barley by cereal powdery mildew. Remote Sens. Environ. 1989, 27, 201–209. [Google Scholar]
  45. Ahern, F.J. The effects of bark beetle stress on the foliar spectral reflectance of lodgepole pine. Int. J. Remote Sens. 1988, 9, 1451–1468. [Google Scholar] [CrossRef]

