Article

Remote Sensing and Spectral Characteristics of Desert Sand from Qatar Peninsula, Arabian/Persian Gulf

1
Department of Chemistry & Earth Sciences, Qatar University, P O Box 2713, Doha, Qatar
2
Environmental Science Program, College of Arts and Science, The University of Texas of the Permian Basin, 4901 East University, Odessa, TX 79762, USA
*
Author to whom correspondence should be addressed.
Remote Sens. 2009, 1(4), 915-933; https://doi.org/10.3390/rs1040915
Submission received: 3 August 2009 / Revised: 27 September 2009 / Accepted: 28 October 2009 / Published: 11 November 2009

Abstract

:
Remote sensing data can provide valuable information about the surface expression of regional geomorphologic and geological features of arid regions. In the present study, several processing techniques were applied to reveal such in the Qatar Peninsula. Those included preprocessing for radiometric and geometric correction, various enhancement methods, classification, accuracy assessment, contrast stretching, color composition, and principal component analyses. Those were coupled with field groundtruthing and lab analyses. Field groundtruthing included one hundred and forty measurements of spectral reflectance for various sediment exposures representing main sand types in the four studied parts in Qatar. Lab investigations included grain size analysis, X-ray diffraction and laboratory measurements of spectral reflectance. During the course of this study three sand types have been identified: (i) sabkha-derived salt-rich, quartz sand, and (ii) beach-derived calcareous sand and (iii) aeolian dune quartz. Those areas are spectrally distinct in the VNIR, suggesting that VNIR spectral data can be used to discriminate them. The study found that the main limitation of the ground spectral reflectance study is the difficulty of covering large areas. The study also found that ground and laboratory spectral radiance are generally higher in reflectance than those of Landsat TM. This is due to several factors such as atmospheric conditions, the low altitude or different scales. Whereas for areas with huge size of dune sand, the Landsat TM spectral has higher reflectance than those from field and laboratory. The study observed that there is a good correspondence or correlation of the wavelengths maximum sensitivity between the three spectral measurements i.e lab, field and space-borne measurements.

1. Introduction

The state of Qatar, as a developing country with a growing population and its large oil and gas reservoirs, is facing an important need for wise and more efficient management aspects of its land, water and other natural resources. Little information is available about the morphology, type, and mineralogy of the major sand fields in Qatar. However, information on sand dune fields is needed because such dunes are often a host for economic minerals, and others have adverse environmental impacts since they threaten buildings and the emerging agricultural sector. To this end, the present study employed remote sensing data and field surveys to examine the distribution, type and mineralogy of sand fields and Quaternary cover in Qatar. The study area of focus is situated halfway along the west coast of the Arabian Gulf, between latitudes 24°40´ and 26°10´ north and longitude 50°45´ and 51°40´ east (Figure 1). It has an area of some 11,500 km². The surface of the study area is low to moderate relief with a slightly undulating surface and several scattered depressions. Most of the depressions are filled with aeolian sand deposits. The central part is formed by a plateau covered with limestone and colluvial soils. Calcareous beach sands are principally along the present coast-line, but they also occur at the edge of or within the scattered sabkha in the study area whose outlining areas were previously covered by the Quaternary Sea.
The study area is one of the driest regions on the earth, with aridity capable of evaporating 200 times the amount of precipitation received. In summer, it is very hot and the maximum daily average temperature in August reaches 45 °C. The minimum is 25 °C and the mean 37 °C. The winter in the study area is mild, with an average minimum temperature in January of 7 °C and average maximum of 26 °C; and the mean temperature is 15 °C. Winds during the winter, directed mainly towards the south-east, and can reach 50–100 km per hour. These winds create waves and surface currents and carry some terrigenous material into the marine sediment. The present research determined the sand types, its mineralogy and relations to regional surficial geology of the Quaternary, using Landsat images, spectral analysis, grain size analyses and X-ray diffraction techniques. This information is much needed to evaluate the economic potentials of sand deposits, as well as manage sand dune migration and airborne dust storms.
Figure 1. Locator map of Qatar and surrounding countries.
Remotesensing 01 00915 g001

2. Methodology

The study used Landsat-5 TM imagery of February, 1987 and June 1990 in conjunction with topographic maps 1:200,000, (one sheet); 1:100,000 (four sheets) and 1:50,000 (15 sheets), together with several geologic maps 1:100,000. All the images were corrected and classified using standard techniques described by [1,2,3].
Digital image processing has been carried out using both ERDAS 8.5 and IDRISI 401 software. A set of preprocessing techniques is concerned with the several of data errors and unwanted or distracting element of the image has been applied. Radiometric correction were carried at the Remote Sensing Center of the Earth Research Institute of Michigan, Ann Arbor, MI, USA, the correction of some scenes, northern part, was carried at the National Remote Sensing Center, Farnborough, Hamphsire, UK. A total of 60 ground control points, a specific pixel in the image data for which UTM coordinates were obtained from topographic maps were selected from the Landsat data and used to create first order transformation matrix for rectification activities. The nearest neighbor re-sampling procedure was also used [4,5]. Various image enhancement and displaying activities were also followed [6,7]. The Optimum Index Factor (OIF) which is one such criterion to produce the best Thematic Mapper (TM) color composite image for detailed geological visual interpretation was applied to the images of the study area [8,9]. Principal component analysis, ratio transformations, supervised and unsupervised classifications were also conduced [10,11]. Assessment of classification accuracy was conducted using the Kappa Coefficient [12]. An increasing number of studies have utilized the Kappa Coefficient of agreement as a measure of classification activity [13]. The field and Laboratory reflectance values have been processed to simulate the response in Thematic Mapper band using Batch processing program [14].
Field campaigns and groundtruthing activities included spectral reflectance measurements, samples analyses using mechanical and chemical analyses as well as X-ray diffraction and grain size analyses. Both field and laboratory spectral measurements were taken using single Field of View Infrared Intelligent Spectroradiometer (S FOV, IRIS) of the Geophysical and Environmental Research Corporation (GER). This instrument, cover 0.3 to 3.0 µm range in approximately 1,000 spectral bands, with a resolution between 1.5 and 5 nm. Ninety measurements were carried out randomly on the different surfical exposures representing the main sand types in Qatar. Forty measurements were recorded in west Qatar; twenty three of the samples were sand. Thirty measurements were made in the north and northeast areas. Nineteen measurements were on calcareous beach-derived sand. Twenty measurements were made in the southeast, eleven samples were dune sand. Portion of the samples were analyses for grain size and with XRD: 2θ, 3°–17°; X-ray radiation, Cu Kα; generator current, 30 mA; generator voltage, 30 kV; scanning speed, 0.05 cm/min. Grain size was conducted on 53 random samples from all four areas.

3. Results and Discussion

3.1. Areas of Interest and Principal Component Analyses (PCA)

The study concentrated on four different areas, where major sand types and Quaternary geological features are observed from Landsat data. These areas are represented on the natural color composites mosaic of Qatar Peninsula. These include the western side or Gulf of Salwa, the Northern tip, the Northern coast and the Southeastern coast (Figure 2A1). Figure 2A2 shows a rectified Landsat sub-scene of west side Qatar Peninsula with a grid superimposed of the image. Figure 2A3 shows the surface sand deposits in the tail of Dukhan sabkha, west of Qatar Peninsula which has a reddish color with some bluish color in the upper of those sand accumulations due to salt content. Patches of pink color in the plate represent sheets of blown sand distribution.
Table 1 gives example results of the Principal Component Analyses for west Qatar. The first three composites, which often account for more than 99.5% of scour value, are the eigen values which represent the amount of data value contained in each Principal Component (PC). An example of PCA image is the sabkha deposit, which is divided into two colors due to moisture content, the dry part showing as dark green color mixed with some blue and wet part represented as dark blue color due to highly moisture content. The salt crust has a blue color in the upper right part of the inland Dukhan sabkha, the main land which represents the Rus Formation in light green to green color. Sea water has black color due to very low reflectance. However, because each new output image is a linear addition combination of all the input channels, the individual images or color composites often are not interpretable in terms of a sensed phenomenon. Therefore this method, i.e PCA, is best used as a tool for distinguishing between rather than identifying geology. These PC color composite images are very valuable to outline the contrast between different units. They also minimize the influence of shadows and other albedo variations.
Table 1. Results of principal component analysis of west Qatar Peninsula.
Variance-Covariance
Matrix
PC1PC2PC3PC4
1507.94
2291.18
3365.5277.83
4301.48232.7
5251.6223.3526.06
767.025.51377.16447.49
Correlation
11
20.99
30.981
40.960.99
50.440.351
70.730.710.881
Eigenvalues2566.139.172.20.8
Percent Variance74.221.130.060.02
Cumulative Percent Variance74.2299.5299.98100
Eigenvectors0.32–0.070.27–0.19
0.230.1–0.380.83
0.320.28–0.570.5
0.320.240.670.12
0.68–0.66–0.05–0.01
0.430.640.030.01
The detailed descriptions of the four distinctive areas that have been characterized by the present work are:
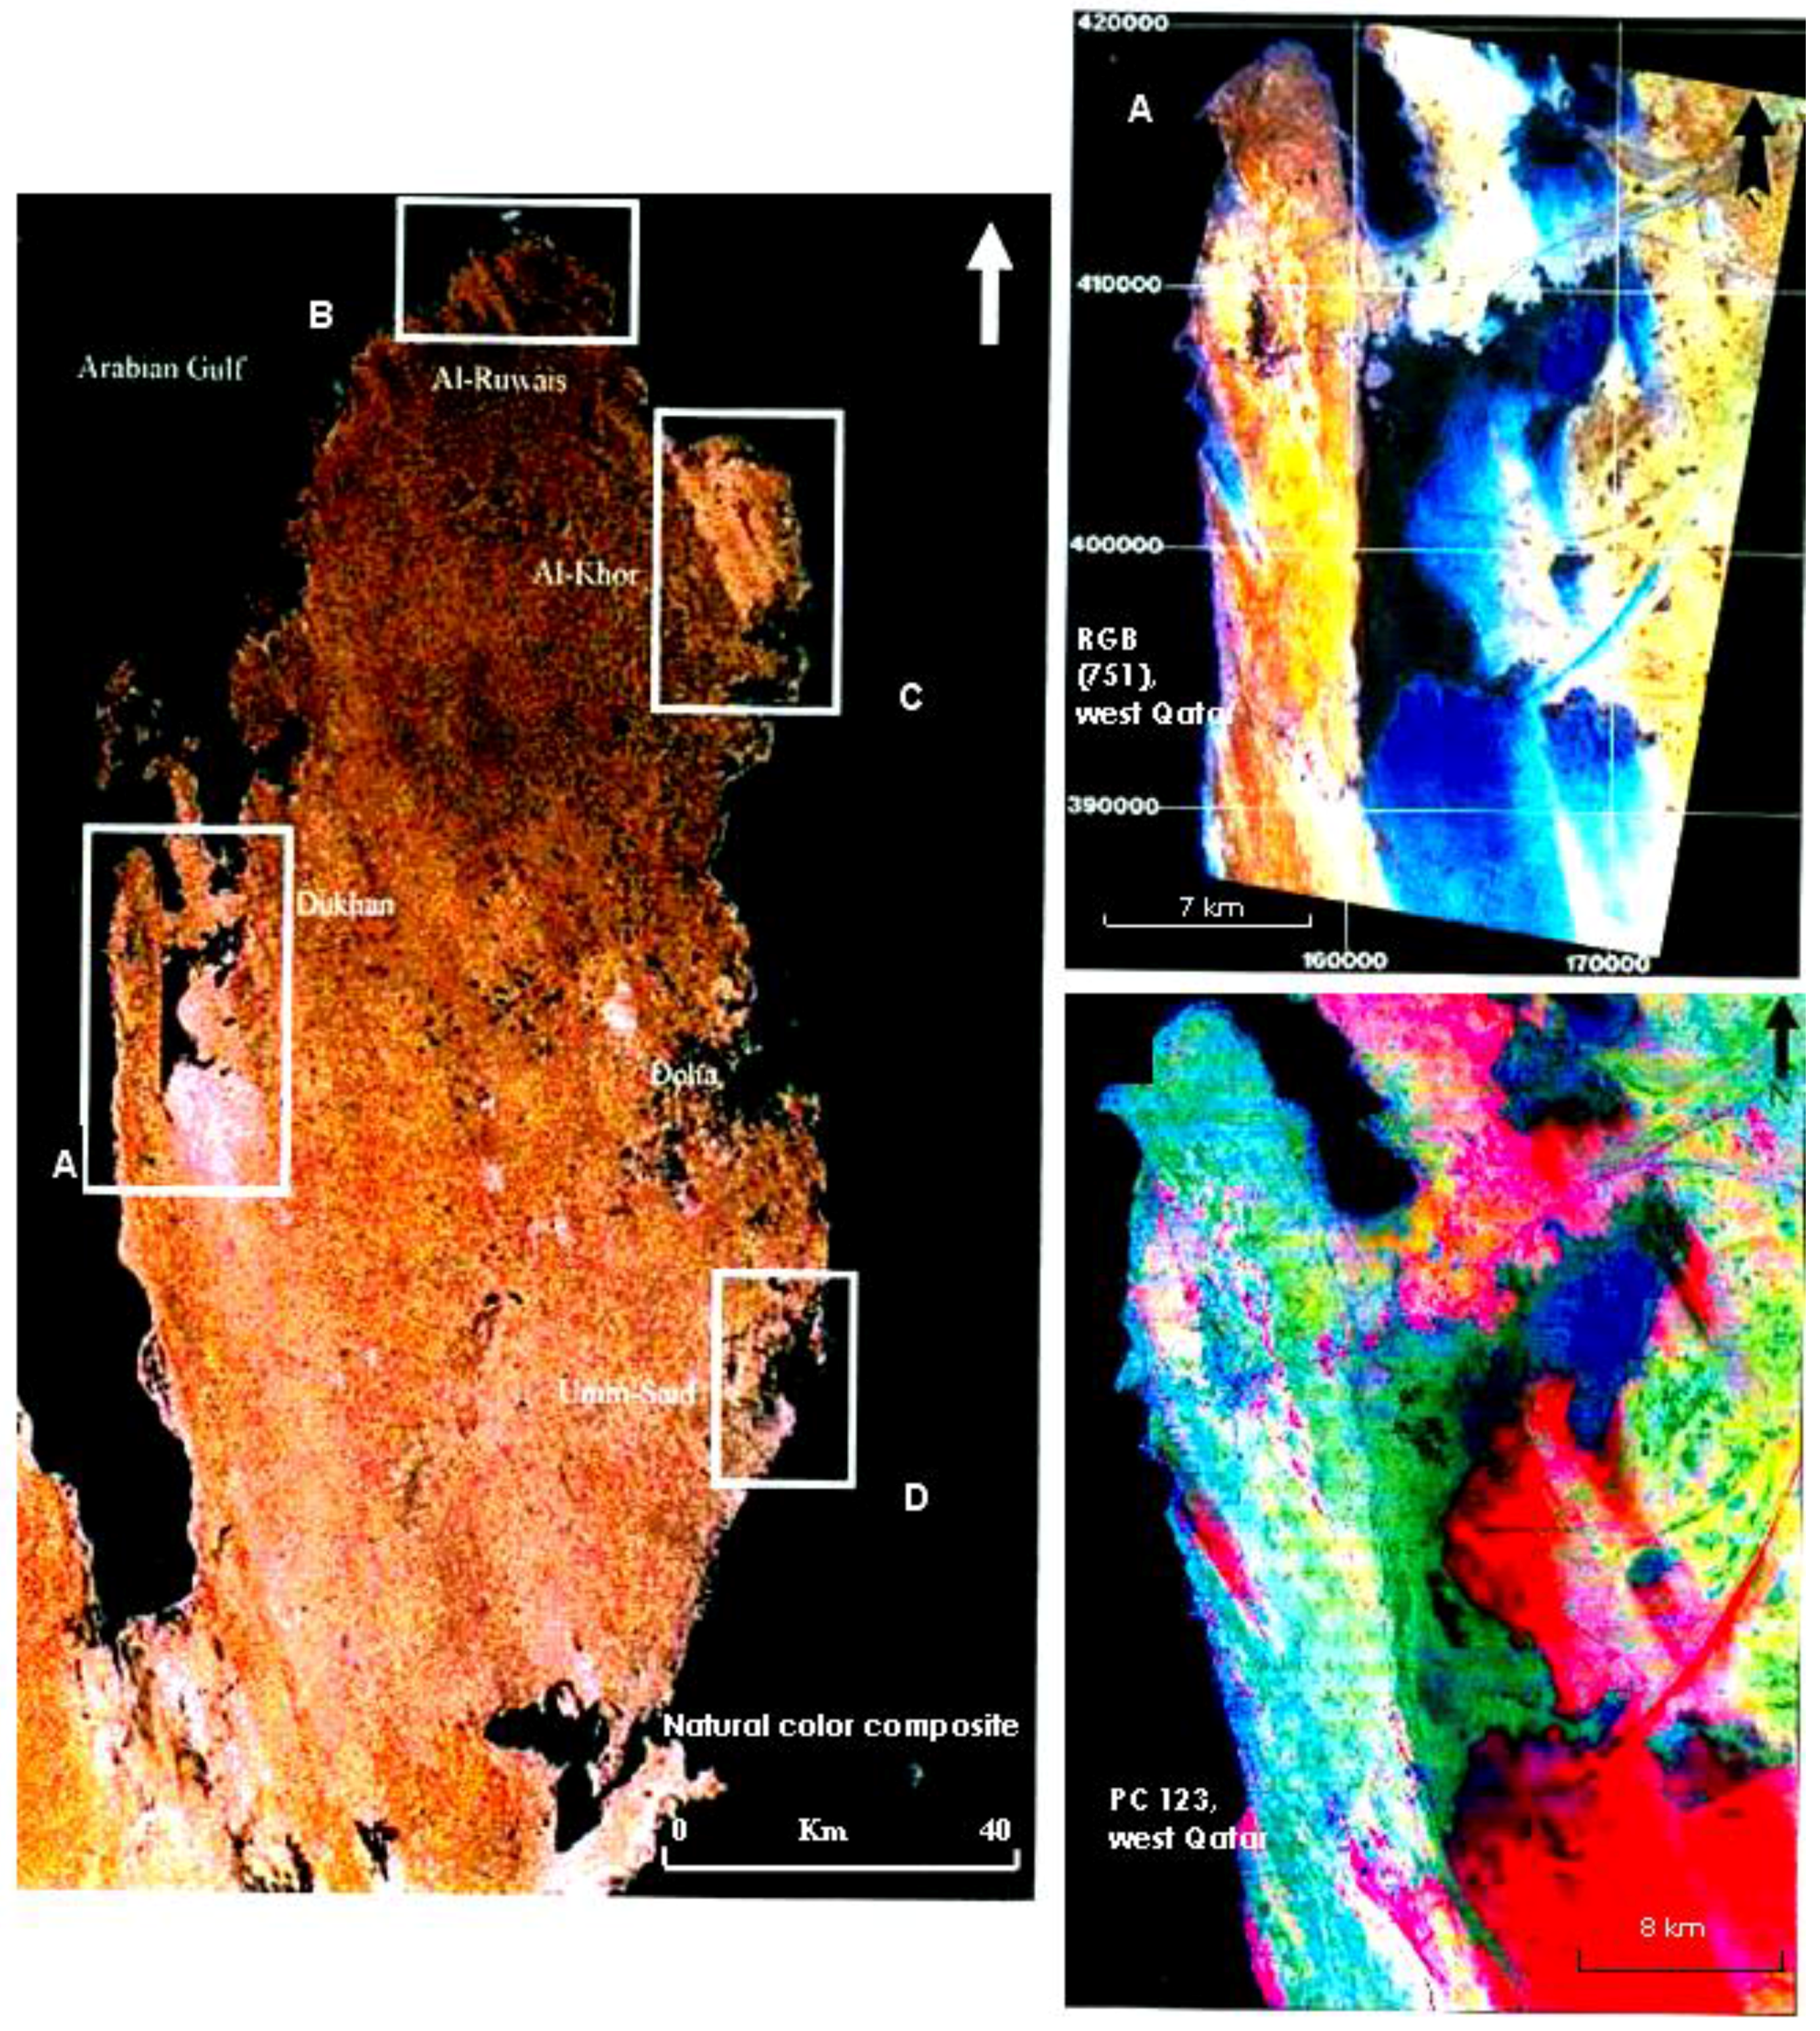
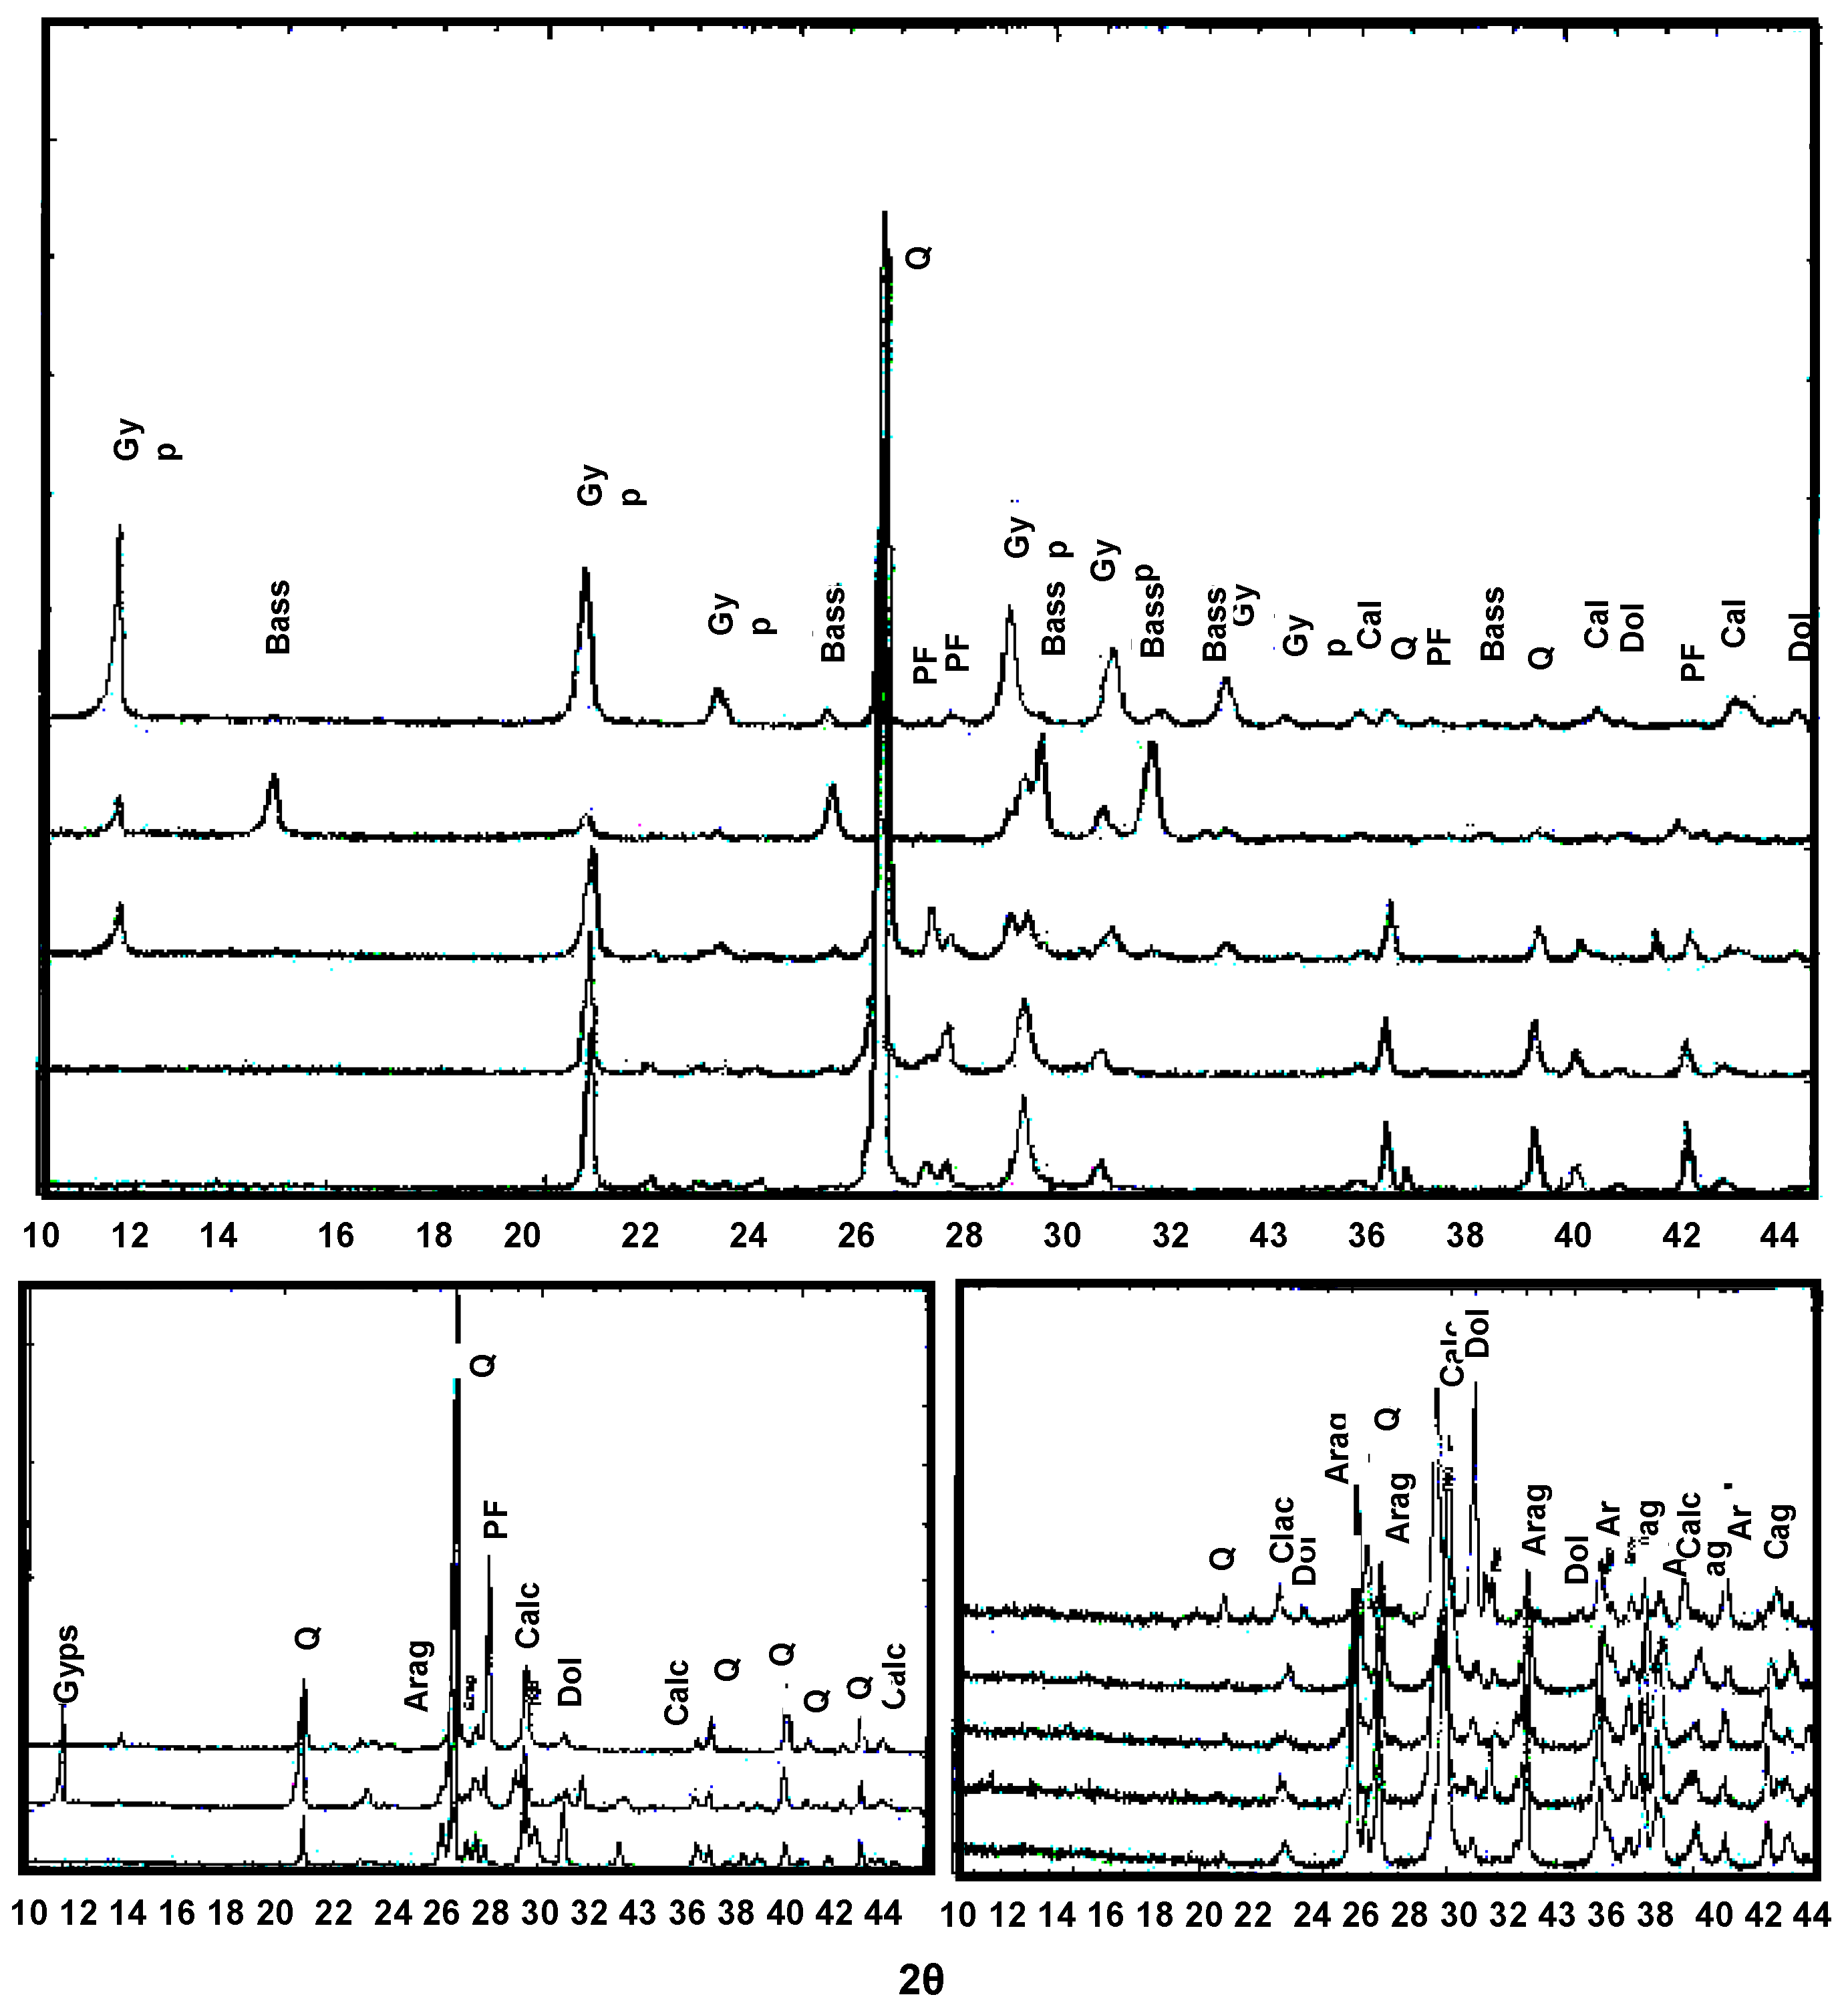
  • Western part or Gulf of Salwa, the false color TM 751 (RGB) (Figure 2A2) shows the occurrence of sabkha-derive, salt-rich quartz sand in the tail of Dukhan sabkha. The sabkha itself has a brown to dark brown color in image due to high moisture content. The salt-rich sand is shown in two different colors, the proximal part which is close to the sabkha has a blue color and the lower part has a cyan color. This is mainly due to difference of the sand thickness and mineral content. In contrast, the PC 123 composite image (Figure 2A3) shows the developed featureless surface of wind-blown sabkha-derived salt-rich sand in two different colors. The area close to the sabkha has a blue color whereas further away the color changes to red. This due to variations of the sand thickness and mineral content. The basis for this conclusion is XRD results, which shows some gypsiferous sand in western samples as will be described in details in the last section of this work.
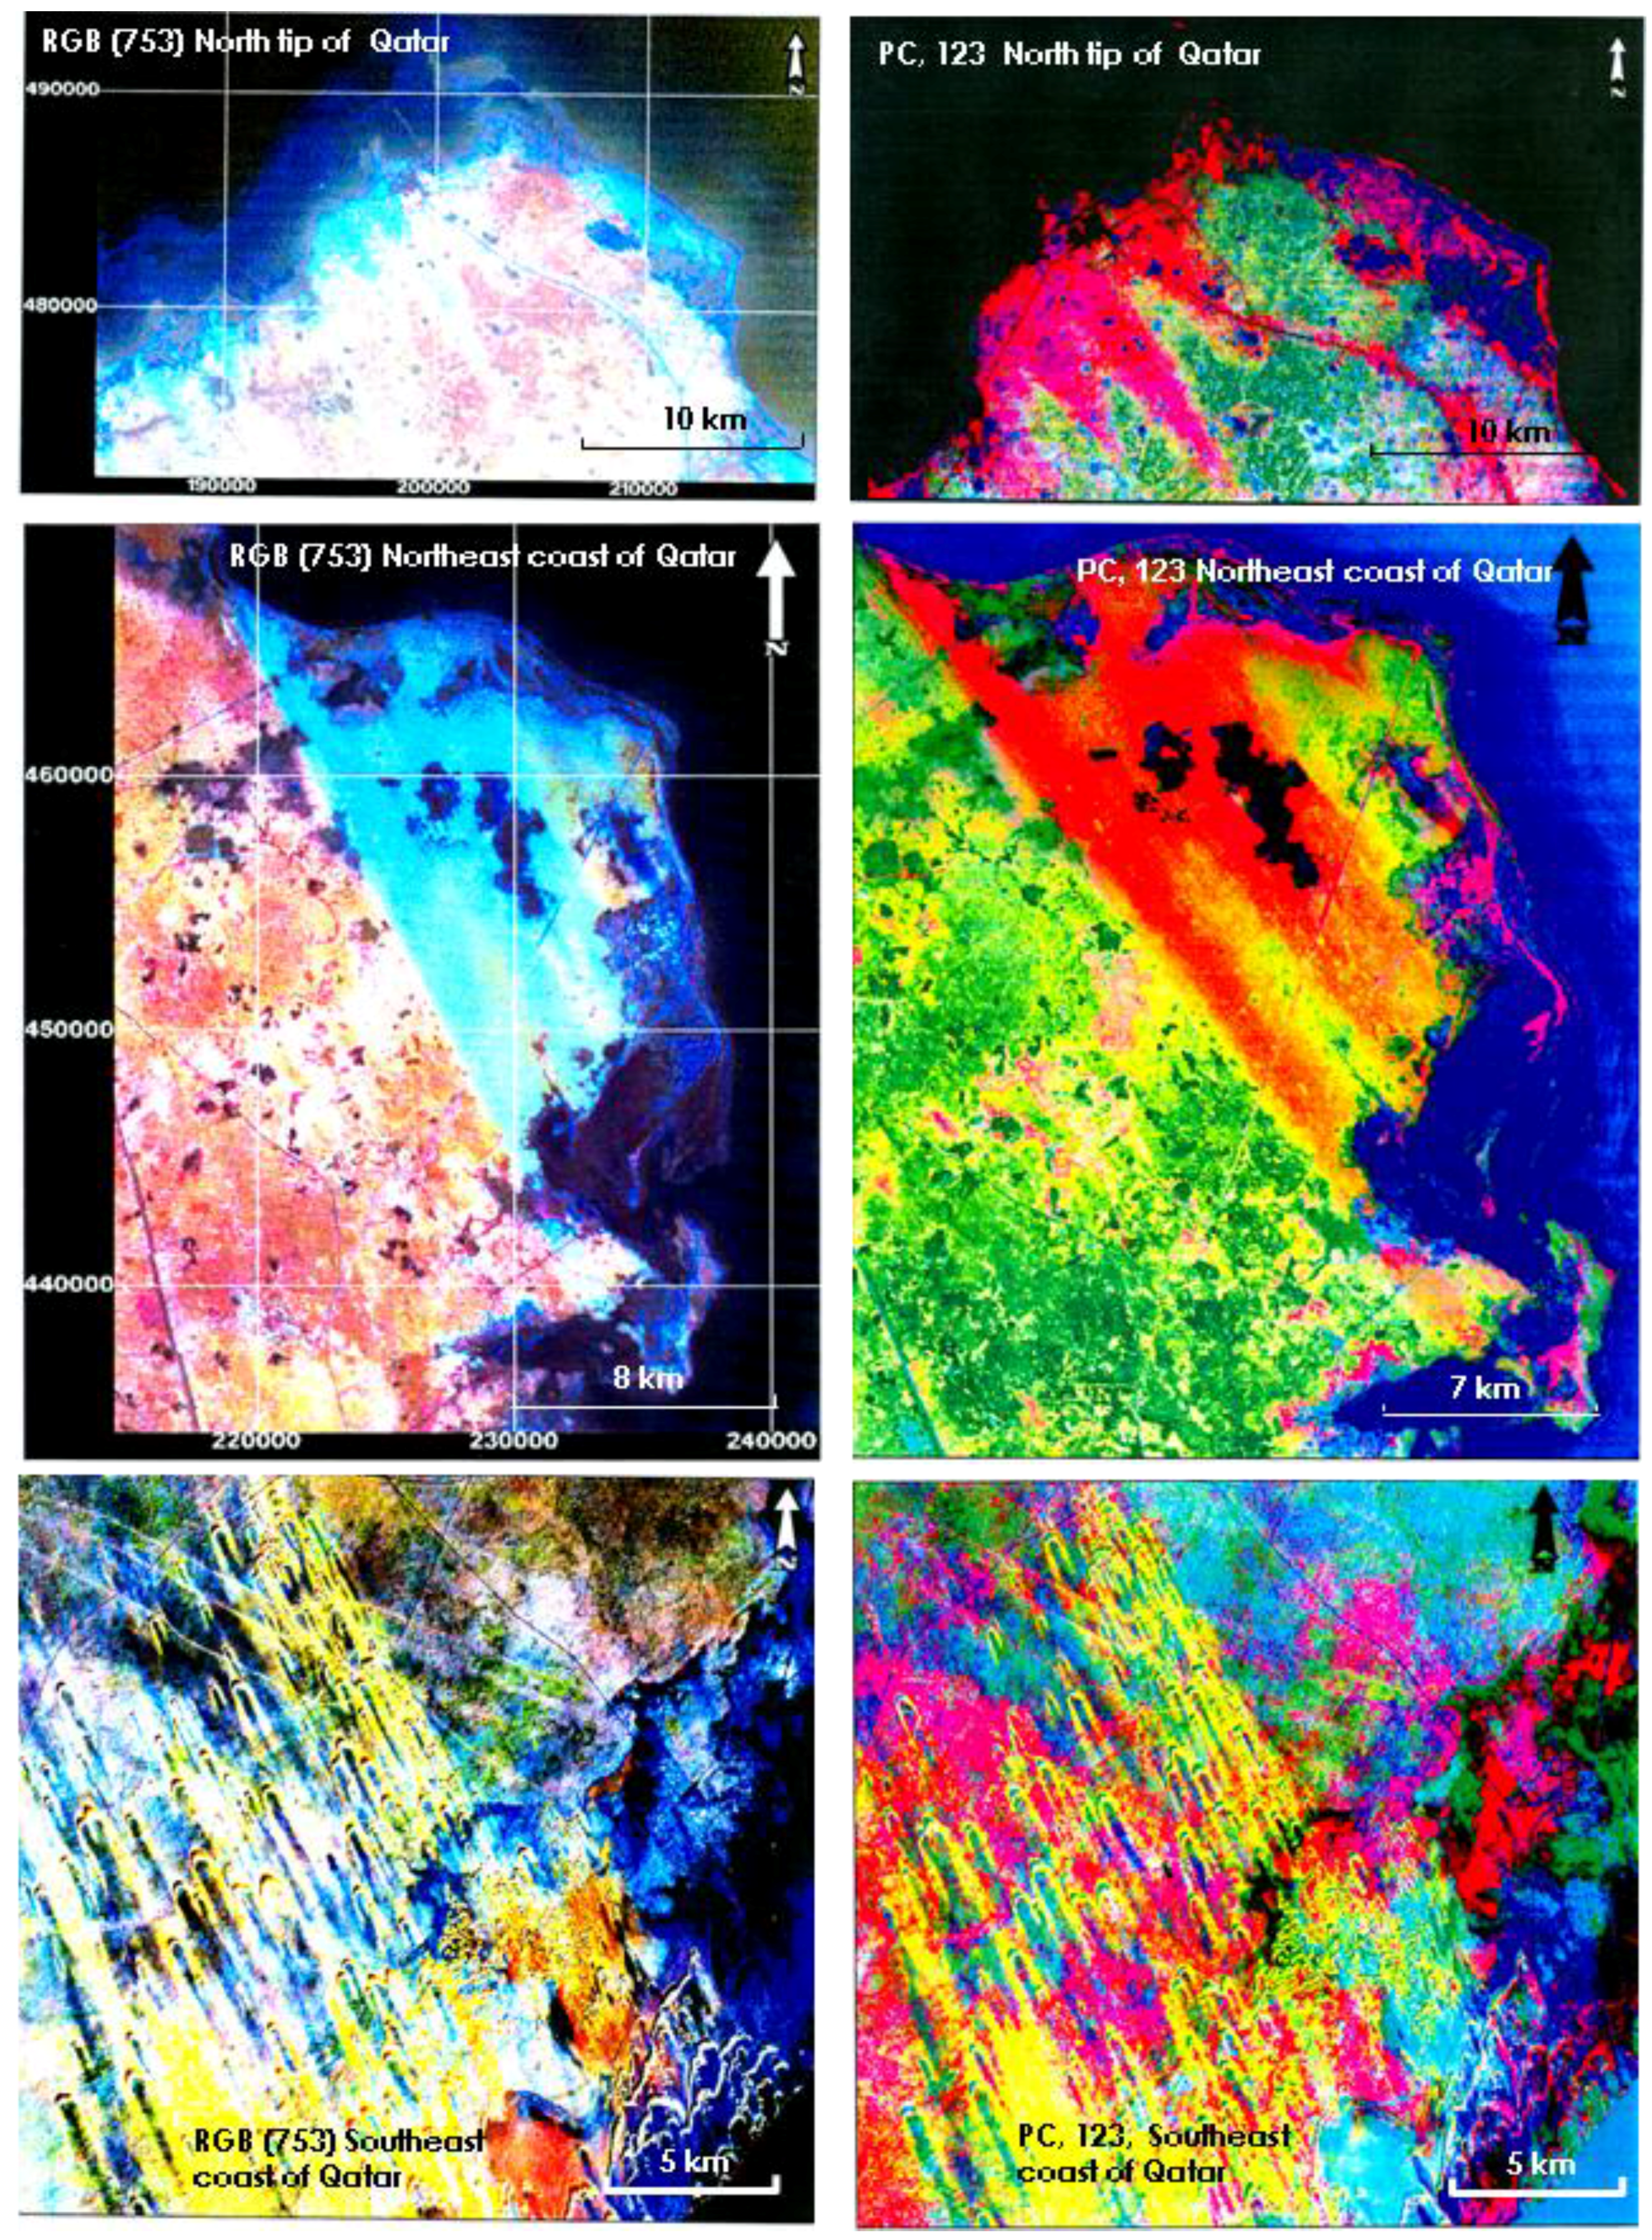
  • Northeast coast, the area is covered with widespread wind-blown sand which appears as a long strip along the northeastern part of the subscenes. This beach-derived, calcareous sand appear in Landsat TM false color 753 composite images as of blue to cyan color (Figure 3). The sand accumulation in the PC 123 composite image appears in two bright colors. The northern part of the sand accumulation appears in pinkish color, while the southern part of the same sand has an orange color. These different colors are related to sand accumulation.
  • Northern Tip, this area represent the largest surface depression in Qatar Peninsula and is low-laying with an average heights of about 14 m. The depression, which is filled with windblown sand and fine-washed soil, appears in dark purple to black as a result of the presence of some permanent vegetation (Figure 3). The false color 753 band combination shows the V-Shape sheets of beach-derived calcareous sands in a white color. The Simsima member dolomite and limestone of Middle Eocene age appears in green to gray color. Coral reefs in the shallow water appear in dark blue color and deep water in black. Beach sand surrounding the coast has a cyan color due to the high reflectance in visible band.
  • Southeast Coast, this area has the largest coastal sabkha deposit in Qatar and is the main location for the sand dune fields which believed that is originated from the Arabian shield. The false color 752 composite images, which contain visible, near infrared and mid infrared band (Figure 3) shows the main features in the area including the sand dunes, sabkha deposits that form most of the land cover in the sub-scenes. Barchan shaped sand dunes and sand sheets have yellow colors. Sabkha cover by water are black, while those partly covered with water appears in a navy blue color. Partly dry sabkha appears in a cyan color. Sabkha mixed with sand dunes appear in red color. Aeolian sands occur in the form of mobile thin sheets, small hummock dunes, barchans dunes and large dune fields. The prevailing wind, Al-Shamal wind, plays a major role in Qatar and blown from the north-northwest. Changes in mineralogy, grain size, texture, moisture content and other physical and chemical properties of various types of sands, in the almost-flat desert terrain of Qatar Peninsula, is often expressed in the spectral characteristics in the visible as well as near and mid-infrared part of the spectrum.
Figure 2. Natural color image of Qatar as well as RGB and PC images of the western part of the study area.
Remotesensing 01 00915 g002
Figure 3. RGB and PC images of the north’ tip, northeast coast and southeast coast of Qatar.
Remotesensing 01 00915 g003

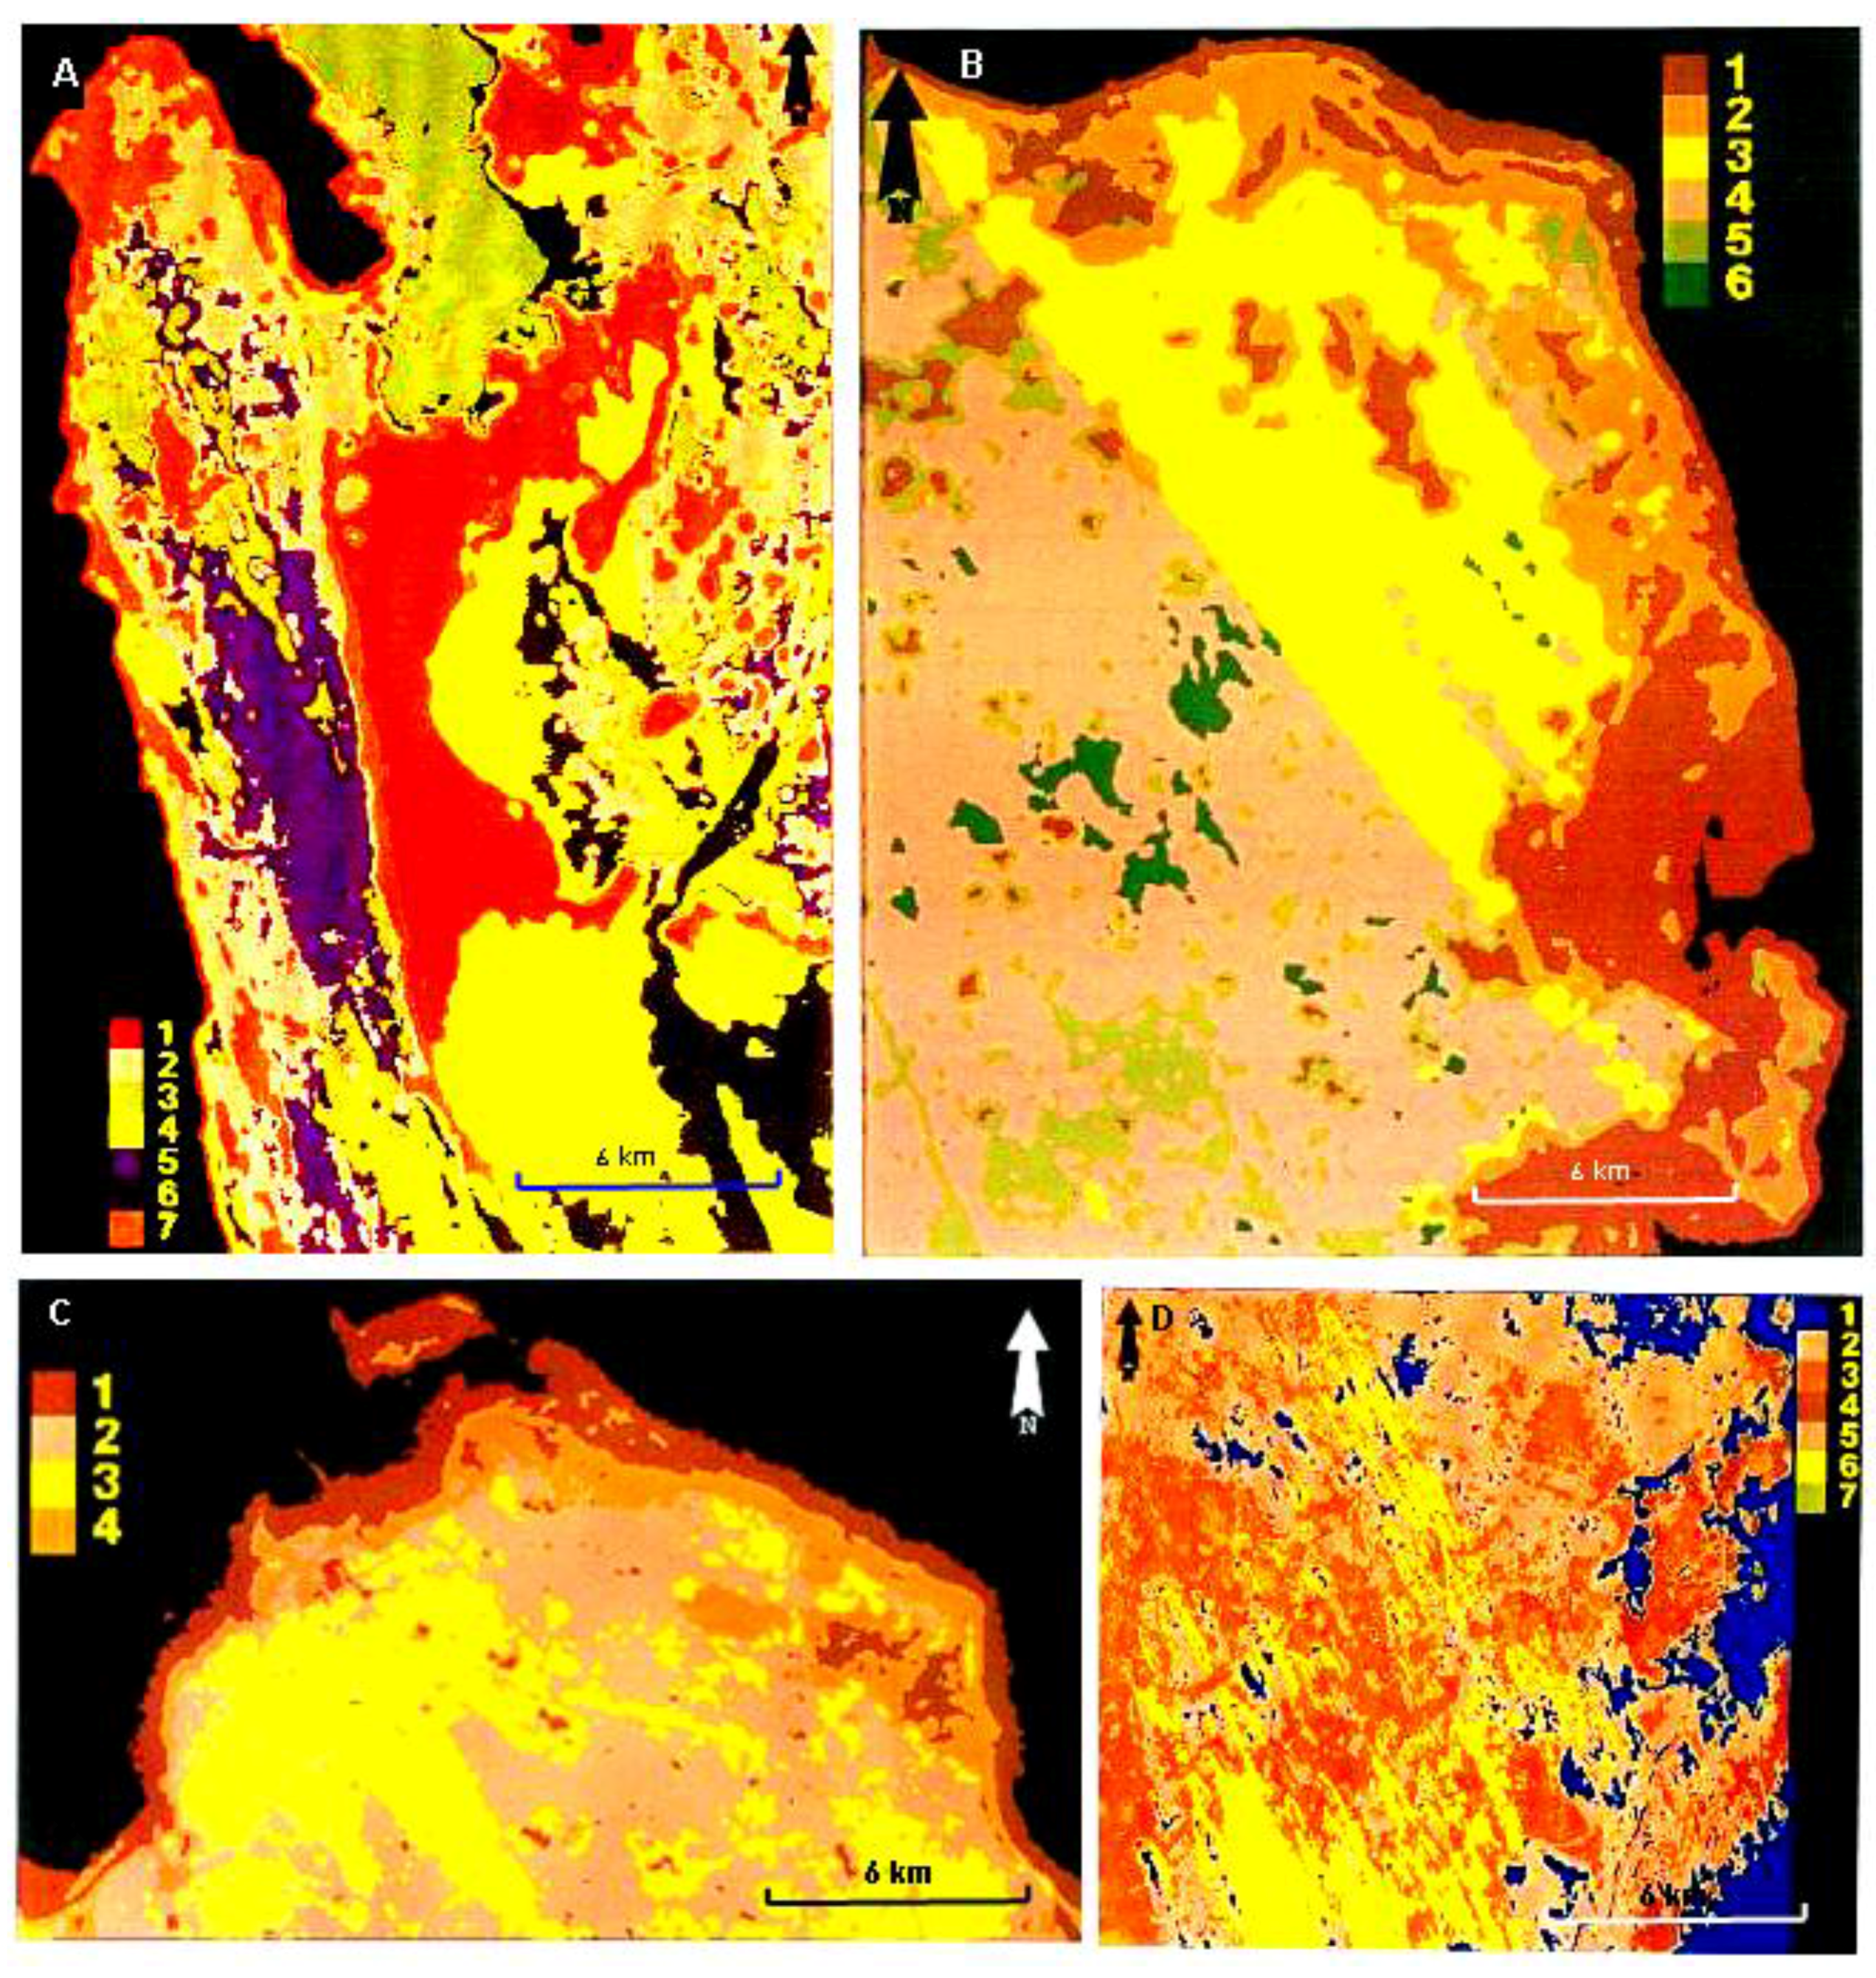
3.2. Image Classification

Classified maps of the studied areas in Qatar Peninsula with various cluster numbers are shown in Figure 4. A maximum number of seven clusters or classes has been assigned for the various surface cover types within the area which includes the inland sabkha, the upper and lower Dammam and Rus Formation, the coastal sabkha, sabkha-derived salt-rich quartz sand with gypsum and chert pebbles with quartz sand. Groundtruthing indicated that misclassification picked up the coastal sand and coastal sabkha as one class (Figure 4).
Figure 4. Unsupervised classification of: (a) west Qatar (1. Inland sabkha, 2. Upper Dammam Fm., 3. Rus Fm., 4. Salty sand, 5. Lower Dammam Fm.,6. Cherty sand and 7. Coastal sabkha ) (b) north east coast (1. Coastal sabkha, 2. Beach sand mixed with sabkha, 3. Blown beach sand, 4. Upper Dammam Fm, 5. Depression sand and Rodah soil and 6. Rus Fm.), (c) north tip (1. Beach-derived sand mixed with sabkha, 2. Uppper Dammam Fm., 3. Blown sand, and 4. Coastal Sabkha) and (d) southeast of Qatar Peninsula (Coastal sabkha cover with water, 2. Upper Dammam Formation, 3. Dry sabkha, 4. Beach-derived sand, 5. Sabkha deposit mixed with dune sand, 6. Sand dune, and 7. Exposed sedimentary outcrop).
Remotesensing 01 00915 g004
The spectral values in each non-thermal TM bands and nearest interpretation are given in Table 2. The northeast coast with its unique linear shape of blown sand sheet appears clearly in Figure 2. This figure represents the classification output results, which assigned six clusters to show the main cover types. The main feature bounders between surface cover types have been picked up. Table 2 shows each spectral value in each TM bands and nearest interpretations. The liner blown sand sheets appear in yellow color, the beach-derived sand has a calcareous orange color, these are mainly located along the coastal line mixed with some sabkha deposits. Coastal sabkha without subdivision has been categorized as one class of a brown color. The Rus Formation is shown clearly in the center of classified map on the edge of the blown sand sheet. There is a depression which is mainly filled with some fine grained silts and sand, commonly calcareous which is known as Rodah soil. These deposits are of considerable importance since they form the main of irrigatable soil in Qatar which appears in small semi-circle or irregular shaped areas which are scattered in the northern part of Qatar Peninsula and have an olive color.
Table 2. Class descriptions and mean spectral values of each class within non-thermal Landast TM bands of west, northeast, north tip and southeast of Qatar Peninsula.
Mean Spectral Value, West
ClassB1B3B5B7ColorDescription
1152 ± 6.799 ± 5133 ± 1061 ± 10BrownLand sabkha
2183 ± 7148 ± 5233 ± 7129 ± 5OchreUpper Dammam Formation
3187 ± 5147 ± 5230 ± 7132 ± 4GreenRus Formation
422 5± 4172 ± 2199 ± 470 ± 3YellowSabkha Derived Sand
5168 ± 6142 ± 4233 ± 6137 ± 4MagentaLower Dammam Fr.
6205 ± 3 153 ± 3228 ± 493 ± 4OliveReg of Cherty Sand
7164 ± 8123 ± 8184 ± 1093 ± 10OrangeCoastal Sabkha
Mean Spectral Value, Northeast
ClassB1B3B5B7ColorDescription
1151 ± 5107 ± 6.6117 ± 1042 ± 6.6BrownCoastal Sabkha
2176 ± 2.5143 ± 2231 ± 3112 ± 2.8OrangeBeach-Derived Sand
3193 ± 3.5157 ± 2.5234 ± 3.6107 ± 2.7YellowBlown Sand Sheet
4173 ± 2.3140 ± 2230 ± 3.4127 ± 2OrchreLower Dammam Formation
5163 ± 3133 ± 3221 ± 4121 ± 3.6OliveDepression
6157 ± 8152 ± 7240 ± 8133 ± 4.8GreenRus Formation
Mean Spectral Value, North
ClassB1B3B5B7ColorDescription
1199 ± 6130 ± 5.6205 ± 193 ± 1BrownBeach-Derived Sand
2160 ± 2129 ± 2214 ± 2.5125 ± 1.8OrchreDammam Formation
3173 ± 3.4141 ± 2.4225 ± 2.9119 ± 2.9YellowBlown Sand Sheet
4145 ± 4111 ± 5139 ± 1052 ± 7OrangeCoastal Sabkha
Mean Spectral Value, Southeast
ClassB1B3B5B7ColorDescription
1139 ± 10103 ± 10131 ± 768 ± 5BlueCoastal Sabkha
2168 ± 3.9137 ± 3.4182 ± 3.9105 ± 3.2OchreUpper Dammam Formation
3183 ± 5148 ± 3.9194 ± 4.9110 ± 4OrangeDry Sabkha
4211 ± 5.4155 ± 10167 ± 4.976 ± 8.9BrownSabkha-Derived Sand
5186 ± 7141 ± 5.9171 ± 1089 ± 9BeigeSabkha Mixed with Dune Sand
6157 ± 4147 ± 3206 ± 3.7129 ± 2.9YellowDune Sand
7179 ± 3.5151 ± 2.8200 ± 3118 ± 2.5GreenExposed Sedimentary Outcrop
Table 3. The result of the producer and user accuracy of classified classes in the Western Qatar Peninsula.
ClassProducer Accuracy %
196
283
382
491
587
676
757
The northeast coast of Qatar has six classes that have been identified clearly from the classification results, such as beach sand, sabkhas and main land. From table 4, the sum of major diagonal is 155 and the overall accuracy is 155/198 × 100% = 78% and the Kappa result is 0.72. The northern tip of Qatar has four clusters that have been selected due to less complex area with only four categories representing the main deposits in the northern part of Qatar. There mainly dolomite and limestone which represent the upper Dammam Formation of Middle Eocene age, and the superficial deposits of blown sand, beach and sabkha deposits. From table 4 the overall accuracy for the north part is 75.2% while the Kappa is 0.63. The southeast coast was the fourth study area, here seven classes have been identified from the classification results such as dune sand, coastal sabkha and bedrock of unknown type. The overall accuracy for the southeast coast is 76% while the Kappa is 0.69.
Table 4. An error matrix showing row, column and grand total, for the studied area in the northern tip of Qatar Peninsula.
Classification DataCoastal SabkhaRus FormationLower Dammam FormationReg. of Chert Pebbles with SandInland SabkhaRow Total
130005054
217512099
315343064
42302162
521360040
612026033
735001148
Col. Total6164413452400
Classification DataCoastal SabkhaBlown SandRodah SoilRus FormationInland SabkhaRow Total
129020038
24110026
313400039
405112072
500150019
6000304
Col. Total34402950198
Classification DataCoastal SabkhaBlown SandBeach sandDammam FormationInland SabkhaRow Total
11901000110
2325613047
300230023
4222352052
Col. Total2657341150226

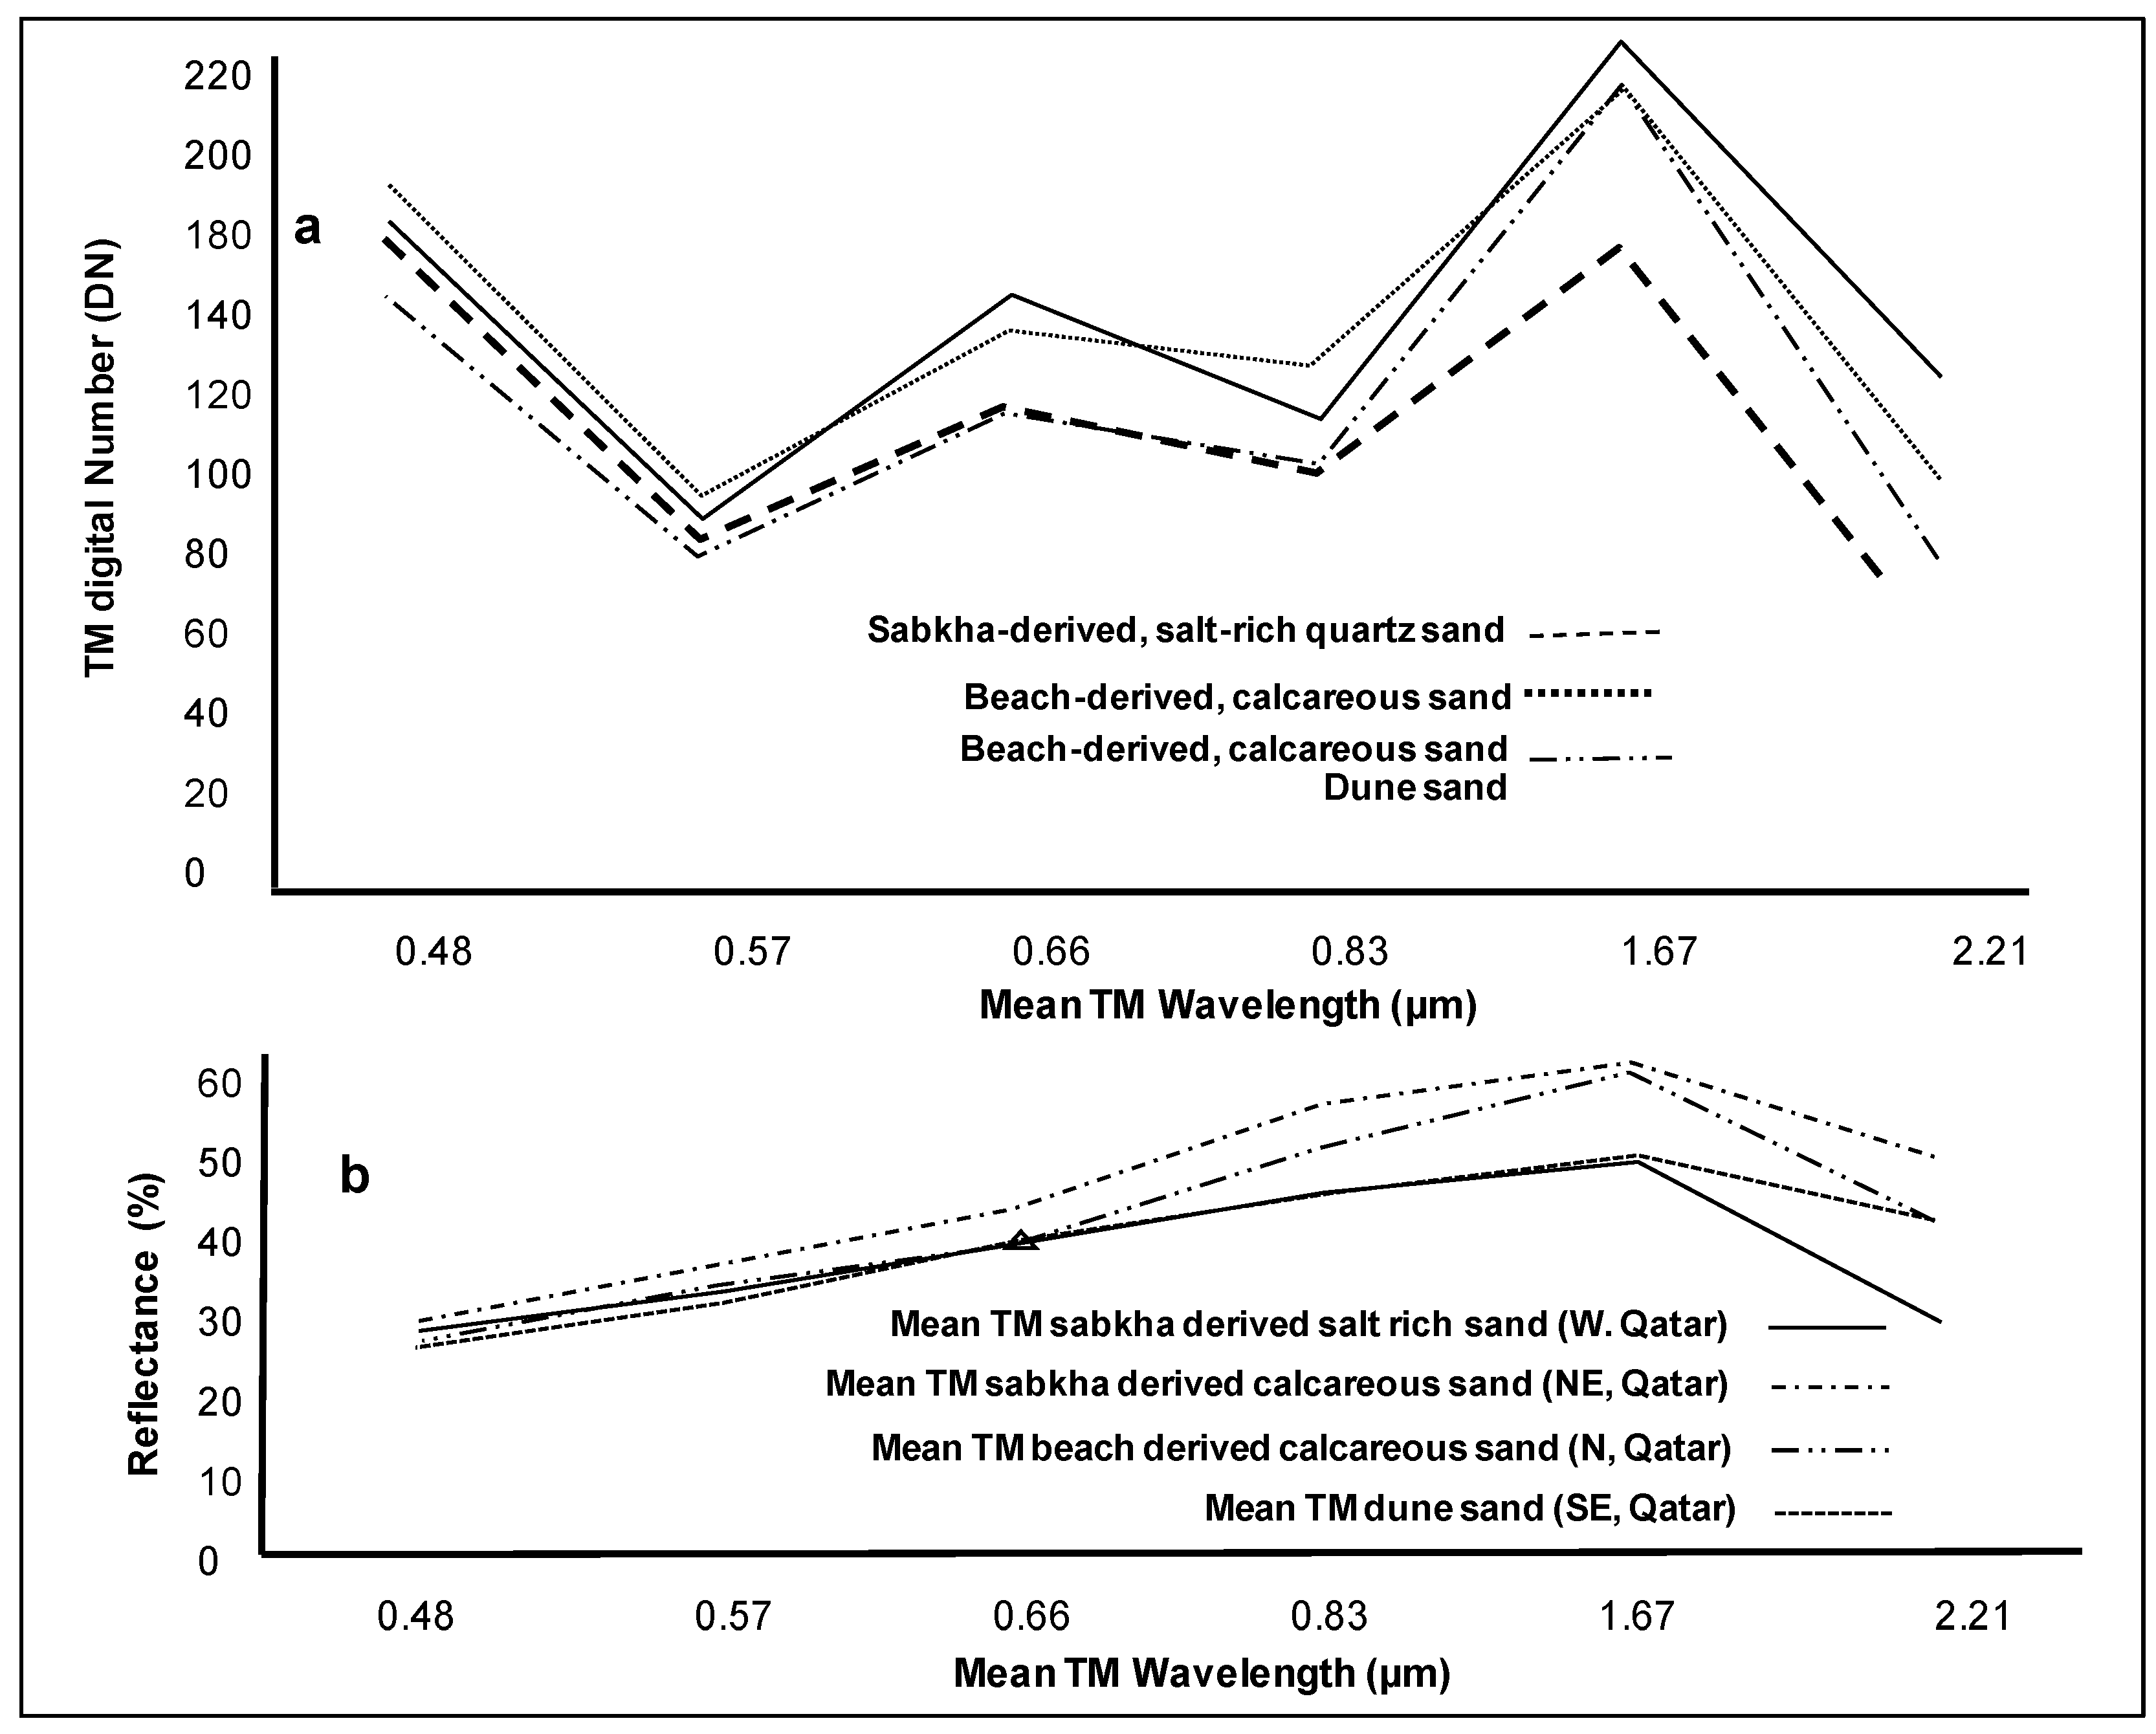
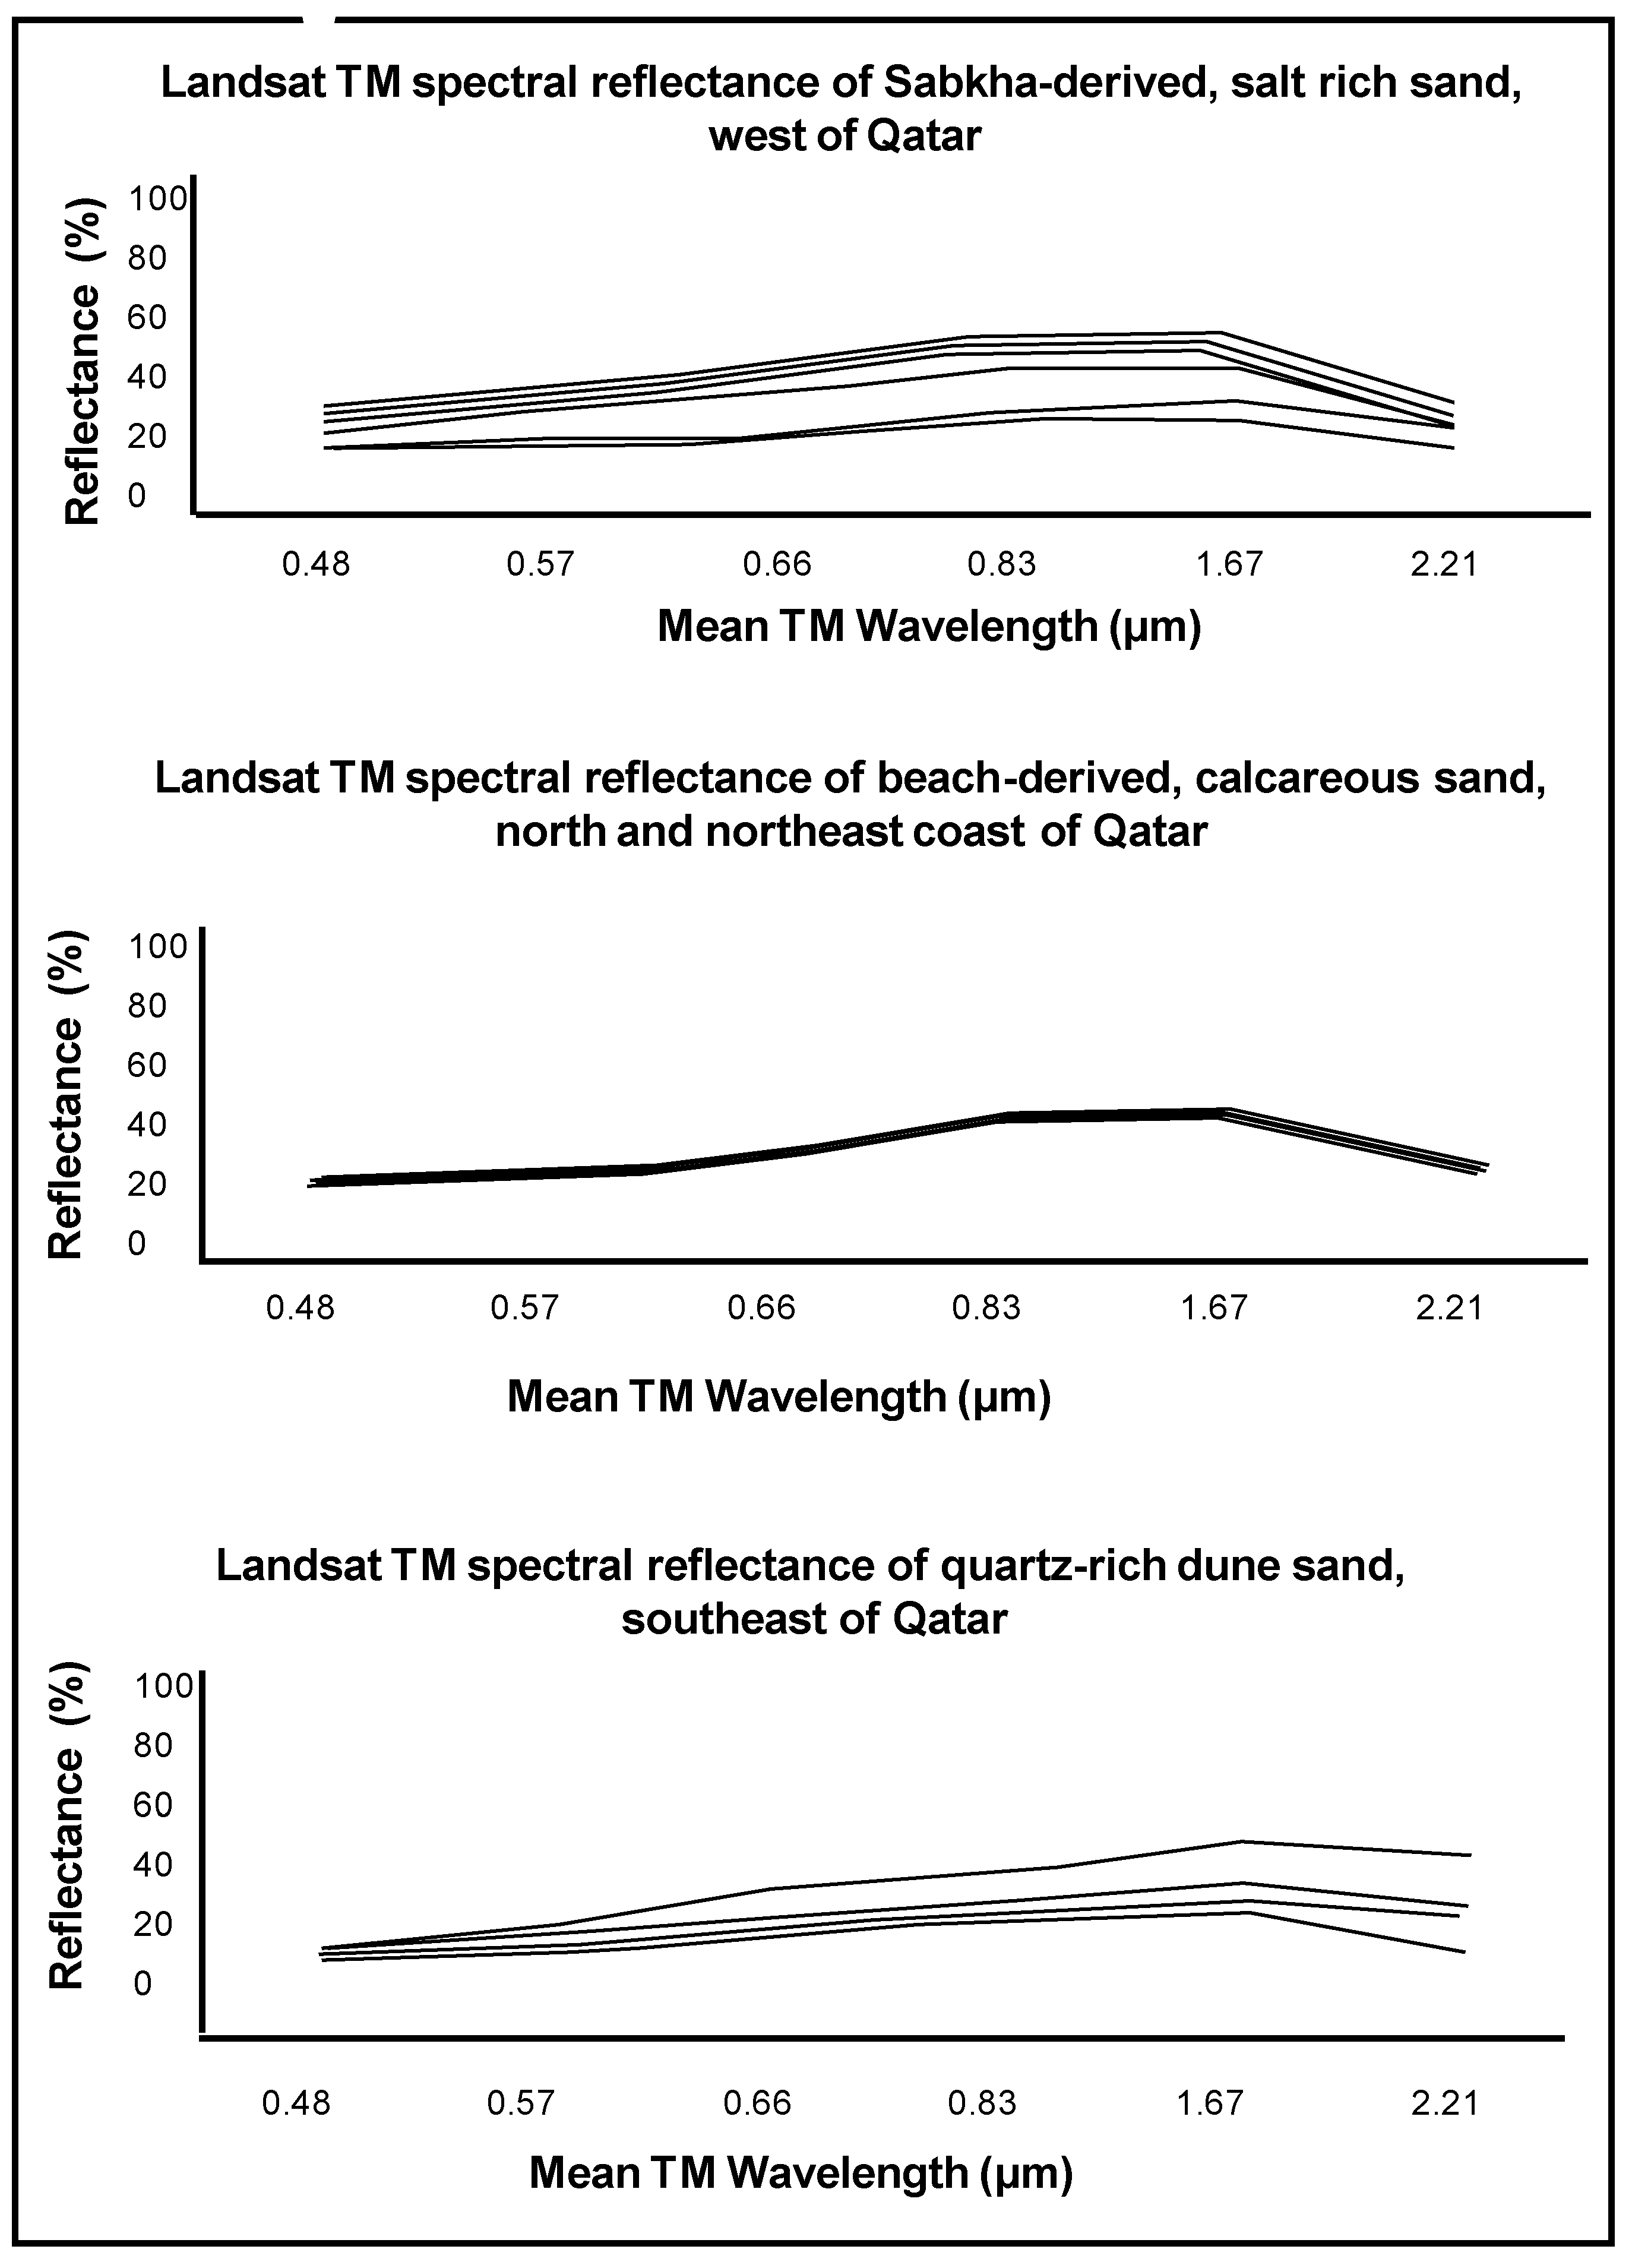
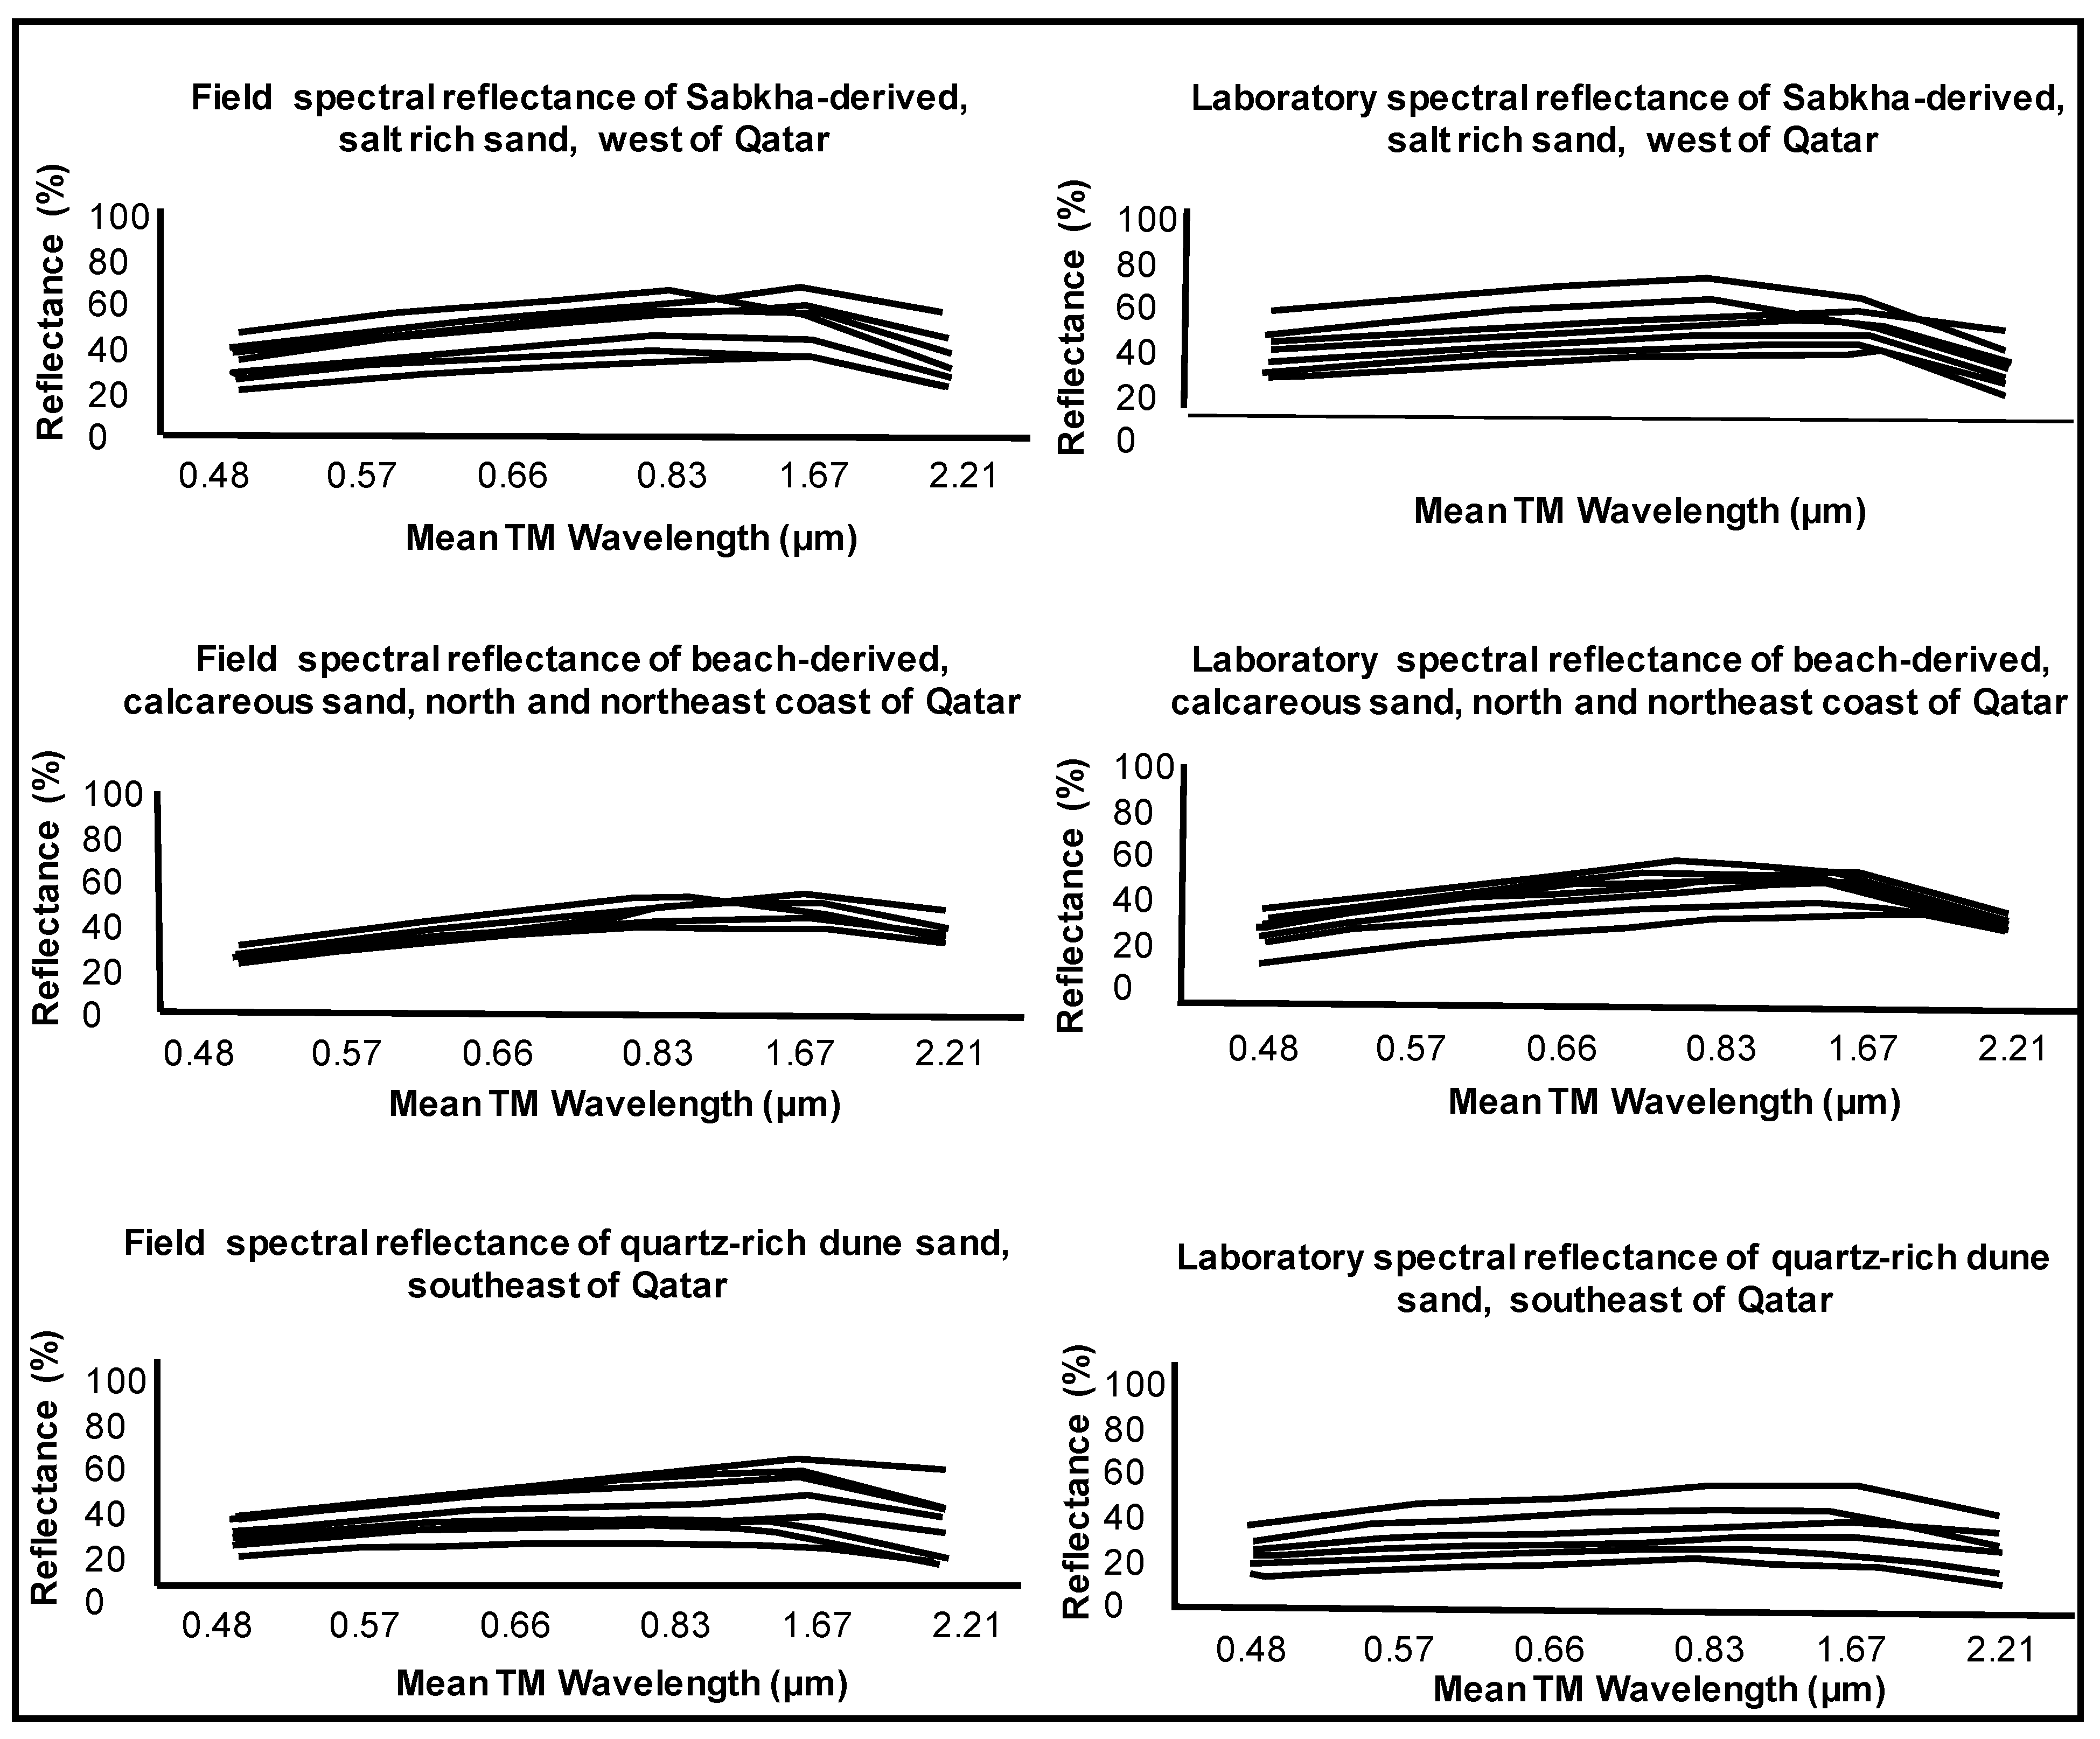
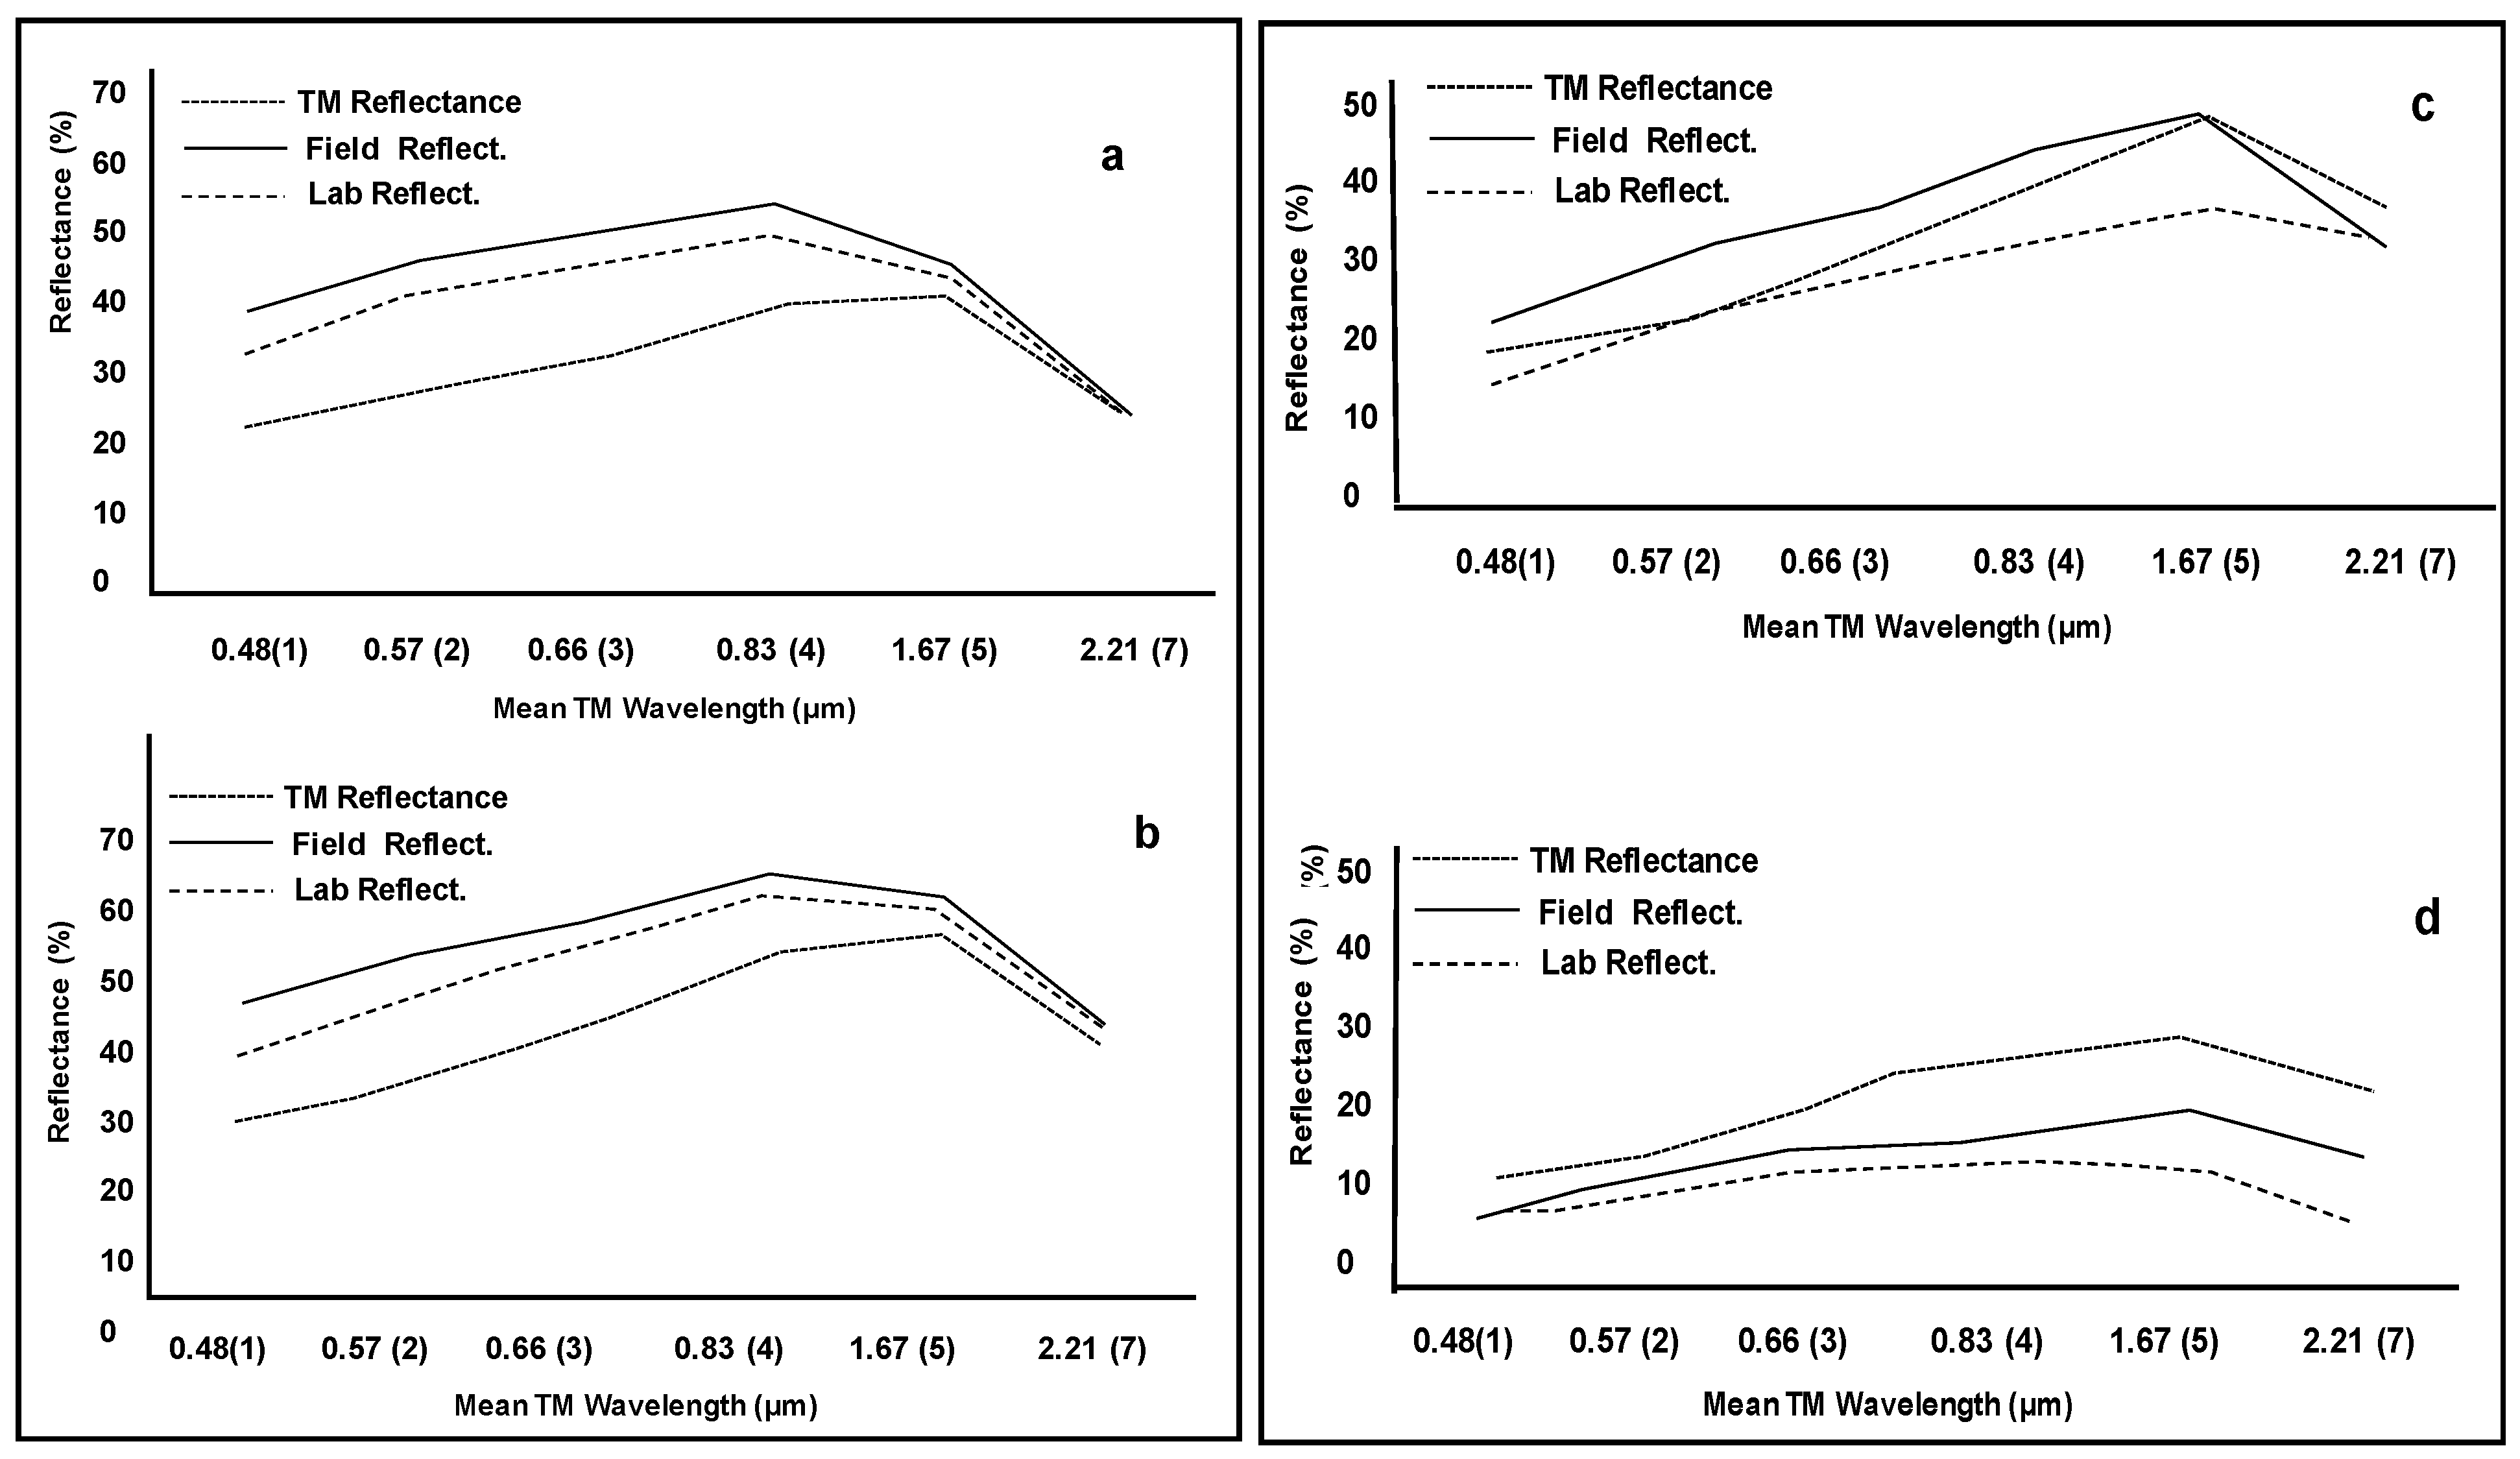
3.4. Spectral Measurements

The main intent of the spectral measurements is to assess the capability of remote sensing spectra to discriminate and identify sand types and other surficial geology materials in the visible and near infrared (V-NIR) spectrum (0.4–2.6 µm). Raw Landsat digital number (DN) values from all four study areas in the Qatar Peninsula have been plotted (Figure 5a,b) to show the various sand types within the Peninsula. These mean DN was plotted against the mean TM wavelength, and show same variation within the sand in the range of wavelength 0.66 to 2.2 µm. It is intended to identify each major sand type present within the surficial materials of the study area using satellite digital values, field and Laboratory measurements. The DN values recorded by imaging systems can generally be converted to a surface reflectance. Example of the result is in Table 3. Some representative examples of individual pixels from each at the sand types are shown graphically in Figure 6.
Figure 5. Spectral profiles of: (a) Landsat TM raw digital number (DN) values for the study area and (b) Landsat TM mean spectral reflectance of various sand types.
Remotesensing 01 00915 g005
Figure 6. Example of Landsat TM spectral reflectance from the studied areas.
Remotesensing 01 00915 g006
The average reflectance for the three main sand types to the four samples area are given in Table 3 and the resulting spectra shown graphically in Figure 5a,b. All three sand types have similar reflectance in the visible bands, which in the near-infrared band the sabkha derived salt-rich quartz sand shows an increase, but in the mid-infrared there is a decrease once again. This is due to the actual color of this type of sand in the field, which has a bright white color and thin covering in the surface. In the case of calcareous beach-derived sand there is a gradual increase from visible bands until reached mid-infrared and then a drop in mid-infrared band. Finally, quartz rich dune sand has a smooth reflectance. There is some similarity with sabkha-derived salt-rich quartz sand except in the mid-infrared when the dune sand has almost horizontal line, which means constant reflectance in the mid-infrared bands. The dune sand has great extent and thickness and some of the dune attains more than 60 meters above sea-level.
Table 5. Digital number (DN) values, and mean TM, field and laboratory reflectance values of west, north, northeast and southeast parts of Qatar Peninsula.
LocationMean TM (DN) ValuesMean TM Reflectance Values %
Band123457123457
West Qatar (A)19411114612618674232833404225
North Tip (B)178106145131231122222633435242
Northeast Coast 209123168155228972429.536.547.55135
Southeast Coast (D)198116176142241151232634384235
LocationMean Field Reflectance Values %Mean Lab. Reflectance Values %
Band 123457 1 2 3457
West Qatar (A)39.44650.354.546.82534.342.345.949.644.425.5
North Tip (B)25.233.438.847.453.236.117.826.331.536.641.337.8
Northeast Coast 4046.751.859.355.837.5334248.356.254.436.6
Southeast Coast (D)1823.526.62932.125.3172123.325.524.117.4

3.4.1. Field Measurements
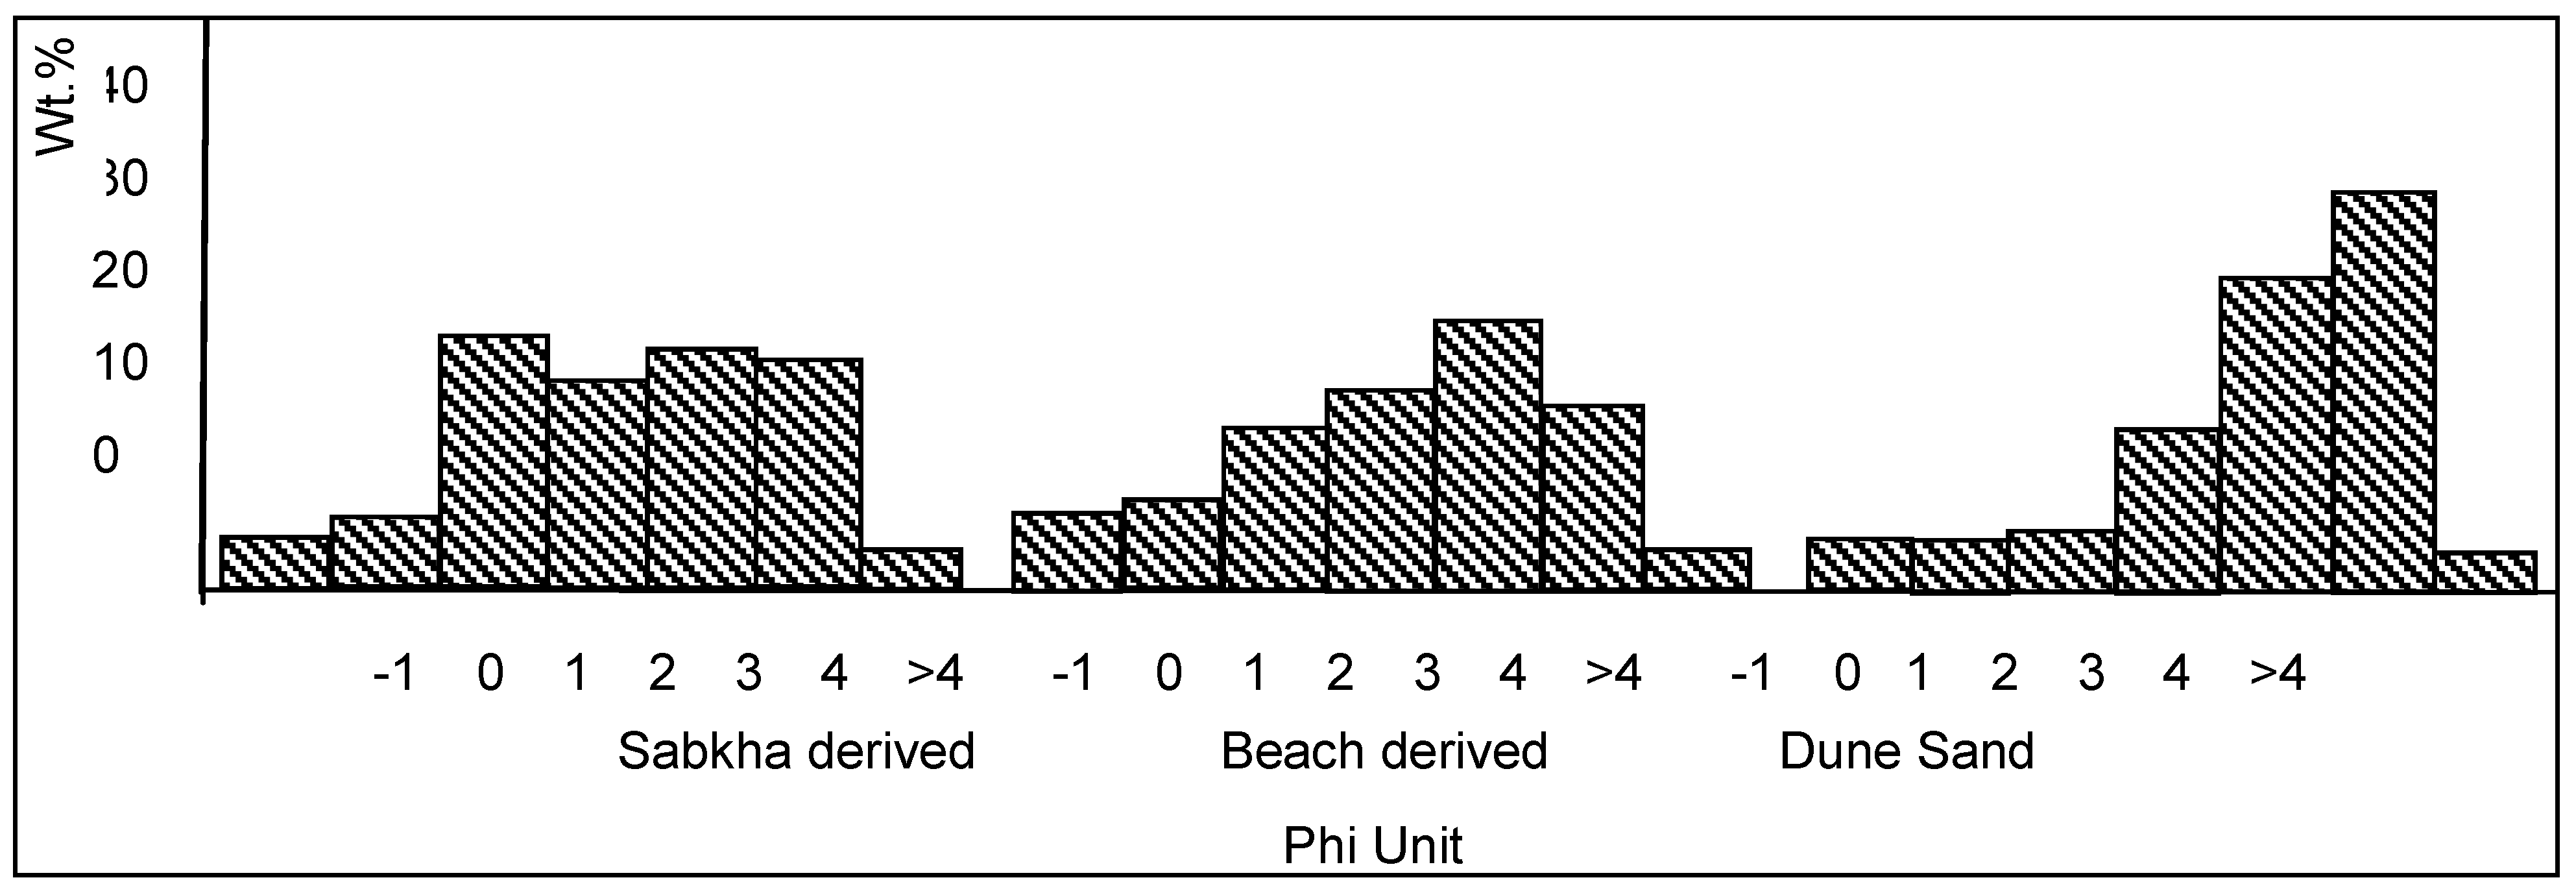
Field spectra are shown in Figure 7a, as can be reflected similar reflectance showing in the visible band while the main reflectance difference appears in IR bands. The difference is due mainly to mineral content, grain size, and the thickness of these sand distributions. The spectral characteristics of most of major minerals in calcite aragonite and dolomite are reasonably well known [15,16,17].
The spectra noted by those authors [15,16,17] are for pure minerals, meanwhile the measurements have been taken for this study was mixed samples and it was difficult to locate areas which are pure under field conditions. Examples of laboratory spectral reflectance which represent the various sand types in Qatar are shown in Figure 7b. These laboratory spectra have some similarity with the field spectra. The same equipment was used to measure both, but the distance between the target and equipment are different. Figure 8 shows the mean sabkha-derived sand TM reflectance value plotted together with field and laboratory reflectance measurements. Landsat TM has the lowest reflectance in the visible bands compared to field and laboratory spectra. This is due to several causes such as atmosphere, distance, timing, type of spectrometer and other cases as well. In the near and mid-infrared, however, the TM reflectance increases. In contrast, the others two measurements the spectra starts decreasing from the near-infrared band. In TM, reflectance decreases after band 5. In all three types of measurements the reflectance drops to almost the same value in band seven.
Figure 7. Field and laboratory spectral profiles of the main sand fields in Qatar.
Remotesensing 01 00915 g007
The mean spectral reflectance of beach-derived sand from north and north east coast are shown in Figure 8b. Landsat TM spectral mean value shows some difference from the sabkha-derived sand, which has lower reflectance in the visible bands than field and laboratory reflectance. On the other hand, TM spectral in the near and mid-infrared has higher reflectance than the laboratory measurements, but not higher than the field measurements. This is due to coarser grain size, and partly dry sand that has lower spectral reflectance than the others sand type as shown in Figure 9a.
Grain size analysis indicate that the sand collected from the different locations fall between coarse and fine sand as shown in Figure 9. Sabkha-derived salt rich quartz sand has a range of mode 500–1,000 µm. The range of mode for beach-derived calcareous sand is 250–500µm. For quartz-rich due sand the range of modes is >63–125 µm. Figure 10 shows the sabkha derived sand which has a distribution that is almost symmetrical i.e. skewness a range zero. The beach-derived, calcareous sand of the north and northeast coast is moderately skewed and the sand dune of the southeast coast has a coarse tail. The sediment is negatively skewed. The beach-derived, calcareous sand has a coarse location which comprises mainly of coral fragments and shells. Table 6 gives the main mineral composition as indicated by XRD analyses using the intensity of the main peak for each mineral. The X-ray profiles of the bulk mineralogy are shown in Figure 10. Sabkha-derived sand of west Qatar has the main minerals of gypsum, calcite, quartz and some halite (Figure 10a). Beach-derived samples from north and northeast of Qatar contain mainly aragonite, calcite, dolomite and some quartz (Figure 10b). Aeolian dune sand of southeast Qatar contains mainly Quartz with calcite (Figure 10c).
Figure 8. Mean spectral reflectances of: (a) Sabkha derived sand of west of Qatar and (b) beach-derived sand, northeast coast of Qatar Peninsula, (c) beach derived sand, north tip, and (d) dune sand, southeast coast of Qatar Peninsula.
Remotesensing 01 00915 g008
Figure 9. Average of grain size analyses of the three sand types.
Remotesensing 01 00915 g009
Figure 10. XRD analysis for: (a) west sabkha-derived sand, (b) northeast beach-derived sand and (c) southeast sand dunes of Qatar Peninsula (Gyp: Gypsum; Bass: Bassanite; Q: Quartz , P-PF: Plagoclase-Feldespar; Cal: Calcite; Dol: Dolomite; Arag: Aragonite).
Remotesensing 01 00915 g010
Table 6. Main Minerals as Indicated by XRD Analysis (abundant, ***; moderate, **; trace, *; none, x).
Sabkha-Derived sandBeach-Derived SandDune Sand
Quartz*******
Aragonitex****
Calcite****
Mg-calcite***
Dolomite***
Gypsum**xx
Halite*xx
Plagioclase Feldspar*x*
K-Feldspar*x*

4. Conclusions

The present study revealed that the surfical aeolian sands can be categorized into three main types, namely: (i) sabkha-derived, salt rich quartz sands, (ii) beach-derived, calcareous sand and (iii) quartz rich sand. Each of these types has a specific spectral signature affected by the mineralogical composition, grain size, erosional maturity and the mode of occurrence. The presented results could be useful to discriminate other surfical deposits in similar environmental conditions in arid land. For examples, Sabkha derived, salt rich, quartz sands are mainly composed of quartz, but contain gypsum and are in some areas salt-encrusted. This type of sand generally has a low TM reflectance of about 20%–30% in the visible and near-infrared (1, 2, 3 and 4) bands with an increase to around 42% in band 5, i.e., the near-infrared. However, the reflectance in the mid infrared band (7) drops to less than 20%. The second type is beach derived calcareous sands which are marine calcareous deposits, mainly composed of aragonite, calcite and some dolomite it forming an intermittent thin cover a long lose area of the present coastline. The combination of calcite and dolomite gives a higher TM reflectance reaching up to 25%–50% in the visible and near-infrared bands and also the higher reflectance of 54% in the infrared band, i.e., number 5. The third type is aeolian dune quartz sand is composed essentially of rounded quartz grains admixed with calcareous fragments and trace amount of heavy minerals. These Aeolian sands are dominantly of quartz grains that usually exhibits a yellow (golden) color and some relief on the false color composite of Landsat imagery. Aeolian quartz sand probably originated from the Arabian shield to the northwestern of Qatar. It is also concluded that the selection of unsupervised clustering data had a stronger influence on accuracy than did the choice of classification algorithm. The results indicate that TM data can be used to affectingly assist field geologist in mapping complex surfical deposits.

References and Notes

  1. Jensen, J.R. Introductory Digital Image Processing A Remote Sensing Perspective, 3rd ed.; Pearson Prentice Hall, Pearson Education: Upper Saddle River, NJ, USA, 2004; p. 163. [Google Scholar]
  2. Pease, P.P.; Bierly, G.D.; Tchakerian, V.P.; Neil, W. Tindale Mineralogical characterization and transport pathways of dune sand using Landsat TM data, Wahiba Sand Sea, Sultanate of Oman. Geomorphology 1999, 29, 235–249. [Google Scholar] [CrossRef]
  3. Howari, F.M.; Baghdady, A.; Goodell, P.C. Mineralogical and gemorphological characterization of sand dunes in the eastern part of United Arab Emirates using orbital remote sensing integrated with field investigations. Geomorphology, 2007, 83, 67–81. [Google Scholar] [CrossRef]
  4. LeMay, V.; Maedel, J.; Coops, N.C. Estimating stand structural details using nearest neighbor analyses to link ground data, forest cover maps, and Landsat imagery. Remote Sens. Environ. 2008, 112, 2578–2591. [Google Scholar] [CrossRef]
  5. Tomppo, E.O.; Gagliano, C.; De Natale, F.; Katila, M.; McRoberts, R. Predicting categorical forest variables using an improved k-Nearest Neighbour estimator and Landsat imagery. Remote Sens. Environ. 2009, 113, 500–517. [Google Scholar] [CrossRef]
  6. Sheffield, C. Selecting band combination from multispectral data. Photogramm. Eng. Remote Sens. 1984, 51, 681–687. [Google Scholar]
  7. Newton, A.R.; Boyle, T.P. Discriminating rock and surface types with multispectral satellite data in the Richtersveld, NW Cape Province, S. Africa. Int. J. Rem. Sens. 1993, 5, 943–959. [Google Scholar] [CrossRef]
  8. Chavez, P.S.; Berlin, G.L.; Sowers, L.B. Statistical methods for selection Landsat MSS ratios. J. Appl. Photogr. Eng. 1982, 8, 23–30. [Google Scholar]
  9. Chavez, P.S.; Guptill, S.C.; Bowell, J.A. Image processing techniques for thematic mapper data, proceedings. ASPRS-ACSM Tech. Pap. 1984, 2, 728–742. [Google Scholar]
  10. Friedman, S.Z. Mapping Urbanized Area Expansion through Digital Image Processing of Landsat and Conventional Data; Jet Propulsion Laboratory: Pasadena, CA, USA, 1980; pp. 79–113. [Google Scholar]
  11. Satterwhite, M.; Rice, W.; Shipman, J. Using landform and vegetative factors to improve the interpretation of landsat imagery. Photogramm. Eng. Remote Sens. 1984, 50, 83–91. [Google Scholar]
  12. Congalton, R.G. A review of assessing the accuracy of classifications of remotely sensed data. Remote Sens. Environ. 1991, 37, 35–46. [Google Scholar] [CrossRef]
  13. Douaoui, A.; Nicolas, H.; Walter, C. Detecting salinity hazards within a semiarid context by means of combining soil and remote-sensing data. Geoderma 2006, 134, 217–230. [Google Scholar] [CrossRef]
  14. Rollin, E.M.; Milton, E.J. Processing of high spectral resolution reflectance data for the retrieval of canopy water content information. Remote Sens. Environ. 1998, 65, 86–92. [Google Scholar] [CrossRef]
  15. Hunt, G.R. Spectroscopic properties of rocks and minerals. In Handbook of Physical Properties of Rocks; Carmichael, R.S., Ed.; CRC Press: Boca Raton, FL, USA, 1982; Vol. 1, pp. 295–385. [Google Scholar]
  16. Hunt, G.R.; Salisbury, J.W. Visible and near infrared spectra of minerals and rocks. I. Silicate minerals. Mod. Geol. 1970, 1, 283–300. [Google Scholar]
  17. Hunt, G.R.; Salisbury, J.W.; Lenhoff, C.J. Visible and near-infrared spectra of minerals and rocks. IV. Sulphides and sulphates. Mod. Geol. 1971a, 3, 1–4. [Google Scholar]

