Article

Using Satellite Remote Sensing to Study the Impact of Climate and Anthropogenic Changes in the Mesopotamian Marshlands, Iraq

1
School of Earth, Ocean and Environment, University of South Carolina, Columbia, SC 29208, USA
2
NASA Goddard Space Flight Center, Greenbelt, MD 20771, USA
*
Author to whom correspondence should be addressed.
Remote Sens. 2018, 10(10), 1524; https://doi.org/10.3390/rs10101524
Submission received: 31 July 2018 / Revised: 3 September 2018 / Accepted: 20 September 2018 / Published: 22 September 2018
(This article belongs to the Section Atmospheric Remote Sensing)

Abstract

:
The Iraqi Marshes in Southern Iraq are considered one of the most important wetlands in the world. From 1982 to the present, their area has varied between 10,500 km2 and 20,000 km2. The marshes support a variety of plants, such as reeds and papyrus, and are home to many species of birds. These marshes are Al-Hammar, Central or Al-Amarah, and Al-Huwaiza. Freshwater supplies to the marshes come from the Tigris and Euphrates rivers in Iraq and from the Karkha River from Iran. For this analysis, we used the Land Long-Term Data Record Version 5 (LTDR V5) Normalized Difference Vegetation Index (NDVI) from the Advanced Very High Resolution Radiometer (AVHRR) sensor dataset. This dataset was recently released at a 0.05 × 0.05° spatial resolution and daily temporal resolution to monitor the spatial and temporal variability of vegetation along with other hydrological variables such as land surface temperature, precipitation, and evapotranspiration. In our analysis, we considered three time periods: 1982–1992; 1993–2003; and 2004–2017 due to anthropogenic activities and climate changes. Furthermore, we examined the relationships between various water cycle variables through the investigation of vegetation and water coverage changes, and studied the impacts of climate change and anthropogenic activities on the Iraqi Marshes and considered additional ground observations along with the satellite datasets. Statistical analyses over the last 36 years show significant deterioration in the vegetation: 68.78%, 98.73, and 83.71% of the green biomass has declined for Al-Hammar, The Central marshes, and Al-Huwaiza, respectively. The AVHRR and Landsat images illustrate a decrease in water and vegetation coverage, which in turn has led to an increase in barren lands. Unfortunately, statistical analyses show that marshland degradation is mainly induced by human actions. The shrinkage in water supplies taken by Iraq’s local neighbors (i.e., Turkey, Syria, and Iran) has had a sharp impact on water levels. The annual discharge of the Tigris declined from ~2500–3000 m3/s to ~500 m3/s, and the annual discharge of the Euphrates River declined from ~1500 m3/s to less than 500 m3/s.

1. Introduction

The world’s wetlands are recognized as an essential environment for natural resources; a vital ecosystem for plant and animal biodiversity; and provide income for local economies through fishing, recreation, grazing for cattle, and reed harvesting [1,2,3].
The freshwater portions of the land surface of marshes are inhabited by broad areas of aquatic plants. Phragmites australis is the most dominant community in all marshlands [4]. Wetlands have disappeared in many parts of the world due to land use change, human intervention, and climate change [5]. Wetlands are also affected by regional and local climate changes caused by changes in hydrology, direct and indirect effects of changes in temperatures, as well as land-use change [6].
The Mesopotamia marshes in Iraq are considered one of the most important wetlands in the world. It is the largest ecosystem of its kind in the Middle East and Western Asia as well as home to one of the oldest civilizations in the world [7]. The Mesopotamia marshes are locally called “Al-Ahwar”, and are sandwiched between three Iraqi provinces: Maysan, Dhiqar, and Al-Basra. They lie in the vast floodplain between the Euphrates and the Tigris rivers in the lower part of the Mesopotamia basin. The floodplains are an area of flat elevation and have been created through the accumulation of alluvial materials carried by surface water from upstream [8]. During the past few decades, the area of marshlands has varied between 10,500 km2 and 20,000 km2. The three marshes are the Al-Hammar marsh, the Central or Al-Amarah marsh, and the Al-Huwaiza marsh.
The hydrology of the Mesopotamia marshlands is extremely important to the ecology of the entire upper Persian Gulf (https://earthobservatory.nasa.gov/images/1716). They acted as a natural wastewater treatment system for the Euphrates and Tigris Rivers, filtering out fertilizers before the water drained into the Persian Gulf. The Marshes assumed an imperative part in the upkeep of provincial biodiversity in the Middle East, essentially on account of their huge size, the extravagance of their aquatic vegetation, and their disconnection from similar comparable systems [9,10]. Rapid desiccation of over 10,000 km2 of wetlands and lakes is bound to have significant ramifications on the regional micro-climate. As the moderating role of the wetlands is eliminated, evapotranspiration and humidity rates will sharply decrease. Rainfall patterns will be modified [7]. Temperatures will invariably rise, particularly during the hot and long summers. Strong and dry winds reaching temperatures of over 40 °C, previously broken by the reed beds, will blow unhindered [11]. With salt crusts and dry marshland soils exposed, wind-blown dust laced with various impurities will considerably increase, affecting thousands of square kilometers well beyond Iraq’s borders [7]. Ecosystem degradation at such a grand scale may have serious drawbacks on human health, ranging from the effects of water scarcity and pollution to increased exposure to thermal extremes and potentially toxic dust storms blowing off saltpans and dried marsh bed. Furthermore, the fragile arable lands surrounding the former marshlands are likely to suffer from land degradation and desertification, caused by wind erosion and sand encroachment from the dried marsh bed and surrounding deserts.
The marshlands dried out from anthropogenic activities of river damming upstream and politically-driven drying operations in the late 1980s and early 1990s as the flow of the Tigris and Euphrates rivers was altered by the construction of dams and canals upstream, and this caused an ecological disaster [12]. Degradation is a decline in the area of vegetation that turns into barren land. The percentage mentioned in the manuscript shows the shrinkage in all three marshes that led to the dramatic increase in barren areas. This degradation led to the transformation of the marshes to barren lands. The marshes with the most damage were the Al-Hammar and The Central marshes, where the percentage of degradation reached 95%; fortunately, about 30% of the Al-Huwaiza marsh remained intact because the Karkha River from Iran continued to feed the northeastern part of this marsh [7]. These massive drainage-alteration operations are considered some of the greatest wetland environmental disasters in the world [5,13,14].
After the fall of the regime responsible for these drainage alterations in late 2003, the marsh dwellers uprooted most of the earthen dams, as well as dikes on the Tigris and Euphrates rivers, and water started flowing back towards the marshlands [15]. Within three years of normal flows, the Mesopotamian marshes began to be re-established. Native species of flora and fauna returned, and the percentage of recovery was between 50% and 60% as compared to the wetlands before alteration, showing the resilience of the marshes [14,16].
Over the last decade, various researchers attempted to monitor the marshlands using Landsat or Moderate Resolution Imaging Spectroradiometer (MODIS) imagery, but their analyses were confined to shorter periods (as described in the following paragraph) than we have undertaken in this study.
The goal of this work is to examine the relationships between water cycle variables and vegetation indices. This examination shows changes that are evidence of environmental degradation. This study also aims to delineate the main points of human-induced land degradation in the study area. The period was divided into three periods: pre-diversion, diversion, and post-diversion periods. Previous research on the Mesopotamian marshes in environmental studies featured findings such as changes detected in the land cover via remote sensing and field observations. The following are the most relevant findings for the marshlands in Southern Iraq. Yacoub et al. [17] performed systemic geological mapping for the southern part of the Mesopotamia plain. They provided detailed descriptions of the geological and geomorphological units present in the area. Partow [7] demonstrates the negative effects of dams on the Tigris and the Euphrates rivers in Iraq that have caused environmental degradation in the region. Richardson et al. [16] studied the effects of massive diversion of water due to drying operations that started during the late 1980s and exhibited the effects of uncontrolled diversion on water quality, environmental, and soil conditions. Unknown is the fate of the many highly threatened species, the quality of water, and food supplies, as well as the diversity of communities, including mature habitats, which will be critical to the return of many of species. Al-Hilli et al. [18] studied the vegetation conditions of the wetland ecosystems in the Mesopotamian plains during 1972–1975 to understand the impact of hydrological controls during the 1970s for the rehabilitation of the marshes. Shehab et al. [19] detected changes in the marshlands that showed consequences of the drying operations on the environment via using remote sensing and GIS techniques. The drying operations affected the top soil cover and changed it to unfavorable soil for growing vegetation. Beside active soil erosion, the chemical and physical properties of the soil were also changed. Hamdan et al. [20] carried out comparisons between three study areas in the re-flooding area and found changes in hydrology and geochemistry. Some plants species of wetland have not been found in re-flooded wetlands. Saleh [21] detected environmental changes in the marshes by using Landsat images detecting land cover changes. Saleh [21] used Landsat images to detect land surface changes in the marsh areas. Al-Handal and Hu [5] showed changes in the vegetation and water coverage in the Iraqi marshes using remote sensing techniques. They found that the vegetation coverage and water bodies in Al-Hammar and The Central marshes have extremely declined more than the Al-Huwiaza marsh.
However, the above studies are either much shorter in duration or at smaller spatial scales or extent. In this research, we detected changes in the Mesopotamian marshlands over almost four decades. Due to the marshlands having been subjected to many drastic conditions over a long time period (i.e., 36 years), we examined the connections between different water cycle variables through the examination of vegetation and water coverage changes, and focused on the effects of climate change and human actions on the Iraqi marshes and considered additional ground observations alongside the satellite datasets. The statistical analyses between Normalized Difference Vegetation Index (NDVI) and meteorological data are important to demonstrate the sensitivity of NDVI. We analyzed Advanced Very High Resolution Radiometer (AVHRR)/NDVI and climatological data to assess the fluctuation and trends in vegetation and water bodies.

2. Datasets and Methods

2.1. Study Area

The Mesopotamian marshes are located in Southern Iraq between 46.4–48.00°E longitude and 30.5–32.2°N latitude. The marshlands are comprised of shallow freshwater lakes, some of which are permanent lakes, while others are seasonal. According to field stations at Al-Basra, Al-Nasiriyah, and Al-Amarah, and the analyses of Global Land Data Assimilation System (GLDAS) data, the average annual precipitation and the average annual air temperature were <25 mm/year and 26.5 °C, respectively. Thus, the study location is located in an arid region as determined by the annual rainfall and mean annual temperature [22,23].
The Mesopotamian marshes consist of three main areas (Table 1 and Figure 1). Each marsh has different sources of water and is different in size. The Al-Hammar marsh has an area approximately 120 km in length and 25 km in width. The area of The Central marsh is about 3000 km2 that lies between the Al-Hammar and Al-Huwaiza marshes. The Al-Huwaiza marsh is 80 km from north to south, and is located along the boundary with Iran, and is 30 km from east to west [7,24].

2.1.1. Al-Hammar Marsh

The Al-Hammar marsh is situated south of the Euphrates River. It expands from Al-Nasiriyah in the west to the suburbs of Al-Basra in the east and is located on Shatt Al-Arab—a river formed via the confluence of the Tigris and Euphrates rivers in Southeast Iraq that flows into the Persian Gulf. The Euphrates River is the primary source of water for the Al-Hammar marsh. The approximate area of the Al-Hammar marsh is 3000 km2, but it increases to ~4000 km2 during seasonal floods. The Al-Hammar marsh has permanent lakes that are considered as some of the largest lakes in the southern part of the Euphrates River region [7].

2.1.2. The Central marshes

The Central marshes lie between the Euphrates and the Tigris rivers. They are called “Central” because they are the center of the marshlands. It is bordered to the west by the Tigris River, and to the south by Euphrates River [7]. A group of the Tigris River’s distributaries feeds The Central marshes, along with some channels from the Euphrates River. The Central marshes occupy an area of approximately 3000 km2 that can expand up to ~4000 km2 during periods of floods.

2.1.3. Al-Huwaiza Marsh

These marshes are located between the towns of Al-Amarah in the north and Al-Basra in the south. The Al-Huwaiza marsh expands into Iran, where it connects with the Al-Azim marsh. These marshes are fed by two of the Tigris River’s tributaries: The Al-Mushrah and the Al-Kahla canals both from the west and the Karkha River from the east. The approximate area of these marshes is ~2750 km2, but it grows to 3250 km2 during floods periods. The northern part of this marsh has large permanent lakes with an average depth around six meters [11].

2.2. Satellite and Model Datasets

2.2.1. AVHRR LTDR V5 Daily NDVI Product

Satellite remote sensing data have been utilized to measure the qualitative and quantitative terrestrial land-cover changes [25]. Through the last two decades, remotely sensed data have been developed to assess the change detection on a global scale [26,27] for monitoring and carrying out inventory of wetlands in developing countries that have insufficient field observations [28]. Additionally, the use of remote sensing data is inexpensive and less time-consuming. The Advanced Very High Resolution Radiometer (AVHRR) is onboard the National Oceanic and Atmospheric Administration (NOAA) polar-orbiting environmental satellites, which are used to calculate the Normalized Difference Vegetation Index (NDVI)—a product derived from the AVHRR sensor. There are two spectral channels on the NOAA AVHRR sensor that are used to calculate the daily NDVI value. The NDVI is the ratio of the difference between the near-infrared band (NIR) and the red band (RED) divided by the sum of the NIR and RED bands [29,30]
  NDVI = NIR RED NIR + RED  
The last version (V5) products were made available (http://ltdr.nascom.nasa.gov) on 15 August 2017. The daily NDVI estimates are derived using daily surface reflectance data from the AVHRR instruments on NOAA 7, 9, 11, 14, 16, 18, and 19. The LTDR dataset was generated by GAC archive images from the NOAA AVHRR series sensors [31]. The GAC time series images were reprocessed by using the preprocessing improvements that were identified in the PAL-II project [32]. The 6S radiative transfer model was applied to atmospherically correct the top of atmosphere AVHRR data to determine surface reflectance values for bands 1 and 2 including Rayleigh scattering, ozone absorption, water vapor, and aerosol corrections [33]. A reanalysis dataset with a 0.05° × 0.05° resolution from the NOAA Center for Environmental Prediction (NCEP) was applied to water vapor corrections [31,34]. Aerosol climatology from internal NOAA was applied to correction for aerosol scattering [31,34]. One line element was used for the geometric correction of the LTDR product [31,34]. Compared with previous versions of the LTDR dataset, V4 and V5 have improved the geolocation accuracy and are computed as the average of the available good data value observations in each grid cell (https://ltdr.nascom.nasa.gov). Previous versions of the LTDR NDVI products have been used to map burned areas [35,36] and assess droughts [37]. The AVHRR sensor provides the most extended global time series of satellite Earth observations. It is considered as an attractive source to study the differences in land surface properties because it has a low data volume spanning more than 30 years [38].
Using Terra MODIS NDVI as a reference, Guo et al. [31] found that the LTDR NDVI dataset was well-suited for long-term vegetation studies of the Chines areas. To this end, we aggregated the original LTDR NDVI time-series (5-km pixel size, daily, period January 1982–December 2017) to get the time-series of monthly and annual mean values as 12-month averages for inter-annual NDVI trend analysis. In this work, NDVI monthly data at 5 km, spatial resolution was utilized from already processed daily NDVI composites using the maximum value of that compositing procedure to minimize effects of cloud contamination, varying solar zenith angles, and surface topography [39]. The NDVI ranges between −1 to 1, where negative values represent clouds, snow, water, and other non-vegetated surfaces, and positive values represent vegetated surfaces [34,39]. For this study, we subset the study area from the global dataset for 1982–2017. We extracted the NDVI values between (0–1) that indicate vegetation surface and neglected the values that were <0. The NDVI is strongly related to the photosynthetic capacity of plants [40].
To obtain the time-series of annual mean values, annual NDVI values were computed as 12-month averages. Average NDVI values for the whole period (1982–2017) of each month were also calculated. These two sets of data were then subjected to statistical analyses to assess the volatility and trends in vegetation index. In this paper we focus our analysis on NDVI patterns during the summer months, because the Phragmites australis community, the dominant vegetation type, is at a maximum in the summer months [18] (Table 2).

2.2.2. GLDAS

Other datasets used in this research were obtained from GLDAS, which are available from NASA Goddard Earth Sciences Data and Information Services Center (GESDISC). GLDAS incorporate satellite and ground-based observational data products, using advanced land surface modeling and data assimilation techniques, in order to generate optimal fields of land surface states and fluxes [41]. The GLDAS/NOAH10 Land Surface Model L4 runs global coverage at a spatial resolution of 1° × 1° on a monthly step. The model provides data from January 1979 to the present period (Table 2).

2.3. Landsat Images and Land Cover Classifications

As the spatial resolution of NDVI/AVHRR is 5 km, we also used Landsat 30 m thematic mapper multi-spectral data to delineate changes in the Mesopotamian marshlands at this spatial resolution.
The results of our analyses are described in Section 3.1.
Remote sensing has increasingly been used as a source data in Geographic Information System (GIS) at local, regional, and global scales [42,43]. In particular, satellite data has been used for prediction in un-gauged basins [44], soil moisture in catchments [45], and groundwater [46]. We used ArcMap GIS to analyze the remotely sensed data by using analytical procedures including data acquisition, data processing, data analysis, data conversion, error assessment, and the final product presentation [42].
The most important method that was used in ArcMap GIS software was the supervised classification method. The classification of land use/land cover is based on statistical pattern recognition techniques applied to multispectral remote sensor data—one of the most often used methods of information extraction [47]. The land cover classification indicates the main features present on the landscape such as water bodies, crops, wetland, forest, and other features that are man-made, and land-use classification indicates the human use of the land surface [48]. The study area images were classified into three classes (i.e., water, vegetation, and barren). The Landsat images showed vegetation during June within the three main periods (pre-diversion, diversion period and post-diversion) to illustrate the changes in the marshlands (Figure 2). The purpose of the supervision was to select sample pixels in the image that were representative of specific classes and forming the direct image with training sites as a reference for the classification for all pixels in the image.
Classification accuracy assessment was used to measure the agreement between an accuracy standard and classified Landsat images of unknown quality and to accurately determine the level of detail found within the classification [48,49]. This method made it possible to increase the accuracy of classification by minimizing the amount of detail by generalizing to broad classes rather than focusing on particular ones. Table 3 illustrates both omission and commission errors for the classification map of the Al-Hammar marsh derived from Landsat Multispectral Scanner images for 1985. The omission errors for water, vegetation, and barren were 2%, 2%, and 0%, respectively. The commission errors are 2%, 0, and 2% for water, vegetation, and barren, respectively.

2.4. In Situ Data

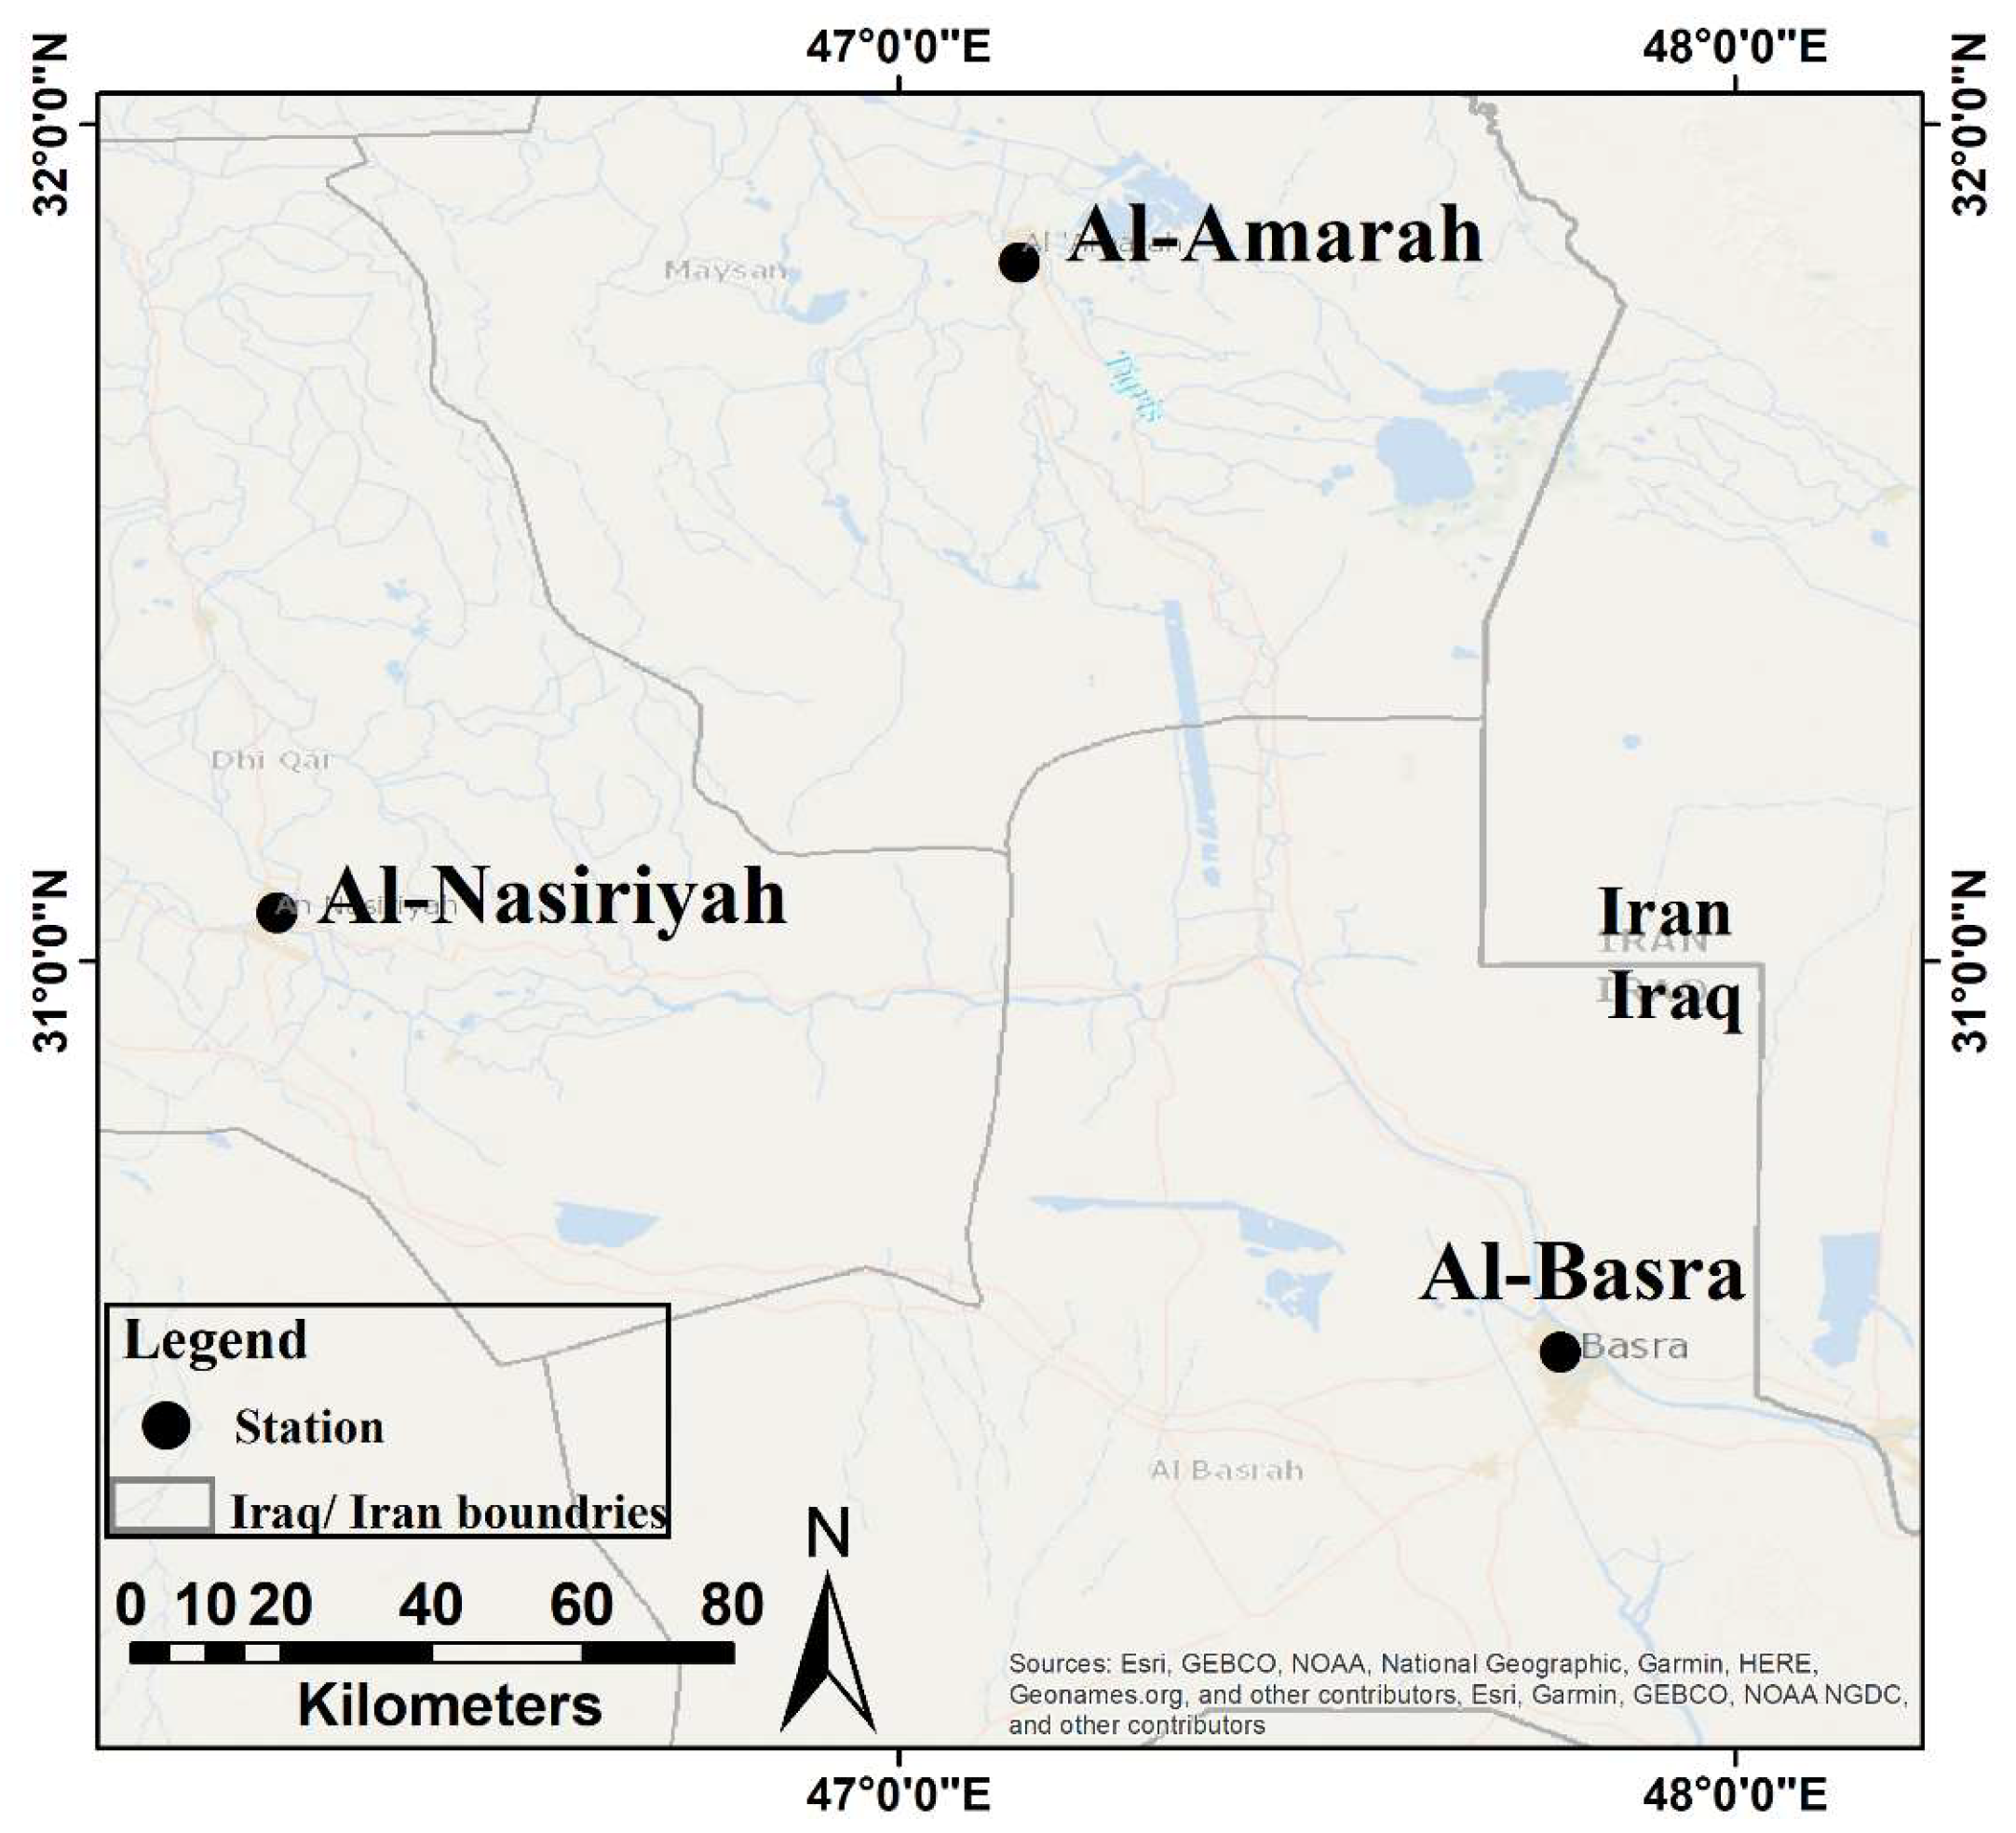
Meteorological data were used to determine the relationship between NDVI and rainfall, temperature, and evapotranspiration (ET). There are three stations in the study area: Al-Basra, Al-Nasiriyah, and Al-Amarah (Figure 2). In this research, the field observations that were used included monthly ET for the period 1982–2015 and monthly precipitation for the period 1982–2017. The field observations were collected from the three main weather stations, located in the study area or nearby. We calculated the average of the variables using the observations from the three stations mentioned above.

2.5. Long-Term Trends in Biomass Dynamics

The NDVI time-series was then statistically analyzed based on linear regression to identify those areas that showed a significant decline or increase in NDVI over time. The simple linear relationship
VI = A × t + B
where VI = annual mean NDVI, A = long-term trend of NDVI, t = year (elapsing from 1982 to 2017), and B = intercept (an indicator for a possible delay in the onset of degradation). The computed slope coefficient A for each pixel was tested for statistical significance [50,51]. For every pixel, the slope A was computed and tested for statistical significance at different confidence levels: 95% (p < 0.05) and 90% (p < 0.1). This exercise yields the area where, at least from a birds-eye view, a significant and worrying loss of vegetation cover was taking place (in brown) and those where NDVI is increasing (in green). The range in the rate of decline or improvement is similar (the slope A ranges from (−0.005 to 0.003).

2.6. Standardized NDVI Anomaly (SNA)

The standardized NDVI ( NDVI ¯ ) is calculated using the following equation as
  NDVI ¯   = X µ σ  
where X is the NDVI value, μ is the average NDVI of the long term, and σ = standard deviation.
The results of the standardized NDVI ( NDVI ¯ ) analyses are described in Section 3.3

3. Results

3.1. Monthly Time-Series Patterns in the Time Period from 1982 to 2017

The change in land use is one of the primary features dealt with in this study. Using Landsat data we display the changes in land use over time. Figure 3 shows the output mosaic image for the study area during different years, including 1985, 1989, 1994, 1998, 2004, and 2009. Vegetation is represented in red, black and blue-turquoise colors represent water bodies, and the barren areas are represented by gray and yellowish-gray color. These Landsat images document at a 30 m scale the degradation of the marshes through 36 years.
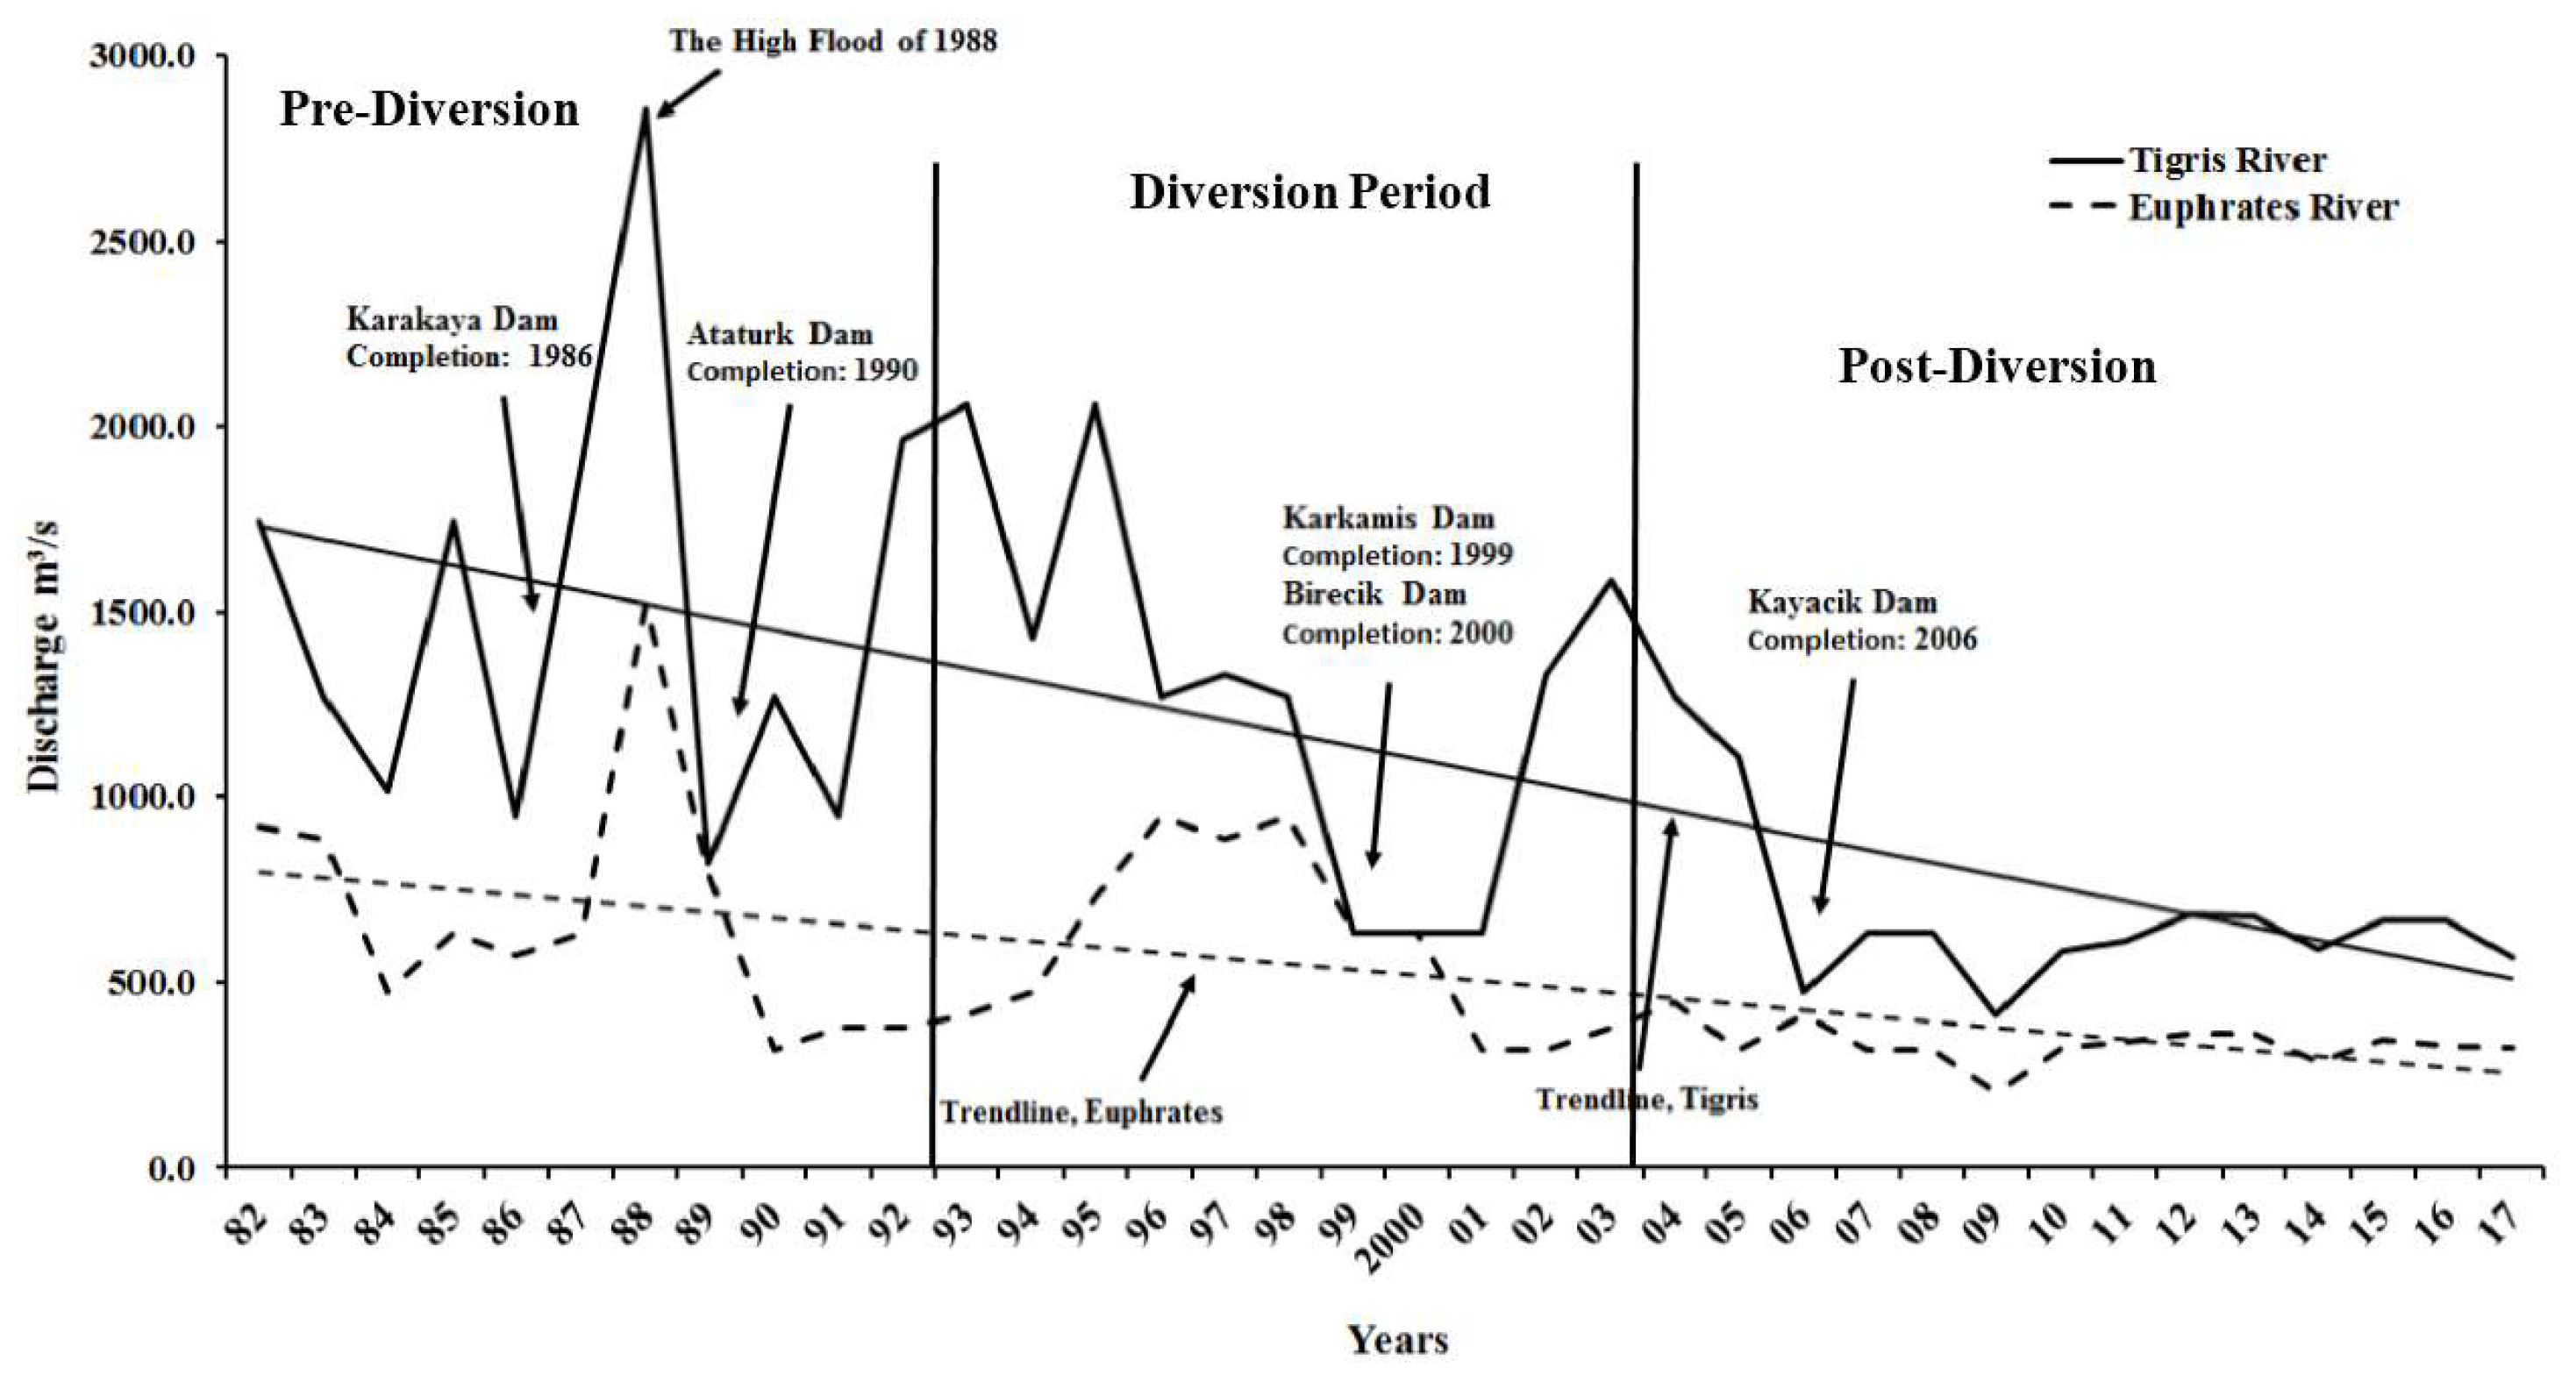
The Euphrates River is the primary water source that feeds the Al-Hammar marsh, and it has a discharge less than that of the Tigris River which feeds The Central and Al-Huwaiza marshes (Figure 4). Figure 4 shows the variations in the annual discharges of the Tigris and Euphrates rivers at Al-Kut and Al-Nasiriyah cities, respectively.
The high discharge rates of the Tigris River are the result of a large number of tributaries that supply it from the north to the confluence with the Euphrates River in Southern Iraq [52,53,54]. Figure 4 shows a statistically significant negative trend for the period of record (1982–2017) on the Tigris and Euphrates rivers indicating a decrease in mean annual discharge. This significant decrease is due to the construction of large dams in Turkey as part of the Southeastern Anatolia Project and the construction of a series of dams in Syria and downstream Iraq (Figure 4 and Supplement 2) [55,56]. Although there was a good amount of flow of the rivers during (1990–2003), the marshlands did not benefit. The supporting rivers’ (the Tigris and Euphrates rivers) water was diverted away from the marshes due to drying operations [12,14,57]. According to the Iraqi Ministry of Water Resources, the inflow of water at the Iraqi-Syrian and Turkey border was constantly decreasing. In 2009, Iraq registered a record low discharge on the Tigris and the Euphrates [55,56].
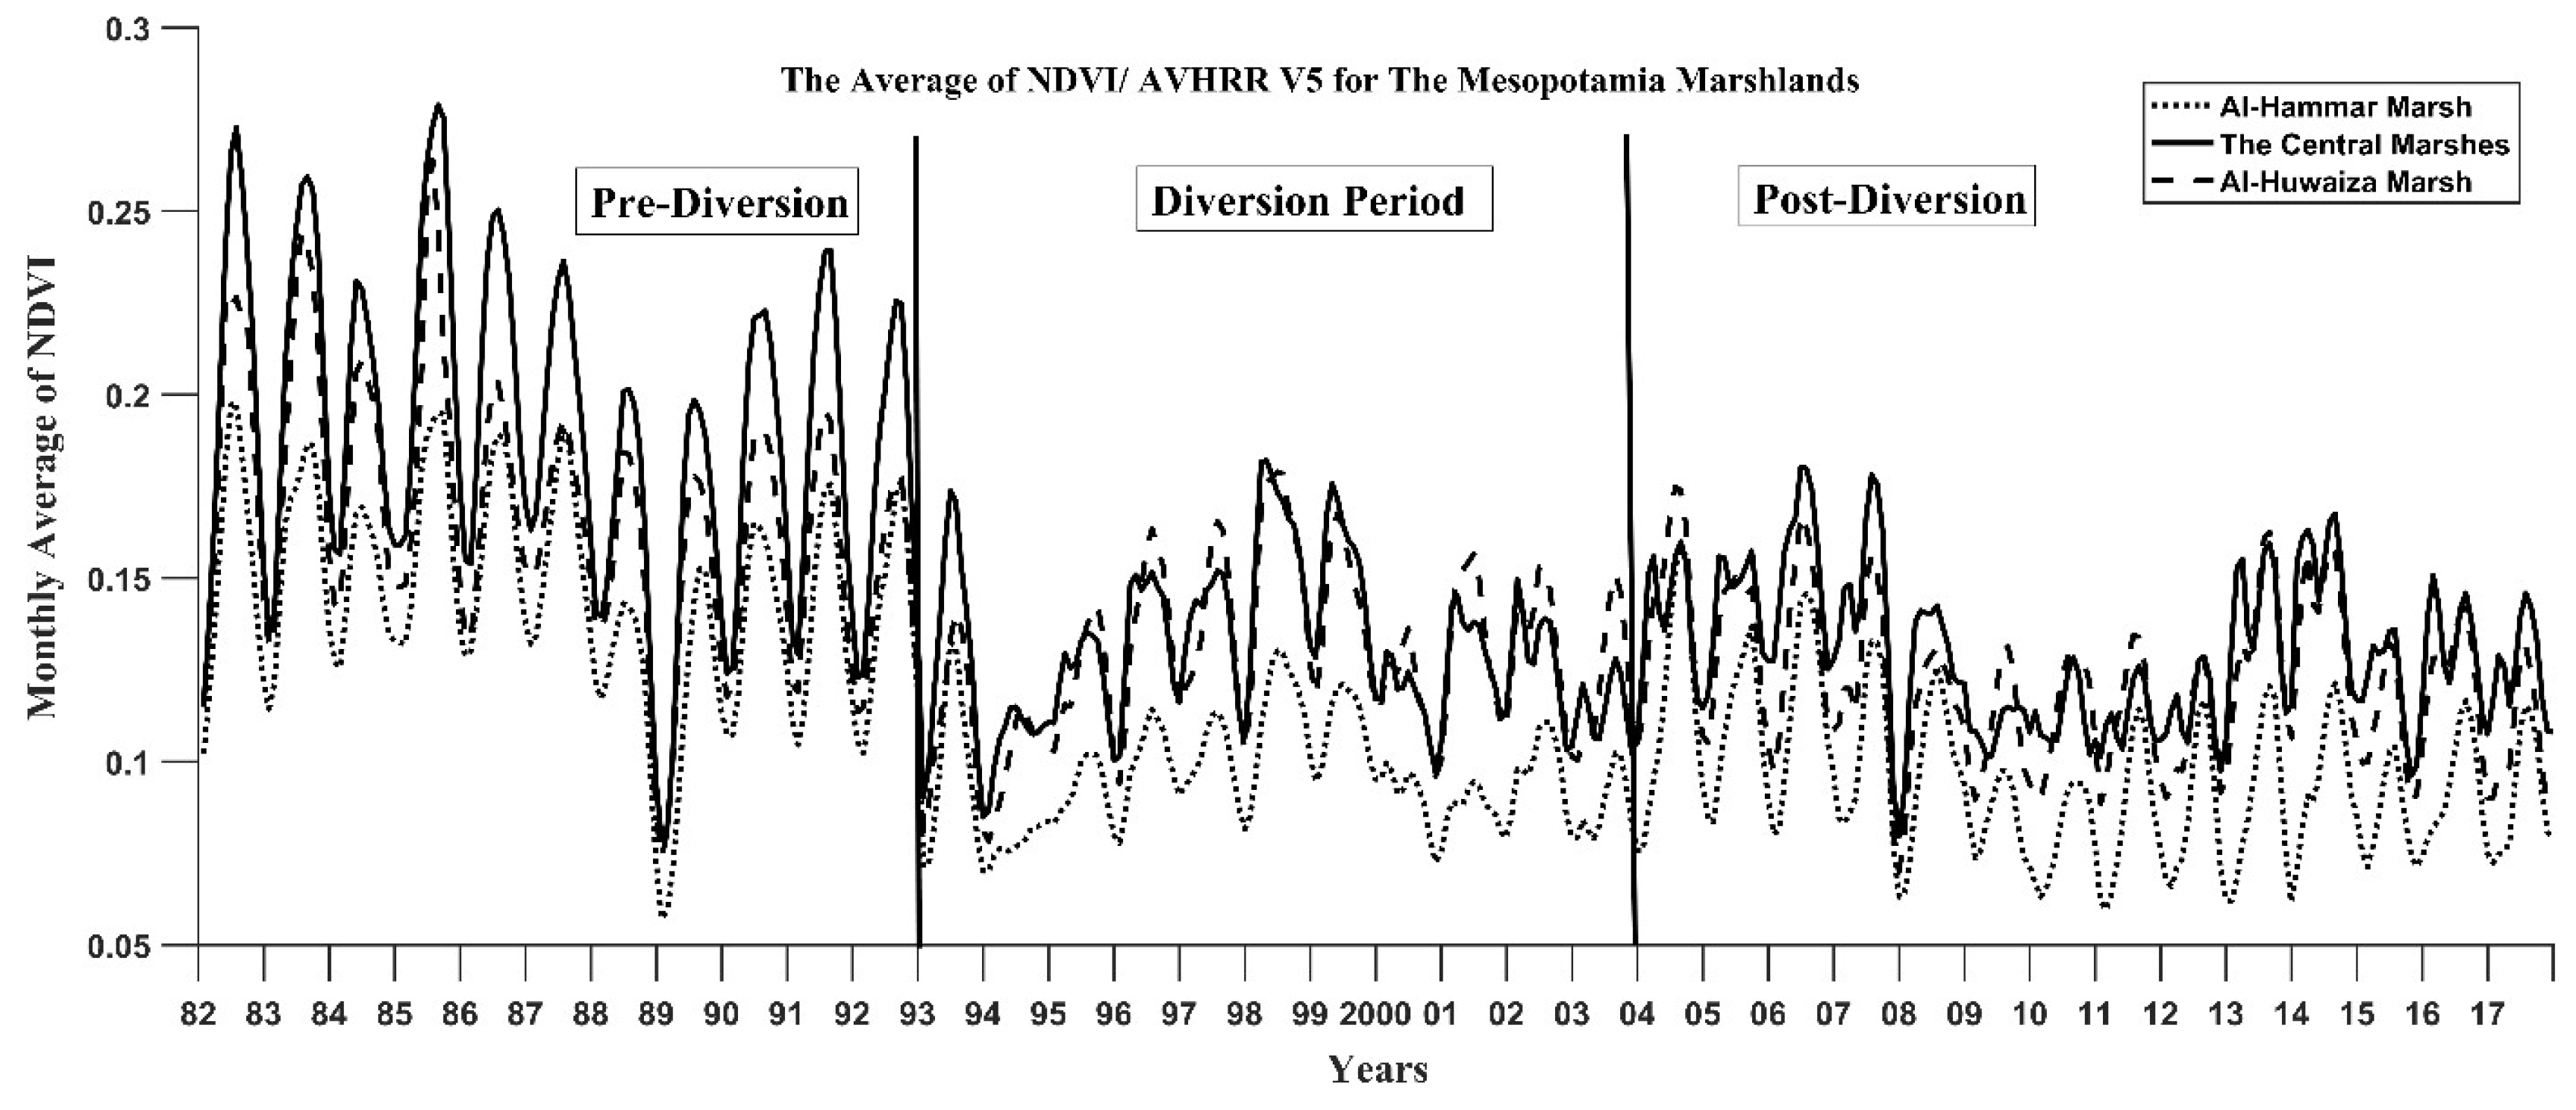
The first period for all marshes displayed high NDVI values, except for 1988 and 1989 due to the drying operations that started in the late 1980s during the Saddam regime [7,14,18,57]. The 1993–2003 period shows the lowest values of NDVI during the 1982–2017 study due to upstream dams and drying operation downstream through the marshlands [5,7,58,59]. The NDVI value for the Mesopotamian marshlands in 1994 represented the lowest NDVI value over the entire period of 36 years. The Mesopotamian marshlands had massive drainage works that were completed in the middle of 1993, creating a river called “Outflow Drain” that ran between the Tigris and Euphrates to the Persian Gulf [12,52]. The Euphrates River water was diverted into the “Outflow Drain” water away from the marshes (Al-Hammar and part of The Central marshes) [12]. In addition, other dams and channels were built on the Tigris River that feeds Al-Huwaiza and part of The Central marshes [12,14,57]. By 1994, the vegetation in the marshlands had declined significantly [57], and we saw the lowest value of NDVI during 1994.
Despite the construction of dams and canals on the Tigris and Euphrates rivers, there were some small canals from the Tigris and Euphrates rivers feeding the marshes during the diversion period [12]. The NDVI behavior slightly increased during 1996–1999 due to the increase of precipitation in upstream countries and the increase in water feeding the marshes through these small canals [5,12]. The precipitation did not affect the growth of the vegetation in the marshes due to lack of rain in Southern Iraq, where the annual average was <25 mm/year. The rainfall in arid areas is scarce, and its effectiveness is minimal due to the high rate of evaporation that leads to the loss of approximately 70–80% of the average rainfall [54]. In the 2004–2017 period, NDVI increased as a result of human activities (e.g., water supply diversions and construction of dams, in addition to local and regional precipitation) [5]. An increase in rainfall in the upstream leads to an increase in the rates of discharge, and a decrease leads to a drought disaster [14,59]. The years following the fall of the Saddam regime witnessed heavy precipitation and high snow in the Anatolian and the Zagros highlands and Iran. The snowmelt led to rising water levels in the Tigris and the Euphrates, the major source of water for the marshlands for the years 2004–2008 [5,14,59]. About 90% of the Tigris River and 80% of the Euphrates River flow into the marshes before reaching Shatt Al-Arab [60]. However, the low NDVI values from 2009 to 2017 show that most of the marshland areas received little water due to intense drought and limited water flows from upstream countries [5,14].
Long-term AVHRR/NDVI was used to detect the changes in vegetation from 1982 to 2017 in each marsh. Our study was divided into three periods: 1982–1992; 1993–2003; and 2004–2017. This division is the result of different conditions faced by the marshes. The first period was the “pre-diversion”, the second period was called “diversion”, and last period was called “post-diversion”.
The monthly time series of NDVI from 1982 to 2017 in Mesopotamia, Iraq is shown in Figure 5. On average, NDVI increased between May to August, reaching maximum in June, representing the growing season for the region (Supplement 1). Figure 5 shows the NDVI values of the Al-Hammar marsh are usually lower than the NDVI values of The Central and Al-Huwaiza marshes.

3.2. Validation of Areas of Vegetation Productivity for Each Marsh

The statistical test results (Figure 6) show that the geographic extent of significant degradation in vegetation cover is sensitive to a shift in confidence level. Due to the highly dynamic nature of human-induced degradation such as dam construction on the main rivers that are feeding the marshlands, the green biomass (NDVI) has dramatically decreased. The green biomass of Al-Hammar marsh over 36 years (1982–2017) increased 13.22% and declined 86.78%. The Central marshes showed a 1.27% increase in vegetation cover, but exhibited a significant 98.73% deterioration in the vegetation. The increase and decline in vegetation cover for the Al-Huwaiza marsh were 16.29% and 83.71%, respectively. The increase in green biomass in the Al-Huwaiza marsh was more than the other two marshlands (i.e., Al-Hammar and The Central marshes); fortunately, the middle part of this marsh remained intact. The Iranian river (Karkha River) continued feeding Al-Huwaiza marsh during the drying operations [7,14].

3.3. Standardized NDVI Anomaly (SNA) Analyses

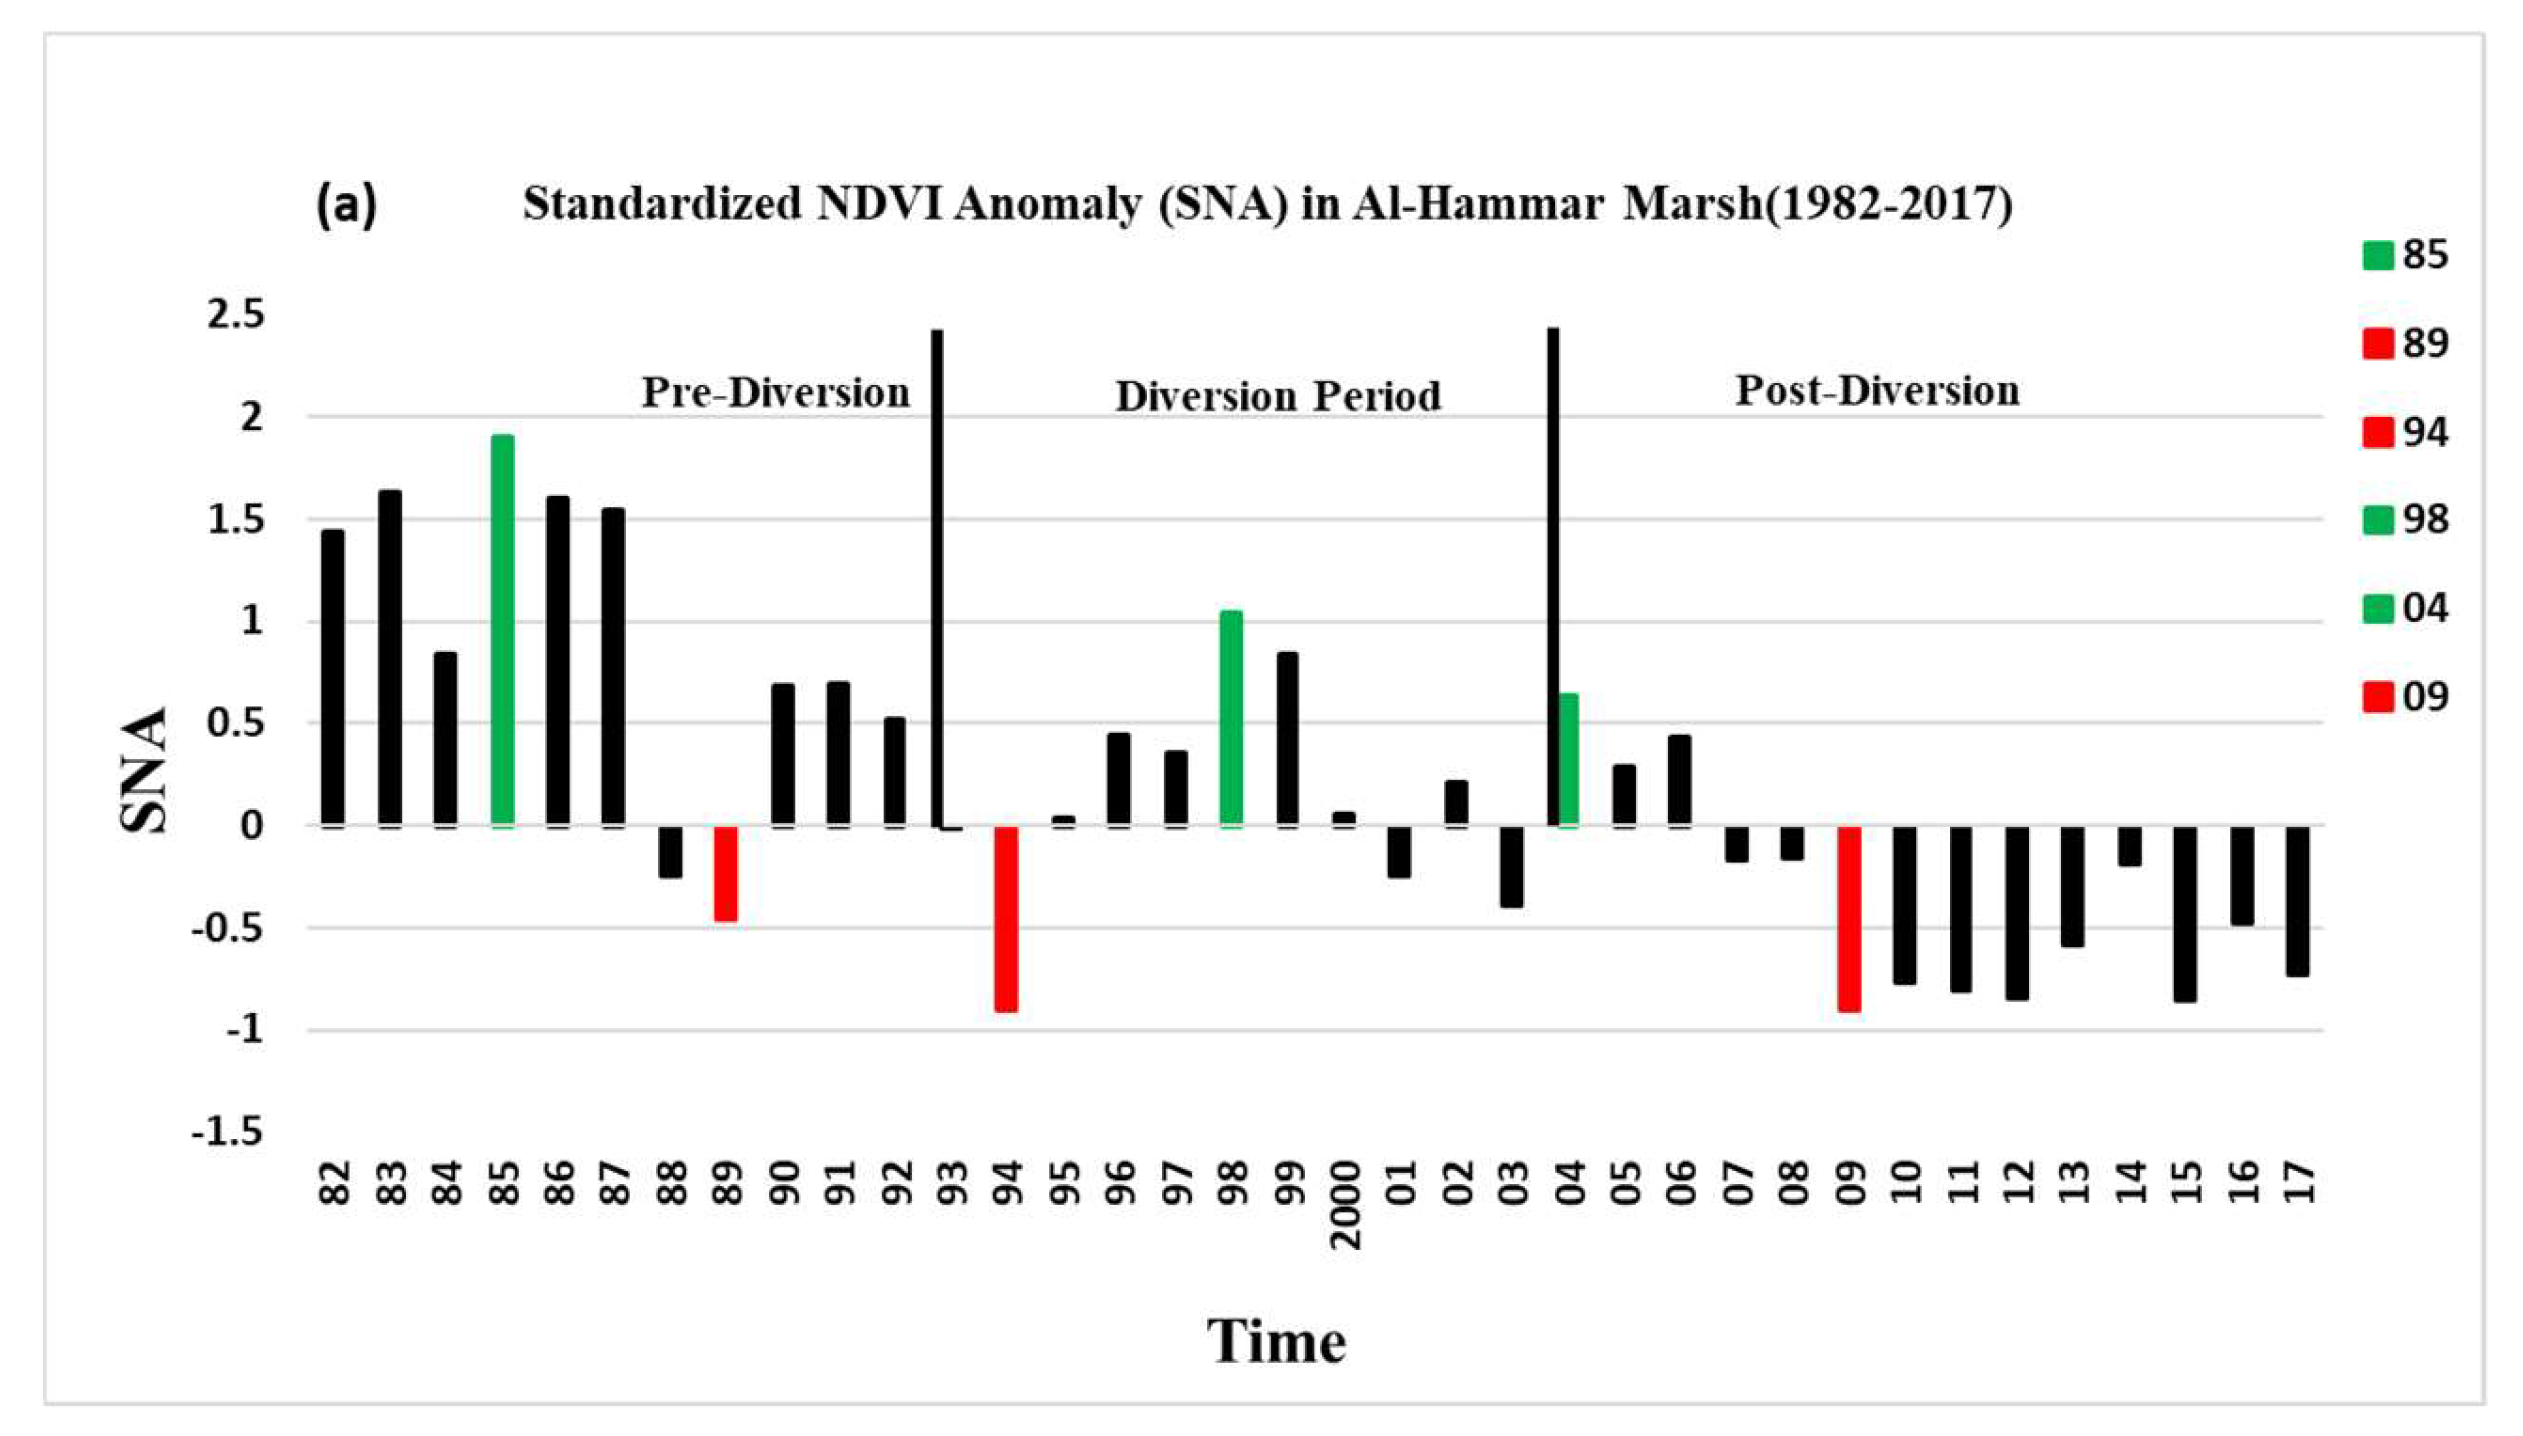
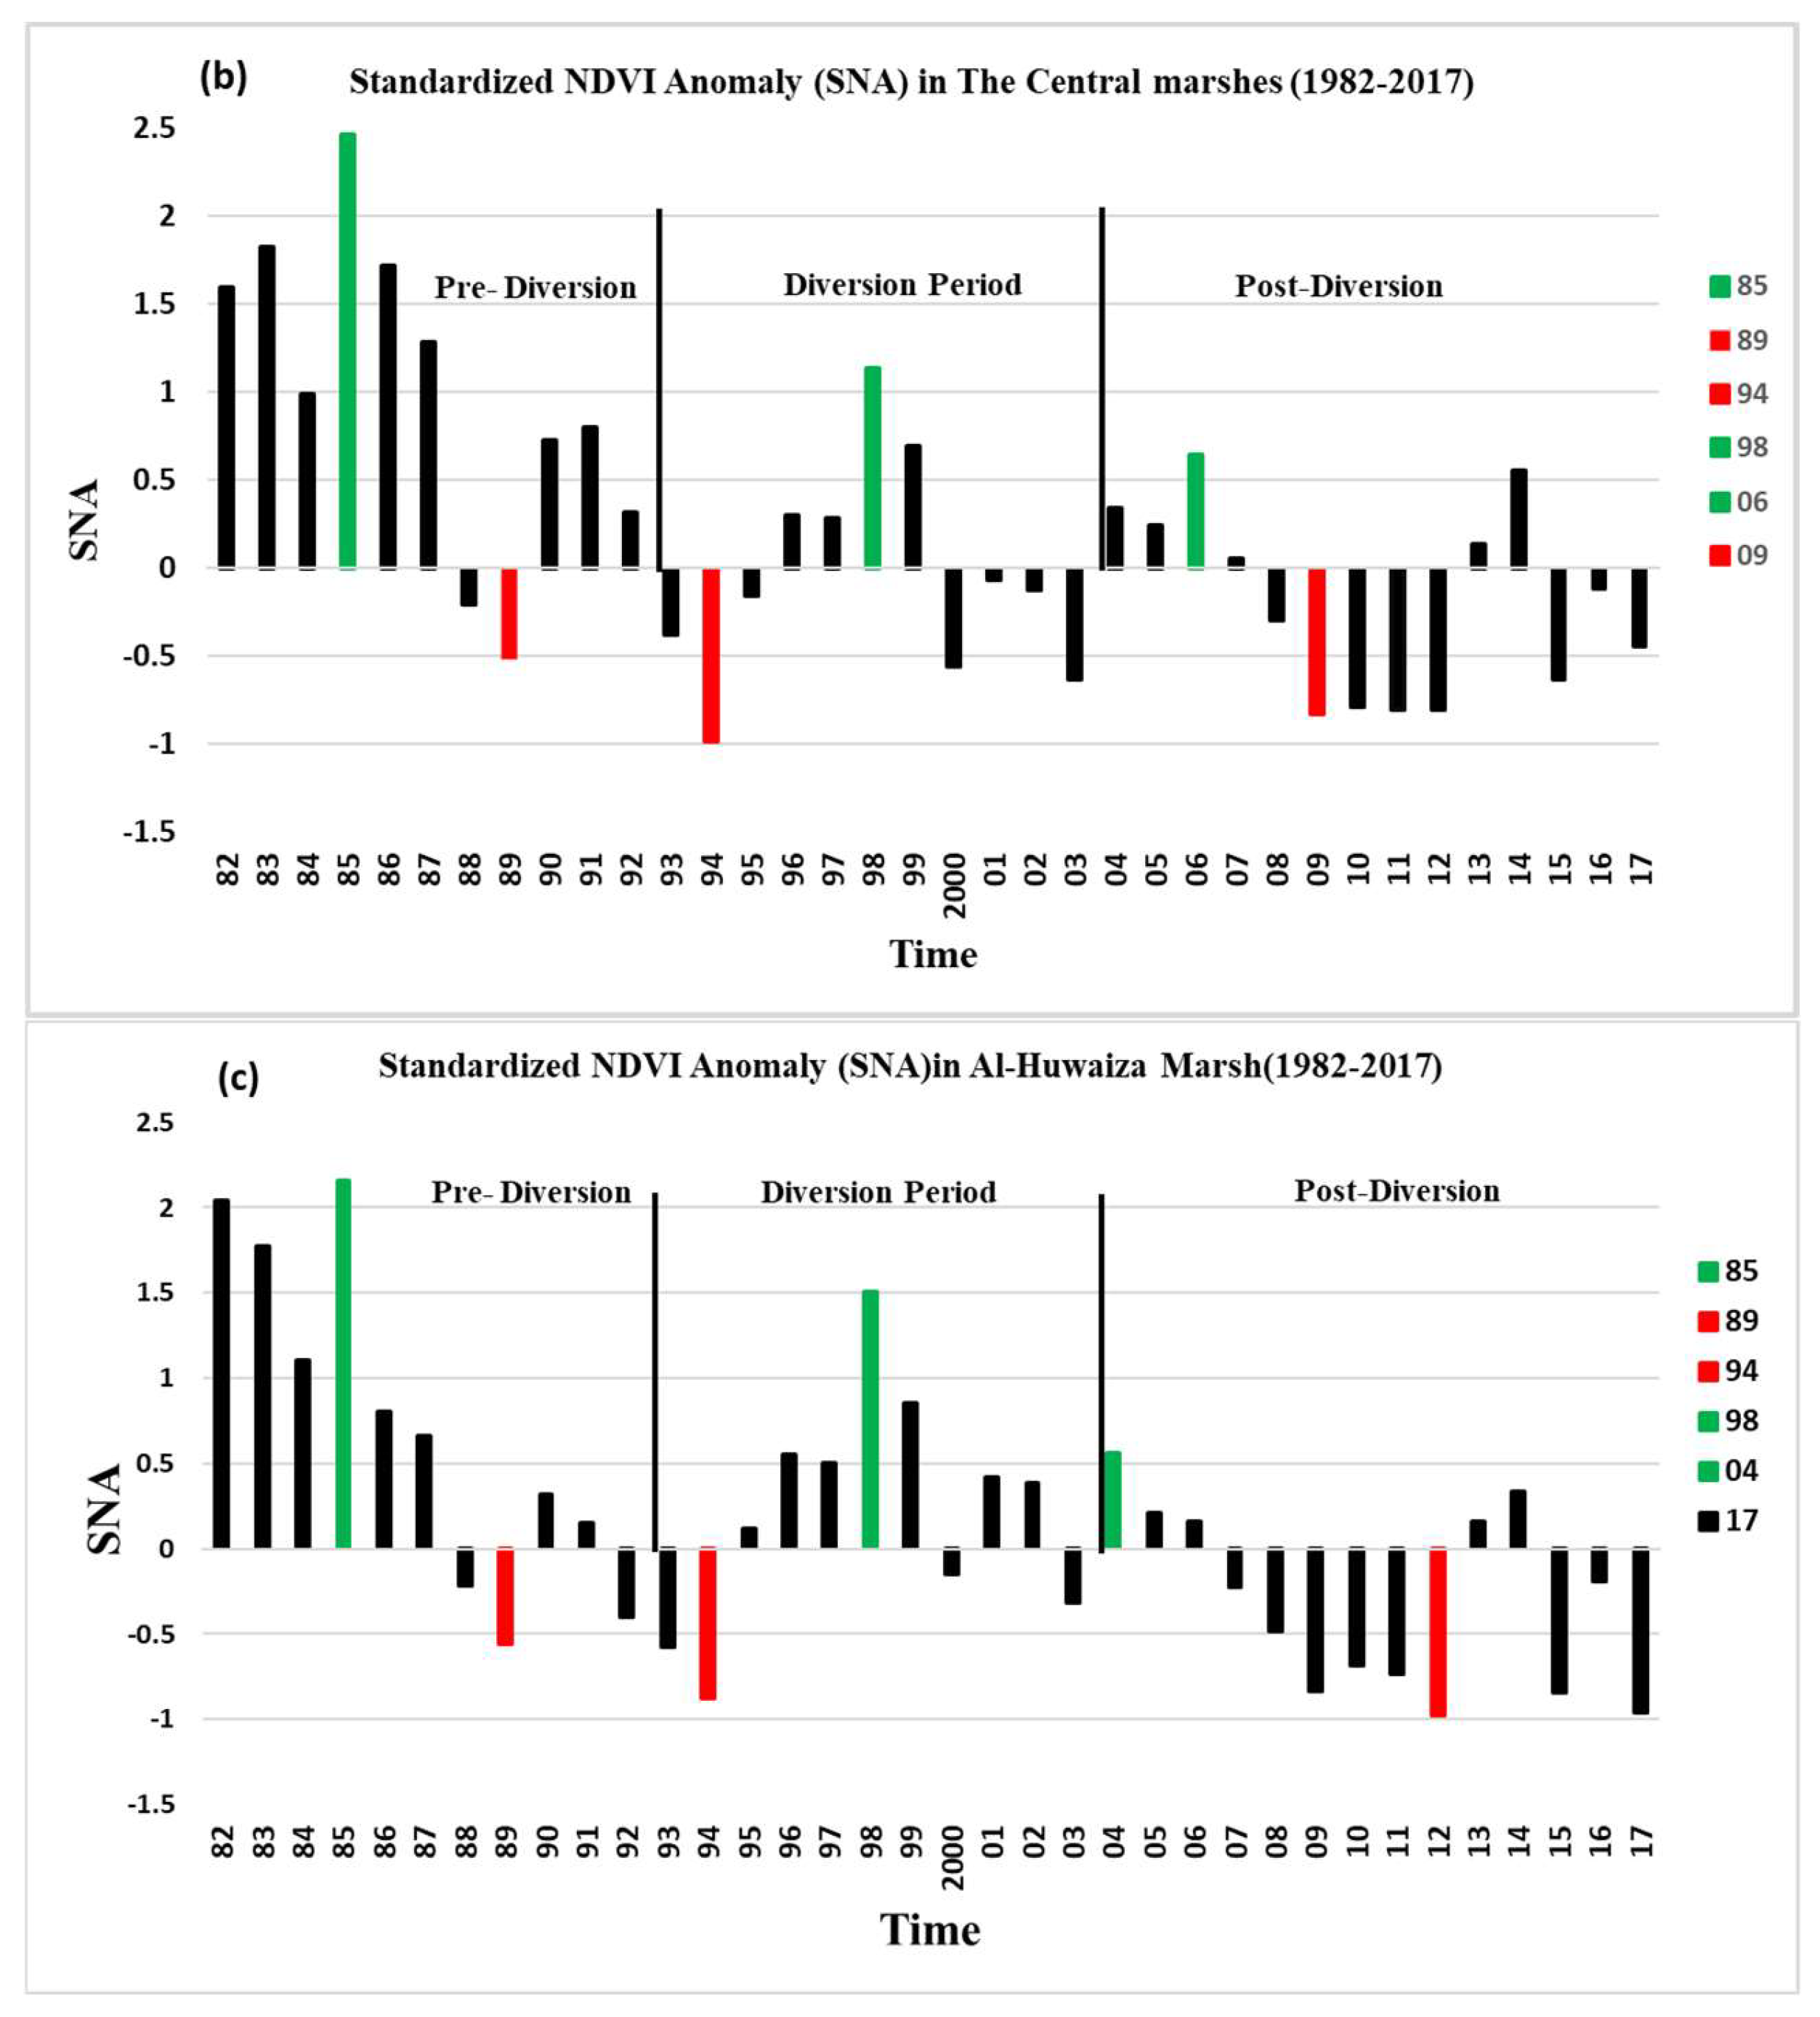
The spatial NDVI ¯ patterns in all three marshes are shown in (Figure 7). The standardization is used to transform the monthly NDVI to have zero mean and unit variance. The negative values indicate low NDVI values below normal vegetation conditions and positive values refer to NDVI values above normal vegetation conditions during the 1982–2017 period. The standardized NDVI anomaly is useful to select the highest and lowest NDVI values for each period.
In the 1982–1993 period of Figure 7a for the Al-Hammar marsh, 18.2% of the years had below-normal NDVI conditions, the largest departure in NDVI occurred in 1989, 82.8% of the marsh showed above-normal NDVI conditions, and the highest NDVI was in 1985. In the second 1993–2004 period, we observed 36.4% of the years had below-normal NDVI values, the lowest value was observed in 1994, 63.6% above-normal yearly NDVI values occurred, and the highest value occurred in 1998. In the 2004–2017 period in Figure 7a, 78.5% of the years had below-normal vegetation conditions, the lowest value was in 2009, only 21.5% of the years had above-normal vegetation conditions, and the highest value was in 2004.
In Figure 7b for The Central marshes, the 1982–1993 period shows 18.2% of the years had negative values or below-normal NDVI conditions, 1989 showed the lowest NDVI, 82.8% of the years had above-normal NDVI conditions, and the highest value was in 1985. The 1993–2003 period had 63.7% of the years with below-normal NDVI conditions, the lowest value was in 1994, 36.3% of the years had above normal vegetation, and the highest value was shown in 1998. In the third period, 57.1% of the time had negative values, which were below normal vegetation conditions, and the lowest value was in 2009, and 42.9% of the years had above-normal NDVI conditions, and the highest value was in 2004.
Figure 7c for the Al-Huwaiza marsh showed for the 1982–1992 period only 27.2% of the years had below-normal NDVI conditions, the lowest value was in 1989, 72.8% of the years had high NDVI conditions, and the highest value was in 1985. The 1993–2003 period showed NDVI negative departures 36.4% of the time, the lowest value was in 1994. 63.6% had the high conditions, and the highest value was in 1985. In the third period (2004–2017), 64.3% of the years had negative standardized NDVI, the lowest value was in 2009 and 2017, 35.7% of the years had above-normal NDVI conditions, and the highest value was in 2004.

3.4. Spatial Patterns

The SNA in Mesopotamian marshlands was used to select the positive and negative years of AVHRR/NDVI anomaly patterns. As we pointed out previously, the highest biomass was observed during the month of June in 1982–1992, 1993–2003, and 2004–2017 periods. For each period in the three marshes, we displayed two maps that represent the highest and lowest NDVI (Figure 8). The spatial resolution of the 5 km AVHRR imagery was spatially-improved using Landsat 30 m data, combining time-series data information with ~2.8 × 10⁴ more detailed Landsat spatial resolutions at specific times. These series of AVHRR/NDVI and classified maps show the quantified annual changes through the time-series in both vegetation and water in each marsh.
Before 1985, the Mesopotamian marshes were characterized by good environmental conditions and were in a natural state without human intervention. We can see the proper correspondence between the classified vegetation in the Landsat images and the high NDVI (higher than 0.18) for the central part of all the three marshes for June 1985. During the ordinarily high biomass season in 1989, the imagery shows low NDVI values and decreased expansion of water in all marshes, due to the beginning of the drying operation on the downstream of the Tigris and Euphrates rivers from the late 1980s until 2003 [7,14,18,57].
Comparing the Landsat and AVHRR maps, we observed the vegetation classified areas of Landsat decreased by 50% and a corresponding NDVI decreased from ~0.3 in June 1985 to 0.16 and lower in June 1989. In 1994, the monthly average AVHRR/NDVI had the lowest value through the 1982–2017 study period and classified maps of the Al-Hammar and The Central marshes exhibited significant deterioration in the vegetation and water bodies that underwent a massive water diversion [12,14,57], as a result of the completion of water control projects of dams and water canals that diverted water from the Tigris and Euphrates rivers away from the marshes. The areas classified as vegetation decreased significantly in both the Al-Hammar and The Central marshes, and the corresponding values of NDVI for these areas was less than 0.15. The proportion of the deterioration in the vegetation and the expansion of water of the Al-Huwaiza marsh was less than other marshes due to the continued feeding of the Karkha River that flows from Iran into the Al-Hammar marsh [11,57,61]. The vegetation-classified areas had an NDVI of 0.18 in the AVHRR maps. The classified and AVHRR/NDVI maps of 1998 showed few increases in NDVI and water body expansion because some small canals from the Tigris and Euphrates rivers were built [12], and there was an increase in precipitation.
The classified and AVHRR/NDVI maps of 2004 and 2009 represented the highest and lowest of NDVI through the 2004–2017 period of post-diversion. It is worth mentioning that the Mesopotamian marshlands experienced re-flooding in mid-2003 after the fall of Saddam’s regime, due to the return of marsh dwellers, who destroyed many of the canals and dams that had been built [12,15]. The year of 2004 showed an increase in both the vegetation and water areas in Al-Hammar and Al-Huwaiza marshes. The Central marshes also showed an increase in vegetation and water areas that began in 2004 during the 2004–2017 post-diversion period. In 2009, however, the NDVI ¯ shows below-normal NDVI conditions, and the classified maps showed a reduction in the spatial expansion of water and an increase in barren areas. The drought in 2008–2009 in the upstream countries of Turkey and Syria coupled with reduced runoff from Iran, led to shrinkage in the Mesopotamian marshlands almost back to the levels of the diversion period [14,62]. By the late spring of 2009, unmistakably a considerable lot of the territories that were re-overflowed have received little water because of an extreme dry spell, confinements of water spill out of neighboring nations, and the maintenance of streams in the north by the Ministry of Water Resources in Iraq. This shows that the eventual fate of the marshlands is stuck in an unfortunate situation because of an absence of water, particularly in dry season years [14,55,63].
Table 4 shows the percentage area of each class in each marsh, as compared to the total area over the time-series. The changes in the coverage areas were distinguished from 1985 to 2009. It is obvious that there were decreases in the area of water during 1985–2009 of about −6%, −1%, and −9% for Al-Hammar, The Central marshes, and Al-Huwaiza, respectively. The NDVI also decreased during 1985–2009 and was around −30%, −48%, and −16% for Al-Hammar, The Central marshes, and Al-Huwaiza, respectively. The percentage growth of the vegetation area from AVHRR/NDVI was −21.5%, −48%, and −16% for the Al-Hammar, the Central, and Al-Huwaiza marshes, respectively. We observed that the percent of vegetated areas also decreased.
The AVHRR and thematic mapper instruments data have considerable differences in spatial resolution and temporal resolution. However, as a result of the decrease in both water extent and vegetation, this has led to a drastic increase in the barren areas during 1985–2017. The barren area has increased 36%, 49%, and 25% for Al-Hammar, The Central marshes, and Al-Huwaiza, respectively. It is worth mentioning that the Mesopotamian marshlands saw increases in the water and vegetation areas in 2004 with a decrease in the barren area as a result of flooding that year.

3.5. Ancillary Data Analysis

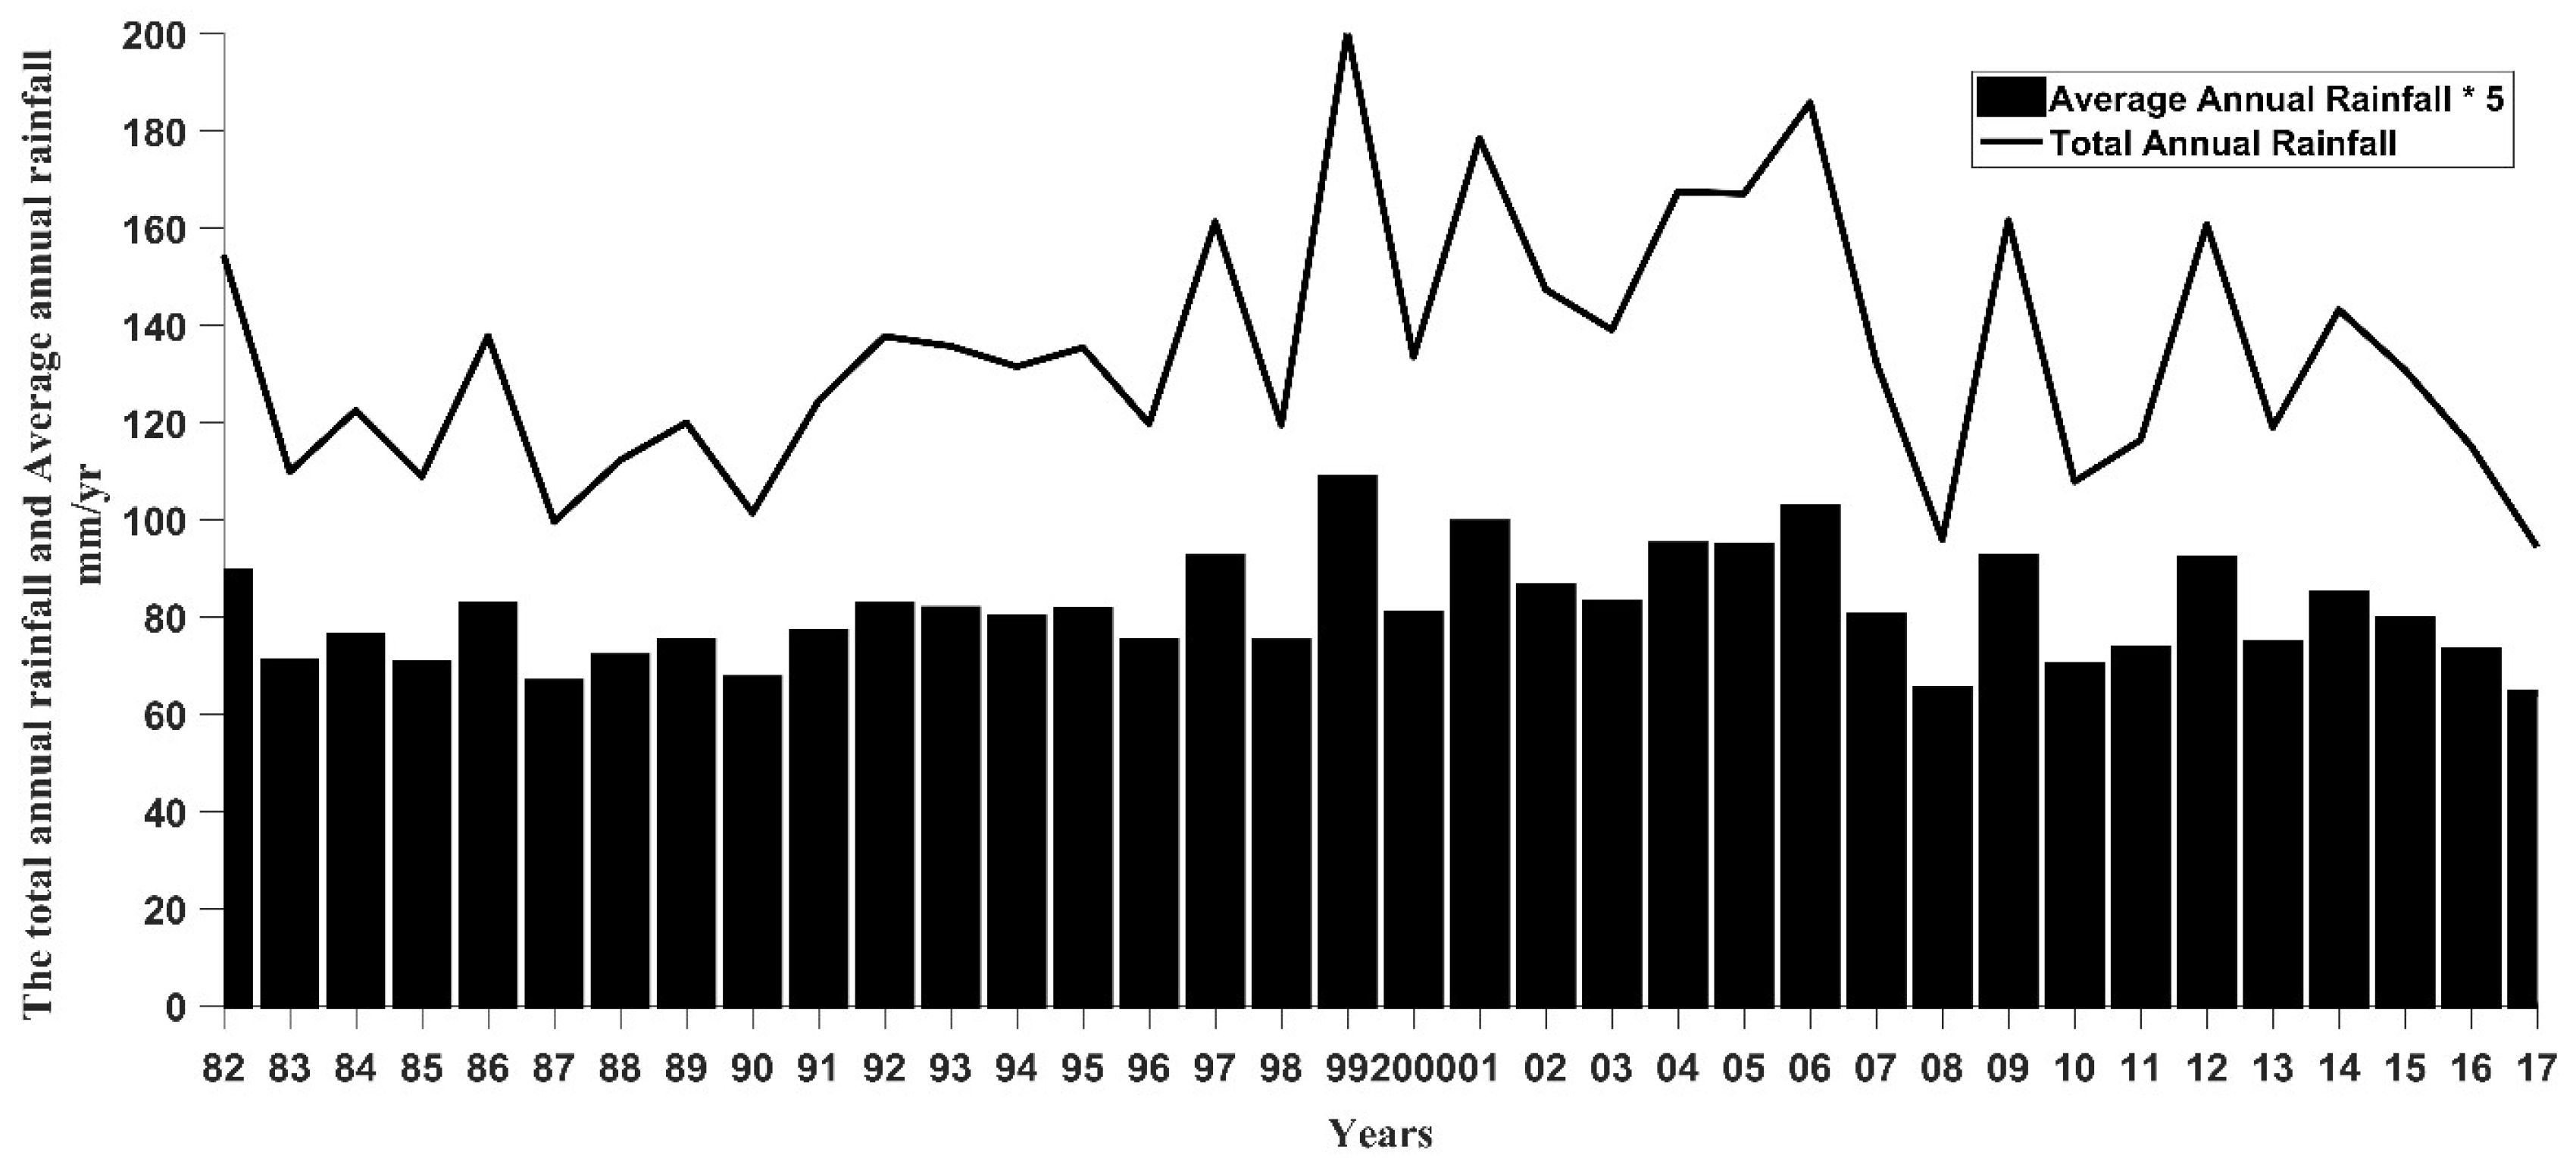
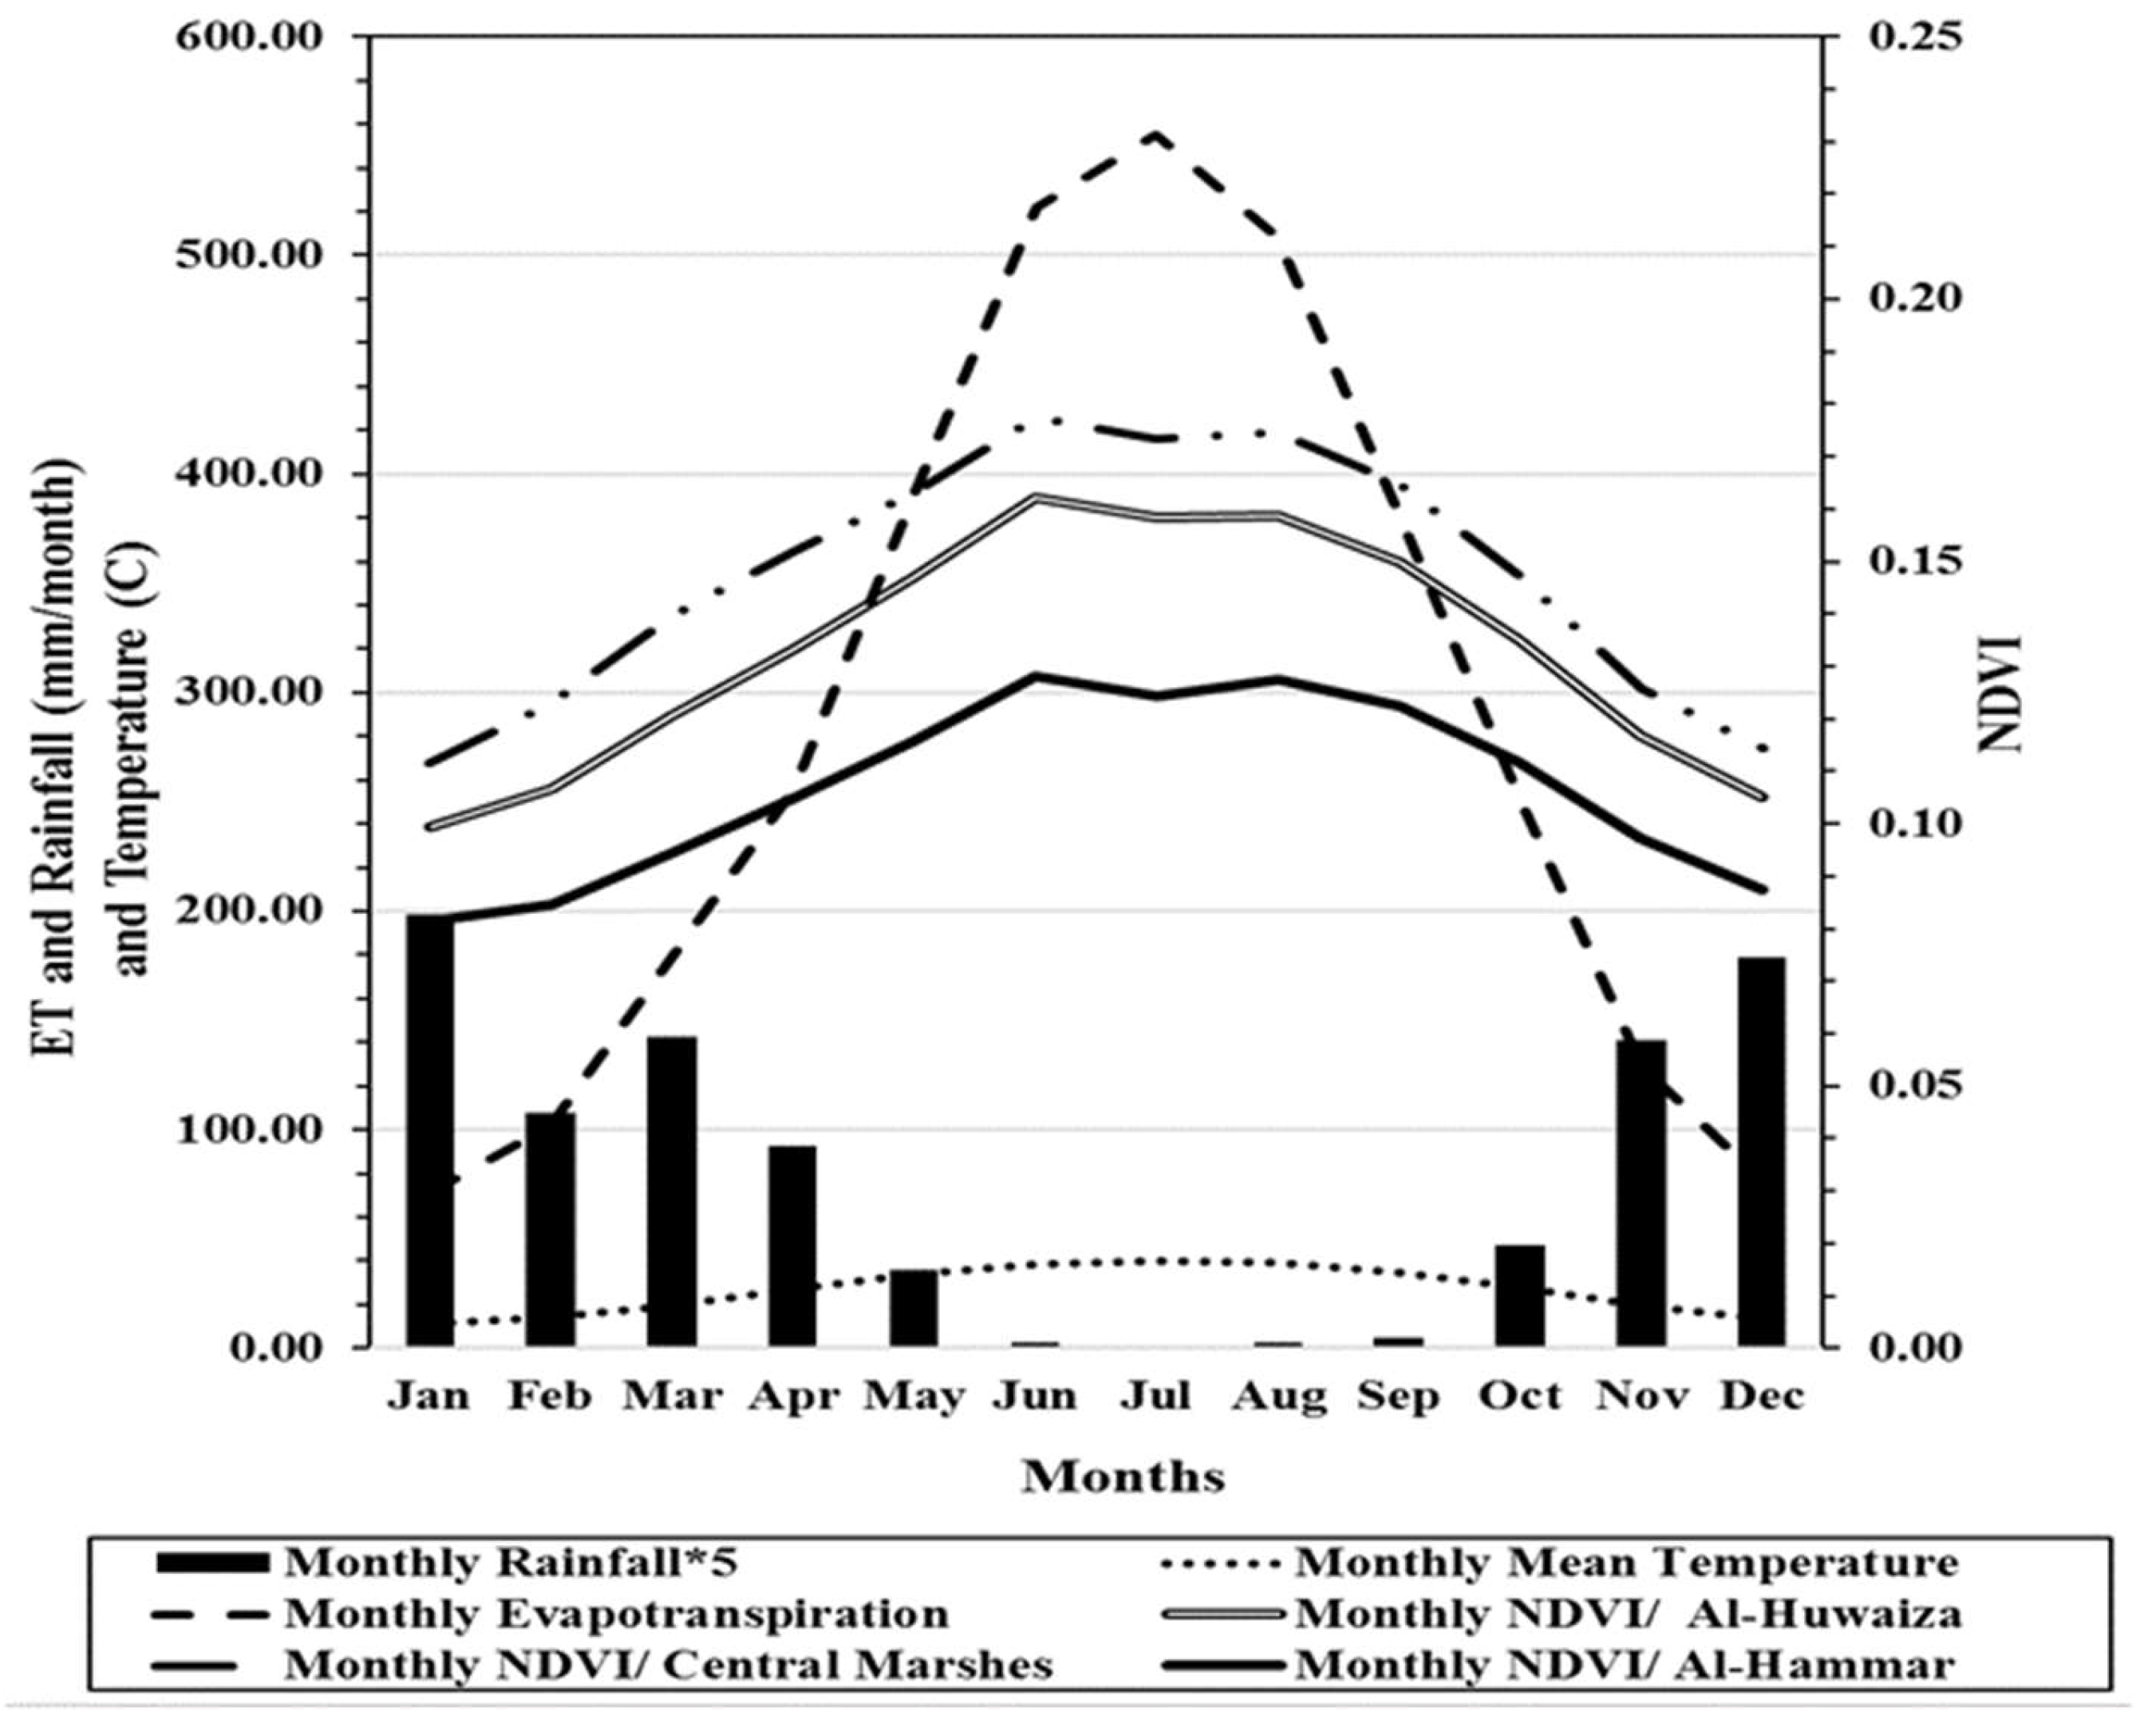
Precipitation in the Mesopotamian marshland region is insufficient to support marsh vegetation [54]. Based on field observations from 1982–1997, the total annual regional precipitation did not exceed 200 mm (Figure 9). Furthermore, most of the precipitation in the marsh region is during November, December, January, and February, and is reduced to a significant degree during April, and is non-existent during the summer season [64]. There is no apparent relationship between precipitation and NDVI (Figure 10). According to GLDAS data for 1982–2017, the lowest temperatures are during the winter season and the highest temperatures are during the summer season; thus, monthly ET has the highest values during summer and the lowest in winter (Figure 10). The high monthly average ET during summer is due to the abundance of water in the Tigris and Euphrates rivers, the high temperature, and high wind speed that keeps the air unsaturated [65,66]. The monthly average mean temperature and wind speed during summer are ~40 °C and 4.5 to 5 m/s, respectively.
Supplement 3 illustrates the correlation for each marsh between monthly ET and monthly mean NDVI. There is a moderate negative correlation between precipitation and NDVI. The primary water resource for the growth of the marshes’ vegetation are the Tigris, Euphrates, Karkha, and Karoon rivers, and 90% of the Tigris and Euphrates rivers flow into the Mesopotamian marshlands [60]. The NDVI behavior and other variables in all marshlands showed clear seasonality during the time-series; the peak NDVI and vegetation growth coincided with peak ET and highest air temperature during June, July, and August; and the ET and lowest air temperature occured in January and December.

4. Discussion and Conclusions

The AVHRR/NDVI observations provided a time-series from 1982 to 2017 for the three marshes and quantified environmental changes that determined vegetation and hydrology. Three time periods were observed for 1982–1992, 1993–2003, and 2004–2017 which were distinct and characterized the environmental and anthropogenic conditions that affected the marshes. The values of the standardized NDVI anomalies were used to quantify photosynthetic capacity in the marshlands. The classification of land cover using Landsat images quantified the spatial and temporal changes in vegetated areas, water extent, and barren areas for each marsh. The classified maps of Al-Hammar, The Central, and Al-Huwaiza marshes showed that the Mesopotamian marshlands suffered profound anthropogenic changes starting in the late 1980s and continued into the early 2000s. Rehabilitation of the marshes began in 2004 when the marshes saw an increase in water and vegetation and a decrease in barren areas. However, this increase did not continue through 2004–2017. In 2009, the marshes suffered significant negative changes, approximately back to 1994 conditions, due to the drought in 2009 in the upstream countries of Turkey and Syria, coupled with reduced runoff from Iran that led to shrinkage in all three marshes [14,62,63]. The area of barren land has continuously and dramatically increased, and we note the very significant deterioration suffered by these unusual and unique marshes over the 36 years analyzed in this paper. The statistical analyses showed the percentage of increases and decreases in NDVI for the three marshlands. The percentages of increases in NDVI were 13.22%, 1.27%, and 16.29% for Al-Hammar, The Central, and Al-Huwaiza marshes, respectively; while the decreases in NDVI were 86.78%, 98.73%, and 83.71% for Al-Hammar, The Central, and Al-Huwaiza marshes, respectively. These percentages illustrate the intensity of the decline in the vegetation coverage area over 36 years (1982–2017). The degradation of vegetation was due to the statistically significant negative trend in mean annual discharge of the Tigris and Euphrates rivers. The annual discharge of the Tigris declined from ~2500–3000 m3/s to ~500 m3/s. The annual discharge of the Euphrates River declined from ~1500 m3/s to less than 500 m3/s. Unfortunately, the dominant reason for the Mesopotamian marshes’ worsening environmental conditions were destructive human activities. The shrinking water supplies taken by Iraq’s regional neighbors (i.e., Turkey, Syria, and Iran) have had the greatest impact on water levels. Iraq’s water system is facing difficult challenges, raising concerns that the Mesopotamian marshlands which have sustained the region for more than 5000 thousand years may soon disappear.

Author Contributions

Conceptualization, R.A., V.L. and C.J.T.; Data curation, R.A. and V.L.; Formal analysis, R.A.; Investigation, V.L. and C.J.T.; Methodology, R.A. and V.L.; Resources, R.A. and V.L.; Software, R.A.; Supervision, V.R.; Validation, R.A. and V.L.; Writing—original draft, R.A.; Writing—review & editing, R.A., V.L. and C.J.T.

Funding

This research received no external funding.

Acknowledgments

We would like to thank Iliana E. Mladenova for her constructive comments as well as Jennifer Pournelle and Inass Almallah for facilitating the task of getting field observation data. This research would not have been possible without NASA. We are extremely thankful to NASA’s Goddard Space Flight Center for providing valuable long-term data such as AVHRR.

Conflicts of Interest

The authors declare no conflict of interest.

References

  1. Maxwell, G. People of the Reeds; ASIN: B0007DMCTC; Harper: New York, NY, USA, 1957; 223p. [Google Scholar]
  2. Young, G. Return to the Marshes: Life with the Marsh Arabs of Iraq; Collins: London, UK, 1977; 224p, ISBN 9780571280971. [Google Scholar]
  3. Tiner, R.W.; Lang, M.W.; Klemas, V.V. Remote Sensing of Wetlands: Applications and Advances, 1st ed.; CRC Press and Taylor and Francis Group: Boca Raton, FL, USA, 2015; 555p, ISBN 9781482237351. [Google Scholar]
  4. Al-Handal, A.; Hu, C. Modis observations of human-induced changes in the mesopotamian marshes in iraq. Wetlands 2015, 35, 31–40. [Google Scholar] [CrossRef]
  5. Mohamed, A.-R.M.; Hussain, N. Evaluation of fish assemblage environment in huwazah marsh, iraq using integrated biological index. Int. J. Curr. Res. 2014, 6, 6124–6129. [Google Scholar]
  6. Erwin, K.L. Wetlands and global climate change: The role of wetland restoration in a changing world. Wetl. Ecol. Manag. 2009, 17, 71. [Google Scholar] [CrossRef]
  7. Partow, H. The Mesopotamian Marshlands: Demise of an Ecosystem. Nairobi (Kenya): Division of Early Warning and Assessment, United Nations Environment Programme; UNEP Publication: Nairobi, Kenya, 2001. [Google Scholar]
  8. Lubinski, B.J.; Jackson, J.R.; Eggleton, M.A. Relationships between floodplain lake fish communities and environmental variables in a large river-floodplain ecosystem. Trans. Am. Fish Soc. 2008, 137, 895–908. [Google Scholar] [CrossRef]
  9. CIMI (Canada-Iraq Marshlands Initiative). Managing for Change: The Present and Future State of the Marshes of Southern Iraq; University of Victoria: Victoria, British Columbia, UK; Canada and Canadian International Development Agency: Gatineau, QC, Canada, 2010. [Google Scholar]
  10. Douabul, A.A.Z.; Al-Saad, H.T.; Abdullah, D.S.; Salman, N.A. Designated protected Marsh within Mesopotamia: Water quality. Am. J. Water Resour. 2013, 1, 39–44. [Google Scholar]
  11. Maltby, E. An Environmental and Ecological Study of the Marshlands of Mesopotamia Wetland Ecosystem; AMAR Appeal Trust; University of Exeter: London, UK, 1994. [Google Scholar]
  12. Vinez, M.; Leonard, S. The Iraq Marshlands: The Loss of the Garden of Eden and Its People; PLSI No. 3443; Illinois State University: Normal, IL, USA, 2010. [Google Scholar]
  13. Brasington, J. Monitoring marshland degradation using multispectral remote sensed imagery. In the Iraqi Marshlands: A Human and Environmental Study; Nicholson, E., Clark, P., Eds.; Politico’s: London, UK, 2002; pp. 151–168. [Google Scholar]
  14. Richardson, C.J. The Status of Mesopotamian Marsh Restoration in Iraq: A Case Study of Transboundary Water Issues and Internal Water Allocation Problems; Towards New Solutions in Managing Environmental Crisis; University of Helsinki: Helsinki, Finland.
  15. Fitzpatrick, R.W. Changes in Soil and Water Characteristics of Natural, Drained and Re-Flooded Soils in the Mesopotamian Marshlands: Implications for Land Management Planning; Client Report; CSIRO Land and Water: Canberra, Australia, 2004. [Google Scholar]
  16. Richardson, C.J.; Reiss, P.; Hussain, N.A.; Alwash, A.J.; Pool, D.J. The restoration potential of the Mesopotamian marshes of Iraq. Science 2005, 307, 1307–1311. [Google Scholar] [CrossRef] [PubMed]
  17. Yacoub, S.; Roffa, S.; Tawfiq, J. Geology Al-Amara—Al-Nasiriya—Al-Basrah Area; GEOSURV Int. Rep. No. 1386; GEOSURV: Baghdad, Iraq, 1985. [Google Scholar]
  18. Al-Hilli, M.R.; Warner, B.G.; Asada, T.; Douabul, A. An assessment of vegetation and environmental controls in the 1970s of the Mesopotamian wetlands of southern Iraq. Wetl. Ecol. Manag. 2009, 17, 207. [Google Scholar] [CrossRef]
  19. Shehab, A.T.; Al-Ma’amar, A.F.; Jabbar, M.F.A. Change detections in marsh areas, south Iraq, using remote sensing and GIS applications. Iraqi Bull. Geol. Min. 2010, 6, 17–39. [Google Scholar]
  20. Hamdan, M.; Asada, T.; Hassan, F.; Warner, B.; Douabul, A.; Al-Hilli, M.; Alwan, A. Vegetation response to re-flooding in the Mesopotamian wetlands, southern Iraq. Wetlands 2010, 30, 177–188. [Google Scholar] [CrossRef]
  21. Saleh, S.A. Studying of the environmental changes in marsh area using Landsat satellite images. J. Asian Sci. Res. 2012, 2, 427. [Google Scholar]
  22. Peltier, L.C. The geographic cycle in periglacial regions as it is related to climatic geomorphology. Ann. Assoc. Am. Geogr. 1950, 40, 214–236. [Google Scholar] [CrossRef]
  23. Fookes, P.G.; Dearman, W.R.; Franklin, J.A. Some engineering aspects of rock weathering with field examples from dartmoor and elsewhere. Q. J. Eng. Geol. Hydrogeol. 1971, 4, 139–185. [Google Scholar] [CrossRef]
  24. Alwash, A.; Alwash, S.; Cattarossi, A. Iraq’s marshlands-demise and the impending rebirth of an ecosystem. In Critical Transitions in Water and Environmental Resources Management; World Water and Environmental Resources Congress: Salt Lake City, Utah, USA, 2004; pp. 1–9. [Google Scholar]
  25. Seto, K.C.; Woodcock, C.; Song, C.; Huang, X.; Lu, J.; Kaufmann, R. Monitoring land-use change in the pearl river delta using landsat tm. Int. J. Remote Sens. 2002, 23, 1985–2004. [Google Scholar] [CrossRef]
  26. Rogan, J.; Franklin, J.; Roberts, D.A. A comparison of methods for monitoring multitemporal vegetation change using thematic mapper imagery. Remote Sens. Environ. 2002, 80, 143–156. [Google Scholar] [CrossRef]
  27. Finlayson, C.; Davidson, N.; Spiers, A.; Stevenson, N. Global wetland inventory—Current status and future priorities. Mar. Freshw. Res. 1999, 50, 717–727. [Google Scholar] [CrossRef]
  28. Ozesmi, S.L.; Bauer, M.E. Satellite remote sensing of wetlands. Wetlands Ecol. Manag. 2002, 10, 381–402. [Google Scholar] [CrossRef]
  29. Tucker, C.J. Red and photographic infrared linear combinations for monitoring vegetation. Remote Sens. Environ. 1979, 8, 127–150. [Google Scholar] [CrossRef] [Green Version]
  30. Higginbottom, T.P.; Symeonakis, E. Assessing land degradation and desertification using vegetation index data: Current frameworks and future directions. Remote Sens. 2014, 6, 9552–9575. [Google Scholar] [CrossRef]
  31. Guo, X.; Zhang, H.; Wu, Z.; Zhao, J.; Zhang, Z. Comparison and evaluation of annual NDVI time series in china derived from the NOAA AVHRR LTDR and terra MODIS mod13c1 products. Sensors 2017, 17, 1298. [Google Scholar]
  32. El Saleous, N.; Vermote, E.; Justice, C.; Townshend, J.; Tucker, C.; Goward, S. Improvements in the global biospheric record from the advanced very high resolution radiometer (AVHRR). Int. J. Remote Sens. 2000, 21, 1251–1277. [Google Scholar] [CrossRef]
  33. Pedelty, J.; Devadiga, S.; Masuoka, E.; Brown, M.; Pinzon, J.; Tucker, C.; Vermote, E.; Prince, S.; Nagol, J.; Justice, C. Generating a long-term land data record from the avhrr and modis instruments. In Proceedings of the 2007 IEEE International Geoscience and Remote Sensing Symposium, Barcelona, Spain, 23–28 July 2007; pp. 1021–1025. [Google Scholar]
  34. Vermote, E. Climate Algorithm Theoretical Basis Document (C-ATBD): AVHRR Land Bundle-Surface Reflectance and Normalized Difference Vegetation Index. 2013.f3. Available online: https://www.ncdc.noaa. gov (accessed on 20 September 2018).
  35. Moreno Ruiz, J.A.; Riaño, D.; Arbelo, M.; French, N.H.F.; Ustin, S.L.; Whiting, M.L. Burned area mapping time series in Canada (1984–1999) from NOAA-AVHRR LTDR: A comparison with other remote sensing products and fire perimeters. Remote Sens. Environ. 2012, 117, 407–414. [Google Scholar] [CrossRef]
  36. Ruiz, J.A.M.; Lázaro, J.R.G.; Cano, I.D.Á.; Leal, P.H. Burned area mapping in the north American boreal forest using Terra-MODIS LTDR (2001–2011): A comparison with the mcd45a1, mcd64a1 and ba geoland-2 products. Remote Sens. 2014, 6, 815–840. [Google Scholar] [CrossRef]
  37. Ghulam, A.; Kasimu, A.; Kusky, T. In Normalization of modified perpendicular drought index using ltdr and gimms dataset for drought assessment in the united states. In Proceedings of the IGARSS 2008–2008 IEEE International Geoscience and Remote Sensing Symposium, Boston, MA, USA, 7–11 July 2008; pp. III-856–III-859. [Google Scholar]
  38. Zhang, X. Reconstruction of a complete global time series of daily vegetation index trajectory from long-term avhrr data. Remote Sens. Environ. 2015, 156, 457–472. [Google Scholar] [CrossRef]
  39. Holben, B.N. Characteristics of maximum-value composite images from temporal avhrr data. Int. J. Remote Sens. 1986, 7, 1417–1434. [Google Scholar] [CrossRef]
  40. Sellers, P.J. Canopy reflectance, photosynthesis and transpiration. Int. J. Remote Sens. 1985, 6, 1335–1372. [Google Scholar] [CrossRef] [Green Version]
  41. Rodell, M.; Houser, P.; Jambor, U.; Gottschalck, J.; Mitchell, K.; Meng, C.-J.; Arsenault, K.; Cosgrove, B.; Radakovich, J.; Bosilovich, M. The global land data assimilation system. Bull. Am. Meteorol. Soc. 2004, 85, 381–394. [Google Scholar] [CrossRef]
  42. Lunetta, R.; Lyons, J. Geospatial Data Accuracy Assessment; No. EPA/600/R-03/064; US Environmental Protection Agency: Las Vegas, NV, USA, 2003.
  43. Townshend, J.R.; Justice, C.O. Towards operational monitoring of terrestrial systems by moderate-resolution remote sensing. Remote Sens. Environ. 2002, 83, 351–359. [Google Scholar] [CrossRef]
  44. Lakshmi, V. The role of satellite remote sensing in the prediction of ungauged basins. Hydrol. Processes 2004, 18, 1029–1034. [Google Scholar] [CrossRef]
  45. Fang, B.; Lakshmi, V. Soil moisture at watershed scale: Remote sensing techniques. J. Hydrol. 2014, 516, 258–272. [Google Scholar] [CrossRef]
  46. Lakshmi, V. Beyond grace: Using satellite data for groundwater investigations. Ground Water 2016, 54, 615–618. [Google Scholar] [CrossRef] [PubMed]
  47. Narumalani, S.; Mishra, D.R.; Rothwell, R.G. Analyzing landscape structural change using image interpretation and spatial pattern metrics. GISci. Remote Sens. 2004, 41, 25–44. [Google Scholar] [CrossRef]
  48. Jensen, J.R. Introductory Digital Image Processing: A Remote Sensing Perspective, 3rd ed.; Prentice Hall: Upper Saddle River, NJ, USA, 2005; pp. 337–342. ISBN 0131453610. [Google Scholar]
  49. Campbell, J.B. Introduction to Remote Sensing, 4th ed.; The Guilford Press: New York, NY, USA, 2007; 625p, ISBN 9781593853198. [Google Scholar]
  50. Vlek, P.L.; Le, Q.B.; Tamene, L. Assessment of land degradation, its possible causes and threat to food security in Sub-Saharan Africa. In Food Security and Soil Quality; CRC Press: Boca Raton, FL, USA, 2010; pp. 57–86. [Google Scholar]
  51. Le, Q.B.; Tamene, L.; Vlek, P.L. Multi-pronged assessment of land degradation in west africa to assess the importance of atmospheric fertilization in masking the processes involved. Glob. Planet. Chang. 2012, 92, 71–81. [Google Scholar] [CrossRef]
  52. Altinbilek, D. Development and management of the Euphrates–Tigris basin. Int. J. Water Resour. Dev. 2004, 20, 15–33. [Google Scholar] [CrossRef]
  53. Issa, I.E.; Al-Ansari, N.; Sherwany, G.; Knutsson, S. Expected future of water resources within the Tigris–Euphrates rivers basin, Iraq. J. Water Resour. Prot. 2014, 6, 421–432. [Google Scholar] [CrossRef]
  54. Chapagain, A.K.; Hoekstra, A.Y. Water Footprints of Nations; Value of Water Research Report Series No.30; IHE No.16; UNESCO: Paris, France, 2004. [Google Scholar]
  55. ASIA, I.W. Euphrates River Basin. In Inventory of Shared Water Resources in Western Asia. Beirut; UN, ESCWA: Beirut, Lebanon, 2013. [Google Scholar]
  56. Holmes, K. Annual precipitation in the river basin for (Iraq, Turkey, Iran, and Syria), Scale 1:5,300,000. Tigris and Euphrates River Basin Map. 2010. Available online: http://hdl.handle.net/1828/2397 (accessed on 22 September 2018).
  57. Munro, D.; Touron, H. The estimation of marshland degradation in southern Iraq using multitemporal landsat tm images. Int. J. Remote Sens. 1997, 18, 1597–1606. [Google Scholar] [CrossRef]
  58. Jema, W.S. Social-Ecological Assessment Framework for the Restoration of the Iraqi Mesopotamian Marshlands; Royal Roads University: Victoria, BC, Canada, 2015. [Google Scholar]
  59. Richardson, C.J.; Hussain, N.A. Restoring the garden of Eden: An ecological assessment of the marshes of iraq. AIBS Bull. 2006, 56, 477–489. [Google Scholar] [CrossRef]
  60. Al-Lami, H. Hyrdochemical and Sedimentological Study of the Northwestern Part of Hor al-Huwizah, Misan Governorate, South of Iraq. Unpub. Master’s Thesis, University of Baghdad, Baghdad, Iraq, 2008. (In Arabic). [Google Scholar]
  61. Muhsin, I.J. Al-hawizeh marsh monitoring method using remotely sensed images. Iraqi J. Sci. 2011, 52, 381–387. [Google Scholar]
  62. Al-Ansari, N.; Knutsson, S.; Ali, A. Restoring the Garden of Eden, Iraq. J. Earth Sci. Geotech. Eng. 2012, 2, 53–88. [Google Scholar]
  63. Hameed, M.; Ahmadalipour, A.; Moradkhani, H. Apprehensive drought characteristics over Iraq: Results of a multidecadal spatiotemporal assessment. Geosciences 2018, 8, 58. [Google Scholar] [CrossRef]
  64. Pollock, S. Ancient Mesopotamia; Cambridge University Press: Cambridge, UK, 1999; 272p, ISBN 0521573343. [Google Scholar]
  65. Allen, R.G.; Pereira, L.S.; Raes, D.; Smith, M. Guidelines for computing crop water requirements-FAO Irrigation and drainage paper 56; FAO-Food and Agriculture Organization of the United Nations, Rome (http://www. fao. org/docrep). ARPAV (2000), La caratterizzazione climatica della Regione Veneto, Quaderni per. Geophysics 1998, 156, 178. [Google Scholar]
  66. Buringh, P. Soils and Soil Conditions in Iraq; ASIN: B0006BTMJS; Ministry of Agriculture: Baghdad, Iraq, 1960; 322p.
Figure 1. The Mesopotamia marshes in the Southern part of Iraq, the Tigris and Euphrates rivers, and the Iraq/Iran boundary.
Remotesensing 10 01524 g001
Figure 2. The location of weather stations in the study area.
Remotesensing 10 01524 g002
Figure 3. Mosaicked Landsat images of the study areas during June of 1985, 1989, 1994, 1998, 2004, and 2009. Landsat MSS, TM and ETM+ (Path 166 and Rows 38 and 39) were used. Path and Row represent the coordinates of scenes. The Landsat path 166 and row 38 is located at center latitude 31°44′17.52′′N and center longitude 47°44′49.27′′E. Path 166 and row 39 is located at center latitude 30°18′07.16′′N and center longitude 47°21′57.17′′E.
Remotesensing 10 01524 g003
Figure 4. The annual discharge (m3/s) of the Tigris and Euphrates rivers (The Ministry of Water Resources, Iraq).
Remotesensing 10 01524 g004
Figure 5. Monthly averages of the daily AVHRR/NDVI data for the three marshes.
Remotesensing 10 01524 g005
Figure 6. (A) Linear slope of annual NDVI for the period of 1982–2017 showing long-term trends of green biomass change in (a) Al-Hammar, (b) The Central and (c) Al-Huwaiza marshes. (B) Pixel-based significance of linear slope over the period 1982–2017 for (a) Al-Hammar, (b) The Central and (c) Al-Huwaiza marshes.
Remotesensing 10 01524 g006
Figure 7. Standardized NDVI Anomaly (SNA) in Mesopotamian marshlands. Iraq (1982–2017). Green color shows the years with the highest positive value during the specific period and red denotes the lowest value.
Remotesensing 10 01524 g007aRemotesensing 10 01524 g007b
Figure 8. (a) Al-Hammar, (b) The Central, and (c) Al-Huwaiza marshes showing the comparison between the classified maps of Landsat images (in the upper row) and maps of AVHRR/NDVI.
Remotesensing 10 01524 g008aRemotesensing 10 01524 g008b
Figure 9. The total annual rainfall and the average annual rainfall from field observations (mm/year) (1982–2017).
Remotesensing 10 01524 g009
Figure 10. The monthly average rainfall from field observations during 1982–2017, GLDAS/monthly mean temperature °C during 1982–2017, and monthly ET mm/month of field observations during 1982–2015 of Al-Hammar, The Central, and Al-Huwaiza marshes.
Remotesensing 10 01524 g010
Table 1. The main marshes in the southern part of Iraq with their area and water supply.
MarshArea in (km2)Water Supply
The Al-Hammar3000–4000The Euphrates River
The Central marshes3000–4000The Tigris and Euphrates rivers
The Al-Huwaiza3000–3500The Tigris and Karkheh rivers
Table 2. Data used in the present study.
Sensor/ModelVariableSpatial ResolutionTemporal ResolutionCoverage
AVHRR 1NDVI 20.05°Monthly1981–present
GLDAS 3Surface Temperature1.0°Monthly1979–present
Field Data
www.meteoseism.gov.iq
Evapotranspiration and Precipitation3 SitesMonthly1982–2015 and 1982–2017
Field Observations
The Ministry of Water Resources, Iraq.
www.mowr.gov.iq
Annual Discharge of the Tigris and Euphrates rivers Yearly1982–2017
1 Advanced Very High Resolution. 2 Normalized Difference Vegetation Index. 3 Global Land Data Assimilation System.
Table 3. Error matrix of the classification map of the Al-Hammar marsh extrapolated from the Landsat Multispectral Scanner data from 1985.
Reference Points
ClassWaterVegetationBarrenRow Total
Water390039
Classified DataVegetation139040
Barren014041
Column Total404040120
Overall Accuracy = 118/120 = 98%
Producer’s Accuracy (omission error)
Water = 39/40 = 98% 2% omission error
Vegetation = 39/40 = 98% 2% omission error
Barren = 40/40 = 100% 0% omission error
User’s Accuracy (commission error)
Water = 39/40 = 98% 2% commission error
Vegetation = 40/40 = 100% 0% commission error
Barren = 40/41 = 98% 2% commission error
Table 4. Summary statistics of the supervised classification for classes in each marsh and vegetation areas from AVHRR/NDVI maps of Mesopotamian marshlands.
Percentage of Water Area
TimeAl-HammarThe Central marshesAl-Huwaiza
198513313
198917411
19945210
1998838
200410515
2009724
Percentage change %−6−1−9
Percentage of vegetation area from classified Landsat images
TimeAl-HammarThe Central marshesAl-Huwaiza
1985465839
1989183032
199461121
1998222238
2004402530
2009161023
Percentage change %−30−48−16
Percentage of vegetation area from AVHRR/NDVI
TimeAl-HammarThe Central marshesAl-Huwaiza
198533.35150
198920.23334
19942218
199879.835
20042028.541
200911.8929
Percentage change %−21.5−48−16
Percentage of barren area
TimeAl-HammarThe Central marshesAl-Huwaiza
1985413948
1989656668
1994898757
1998707655
2004517355
2009778873
Percentage change %364925