Development of Operational Applications for TerraSAR-X
by
Oliver Lang
1,*, 
Parivash Lumsdon
2,
Diana Walter
1,
Jan Anderssohn
1,
Wolfgang Koppe
2,
Jüergen Janoth
2,
Tamer Koban
3 and
Christoph Stahl
3 1
Airbus Defence and Space GmbH, Platz der Einheit 14, 14467 Potsdam, Germany
2
Airbus Defence and Space GmbH, Claude-Dornier Straße, 88090 Immenstaad, Germany
3
Airbus Defence and Space GmbH, Rechliner Str., 85077 Manching, Germany
*
Author to whom correspondence should be addressed.
Remote Sens. 2018, 10(10), 1535; https://doi.org/10.3390/rs10101535
Submission received: 30 June 2018
/
Revised: 7 September 2018
/
Accepted: 11 September 2018
/
Published: 25 September 2018
(This article belongs to the Special Issue Ten Years of TerraSAR-X—Scientific Results)
Abstract
:In the course of the TerraSAR-X mission, various new applications based on X-Band Synthetic Aperture Radar (SAR) data have been developed and made available as operational products or services. In this article, we elaborate on proven characteristics of TerraSAR-X that are responsible for development of operational applications. This article is written from the perspective of a commercial data and service provider and the focus is on the following applications with high commercial relevance, and varying operational maturity levels: Surface Movement Monitoring (SMM), Ground Control Point (GCP) extraction and Automatic Target Recognition (ATR). Based on these applications, the article highlights the successful transition of innovative research into sustainable and operational use within various market segments. TerraSAR-X’s high orbit accuracy, its precise radar beam tracing, the high-resolution modes, and high-quality radiometric performance have proven to be the instrument’s advanced characteristics, through, which reliable ground control points and surface movement measurements are obtained. Moreover, TerraSAR-X high-resolution data has been widely exploited for the clarity of its target signatures in the fields of target intelligence and identification. TerraSAR-X’s multi temporal interferometry applications are non-invasive and are now fully standardised autonomous tools to measure surface deformation. In particular, multi-baseline interferometric techniques, such as Persistent Scatter Interferometry (PSI) and Small Baseline Subsets (SBAS) benefit from TerraSAR-X’s highly precise orbit information and phase stability. Similarly, the instrument’s precise orbit information is responsible for sub-metre accuracy of Ground Control Points (GCPs), which are essential inputs for orthorectification of remote sensing imagery, to locate targets, and to precisely georeference a variety of datasets. While geolocation accuracy is an essential ingredient in the intelligence field, high-resolution TerraSAR-X data, particularly in Staring SpotLight mode has been widely used in surveillance, security and reconnaissance applications in real-time and also by automatic or assisted target recognition software.
1. Introduction
Designed for a five years operation, the German Synthetic Aperture Radar (SAR) satellite TerraSAR-X has already achieved ten years of flawless operation in orbit providing high-resolution radar images in all weather conditions 24 h per day. Developed and constructed by Airbus Defence and Space in Friedrichshafen, Germany for the German Aerospace Center (DLR), the satellite orbits at a height of 514 km above Earth and provides radar imagery to a wide variety of scientific and commercial users. To date, TerraSAR-X has not only doubled its service lifetime, but also boasts 99.9% availability, at an outstanding performance. TerraSAR-X is in full health so that a current assessment indicates that it can be operated for a few more years in space until a follow-on system is in place.
With a user driven end-to-end system design, TerraSAR-X has successfully carried out its scientific and commercial data exploitation commitments through DLR’s large science phase outreach and Airbus’s industrial partnership. TerraSAR-X has paved the way for its national focus on a sustainable SAR technology strategy, in addition to disseminating know-how and exploring new paths for the next generation of high performance SAR Systems based on advanced features (High Resolution Wide Swath (HRWS), digital beamforming).
As a parallel mission, TerraSAR-X has been a source of data sharing continuity of earth observation projects through the European Space Agency’s Copernicus programme, and other international space organisations. In this respect, TerraSAR-X data has been extensively applied to five main thematic areas of land, marine, atmosphere, emergency, and security.
Since the launch of its almost identical twin TanDEM-X (TerraSAR-X add-on for Digital Elevation Measurement) in 2010, both satellites have been flying in a formation at a distance only a few hundred metres apart. Together, they have acquired a large amount of data, which provides the basis for the new global elevation model, WorldDEM. TerraSAR-X and TanDEM-X offer a high repeat rate, irrespective of the area of interest (AOI) or weather conditions. This is crucial in the case of natural or manmade disasters, where reactive mapping is needed to support situation awareness and rescue planning. Following the launch of the PAZ (peace in Spanish), satellite in February 2018, into the same orbit, the three satellites are now operating as a constellation to deliver even higher revisit times, increased spatial coverage and thus improved services. Airbus Defence and Space is now working on next generation Synthetic Aperture Radar satellites as the follow-on to the TerraSAR-X family triplets from 2022.
TerraSAR-X features a unique geometric accuracy and offers flexible area coverage and spatial resolution ranging from 0.25 m to 40.0 m. This answers the needs of a wide range of application domains, such as engineering companies who ensure safe operation of large construction projects, oil and gas enterprises that monitor remote production sites, or intelligence and security agencies that carry out targeted surveillance and detailed change detection of site activities.
The article aims to highlight the successful transition of innovative research into a sustainable and operational use within a commercial framework. The qualities of the TerraSAR-X mission and its setup as dual-use (scientific and commercial) mission perfectly demonstrates that basic research and methodological evolution can lead to relevant information for various industry segments and administrative bodies. In the following sections the methods employed for implementation of three operational applications are outlined. The applications are selected, since they all share a high commercial relevance, but they vary with respect to their operational maturity level. Thus, they reflect the typical transition steps from a scientific into a commercial context.
These operational services include Surface Movement Monitoring, an operational and mature application that is relevant, for example, for civil engineering projects and transport maintenance. Secondly, we discuss precise Ground Control Points, which are useful within the automotive and aeronautics sector. The application is well established, but shall be lifted to the next evolution level by leveraging cutting-edge research findings. Finally, we present an Automatic Target Recognition approach, which is at a medium operational maturity level. Research in machine learning is used to optimise the application’s performance. The achievable performance of each application in accordance with the satellite’s systematic and processing characteristics is described.
2. Applications and Methods
2.1. Surface Movement Monitoring (SMM)
2.1.1. Overview
SAR-interferometric (InSAR) surface deformation monitoring has gained an increasing interest and acceptance in the commercial market. Several operational aspects are addressed by this technique complementing and even replacing successively terrestrial surveillance approaches. Surface movements induced by manmade activities, such as infrastructure constructions, excavations and underground engineering, or natural disasters (e.g., landslides) can be unexpected and far-reaching, and may endanger infrastructure and even human lives. Satellites monitor wide-area surface movements, as well as single structure displacements [1,2] at regular intervals. They can help to understand the nature of ground instabilities and formulate an adequate response. They may also provide input data into simulation models to better evaluate risks of future surface movements.
The start of the TerraSAR-X mission in 2007 was a significant milestone, which helped to establish products and geo-information services based on Earth remote sensing sources on a global scale. In particular, Multi Baseline Interferometric Techniques (such as Persistent Scatter Interferometry (PSI) [3], and Small Baseline Subsets (SBAS) [4]) profit from a precisely defined satellite orbit tube and precise absolute orbit information. The sensor’s high-resolution of up to 0.25 m × 1.0 m allows for monitoring of infrastructure elements (e.g., single buildings) on a large scale. In urban regions, a density of 100,000 valid measurement points per square kilometre is typically exceeded. This high level of detail in combination with complementary geospatial information, e.g., municipal building footprints, provides added value to a broad range of applications. The aggregation of a significant number of individual measurements at respective points and the link to relevant object dimensions (e.g., buildings) does not only reduce the number of single measurement points, but also improves data handling and validity levels for specific problems, in particular for non-expert users. The value-added geospatial information can be disseminated in a user friendly way, e.g., on a web platform. The way in which information is provided is crucial for a widespread acceptance of the technique and consequently the use by decision makers in industry and public authorities. High-resolution surface movement products based on TerraSAR-X synergistically complement small scale information layers, such as the German Surface Movement Service (Bodenbewegungsdienst Deutschland BBD [5]).
The following case study demonstrates the capacity of TerraSAR-X showing a relevant operational use case in an active mining area. The use of TerraSAR-X helps determine relatively dynamic movements, but also identifies phenomena of a slower movement rate; quick and frequent situation updates are achieved in an 11-day repeat cycle, cloudless long-term observation allow for the assessment of slowly ongoing or historic situations. The end-user profits from a high density of information.
2.1.2. TerraSAR-X Surface Movement Monitoring Case Study
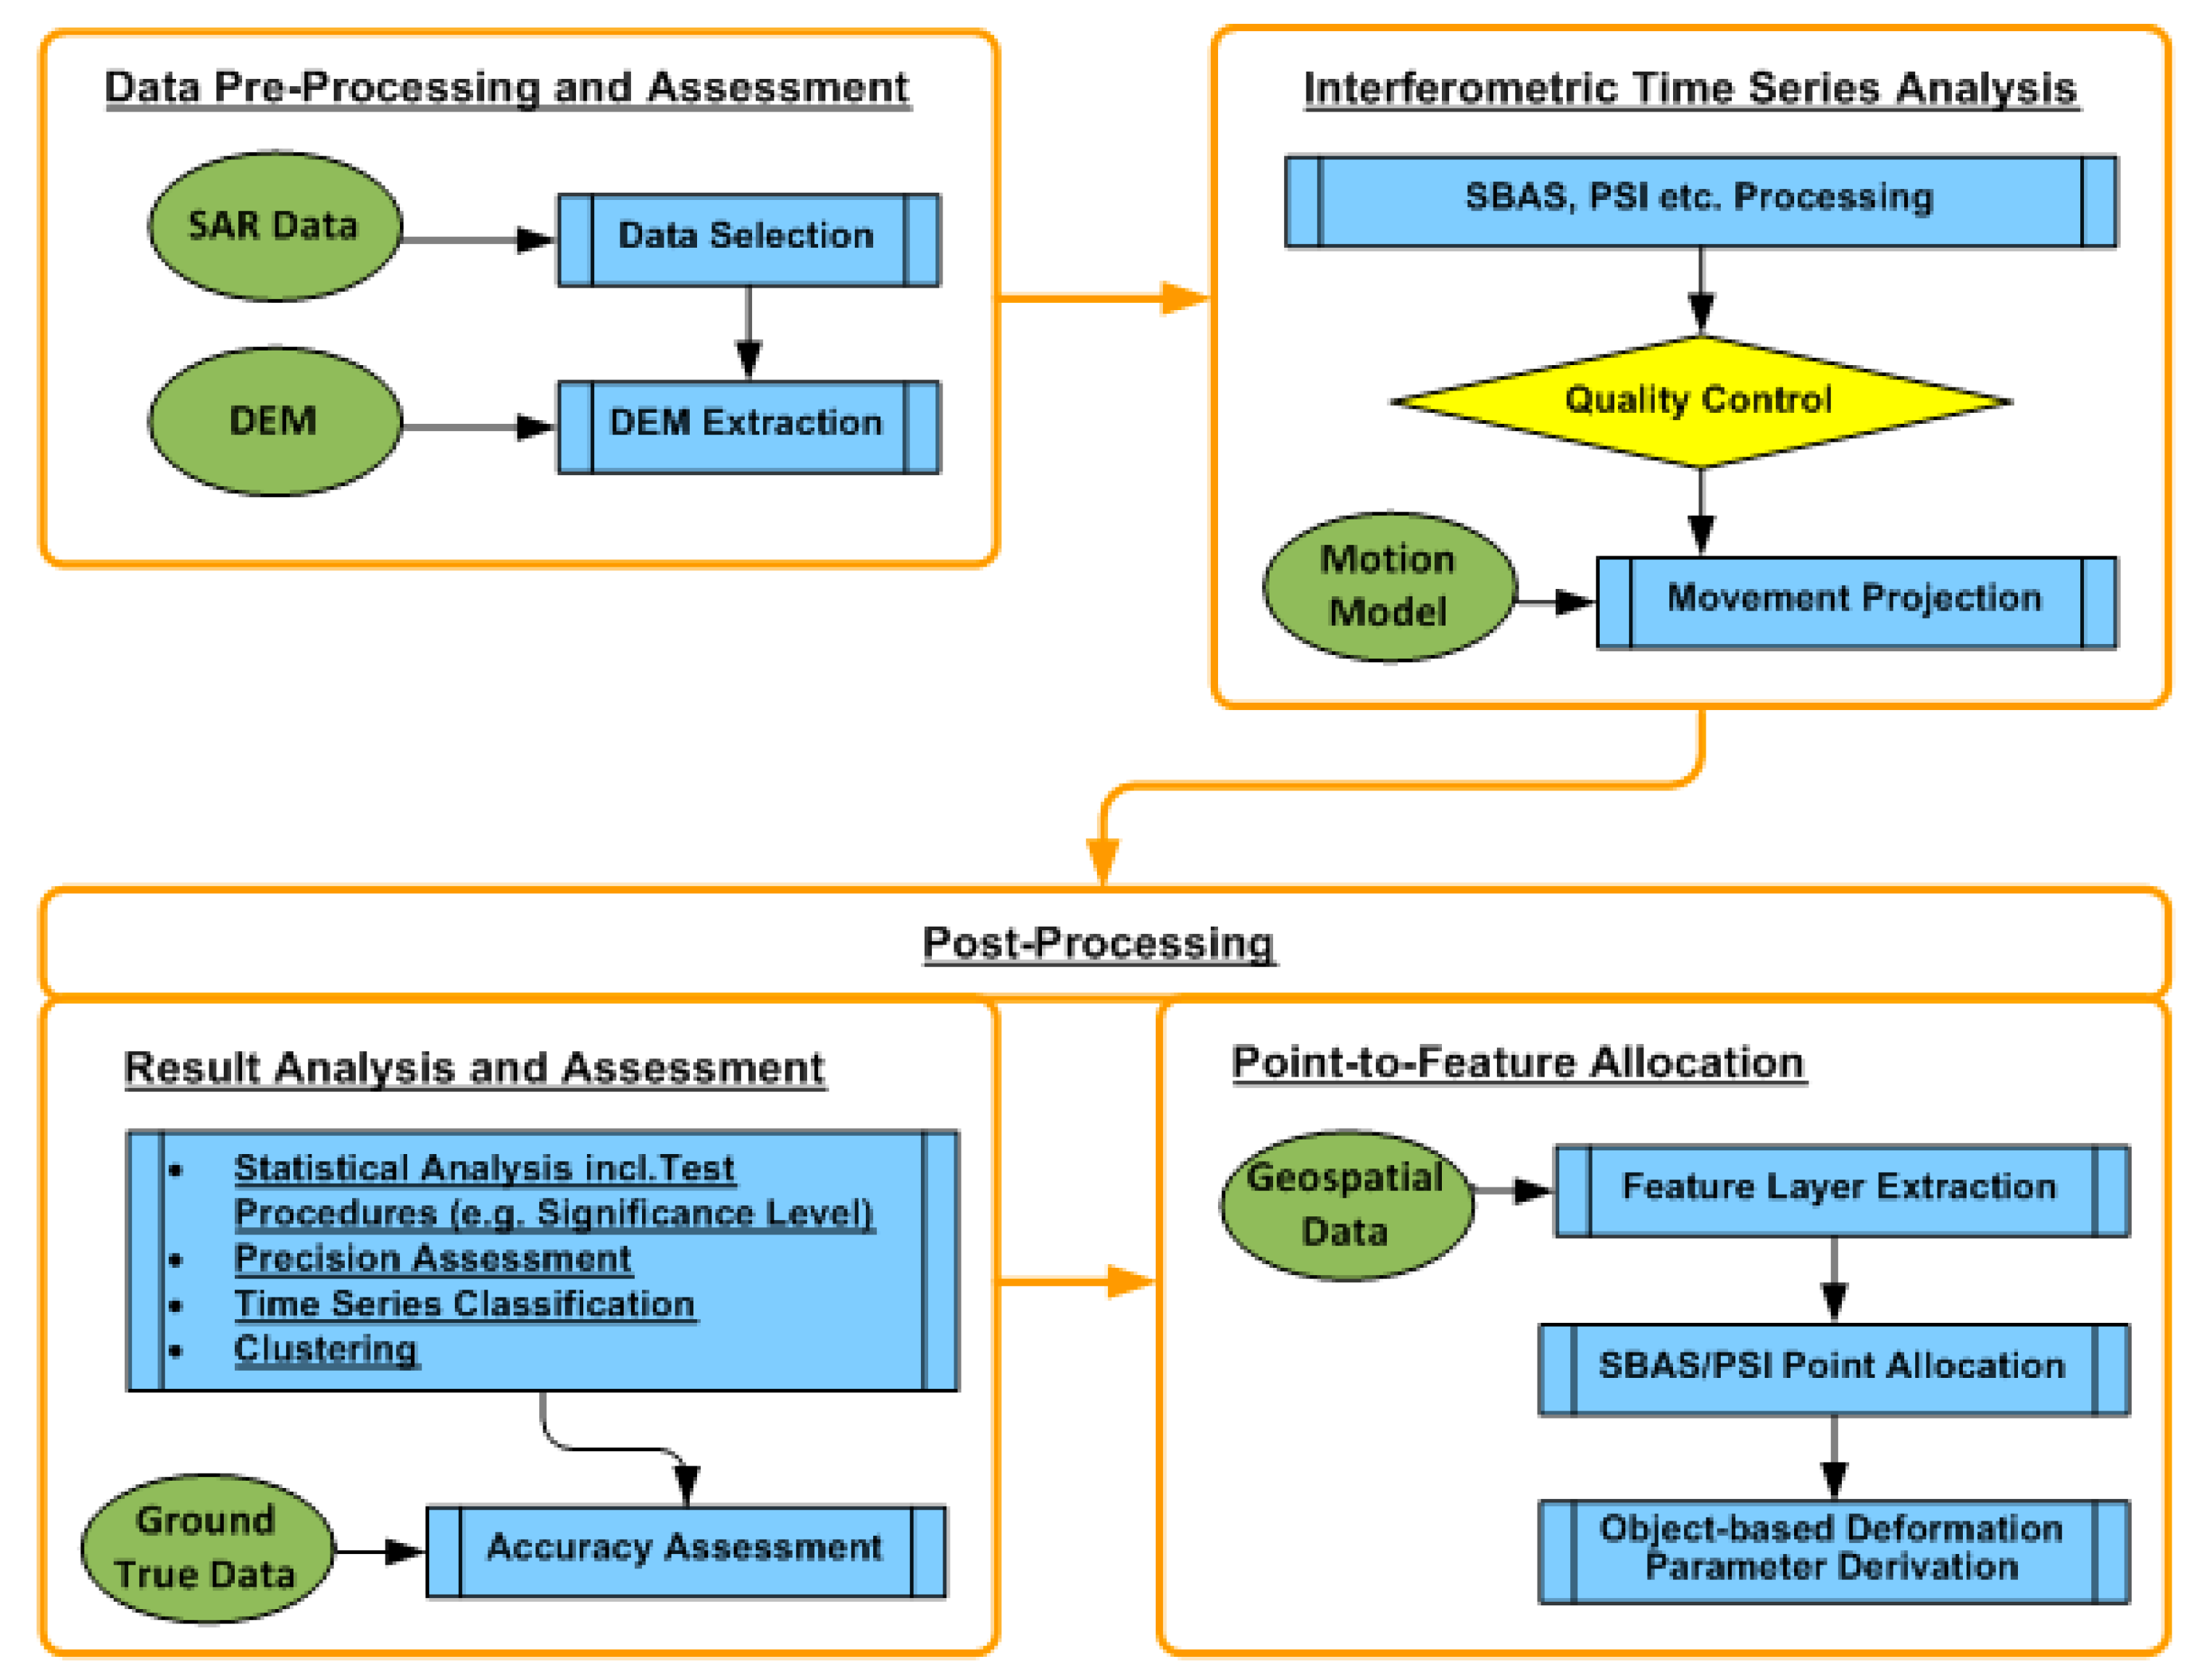
Surface movement detection based on InSAR measurements is demonstrated in an opencast mining region in western Germany near the city of Cologne with known tectonic faults, which is also affected by groundwater abstraction. The method is based on interferometric SBAS processing of 34 TerraSAR-X repeat-pass scenes, acquired between February 2015 and March 2016 in StripMap (SM) mode at a spatial resolution of 3 m and a repeat cycle of 11 days. The acquisitions were recorded from a descending orbit (rel. orbit 63, strip009R) with HH (Horizontal transmit and Horizontal receive) polarisation and an incidence angle of approximately 34°. We used a semi-automated processing chain for interferometric SAR analysis and post-processing with the objective of providing user relevant deformation information (Figure 1).
The interferometric SBAS processing of the TerraSAR-X data stack was carried out using the SARscape software (Version 5.2) from sarmap S.A. [6]. For the creation of the interferometric-pairs network, geometric baselines have been limited by a threshold of about 183 m to avoid geometric decorrelation. The maximum temporal baseline has been limited to 176 days. The Time-Position Plot in Figure 2 shows the final interferometric network that was used and the differential interferograms for estimation of the deformation time series with measured displacements in line-of-sight (LOS). SBAS processing also includes atmospheric phase screen (APS) for estimation of the atmospheric effects (second inversion). A reliable estimation of these atmospheric components could be achieved by using default APS SARscape setting parameters. This means we used an atmospheric low pass size of 1200 m and atmospheric high pass size of 365 days for atmospheric correction.
After an extensive quality control of SBAS results and under the assumption of no horizontal displacements, the LOS results could be transformed into vertical displacements (see step ‘Movement Projection’ in Figure 1).
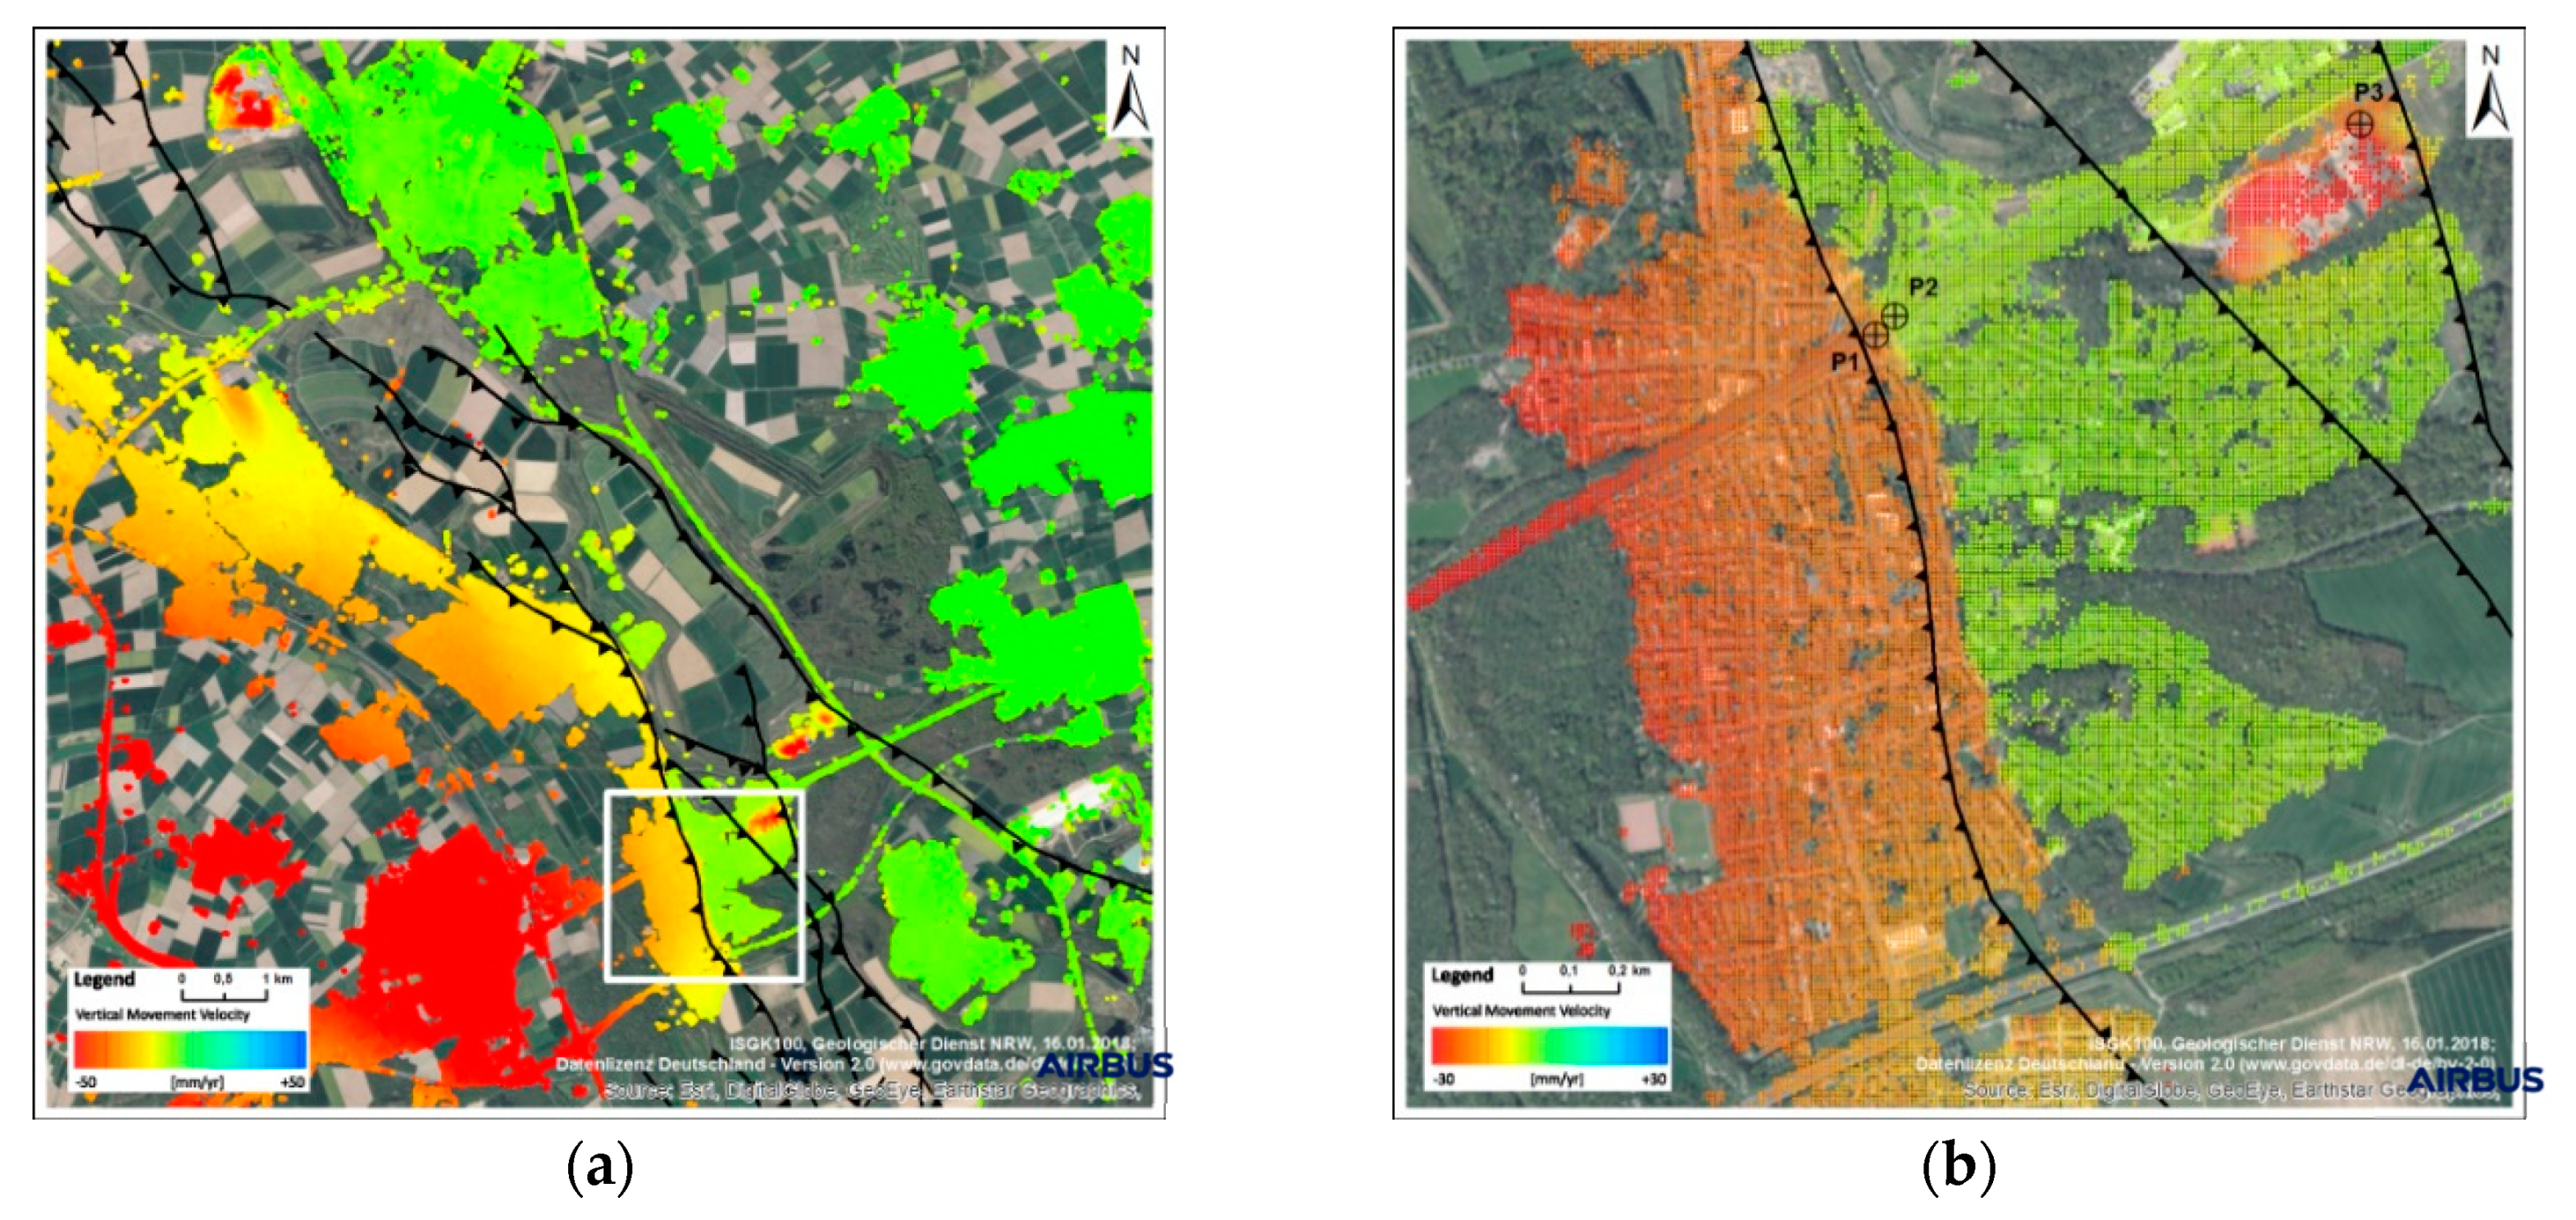
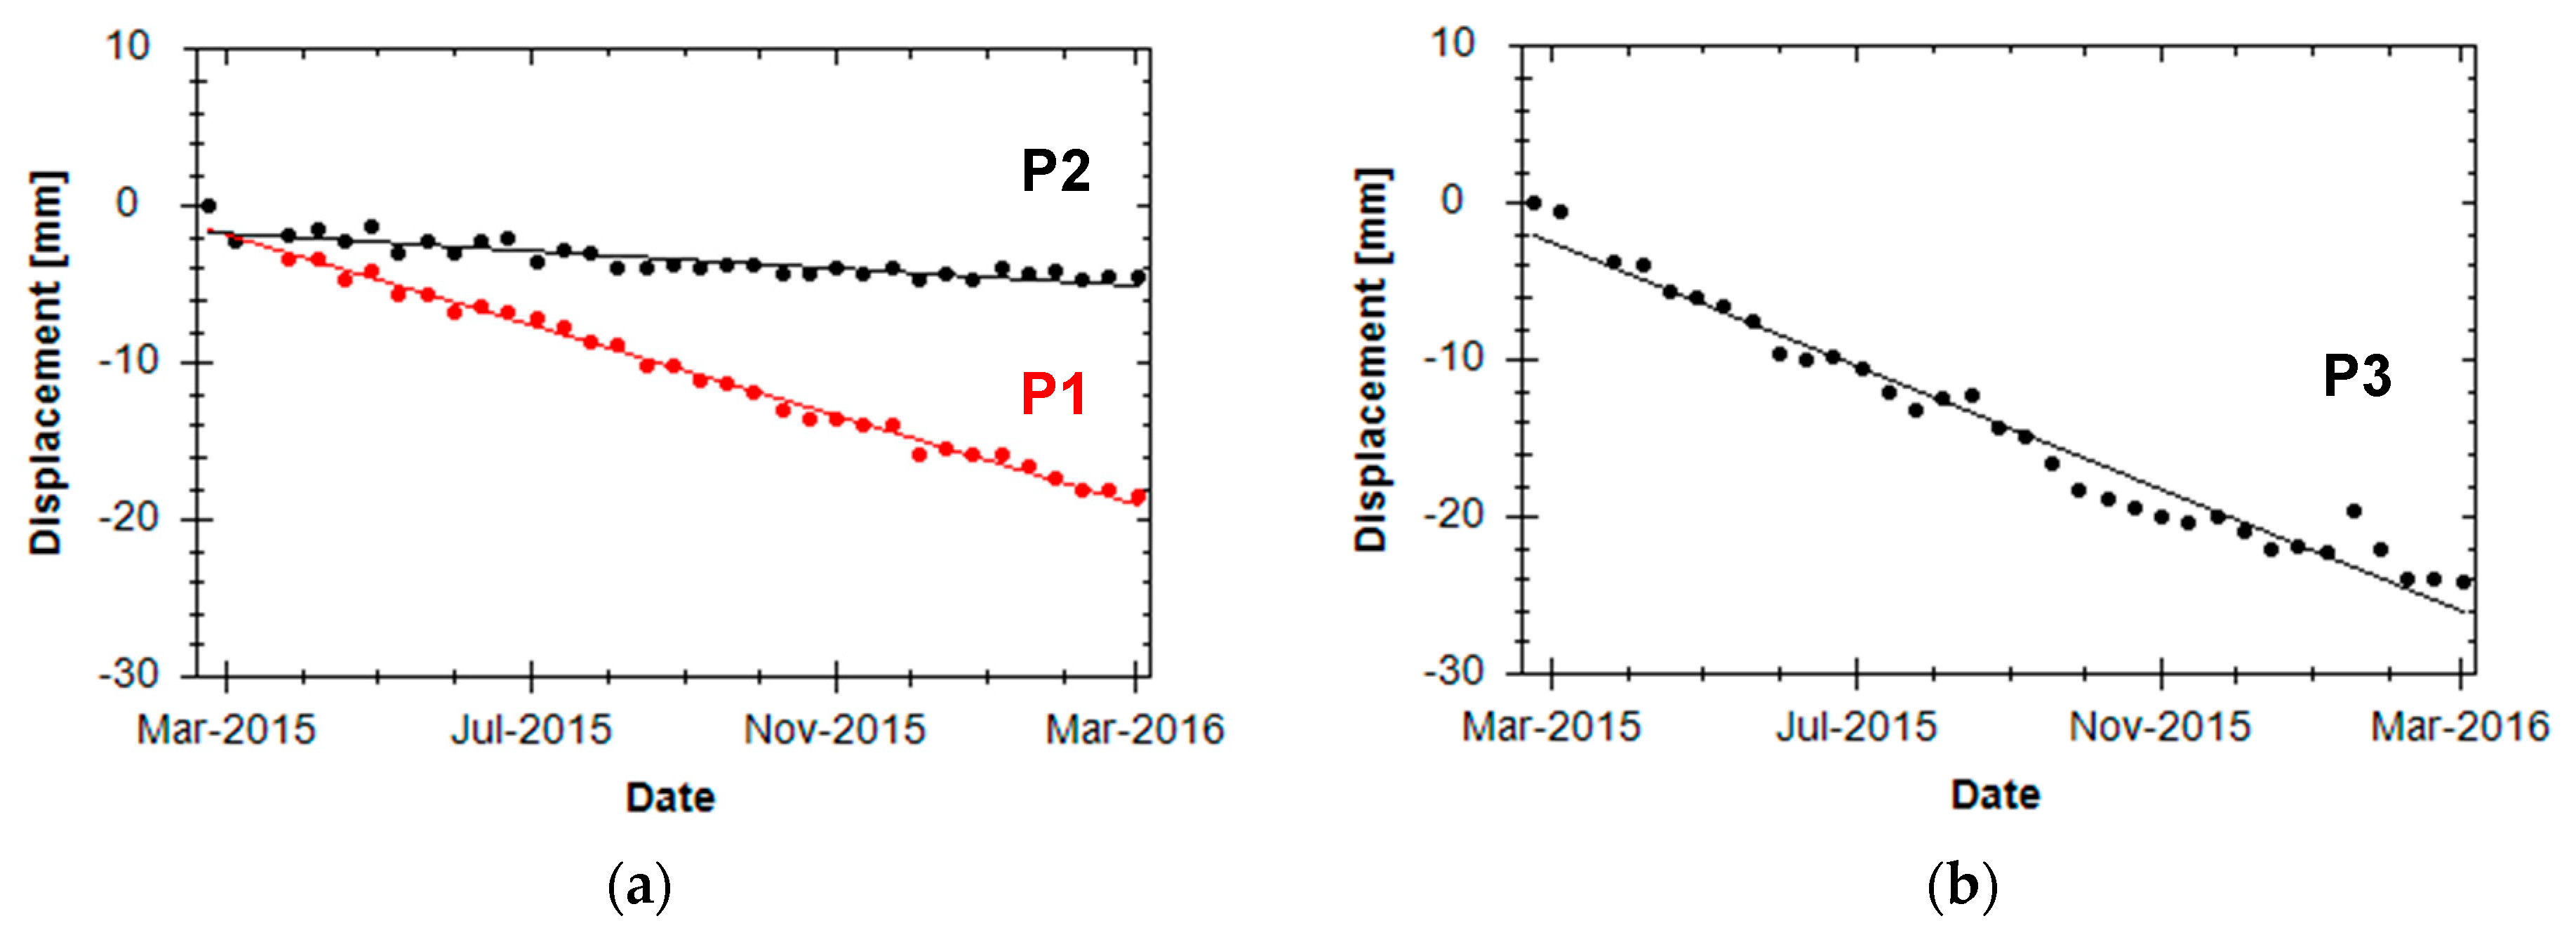
Figure 3a provides the area extent and a detailed view of vertical movement velocity in the area. The dimension of the large-scale subsidence areas is closely connected to the known location of tectonic faults (black hatching lines in Figure 3). Locally, further subsidence areas are detectable, e.g., on waste disposal sites. Figure 4 shows the time series of estimated vertical displacements for three selected measurement positions in Figure 3b. On the west side of the tectonic fault, we can observe a high subsidence velocity of about −17 mm/year (P1), while further east the velocities are clearly smaller (P2—approx. −3 mm/year). Furthermore, the time series of P1 and P2 show a significant linear behaviour in time depending on groundwater withdrawal activities of opencast mining. By contrast on the waste disposal site, the time series of P3 shows a higher velocity, but also a deceleration. This is due to the varying causes of movement.
For a more detailed analysis of objects of interest in a movement area, high-resolution TerraSAR-X data is particularly recommended, in order to fully exploit the high sampling of the surface showing local and small scale specific differences in the movement behaviour. Therefore, high-resolution TerraSAR-X acquisitions are used for enhanced and precise localisation of active tectonic faults (see Figure 3b).
In general, urban structures provide a sufficiently high number of valid measurement pixels. In rural areas with dense vegetation on agricultural land, grasslands, forests and plantations, however, no surface valid movement results can be derived, due to vegetation growth and movement and the resultant radar backscatter changes over time. Infrastructure objects are stable radar backscatter targets, thereby allowing the allocation of a large number of measurement pixels to create feature layers, as shown by railways in Figure 3c, roads (Figure 3d) and buildings (Figure 3e). In the region of interest, approximately 75% of railway networks, and about 40% of road networks have been covered by surface movement results retrieved from TerraSAR-X StripMap data. Therefore, a railway operator has the possibility for high-resolution, large-scale deformation monitoring of his rail network to identify critical sections. Municipalities and district authorities can be supported in their management and fulfilment of duties to detect and maintain traffic lines affected by deformation. Experience shows that insurance companies, for example, are highly interested in building-level movement information in the context of loss adjustment in areas affected by mining-induced surface deformation. For each building, a time series of surface movement measurement pixels is available including, for example, movement velocity and acceleration/deceleration. An extensive analysis allows the extraction of damage-relevant information, such as the maximum tilt of a house, the date when the tilt threshold is surpassed and the potential risk of instability and break. In Figure 3f, houses and railway segments with maximum tilts greater than 0.3 mm/meter are identified. These houses are potentially at risk of damage.
2.2. Ground Control Points (GCP)
2.2.1. TerraSAR-X GCP Background
Reliable Ground Control Points (GCPs), i.e., points of known geographical coordinates, are an essential input for the precise orthorectification of remote sensing imagery, the exact location of targets or the accurate georeferencing of a variety of geo-datasets. Although GCPs collected by terrestrial means typically offer a high accuracy, the TerraSAR-X based space-borne approach is of significant interest in such areas where access can be hazardous or may not be authorised. Thanks to TerraSAR-X’s precise orbit determination accuracy (within the range of centimetres), the precise radar beam tracing, its high spatial resolution and the resulting high positional accuracy of the imagery, the satellite proves to be highly suitable for obtaining 3D ground information. Based on stereo imagery or multiple image datasets acquired at defined geometrical conditions, GCPs can be obtained at a high accuracy in East (E), North (N) coordinates and in Height (H). The subsequent use of the retrieved points is to establish a control point database for commercial use, particularly in poorly mapped areas, where such information is not available or insufficiently accurate.
TerraSAR-X and TanDEM-X are capable of high-resolution and multi-beam image acquisition. Along with the image data, detailed and very precise orbit data allow for highly accurate 3D information extraction based on stereo or multi-angle image data sets. The image geolocation positioning error is proved to be less than 10 cm in azimuth and range [7,8].
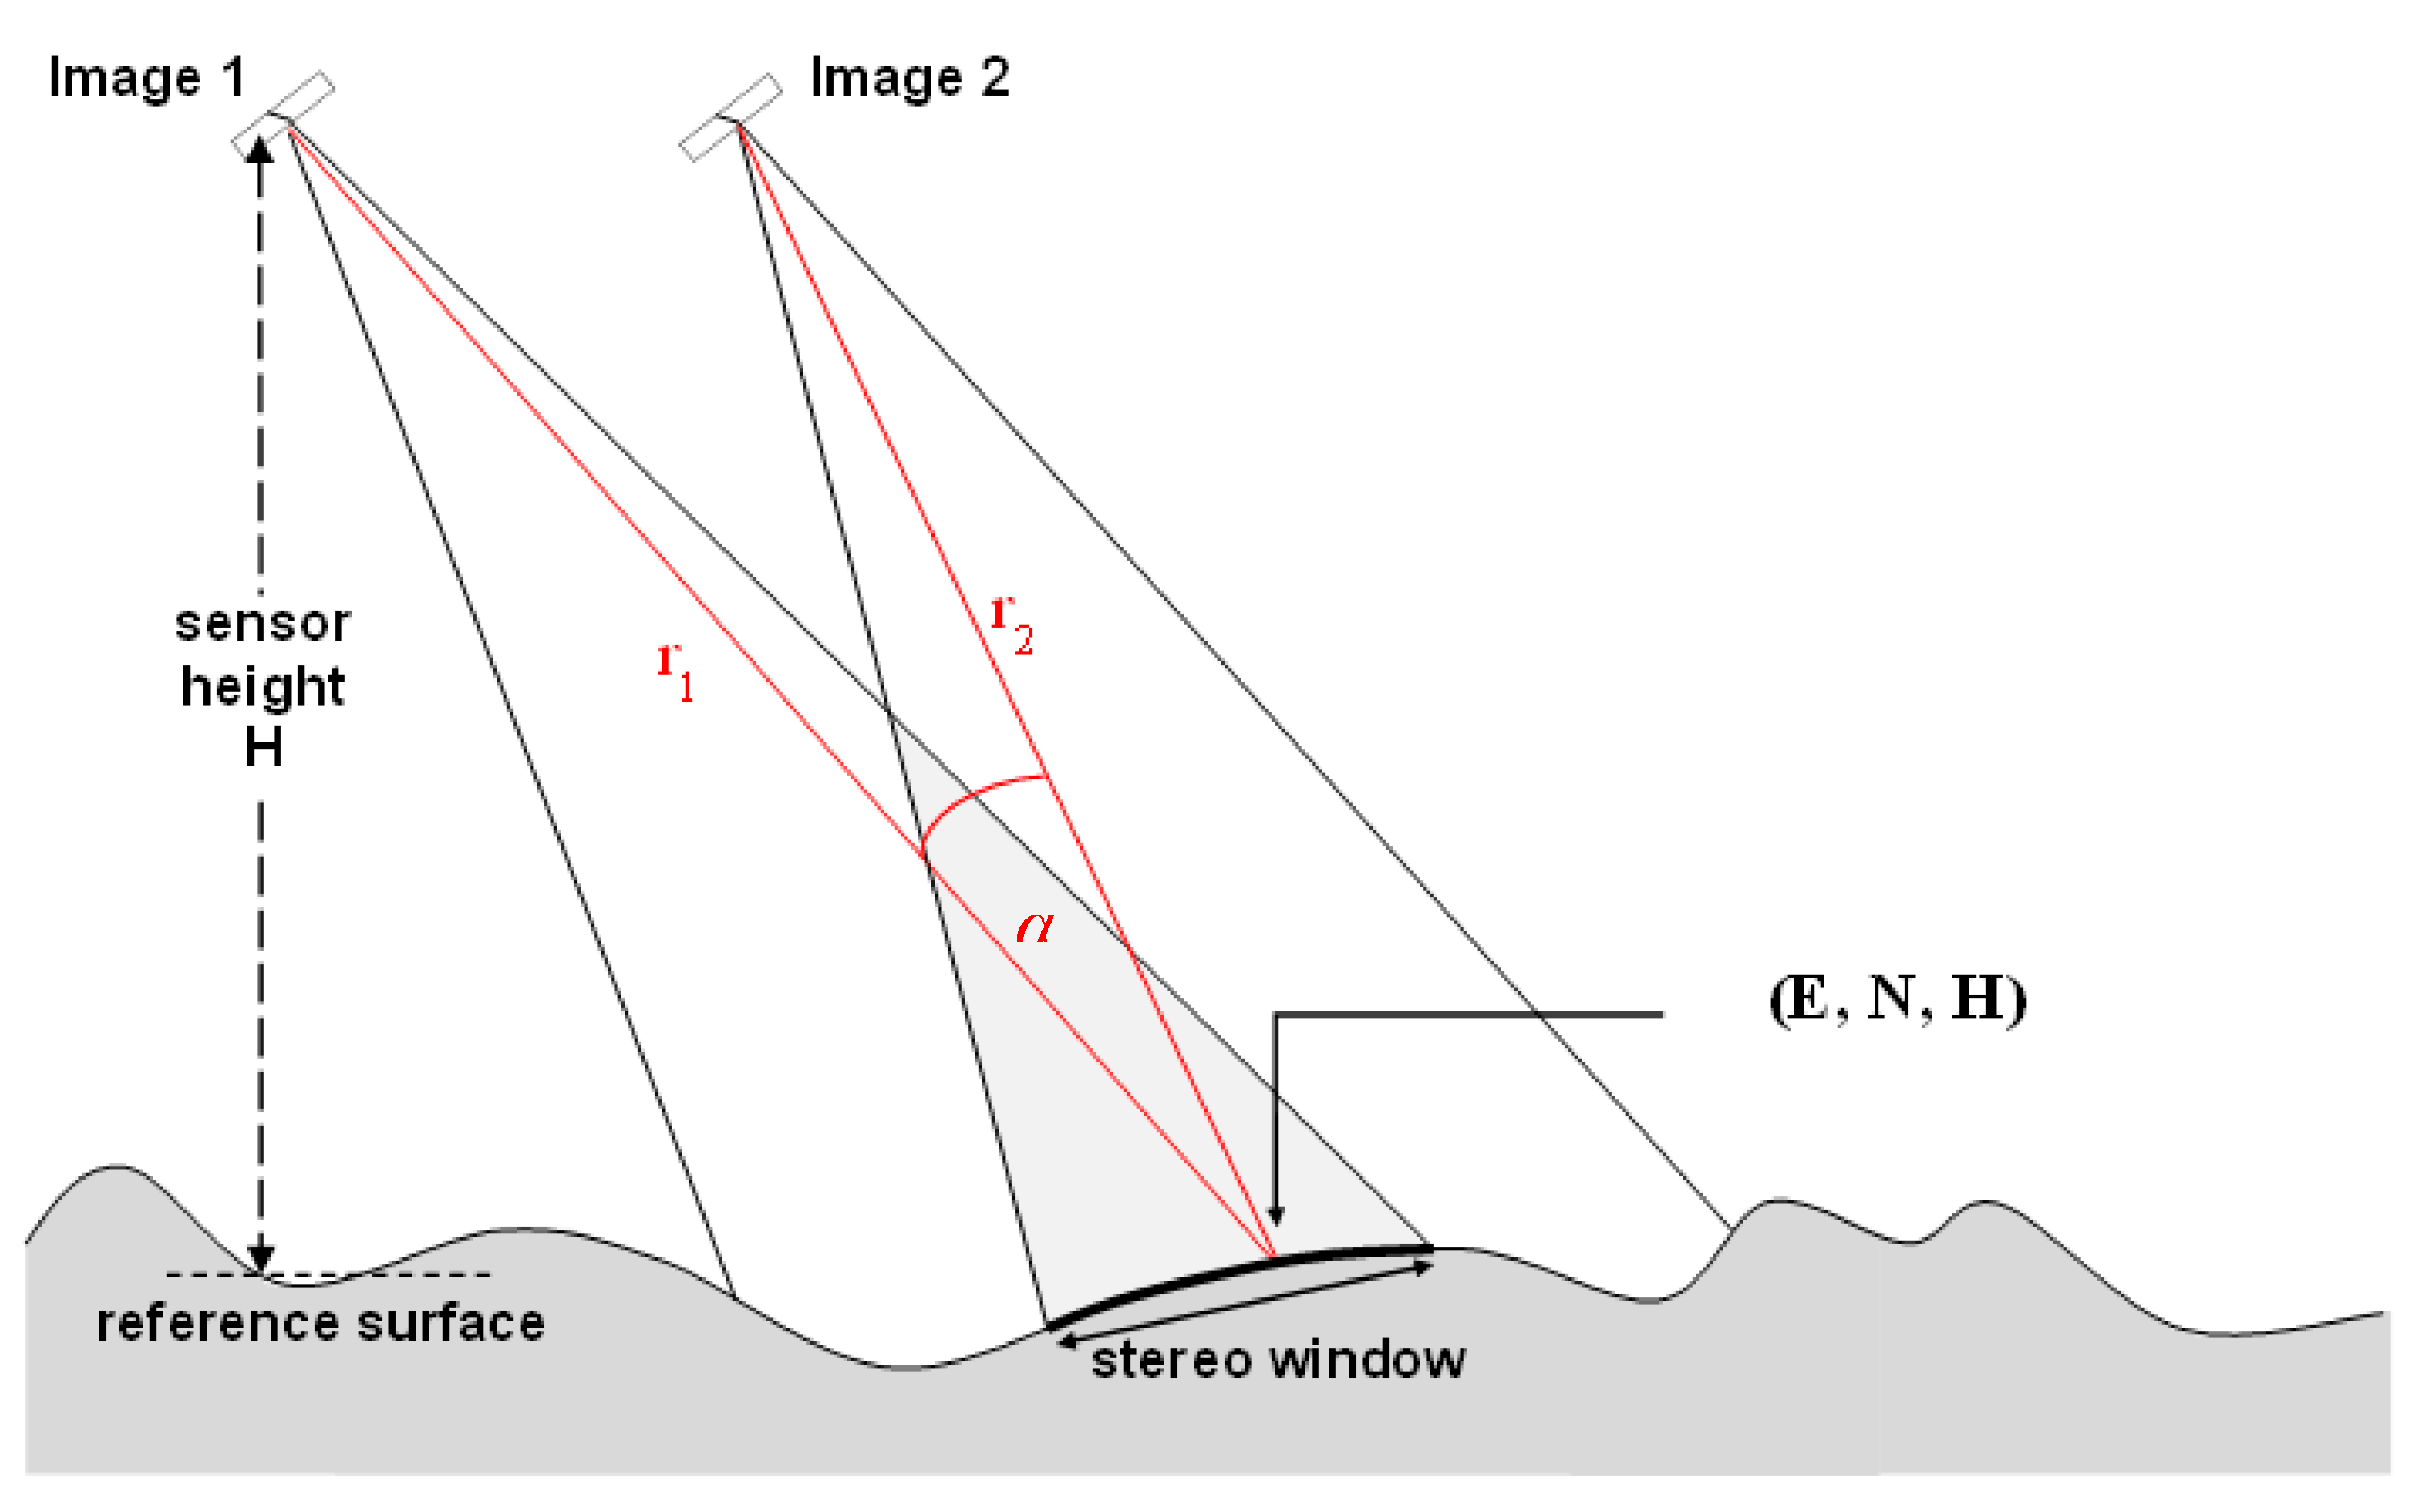
For automated radargrammetric ground control point extraction, a minimum of two images acquired with the same orbit direction or, ideally, from ascending and descending orbits are acquired over the area of interest. The disparity angle α (compare Figure 5) between the acquisition geometry of the 2 images is of great importance for the establishment of a stable geometric model. Measurements of corresponding points in two or more images are used to determine the ground coordinates (Easting, Northing, and Height). The general mathematical background of this intersection procedure is given in [9]. Detailed analysis of image stereo constellations for high performance can be found in [10,11].
2.2.2. TerraSAR-X GCP Case Study
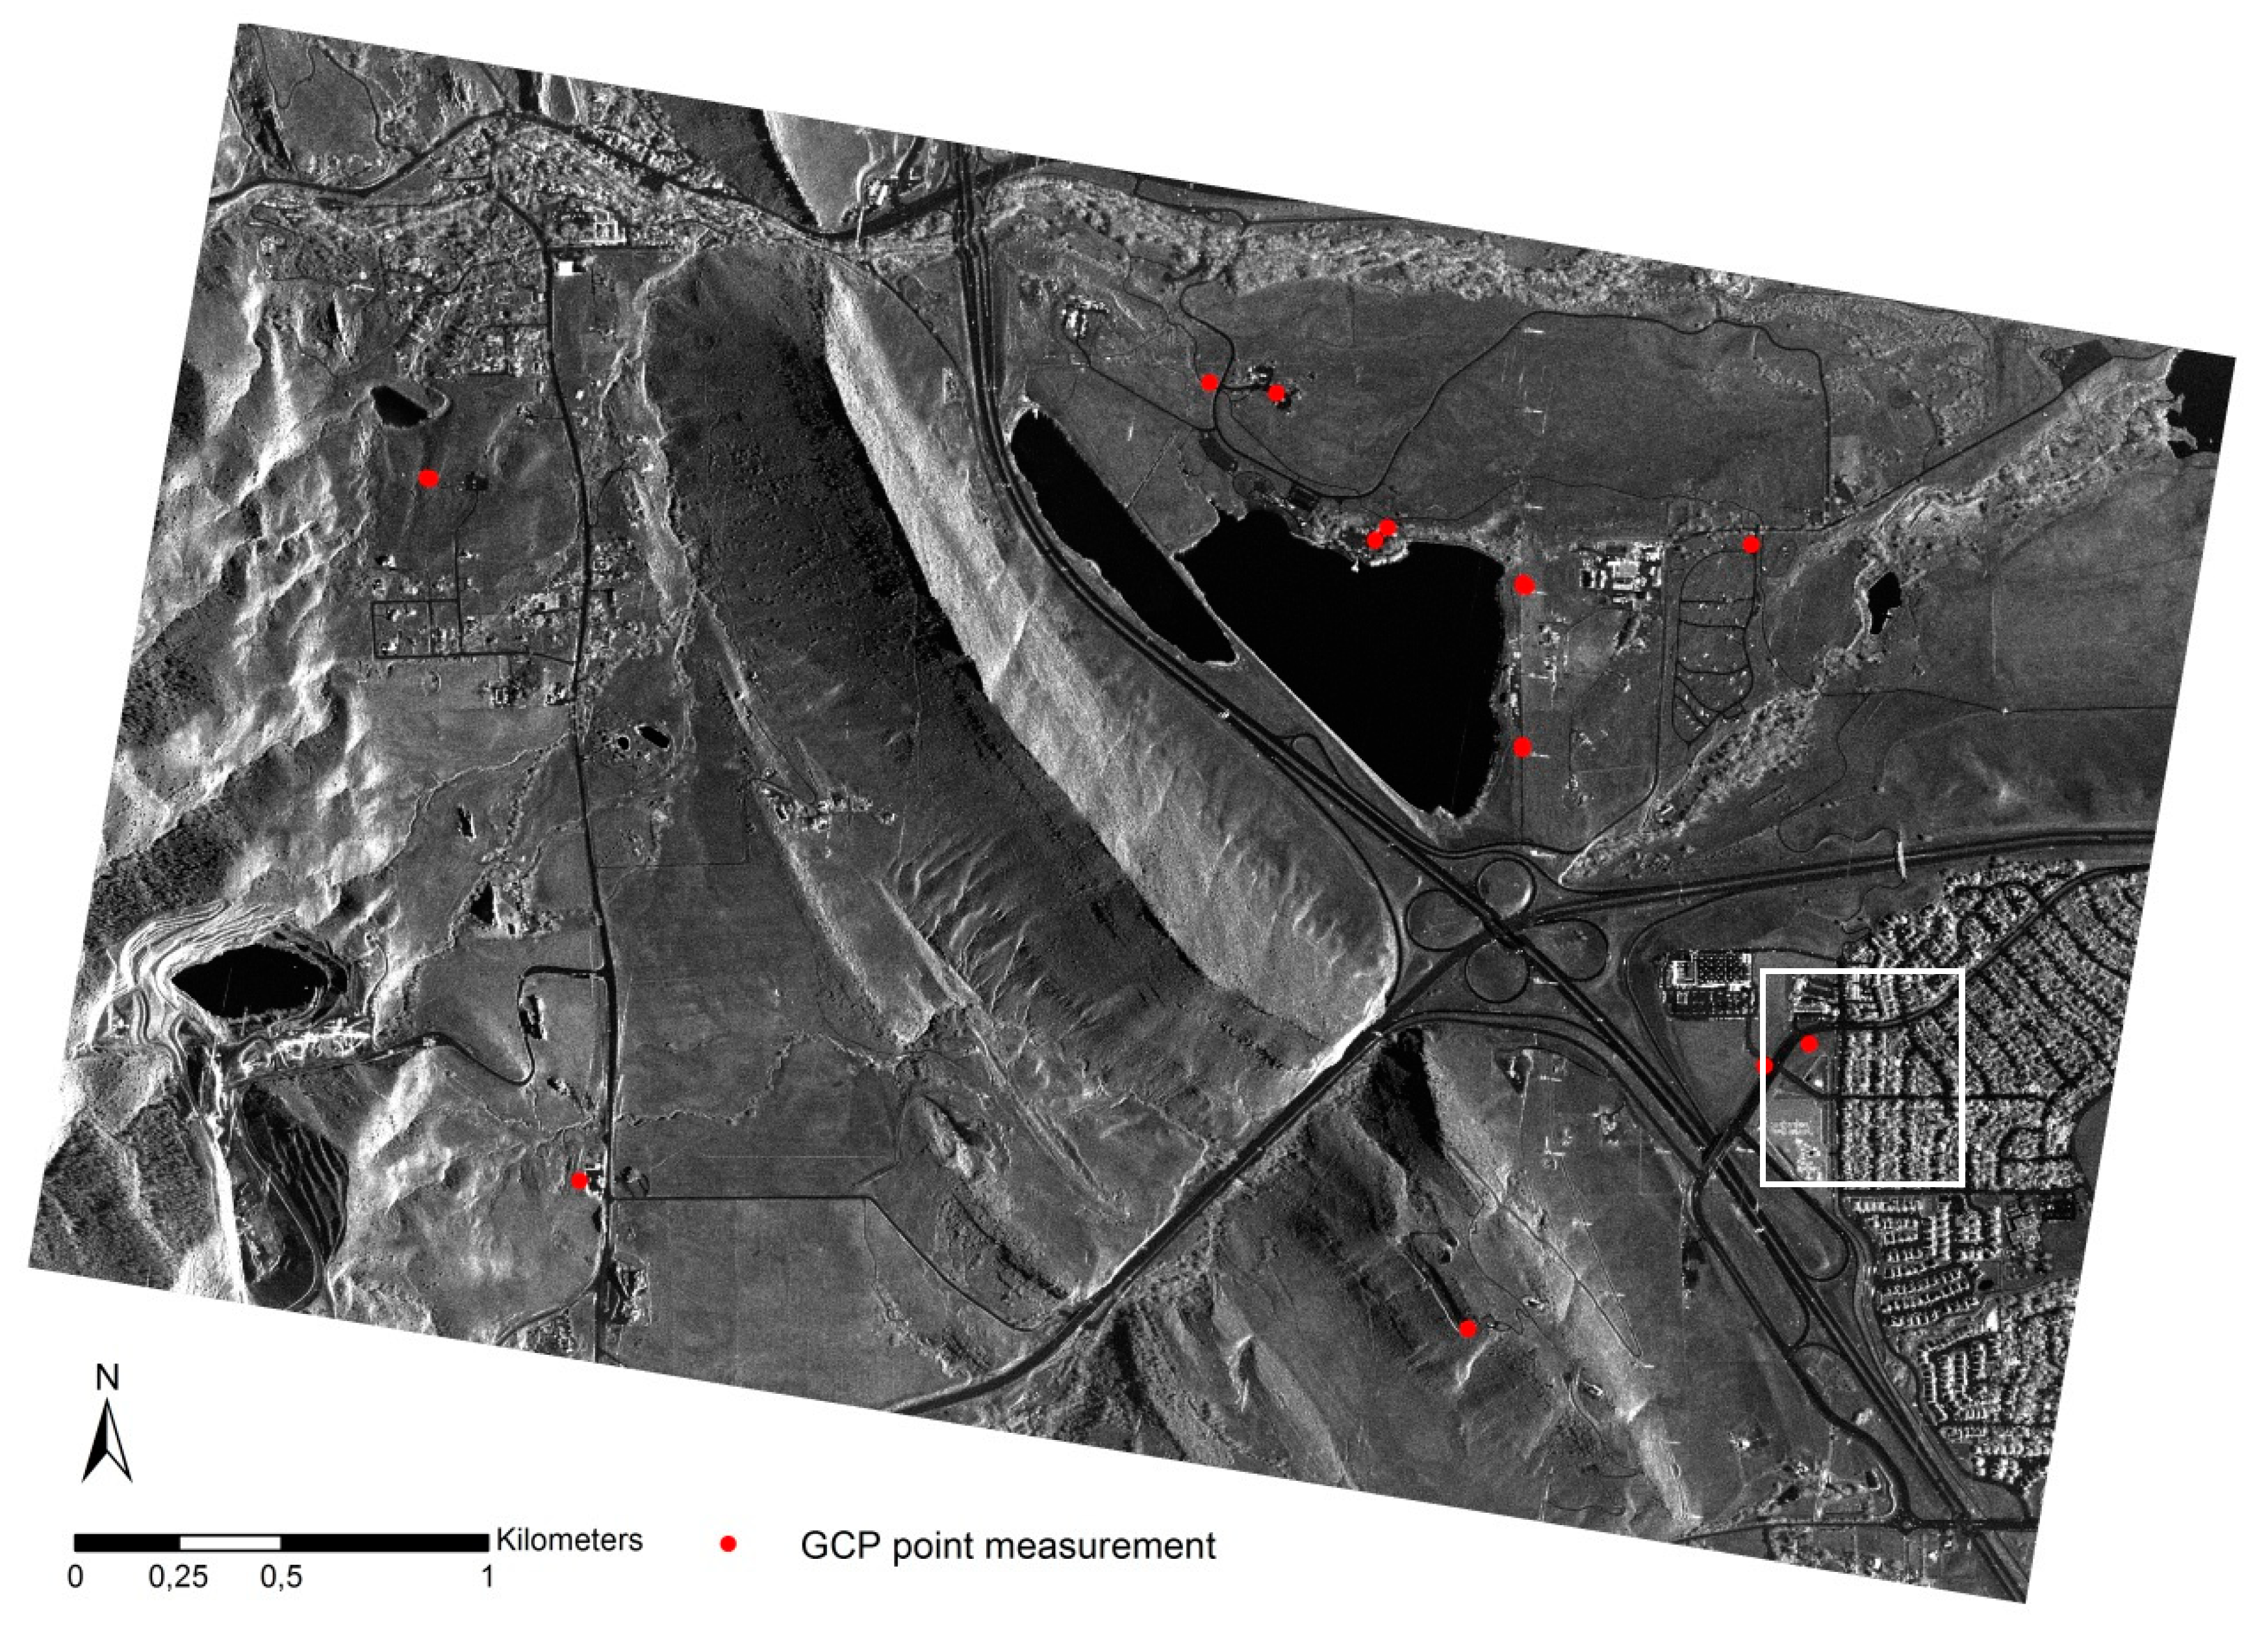
The test site in the South-West of Denver, USA, mainly covers urban/suburban and rural areas. According to the image data acquisition scenario, shown in Figure 6, TerraSAR-X Staring SpotLight (ST) images are acquired as stereo image pairs in HH polarisation. For each acquisition period, three images taken from ascending and descending orbits were used. The image parameters are summarised in Table 1.
In Figure 6, an overview of the Denver test site and the measured points is shown. Points are selected in urban and suburban areas to achieve a mix of diverse surface features, different elements, such as point scatterers (lamp posts and utility poles), road crossings and roundabouts.
Figure 7 depicts the backscatter response of a point target localised in the TerraSAR-X ST image. Due to the high spatial resolution and radiometric performance of TerraSAR-X ST, the point target is clearly pronounced.
For the validation of the TerraSAR-X retrieved Ground Control Points, highly accurate reference coordinates of similar features obtained from Differential Global Positioning System (DGPS) observations, i.e., ITRF 2008 with the Epoch of 2012.0, are employed [12]. The advantage of the DGPS measurements is the very high positional accuracy of the measurements and the global availability with a consistent quality. This reference data was measured with survey grade GPS equipment and processed to an absolute and global accuracy better than 10 cm with CE95 and LE95 confidence levels [12].
2.3. Automatic Target Recognition (ATR)
2.3.1. Method
For surveillance, security and reconnaissance applications, high-resolution TerraSAR-X data has been exploited with respect to the detection of relevant ground targets in real-time by automatic and assisted target recognition software. Target detection and recognition is one of Airbus’s main technology development products, which are utilised in a variety of applications on both green and blue borders, e.g., for target tracking and recognition, change detection and recognition, anti-piracy or immigration-control, and ship detection of search and rescue operations.
The TerraSAR-X satellite acquires high-quality, high-resolution commercial radar data well suited for purposes of earth observation, target detection and recognition. TerraSAR-X operates in three main acquisition modes: ScanSAR (16 m resolution), StripMap (3 m resolution) and SpotLight modes (0.25 to 0.5 m). In this section, machine learning methods applied to specific target signatures for detection and recognition applications with high-resolution TerraSAR-X images are investigated.
With the increase in processing capabilities through fast multiple parallel graphical units (GPUs) [14], the availability of large-scale annotated datasets, the accessibility of high-resolution SAR imagery and the intense demand from civil applications, the push to develop automated target recognition with transfer learning has grown. Machine learning techniques are often engaged in autonomous detection of the targets based on appropriate training data sets. Convolutional Neural Networks (CNN) include a specific architecture of deep learning and are particularly effective in object and feature classification [15,16]. The CNNs algorithm convolves the input data with a successive number of pre-learned kernels to derive and encode target features prepared for classification. Deep Convolution Neural Network is the stepping block within ATR that iteratively and adaptively customises a variety of relevant features to classify and identify targets. Deep learning does not require any manual pre-built feature extractor, but rather excerpts features automatically. Therefore, an increase in the number of high-quality training datasets enhances feature recognition. In order to minimise experimental risks, the training data set parameters must be adjusted for their quality, quantity and target feature diversity. A hybrid system comprising Deep CNN (DCNN) and Support Vector Machines (SVM) algorithms has been designed at Airbus specifically for TerraSAR-X. This hybrid design has shown to decrease generalisation error producing complex non-linear constraints that give the highest possible differentiation between trained target classes and the surrounding environment, as well as reducing total throughput for ATR applications [17]. The hybrid system efficiently combines convolutional networks effective learning of invariant features, with support vector machines fast and powerful decision making to reduce the number of parameters and thus increases the runtime performance of the network Figure 8 shows the steps employed in the ATR processor.
Input data are stacks of high-resolution TerraSAR-X level1B images in SpotLight mode. Images are acquired at different incidence angles to account for flexibility in recognition. TerraSAR-X images are processed to Enhanced Ellipsoid Corrected geometric projection format.
Each target of interest’s position is manually identified and labelled as a training image patch. Following image preparation, the prepared image patches are fed into the DCNN processor. Therein distinctive features, such as target brightness, texture, edges, shadows and corners are automatically obtained. Each patch covers the labelled target and its surrounding pixels where target backscattering characteristic are described by the scatter cluster rather than the scatter point extraction. These features are combined layer by layer to achieve complex non-linear class features that fully encode target characteristics and are superior to any manual operation. The pre-trained layers are obtained by training the stacked convolutional auto-encoder on labelled SAR scene images.
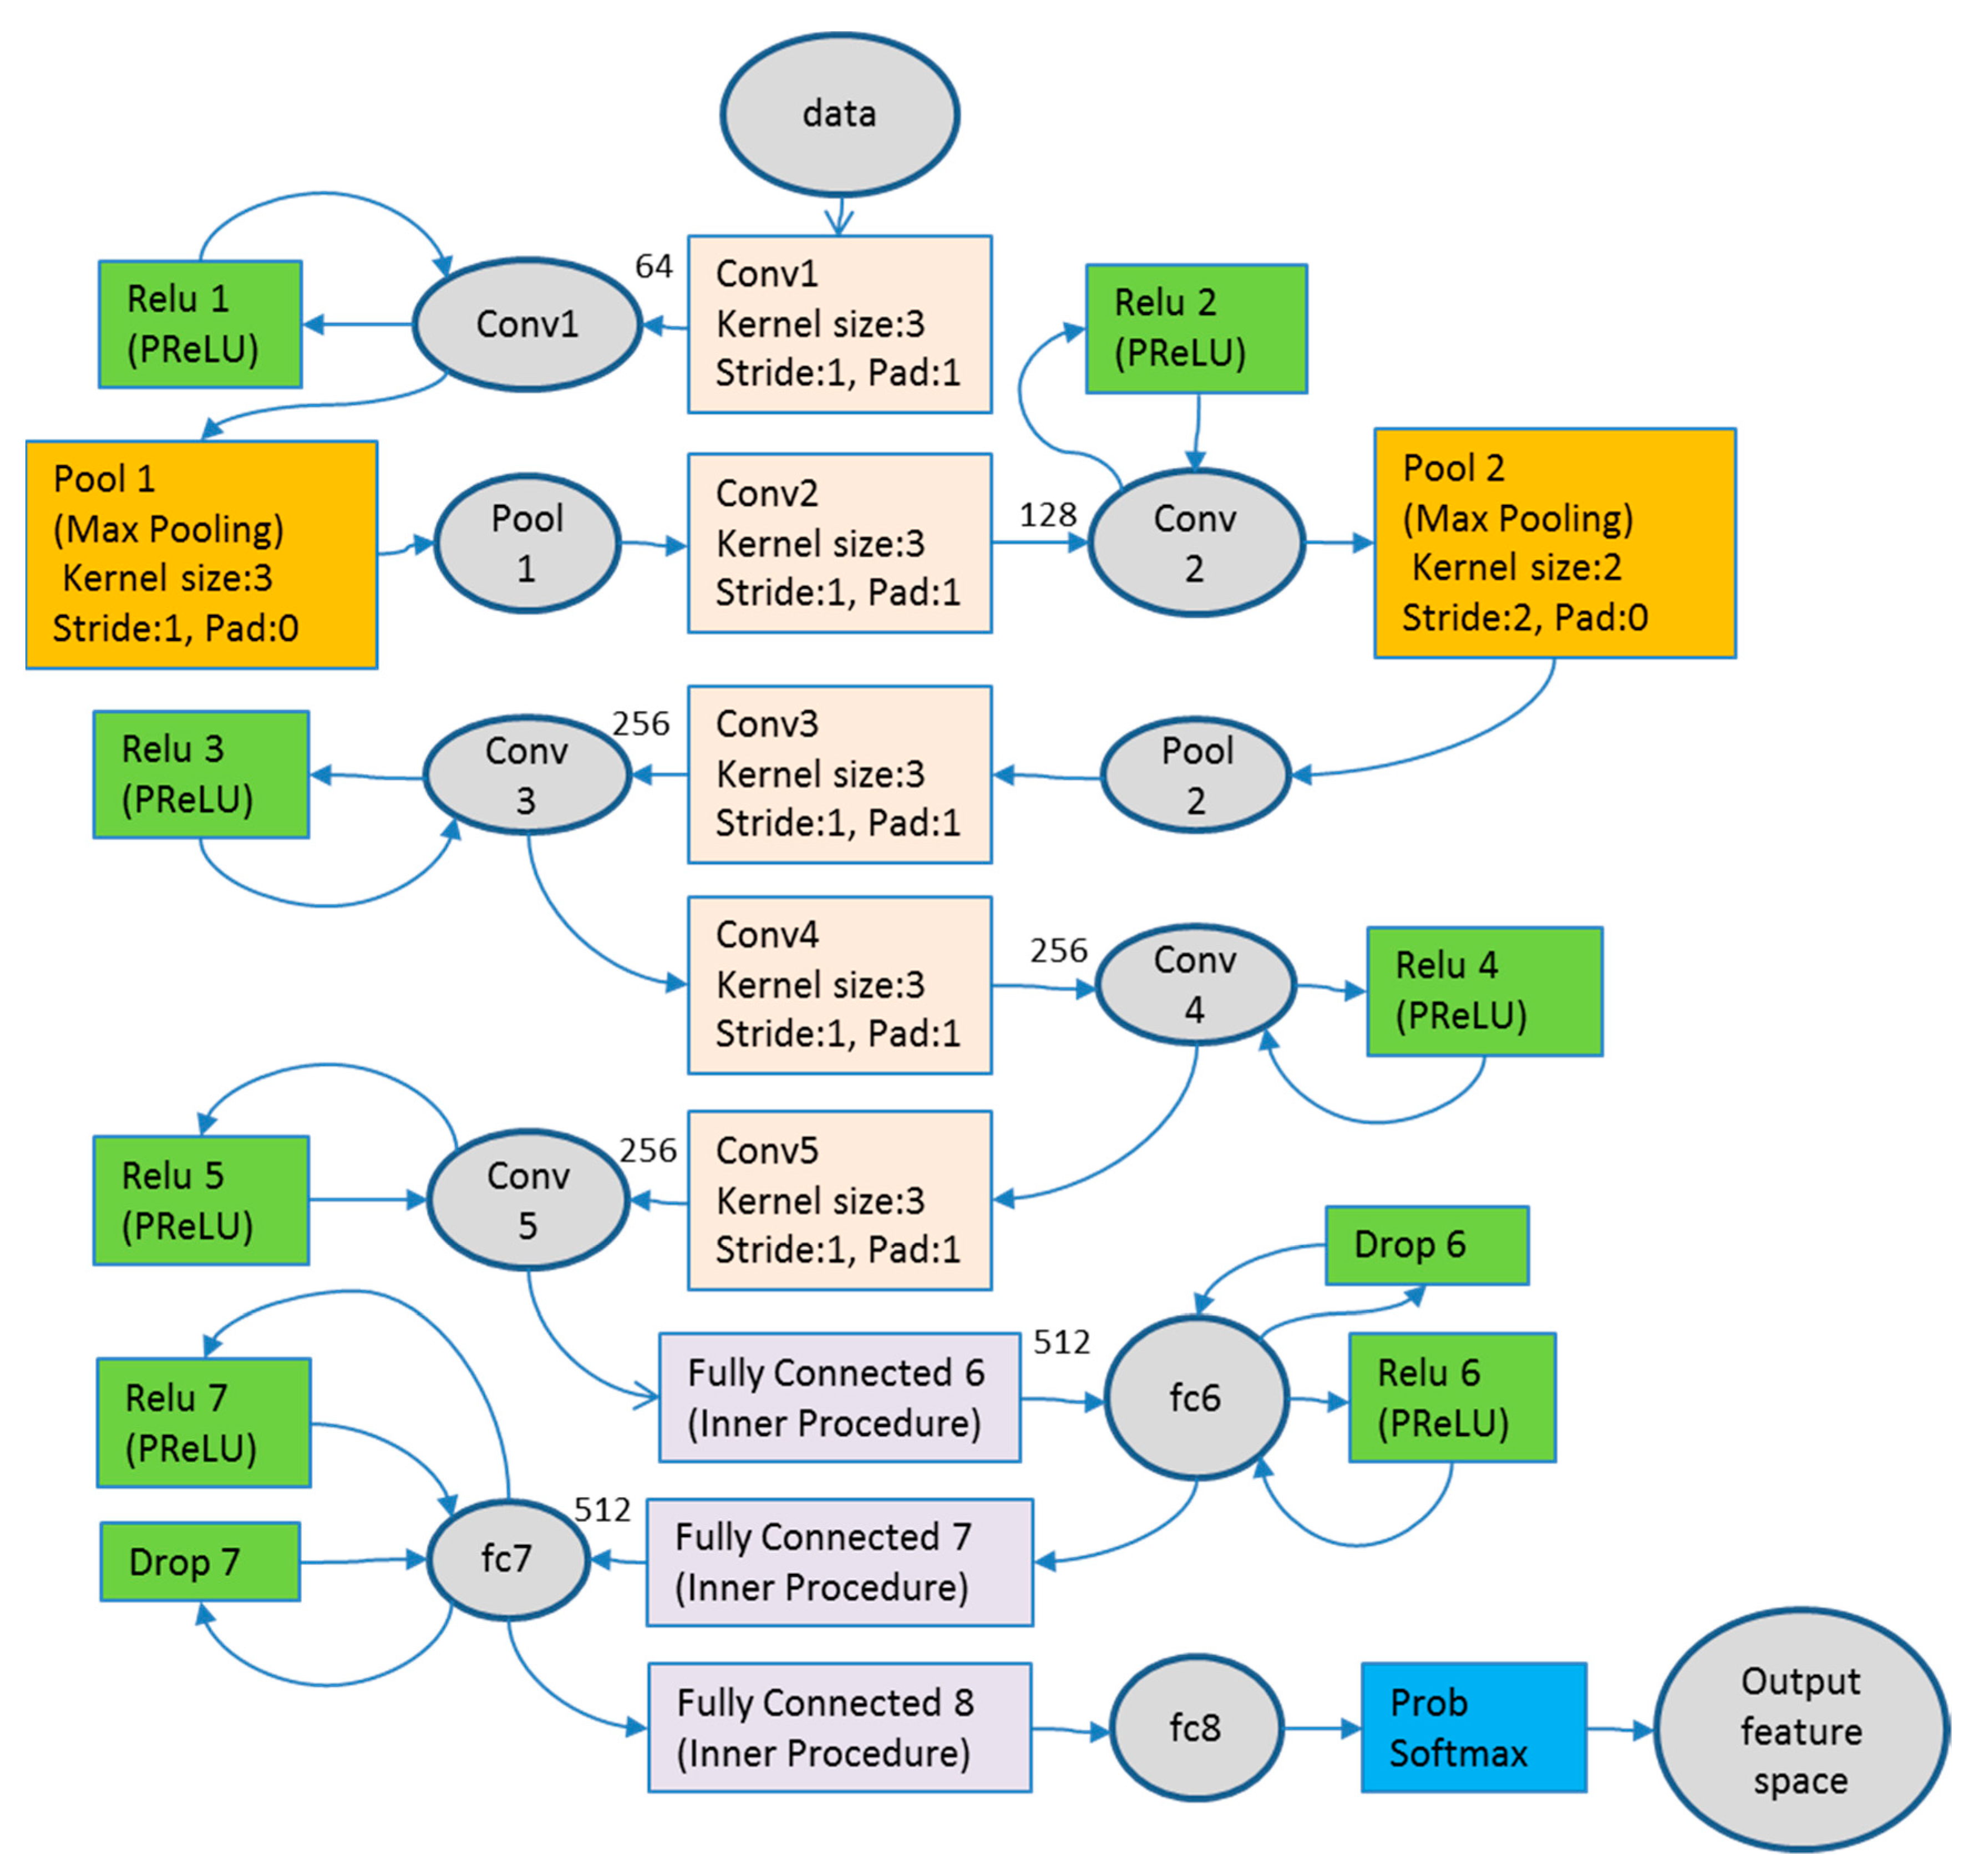
As depicted in Figure 9, the classification architecture consists of several (here, five) convolutional layers, followed by max pooling with rectified linear units (ReLU) activation functions and fully connected layers. In this example, convolutional layers have adopted a pyramid structure, which means as the convolution layers increase, the outputs of each layer are down sampled by maxpooling. The fully-connected layer preserves the 512-neurons. The output of the last fully connected layer is fed to the Softmax probability activation function, before going into the SVM classifier. The Frequency-Domain Support Vector Machine is an Airbus proprietary disruptive technology, which enables high-speed machine learning applications [18].
The application of automatic target recognition is performed in two steps: Detection and identification. Detection is the pure localisation of the target. Identification is achieved in two ways; a target can be identified as a member of a class (e.g., class of airplanes) or a specific type within that class (e.g., military aircraft or civilian passenger aircraft).
The performance capabilities of an ATR application depend on appropriate feature detection, characterised by its spatial and radiometric resolutions, and the noise level. The training phase enables “learning by examples” and data-driven generalisation, but performance correlates to availability and quality of training imagery. A variety of pre-training tasks can be utilised to enhance image-signal-to-clutter ratio, for example noise reduction with spatially variant apodization [19], polarisation whitening filters [20], or radiometrically/spatially enhanced image products [21]. The SAR image acquisition geometry and environmental conditions are other important factors for the ATR process. Here, ATR performance depends not only on sensor acquisition geometry, but also on the target geometry, its shadow, layover, foreshortening or occlusion by neighbouring objects. These limitations may be partially overcome by exploitation of target libraries created from simulated SAR data for a specific target size, shape, orientation, and revetment. The accuracy of labelled training targets and classes and the validity of ground-truth data in all-weather conditions are less compromised with simulated SAR libraries. In addition to the above, considerations are made for user requirements, where ATR applications are required to perform within minimum processing time (near-real-time), under limited or reduced data dimensions dealing with computational complexity, achieving a reasonably high (>90%) average precision.
2.3.2. Automatic Target Recognition Case Study
The presented ATR experiment is executed on TerraSAR-X High Resolution SpotLight images (with a resolution of 0.5 m) processed respectively with Spatially Enhanced (SE) and Radiometrically Enhanced (RE) variants and TerraSAR-X Staring SpotLight images (with a ground resolution of approximately 0.25 m × 1.0 m) with the Spatially Enhanced (SE) processing variant. In total, 93 images, for three sites, and 26 images per area of interest in different modes containing positively labelled targets of interest and negatively excluding targets are used for training and testing. The areas of interest are selected to contain a large number of targets suitable for detection and recognition. Targets of interest are four models of aircrafts with lengths ranging from 12 m to 46 m. Targets include a variety of ground parking orientations, due to interim use of the aircraft. Table 3 provides the aircrafts’ primary dimensions.
The areas of interest selected are Ryazan, Ukrainka and Engels airbases in Russia. Training data sets are acquired at different incidence angles and at different orbit orientations to accommodate for different acquisition geometries. The time series of the images accounts for the possibility of seasonal variation throughout the year (i.e., snow and rain). Figure 10 and Figure 11 provide distribution of variety of images per site per acquisition for each site.
The image pre-processing step of the experiment started with conversion of TerraSAR-X images from 16 to 8 bit by histogram truncation and rescaling. The experiment was performed on image patches of 2048 × 2048 pixels. All training and test data patches were resampled to 0.4 m pixel spacing. The positively labelled target chip size in the training depended on the object class size. Data chips were utilised to train the DCNN processor. The frequency domain SVM [22] was trained on the output of the DCNN. In this experiment, the quantitative evaluation of the ATR processor gave very promising results. It showed especially very low false alarm rates on the additional TerraSAR-X test images. Figure 12 provides the performance of the processor for each target on tested data. The quantitative average precision of ATR processor on TerraSAR-X images is given in Table 4. It can be deduced that, since the pose or ground parking geometry of the targets in this experiment did not vary significantly, the tested target signature remained similar, and was mainly affected by signal to noise variation, due to the sensor system and the local weather conditions. Examples of SAR image signature, and the corresponding computer graphics models of each labelled aircraft, are shown in Figure 13.
In preparation for the ATR experiment, every aspect of SAR imagery was considered. Products derived from ATR applications ultimately will be utilised to support SAR image analysts where timeliness and precision are of highest importance.
The fusion of pre-processing steps, employment of deep convolution neural network and feature enhancement methodologies in the frequency domain to extract complex and non-linear target attributes minimised efforts to generate optimised target features and reduced the required processing time.
The analysis showed that the classifier’s performance is limited significantly by the sensor’s acquisition geometry, target shape, size, orientation, revetment, and environmental variations. The target’s geometric signature sensitivity indicates the need for feature annotation libraries at a range of incidence angles with small intervals and limited squint variation. Target ground aspects and orientation angles greater than 10 degrees reduce the probability of correct recognition. Therefore, provision for additional training data with different parking positions must be made. In addition, significant differences between signatures of the same target were observed from different imaging modes of TerraSAR-X. The ATR classifier cannot be reused and applied to High Resolution SpotLight and Staring SpotLight images without re-training the system. This confirmed the importance of SAR image resolution and noise level in ATR processing applications.
During this experiment, it was found that the hybrid DCNN design had a much superior generalisation performance, due to abstract feature learning and reacted better at target scale variation. It also performed in an acceptable run-time.
Future experiments are planned to analyse simulated SAR signatures of targets within the same target class category. Simulated SAR data will be utilised to determine specific target attributes that differentiate them from each other. In addition, all scenarios will be tested with different ground parking poses and at different signal-to-clutter levels.
3. Conclusions
Since the launch of TerraSAR-X in 2007 a steady flow of high-resolution SAR data in X-band frequency has been processed and disseminated. The raw SAR data is processed by the TerraSAR-X multi-mode SAR processor at DLR to achieve an optimised geometric and radiometric resolution. In addition to the TerraSAR-X basic products, Airbus Defence and Space provides TerraSAR-X value added geo-information products to a variety of applications. In this paper, three key operational applications were presented. Characterised by high radiometric focusing quality and phase stability, TerraSAR-X surface movement products based on StripMap or High Resolution SpotLight mode imagery have demonstrated an average InSAR phase velocity measurement at a resolution along the line of sight of the sensor, which is equivalent to 1 mm/year.
Similarly, with the advantage of multiple radiometric looks in azimuth and an orbital stability better than 10 cm, the application of ground control points from Staring SpotLight images, provides absolute geolocation accuracy RMSE of < 0.85 m.
In the field of automated target detection and recognition, armed with a large number of training images and objects and advances in deep machine learning techniques, new challenges are tackled, and a fresh wave of products are currently being developed. Thanks to both radiometric stability, absolute geometric focusing and driven by high-resolution training signatures, the operational machine learning application has achieved an average precision of 88% to 97% for selected targets.
The advances in development of operational applications fuel the design requirements for the next generation of synthetic aperture radar satellites as follow-on missions to the current constellation. Based on current achievements, the new era of high-resolution wide swath sensors has started. The importance of high-resolution imagery with greater orbital accuracy and highly focused and stable radiometric quality are vital needs of the follow-on missions.
Author Contributions
O.L. and J.J. supervised and administrated the contribution of all authors, reviewed and edited the manuscript. W.K. wrote the total manuscript for Ground Control Points experiment. D.W., J.A. and O.L. designed analyzed, validated results and wrote the manuscript for Surface Movement Monitoring. P.L. contributed to literature review and assembly of all results for Automatic Target Recognition. C.S. and T.K. designed Deep Neural Network architecture and performed all ATR analysis.
Funding
This research received no external funding.
Conflicts of Interest
The authors declare no conflict of interest.
References
- Perissin, D.; Ferretti, A. Urban-Target Recognition by Means of Repeated Spaceborne SAR Images. IEEE Trans. Geosci. Remote Sens. 2007, 45, 4043–4058. [Google Scholar] [CrossRef]
- Airbus Defence and Space Case Studies. Available online: http://www.intelligence-airbusds.com/en/6988-case-study-gallery-details?item=41559&products_services={Case_Study:Products__Services:value}&search=&market=2397&keyword= (accessed on 12 September 2018).
- Ferretti, A.; Prati, C.; Rocca, F. Permanent Scatterers in SAR Interferometry. IEEE Trans. Geosci. Remote Sens. 2001, 39, 8–20. [Google Scholar] [CrossRef]
- Berardino, P.; Fornaro, G.; Lanari, R.; Sansosti, E. A New Algorithm for Surface Deformation Monitoring Based on Small Baseline Differential SAR Interferograms. IEEE Trans. Geosci. Remote Sens. 2002, 40, 2375–2383. [Google Scholar] [CrossRef]
- Bodenbewegungsdienst Deutschland (BBD). Available online: https://www.bgr.bund.de/DE/Themen/Erdbeben-Gefaehrdungsanalysen/Fernerkundliche_Gefaehrdungsanalysen/fernerkundliche_gefaehrdungsanalysen_node.html (accessed on 12 Sep 2018).
- Harris Geospatial Solutions. SARscape Help Manual. Available online: https://www.harrisgeospatial.com/docs/pdf/sarscape_5.1_help.pdf (accessed on 31 July 2018).
- Eineder, M.; Minet, M.C.; Steigenberger, P.; Cong, X.; Fritz, T. Imaging Geodesy—Towards Centimeter-Level Ranging Accuracy with TerraSAR-X. IEEE Trans. Geosci. Remote Sens. 2011, 49, 661–671. [Google Scholar] [CrossRef]
- Fritz, T.; Eineder, M. TerraSAR-X Basic Product Specification Document. TX-GS-DD-3302. Airbus DS 2014. Available online: http://www.intelligence-airbusds.com/en/228-terrasar-x-technical-documents (accessed on 12 December 2014).
- Raggam, H.; Almer, A. Mathematical Aspects of Multi-Sensor Stereo Mapping. In Proceedings of the 1990 IEEE International Geoscience and Remote Sensing Symposium (IGRASS): Remote Sensing—Science for the Nineties, Washington, DC, USA, 20–24 May 1990. [Google Scholar]
- Koppe, W.; Wenzel, R.; Hennig, S.; Janoth, J.; Hummel, P.; Raggam, H. Quality assessment of TerraSAR-X derived ground control points. In Proceedings of the 2012 IEEE International Geoscience and Remote Sensing Symposium (IGRASS), Munich, Germany, 22–27 July 2012. [Google Scholar]
- Raggam, H.; Perko, R.; Gutjahr, K.H.; Koppe, W.; Kiefl, N.; Hennig, S. Accuracy Assessment of 3D Point Retrieval from TerraSAR-X Data Sets. In Proceedings of the 2010 EUSAR European Conference on Synthetic Aperture Radar, Aachen, Germany, 7–10 June 2010. [Google Scholar]
- Hummel, P. Remotely Sensed Ground Control Points; Compass Data Inc.: Centennial, CO, USA, 2014; Available online: http://www.compassdatainc.com (accessed on 12 December 2014).
- Koppe, W.; Hennig, S.; Henrichs, L. 3D Point Measurement from Space Using TerraSAR-X HS and ST Stereo Imagery. In Proceedings of the DGPF (German Society for Photogrammetry, Remote Sensing and Geoinformation) Conference, Köln, Germany, 16–18 March 2015. [Google Scholar]
- Mizell, E.; Biery, R. Introduction to GPUs for Data Analytics Advances and Applications for Accelerated Computing; O’Reilly Media, Inc.: Sebastopol, CA, USA, 2017; Available online: https://www.networld.co.jp/files/9615/0846/8069/GPUs_Data_Analytics_Book.pdf (accessed on 4 June 2018).
- Dertat, A. Applied Deep Learning—Part 4: Convolutional Neural Networks, @ Pinterest Nov 8, 2017. Available online: https://towardsdatascience.com/applied-deep-learning-part-4-convolutional-neural-networks-584bc134c1e2 (accessed on 4 June 2018).
- Huang, Z.; Pan, Z.; Lei, B. Transfer Learning with Deep Convolutional Neural Network for SAR Target Classification with Limited Labeled Data. Remote Sens. 2017, 9, 907. [Google Scholar] [CrossRef]
- Kroll, C.; von der Werth, M.; Leuck, H.; Stahl, C.; Schertler, K. Combining high-speed SVM learning with CNN feature encoding for real-time target recognition in high-definition video for ISR missions. In Proceedings of the SPIE, Automatic Target Recognition XXVII, Anaheim, CA, USA, 1 May 2017; Volume 10202, p. 1020208. [Google Scholar]
- Schertler, K.; Liebelt, J. Automatic Learning Method for the Automatic Learning of Forms of Appearance of Objects in Images. U.S. Patent No. 9361543B2, 7 June 2016. [Google Scholar]
- Evers, C.M. Novel Techniques for Enhancing SAR Imaging Using Spatially Variant Apodization. Master’s Thesis, The Graduate School of The Ohio State University, Columbus, OH, USA, 2011. [Google Scholar]
- Novak, L.M.; Hesse, S.R. Optimal polarizations for radar detection and recognition of targets in clutter. In Proceedings of the Automatic Object Recognition II, Aerospace Sensing, Orlando, FL, USA, 16 September 1992; Volume 1700. [Google Scholar] [CrossRef]
- TerraSAR-X Image Product Guide, Basic and Enhanced Radar Satellite Imagery; Issue 2.1, Airbus Defence and Space: Ottobrunn, Germany, 2015.
- Huang, F.J.; LeCun, Y. Large-scale learning with SVM and convolutional nets for generic object categorization. In Proceedings of the IEEE Conference on Computer Vision and Pattern Recognition, New York, NY, USA, 17–22 June 2006; pp. 284–291. [Google Scholar]
Figure 1.
Semi-automated interferometric time series processing and post-processing steps.

Figure 2.
Time-position plot of SBAS connection graph for the used scenes in the case study (left figure). TerraSAR-X scenes were acquired on the listed dates in the table on the right.
Figure 2.
Time-position plot of SBAS connection graph for the used scenes in the case study (left figure). TerraSAR-X scenes were acquired on the listed dates in the table on the right.

Figure 3.
Selection of operational TerraSAR-X surface movement products for an opencast mining region with known tectonic faults (black hatching lines of ISGK100 © Geologischer Dienst North Rhine-Westphalia 2018): (a) Vertical movement velocities in the AOI of 13 × 13 km2; (b) Subset area (white rectangle in (a) with Surface Movement Monitoring (SMM) measurement pixels in Horrem (Kerpen, Germany); (c) SMM railway allocation product; (d) SMM road allocation product; (e) SMM building allocation product; (f) SMM enhanced product with marking of buildings and railway sections with maximum tilts > 0.3 mm/m in a detailed area. Background: World Imagery (Source: Esri, Digital Globe, GeoEye, Earthstar Geographics) and OSM data (© OpenStreetMap).


Figure 4.
Time series of vertical displacements (plotted points) and linear regression line (solid line) on selected measurements positions in Figure 3b. (a) refers to the points P1 and P2, shown in Figure 3b. Though spatially adjacent the temporal displacement of both points significantly differs. (b) refers to point P3 and represents the subsiding tendency of a waste disposal site.

Figure 5.
Stereo image configuration for Ground Control Points (GCP) calculation.

Figure 6.
Overview of the area of interest (Denver, USA) and selected points for ground coordinate measurements. The white box indicates the subset in Figure 7.
Figure 6.
Overview of the area of interest (Denver, USA) and selected points for ground coordinate measurements. The white box indicates the subset in Figure 7.

Figure 7.
Signal response of a point target (centre peak) in the TerraSAR-X ST image as marked with white box in Figure 6.
Figure 7.
Signal response of a point target (centre peak) in the TerraSAR-X ST image as marked with white box in Figure 6.

Figure 8.
Automatic Target Recognition (ATR) real-time processing steps emulated on a stand-alone computer using Synthetic Aperture Radar (SAR)-specific feature extractor and frequency domain high-speed Support Vector Machine classifier.
Figure 8.
Automatic Target Recognition (ATR) real-time processing steps emulated on a stand-alone computer using Synthetic Aperture Radar (SAR)-specific feature extractor and frequency domain high-speed Support Vector Machine classifier.

Figure 9.
Adaptation and processing steps of Deep Convolutional Neural Network for SAR ATR.

Figure 10.
Number of TerraSAR-X images per season for each location.

Figure 11.
Ground range resolution of TerraSAR-X images for each location.

Figure 12.
Performance of the processor for each target on tested data.

Figure 13.
Target detection and classification of TerraSAR-X Staring SpotLight images for Ryazan airbase.
Figure 13.
Target detection and classification of TerraSAR-X Staring SpotLight images for Ryazan airbase.


Table 1.
TerraSAR-X data over south west Denver, USA acquired with Staring SpotLight (ST) mode (rg—range, az—azimuth).
Table 1.
TerraSAR-X data over south west Denver, USA acquired with Staring SpotLight (ST) mode (rg—range, az—azimuth).
| ID | Acquisition Mode | Date | Orbit Direction | Incidence Angle (°) | Resolution rg/az (m) |
|---|---|---|---|---|---|
| 1 | ST | 09.05.2014 | Descending | 42.5 | 0.88/0.38 |
| 2 | ST | 15.05.2014 | Descending | 53.5 | 0.74/0.32 |
| 3 | ST | 08.06.2014 | Ascending | 35.8 | 1.03/0.44 |
Table 2.
Absolute and relative 3D geolocation accuracies for retrieved GCPs from TerraSAR-X ST data (n = 12) [13].
Table 2.
Absolute and relative 3D geolocation accuracies for retrieved GCPs from TerraSAR-X ST data (n = 12) [13].
| ΔE (m) | ΔN (m) | ΔH (m) | Δ Horizontal (m) | Δ Spatial (m) | |
|---|---|---|---|---|---|
| Mean | −0.28 | −0.39 | −0.07 | 0.68 | 0.83 |
| RMSE | 0.48 | 0.54 | 0.44 | 0.73 | 0.85 |
Difference in planimetric East (ΔE) and North (ΔN), as well as Height of measured GCP compared to DGPS measurements (ΔH).
Table 3.
Aircraft dimensions for four targets considered in the ATR experiment.
| Aircraft Model | Length (m) | Height (m) | Wing Span (m) |
|---|---|---|---|
| Bear (Tupolev Tu-95) | 46.2 | 12.1 | 50.1 |
| Backfire (Tupolev Tu-22) | 42.4 | 11.0 | 34.3 or 23.3 |
| Midas/Candid (Ilyushin IL-76M) | 46.6 | 14.7 | 50.6 |
| Colt (Antonov An-2) | 12.4 | 4.1 | 14.2 lower, 18.2 upper wing |
Table 4.
Average precision (AP) results of Automatic Target Recognition based on DCNN and frequency domain SVM classifier.
Table 4.
Average precision (AP) results of Automatic Target Recognition based on DCNN and frequency domain SVM classifier.
| Aircraft Model | AP |
|---|---|
| Bear (Tupolev Tu-95) | 97% |
| Backfire (Tupolev Tu-22) | 96% |
| Midas/Candid (Ilyushin IL-76M) | 88% |
| Colt (Antonov An-2) | 100% |
© 2018 by the authors. Licensee MDPI, Basel, Switzerland. This article is an open access article distributed under the terms and conditions of the Creative Commons Attribution (CC BY) license (http://creativecommons.org/licenses/by/4.0/).
Share and Cite
MDPI and ACS Style
Lang, O.; Lumsdon, P.; Walter, D.; Anderssohn, J.; Koppe, W.; Janoth, J.; Koban, T.; Stahl, C. Development of Operational Applications for TerraSAR-X. Remote Sens. 2018, 10, 1535. https://doi.org/10.3390/rs10101535
AMA Style
Lang O, Lumsdon P, Walter D, Anderssohn J, Koppe W, Janoth J, Koban T, Stahl C. Development of Operational Applications for TerraSAR-X. Remote Sensing. 2018; 10(10):1535. https://doi.org/10.3390/rs10101535
Chicago/Turabian StyleLang, Oliver, Parivash Lumsdon, Diana Walter, Jan Anderssohn, Wolfgang Koppe, Jüergen Janoth, Tamer Koban, and Christoph Stahl. 2018. "Development of Operational Applications for TerraSAR-X" Remote Sensing 10, no. 10: 1535. https://doi.org/10.3390/rs10101535
Note that from the first issue of 2016, this journal uses article numbers instead of page numbers. See further details here.