Feasibility, Design, and Deployment Requirements of TCR for Bistatic SAR Radiometric Calibration


1
Institute of Electronics, Chinese Academy of Sciences, National Key Laboratory of Science and Technology on Microwave Imaging, Beijing 100190, China
2
University of Chinese Academy of Sciences, Beijing 100049, China
3
China Center for Resources Satellite Data and Application, Beijing 100094, China
*
Authors to whom correspondence should be addressed.
Remote Sens. 2018, 10(10), 1610; https://doi.org/10.3390/rs10101610
Submission received: 13 July 2018
/
Revised: 27 August 2018
/
Accepted: 5 October 2018
/
Published: 10 October 2018
Abstract
:The trihedral corner reflector (TCR) is widely used as the calibration device in monostatic synthetic aperture radar (SAR) calibration, and the performance of the TCR in radiometric calibration has been studied and verified in depth. As for the bistatic SAR system calibration problem, there have been few published studies. There is a lack of knowledge regarding the exact bistatic radar cross-section (RCS) pattern of TCR with different bistatic angles, and it is also not clear whether the TCR can be used as the calibration target in bistatic SAR. Moreover, the bistatic and monostatic radar cross-section (RCS) characteristics of the TCR are different, even if the bistatic angle is very small. Therefore, the feasibility, design, and deployment requirements of the TCR for bistatic SAR calibration should be carefully investigated. In this paper, we outline the theoretical and practical requirements that need to be satisfied when choosing appropriate calibration devices for bistatic radiometric calibration. Based on these requirements, we analyzed the bistatic RCS patterns using electromagnetic simulation, and concluded that the TCR is feasible for bistatic SAR calibration under relatively small bistatic angles (less than 6°). The change of TCR boresight with the bistatic angle is not considered generally. However, we found that the TCR boresight and peak RCS will change with the bistatic angle. We have also proposed that the bistatic angle can be extended to 20° by taking the change of the TCR boresight into account. In this condition, we should get the TCR boresight according to the bistatic angle and then align it during the deployment. Both of these two conditions have their own unique advantages. Different error sources of TCR RCS from manufacture, misalignment, and deformation were investigated quantitatively with simulations, which can provide a theoretical basis for how to design a suitable TCR and guarantee the calibration accuracy for bistatic calibration. In addition, simulation results are different from those of monostatic calibration. Through experiments, we have further verified the feasibility by comparing the quality of bistatic SAR images and point target energy with several typical bistatic angles as the TCR boresight is considered or not. If the bistatic angle is larger than 6°, taking the TCR optimum boresight into account can improve imaging quality and point target energy.

1. Introduction
The radiometric calibration theory and technique of the monostatic SAR system have been considerably improved in the past, and the relevant problem has been extensively studied and well understood [1,2,3]. Numerous canonical passive reflectors have been proven to be suitable as monostatic calibration targets such as spheres, dihedrals, and trihedrals. From the first decade of this century, great interest in the bistatic synthetic aperture radar (SAR) system has been arisen rapidly given its special merits in various microwave remote sensing applications [4,5,6]. However, for the bistatic SAR system, the calibration problem is significantly more complex, and limited bistatic SAR calibration theory and experiments have been reported in the literature. The main reason may be due to the lack of suitable calibration targets introduced by the bistatic SAR observation geometry. Therefore, the design of appropriate calibration targets and the investigation of their performances in the SAR image are the first and foremost issues in bistatic SAR radiometric calibration.
At present, several bistatic calibration methods based on point targets have been proposed, which can be roughly divided into two categories. One idea is to use an active calibration target with a high radar cross-section (RCS) over a large frequency range that can be easily configured for different bistatic angles [7,8,9]; however, active calibration targets are expensive and complex to manufacture. The other view is to utilize passive calibration targets. In 2003, a passive cross-polarization bistatic calibration target was designed for RCS measurements [10]. Although this device performed well over a wide frequency range, it was very complicated to design and manufacture. Trihedral corner reflectors (TCRs) are generally considered not suitable for bistatic SAR calibration with large bistatic angles [11]. One bistatic SAR experiment has been reported using TCR, but failed to perform bistatic radiometric calibration [12], which may be due to the lack of an exact bistatic RCS pattern and not considering the design and deployment requirements. Theoretically, spheres can be considered as good calibration targets at arbitrary bistatic angles, but their relative low RCS restricts their practicability.
The TCR is perhaps the most practical device for calibrating monostatic SAR systems. The monostatic RCS pattern of TCR has a 3-dB beamwidth of approximately 40° in both the azimuth and elevation dimensions, which means that it is much more tolerant to field alignment errors [13]. It is also relatively inexpensive to manufacture, and can be produced in large quantities. Consequently, the TCR have been used as the standard calibration target in monostatic SAR radiometric calibration for many years. However, knowledge on the bistatic calibration performance of TCR is inadequate or questionable; in particular, its feasibility for bistatic SAR with different bistatic angles is not so clear. Therefore, it is important and meaningful to analyze the TCR RCS characteristics, reexamine their feasibility, and subsequently analyze the design and deployment requirements of this classical passive calibration target in bistatic SAR radiometric calibration.
The TCR has a very narrow bistatic pattern when the bistatic angle is used as an independent variable [8]. Therefore, it should be noted that the bistatic pattern discussed in this paper used the incident angle as an independent variable, rather than the bistatic angle, and we just analyzed the RCS characteristics of the TCR for bistatic SAR tandem mode radiometric calibration. The bistatic SAR tandem mode, whose transmitting and receiving antennas are spatially separated by a fixed distance (i.e., baseline) along the flight track of the SAR platform, can ensure that the bistatic angle is unchanged during the movement. One example for the tandem mode is the interferometric cartwheel [14]. Similarly, there are other distributed spaceborne SAR or constellation systems with a relatively small and fixed bistatic angles [15,16] along, across, or at the hybrid of the flight tracks. For example, TanDEM-X is the first genuinely bistatic SAR system in space, and the working mode includes monostatic, bistatic, and alternating bistatic mode. The first bistatic spaceborne SAR experiments was made as the bistatic angle is 1.8°, and then obtained the good quality bistatic image [17]. The Argentine SAOCOM constellation comprises two L-band satellites, SAOCOM-1A and SAOCOM-1B, which will be monitoring for the mitigation of the effects of natural disasters.
This paper is structured as follows. Section 2 is devoted to outlining the requirements of the calibration target for radiometric calibration. The bistatic RCS pattern of the TCR is analyzed in Section 3 through electromagnetic simulations as the bistatic angle fixed in azimuth. Section 4 analyzes the various error factors of the TCR RCS quantitatively, including machining, deployment, and thermal deformation errors. In Section 5, the quality of the bistatic SAR images of the TCR with different bistatic angles are analyzed. The discussion and conclusions are finally drawn in Section 6 and Section 7, respectively.
2. Requirements of Calibration Target for Radiometric Calibration
Knowing how to select a calibration target is critical when evaluating the feasibility of a certain calibration target for bistatic SAR radiometric calibration. The calibration targets, including passive corner reflectors and active calibration targets, play an important role in SAR radiometric calibration. In the following, we discuss the basic requirements that should be considered when designing suitable calibration targets for radiometric calibration, including the beamwidth, the stability of the RCS, and the signal-to-clutter ratio (SCR). These requirements are derived from monostatic SAR radiometric calibration in principle; however, they are also prerequisites for determining the feasibility of bistatic SAR calibration targets.
2.1. The Beamwidth Requirement
For an antenna or reflector pattern, the beamwidth is a physical quantity that characterizes the angle range between certain power points (generally half power or so-called 3 dB) of the main lobe, when referenced to the peak effective radiated power of the main lobe. The wider the 3-dB beamwidth of a calibration target, the easier it is to align to the SAR antenna. The beamwidth requirement is that the beamwidth of the calibration target should be larger than the SAR antenna beamwidth, especially the azimuth beamwidth of the calibration target. Using the Sentinel-1 SAR calibration as an example, the first criterion can be expressed mathematically as follows [18]:
where is the beamwidth of the Sentinel-1 SAR antenna given by the sum of the SAR antenna azimuth beamwidth and the yaw attitude stability of antenna ; and is the monostatic azimuth beamwidth of the calibration target, which should be larger with respect to the . Obviously, Equation (1) is still valid for a bistatic situation, when stands for the bistatic azimuth beamwidth of the calibration targets.
In fact, the TCR has a wide monostatic pattern (TCR RCS versus incident angle), but a very narrow bistatic pattern (TCR RCS versus bistatic angle) that is different from the pattern we usually define [8], and the 3-dB bistatic beamwidth can be written as:
where is the length of the hypotenuse sides of the TCR, and is the frequency. The 3-dB bistatic beamwidth is less than 4° for a 0.4-m TCR at X-band. It should be noted that the beamwidth and bistatic pattern discussed in this paper used the incident angle as an independent variable, and not the bistatic angle (angle between the incident and backscattered wave), if not specified.
2.2. The Stability of RCS Requirement
The RCS of the target determines the power density returned to the radar for a particular power density incident on the target [19], so a natural requirement for a calibration target is that its RCS should be stable to allow radiometric calibration results with repeatability, where the stability of RCS refers to variation over frequency, due to the frequency having a great influence on the target RCS. For passive calibration targets, according to electromagnetic theory, the target RCS or backscattering characteristic can be divided into three regions, including the Rayleigh region (), resonance region (), and optical region () [20], where is the wavenumber, and represents the feature size (e.g., radius of a sphere, interleg length of a TCR) of the passive target. Passive calibration targets will show a stable RCS when they work within the optical region. As shown in Figure 1, the target RCS is stable, and can be estimated accurately in the optical region. Therefore, the requirement for the stability of the RCS is that the feature size of the TCR must meet the optical region. We calculated that can ensure RCS stability at the X-band.
2.3. The SCR Requirement
To work as a calibration target, the target must be distinguished from the surrounding background scatterers (often termed clutter), which means that the target must have a large enough RCS to ensure sufficient visibility. The measure of visibility in a SAR image is the target SCR, and is defined as [13]:
where is the RCS of the calibration target, is the background clutter RCS, is the normalized average clutter RCS (i.e., the clutter backgrounding coefficient), the subscript stands for the transmitted and received polarization of the radar signal, is the radar incident angle, and are the azimuth and range sampling interval of the SAR images, respectively.
Generally, the SCR is directly related to radiometric calibration accuracy [21], as shown in Figure 2. A SCR of at least 25 dB is desired to guarantee that the radiometric calibration error is less than 0.5 dB, which is normally used as a fundamental requirement for the SAR radiometric calibration experiment. The bistatic backscattering coefficient of dry grass, when the radar incident angle is 20°, is likely to be −10 dB at the X-band [22], and we can obtain a calibration target RCS of at least about 11 dBm2 when the SCR is 25 dB, and the azimuth and range sampling interval are both 0.5 . In practice, the background reflections should be as small as possible. It is important to carefully consider the deployment of calibration targets to restrict the influence of background clutter [23].
3. Bistatic RCS Characteristics
To select and design proper calibration targets, knowledge of the bistatic RCS characteristics of calibration targets is indispensable according to the requirements listed in Section 2. The term RCS is a measure of power scattered in a given direction when a target is illuminated by an incident wave from radar. The RCS can be expressed by the electric field strength [20]:
where is the electric field strength of the incident wave impinging on the target, is the electric field strength of the scattered wave at the radar, and R is the range from the radar to the target.
This definition applies to both monostatic and bistatic target RCSs. However, the target RCS depends on the transmitting and receiving direction. Therefore, the bistatic RCS is generally not equal to the monostatic RCS. Figure 3 depicts both monostatic and bistatic radar configurations. A monostatic system uses a single location for both the transmitter and receiver, whereas a bistatic system locates the transmitter and receiver separately, and the angle between the transmitter and receiver is the bistatic angle.
At present, there have been many studies on monostatic RCSs for different types of targets, but little information on bistatic RCSs. The TCR is widely used as a calibration target in monostatic SAR radiometric calibration, but the characteristic of its real bistatic RCS, especially the exact bistatic RCS pattern, is not clear in bistatic SAR calibration. In order to solve this problem, we considered two approaches in the following: one based on the monostatic bistatic equivalence theorem, and the other was electromagnetic simulation at the X-band (9.6 GHz), and the TCR had inner-leg dimensions of 0.4 m to acquire stable RCS characteristics within the optical region.
3.1. Monostatic Bistatic Equivalence Theorem
The monostatic bistatic equivalence theorem indicates that the bistatic RCS can be approximated by the monostatic RCS measured on the bistatic angle bisector and measured at times lower than the true frequency for small bistatic angles [24], which can be written by:
where is the incident angle and is the bistatic angle.
Consider a TCR with sides comprised of isosceles right triangles. With the geometry defined as per Figure 4, by using geometrical optics approximation theory, the RCS of a TCR can be formulated as [25]:
where are each assigned one of:
where is the radar wave length, is the effective aperture of a trihedral, is the elevation angle, and is the azimuth angle.
As shown in Figure 5, the bistatic RCS azimuth patterns versus the azimuth angles of the TCR under different bistatic angles were simulated by using the monostatic bistatic equivalence theorem. It can be seen that the main lobe of the RCS patterns were very wide and flat, and the bistatic RCS values for different bistatic angles obtained by the monostatic bistatic equivalence theorem were similar to the monostatic RCS value near the peak. However, the azimuth angles corresponding to the peak RCS were different due to the monostatic RCS measured on the bistatic angle bisector.
3.2. FEKO Electromagnetic Simulation
FEKO is a simulation software for three-dimensional (3D) structural electromagnetic field analysis, and offers a variety of core algorithms such as the Method of Moments (MOM), Physical Optics (PO), Multilevel Fast Multipole Method (MLFMM), Finite Element Method (FEM), Uniform Theory of Diffraction (UTD), and several of the above algorithms are used together. In addition, theoretical analysis or simulation computation has been used as a standard for RCS analysis and evaluation of the calibration target. Paper [26] has concluded that FEKO’s RCS is more reliable and accurate than the results of the normal anechoic chamber. So, we give the results of FEKO electromagnetic simulation. Combining the MOM with the MLFMA to calculate the RCS of TCR under different bistatic angles has the advantages of shortening the calculation time and having a high accuracy. The bistatic RCS observation geometry of TCR is shown in Figure 6, where is the elevation angle, is the azimuth angle, and is the bistatic angle. We get the bistatic RCS azimuth pattern at different bistatic angles with the elevation angle fixed at 54.74° and the bistatic angle illustrated in the azimuth.
As shown in Figure 7, the bistatic RCS azimuth patterns of the TCR were simulated using the FEKO electromagnetic simulations. It can be seen that the main lobe of the bistatic RCS pattern became highly rippled and dramatically lower with the bistatic angle increasing. Furthermore, the peak RCS and beamwidth varied greatly for different bistatic angles, so even in the case of a small bistatic angle, the monostatic and bistatic RCS characteristics are different. However, the peak RCS for different bistatic angles corresponded to different azimuth angles, which was the same as the results obtained by using the monostatic bistatic equivalence theorem.
By comparing the results of the FEKO electromagnetic simulations (see Figure 7) and those of the monostatic bistatic equivalence theorem (see Figure 5), it was found that the peak RCS and the beamwidth of the two results were different for the same bistatic angle. The TCR is specifically designed to be a backscatter, and the coherent addition of the waves work only in that direction. In most of the other directions, i.e., the bistatic condition, there is very little scattering, and in all of the other directions, the scatter is less than in the backscatter [24]. It has a narrow backscattering lobe, with the beamwidth of the lobe proportional to the wavelength divided by a characteristic length of the trihedral, so the TCR would be the worst case for the monostatic bistatic equivalence theorem. Therefore, it is not suitable to use the equivalence theorem to compute the bistatic RCS of TCR. For these reasons, the computation of the bistatic RCS characteristics of the TCR in this paper were based on the FEKO electromagnetic simulations.
As shown in Figure 7, when the bistatic angle is larger than 6°, the ripples are too large and dramatic to align the peak RCS pointing of the TCR with the SAR antenna’s boresight. Therefore, the RCS becomes unpredictable, which would degrade the SAR image quality and induce radiometric calibration errors. For bistatic angles of less than 6°, the bistatic RCS patterns of TCR are wide, with a beamwidth up to 30°, so it satisfies the beamwidth requirement of the calibration target when the bistatic SAR is working in tandem mode. On the other hand, the peak RCS is more than 15 dB, and also satisfies the SCR requirements that were discussed in Section 2.
As is widely known, the TCR boresight of the maximum RCS is for monostatic SAR. We got the bistatic RCS azimuth patterns (Figure 7) with the elevation angle fixed at 54.74°. The results of previous studies about TCR for bistatic SAR calibration may be obtained in this case [11]. However, we found the elevation angle of the peak RCS for different bistatic angles are different, as shown in Figure 8a. The main lobe is gradually disappearing and the energy is moving to the side lobe when the bistatic angle is greater than 20°, so we set 20° as the upper limit for the range of feasible bistatic angle. Then, we got the bistatic RCS azimuth patterns of the TCR as the elevation angle corresponding to its individual peak RCS, as shown in Figure 8b. It can be seen that the bistatic RCS patterns are still wide and flat, even when the bistatic angle increases beyond 6°. These azimuth patterns in Figure 8b are different from those of Figure 7, and the peak RCSs are larger than those of Figure 7 at the same bistatic angle. So, we concluded that the TCR can be used as the bistatic calibration target as the bistatic angle increases below 20°. In this condition, we should align the TCR boresight according to the bistatic angle during the deployment, instead of just fixing the elevation angle at 54.74°. However, the lower peak RCS will affect the SCR as the bistatic angle become larger.
Combined with the electromagnetic simulation results and the above analysis, the results can be divided into two aspects. On the one hand, if we don’t consider the change of TCR boresight with the bistatic angle, the TCR is not suitable for bistatic SAR calibration under large bistatic angles. Furthermore, the TCR meets the requirements of the calibration target for bistatic radiation calibration under the condition of small bistatic angles (less than 6°) when the bistatic SAR is working in tandem mode. On the other hand, we have also proposed that the bistatic angle can be extended to 20° by taking the change of the TCR boresight into account. In summary, if the TCR is aligned with the optimum boresight according to the bistatic angle during the deployment, it can also work at relatively large bistatic angles at the cost of sacrificing the SCR.
4. Error Factors of TCR RCS
In Section 3, the bistatic RCS characteristics of the TCR were analyzed, which indicated that the TCR could meet the requirements listed in Section 2. For practical calibration of a bistatic SAR, it is very important to ensure the accurate RCS of the calibration targets. There are several error factors that can introduce a change of RCS for the TCR, including that limited machining accuracy will mainly cause the interplate to be nonorthogonal and the interleg length to not reach the standard during the manufacturing process. Moreover, the TCR deviates from the design route during the deployment, or the attitude error (yaw, pitch, and roll) caused the deviation of the platform, which will result in the pointing deviation. In addition, thermal deformation caused by the environment will also change the interleg length. Proper control of the above errors will guarantee or improve the accuracy of the bistatic SAR radiometric calibration. In order to meet the RCS accuracy requirement, we analyzed the error factors such as interplate orthogonality, machining error of length, pointing deviation, and thermal deformation quantitatively with electromagnetic simulations. Furthermore, the machining tolerance, deployment requirements for pointing, and deformation tolerance are recommended in this section.
4.1. Interplate Orthogonality
The interplate orthogonality means ensuring the angle between the two plates is 90° at their intersections, but in practical manufacturing, the plates need to be assembled together such as using welding or other techniques, so it is difficult to ensure the orthogonality between the two plates. When analyzing the bistatic RCS observation geometry of the TCR (see in Figure 6), points A and B move outward or inward, and each point moves (), respectively. In this condition, points A and B are still in the XOY plane, and ; we can calculate the azimuth bistatic RCS pattern.
Define as the peak RCS reduction of the trihedral:
where is the peak RCS of the ideal TCR, and is the peak RCS of the TCR with errors. The effect of the interplate angle deviations on RCS can be obtained, and we can also calculate the relationship between the interplate angle errors and the peak RCS errors, as shown in Figure 9.
When only the angle between the two vertical plates is varied, we found that the RCS changes were negligible, as the interplate angle was smaller than 0.5°. For monostatic calibration, the interplate angle error will result in a reduction in RCS. However, the effect of interplate angle error on the RCS at different bistatic angles is irregular, which may be due to the complexity of the bistatic system, and the interplate angle error will change the original structure of the TCR. Even in the case of small bistatic angle (less than 6°), the RCS errors are negative numbers, as the interplate angle is less than 90° (i.e., the interplate angle errors are negative numbers). The errors were more severe when the interplate angle was more than 90°, rather than less than 90°. The current level of machining can ensure the interplate angle error is less than 0.5°, and the maximum RCS error will not exceed 0.2 dB for different bistatic angles. Generally, the RCS loss of the TCR is about 0.23 dB if the interplate angle deviation is 0.5° for monostatic calibration [27]. So, RCS errors due to interplate angle errors are more severe for monostatic calibration at this machining level. Moreover, the interplate angle deviation will only cause a loss of RCS, and will not affect the beamwidth and stability requirements when the TCR is used as a bistatic calibration target.
4.2. Machining Error of Length
The limited machining accuracy will also cause the length of the TCR to not be up to the standard. Figure 10 shows the curve with the machining errors of length and RCS errors. The absolute value of the RCS error is probably proportional to the machining error of length. Again, the changes were more severe when the length decreased rather than increased. In general, the current machining accuracy of length can be guaranteed up to 1 mm, and the relative RCS errors are less than 0.1 dB for different bistatic angles. Figure 10 also shows that a length error of less than 1 mm can result from an RCS error of less than 0.1 dB at the X-band for monostatic calibration, where the RCS error is a little larger than the result of bistatic calibration. Moreover, when the length error exceeds 2 mm, we found that only the bistatic angle is 20°, and the RCS error is larger than that of the monostatic calibration. Similar to the interplate orthogonality, the machining error of length does not affect the application of the TCR for bistatic radiometric calibration.
4.3. Pointing Deviation
In radiometric calibration, it is important to align the TCR boresight with respect to the SAR antenna boresight. Either the attitude measurement errors of the SAR platform and antennas or the pointing of the TCR in the field deployment process will cause the pointing deviation and the final radiometric calibration errors. Here, we focused on the latter from the view of the TCR deployment requirements.
Using a TCR with an interleg length of 0.4 m and a bistatic angle of 2° as an example, the bistatic peak RCS is , and the corresponding boresight is in the direction: , which were obtained from the simulation results in Figure 8. The bistatic RCS pattern was calculated in the range of and , and compared with the peak RCS. The contour map of the azimuth and elevation misalignments is shown in Figure 11.
The RCS reduction becomes greater with the incident direction deviation from the optimum boresight increasing. As shown in Figure 12, we can also get the effect of the pointing deviation on the RCS for different bistatic angles. In the radiometric calibration, it is possible to control the pointing deviation within 0.5° generally. Furthermore, an azimuth deviation of less than 0.5° and elevation deviation of less than 0.5° could introduce no more than 0.5-dB RCS loss at the X-band. However, a pointing deviation of less than 0.5° in azimuth and elevation could make the resulting RCS within about 0.1 dB of the peak value for monostatic calibration [25]. By comparing the two results, we found that the RCS loss due to pointing deviation was more severe for bistatic calibration. Moreover, the RCS loss was more severe for elevation misalignments than for azimuth misalignments, so the elevation angle should be adjusted as accurately as possible in deployment.
4.4. Thermal Deformation
The thermal deformation caused by environment mainly changes the length of the TCR, which is similar to the machining error of length. The thermal deformation can be calculated according to the temperature range, and then the relationship between thermal deformation and the corresponding bistatic RCS error can be obtained from Figure 10. Aluminum is commonly used for the construction of plates; the linear thermal expansion coefficient of the aluminum is as the measurement temperature is . For the TCR with a length of 0.4 m, the length will change −0.552–0.368 mm in the temperature range of to . According to Figure 10, it can be seen that the relative change on RCS is very small (less than 0.05 dB) for this temperature range.
To sum up the errors in the above Section 4.1, Section 4.2, Section 4.3 and Section 4.4, it can be concluded that RCS errors due to interplate orthogonality and machining errors of length were more severe for monostatic calibration under the current machining accuracy, and the thermal deformation is similar to the matching error of length. However, the effect of the pointing deviation on the RCS errors was more severe for bistatic calibration when the misalignment is the same. These results indicate that these error factors can introduce different RCS errors for monostatic and bistatic calibration, so we cannot replace the conclusions of monostatic calibration with those of bistatic calibration. Moreover, these results will have important reference values and guidance significance for guaranteeing the calibration accuracy for bistatic SAR calibration.
5. Simulation Experiments
One basic purpose of radiometric calibration is to obtain the absolute calibration constant, which is the corresponding relation between the target RCS and its pixel value in a SAR image. Therefore, either the accurate RCS or accurate pixel value is critical to calibration accuracy. We have described the theoretical requirements, bistatic RCS characteristics, and error factors of the TCR RCS with electromagnetic simulations. In this section, based on the electromagnetic simulation results, bistatic SAR imaging simulation experiments were conducted to analyze the bistatic image quality and the point target energy, and these were compared with several typical bistatic angles as the TCR boresight is considered or not. The bistatic SAR imaging system parameters are shown in Table 1 and the imaging algorithm is the Range–Doppler (RD) algorithm.
The SAR image quality of a point target is a precondition that determines whether to use this target as a calibration target or not. The most common image quality parameters for SAR images are the shape of the impulse response function (IRF). As for a point target, the IRF takes the form of a Dirac delta function, and the image quality parameters of the point target are shown in Figure 13.
The most important image quality parameters of the point target include [28]: (1) impulse response width (IRW); (2) peak side lode ratio (PSLR); and (3) integral side lobe ratio (ISLR). These features are often considered sufficient to judge the quality of the impulse response performance. The IRW refers to the 3-dB width of the main lode, which is also known as image resolution. The PSLR and ISLR are related to the image contrast. PSLR is the ratio of the highest side lobe power to the peak of the response, and the PSLR is usually less than −13 dB. ISLR is the ratio of the energy contained in the side lobe to the energy contained in the main lobe of the impulse response, and the ISLR is usually about −10 dB. The point target accounts for only one or two pixels in the SAR images. Generally, the upsampling operation is a necessary pre-processing step in order to measure the above parameters accurately.
The integral method is commonly used to obtain the absolute calibration constant by measuring the response of the targets. The integrated point target energy is mainly obtained by the difference between the energy of the point target in the integration area and the energy of the adjacent same background area. Typically, the region centered on the peak point is used to describe the target, which includes the target region and the background region [23].
where is the summed energy in the target region, is the energy in the background region, is the number of the samples in the target region, and is the number of samples in the background region.
In the following simulation experiments, the bistatic scattering data, containing amplitude and phase information, obtained by electromagnetic simulations were used in the SAR echo simulation and imaging processing, and then the image quality parameters and point target energy were analyzed. The simulation results were shown in Figure 14, Figure 15 and Figure 16 without the consideration of the TCR boresight, and the image quality analysis parameters and point target energy are shown in Table 2. We can conclude that the main lobe of the TCR image became wider as the bistatic angle increased, which degrades the resolution of the image (i.e., IRW). Otherwise, the point target energy drops quickly with the bistatic angle increasing. Therefore, the increase of bistatic angles will deteriorate the quality of the bistatic SAR image and the point target energy.
As shown in Figure 17, Figure 18 and Figure 19, the simulation results were obtained as the change of TCR boresight is considered, and image quality analysis parameters and point target energy of the TCR are shown in Table 3. As long as the bistatic angle is less than 20°, the image quality was good, and the image quality analysis parameters could meet the general image quality requirements. Otherwise, comparing the simulation results for the 2° bistatic angle in Figure 14 and Figure 17, it can be seen that whether the TCR boresight is considered or not has little effect on imaging when the bistatic angle is small (less than 6°). In addition, if the bistatic angle is larger than 6°, taking the TCR optimum boresight into account can improve the imaging quality and point target energy by comparing the parameters in Table 2 and Table 3.
6. Discussion
After discussing the requirements of SAR radiometric calibration for calibration targets in principle, the feasibility of the TCR for bistatic SAR radiometric calibration at the X-band was investigated. Both electromagnetic simulations and SAR imaging simulation results demonstrated that the TCR can be used as a bistatic SAR calibration target for relatively small bistatic angles (less than 6°) if the boresight for different bistatic angles is not considered. Moreover, the bistatic angle can be extended to 20° by taking the change of the TCR boresight into account, which has solved the problem that the TCR is not suitable for a large bistatic angle [11]. However, the lower peak RCS will affect the SCR as the bistatic angle becomes larger. In order to design an appropriate TCR as the bistatic calibration target, the interleg dimension must be large enough to ensure the target stable RCS characteristics within the optical region. Furthermore, since the SCR is closely related to the radiometric calibration accuracy, if there is to be no more than a 0.5-dB measurement error, the SCR must be at least 25 dB. Otherwise, the target deployment sites should be chosen carefully to consider the clutter characteristics. To further prove the feasibility, the quality of the bistatic SAR images were compared with typical bistatic angles as the TCR boresight is considered or not. However, if the bistatic angle is larger than 6°, taking the TCR optimum boresight into account can improve the imaging quality and point target energy.
The most important considerations when design a suitable TCR for bistatic calibration are the interplate orthogonality, the machining error of length, the pointing deviation, and the thermal deformation. Generally, the simulation results at the X-band imply that if an interplate angle deviation is less than 0.5°, the length error is less than 1 mm, and the pointing deviation is less than 0.5°, the resulting RCS will be within 0.5 dB of the peak value. Under the same accuracy, the requirements regarding those error factors for monostatic and bistatic calibration are different.
The main motivation behind analyzing the TCR is that the bistatic RCS characteristics of the TCR are not so clear, and whether it can be used as a bistatic calibration target is questionable. Moreover, compared to active calibration targets and some passive calibration targets, the performance of TCR is that it is simple to manufacture, efficient to work, and has a relatively high bistatic RCS. Although we have analyzed how to design the TCR at the X-band, it can be easily extended to other bands that are similar to the bistatic SAR. In this paper, the feasibility of the TCR in bistatic tandem mode was validated, i.e., the mode where the bistatic angle appears in the azimuth (along track) direction. However, it was still valid if the bistatic angle was in the slant range (across track) direction or their hybrid.
It must be admitted that the TCR does have limitations in bistatic SAR calibration. First, the feasibility of the TCR is limited to the mode that the bistatic angle is fixed. The bistatic SAR imaging modes are diversified, such as the tandem mode, translation invariant mode, constant velocity mode, and general mode [29]. However, the TCR has a very narrow bistatic pattern regarding the bistatic angles [8] and the 3-dB bistatic beamwidth corresponding to the bistatic angles is less than 4° for a 0.4-m TCR at the X-band, so it cannot be configured to calibrate all of the bistatic modes, especially bistatic modes with a large time-variable bistatic angle. Second, the TCR cannot be configured for all of the bistatic angles due to their rippled bistatic RCS pattern or lower SCR. We concluded that TCR can only be used as a radiometric calibration target for relatively small bistatic angles (less than 6°). If the TCR is aligned with the optimum boresight, it can also work well, as the bistatic angle is less than 20°. For the time-variable bistatic angle or larger bistatic angle (more than 20°), maybe we should analyze an active calibration target.
7. Conclusions
The RCS characteristics and the requirements of radiometric calibration for bistatic SAR were analyzed based on the electromagnetic simulations. We concluded that the TCR could be used as a bistatic calibration target for relatively small bistatic angles (less than 6°). TCR are generally considered not suitable for bistatic SAR calibration with large bistatic angles, but we have proposed that if we consider the TCR boresight changes with the bistatic angle, the bistatic angle can be extended to 20°. Both of these two conditions have their own advantages and disadvantages. If the change of TCR boresight with the bistatic angle is not considered, we just place it according to the TCR boresight of the monostatic calibration; however, it is not suitable for large bistatic angles (more than 6°). In addition, the TCR was considered a good calibration target at a bistatic angle of less than 20°, but we need to know the optimum boresight in advance and align the TCR boresight with respect to the SAR antenna boresight during the deployment. To further verify the feasibility, bistatic SAR image quality and point target energy were analyzed. The importance of the study lies in that we can make full use of the advantages of the TCR, and then solve the problem of applicability and a design that is suitable TCR for bistatic radiometric calibration. Furthermore, the simulation results support that attention should be paid to ensure orthogonality between the three plates, interleg dimensions, and alignment, which will have reference value and guidance significance for the design and utilization of TCR RCS in bistatic SAR calibration.
Author Contributions
J.H. played the leading role in preparing this article. Q.Z. performed the electromagnetic simulations and analyzed the data. Y.W. contributed to the structure and revision of this article and provided insightful comments and suggestions. A.W. provided valuable suggestions and revised the manuscript.
Funding
This research work was partly supported by the NSFC (the National Natural Science Foundation of China, No. 61771453) and Equipment Development Department pre-research fund No. 6140416010202.
Acknowledgments
Thanks go to Yuncheng Bu for providing some plotting supports. The authors would like to thank the anonymous reviewers for their meticulous work in enhancing the quality of this paper.
Conflicts of Interest
The authors declare no conflict of interest.
References
- Gray, A.L.; Vachon, P.W.; Livingstone, C.E.; Lukowski, T.I. Synthetic aperture radar calibration using reference reflectors. IEEE Trans. Geosci. Remote Sens. 1990, 28, 374–383. [Google Scholar] [CrossRef]
- Ulander, L.M.H. Accuracy of using point targets for SAR calibration. IEEE Trans. Aerosp. Electron. Syst. 1991, 27, 139–148. [Google Scholar] [CrossRef]
- El-Darymli, K.; Mcguire, P.; Gill, E.; Power, D.; Moloney, C. Understanding the significance of radiometric calibration for synthetic aperture radar imagery. In Proceedings of the Electrical and Computer Engineering, Toronto, ON, Canada, 4–7 May 2014; Volume 2014, pp. 1–6. [Google Scholar]
- Burkholder, R.J.; Gupta, L.J.; Johnson, J.T. Comparison of monostatic and bistatic radar images. IEEE Antennas Propag. Mag. 2003, 45, 41–50. [Google Scholar] [CrossRef]
- Eigel, R.L.J.; Collins, P.J.; Terzuoli, A.J.; Nesti, G. Bistatic scattering characterization of complex objects. IEEE Trans. Geosci. Remote Sens. 2000, 38, 2078–2092. [Google Scholar] [CrossRef]
- Bezousek, P.; Schejbal, V. Bistatic and Multistatic Radar Systems. Radioengineering 2008, 17, 53–59. [Google Scholar]
- Pienaar, M.; Odendaal, J.W.; Joubert, J.; Cilliers, J.E.; Smit, J.C. Active calibration target for bistatic radar cross-section measurements. Radio Sci. 2016, 51, 515–523. [Google Scholar] [CrossRef] [Green Version]
- Dubois-Fernandez, P.; Cantalloube, H.; Vaizan, B.; Krieger, G.; Horn, R.; Wendler, M.; Giroux, V. ONERA-DLR bistatic SAR campaign: Planning, data acquisition, and first analysis of bistatic scattering behaviour of natural and urban targets. IEE Proc. Radar Sonar Navig. 2004, 153, 214–223. [Google Scholar] [CrossRef]
- Wang, W.Q. Inflight Antenna Pattern Measurement for Bistatic Synthetic Aperture Radar Systems. IEEE Antennas Wirel. Lett. 2007, 6, 432–435. [Google Scholar] [CrossRef]
- Monzon, C. A cross-polarized bistatic calibration device for RCS measurements. IEEE Trans. Antennas Propag. 2003, 51, 833–839. [Google Scholar] [CrossRef]
- Bradley, C.J.; Collins, P.J.; Fortuny-Guasch, J.; Hastriter, M.L.; Nesti, G.; Terzuoli, A.J.; Wilson, K.S. An investigation of bistatic calibration objects. IEEE Trans. Geosci. Remote Sens. 2005, 43, 2185–2191. [Google Scholar] [CrossRef]
- Balke, J. Field test of bistatic forward-looking synthetic aperture radar. In Proceedings of the 2005 IEEE International Radar Conference, Arlington, VA, USA, 9–12 May 2005; Volume 2005, pp. 424–429. [Google Scholar]
- Freeman, A. SAR calibration: An overview. IEEE Trans. Geosci. Remote Sens. 1992, 30, 1107–1121. [Google Scholar] [CrossRef]
- Massonnet, D. Capabilities and limitations of the interferometric cartwheel. IEEE Trans. Geosci. Remote Sens. 2001, 39, 506–520. [Google Scholar] [CrossRef]
- Yocky, D.A.; Wahl, D.E.; Jakowatz, C.V. Bistatic SAR: Imagery & Image Products; SAND2014-18346; Sandia National Laboratories: Albuquerque, NM, USA, 2014. [Google Scholar]
- D’Errico, M. Distributed Space Missions for Earth System Monitoring; Springer: New York, NY, USA, 2013. [Google Scholar]
- Rodriguez-Cassola, M.; Prats, P.; Schulze, D.; Tous-Ramon, N.; Steinbrecher, U.; Marotti, L.; Nannini, M.; Younis, M.; Lopez-Dekker, P.; Zink, M.; et al. First bistatic spaceborne SAR experiments with TanDEM-X. IEEE Geosci. Remote Sens. Lett. 2012, 9, 33–37. [Google Scholar] [CrossRef] [Green Version]
- Lavalle, M.; Pottier, E.; Ainsworth, T.; Solimini, D.; Rosich, B. Calibration of Dual Polarimetric C-Band SAR Data: A Possible Approach for SENTINEL-1. In Proceedings of the Fourth International Workshop on Science and Applications of SAR Polarimetry and Polarimetric Interferometry (PoIInSAR 2009), Frascati, Italy, 26–30 January 2009; Volume 668. [Google Scholar]
- Krishna, R.R.; Krishna, R.M.; Krishna, R.G.; Sekhar, D. Radar Cross Section Prediction for Different Objects Using MATLAB and Radar Cross Section (RCS) Reduction. Int. J. Adv. Res. Comput. Sci. Electron. Eng. 2012, 1, 67–75. [Google Scholar]
- Skolnik, M.I. Radar Handbook; McGraw-Hill: New York, NY, USA, 1970. [Google Scholar]
- Blacksmith, P.J.; Hiatt, R.E.; Mack, R.B. Introduction to radar cross-section measurements. Proc. IEEE 1965, 53, 901–920. [Google Scholar] [CrossRef]
- Cost, S.T. Measurements of the Bistatic Echo Area of Terrain at X-Band. Ph.D. Thesis, The Ohio State University, Columbus, OH, USA, 1965. [Google Scholar]
- Garthwaite, M. On the Design of Radar Corner Reflectors for Deformation Monitoring in Multi-Frequency InSAR. Remote Sens. 2017, 9, 648. [Google Scholar] [CrossRef]
- Kell, R.E. On the derivation of bistatic RCS from monostatic measurements. Proc. IEEE 2005, 53, 983–988. [Google Scholar] [CrossRef]
- Brock, B.C.; Doerry, A.W. Radar Cross Section of Triangular Trihedral Reflector with Extended Bottom Plate; SAND2009-2993; Sandia National Laboratories: Albuquerque, NM, USA, 2009. [Google Scholar]
- Zajc, T.; Thibeault, M.; Azcueta, M.; Ferreyra, J. A Precise Corner Reflector Characterization Technique; Ministry of Science, Technology and Productive Innovation: Caba, Argentina, 2017.
- Craeye, C.; Sobieski, P.; Robin, E.; Guissard, A. Angular errors in trihedrals used for radar calibrations. Int. J. Remote Sens. 1997, 18, 2683–2689. [Google Scholar] [CrossRef]
- Cumming, I.G.; Wong, F.G. Digital Processing of Synthetic Aperture Radar Data; Artech House: Norwood, MA, USA, 2005. [Google Scholar]
- Ender, J. A step to bistatic SAR processing. In Proceedings of the EUSAR, Ulm, Germany, 25–27 May 2004; pp. 356–359. [Google Scholar]
Figure 1.
Radar cross-section (RCS) of a perfectly conducting sphere normalized to the optics value .
Figure 1.
Radar cross-section (RCS) of a perfectly conducting sphere normalized to the optics value .
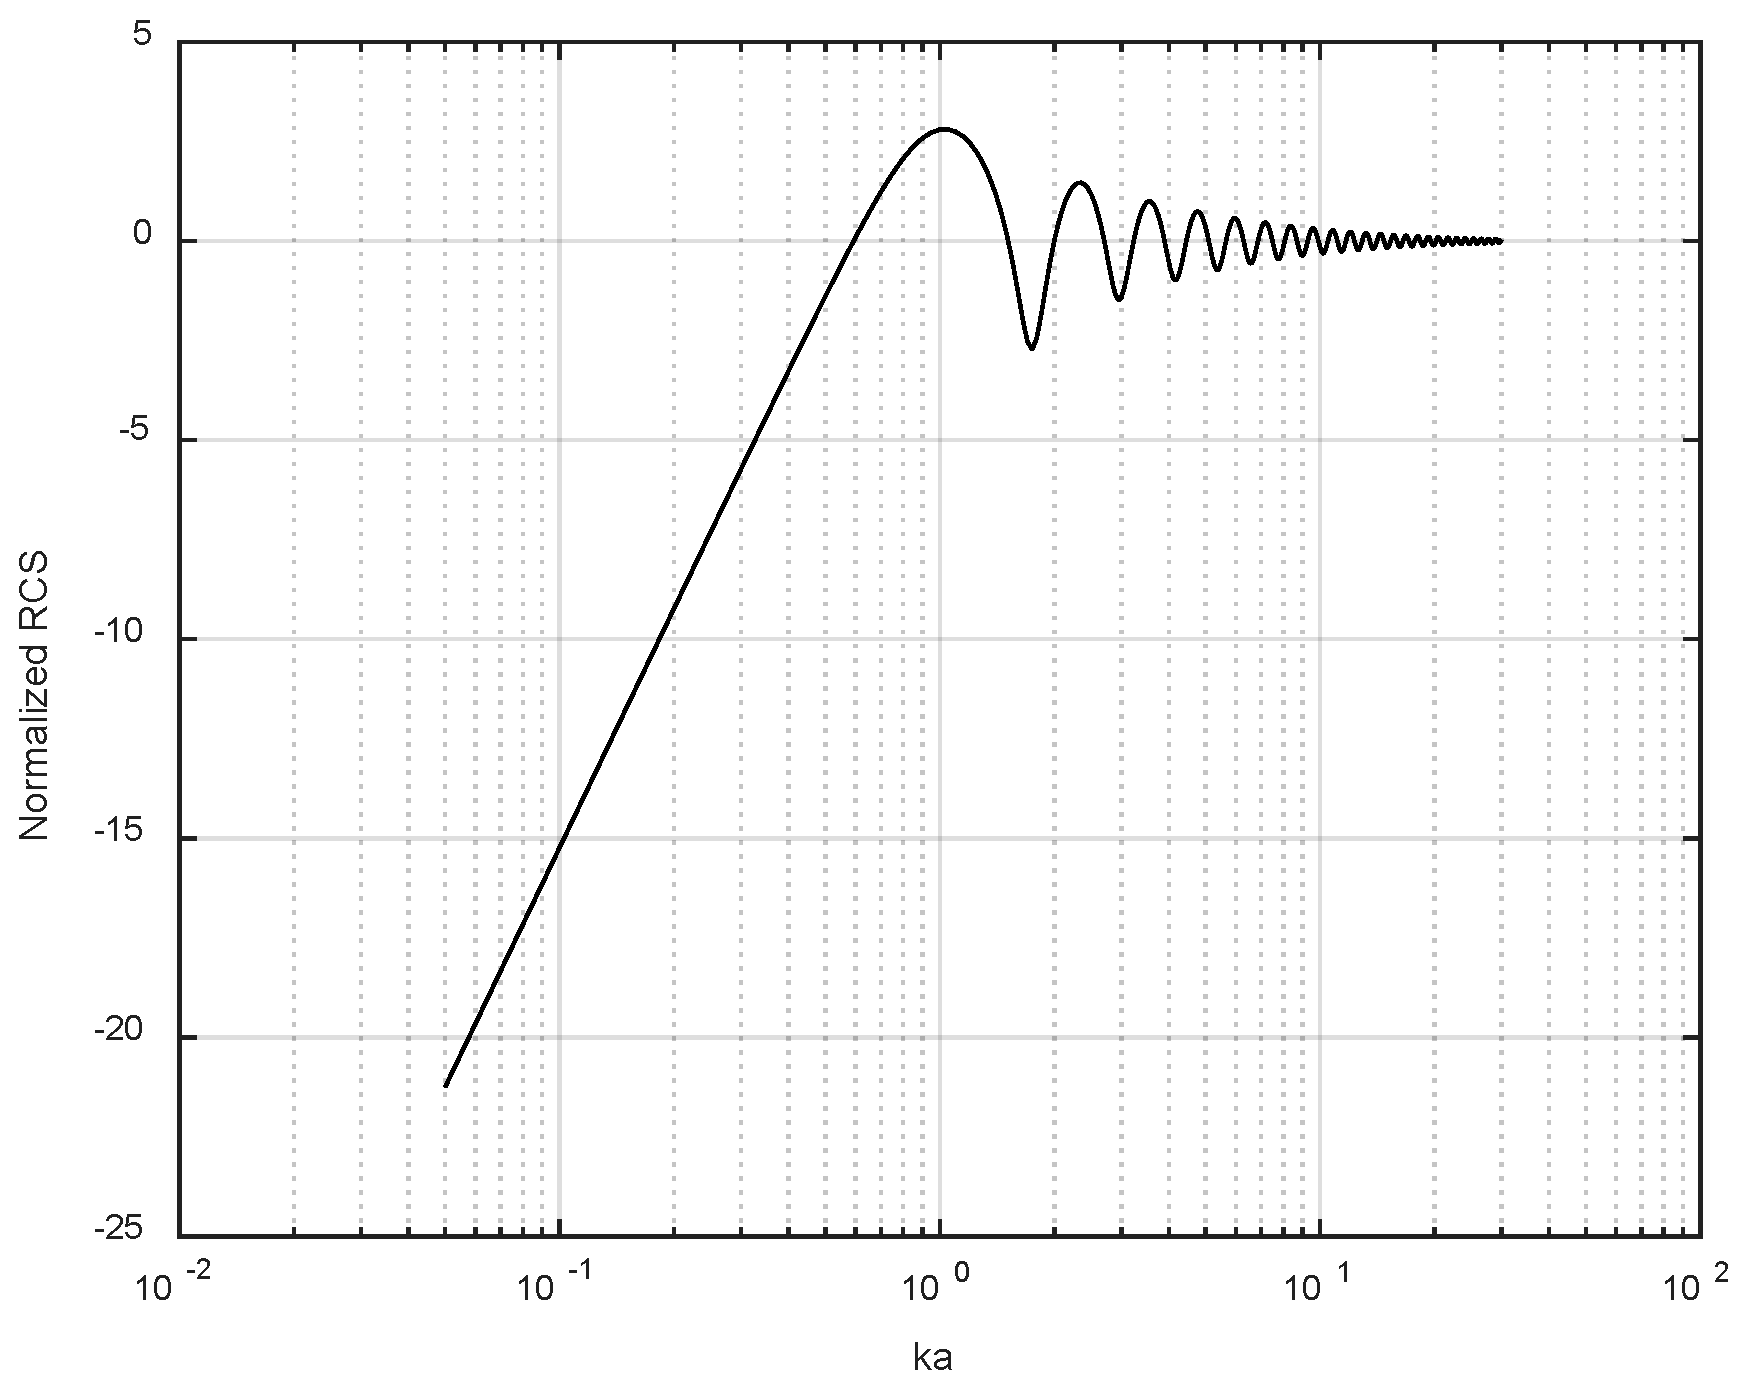
Figure 2.
Upper (blue) and lower (red) limits of the radiometric calibration errors vs. signal-to-clutter ratio (SCR).
Figure 2.
Upper (blue) and lower (red) limits of the radiometric calibration errors vs. signal-to-clutter ratio (SCR).
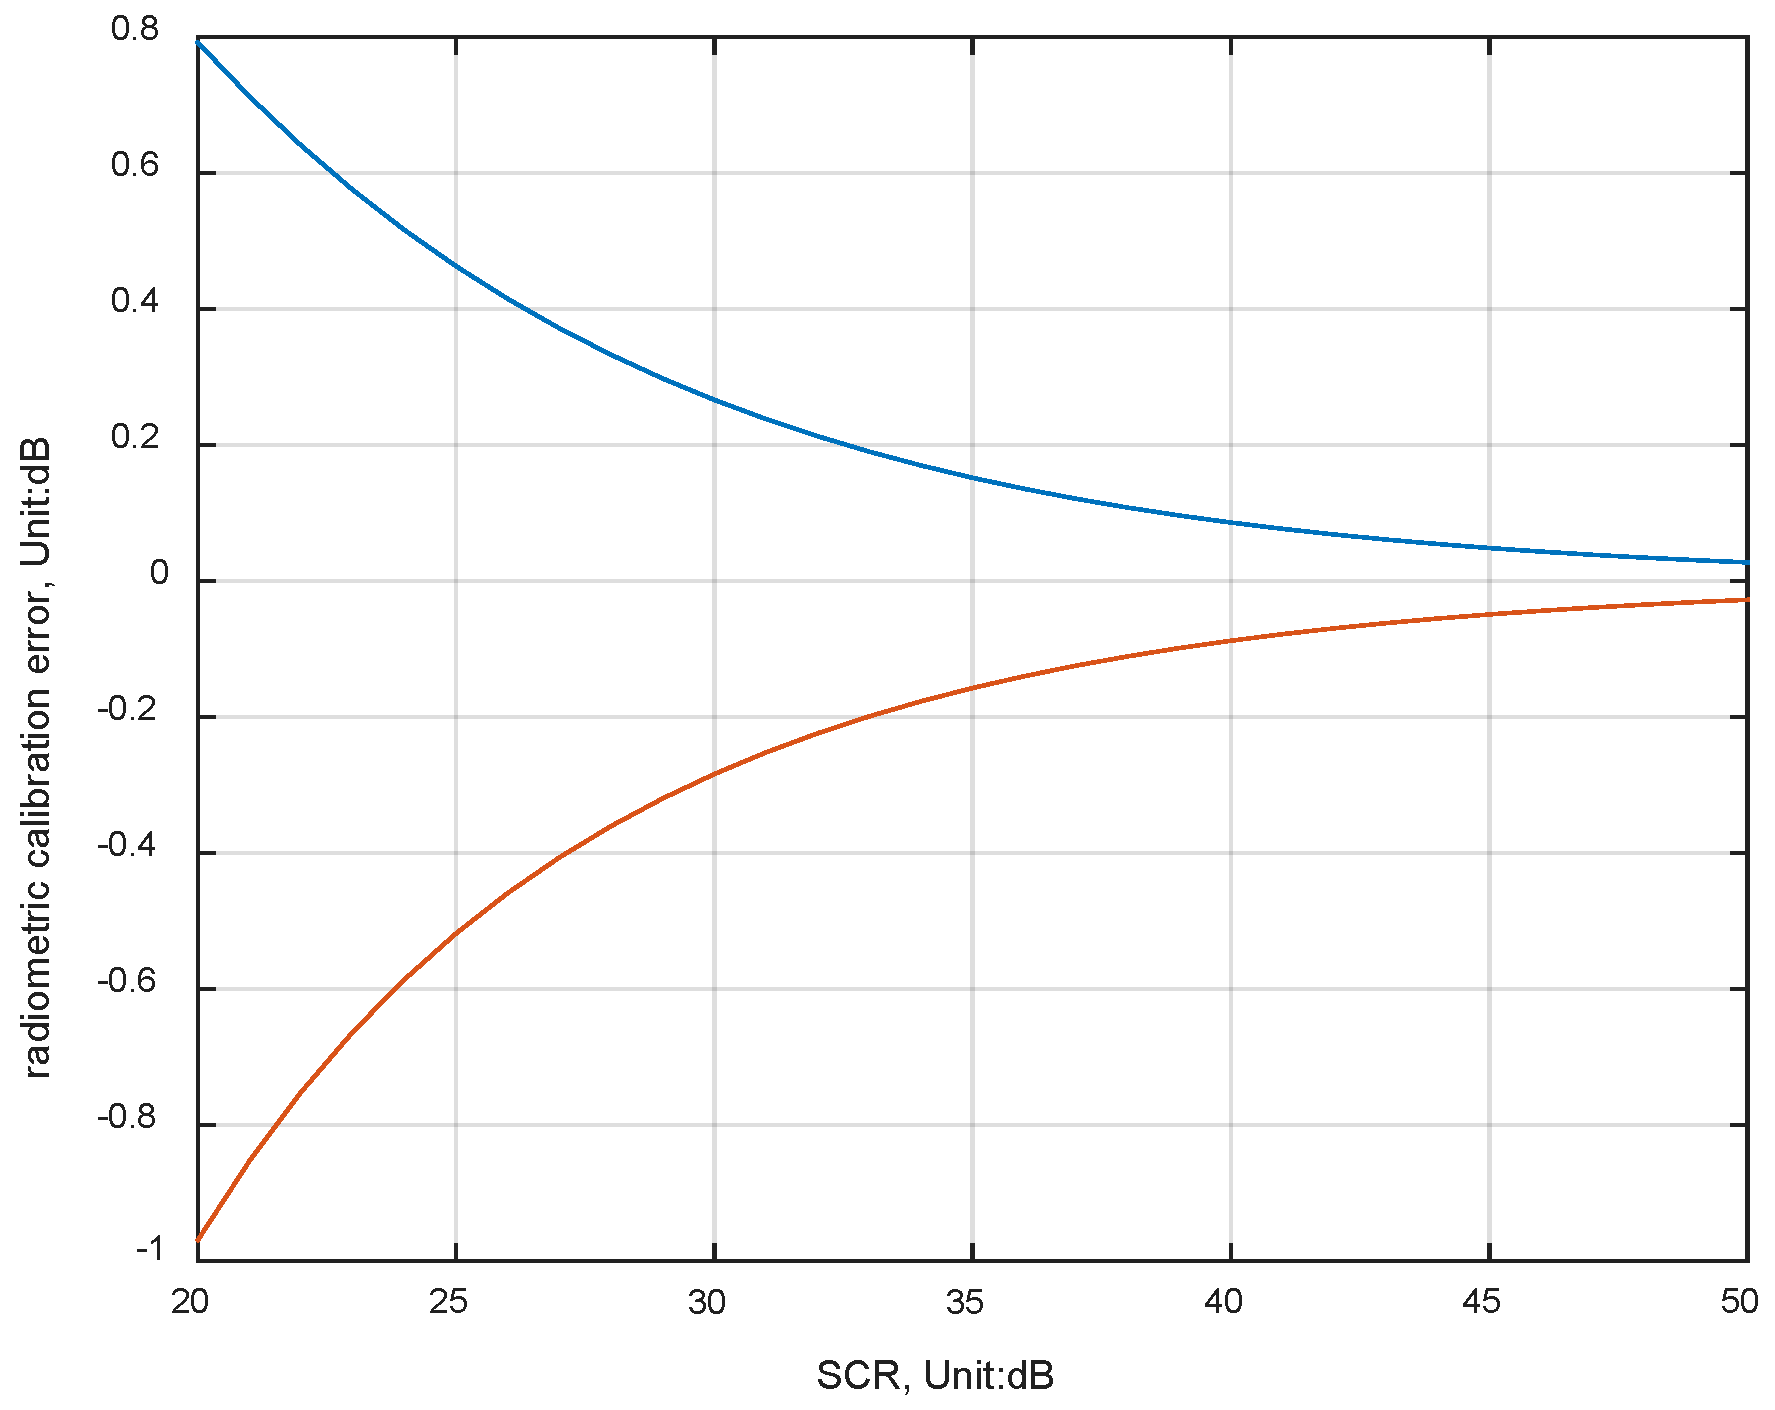
Figure 3.
The monostatic and bistatic radar configurations.
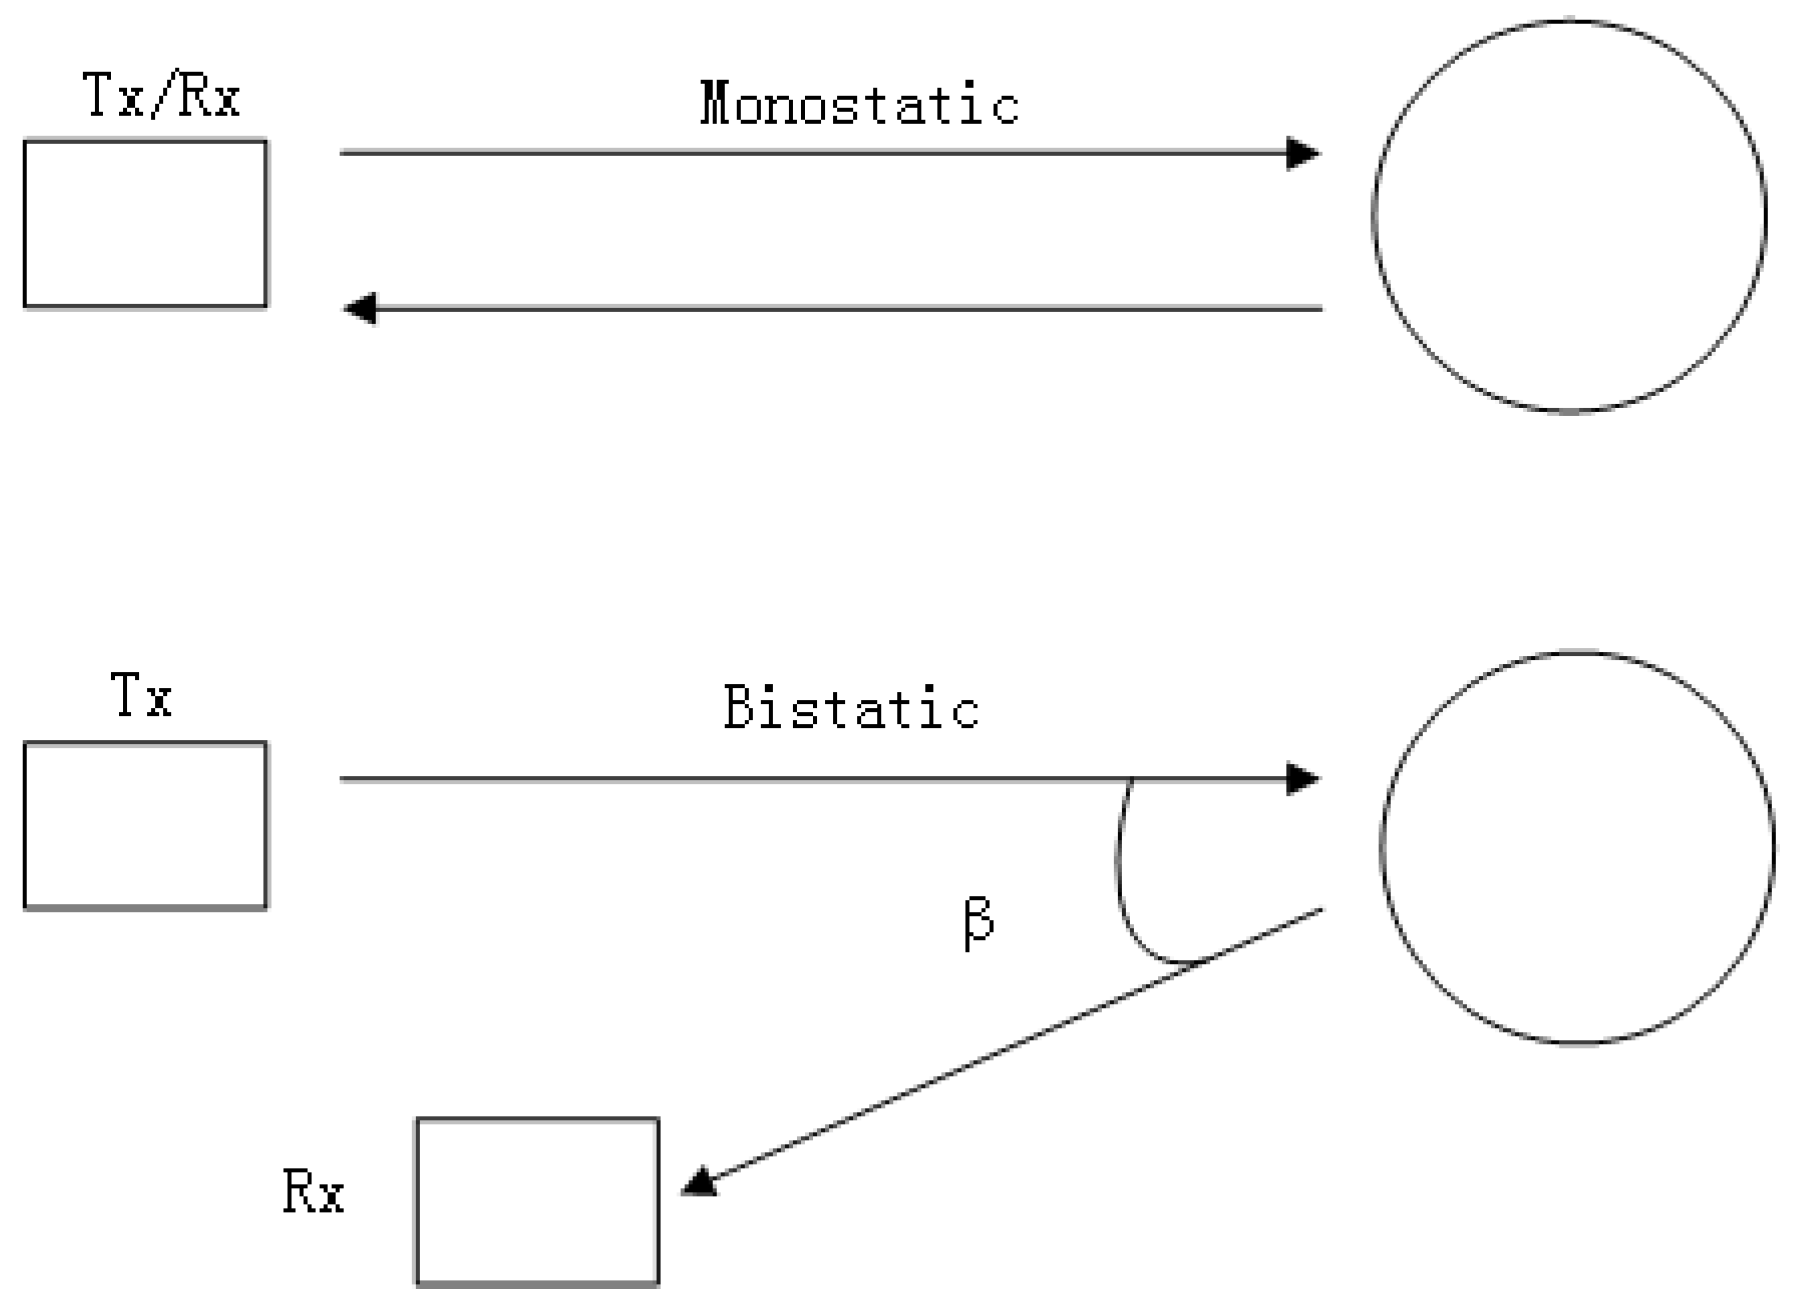
Figure 4.
The monostatic RCS observation geometry of the trihedral corner reflector (TCR).
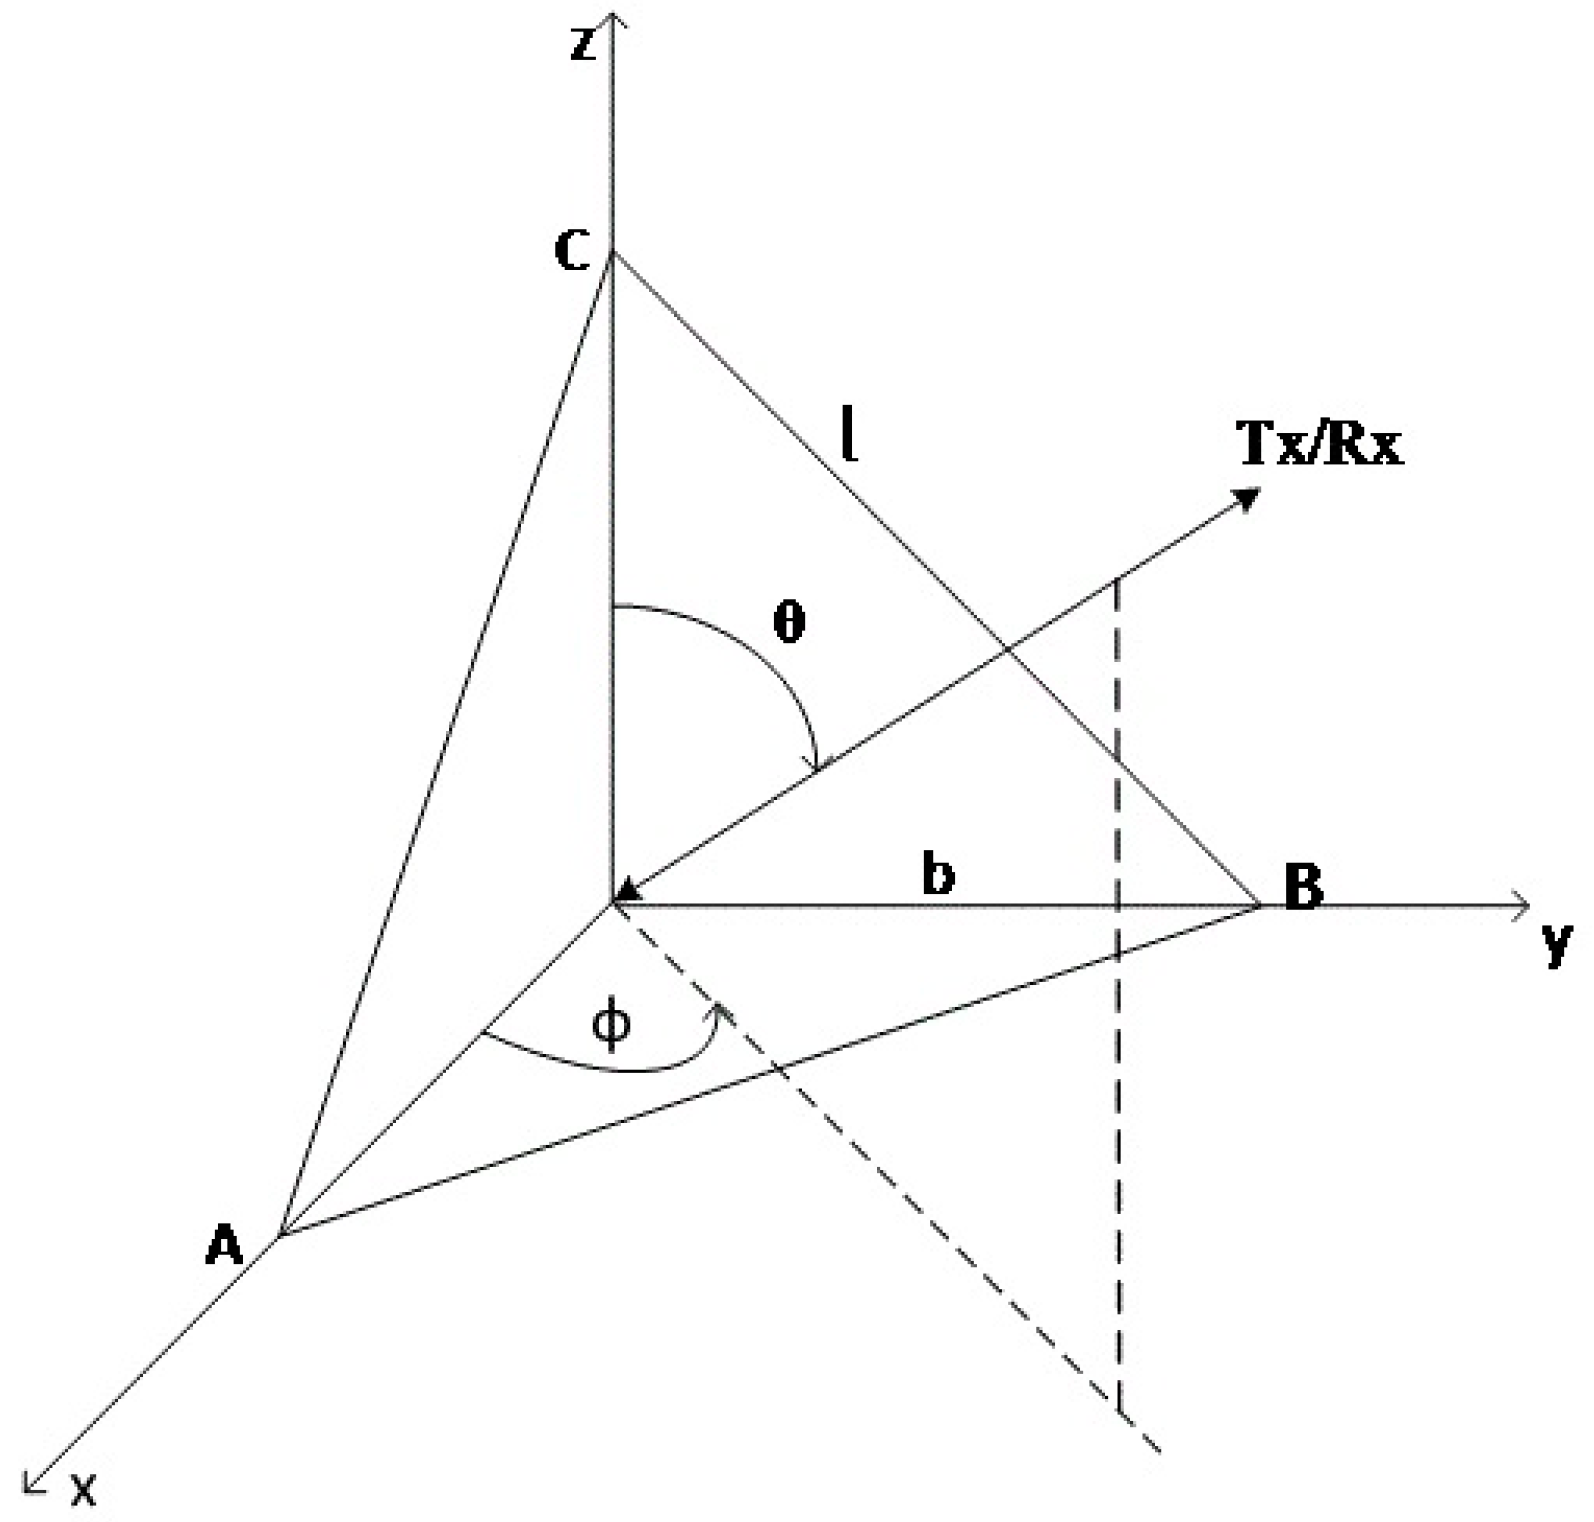
Figure 5.
The bistatic RCS azimuth pattern of the TCR based on the monostatic bistatic equivalence theorem.
Figure 5.
The bistatic RCS azimuth pattern of the TCR based on the monostatic bistatic equivalence theorem.

Figure 6.
The bistatic RCS observation geometry of the TCR.

Figure 7.
The bistatic RCS azimuth pattern of the TCR based on FEKO electromagnetic simulations.

Figure 8.
The bistatic RCS pattern of the TCR based on FEKO electromagnetic simulations as the TCR boresight changes with the bistatic angle is considered. (a) The bistatic RCS elevation pattern of the TCR; (b) the bistatic RCS azimuth pattern of the TCR.
Figure 8.
The bistatic RCS pattern of the TCR based on FEKO electromagnetic simulations as the TCR boresight changes with the bistatic angle is considered. (a) The bistatic RCS elevation pattern of the TCR; (b) the bistatic RCS azimuth pattern of the TCR.
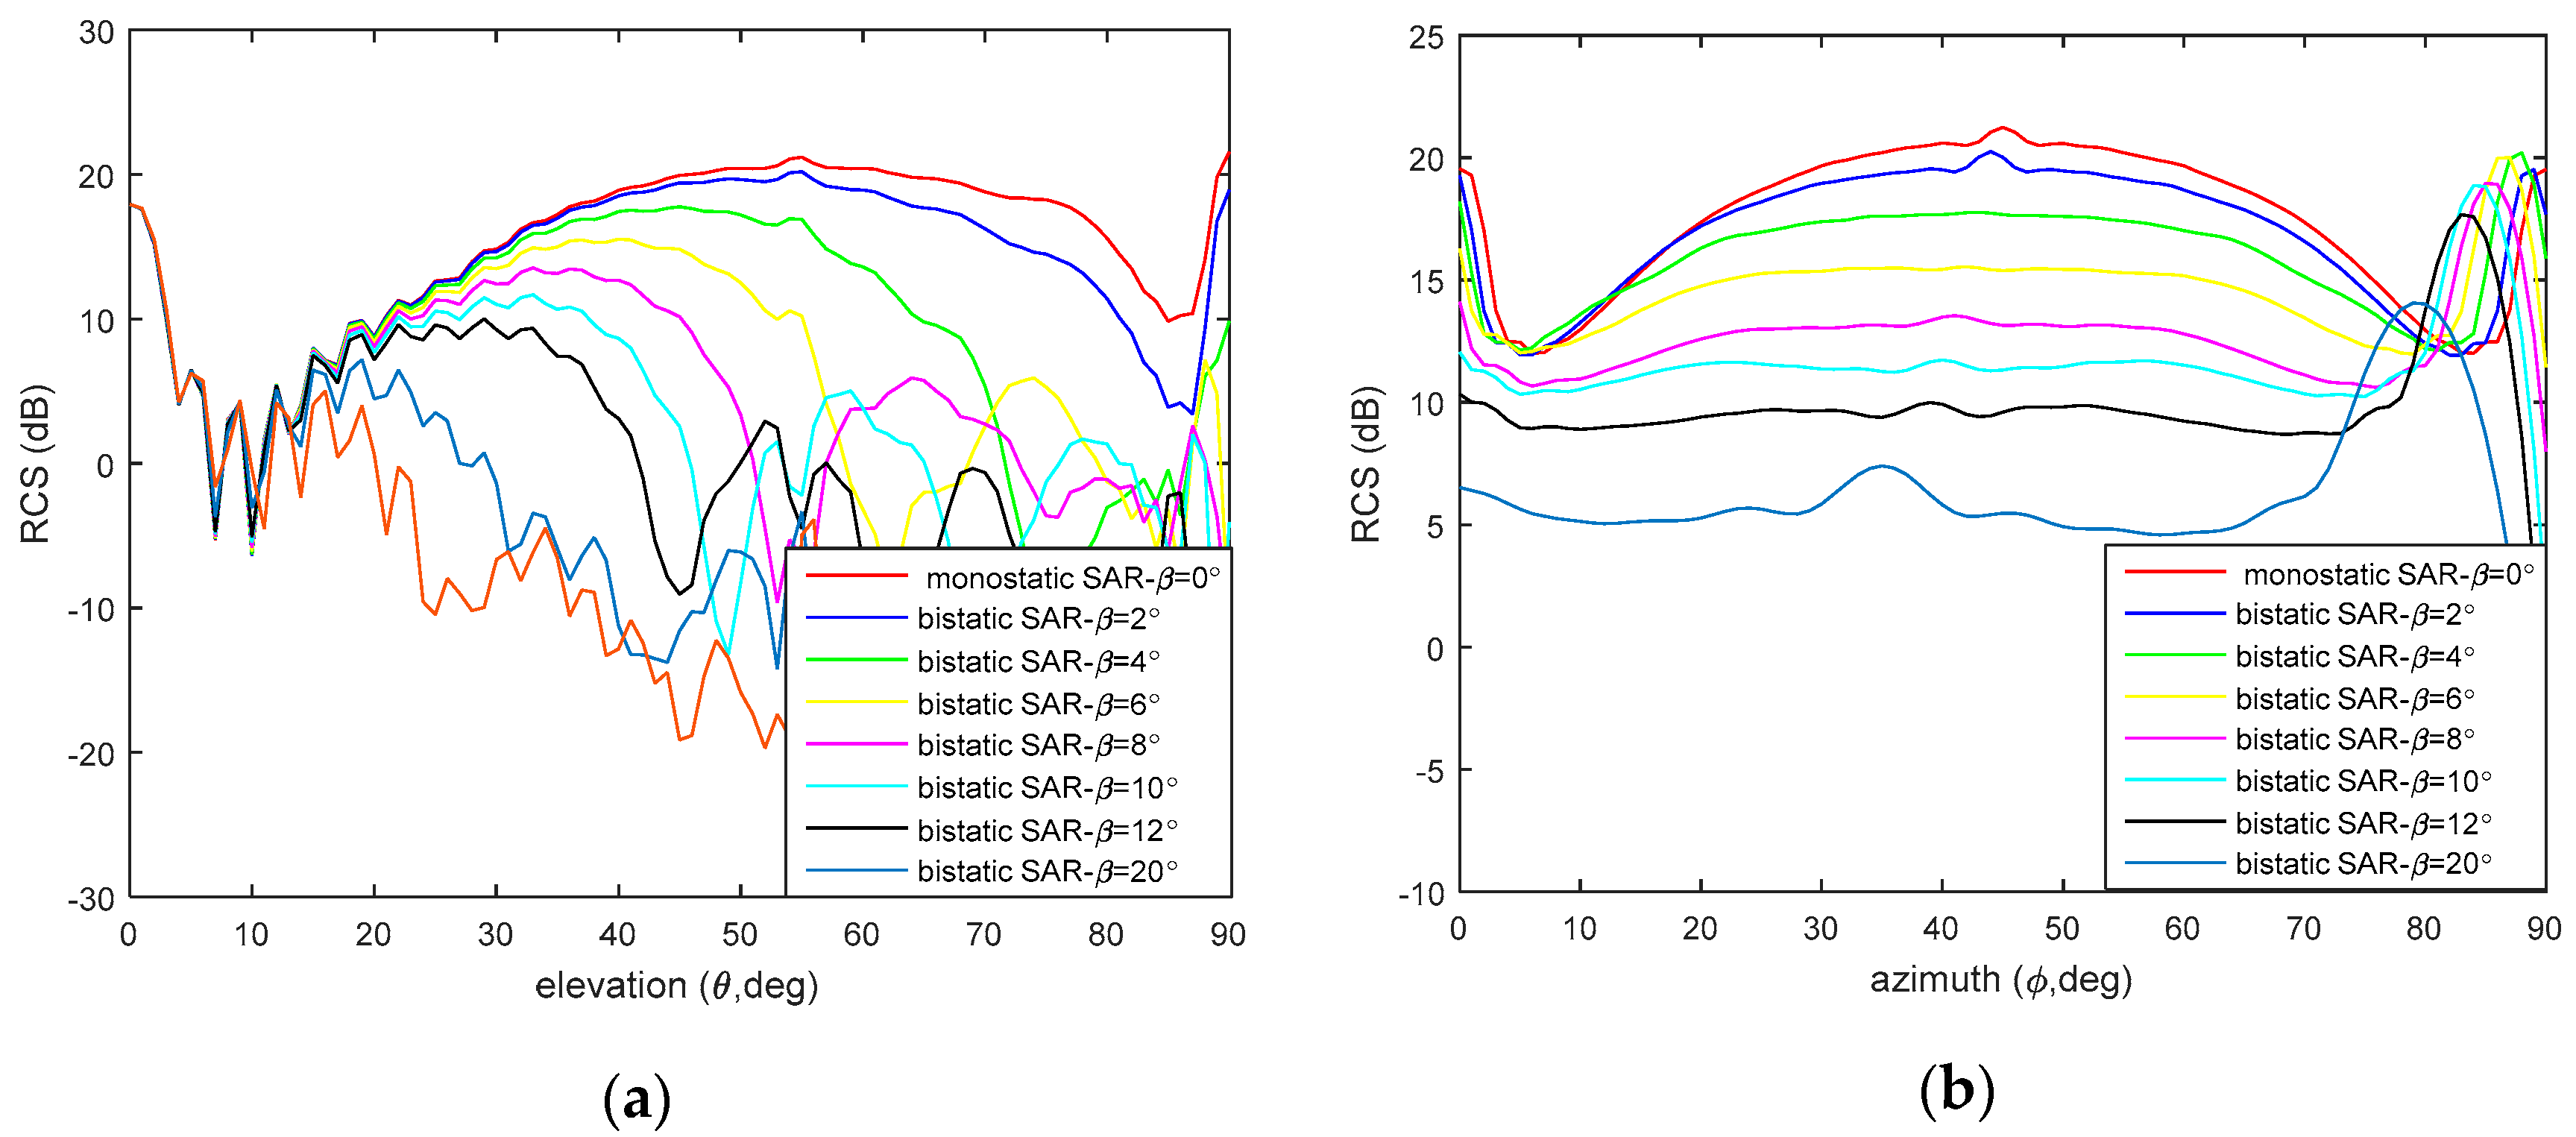
Figure 9.
The effect of interplate angle error on the RCS at different bistatic angles.
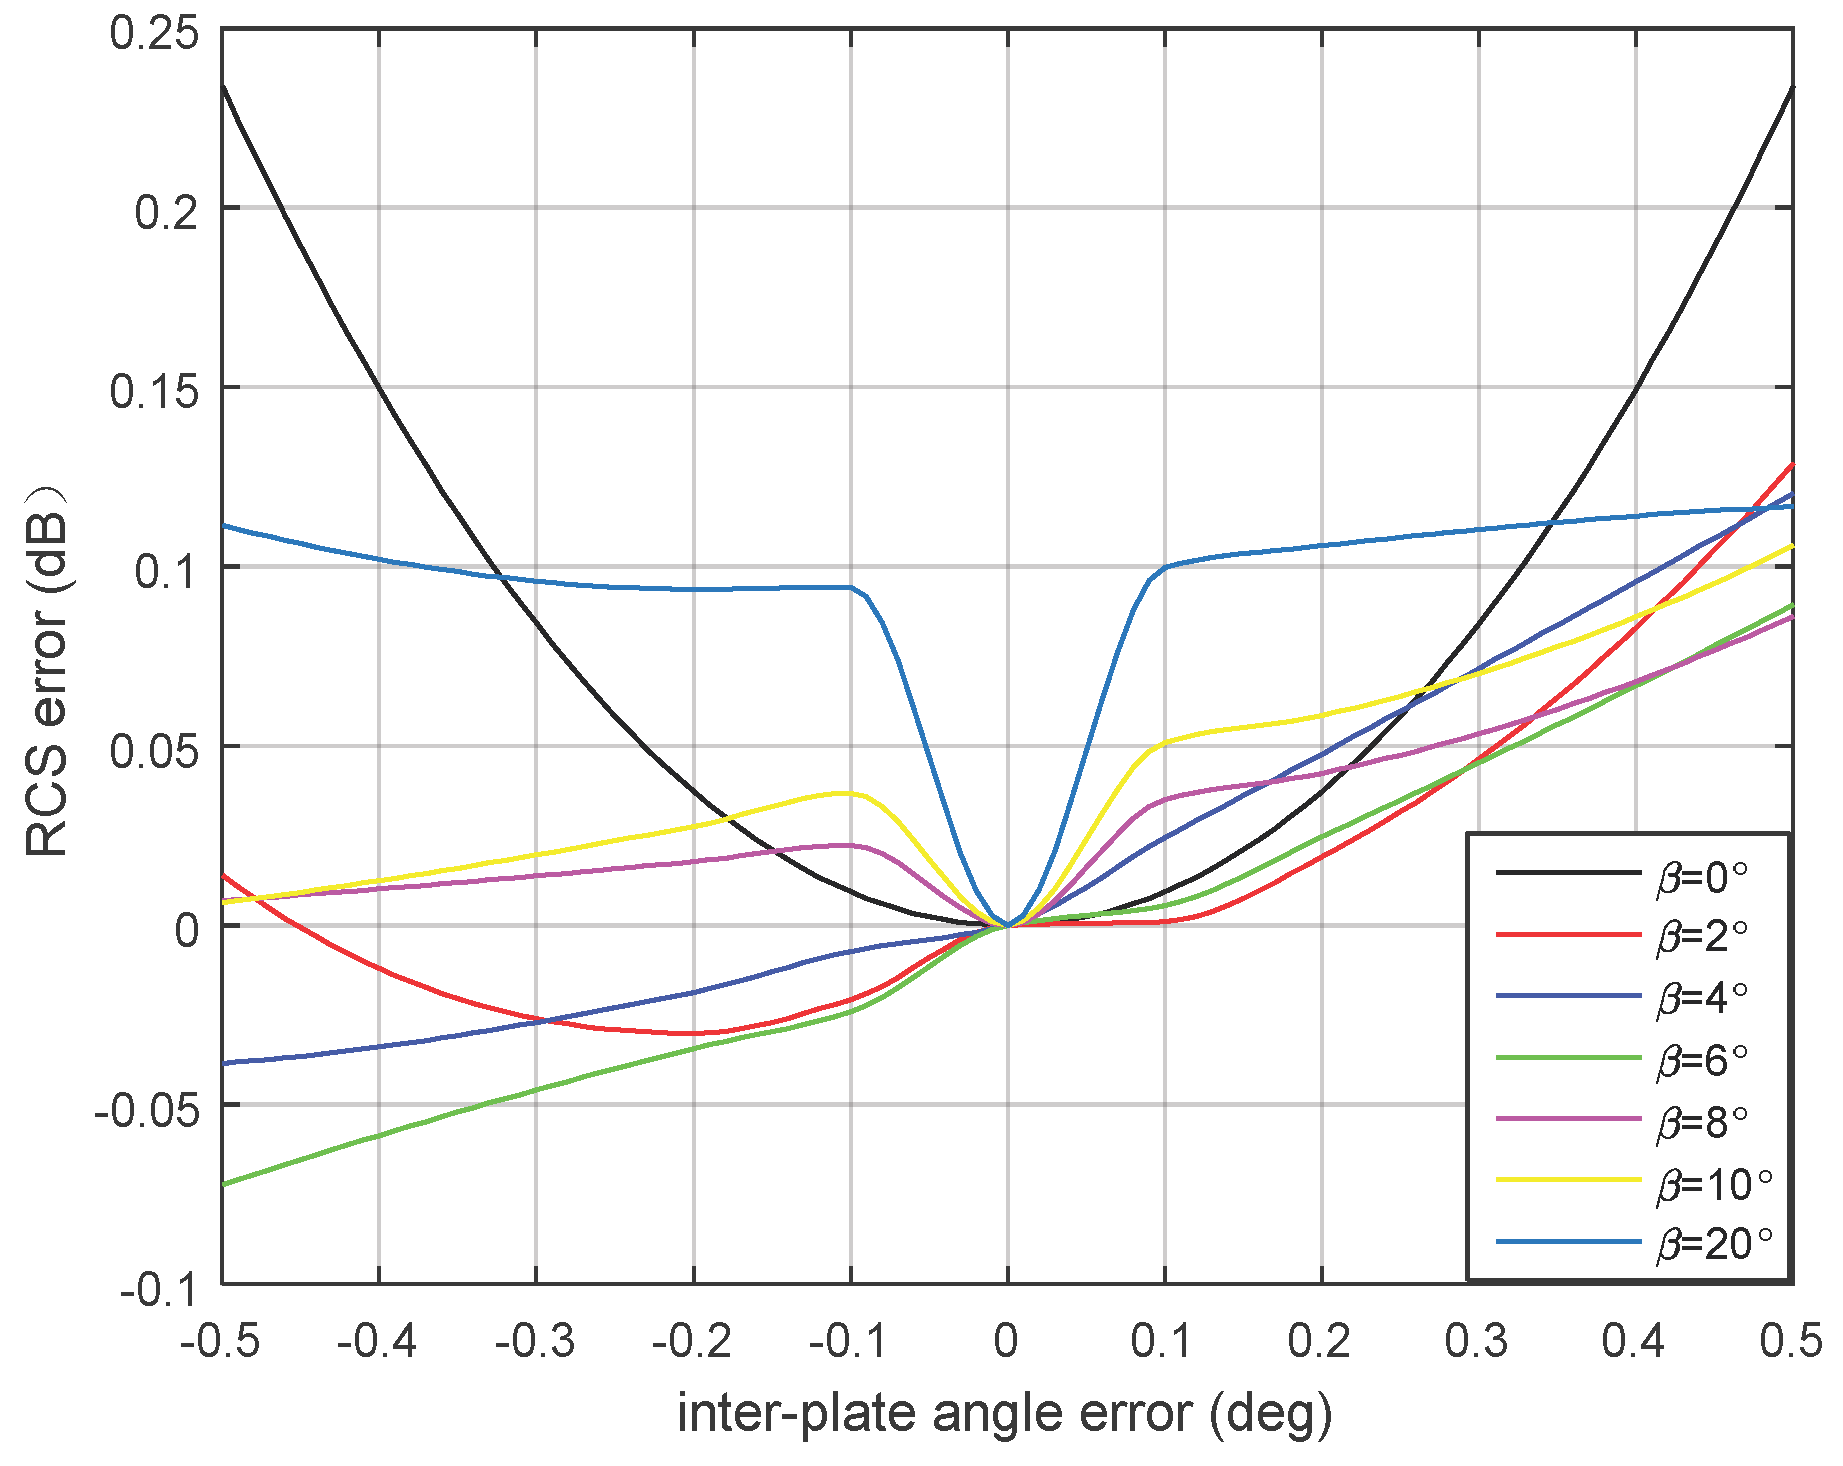
Figure 10.
The effect of machining error of length on the RCS at different bistatic angles.

Figure 11.
The contour map of the RCS loss due to pointing deviation.
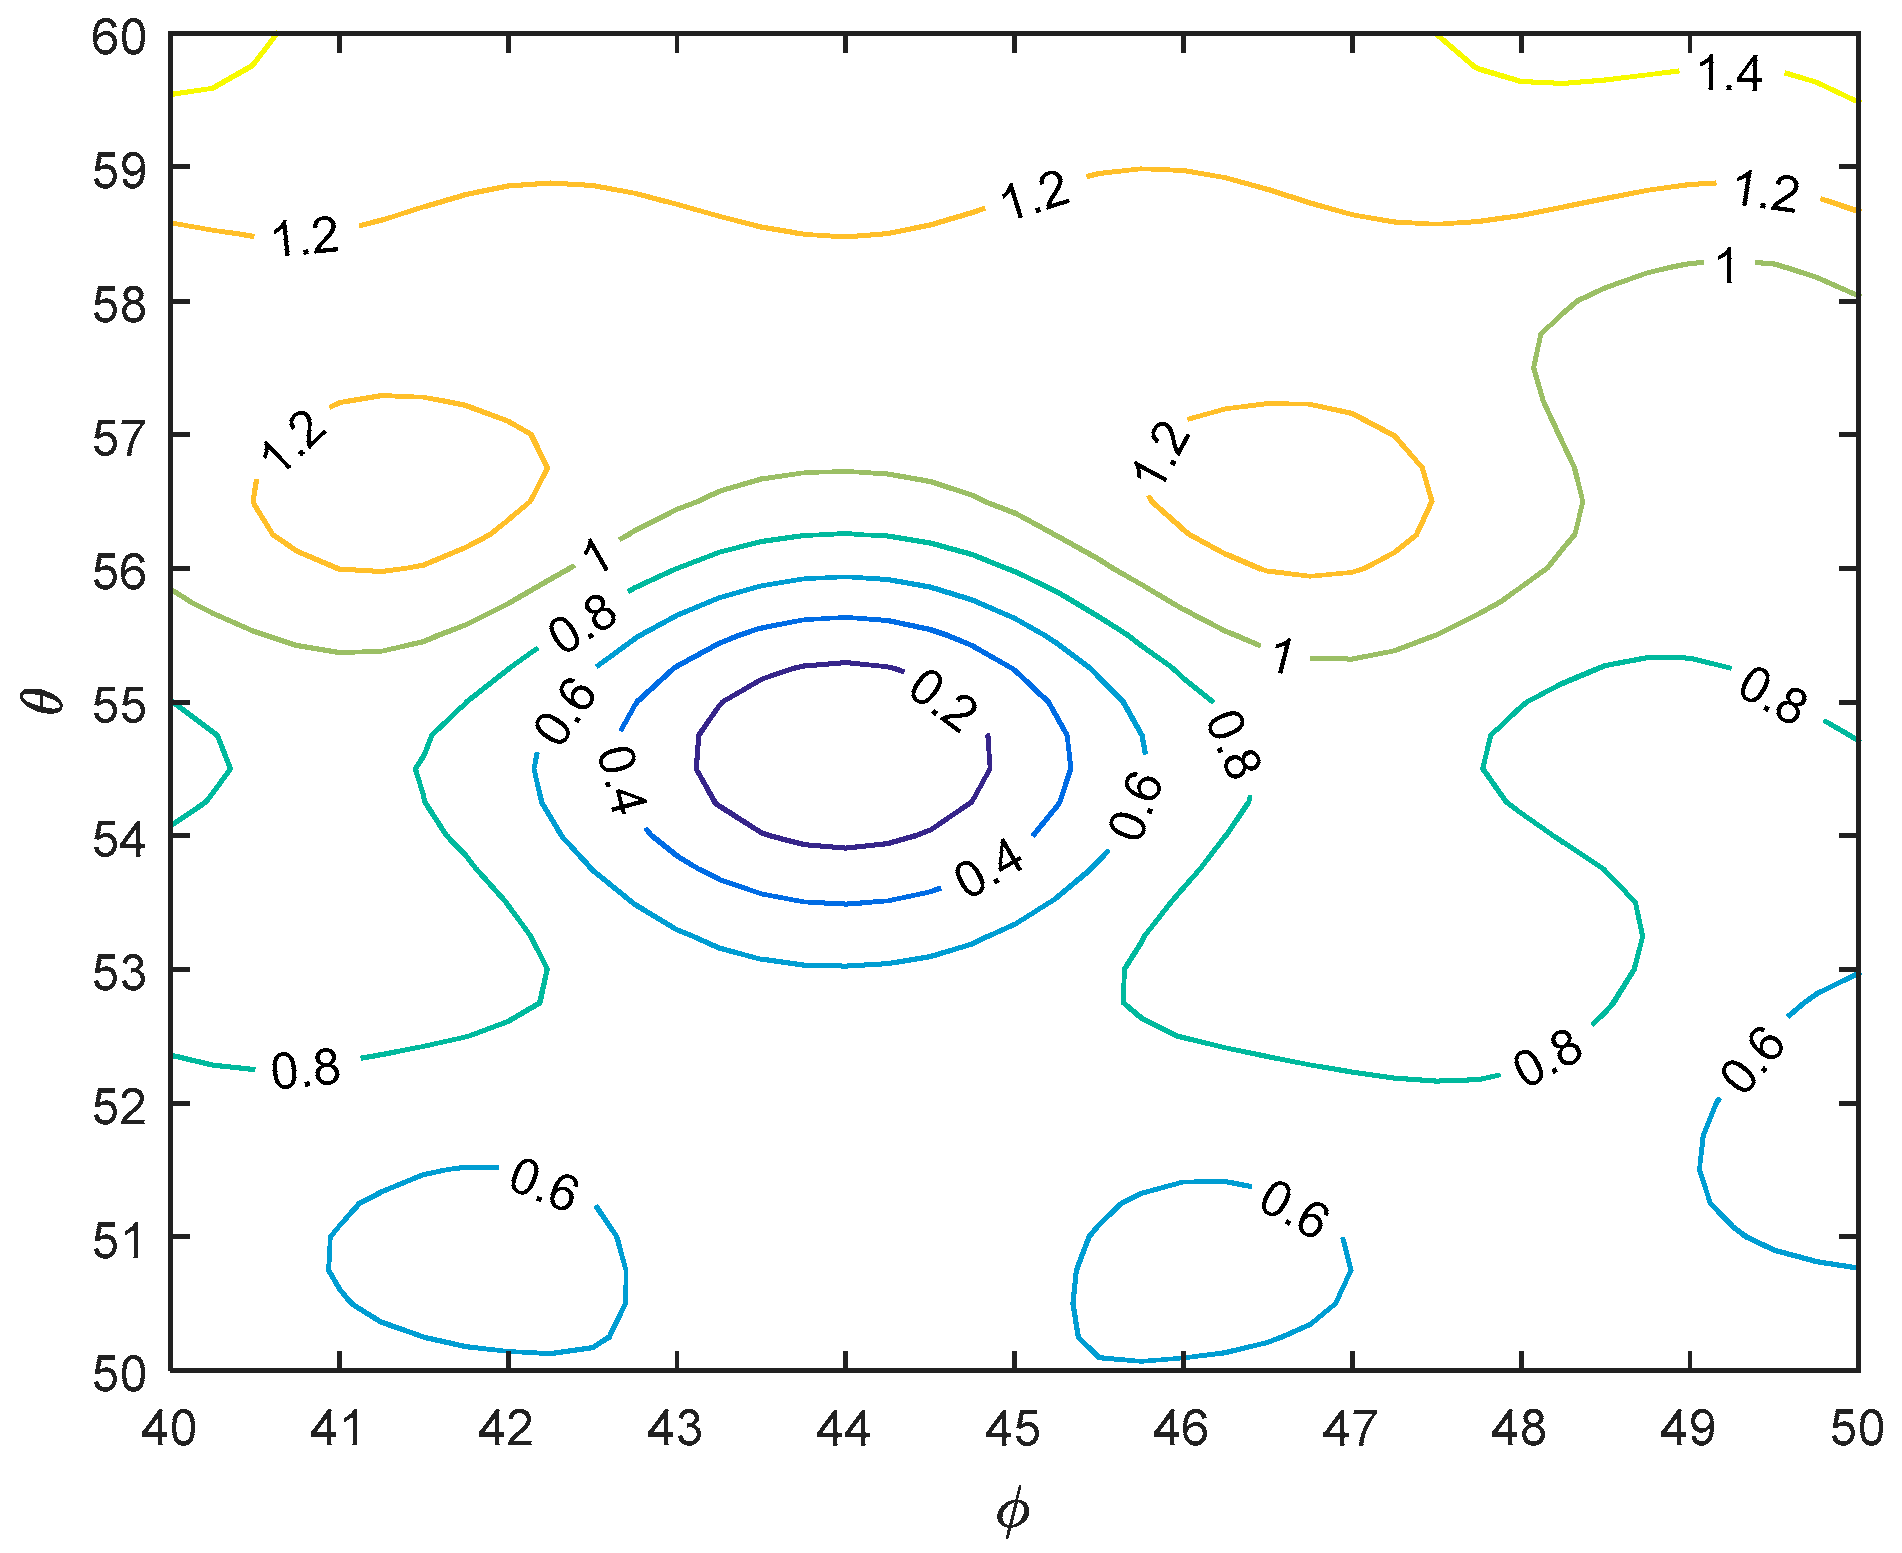
Figure 12.
The effect of pointing deviation on the RCS at different bistatic angles. (a) Azimuth pointing deviations and corresponding RCS errors; (b) elevation pointing deviations and corresponding RCS errors.
Figure 12.
The effect of pointing deviation on the RCS at different bistatic angles. (a) Azimuth pointing deviations and corresponding RCS errors; (b) elevation pointing deviations and corresponding RCS errors.
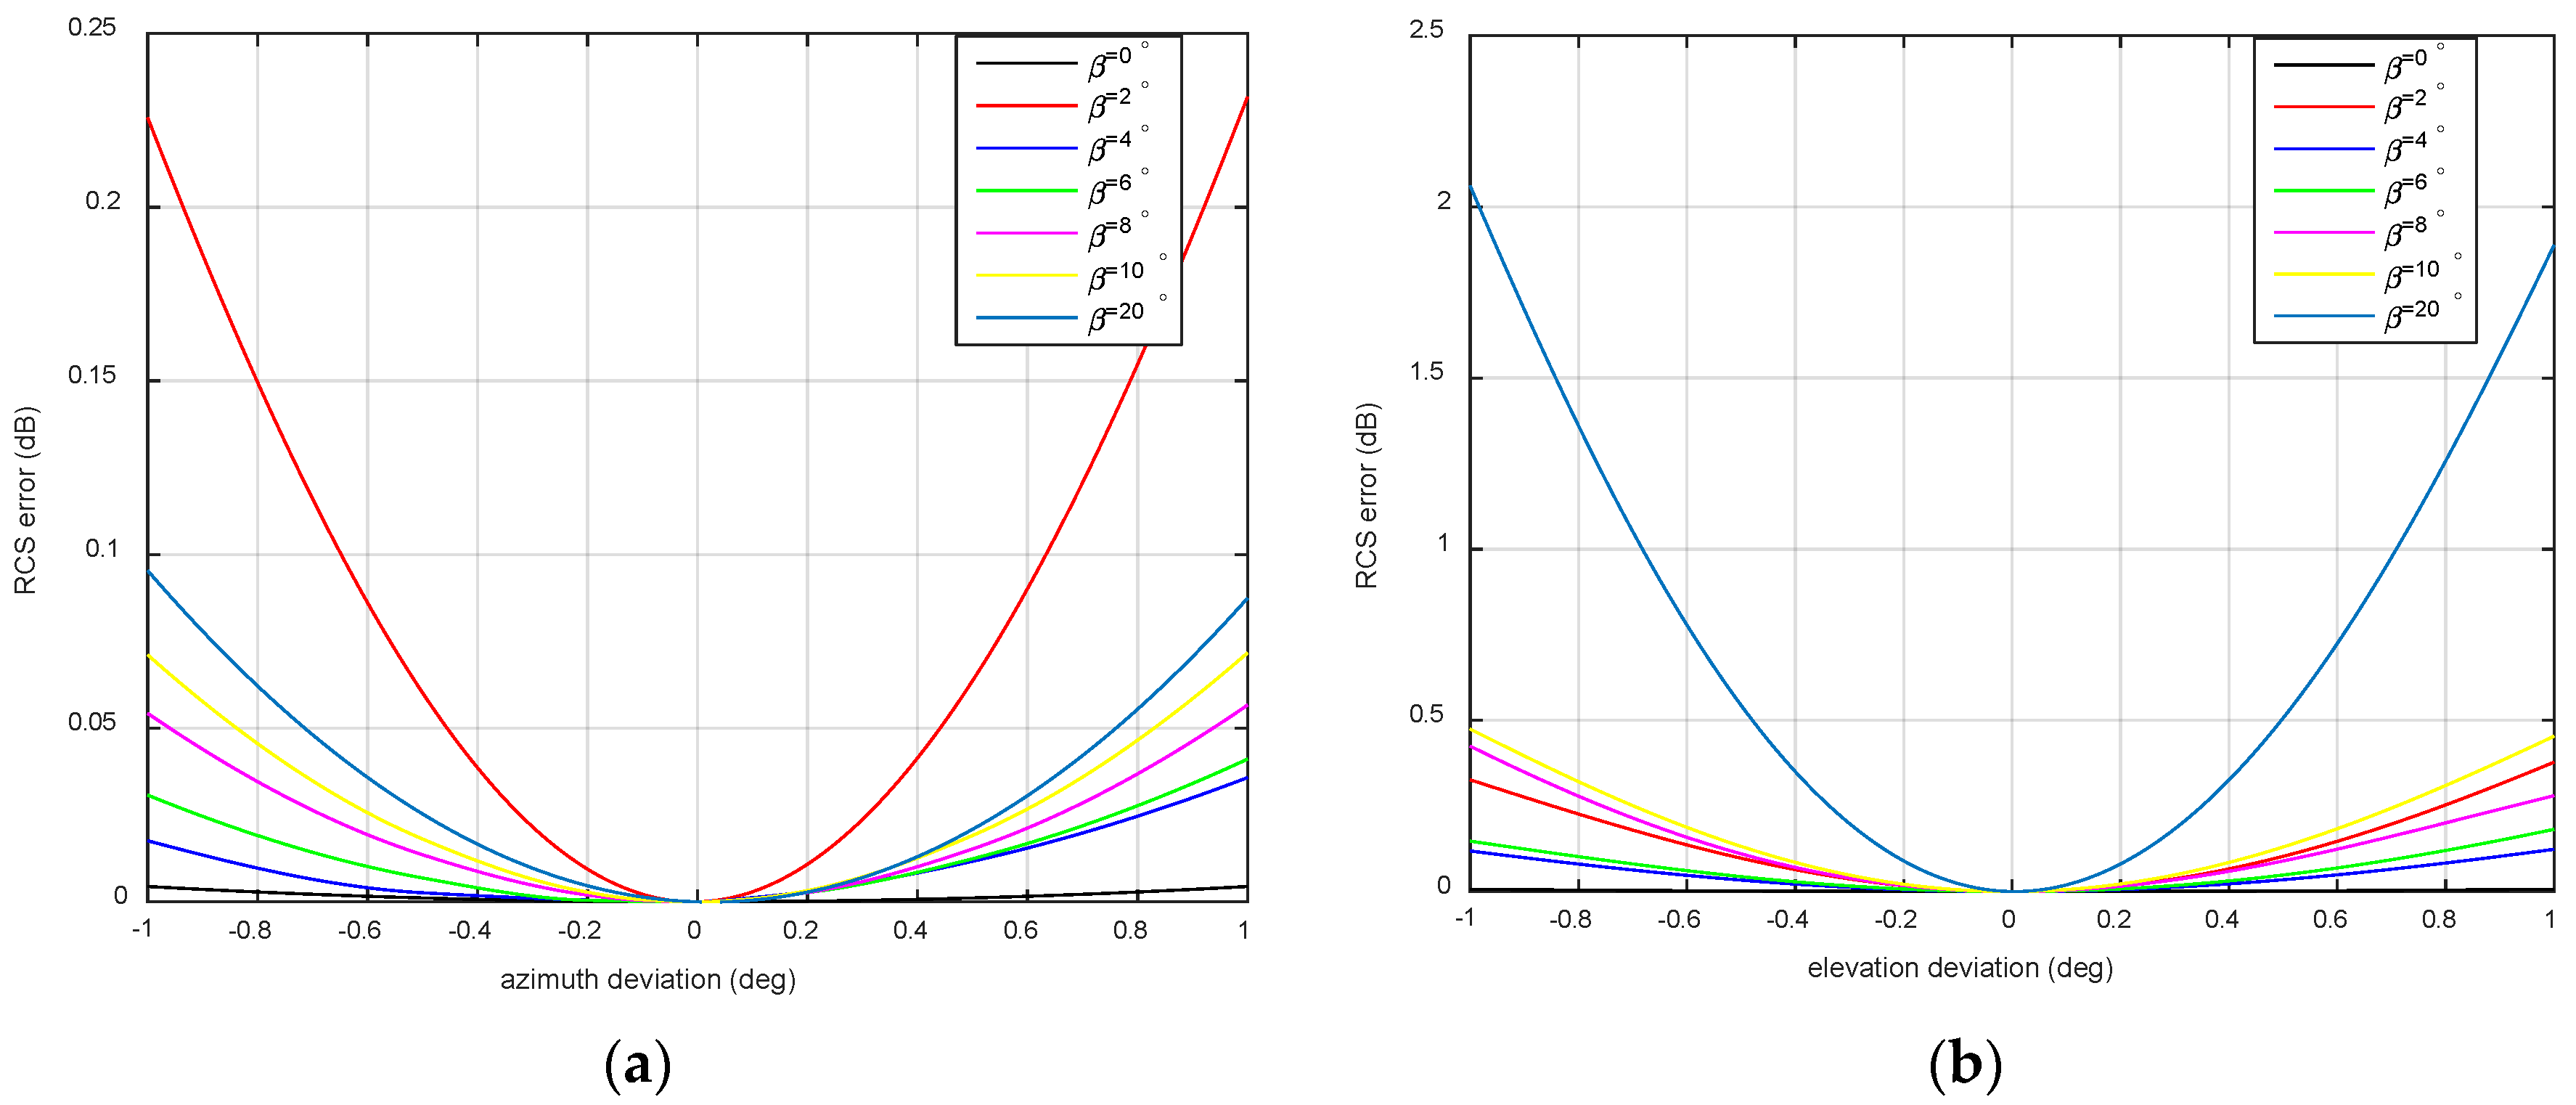
Figure 13.
The image quality analysis parameters of the point target.

Figure 14.
The simulation results for the 2° bistatic angle without the consideration of the TCR optimum boresight. (a) The point target image after upsampling 48 times; (b) the azimuth profile based on the results of the electromagnetic simulation.
Figure 14.
The simulation results for the 2° bistatic angle without the consideration of the TCR optimum boresight. (a) The point target image after upsampling 48 times; (b) the azimuth profile based on the results of the electromagnetic simulation.
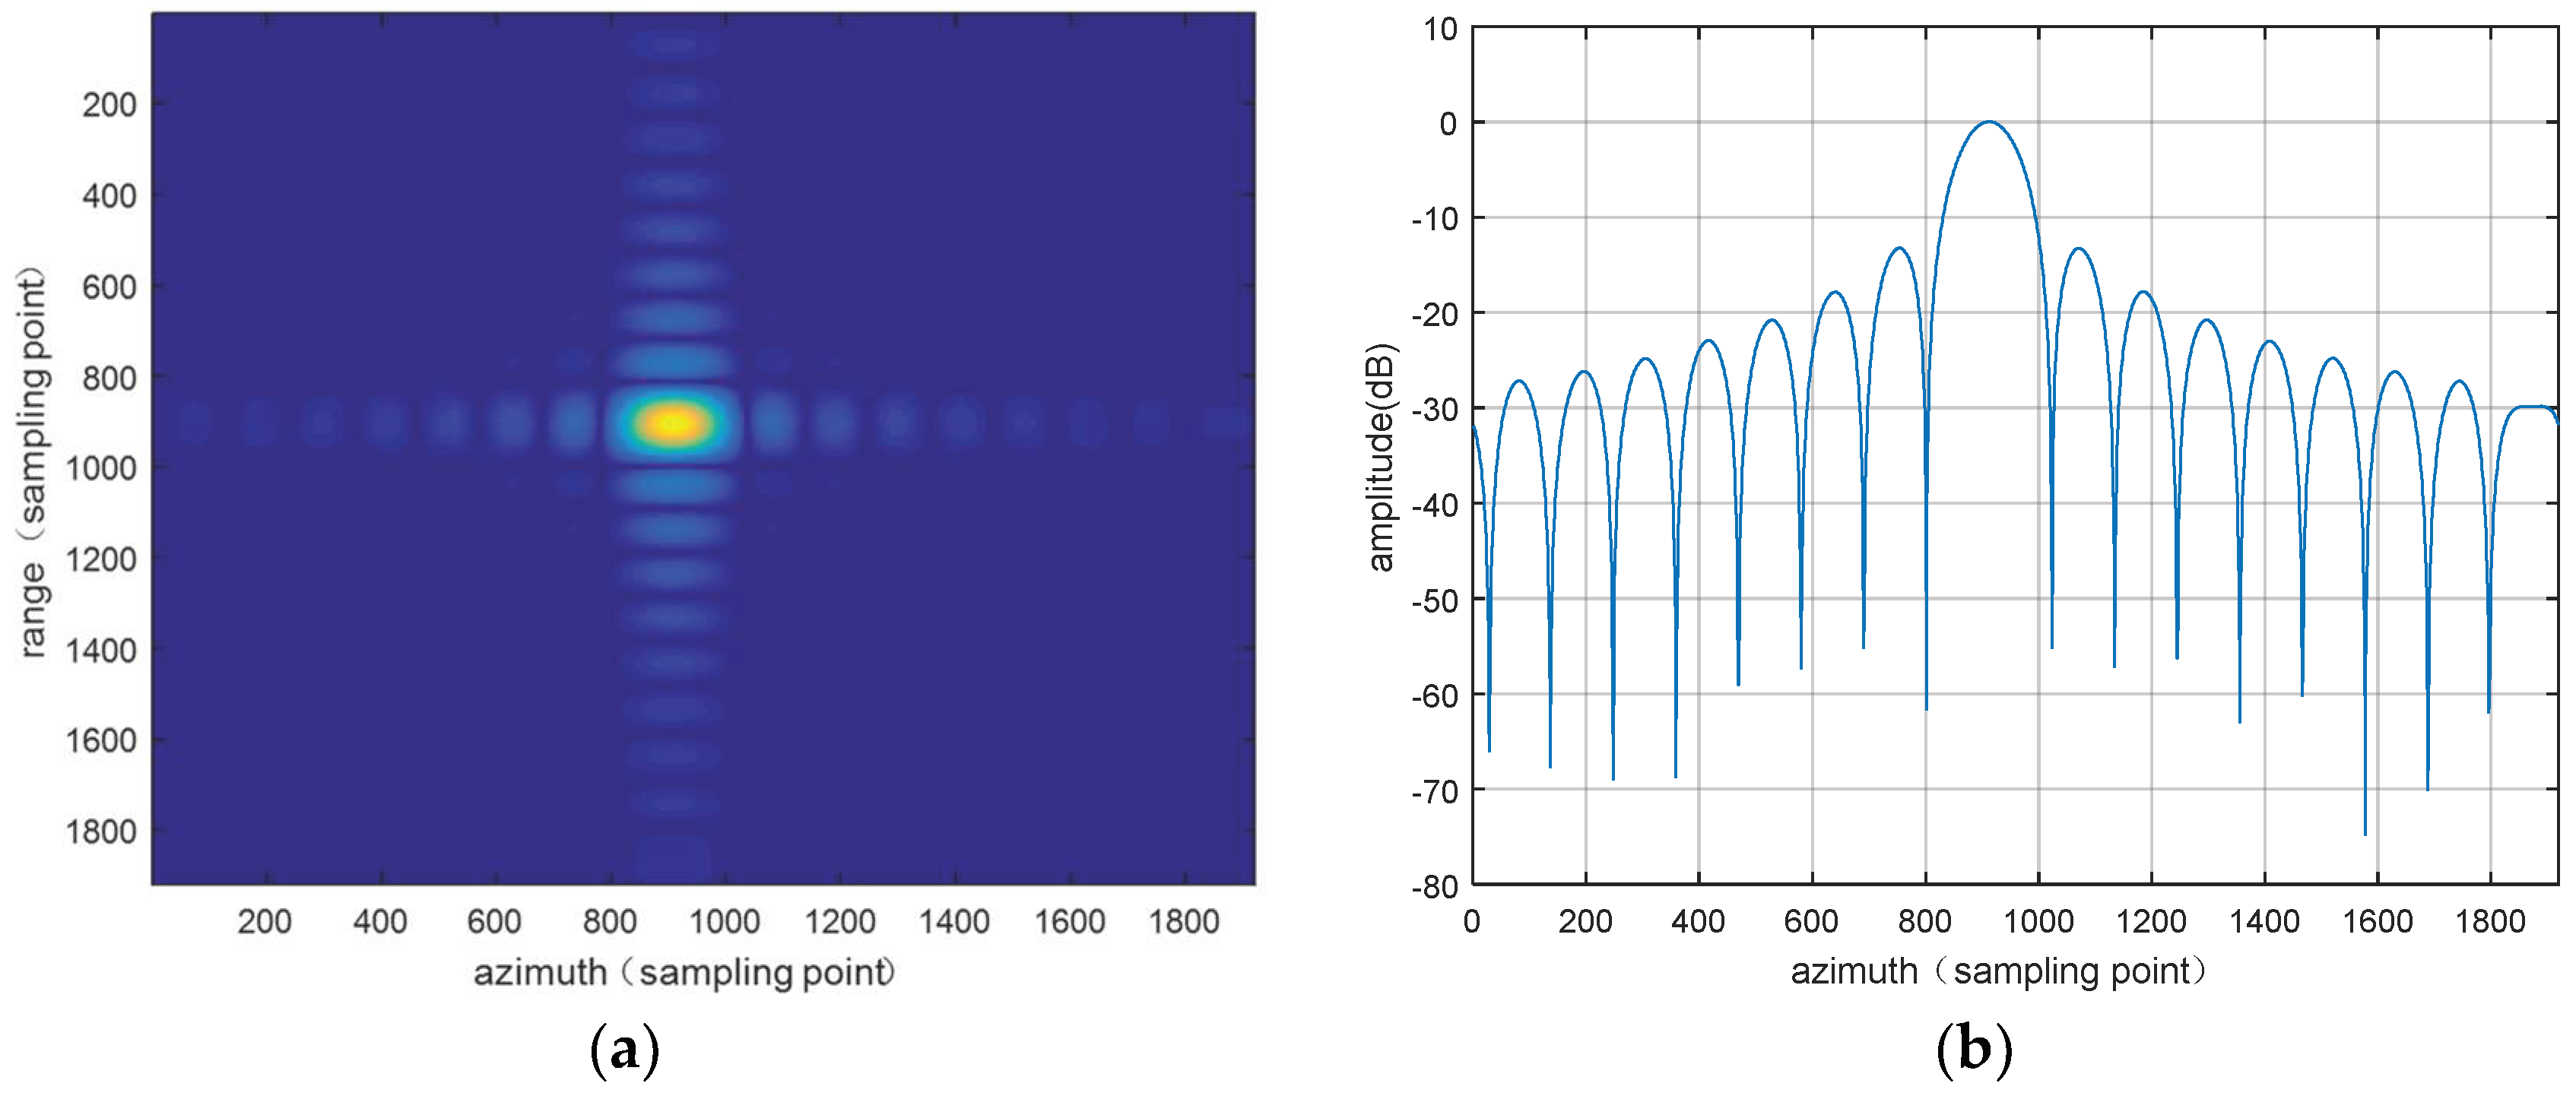
Figure 15.
The simulation results for 6° bistatic angle without the consideration of the TCR optimum boresight. (a) The point target image after upsampling 48 times; (b) the azimuth profile based on the results of the electromagnetic simulation.
Figure 15.
The simulation results for 6° bistatic angle without the consideration of the TCR optimum boresight. (a) The point target image after upsampling 48 times; (b) the azimuth profile based on the results of the electromagnetic simulation.
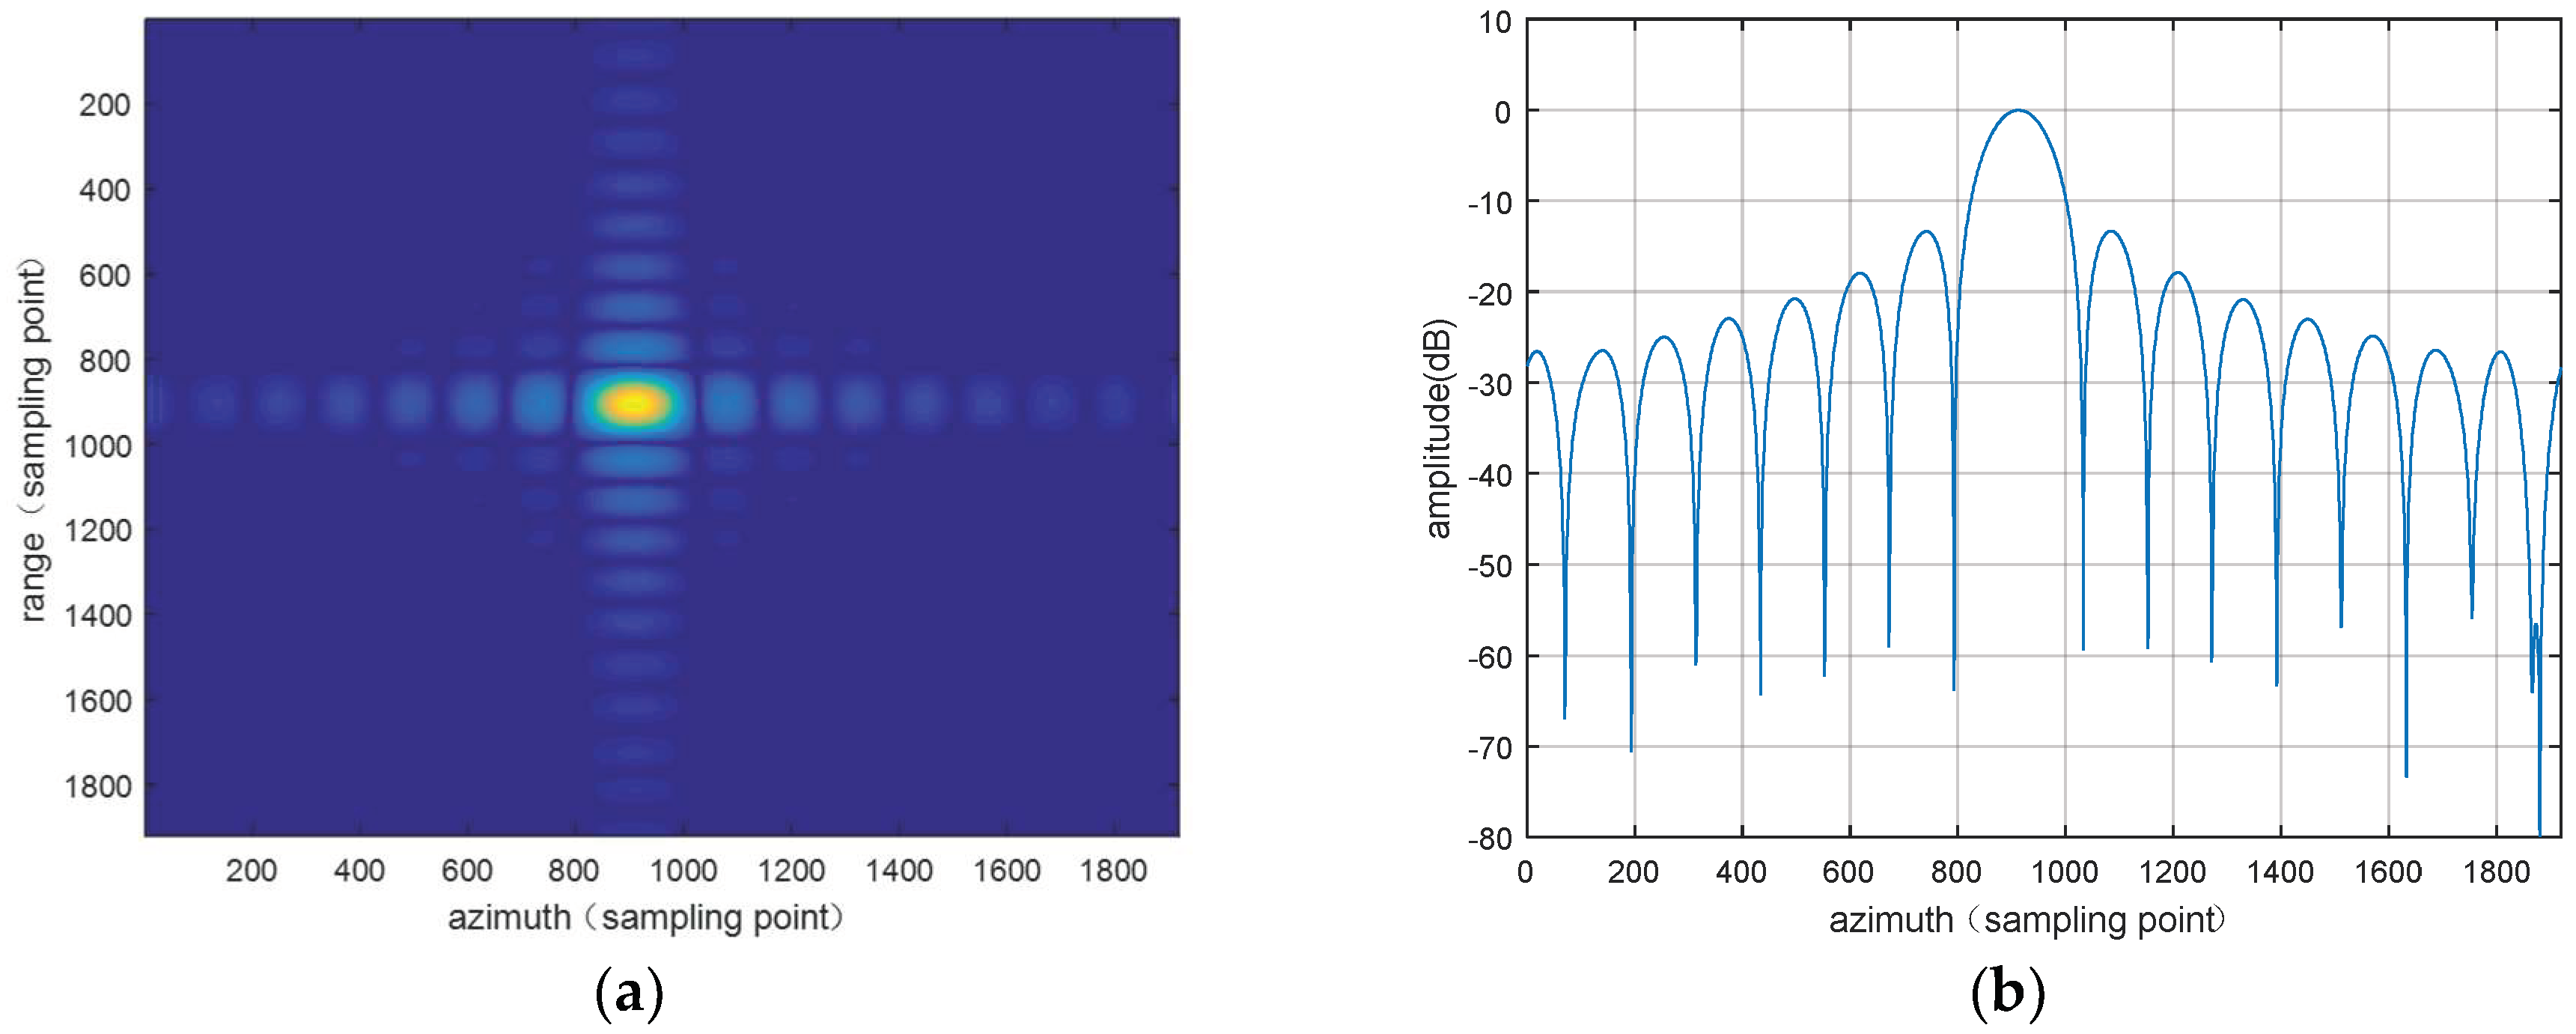
Figure 16.
The simulation results for 20° bistatic angle without the consideration of the TCR optimum boresight. (a) The point target image after upsampling 48 times; (b) the azimuth profile based on the results of the electromagnetic simulation.
Figure 16.
The simulation results for 20° bistatic angle without the consideration of the TCR optimum boresight. (a) The point target image after upsampling 48 times; (b) the azimuth profile based on the results of the electromagnetic simulation.
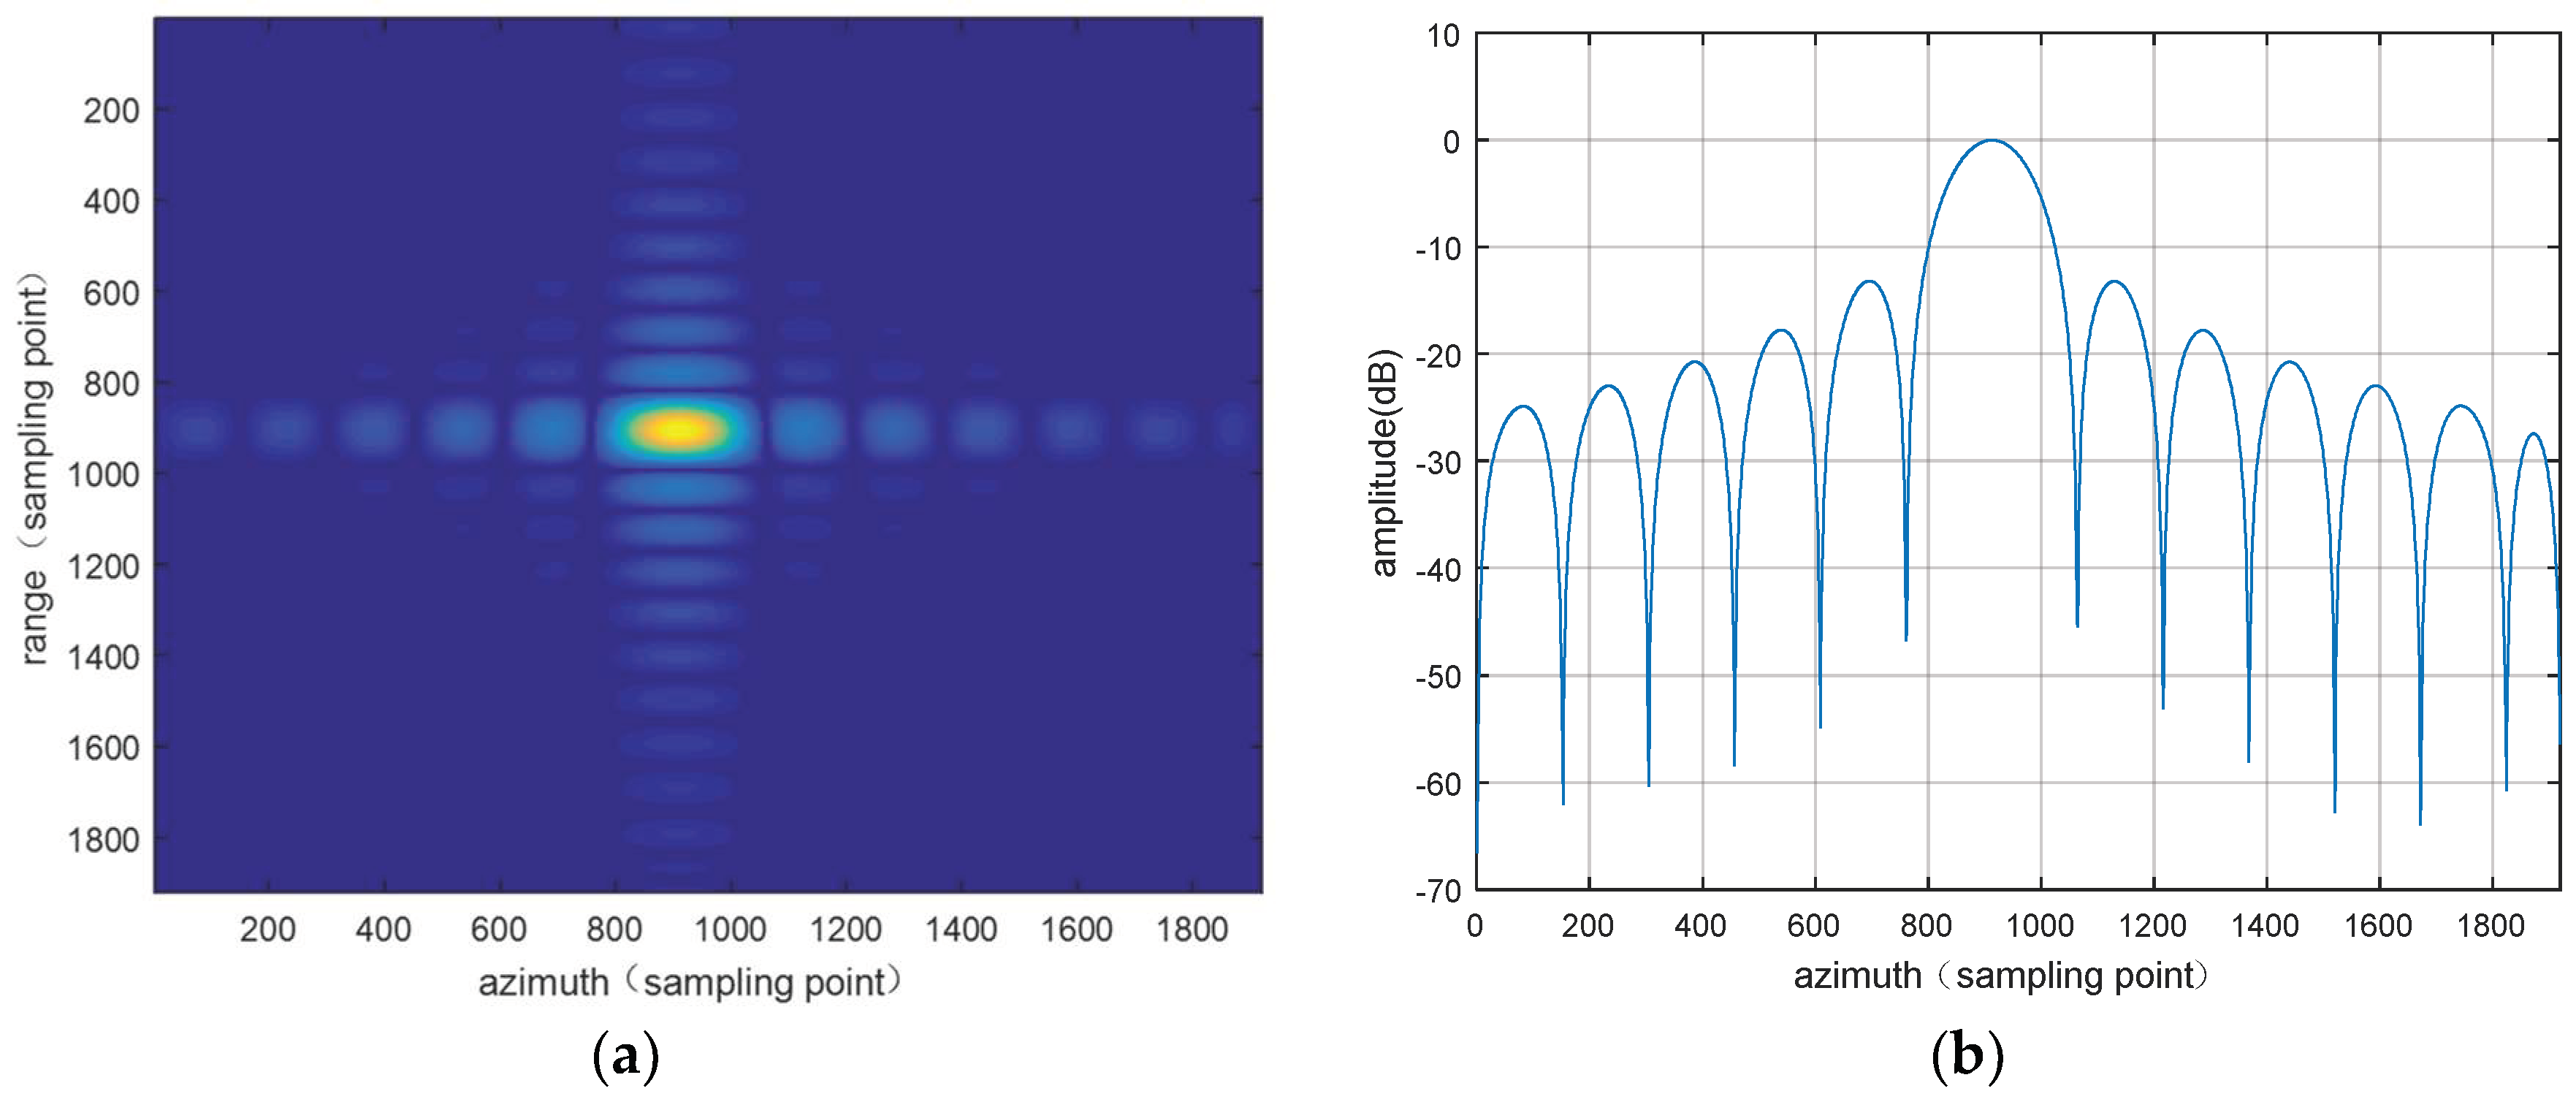
Figure 17.
The simulation results for 2° bistatic angle with the consideration of the TCR optimum boresight. (a) The point target image after upsampling 48 times; (b) the azimuth profile based on the results of the electromagnetic simulation.
Figure 17.
The simulation results for 2° bistatic angle with the consideration of the TCR optimum boresight. (a) The point target image after upsampling 48 times; (b) the azimuth profile based on the results of the electromagnetic simulation.
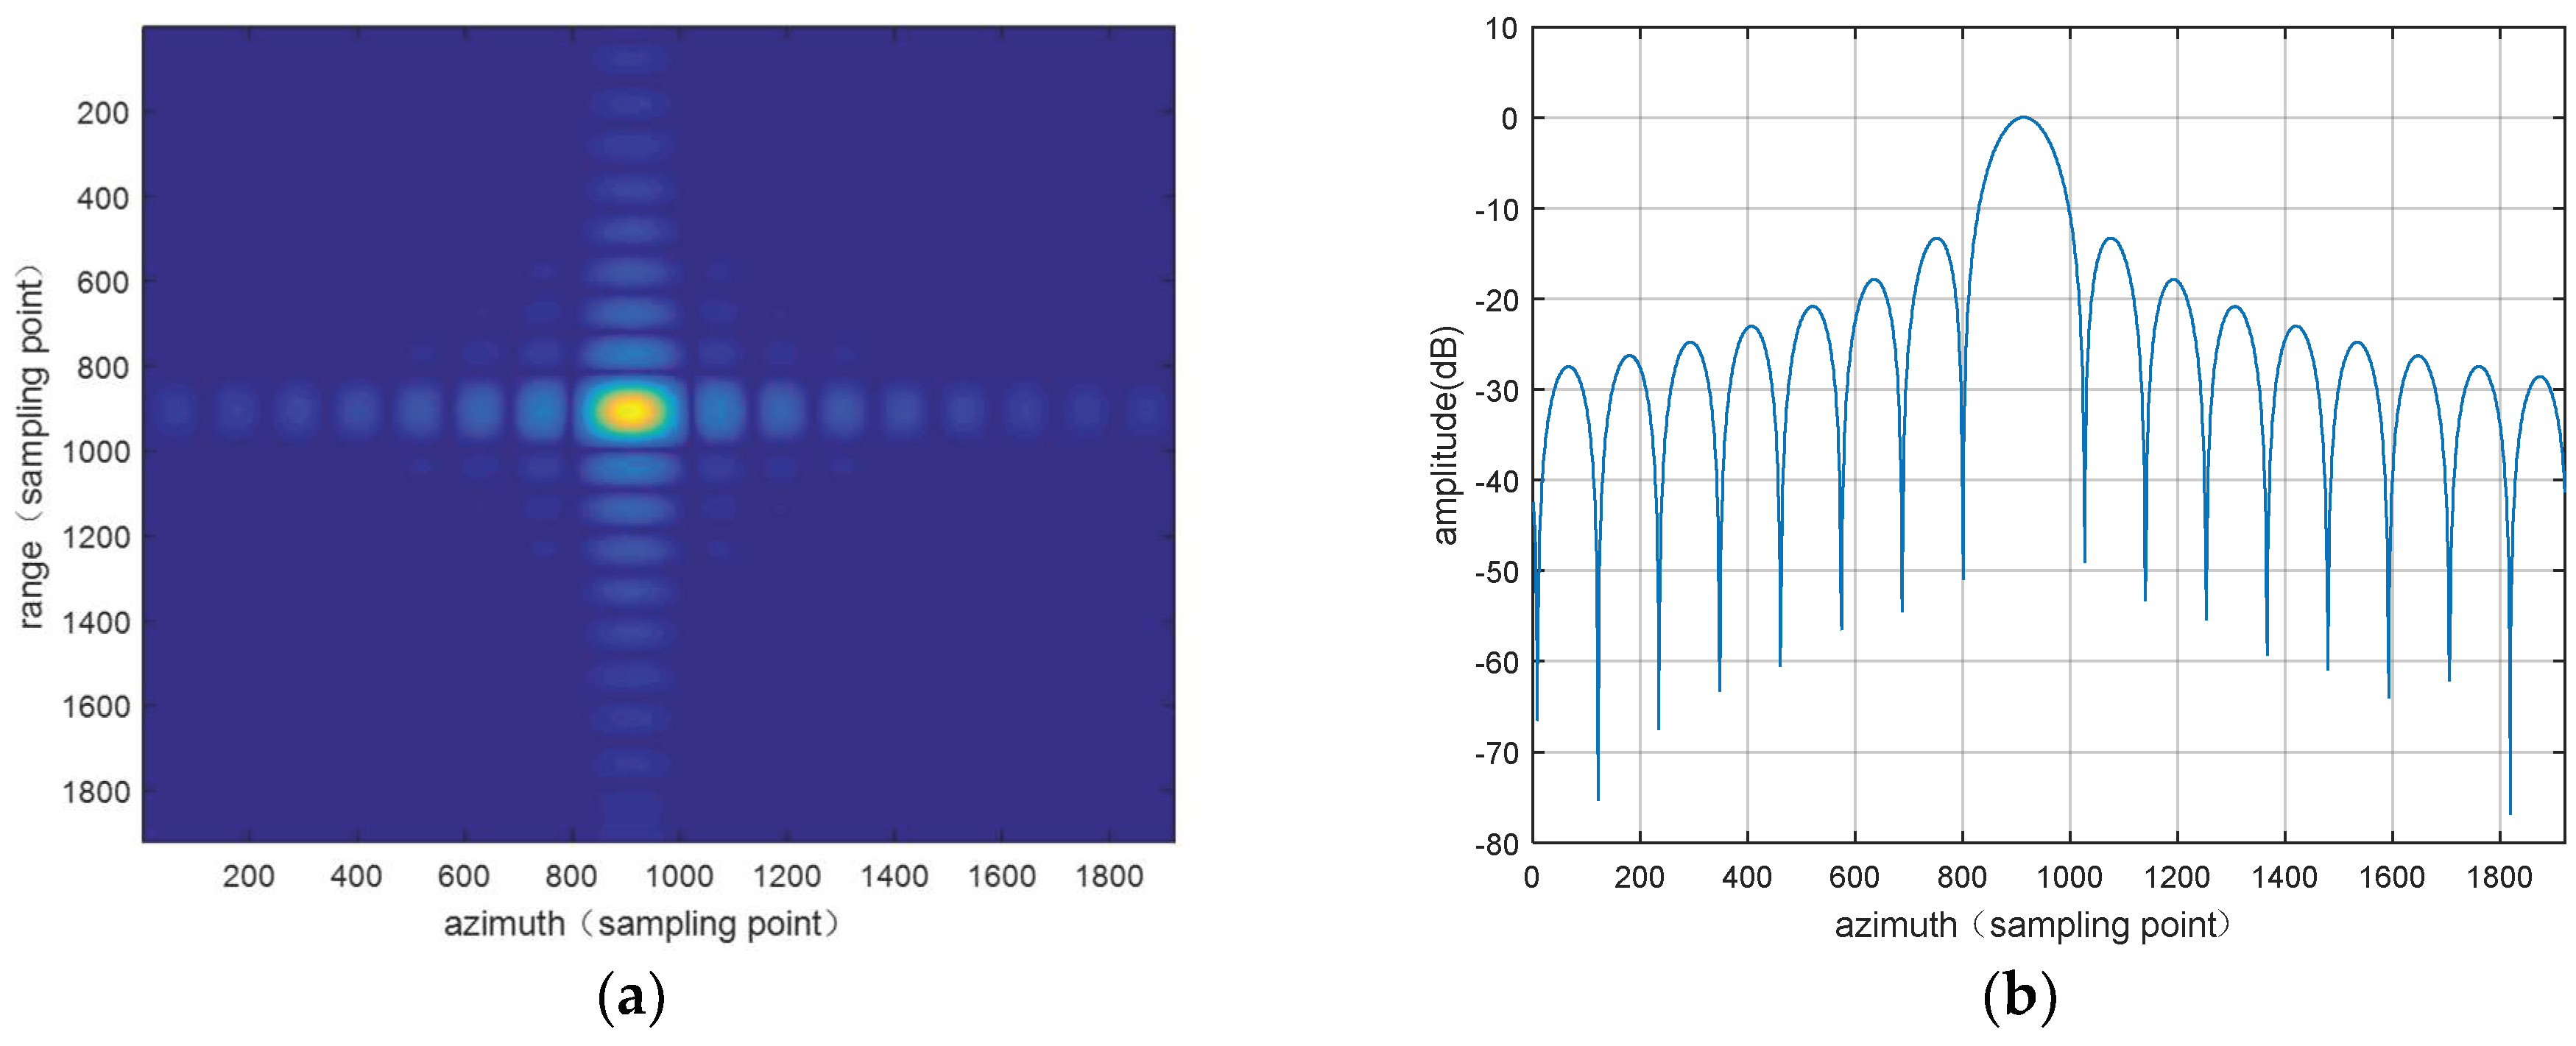
Figure 18.
The simulation results for 6° bistatic angle with the consideration of the TCR optimum boresight. (a) The point target image after upsampling 48 times; (b) the azimuth profile based on the results of the electromagnetic simulation.
Figure 18.
The simulation results for 6° bistatic angle with the consideration of the TCR optimum boresight. (a) The point target image after upsampling 48 times; (b) the azimuth profile based on the results of the electromagnetic simulation.
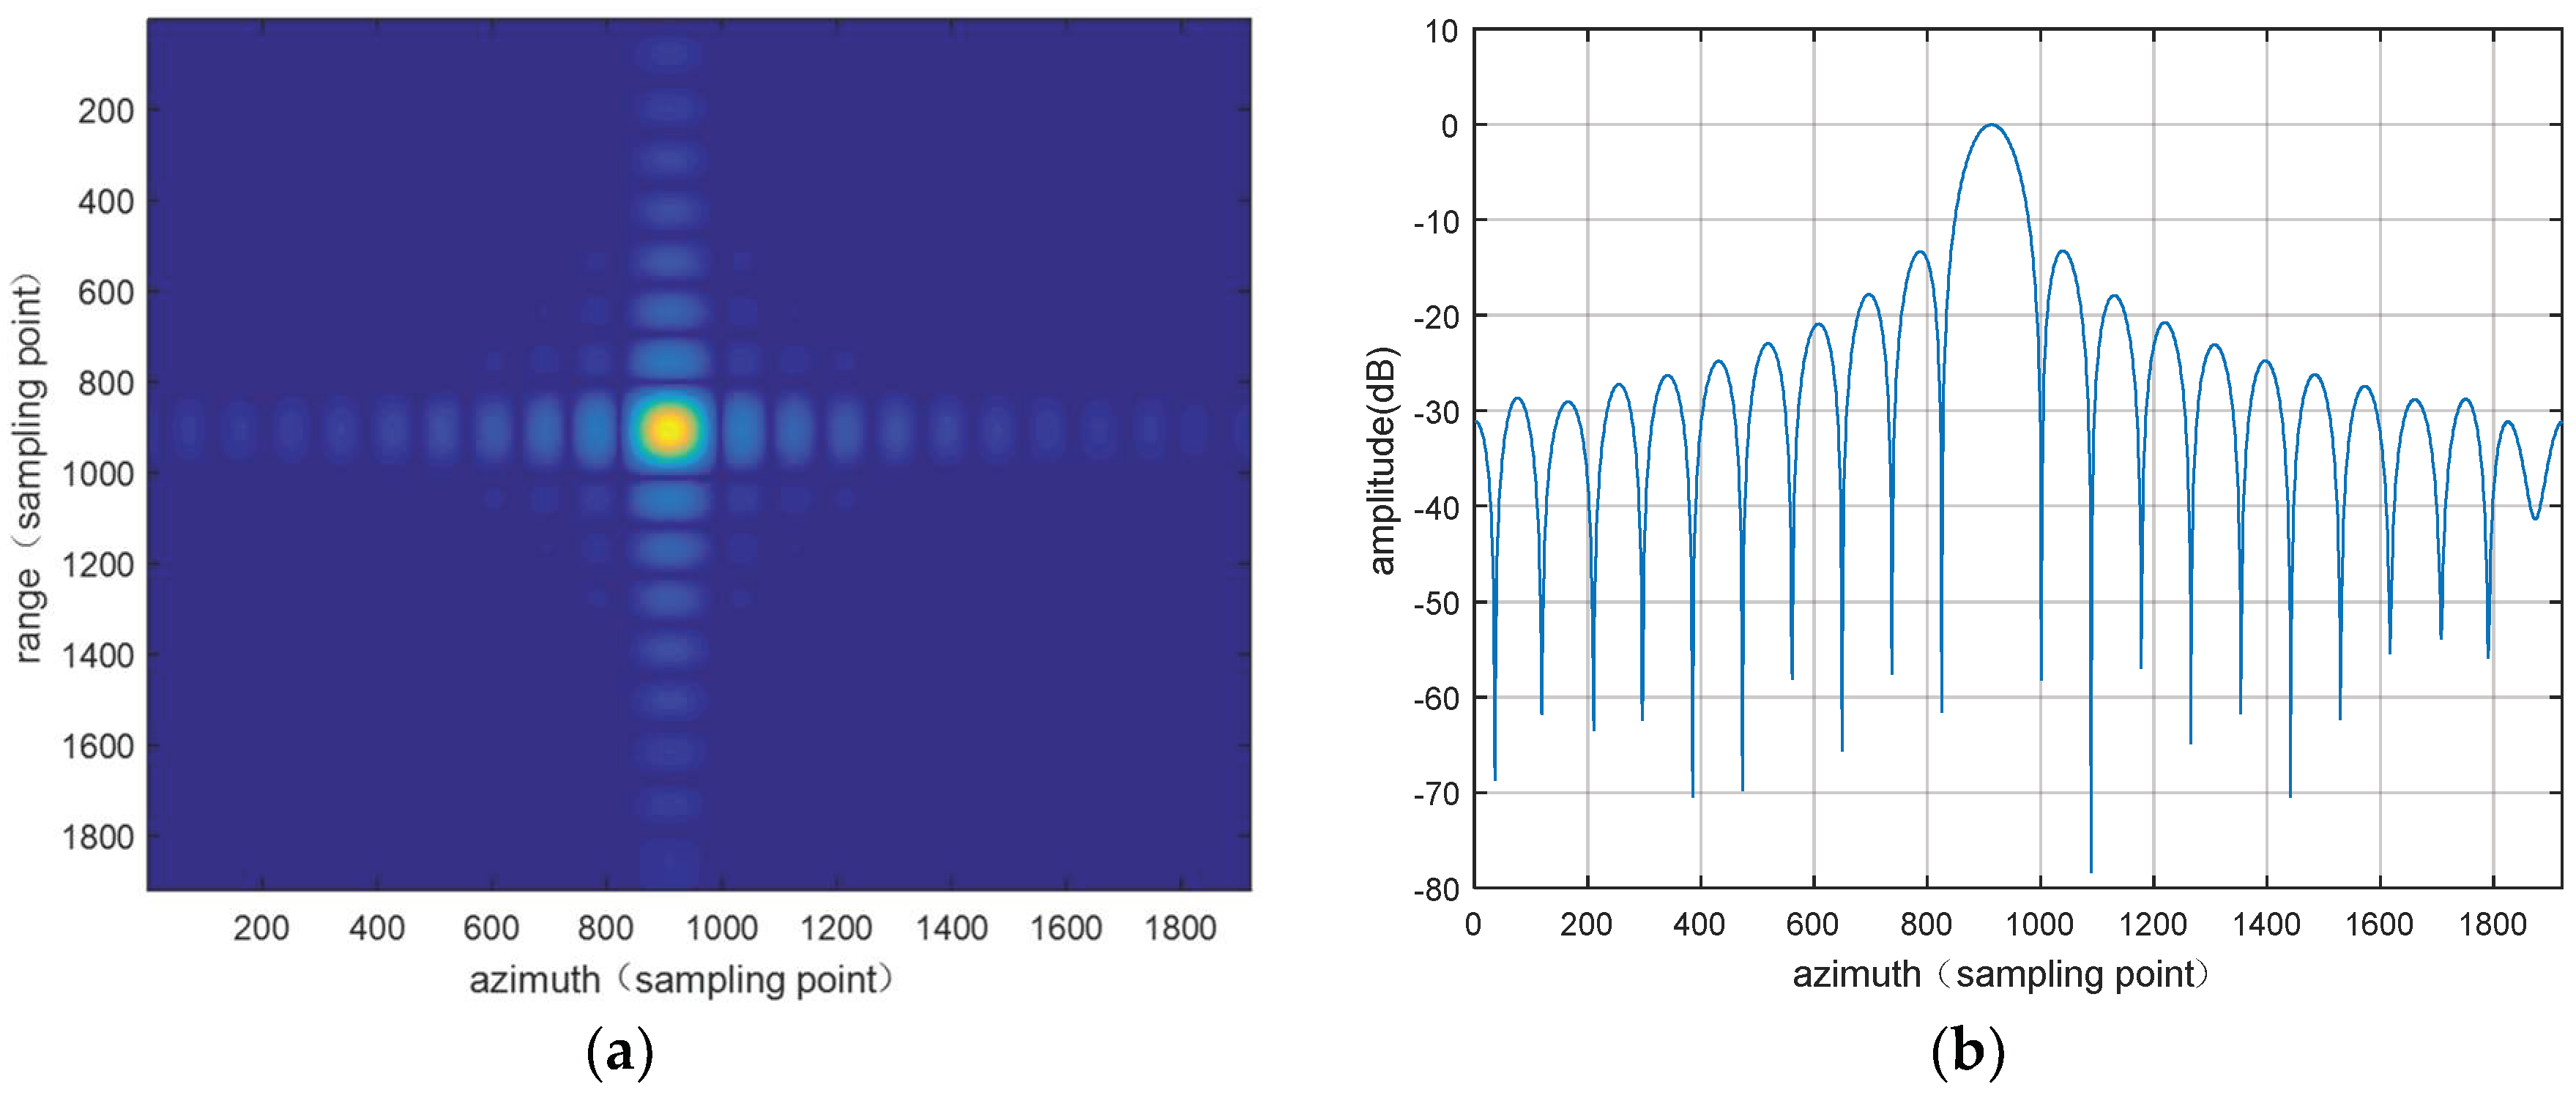
Figure 19.
The simulation results for 20° bistatic angle with the consideration of the TCR optimum boresight. (a) The point target image after upsampling 48 times; (b) the azimuth profile based on the results of the electromagnetic simulation.
Figure 19.
The simulation results for 20° bistatic angle with the consideration of the TCR optimum boresight. (a) The point target image after upsampling 48 times; (b) the azimuth profile based on the results of the electromagnetic simulation.


Table 1.
System parameters used in the simulation dataset.
| Simulation Data Parameters | |
|---|---|
| Frequency | 9.6 GHz (X-Band) |
| Bandwidth | 100 MHz |
| Pulse width | 1.5 μs |
| Altitude | 2 × 10⁴ m |
| Velocity | 150 m/s |
| Antenna azimuth beamwidth | 0.5° |
| Azimuth sampling rate | 300 Hz |
| Range sampling rate | 120 MHz |
Table 2.
Image quality analysis parameters of the TCR. IRW: impulse response width, PSLR: peak side lode ratio, ISLR: integral side lobe ratio.
Table 2.
Image quality analysis parameters of the TCR. IRW: impulse response width, PSLR: peak side lode ratio, ISLR: integral side lobe ratio.
| Bistatic Angle | IRW (m) | Range PSLR | Range ISLR | Azimuth PSLR | Azimuth ISLR | Energy |
|---|---|---|---|---|---|---|
| 2° | 2.5521 | −13.3511 | −10.2050 | −13.2756 | −10.2737 | 49.8635 |
| 6° | 2.7604 | −13.3257 | −10.1887 | −13.3436 | −10.4011 | 44.1211 |
| 20° | 3.4895 | −13.3577 | −10.2092 | −13.1612 | −10.4430 | 34.3275 |
Table 3.
Image quality analysis parameters of the TCR.
| Bistatic Angle | IRW (m) | Range PSLR | Range ISLR | Azimuth PSLR | Azimuth ISLR | Energy |
|---|---|---|---|---|---|---|
| 2° | 2.6041 | −13.3613 | −10.2023 | −13.2855 | −10.3628 | 49.8637 |
| 6° | 2.0313 | −13.3295 | −10.2343 | −13.29544 | −10.2122 | 47.5656 |
| 20° | 1.7187 | −13.3458 | −10.3923 | −13.29661 | −10.1582 | 44.3411 |
© 2018 by the authors. Licensee MDPI, Basel, Switzerland. This article is an open access article distributed under the terms and conditions of the Creative Commons Attribution (CC BY) license (http://creativecommons.org/licenses/by/4.0/).
Share and Cite
MDPI and ACS Style
Zheng, Q.; Wang, Y.; Hong, J.; Wang, A. Feasibility, Design, and Deployment Requirements of TCR for Bistatic SAR Radiometric Calibration. Remote Sens. 2018, 10, 1610. https://doi.org/10.3390/rs10101610
AMA Style
Zheng Q, Wang Y, Hong J, Wang A. Feasibility, Design, and Deployment Requirements of TCR for Bistatic SAR Radiometric Calibration. Remote Sensing. 2018; 10(10):1610. https://doi.org/10.3390/rs10101610
Chicago/Turabian StyleZheng, Qiaona, Yu Wang, Jun Hong, and Aichun Wang. 2018. "Feasibility, Design, and Deployment Requirements of TCR for Bistatic SAR Radiometric Calibration" Remote Sensing 10, no. 10: 1610. https://doi.org/10.3390/rs10101610
Note that from the first issue of 2016, this journal uses article numbers instead of page numbers. See further details here.