Scattering and Radiative Properties of Morphologically Complex Carbonaceous Aerosols: A Systematic Modeling Study


1
NASA Goddard Institute for Space Studies, 2880 Broadway, New York, NY 10025, USA
2
Columbia University, 2880 Broadway, New York, NY 10025, USA
3
NASA Goddard Institute for Space Studies, 2880 Broadway, New York, NY 10025, USA
*
Author to whom correspondence should be addressed.
Remote Sens. 2018, 10(10), 1634; https://doi.org/10.3390/rs10101634
Submission received: 8 September 2018
/
Revised: 4 October 2018
/
Accepted: 6 October 2018
/
Published: 14 October 2018
(This article belongs to the Special Issue Advances in Remote Sensing of Aerosols and Cloud Properties over Ocean)
Abstract
:This paper provides a thorough modeling-based overview of the scattering and radiative properties of a wide variety of morphologically complex carbonaceous aerosols. Using the numerically-exact superposition T-matrix method, we examine the absorption enhancement, absorption Ångström exponent (AAE), backscattering linear depolarization ratio (LDR), and scattering matrix elements of black-carbon aerosols with 11 different model morphologies ranging from bare soot to completely embedded soot–sulfate and soot–brown carbon mixtures. Our size-averaged results show that fluffy soot particles absorb more light than compact bare-soot clusters. For the same amount of absorbing material, the absorption cross section of internally mixed soot can be more than twice that of bare soot. Absorption increases as soot accumulates more coating material and can become saturated. The absorption enhancement is affected by particle size, morphology, wavelength, and the amount of coating. We refute the conventional belief that all carbonaceous aerosols have AAEs close to 1.0. Although LDRs caused by bare soot and certain carbonaceous particles are rather weak, LDRs generated by other soot-containing aerosols can reproduce strong depolarization measured by Burton et al. for aged smoke. We demonstrate that multi-wavelength LDR measurements can be used to identify the presence of morphologically complex carbonaceous particles, although additional observations can be needed for full characterization. Our results show that optical constants of the host/coating material can significantly influence the scattering and absorption properties of soot-containing aerosols to the extent of changing the sign of linear polarization. We conclude that for an accurate estimate of black-carbon radiative forcing, one must take into account the complex morphologies of carbonaceous aerosols in remote sensing studies as well as in atmospheric radiation computations.
1. Introduction
Soot aerosols serve as an important tropospheric absorber of radiation [1,2,3]. They exert radiative forcing directly, through scattering and absorption of solar and infrared radiation in the atmosphere, and indirectly, by affecting cloud formation and reducing the albedo of ice and snow surfaces [2,3,4,5,6,7,8,9,10,11,12,13]. Knowledge of the scattering and radiative properties of soot particles is essential in a variety of applications such as remote sensing, environmental studies, optical diagnostics for industrial aerosol processes and combustion, and astrophysical phenomena involving the effects of interstellar grains on light propagation and scattering (e.g., Refs. [14,15,16]).
Freshly emitted soot particles are fractal aggregates typically consisting of tens to hundreds of carbonaceous spherules (monomers) with diameters of about a few tens of nanometers [17,18,19,20]. These fresh soot aerosols are mostly hydrophobic and externally mixed with other aerosol constituents, but tend to become semi-externally and internally mixed (according to the mixing classification in Ref. [21]) as they age in the atmosphere. The aging processes include condensation of sulfates, nitrates, organics, and water on soot particles’ surfaces; coagulation with preexisting aerosols; and heterogeneous reactions with gaseous oxidants [22,23,24,25]. Meanwhile, the soot aggregate morphology changes and exhibits compaction from fluffy to more densely packed formations [26,27,28].
According to Ueda et al. [29,30], carbonaceous aerosols can be classified into seven types based on their dominant morphology: soot aggregates, spherical particles, coccoid particles, dome-like particles, clusters of spherical and coccoid bodies, crystalline coarse bodies, and re-crystallized droplet particles. China et al. [31,32] classify the soot component of carbonaceous aerosols into four major morphological types: embedded, with soot fully engulfed by, e.g., a sulfate host; partly coated, wherein the coating material fills the soot internal voids; thinly coated, wherein coating on soot is minimal; and partially embedded, wherein only a fraction of the soot material is inside the host particle.
There is a rather wide consensus that aggregation can result in a significant enhancement of absorption relative to that computed for idealized spherically-shaped aerosols using the Lorenz–Mie theory [33,34,35,36,37], while internal mixing of soot aerosols with other non-absorbing or weakly absorbing aerosol species further amplifies absorption compared to the corresponding external mixture [2,30,38,39,40,41,42,43,44,45,46,47]. The absorption enhancement is a complex function of many factors such as the size and shape of the soot aerosols, the refractive index, the mixing state, the location of soot within the host, the amount and composition of the coating material, etc. Naturally, there is a wide range of estimates in various modeling and measurement studies of how much more light can be absorbed by morphologically complex carbonaceous aerosols.
In the study by He et al. [46], there is a voluminous compilation of laboratory and field results that reveal substantial variations in the degree of increased absorption of solar radiation by black carbon (BC) aerosols. From the modeling perspective, Haywood et al. [48] used a simplified volume mixing model to estimate the global radiative forcing for an external mixture of soot and sulfate aerosols at 0.2 W m−2 relative to the sulfate-only case by assuming a soot/sulfate mass ratio of 0.075, as compared to 0.36 W m−2 for the internal-mixing scenario. The concentric core–shell model was used by Jacobson [39] in a climate model to evaluate the direct radiative forcing by elemental carbon. It was found that the mixing state can amplify the BC global direct forcing by a factor of 2.9 (+0.27 W m−2 for an external mixture, +0.54 W m−2 for BC as a coated core, and +0.78 W m−2 for BC being well mixed internally, based on an effective-medium approximation).
Numerous recent studies have highlighted the inadequacy of the standard concentric core–shell model and other oversimplified internal-mixing schemes often used in climate models [19,36,46,49,50,51,52]. For example, the experimental measurements of atmospheric black carbon by Cappa et al. [49,50] showed that the measured absorption enhancement by weakly absorbing coating materials was much lower than that predicted by the concentric core–shell model. Bueno et al. [51] found that the amplification in absorption observed when BC was coated with a surrogate of sulfuric acid was smaller than the predictions using core–shell Mie theory, and they attributed the discrepancy to the misrepresentation of the morphology of the coated particles and/or the structure of the BC core in the model. On the basis of the so-called discrete dipole approximation (DDA) of electromagnetic scattering [53], Adachi et al. [19] concluded that, overall, the external mixing model underestimates the absorption cross section by about 30%, while the concentric core–shell model results in a 40% overestimation, depending on the actual shapes and positions of soot inclusions within their hosts. Kahnert and Devasthale [36] found that the radiative forcing at the top of the atmosphere doubles if fresh BC is modeled as an aggregate instead of a homogeneous sphere. The radiative forcing caused by aggregates with open chain-like (lacy) structures is 1.1 to 1.6 times greater than that for aggregates with a more compact shape. Liu et al. [52] demonstrated that the core–shell model significantly overestimates the absorption enhancement by the coating in the visible and near-infrared spectral range compared to the DDA results for a coated soot aggregate. The study by He et al. [46] suggests that it is necessary to incorporate a dynamic aerosol aging process in climate models for an accurate estimate of BC radiative effects; depending on coating morphology and aging stage, the increase in absorption is estimated to range from 20% to 250%.
When absorption is measured or calculated at two or more wavelengths, the absorption Ångström exponent (AAE), which characterizes the spectral dependence of particulate absorption, can be defined according to
where λ and Cabs denote the wavelength and the aerosol ensemble-averaged absorption cross section per particle, respectively. The AAE has been used for particle characterization and source apportionment in many studies [54,55,56,57,58]. The soot AAE has been widely accepted to be close to 1.0 when the externally mixed soot carbon is the only absorbing agent present [2,59,60,61,62,63,64]. AAE values close to unity can be interpreted as being caused by aerosols rich in BC from fossil fuel burning, while greater AAE values are indicative of the abundance of biomass/biofuel burning or dust in the sample [54]. The AAE has also been used quantitatively to separate brown carbon (BrC) absorption from BC absorption [65,66]. Schuster et al. [67] explored the possibility of exploiting the AAE to deduce the component aerosol absorption optical depth of carbonaceous aerosols in the Aerosol Robotic Network (AERONET) database. In the case study by Garg et al. [68], limitations of the use of the AAE for source apportionment of equivalent BC was emphasized. Garg et al. argued that the AAE is not representative of the fuel used and cannot be used as a generic tracer to constrain source contributions.
The derivation of AAE values ≈1.0 has been based on the assumptions that (i) the soot particles are small compared to the incident wavelengths and are within the Rayleigh limit, and (ii) their refractive index is wavelength independent. The validity of these two assumptions is highly questionable as ambient soot aerosols often exist as aggregates of numerous small spherules and are commonly coated by, embedded in, or aggregated with other materials [19], while the soot refractive index is known to vary with wavelength [69,70]. Indeed, observational estimates of the AAE values for BC aerosols fall into a wide range: 0.6–1.3 according to Liu et al. [71] and 0.31–1.25 according to Bahadur et al. [72].
As the first derivative of absorption with respect to wavelength, the AAE is affected by the same complex factors, listed above, that affect aerosol absorption. Liu et al. [71] applied the multiple-sphere T-matrix method [73,74,75,76] to calculate the BC size-averaged AAE assuming that the particles obey a lognormal size distribution. The main theoretical models of actual particle morphologies considered in that study were fluffy aggregates (fresh BC) as well as compact aggregates and coated compact aggregates (aged BC). Liu et al. [71] concluded that the AAE of fresh BC is approximately 1.05 if a wavelength-independent refractive index is adopted. This appears to be reasonable owing to the dominant role of first-order scattering by Rayleigh-sized monomers. For both compact and coated BC, however, it was found that the AAE is highly sensitive to the particle size distribution, ranging from approximately 0.8 to over 1.4 with a wavelength-independent refractive index. Liu et al. surmised that the BC AAE would have a much wider range if a wavelength-dependent refractive index was adopted.
The backscattering linear depolarization ratio (LDR) [77] is another important aerosol characteristic that can be used for optical characterization of morphologically complex BC aerosols. A non-zero LDR indicates the presence of nonspherical aerosols and is rather sensitive to their size relative to the wavelength. Until quite recently, it had generally been believed that strong absorption of light by bare BC aggregates causes very small (and thereby hardly useful) LDR values. However, higher LDR values of 0.05–0.11 at 532 nm have sometimes been observed for layers of aged smoke (see Refs. [14,78] and references therein). In the remarkable study by Burton et al. [14], exceptionally high LDR values potentially reaching 0.24 at 355 nm were observed using the NASA Langley airborne High Spectral Resolution Lidar-2 (HSRL-2) (see also Refs. [79,80]).
Many studies have been carried out to calculate the BC LDR theoretically [78,81,82,83,84,85,86]. Calculations for bare BC aggregates [81,82] tend to produce small LDR values, much smaller than what was measured in the HSRL-2 case study by Burton et al. [14]. Yet, Kahnert et al. [78] and, especially, Mishchenko et al. [84] have demonstrated that specific complex morphologies of soot-containing aerosols can reproduce the observed spectral dependence of the LDRs and thereby confirmed the potential of using depolarization measurements to identify and characterize smoke particles.
It has recently been suggested that making passive multiangle photopolarimetric measurements and especially combining active and passive remote sensing can improve the detection and accurate quantitative characterization of BC aerosols [87,88]. In this case the knowledge of the entire scattering matrix as a function of BC morphology becomes essential.
Consistent with the above rationale, the primary objective of this paper is to perform a thorough and systematic theoretical overview of the scattering and radiative properties of a wide variety of morphologically complex carbonaceous aerosols, including their spectral dependence. Our goal is to obtain a much improved quantitative understanding of how the absorption enhancement, AAE, LDR, and scattering matrix elements depend on BC-particle microphysics and quantify the likely range of their variability. To this end, we use the highly efficient and numerically-exact superposition T-matrix method (STMM), which is a first-principles scattering methodology rendering direct computer solutions of the macroscopic Maxwell equations [73,74,75,76,89]. Given the enormous diversity and variability of morphologies of carbonaceous aerosols, any single study cannot be exhaustive. Yet we believe that our systematic analysis is uniquely representative by virtue of featuring 11 soot-particle morphological models ranging from bare (both fluffy and compact) to partially embedded to fully-engulfed soot. We specifically analyze the factors that are potentially critical but have often been left out or downplayed in previous studies, i.e., the dependence of light scattering and absorption on (i) the distribution of soot inside a host, (ii) the fraction of soot enclosed inside the host, (iii) the volume fraction of the host/coating material, (iv) the coating thickness of each individual spherule, and (v) the range of monomer radii. We assume that soot and soot-containing aerosols obey a power law size distribution with the effective volume-equivalent radii consistent with observations. In addition, two different types of coating substance, viz., sulfate and BrC, are considered. The calculations are carried out at multiple wavelengths and for spectrally dependent refractive indices for both the BC and the host/coating material.
2. Methods
2.1. Model Aerosol-Particle Morphologies
It has been demonstrated that the typical overall morphology of a relatively fresh dry BC particle is well represented by a fractal cluster described by the following statistical scaling law [81,90]:
where a is the monomer mean radius; k0 is the fractal prefactor; Df is the fractal dimension; NS is the number of monomers in the cluster; and Rg, called the radius of gyration, is a measure of the overall cluster radius. Aged soot-containing aerosols can exhibit varying degrees of deviation from this primordial morphology.
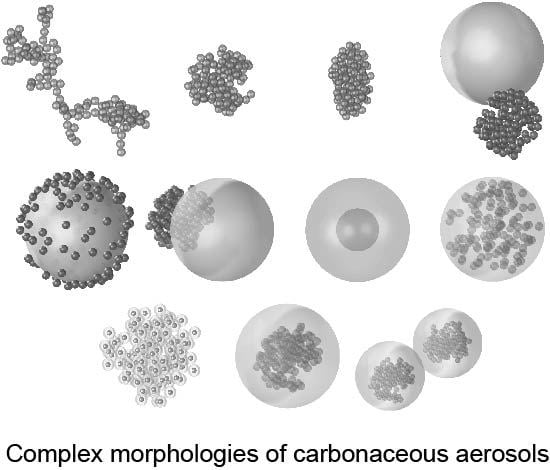
Figure 1 depicts the 11 morphological models of soot and soot-containing aerosols considered in this study, ranging from bare soot to completely embedded soot mixtures. Models 1–3 represent bare soot particles. Model 1 is a freshly emitted fluffy soot aggregate with k0 = 1.2 and Df = 1.8, Model 2 represents a somewhat aged soot aggregate with k0 = 1.2 and Df = 2.6, and Model 3 shows a compact soot cluster whose overall shape is constrained by an imaginary spheroid with an aspect ratio of 2.
In Models 4 and 5, the BC material is semi-externally mixed with a spherical host aerosol. Model 4 shows a sulfate or BrC host particle and an aged soot aggregate with k0 = 1.2 and Df = 2.6 in physical contact, while Model 5 represents a host particle randomly “dusted” with small soot spherules [91].
Model 6 represents the scenario wherein a compact soot fractal is partially embedded in a sulfate or BrC host.
Models 7–11 represent soot particles completely embedded in a spherical host or uniformly coated by a sulfate or BrC material. Model 7 is an internal mixture wherein all soot material is compacted into a single large spherical inclusion. The simplest yet highly idealistic version of this model is the conventional concentric core–shell configuration discussed above. In Model 8, the individual primary soot monomers are quasi-randomly distributed inside the spherical host. Model 9 represents the so-called closed-cell morphology resulting from the accumulation of a refractory material around individual soot monomers forming a compact cluster (with k0 = 1.2 and Df = 2.6). Model 10 represents a spherical sulfate or BrC particle hosting a fully engulfed compact soot cluster. Model 11 is composed of two spherical sulfate or BrC particles in contact, each encapsulating a compact soot aggregate.
Note that for Models 1–10, the amount of soot material is kept fixed, while Model 11 is a semi-external mixture of two Model 10 particles and therefore has twice the amount of soot.
We assume that the effective soot monomer radius is equal to 0.02 µm [20,31,92]. Two different values for the number of monomers are adopted in this study: NS = 125 and 422. Therefore, the corresponding cumulative volume-equivalent radii of soot are equal to 0.1 µm (NS = 125) and 0.15 µm (NS = 422), respectively, consistent with field measurements. Indeed, according to Ueda et al. [30], the peak refractory BC mass-equivalent-sphere diameters were around 0.2 µm for all the samples they collected. In another study [93], the mode for the externally mixed soot (without coating or with minimal coating) size distribution was 0.15–0.2 µm in terms of the equivalent-sphere diameter. The values of NS ranging from 132 to 498 and the area-equivalent radii within 264 to 590 nm were observed for individual freshly emitted wildfire carbonaceous aerosols by China et al. [31].
Aged soot has often been found to be internally mixed with sulfate aerosols [93,94]. Sulfates represent the host or coating material most commonly used in modeling studies [19,44,45,47,78,84,86,95]. Soot can also be mixed with or embedded in weakly absorbing carbonaceous materials derived from combustion of biomass and biofuels and termed brown carbon, or BrC [69]. Therefore, both sulfates and BrC are assumed to form the host or the coating in this study. We calculated light scattering and absorption by carbonaceous aerosols at three wavelengths λ = 355, 532, and 1064 nm representing the spectral channels of the HSRL-2 [14]. The refractive indices of soot at the three wavelengths were estimated according to Equations (19a) and (19b) of Ref. [96]. The corresponding sulfate refractive indices were interpolated from the tabulated values at a 50% relative humidity in Ref. [97]. The BrC refractive index at 532 nm was taken from Ref. [98]. The spectrally dependent refractive indices for all the chemical components used in this study are listed in Table 1.
The soot volume fraction values considered in this study are f = 7% and 15%. It should be emphasized that since we kept the soot amount constant, the respective volume-equivalent radii of the host were R = 0.2426 and 0.1882 µm when the soot volume fractions were 7% and 15%, while NS = 125. When NS was equal to 422, the corresponding R values were 0.3640 and 0.2823 µm. The selection of these parameters was consistent with field measurements. Specifically, it was reported by Vester et al. [99] that the average soot volume fraction for particles of 0.15–0.8 µm in diameter at an urban background site in Mainz, Germany fell between 7–27%. According to Adachi and Buseck [93], the median value of the soot volume fraction for particle aerodynamic diameters 0.05–0.3 µm in Mexico City was 15%. Ueda et al. [29] found that the median soot volume fraction values were less than 20% for 0.2–0.4 µm and less than 10% for 0.4–0.7 µm particles at Cape Hedo. In a more recent study [30], the soot volume fractions were found to be 21–50% and ≈10%, respectively, for particles with diameters ≤0.6 and >0.6 µm.
We used the algorithm described by Mackowski [100,101] to generate fractal-parameter- equivalent soot clusters composed of 125 or 422 equal-size monomers. The fractal prefactor k0 was fixed at 1.2. For freshly emitted fluffy soot represented by Model 1, we assumed the fractal dimension Df = 1.8, while for other models, when applicable, the Df value was set to be 2.6, thereby corresponding to a compact aged soot cluster.
2.2. Optical Modeling
For accurate calculations of the scattering and radiative properties of morphologically complex soot particles, we needed a first-principles methodology based on direct computer solutions of the macroscopic Maxwell equations. The STMM and the DDA [53,102,103] appeared to be the most frequently used techniques. However, other approaches, such as the finite difference time domain method [85,104,105], the pseudo-spectral time domain method [106,107], and the finite element–boundary integral technique [108,109], have also been applied (see, e.g., Ref. [83] and numerous references therein).
Having a reasonable combination of accuracy, efficiency, and versatility in mind, we used the STMM in this study. Importantly, a recent implementation of this technique [76] has made it applicable to arbitrary configurations of spherical domains wherein any of the spheres can be located at points that are either internal or external to the other spheres (i.e., such as the configurations exemplified by Models 6–11). Furthermore, the corresponding program can efficiently be run on distributed-memory computer clusters as well as on serial platforms. Overall, the STMM programs used enable fast and accurate calculations of ensemble-averaged absorption and scattering characteristics of a representative subset of morphologically complex carbonaceous aerosols.
Consistent with Ref. [110], we assume throughout this paper that all nonspherical and/or internally heterogeneous aerosols are randomly oriented and form a statistically isotropic and mirror-symmetric ensemble. The key single-scattering characteristics we were looking for were the (ensemble-averaged) scattering, Csca, and absorption, Cabs, cross sections per particle, as well as the elements of the normalized Stokes scattering matrix. The latter has the following well-known block-diagonal structure [73,111]:
where is the scattering angle. The element of the scattering matrix, is the conventional phase function; it is normalized according to
and describes the angular distribution of the scattered intensity in the case of unpolarized incident light. The conventional LDR is defined as
while the degree of linear polarization of the scattered light for the case of unpolarized incident light is given by
To make our numerical results representative of naturally polydisperse particle groups and further suppress interference and resonance effects typical of electromagnetic scattering by monodisperse particles [73], we supplemented orientation averaging with size averaging. Specifically, we assumed that the distribution of soot and soot-containing particles shown in Figure 1 over sizes could be parameterized by the standard power-law [112]
where r is a “characteristic” aerosol-particle size. The effective size and the effective variance of the size distribution are then defined according to
and
respectively, where
[112]. We assume throughout the paper that the effective variance is fixed at 0.1, which implies that and
The computation of the corresponding size averages is based on the following formulas [73]:
and similarly for the other elements of the normalized scattering matrix, where and (with were the division points and weights of a Gaussian quadrature formula on the interval The number of quadrature points was kept at 100 for all models.
According to this approach, the spherule radii for the bare soot aerosols (Models 1, 2, and 3) varied in the range [0.546765 × 0.02 µm, 1.65323 × 0.02 µm] which corresponded to an effective monomer radius of 0.02 µm. In the case of composite particles, the sizes of all the components were scaled simultaneously so that the volume fraction of soot remained the same at all quadrature division points.
In addition to size averaging, one could also think of averaging over other “random” parameters, for example over random locations of the soot cluster embedded in a large spherical host in Model 10. We found, however, that the “randomized” scattering and radiative characteristics of this model were virtually indistinguishable from those computed for the quasi-central position of the cluster inside the host. This result may imply that it was the combination of the quasi-random morphology of the soot cluster and size averaging that served as the dominant “randomization” factor.
3. Numerical Results for Monodisperse Carbonaceous Aerosols
Before analyzing realistic size-averaged results, it was useful to examine the range of sensitivity of the radiative and scattering characteristics introduced above to microphysical parameters of the individual members of an ensemble. Indeed, this helped us to understand how the ensemble-averaged results could differ from those for the individual members of the ensemble and to what extent the latter could be representative of the former.
Figure 2 illustrates the variation of the absorption cross section and the AAE calculated for different monodisperse soot-containing particles (partially) coated by sulfates. For Models 6, 7, and 9, the soot volume fraction was fixed at f = 7%. All soot aggregates consisted of NS = 125 monomers having the monodisperse radius a = 0.02 µm.
The top row of panels displays the absorption cross section and AAE as functions of the fraction of soot monomers encapsulated inside the sulfate host for Model 6 particles. It is seen that Cabs nearly doubles as more and more soot spherules get engulfed by the host.
The second row of panels shows the sensitivity of the absorption cross section and AAE to the position of the spherical soot inclusion within the host (Model 7) quantified as the distance from the center. R denotes the radius of the host particle and r is the radius of the soot inclusion; the value of R – r is thus the farthest distance from the center that the soot inclusion can move without crossing the outer surface. Given the specified model parameters, the corresponding R and r values were equal to 0.2426 µm and 0.1 µm, respectively. Cabs was maximal when the soot inclusion was at the center of the host, i.e., in the case of the concentric core–shell model frequently used in climate models. As the inclusion moved away from the center toward the outer boundary, absorption gradually decreased. This is consistent with our previous findings reported in Ref. [113].
The third row of panels shows that Cabs did not necessarily increase monotonously with increasing coating thickness for Model 9 aerosols.
Finally, for Model 10 particles (the bottom row of panels), Cabs grew with the size of the sulfate host and could become saturated as the host reached about 95% of the total particle volume.
The AAE computed for the {532 nm, 1064 nm} pair of wavelengths (the right-hand column in Figure 2) also displays a wide range of variability, from about 0.7 to about 1.5. For the specific range of model parameters used, the AAE values for the core–shell Model 7 particles were the closest to unity, i.e., to the “standard” value adopted in the majority of previous studies [2,59,60,61,62,63,64]. The corresponding AAEs increased from ≈0.93 to ≈0.98 as the soot inclusion moved away from the center toward the boundary of the sulfate host. However, the majority of AAE values in Figure 2 were not close to unity but rather were quite variable depending on the particle microphysical parameters. For example, the AAE curve for Model 9 particles shows values of about 1.05 for an aged compact soot aggregate with minimal coating, but as the spherules accumulated sulfate mantles and grew, so did the AAE until it reached the maximum value about 1.5, when the mantle thickness was about five times the monomer radius; then it started to decline.
Figure 3 parallels Figure 2 and depicts the LDR at the 355 nm (left-hand column) and 532 nm (right-hand column) wavelengths for different model parameters. It is clear that linear depolarization was very sensitive to particle size, morphology, sulfate amount, and heterogeneity. Although the outer shape of Model 7 and 10 particles was perfectly spherical, the corresponding LDR values deviated from zero to some extent owing to the existence of the (eccentric) soot impurity. For Model 6 aerosols, the LDRs reached the maximum value when about 35% of the soot material was engulfed by the sulfate host. The LDRs were very close to zero for Model 9 particles when there was minimal or no coating, but could reach nearly 40% when the coating thickness was about seven times the spherule radius (i.e., ≈0.14 µm). The strong linear depolarization induced by Model 9 aerosols (as well as by other large particles of certain morphologies) can potentially explain the high LDR values identified in recent lidar observations [14,79,80].
Figure 4 shows the LDRs at 355 nm and the {532 nm, 1064 nm} AAEs as functions of soot monomer radius a for different Model 2, 6, 9, and 11 soot and soot–sulfate particles and a ranging from 0.01 µm to 0.034 µm. The number of soot spherules was NS = 125 for Models 2, 6, and 9 and NS = 250 for Model 11; the soot volume fraction for Models 6, 9, and 11 was fixed at f = 7%. Since the soot volume fraction was fixed, the overall particle sizes shrunk or expanded accordingly with the size of the soot monomers. For example, for Model 6 aerosols, the sulfate host radius changed from 0.2426 µm to 0.1213 µm as a decreased from 0.02 µm down to 0.01 µm, while for Model 9 aerosols, the radius of the soot cores was always kept at 0.4121 times that of the shells.
Both the LDRs and the AAEs were highly sensitive to the change of particle morphology and size. For the same amount of soot, depending on the specific particle morphology, the difference in LDR values could easily exceed a factor of ten. Overall, the LDR values tended to increase with increasing particle size. When the soot spherule radius a was about 0.01 µm, there was virtually no depolarization for Model 6 aerosols with roughly 50% of soot material engulfed by the host. The LDR values rose quickly to over 40% with four local maxima and minima as a increased from about 0.01 to over 0.03 µm. Interestingly, a similar pattern was observed for Model 11 aerosols, but with stronger oscillations. Such non-uniqueness, wherein different a values can induce the same LDR value if all the other parameters are kept fixed, can potentially cause an ill-posed retrieval problem in a remote-sensing study based on lidar measurements alone. Therefore, other measurements besides the LDR ones may be needed to accurately identify aerosol microphysics.
The AAEs can either increase or decrease with increasing soot monomer radius, as the right-hand column of Figure 4 illustrates. One cannot help but notice that the AAE value was about 1.16 for the bare soot aggregate (Model 2, k0 = 1.2, Df = 2.6, and NS = 125) even when the soot spherules were as small as ≈0.01 µm in radius and the cumulative soot volume-equivalent radius was r = 0.05 µm. The AAEs gradually decreased to the “conventional” value 1.0 when a = 0.022 µm, and then to ≈0.85 when a exceeded 0.03 µm. The deviation of the AAEs from 1.0 can be explained by our use of spectrally varying refractive indices and, more importantly, by the inability of the Rayleigh approximation to describe light scattering and absorption by morphologically complex soot aggregates, even though the individual soot spherules were much smaller than the incident wavelength. It is also evident from Figure 4 that once the soot aerosols became coated with refractive materials, the AAE values were rather different from those of bare soot. Coating could either increase or decrease the AAE values depending on the specific particle morphology.
4. Ensemble-Averaged Numerical Results
Figure 5 shows the size-averaged absorption cross sections at λ = 355 nm (top row), 532 nm (middle row), and 1064 nm (bottom row) for Model 1–10 aerosols. The left-hand and right-hand columns depict the results for aerosols containing NS = 125 and NS = 422 soot spherules, respectively, with an effective soot-monomer radius of a = 0.02 µm. We assumed that 50% of the soot spherules were engulfed by the sulfate host for Model 6 particles. In the case of Model 7, all soot spherules were “compacted” into a single centrally positioned spherical volume-equivalent soot core, thereby representing the conventional concentric core–shell model [39]. The blue and red curves show Cabs for the soot volume fractions f = 7% and 15%, respectively. The effective cumulative volume-equivalent soot radii corresponding to a = 0.02 µm were equal to 0.1 and 0.15 µm. For the bare soot aggregates (Models 1–3), the results shown by the blue and red curves were identical.
It is clear from Figure 5 that freshly emitted fluffy soot particles (Model 1) tended to absorb more light than the other types of bare soot with a more compact structure (Models 2 and 3). As pointed out by Liu et al. [35], this may be the consequence of the shielding effect of the outer layer of monomers that blocks light from penetrating deeply inside a compact aggregate. The semi-external mixture represented by Model 5 was a stronger absorber than that represented by Model 4 owing to the more direct exposure of the soot spherules to the incident light. The role of the strongest light absorbers, however, belonged to soot–sulfate internal mixtures. Figure 5 shows that for the same amount of absorbing material, Cabs of the internal mixtures could be more than twice that of bare soot depending on how the soot was distributed throughout the host particle. At λ = 355 nm, the size-averaged absorption cross section was about 0.043 µm2 for Model 3 particles with NS = 125 and a = 0.02 µm, but jumped to about 0.091 µm2 for Model 8 aerosols with a 7% soot volume fraction. For NS = 422, Cabs increased from about 0.113 µm2 to about 0.263 µm2 when the particle morphology changed from Model 3 to Model 9.
The absorption enhancement was influenced by particle size (left-hand vs right-hand columns), morphology (different models), wavelength (different rows), and amount of coating (blue vs red curves). No single morphology served as the universally strongest absorber: depending on many factors accommodated in Figure 5, it could be Model 7, 8, 9, or 10. It was always true, however, that for the same amount of absorbing material, soot-containing aerosols with a thicker coating absorbed more light than their counterparts with less coating, unless the amount of coating was so large that absorption got saturated.
Figure 6 parallels Figure 5 and illustrates the variability of the AAEs, calculated for three different pairs of wavelengths, with varying aerosol morphology. Again, the effective soot monomer radius a was fixed at 0.02 µm. Our numerically-exact results show that the AAE was quite sensitive to the choice of pair of wavelengths as well as to the particle morphology and size. It could also be sensitive to the amount of coating material. The fresh-soot AAEs (Model 1) were always larger than the AAEs of the other two types of bare soot (Models 2 and 3). By comparing the results on the left with those on the right, we concluded that the AAE could significantly decrease with increasing aerosol-particle size and soot volume fraction. This was consistent with the finding by Liu et al. [71]. When we compared the AAEs for “soot-aggregate-equivalent” Model 2 and 10 particles, we could not conclude definitively that coating increased (or decreased) the AAE, as both scenarios were possible. Among the morphological types considered in this study, the concentric core–shell model produced the smallest AAE values: it could become as low as 0.1 when the AAE was calculated for the {355 nm, 532 nm} pair of wavelengths. Although the size-averaged AAEs were close to 1.0 for some aerosol particles with NS = 125, the overall range of AAEs was quite wide: from as low as 0.1 to about 1.7. We thus cannot help but conclude that using a flat value of 1.0 is likely to introduce significant errors in soot-aerosol absorption analyses.
The concentric core–shell Model 7 was spherically symmetric and hence caused zero depolarization. Figure 7 depicts the size-averaged LDRs calculated for seven other models containing NS = 125 (left-hand panels) or 422 (right-hand panels) BC spherules with an effective radius a = 0.02 µm. Model 11 was a semi-external mixture of two Model 10 particles and therefore contained twice as much soot. In most cases, the solid lines lay above the corresponding dotted ones, thereby indicating that particles with more sulfate material generated larger LDR values than their BC-equivalent counterparts with less sulfate material. The only exception was Model 10, which appears to be inconsistent with the bottom panels of Figure 3. It should be kept in mind, however, that Figure 3 shows the results computed for monodisperse aerosols and may not be representative of size-averaged LDRs.
As expected, the LDRs caused by Model 4 and 5 particles are rather insignificant and may often be within the instrumental noise level. As such, they hardly contain much useful information. However, we did see larger LDRs for other morphologies such as Models 6 and 11. Figure 7 confirms the potential of exploiting polarization backscattering lidars for optical characterization of morphologically complex particulates, especially when depolarization data are available at multiple wavelengths. For example, a spherical sulfate host with a partially imbedded (in this case 50%) soot aggregate (Model 6) with NS = 422, f = 7% and a semi-external mixture of two heterogeneous sulfate particles each encapsulating a soot aggregate (Model 11) with NS = 125, f = 7% both produced LDR values at λ = 355, 532, and 1064 nm within the range observed for an aged smoke plume by Burton et al. [14] = 0.203 ± 0.053 at 355 nm, 0.093 ± 0.026 at 532 nm, and 0.018 ± 0.009 at 1064 nm). It is worth mentioning that Model 9 particles were also able to generate spectral LDRs consistent with the lidar measurements by Burton et al. provided that the sulfate coating of each individual soot spherule was of the right thickness [84].
Active lidar measurements (especially multi-wavelength lidar systems [114]) coupled with advanced passive photopolarimetric observations may provide the capability to identify and characterize aerosols with nonspherical geometries such as soot and dust particles [87,88,115]. The fidelity of such retrievals obviously depends on the adequacy of modeling the Stokes scattering matrix. As an example, Figure 8 illustrates the differences in the size-averaged phase function and linear polarization between different soot and soot–sulfate aerosol models. The number of soot spherules was NS = 125, and their effective radius a was fixed at 0.02 µm. Again, in the case of the concentric core–shell Model 7, all the soot spherules were consolidated into one single volume-equivalent spherical soot core. The solid and dotted curves depict the results calculated for soot volume fractions of f = 7% and 15%, respectively. As before, we assumed that 50% of soot spherules were engulfed by the host particles in the case of Model 6.
Figure 8 and its companion, Figure 9, reveal a considerable degree of dependence of both and on aerosol-particle morphology. For bare soot aggregates represented by Models 1–3, we could not help but notice that the degree of linear polarization for unpolarized incident light is essentially Rayleigh-like, with a nearly 100% maximum at ≈ 90°, thereby implying the dominant role of single scattering by the subwavelength soot monomers. At the same time, the corresponding phase functions had a pronounced forward-scattering peak typical of wavelength-sized particles. This remarkable scattering behavior of large aggregates composed of Rayleigh-sized monomers was first identified by West [116,117]. As the soot aggregates acquired more sulfate material or got attached to a sulfate host, the became significantly reduced, the position of maximal polarization shifted toward larger scattering angles around 130°, and a negative-polarization branch could develop at backscattering angles. This behavior became even more prominent with increasing NS, as shown in Figure 9.
Our computations of light scattering and absorption by soot particles hosted or coated by BrC material were less comprehensive and will be expanded once consistent and accurate BrC refractive indices at λ = 355 and 1064 nm become available. Based on our limited data shown in Figure 10, it is clear that even with the same size and morphology, the physical properties of the BrC material can fundamentally change the overall optical properties of soot-containing aerosols. Indeed, comparison of the dotted and the corresponding solid curves reveals significant differences in the phase function and the degree of linear polarization for the soot-equivalent aerosols, to the extent of the polarization switching sign.
Figure 11 shows the corresponding LDR differences at λ = 532 nm. We can see that the LDRs for Models 5, 8, and 10 were rather small and showed little dependence on the host/coating material. However, the LDR for Model 11 particles could be significantly altered by the nature of the host substance.
5. Conclusions and Future Work
We have used the numerically-exact and highly efficient superposition T-matrix method to investigate the absorption enhancement, the absorption Ångström exponent, the backscattering linear depolarization ratio, and essential scattering matrix elements of carbonaceous aerosols represented by 11 distinct morphologies ranging from bare soot to completely embedded soot–sulfate and soot–BrC internal mixtures.
Our sensitivity analysis for monodisperse aerosols shows that for the commonly used core–shell model (Model 7), absorption was maximal when the soot inclusion was centrally positioned and steadily weakened as the soot inclusion moved closer to the boundary of the host. We demonstrated numerically that for Model 6 (a soot aggregate partially imbedded in the spherical sulfate host), absorption nearly doubled as the percentage of the monomers engulfed by the host increased from zero to 100%. For the Model 10 morphology (a spherical sulfate particle hosting a completely imbedded compact soot cluster), absorption increased with the volume fraction of the sulfate material and could get saturated as this fraction reached ≈95%.
Our size-averaged results demonstrated once again that freshly emitted fluffy soot particles (Model 1) tended to absorb more light compared with the other types of bare soot aerosols having more compact morphologies (Models 2 and 3). Model 3 soot clusters, which mimic the cocoon shape observed by Ueda et al. [30], were the least efficient absorbers. For the same amount of absorbing material, the absorption cross section of internally mixed soot could be more than twice that of bare soot. In general, the absorption enhancement was influenced by particle size, morphology, wavelength, and amount of sulfate or BrC material. As a result, no single morphological model served as a universally strongest absorber. It is worth emphasizing that although many previous studies have indicated that the BC absorption enhancement predicted by the concentric core–shell morphology is biased high [19,49,50,51,52], which may indeed be the case when the calculations and/or measurements are performed at a longer wavelength, such as 1064 nm, the absorption by the concentric core–shell geometry at λ = 355 nm was actually weaker than that by the other “equivalent” soot-sulfate internal mixtures.
We believe that the absorption enhancement is also strongly affected by the choice of constituent refractive indices. In this study, we used a set of pre-defined spectrally varying refractive indices. In the future, it may be instructive to consider refractive indices that represent the higher and lower bounds of BC absorption.
Our analysis of the AAE largely validated the conclusions drawn by Liu et al. [71] and extended their study to a great extent. In general, the AAE was quite sensitive to the choice of the wavelength pair, particle morphology, and size, and the constituent refractive indices. While the conventional assumption is that the AAE is ≈1.0 for isolated BC particles, our computations of the size-averaged AAE for bare-soot aerosols exhibited values ranging from ≈0.68 to ≈1.26. Furthermore, when soot was semi-externally or internally mixed with sulfates, the range of AAE values extended from ≈0.1 to ≈1.7. Thus, using the flat value ≈1.0 can be thoroughly inappropriate.
Our computations confirmed and further illustrated that size-averaged LDRs can be very sensitive to particle size, shape, and morphology. The LDRs produced by bare-soot aerosols and some types of internal soot mixtures were rather small and hence hardly useful. However, Model 6, 9, and 11 aerosols containing large amounts of refractory materials could cause much larger LDRs and could even reproduce exceptionally high, spectrally dependent values such as those measured by Burton et al. [14] for a plume of aged smoke. Our results demonstrate that spectral LDR measurements can be used to identify the presence of morphologically complex smoke particles, even though additional observations (e.g., with a passive polarimeter [87,88,118,119,120,121] or a bistatic polarization lidar [122,123,124,125]) may be required to narrow down the plausible ranges of particle morphology (including size) and composition.
The scattering phase function and the degree of linear polarization also varied greatly among different carbonaceous aerosol models having the same amount of absorbing material. While bare-soot aerosols exhibited classical bell-shaped polarization curves typical of Rayleigh scattering, mixing them semi-externally or internally with sulfate or BrC materials could modify the scattering-angle dependence of polarization quite dramatically. This result emphasized the importance of using appropriate aerosol models in analyses of remote-sensing observations and in situ measurements.
In summary, the results of our extensive computations based on numerically-exact solutions of the Maxwell equations further demonstrate that the scattering and radiative properties of particulate soot can vary significantly from the moment it is injected into the atmosphere as it goes through different processes of aging all the way until it settles. Our study confirms the importance of explicit morphological and optical modeling of soot and soot-containing aerosols in atmospheric-radiation computations as well as in remote-sensing studies.
Being as extensive and systematic as it is, our analysis is still not exhaustive. For example, it needs to be supplemented by computations of light scattering and absorption at λ = 355 nm and 1064 nm for BC–BrC semi-external and internal mixtures. It is also important to study the effects of other hosting/coating materials with different refractive indices. Furthermore, significant effort is required in order to incorporate complex morphological models of BC aerosols in retrieval algorithms and climate-related computations of atmospheric radiation. Lastly, extensive comparisons of modeling results with experiments must be a priority.
Author Contributions
Conceptualization, M.I.M.; Data curation, L.L.; Formal analysis, L.L.; Methodology, L.L. and M.I.M.; Supervision, M.I.M.; Writing—original draft, L.L.; Writing—review and editing, M.I.M.
Funding
NASA ACE Project and NASA Radiation Sciences Program.
Acknowledgments
All numerical results were obtained with the “Discover” supercomputer at the NASA Center for Climate Simulation. We thank four anonymous reviewers for positive and instructive comments.
Conflicts of Interest
The authors declare no conflict of interest. The funders had no role in the design of the study; in the collection, analyses, or interpretation of data; in the writing of the manuscript, or in the decision to publish the results.
References
- Sato, M.; Hansen, J.; Koch, D.; Lacis, A.; Ruedy, R.; Dubovik, O.; Holben, B.; Chin, M.; Novakov, T. Global atmospheric black carbon inferred from AERONET. Proc. Natl. Acad. Sci. USA 2003, 100, 6319–6324. [Google Scholar] [CrossRef] [PubMed] [Green Version]
- Bond, T.C.; Bergstrom, R.W. Light absorption by carbonaceous particles: An investigative review. Aerosol Sci. Technol. 2006, 40, 27–67. [Google Scholar] [CrossRef]
- Bond, T.C.; Doherty, S.J.; Fahey, D.W.; Forster, P.M.; Berntsen, T.; DeAngelo, B.J.; Flanner, M.G.; Ghan, S.; Kärcher, B.; Koch, D.; et al. Bounding the role of black carbon in the climate system: A scientific assessment. J. Geophys. Res. 2013, 118, 5380–5552. [Google Scholar] [CrossRef] [Green Version]
- Chýlek, P.; Lesins, G.B.; Videen, G.; Wong, J.G.D.; Pinnick, R.G.; Ngo, D.; Klett, J.D. Black carbon and absorption of solar radiation by clouds. J. Geophys. Res. 1996, 101, 23365–23371. [Google Scholar] [CrossRef]
- Hansen, J.E.; Sato, M.; Ruedy, R. Radiative forcing and climate response. J. Geophys. Res. 1997, 102, 6831–6864. [Google Scholar] [CrossRef] [Green Version]
- Ackerman, A.S.; Toon, O.B.; Stevens, D.E.; Heymsfield, A.J.; Ramanathan, V.; Welton, E.J. Reduction of tropical cloudiness by soot. Science 2000, 288, 1042–1047. [Google Scholar] [CrossRef] [PubMed]
- Hansen, J.; Bond, T.; Cairns, B.; Gaeggler, H.; Liepert, B.; Novakov, T.; Schichtel, B. Carbonaceous aerosols in the industrial era. Eos Trans. Am. Geophys. Union 2004, 85, 241–248. [Google Scholar] [CrossRef]
- Hansen, J.; Nazarenko, L. Soot climate forcing via snow and ice albedos. Proc. Natl. Acad. Sci. USA 2004, 101, 423–428. [Google Scholar] [CrossRef] [PubMed]
- Ramanathan, V.; Ramana, M.V.; Roberts, G.; Kim, D.; Corrigan, C.; Chung, C.; Winker, D. Warming trends in Asia amplified by brown cloud solar absorption. Nature 2007, 448, 575–579. [Google Scholar] [CrossRef] [PubMed]
- Ramanathan, V.; Carmichael, G. Global and regional climate changes due to black carbon. Nat. Geosci. 2008, 1, 221–227. [Google Scholar] [CrossRef]
- Moosmüller, H.; Chakrabarty, R.K.; Arnott, W.P. Aerosol light absorption and its measurement: A review. J. Quant. Spectrosc. Radiat. Transf. 2009, 110, 844–878. [Google Scholar] [CrossRef]
- Bauer, S.E.; Menon, S.; Koch, D.; Bond, T.C.; Tsigaridis, K. A global modeling study on carbonaceous aerosol microphysical characteristics and radiative effects. Atmos. Chem. Phys. 2010, 10, 7439–7456. [Google Scholar] [CrossRef] [Green Version]
- Koch, D.; Del Genio, A.D. Black carbon absorption effects on cloud cover: Review and synthesis. Atmos. Chem. Phys. 2010, 10, 7685–7696. [Google Scholar] [CrossRef] [Green Version]
- Burton, S.P.; Hair, J.W.; Kahnert, M.; Ferrare, R.A.; Hostetler, C.A.; Cook, A.L.; Harper, D.B.; Berkoff, T.A.; Seaman, S.T.; Collins, J.E.; et al. Observations of the spectral dependence of linear particle depolarization ratio of aerosols using NASA Langley airborne high spectral resolution lidar. Atmos. Chem. Phys. 2015, 15, 13453–13473. [Google Scholar] [CrossRef]
- Videen, G.; Kocifaj, M. (Eds.) Optics of Cosmic Dust; Springer: New York, NY, USA, 2002. [Google Scholar]
- Borghese, F.; Denti, P.; Saija, R. Scattering from Model Non-Spherical Particles; Springer: Berlin, Germany, 2007. [Google Scholar]
- Li, J.; Pósfai, M.; Hobbs, P.V.; Buseck, P.R. Individual aerosol particles from biomass burning in southern Africa: 2. Compositions and aging of inorganic particles. J. Geophys. Res. 2003, 108, 8484. [Google Scholar] [CrossRef]
- Pósfai, M.; Simonics, R.; Li, J.; Hobbs, P.V.; Buseck, P.R. Individual aerosol particles from biomass burning in southern Africa: 1. Compositions and size distributions of carbonaceous particles. J. Geophys. Res. 2003, 108, 8483. [Google Scholar] [CrossRef]
- Adachi, K.; Chung, S.H.; Buseck, P.R. Shapes of soot aerosol particles and implications for their effects on climate. J. Geophys. Res. 2010, 115, D15206. [Google Scholar] [CrossRef]
- Buseck, P.R.; Adachi, K.; Gelencsér, A.; Tompa, É.; Pósfai, M. Are black carbon and soot the same? Atmos. Chem. Phys. Discuss. 2012, 12, 24821–24846. [Google Scholar] [CrossRef]
- Mishchenko, M.I.; Liu, L.; Travis, L.D.; Lacis, A.A. Scattering and radiative properties of semi-external versus external mixtures of different aerosol types. J. Quant. Spectrosc. Radiat. Transf. 2004, 88, 139–147. [Google Scholar] [CrossRef]
- Zuberi, B.; Johnson, K.S.; Aleks, G.K.; Molina, L.T.; Laskin, A. Hydrophilic properties of aged soot. Geophys. Res. Lett. 2005, 32, L01807. [Google Scholar] [CrossRef]
- Khalizov, A.F.; Cruz-Quinones, M.; Zhang, R.Y. Heterogeneous reaction of NO2 on fresh and coated soot surfaces. J. Phys. Chem. A 2010, 114, 7516–7524. [Google Scholar] [CrossRef] [PubMed]
- Zhang, R.Y.; Khalizov, A.; Wang, L.; Hu, M.; Xu, W. Nucleation and growth of nanoparticles in the atmosphere. Chem. Rev. 2012, 112, 1957–2011. [Google Scholar] [CrossRef] [PubMed]
- Moteki, N.; Kondo, Y.; Miyazaki, Y.; Takegawa, N.; Komazaki, Y.; Kurata, G.; Shirai, T.; Blake, D.R.; Miyakawa, T.; Koike, M. Evolution of mixing state of black carbon particles: Aircraft measurements over the western Pacific in March 2004. Geophys. Res. Lett. 2007, 34, L11803. [Google Scholar] [CrossRef]
- Zhang, R.Y.; Khalizov, A.F.; Pagels, J.; Zhang, D.; Xue, H.X.; McMurry, P.H. Variability in morphology, hygroscopicity, and optical properties of soot aerosols during atmospheric processing. Proc. Natl. Acad. Sci. USA 2008, 105, 10291–10296. [Google Scholar] [CrossRef] [PubMed] [Green Version]
- Adachi, K.; Buseck, P.R. Changes of ns-soot mixing states and shapes in an urban area during CalNex. J. Geophys. Res. Atmos. 2013, 118, 3723–3730. [Google Scholar] [CrossRef] [Green Version]
- Ma, X.; Zangmeister, C.D.; Gigault, J.; Mulholland, G.W.; Zachariah, M.R. Soot aggregate restructuring during water processing. J. Aerosol Sci. 2013, 66, 209–219. [Google Scholar] [CrossRef]
- Ueda, S.; Osada, K.; Takami, A. Morphological features of soot-containing particles internally mixed with water-soluble materials in continental outflow observed at Cape Hedo, Okinawa, Japan. J. Geophys. Res. 2011, 116, D17207. [Google Scholar] [CrossRef]
- Ueda, S.; Nakayama, T.; Taketani, F.; Adachi, K.; Matsuki, A.; Iwamoto, Y.; Sadanaga, Y.; Matsumi, Y. Light absorption and morphological properties of soot-containing aerosols observed at an East Asian outflow site, Noto Peninsula, Japan. Atmos. Chem. Phys. 2016, 6, 2525–2541. [Google Scholar] [CrossRef]
- China, S.; Mazzoleni, C.; Gorkowski, K.; Aiken, A.C.; Dubey, M.K. Morphology and mixing state of individual freshly emitted wildfire carbonaceous particles. Nat. Commun. 2013, 4, 2122. [Google Scholar] [CrossRef] [PubMed]
- China, S.; Scarnato, B.; Owen, R.C.; Zhang, B.; Ampadu, M.T.; Kumar, S.; Dzepina, K.; Dziobak, M.P.; Fialho, P.; Perlinger, J.A.; et al. Morphology and mixing state of aged soot particles at a remote marine free troposphere site: Implications for optical properties. Geophys. Res. Lett. 2015, 42, 1243–1250. [Google Scholar] [CrossRef] [Green Version]
- Liu, L.; Mishchenko, M.I. Effects of aggregation on scattering and radiative properties of soot aerosols. J. Geophys. Res. 2005, 110, D11211. [Google Scholar] [CrossRef]
- Liu, L.; Mishchenko, M.I. Scattering and radiative properties of complex soot and soot-containing aggregate particles. J. Quant. Spectrosc. Radiat. Transf. 2007, 106, 262–273. [Google Scholar] [CrossRef]
- Liu, L.; Mishchenko, M.I.; Arnott, W.P. A study of radiative properties of fractal soot aggregates using the superposition T-matrix method. J. Quant. Spectrosc. Radiat. Transf. 2008, 109, 2656–2663. [Google Scholar] [CrossRef]
- Kahnert, M.; Devasthale, A. Black carbon fractal morphology and short-wave radiative impact: A modeling study. Atmos. Chem. Phys. 2011, 11, 11745–11759. [Google Scholar] [CrossRef]
- Wu, Y.; Gu, X.; Cheng, T.; Xie, D.; Yu, T.; Chen, H.; Guo, J. The single scattering properties of the aerosol particles as aggregated spheres. J. Quant. Spectrosc. Radiat. Trans. 2012, 113, 1454–1466. [Google Scholar] [CrossRef]
- Fuller, K.A.; Malm, W.C.; Kreidenweis, S.M. Effects of mixing on extinction by carbonaceous particles. J. Geophys. Res. 1999, 104, 15941–15954. [Google Scholar] [CrossRef] [Green Version]
- Jacobson, M.Z. Strong radiative heating due to the mixing state of black carbon in atmospheric aerosols. Nature 2001, 409, 695–697. [Google Scholar] [CrossRef] [PubMed]
- Bond, T.C.; Habib, G.; Bergstrom, R.W. Limitations in the enhancement of visible light absorption due to mixing state. J. Geophys. Res. Atmos. 2006, 111, D20211. [Google Scholar] [CrossRef]
- Scarnato, B.V.; Vahidinia, S.; Richard, D.T.; Kirchstetter, T.W. Effects of internal mixing and aggregate morphology on optical properties of black carbon using discrete dipole approximation model. Atmos. Chem. Phys. 2013, 13, 5089–5101. [Google Scholar] [CrossRef]
- Liou, K.N.; Takano, Y.; Yang, P. Light absorption and scattering by aggregates: Application to black carbon and snow grains. J. Quant. Spectrosc. Radiat. Transf. 2011, 112, 1581–1594. [Google Scholar] [CrossRef]
- Liu, C.; Panetta, R.L.; Yang, P. The influence of water coating on the optical scattering properties of fractal soot aggregates. Aerosol Sci. Technol. 2012, 46, 31–43. [Google Scholar] [CrossRef]
- Liu, C.; Li, J.; Yin, Y.; Zhu, B.; Feng, Q. Optical properties of black carbon aggregates with non-absorptive coating. J. Quant. Spectrosc. Radiat. Transf. 2017, 187, 443–452. [Google Scholar] [CrossRef]
- Kahnert, M.; Nousiainen, T.; Lindqvist, H.; Ebert, M. Optical properties of light absorbing carbon aggregates mixed with sulfate: Assessment of different model geometries for climate forcing calculations. Opt. Express 2012, 20, 10042–10058. [Google Scholar] [CrossRef] [PubMed]
- He, C.; Liou, K.N.; Takano, Y.; Zhang, R.; Zamora, M.L.; Yang, P.; Li, Q.; Leung, L.R. Variation of the radiative properties during black carbon aging: Theoretical and experimental intercomparison. Atmos. Chem. Phys. 2015, 15, 11967–11980. [Google Scholar] [CrossRef]
- Dong, J.; Zhao, J.M.; Liu, L.H. Morphological effects on the radiative properties of soot aerosols in different internally mixing states with sulfate. J. Quant. Spectrosc. Radiat. Transf. 2015, 165, 43–55. [Google Scholar] [CrossRef]
- Haywood, J.M.; Roberts, D.L.; Slingo, A.; Edwards, J.M.; Shine, K.P. General circulation model calculations of the direct radiative forcing by anthropogenic sulfate and fossil-fuel soot aerosol. J. Clim. 1997, 10, 1562–1577. [Google Scholar] [CrossRef]
- Cappa, C.D.; Onasch, T.B.; Massoli, P.; Worsnop, D.R.; Bates, T.B.; Cross, E.S.; Davidovits, P.; Hakala, J.; Hayden, K.L.; Jobson, B.T.; et al. Radiative absorption enhancements due to the mixing state of atmospheric black carbon. Science 2012, 337, 1078–1081. [Google Scholar] [CrossRef] [PubMed]
- Cappa, C.D.; Onasch, T.B.; Massoli, P.; Worsnop, D.R.; Bates, T.S.; Cross, E.S.; Davidovits, P.; Hakala, J.; Hayden, K.L.; Jobson, B.T.; et al. Response to comment on “Radiative absorption enhancements due to the mixing state of atmospheric black carbon”. Science 2013, 339, 393. [Google Scholar] [CrossRef] [PubMed]
- Bueno, P.A.; Havey, D.K.; Mulholland, G.W.; Hodges, J.T.; Gillis, K.A.; Dickerson, R.R.; Zachariah, M.R. Photoacoustic measurements of amplification of the absorption cross section for coated soot aerosols. Aerosol Sci. Technol. 2011, 45, 1217–1230. [Google Scholar] [CrossRef]
- Liu, F.; Yon, J.; Bescond, A. On the radiative properties of soot aggregates—Part 2: Effects of coating. J. Quant. Spectrosc. Radiat. Transf. 2016, 172, 134–145. [Google Scholar] [CrossRef]
- Draine, B.T.; Flatau, P.J. Discrete-dipole approximation for scattering calculations. J. Opt. Soc. Am. A 1994, 11, 1491–1499. [Google Scholar] [CrossRef]
- Russell, P.B.; Bergstrom, R.W.; Shinozuka, Y.; Clarke, A.D.; DeCarlo, P.F.; Jimenez, J.L.; Livingston, J.M.; Redemann, J.; Dubovik, O.; Strawa, A. Absorption Ångström exponent in AERONET and related data as an indicator of aerosol composition. Atmos. Chem. Phys. 2010, 10, 1155–1169. [Google Scholar] [CrossRef]
- Giles, D.M.; Holben, B.N.; Eck, T.F.; Sinyuk, A.; Smirnov, A.; Slutsker, I.; Dickerson, R.R.; Thompson, A.M.; Schafer, J.S. An analysis of AERONET aerosol absorption properties and classifications representative of aerosol source regions. J. Geophys. Res. 2012, 117, D17203. [Google Scholar] [CrossRef]
- Sandradewi, J.; Prévôt, A.S.H.; Szidat, S.; Perron, N.; Alfarra, M.R.; Lanz, V.A.; Weingartner, E.; Baltensperger, U. Using aerosol light absorption measurements for the quantitative determination of wood burning and traffic emission contributions to particulate matter. Environ. Sci. Technol. 2008, 42, 3316–3323. [Google Scholar] [CrossRef]
- Crilley, L.R.; Bloss, W.J.; Yin, J.; Beddows, D.C.S.; Harrison, R.M.; Allan, J.D.; Young, D.E.; Flynn, M.; Williams, P.; Zotter, P.; et al. Sources and contributions of wood smoke during winter in London: Assessing local and regional influences. Atmos. Chem. Phys. 2015, 15, 3149–3171. [Google Scholar] [CrossRef] [Green Version]
- Favez, O.; El Haddad, I.; Piot, C.; Boréave, A.; Abidi, E.; Marchand, N.; Jaffrezo, J.-L.; Besombes, J.-L.; Personnaz, M.-B.; Sciare, J.; et al. Inter-comparison of source apportionment models for the estimation of wood burning aerosols during wintertime in an Alpine city (Grenoble, France). Atmos. Chem. Phys. 2010, 10, 5295–5314. [Google Scholar] [CrossRef] [Green Version]
- Kirchstetter, T.W.; Novakov, T.; Hobbs, P.V. Evidence that the spectral dependence of light absorption by aerosols is affected by organic carbon. J. Geophys. Res. 2004, 109, D21208. [Google Scholar] [CrossRef]
- Bergstrom, R.W.; Russell, P.B.; Hignett, P. Wavelength dependence of the absorption of black carbon particles: Predictions and results from the TARFOX experiment and implications for the aerosol single scattering albedo. J. Atmos. Sci. 2002, 59, 567–577. [Google Scholar] [CrossRef]
- Bergstrom, R.W.; Pilewskie, P.; Schmid, B.; Russell, P.B. Estimates of the spectral aerosol single scattering albedo and aerosol radiative effects during SAFARI 2000. J. Geophys. Res. 2003, 108, 8474. [Google Scholar] [CrossRef]
- Schnaiter, M.; Horvath, H.; Möhler, O.; Naumann, K.-H.; Saathoff, H.; Söchck, O.W. UV-VIS-NIR spectral optical properties of soot and soot-containing aerosols. J. Aerosol Sci. 2003, 34, 1421–1444. [Google Scholar] [CrossRef]
- Lawless, P.A.; Rodes, C.E.; Ensor, D.S. Multiwavelength absorbance of filter deposits for determination of environmental tobacco smoke and black carbon. Atmos. Environ. 2004, 38, 3373–3383. [Google Scholar] [CrossRef]
- Yang, M.; Howell, S.G.; Zhuang, J.; Huebert, B.J. Attribution of aerosol light absorption to black carbon, brown carbon, and dust in China—interpretations of atmospheric measurements during EAST-AIRE. Atmos. Chem. Phys. 2009, 9, 2035–2050. [Google Scholar] [CrossRef]
- Kirchstetter, T.W.; Thatcher, T.L. Contribution of organic carbon to wood smoke particulate matter absorption of solar radiation. Atmos. Chem. Phys. 2012, 12, 6067–6072. [Google Scholar] [CrossRef] [Green Version]
- Lu, Z.; Streets, D.G.; Winijkul, E.; Yan, F.; Chen, Y.; Bond, T.C.; Feng, Y.; Dubey, M.K.; Liu, S.; Pinto, J.P.; et al. Light absorption properties and radiative effects of primary organic aerosol emissions. Environ. Sci. Technol. 2015, 49, 4868–4877. [Google Scholar] [CrossRef] [PubMed]
- Schuster, G.; Dubovik, O.; Arola, A.; Eck, T.F.; Holben, B. Remote sensing of soot carbon—Part 2: Understanding the absorption Ångström exponent. Atmos. Chem. Phys. 2016, 16, 1587–1602. [Google Scholar] [CrossRef]
- Garg, S.; Chandra, B.P.; Sinha, V.; Sarda-Esteve, R.; Gros, V.; Sinha, B. Limitation of the use of the absorption Ångström Exponent for source apportionment of equivalent black carbon: A case study from the north west Indo-Gangetic plain. Environ. Sci. Technol. 2016, 50, 814–824. [Google Scholar] [CrossRef] [PubMed]
- You, R.; Radney, J.G.; Zachariah, M.R.; Zangmeister, C.D. Measured wavelength-dependent absorption enhancement of internally mixed black carbon with absorbing and non-absorbing materials. Environ. Sci. Technol. 2016, 50, 7982–7990. [Google Scholar] [CrossRef] [PubMed]
- Kim, J.; Bauer, H.; Dobovičnik, T.; Hitzenberger, R.; Lottin, D.; Ferry, D.; Petzold, A. Assessing optical properties and refractive index of combustion aerosol particles through combined experimental and modeling studies. Aerosol Sci. Technol. 2015, 49, 340–350. [Google Scholar] [CrossRef]
- Liu, C.; Chung, C.E.; Yin, Y.; Schnaiter, M. The absorption Ångström exponent of black carbon: From numerical aspects. Atmos. Chem. Phys. 2018, 18, 6259–6273. [Google Scholar] [CrossRef]
- Bahadur, R.; Praveen, P.S.; Xu, Y.; Ramanathan, V. Solar absorption by elemental and brown carbon determined from spectral observations. Proc. Natl. Acad. Sci. USA 2012, 109, 17366–17371. [Google Scholar] [CrossRef] [PubMed] [Green Version]
- Mishchenko, M.I.; Travis, L.D.; Lacis, A.A. Scattering, Absorption, and Emission of Light by Small Particles; Cambridge University Press: Cambridge, UK, 2002. [Google Scholar]
- Mackowski, D.W.; Mishchenko, M.I. A multiple sphere T-matrix Fortran code for use on parallel computer clusters. J. Quant. Spectrosc. Radiat. Transf. 2011, 112, 2182–2192. [Google Scholar] [CrossRef]
- Mackowski, D. The extension of Mie theory to multiple spheres. In The Mie Theory; Hergert, W., Wriedt, T., Eds.; Springer: Berlin, Germany, 2012; pp. 223–256. [Google Scholar]
- Mackowski, D.W. A general superposition solution for electromagnetic scattering by multiple spherical domains of optically active media. J. Quant. Spectrosc. Radiat. Transf. 2014, 133, 264–270. [Google Scholar] [CrossRef]
- Mishchenko, M.I.; Hovenier, J.W. Depolarization of light backscattered by randomly oriented nonspherical particles. Opt. Lett. 1995, 20, 1356–1358. [Google Scholar] [CrossRef] [PubMed]
- Kahnert, M. Optical properties of black carbon aerosols encapsulated in a shell of sulfate: Comparison of the closed cell model with a coated aggregate model. Opt. Express 2017, 25, 24579–24593. [Google Scholar] [CrossRef] [PubMed]
- Haarig, M.; Ansmann, A.; Baars, H.; Jimenez, C.; Veselovskii, I.; Engelmann, R.; Althausen, D. Depolarization and lidar ratios at 355, 532, and 1064 nm and microphysical properties of aged tropospheric and stratospheric Canadian wildfire smoke. Atmos. Chem Phys. 2018, 18, 11847–11861. [Google Scholar] [CrossRef]
- Hu, Q.; Goloub, P.; Veselovskii, I.; Bravo-Aranda, J.-A.; Popovici, I.; Podvin, T.; Haeffelin, M.; Lopatin, A.; Pietras, C.; Huang, X.; et al. A study of long-range transported smoke aerosols in the Upper Troposphere/Lower Stratosphere. Atmos. Chem. Phys. Discuss. 2018. [CrossRef]
- Sorensen, C. Light scattering by fractal aggregates: A review. Aerosol Sci. Technol. 2001, 35, 648–687. [Google Scholar] [CrossRef]
- Bescond, A.; Yon, J.; Girasole, T.; Jouen, C.; Rozé, C.; Coppalle, A. Numerical investigation of the possibility to determine the primary particle size of fractal aggregates by measuring light depolarization. J. Quant. Spectrosc. Radiat. Transf. 2013, 126, 130–139. [Google Scholar] [CrossRef]
- Mishchenko, M.I.; Liu, L.; Mackowski, D.W. T-matrix modeling of linear depolarization by morphologically complex soot and soot-containing aerosols. J. Quant. Spectrosc. Radiat. Transf. 2013, 123, 135–144. [Google Scholar] [CrossRef]
- Mishchenko, M.I.; Dlugach, J.M.; Liu, L. Linear depolarization of lidar returns by aged smoke particles. Appl. Opt. 2016, 55, 9968–9973. [Google Scholar] [CrossRef] [PubMed]
- Sun, W.; Liu, Z.; Videen, G.; Fu, Q.; Muinonen, K.; Winker, D.M.; Lukashin, C.; Jin, Z.; Lin, B.; Huang, J. For the depolarization of linearly polarized light by smoke particles. J. Quant. Spectrosc. Radiat. Transf. 2013, 122, 233–237. [Google Scholar] [CrossRef]
- Kanngießer, F.; Kahnert, M. Calculation of optical properties of light-absorbing carbon with weakly absorbing coating: A model with tunable transition from film-coating to spherical-shell coating. J. Quant. Spectrosc. Radiat. Transf. 2018, 216, 17–36. [Google Scholar] [CrossRef]
- Waquet, F.; Riedi, J.; Labonnote, L.C.; Goloub, P.; Cairns, B.; Deuzé, J.-L.; Tanré, D. Aerosol remote sending over clouds using A-train observations. J. Atmos. Sci. 2009, 66, 2468–2480. [Google Scholar] [CrossRef]
- Knobelspiesse, K.; Cairns, B.; Ottaviani, M.; Ferrare, R.; Hair, J.; Hostetler, C.; Obland, M.; Rogers, R.; Redemann, J.; Shinozuka, Y.; et al. Combined retrievals of boreal forest fire aerosol properties with a polarimeter and lidar. Atmos. Chem. Phys. 2011, 11, 7045–7067. [Google Scholar] [CrossRef] [Green Version]
- Mackowski, D.W.; Mishchenko, M.I. Calculation of the T matrix and the scattering matrix for ensembles of spheres. J. Opt. Soc. Am. A 1996, 13, 2266–2278. [Google Scholar] [CrossRef]
- Mikhailov, E.F.; Vlasenko, S.S.; Kiselev, A.A. Optics and structure of carbonaceous soot aggregates. In Optics of Nanostructured Materials; Markel, V.A., George, T.F., Eds.; Wiley: Hoboken, NJ, USA, 2001; pp. 413–466. [Google Scholar]
- Mishchenko, M.I.; Dlugach, J.M. Adhesion of mineral and soot aerosols can strongly affect their scattering and absorption properties. Opt. Lett. 2012, 37, 704–706. [Google Scholar] [CrossRef] [PubMed]
- Adachi, K.; Zaizen, Y.; Kajino, M.; Igarashi, Y. Mixing state of regionally transported soot particles and the coating effect on their size and shape at a mountain site in Japan. J. Geophys. Res. Atmos. 2014, 119, 5386–5396. [Google Scholar] [CrossRef] [Green Version]
- Adachi, K.; Buseck, P.R. Internally mixed soot, sulfates, and organic matter in aerosol particles from Mexico City. Atmos. Chem. Phys. 2008, 8, 6469–6481. [Google Scholar] [CrossRef] [Green Version]
- Toner, S.M.; Sodeman, D.A.; Prather, K.A. Single particle characterization of ultrafine and accumulation mode particles from heavy duty diesel vehicles using aerosol time-of-flight mass spectrometry. Environ. Sci. Technol. 2006, 40, 3912–3921. [Google Scholar] [CrossRef] [PubMed]
- Wu, Y.; Cheng, T.; Zheng, L.; Chen, H.; Xu, H. Single scattering properties of semi-embedded soot morphologies with intersecting and non-intersecting surfaces of absorbing spheres and non-absorbing host. J. Quant. Spectrosc. Radiat. Transf. 2015, 157, 1–13. [Google Scholar] [CrossRef]
- Chang, H.; Charalampopoulos, T.T. Determination of the wavelength dependence of refractive indices of flame soot. Proc. R. Soc. Lond. A 1990, 430, 577–591. [Google Scholar] [CrossRef]
- Hess, M.; Koepke, P.; Schult, I. Optical properties of aerosols and clouds: The software package OPAC. Bull. Am. Meteorol. Soc. 1998, 79, 831–844. [Google Scholar] [CrossRef]
- Sumlin, B.J.; Heinson, Y.W.; Shetty, N.; Pandey, A.; Pattison, R.S.; Baker, S.; Hao, W.M.; Chakrabarty, R.K. UV–Vis–IR spectral complex refractive indices and optical properties of brown carbon aerosol from biomass burning. J. Quant. Spectrosc. Radiat. Transf. 2018, 206, 392–398. [Google Scholar] [CrossRef] [Green Version]
- Vester, B.P.; Ebert, M.; Barnert, E.B.; Schneider, J.; Kandler, K.; Schütz, L.; Weinbruch, S. Composition and mixing state of the urban background aerosol in the RheinMain area (Germany). Atmos. Environ. 2007, 41, 6102–6115. [Google Scholar] [CrossRef]
- Mackowski, D.W. Electrostatic analysis of radiative absorption by sphere clusters in the Rayleigh limit: Application to soot particles. Appl. Opt. 1995, 34, 3535–3545. [Google Scholar] [CrossRef] [PubMed]
- Mackowski, D.W. A simplified model to predict the effects of aggregation on the absorption properties of soot particles. J. Quant. Spectrosc. Radiat. Transf. 2006, 100, 237–249. [Google Scholar] [CrossRef]
- Yurkin, M.A.; Hoekstra, A.G. The discrete dipole approximation: An overview and recent developments. J. Quant. Spectrosc. Radiat. Transf. 2007, 106, 558–589. [Google Scholar] [CrossRef] [Green Version]
- Yurkin, M.A.; Hoekstra, A.G. The discrete-dipole-approximation code ADDA: Capabilities and known limitations. J. Quant. Spectrosc. Radiat. Transf. 2011, 112, 2234–2247. [Google Scholar] [CrossRef]
- Yang, P.; Liou, K.N. Finite difference time domain method for light scattering by nonspherical and inhomogeneous particles. In Light Scattering by Nonspherical Particles: Theory, Measuremnts, and Applications; Mishchenko, M.I., Hovenier, J.W., Travis, L.D., Eds.; Academic Press: San Diego, CA, USA, 2000; pp. 173–221. [Google Scholar]
- Sun, W.; Videen, G.; Fu, Q.; Tanev, S.; Lin, B.; Hu, Y.; Liu, Z.; Huang, J. Finite-difference time-domain solution of light scattering by arbitrarily shaped particles and surfaces. Light Scatt. Rev. 2012, 6, 75–113. [Google Scholar]
- Liu, C.; Panetta, R.L.; Yang, P. Application of the pseudo-spectral time domain method to compute particle single-scattering properties for size parameters up to 200. J. Quant. Spectrosc. Radiat. Transf. 2012, 113, 1728–1740. [Google Scholar] [CrossRef]
- Liu, C.; Bi, L.; Panetta, R.L.; Yang, P.; Yurkin, M.A. Comparison between the pseudo-spectral time domain method and the discrete dipole approximation for light scattering simulations. Opt. Express 2012, 20, 16763–16766. [Google Scholar] [CrossRef]
- Cui, Z.W.; Han, Y.P.; Li, C.Y. Characterization of the light scattering by ensembles of randomly distributed soot aggregates. J. Quant. Spectrosc. Radiat. Transf. 2011, 112, 2722–2732. [Google Scholar] [CrossRef]
- Cui, Z.W.; Han, Y.P.; Wang, J.J.; Zhao, W.J. Scattering of Gaussian beam by arbitrarily shaped inhomogeneous particle. J. Quant. Spectrosc. Radiat. Transf. 2012, 113, 480–488. [Google Scholar] [CrossRef]
- Mishchenko, M.I.; Yurkin, M.A. On the concept of random orientation in far-field electromagnetic scattering by nonspherical particles. Opt. Lett. 2017, 42, 494–497. [Google Scholar] [CrossRef] [PubMed]
- Mishchenko, M.I. Electromagnetic Scattering by Particles and Particle Groups: An Introduction; Cambridge University Press: Cambridge, UK, 2014. [Google Scholar]
- Hansen, J.E.; Travis, L.D. Light scattering in planetary atmospheres. Space Sci. Rev. 1974, 16, 527–610. [Google Scholar] [CrossRef]
- Mishchenko, M.I.; Liu, L.; Cairns, B.; Mackowski, D.W. Optics of water cloud droplets mixed with black-carbon aerosols. Opt. Lett. 2014, 39, 2607–2610. [Google Scholar] [CrossRef] [PubMed]
- Behrendt, A.; Wagner, G.; Petrova, A.; Shiler, M.; Pal, S.; Schaberl, T.; Wulfmeyer, V. Modular lidar systems for high-resolution 4-dimensional measurements of water vapor, temperature, and aerosols. Proc. SPIE 2005, 5653, 220–227. [Google Scholar]
- Stamnes, S.; Hostetler, C.; Ferrare, R.; Burton, S.; Liu, X.; Hair, J.; Hu, Y.; Wasilewski, A.; Martin, W.; van Diedenhoven, B.; et al. Simultaneous polarimeter retrievals of microphysical aerosol and ocean color parameters from the “MAPP” algorithm with comparison to high spectral resolution lidar aerosol and ocean products. Appl. Opt. 2018, 57, 2394–2413. [Google Scholar] [CrossRef] [PubMed]
- West, R.A. Optical properties of aggregate particles whose outer diameter is comparable to the wavelength. Appl. Opt. 1991, 30, 5316–5324. [Google Scholar] [CrossRef] [PubMed]
- West, R.A.; Smith, P.H. Evidence for aggregate particles in the atmospheres of Titan and Jupiter. Icarus 1991, 90, 330–333. [Google Scholar] [CrossRef]
- Chowdhary, J.; Cairns, B.; Waquet, F.; Knobelspiesse, K.; Ottaviani, M.; Redemann, J.; Travis, L.; Mishchenko, M. Sensitivity of multiangle, multispectral polarimetric remote sensing over open oceans to water-leaving radiance: Analyses of RSP data acquired during the MILAGRO campaign. Remote Sens. Environ. 2012, 118, 284–308. [Google Scholar] [CrossRef]
- Dubovik, O.; Li, Z.; Mishchenko, M.I. The first international workshop on “Advancement of POLarimetric Observations: Calibration and improved aerosol retrievals”: APOLO-2017. J. Quant. Spectrosc. Radiat. Transf. 2018, 212, A1–A2. [Google Scholar] [CrossRef]
- Dlugach, J.M.; Ivanova, O.V.; Mishchenko, M.I.; Afanasiev, V.L. Retrieval of microphysical characteristics of particles in atmospheres of distant comets from ground-based polarimetry. J. Quant. Spectrosc. Radiat. Transf. 2018, 205, 80–90. [Google Scholar] [CrossRef]
- Mishchenko, M.I.; Cairns, B.; Kopp, G.; Schueler, C.F.; Fafaul, B.A.; Hansen, J.E.; Hooker, R.J.; Itchkawich, T.; Maring, H.B.; Travis, L.D. Accurate monitoring of terrestrial aerosols and total solar irradiance: Introducing the Glory mission. Bull. Am. Meteorol. Soc. 2007, 88, 677–691. [Google Scholar] [CrossRef]
- Reagan, J.A.; Byrne, D.M.; Herman, B.M. Bistatic LIDAR: A tool for characterizing atmospheric particulates: Part I—The remote sensing problem. IEEE Trans. Geosci. Remote Sens. 1982, 20, 229–235. [Google Scholar] [CrossRef]
- Reagan, J.A.; Byrne, D.M.; Herman, B.M. Bistatic LIDAR: A tool for characterizing atmospheric particulates: Part II—The inverse problem. IEEE Trans. Geosci. Remote Sens. 1982, 20, 236–243. [Google Scholar] [CrossRef]
- Mishchenko, M.I.; Alexandrov, M.D.; Cairns, B.; Travis, L.D. Multistatic aerosol-cloud lidar in space: A theoretical perspective. J. Quant. Spectrosc. Radiat. Transf. 2016, 184, 180–192. [Google Scholar] [CrossRef]
- Alexandrov, M.; Mishchenko, M.I. Information content of bistatic lidar observations of aerosols from space. Opt. Express 2017, 25, A134. [Google Scholar] [CrossRef] [PubMed]
Figure 1.
Model morphologies of soot and soot-containing particles considered in this study.

Figure 2.
The absorption cross section at λ = 532 nm (left-hand panels) and the absorption Ångström exponent (AAE) computed for the {532 nm, 1064 nm} pair of wavelengths (right-hand panels) as functions of different microphysical parameters for monodisperse Model 6, 7, 9, and 10 particles.
Figure 2.
The absorption cross section at λ = 532 nm (left-hand panels) and the absorption Ångström exponent (AAE) computed for the {532 nm, 1064 nm} pair of wavelengths (right-hand panels) as functions of different microphysical parameters for monodisperse Model 6, 7, 9, and 10 particles.

Figure 3.
As in Figure 2, but for the linear depolarization ratio (LDR) at λ = 355 nm (left-hand column) and 532 nm (right-hand column).
Figure 3.
As in Figure 2, but for the linear depolarization ratio (LDR) at λ = 355 nm (left-hand column) and 532 nm (right-hand column).

Figure 4.
Linear depolarization ratio (LDR) at λ = 355 nm (left-hand panels) and absorption Ångström exponent (AAE) computed for the {532 nm, 1064 nm} pair of wavelengths (right-hand panels) as functions of soot monomer radius.
Figure 4.
Linear depolarization ratio (LDR) at λ = 355 nm (left-hand panels) and absorption Ångström exponent (AAE) computed for the {532 nm, 1064 nm} pair of wavelengths (right-hand panels) as functions of soot monomer radius.

Figure 5.
Polydisperse absorption cross sections (in µm2) for Model 1 to 10 aerosols. The number of soot spherules is NS = 125 (left-hand panels) and 422 (right-hand panels).
Figure 5.
Polydisperse absorption cross sections (in µm2) for Model 1 to 10 aerosols. The number of soot spherules is NS = 125 (left-hand panels) and 422 (right-hand panels).

Figure 6.
As in Figure 5, but for the absorption Ångström exponent (AAE). The number of soot spherules is NS = 125 (left-hand panels) and 422 (right-hand panels).
Figure 6.
As in Figure 5, but for the absorption Ångström exponent (AAE). The number of soot spherules is NS = 125 (left-hand panels) and 422 (right-hand panels).

Figure 7.
Linear depolarization ratios at the three HSRL-2 wavelengths for different morphological models. The solid and dotted lines depict the results for soot volume fractions f = 7% and 15%, respectively. The number of soot spherules is NS = 125 (left-hand panels) and 422 (right-hand panels).
Figure 7.
Linear depolarization ratios at the three HSRL-2 wavelengths for different morphological models. The solid and dotted lines depict the results for soot volume fractions f = 7% and 15%, respectively. The number of soot spherules is NS = 125 (left-hand panels) and 422 (right-hand panels).

Figure 8.
Phase function (left-hand panels) and linear polarization (right-hand panels) at λ = 532 nm for different polydisperse carbonaceous aerosols. The solid and dotted curves depict the results for soot volume fractions f = 7% and 15%, respectively.
Figure 8.
Phase function (left-hand panels) and linear polarization (right-hand panels) at λ = 532 nm for different polydisperse carbonaceous aerosols. The solid and dotted curves depict the results for soot volume fractions f = 7% and 15%, respectively.

Figure 9.
Phase function at = 180° (upper panels) and linear polarization at = 90° (bottom panels) computed at the wavelength λ = 532 nm for all 11 morphological models. In the case of Models 4–11, the blue and red curves represent the results calculated for the soot volume fractions f = 7% and 15%, respectively. The number of soot spherules is NS = 125 (left-hand panels) and 422 (right-hand panels).

Figure 10.
As in Figure 8, except that now the solid and dotted curves represent the results calculated for soot-containing aerosols with brown-carbon (BrC) and sulfate (Sul) host/coating, respectively.
Figure 10.
As in Figure 8, except that now the solid and dotted curves represent the results calculated for soot-containing aerosols with brown-carbon (BrC) and sulfate (Sul) host/coating, respectively.

Figure 11.
LDR differences at λ = 532 nm between soot-containing aerosols hosted/coated by sulfate (blue lines) and brown-carbon (red lines) materials. The soot volume fraction is fixed at f = 7%. The number of soot spherules is NS = 125 (left-hand panel) and 422 (right-hand panel).
Figure 11.
LDR differences at λ = 532 nm between soot-containing aerosols hosted/coated by sulfate (blue lines) and brown-carbon (red lines) materials. The soot volume fraction is fixed at f = 7%. The number of soot spherules is NS = 125 (left-hand panel) and 422 (right-hand panel).
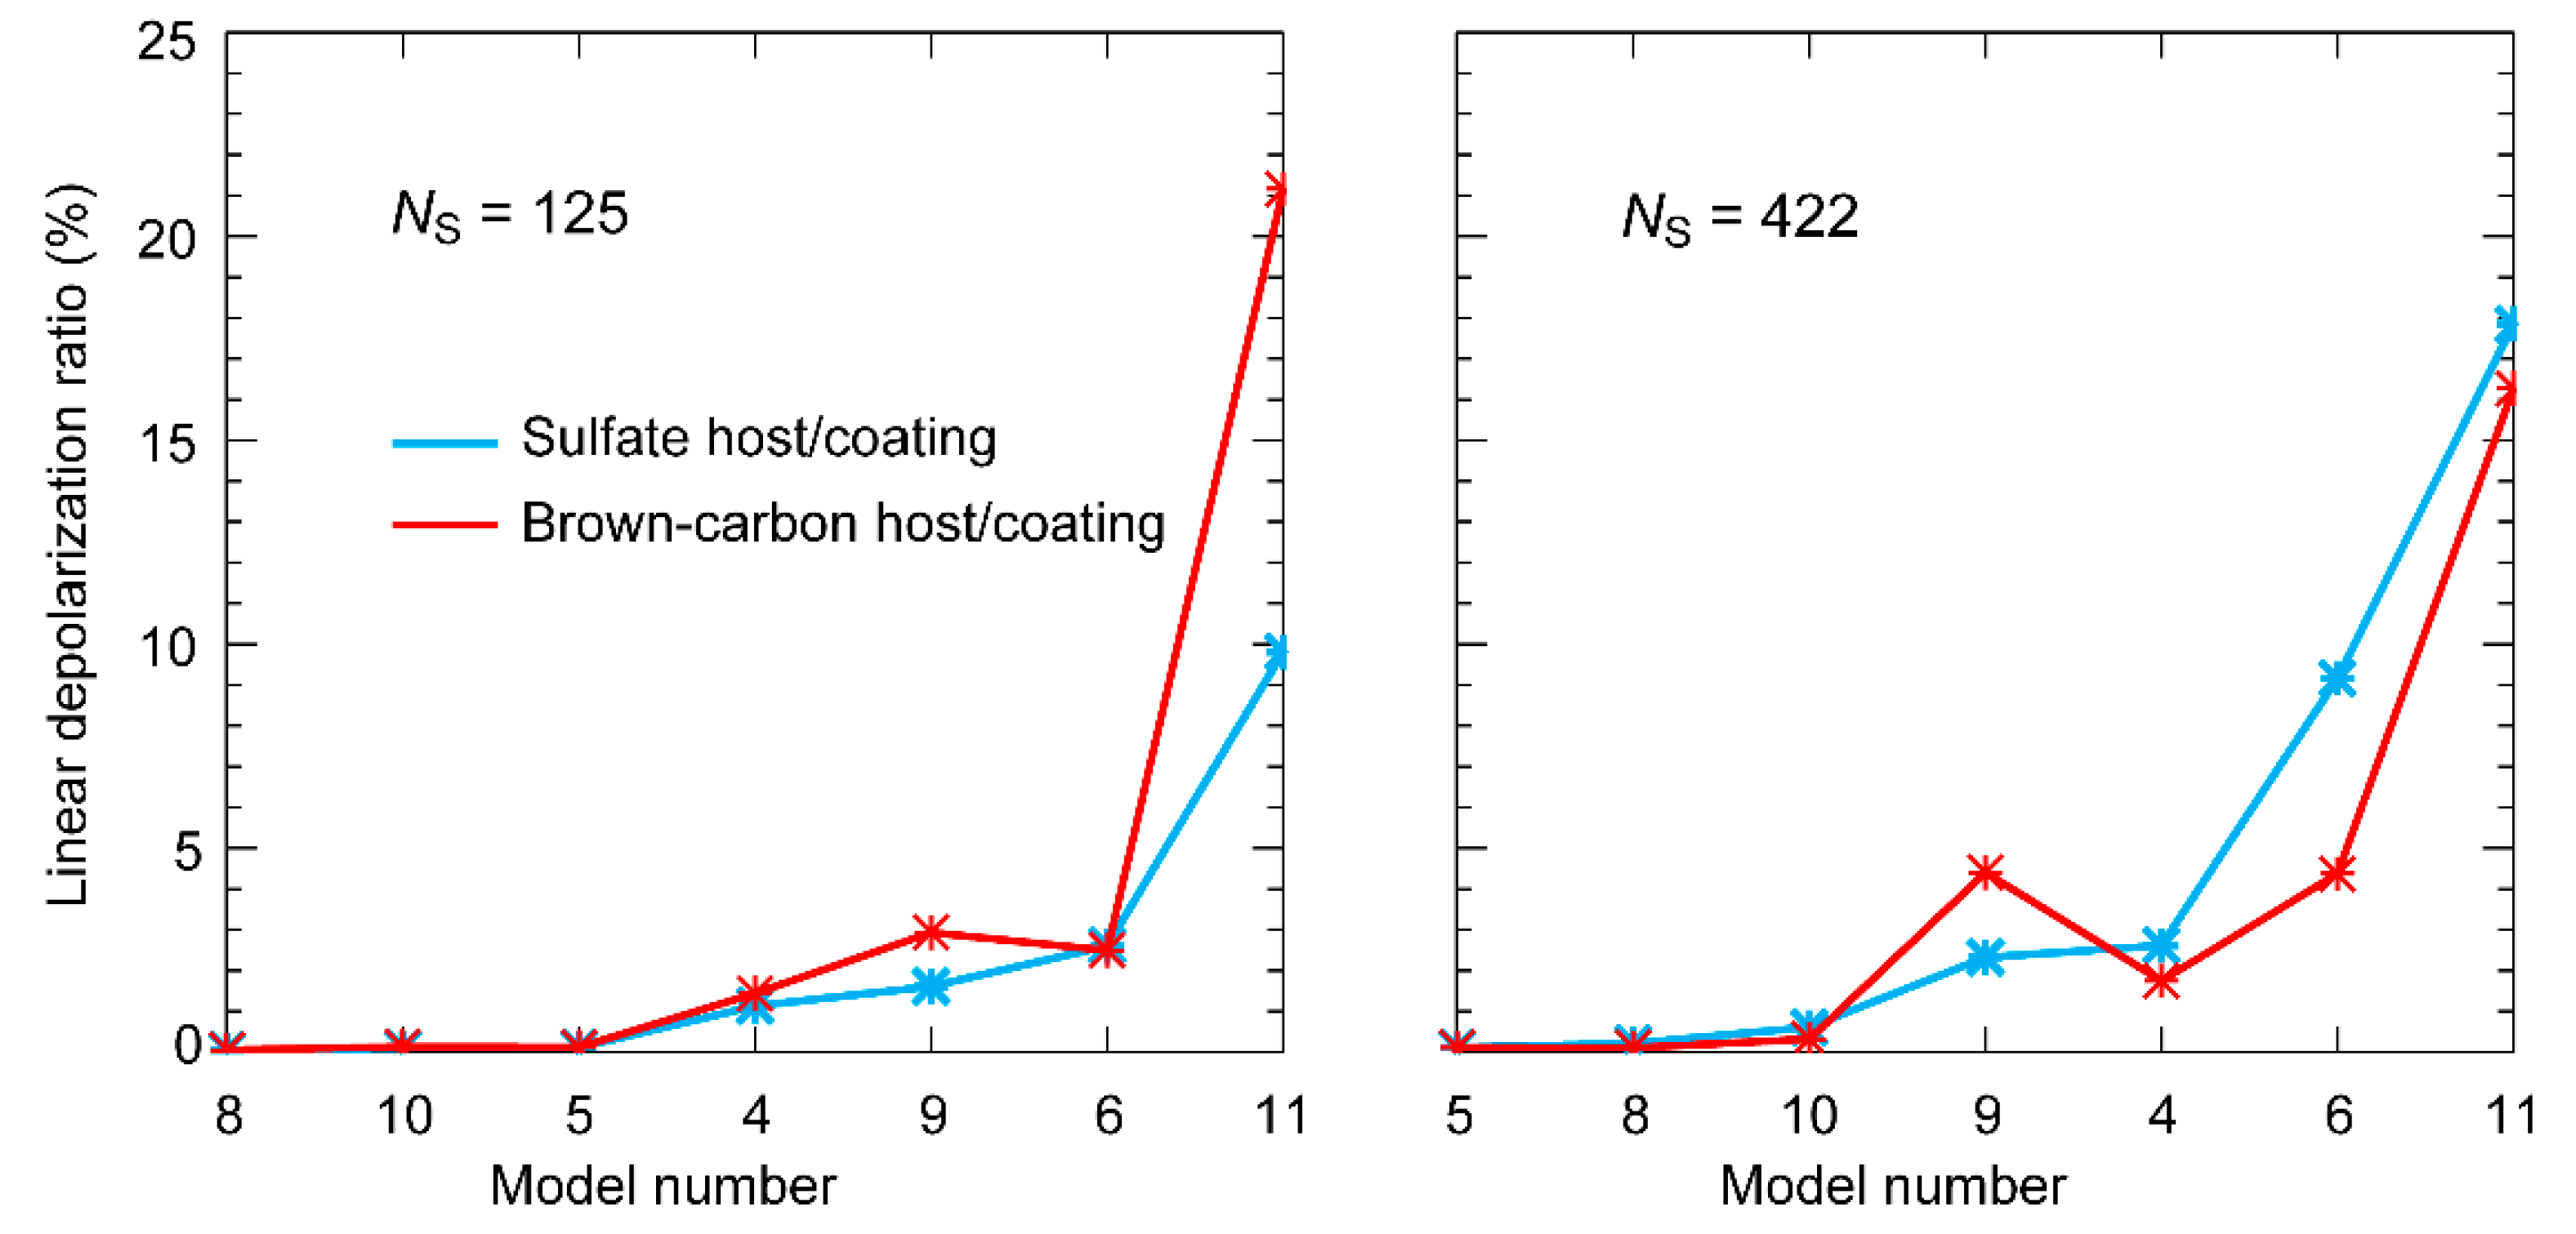

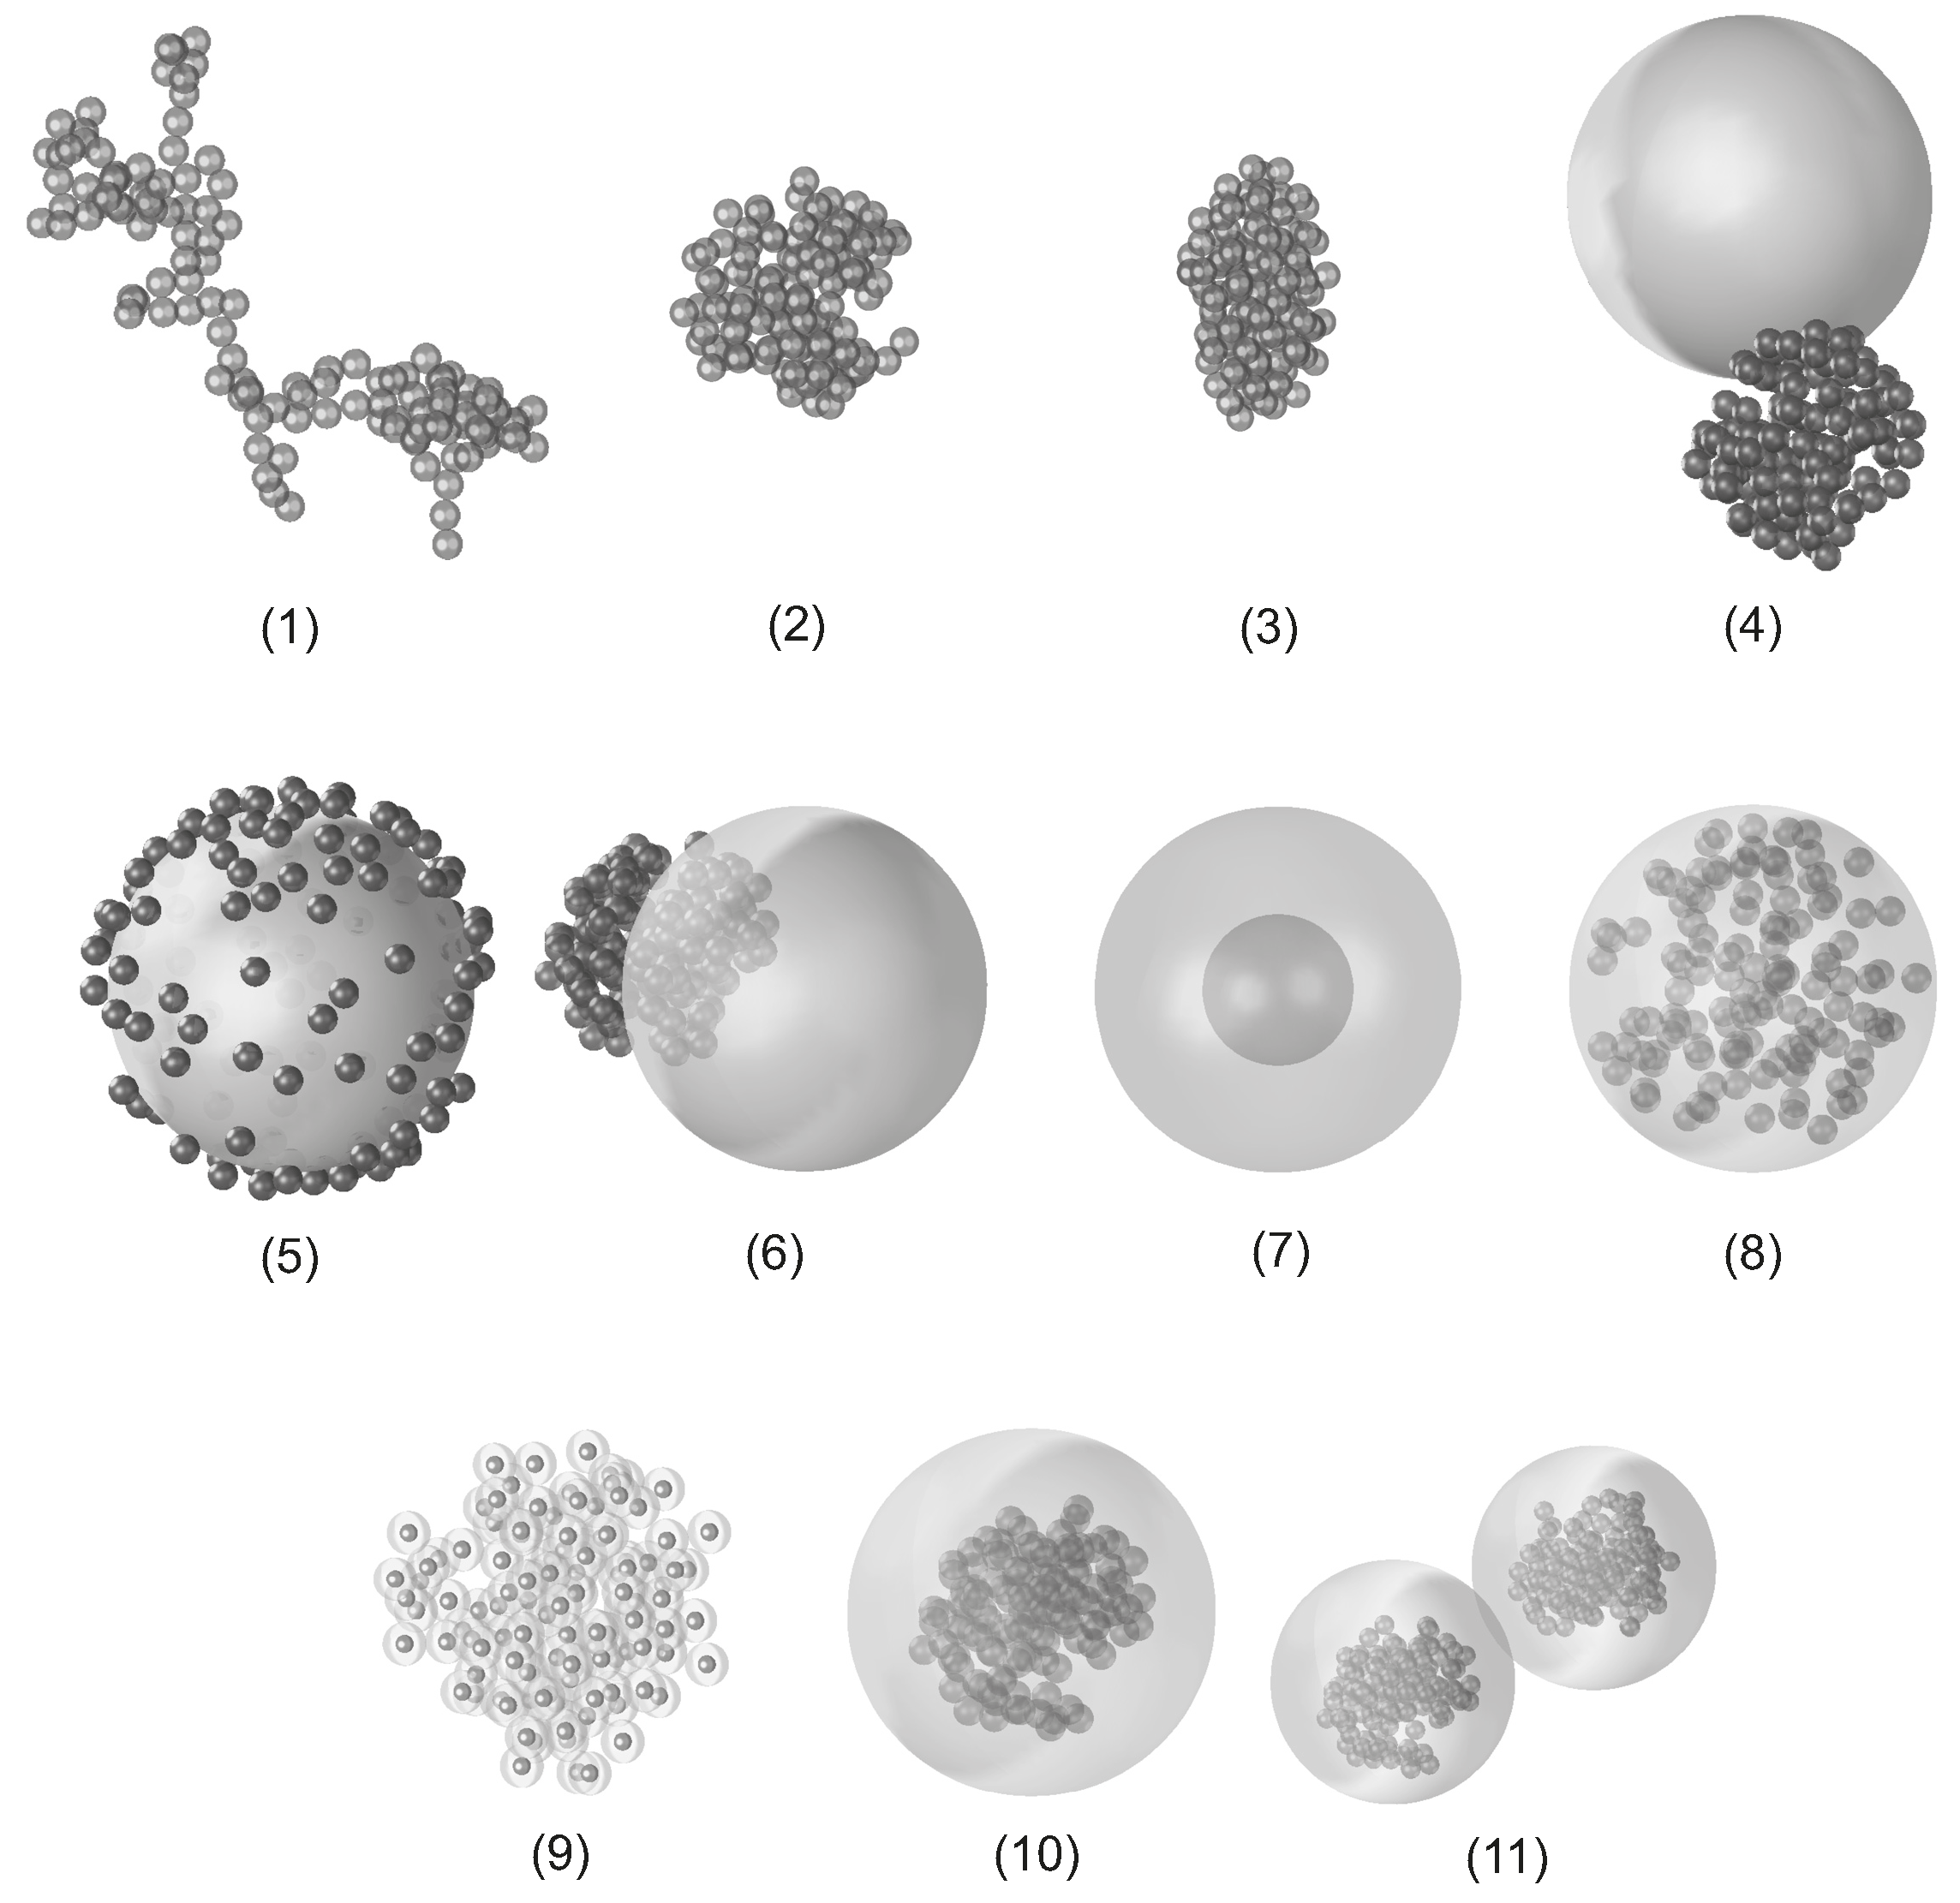
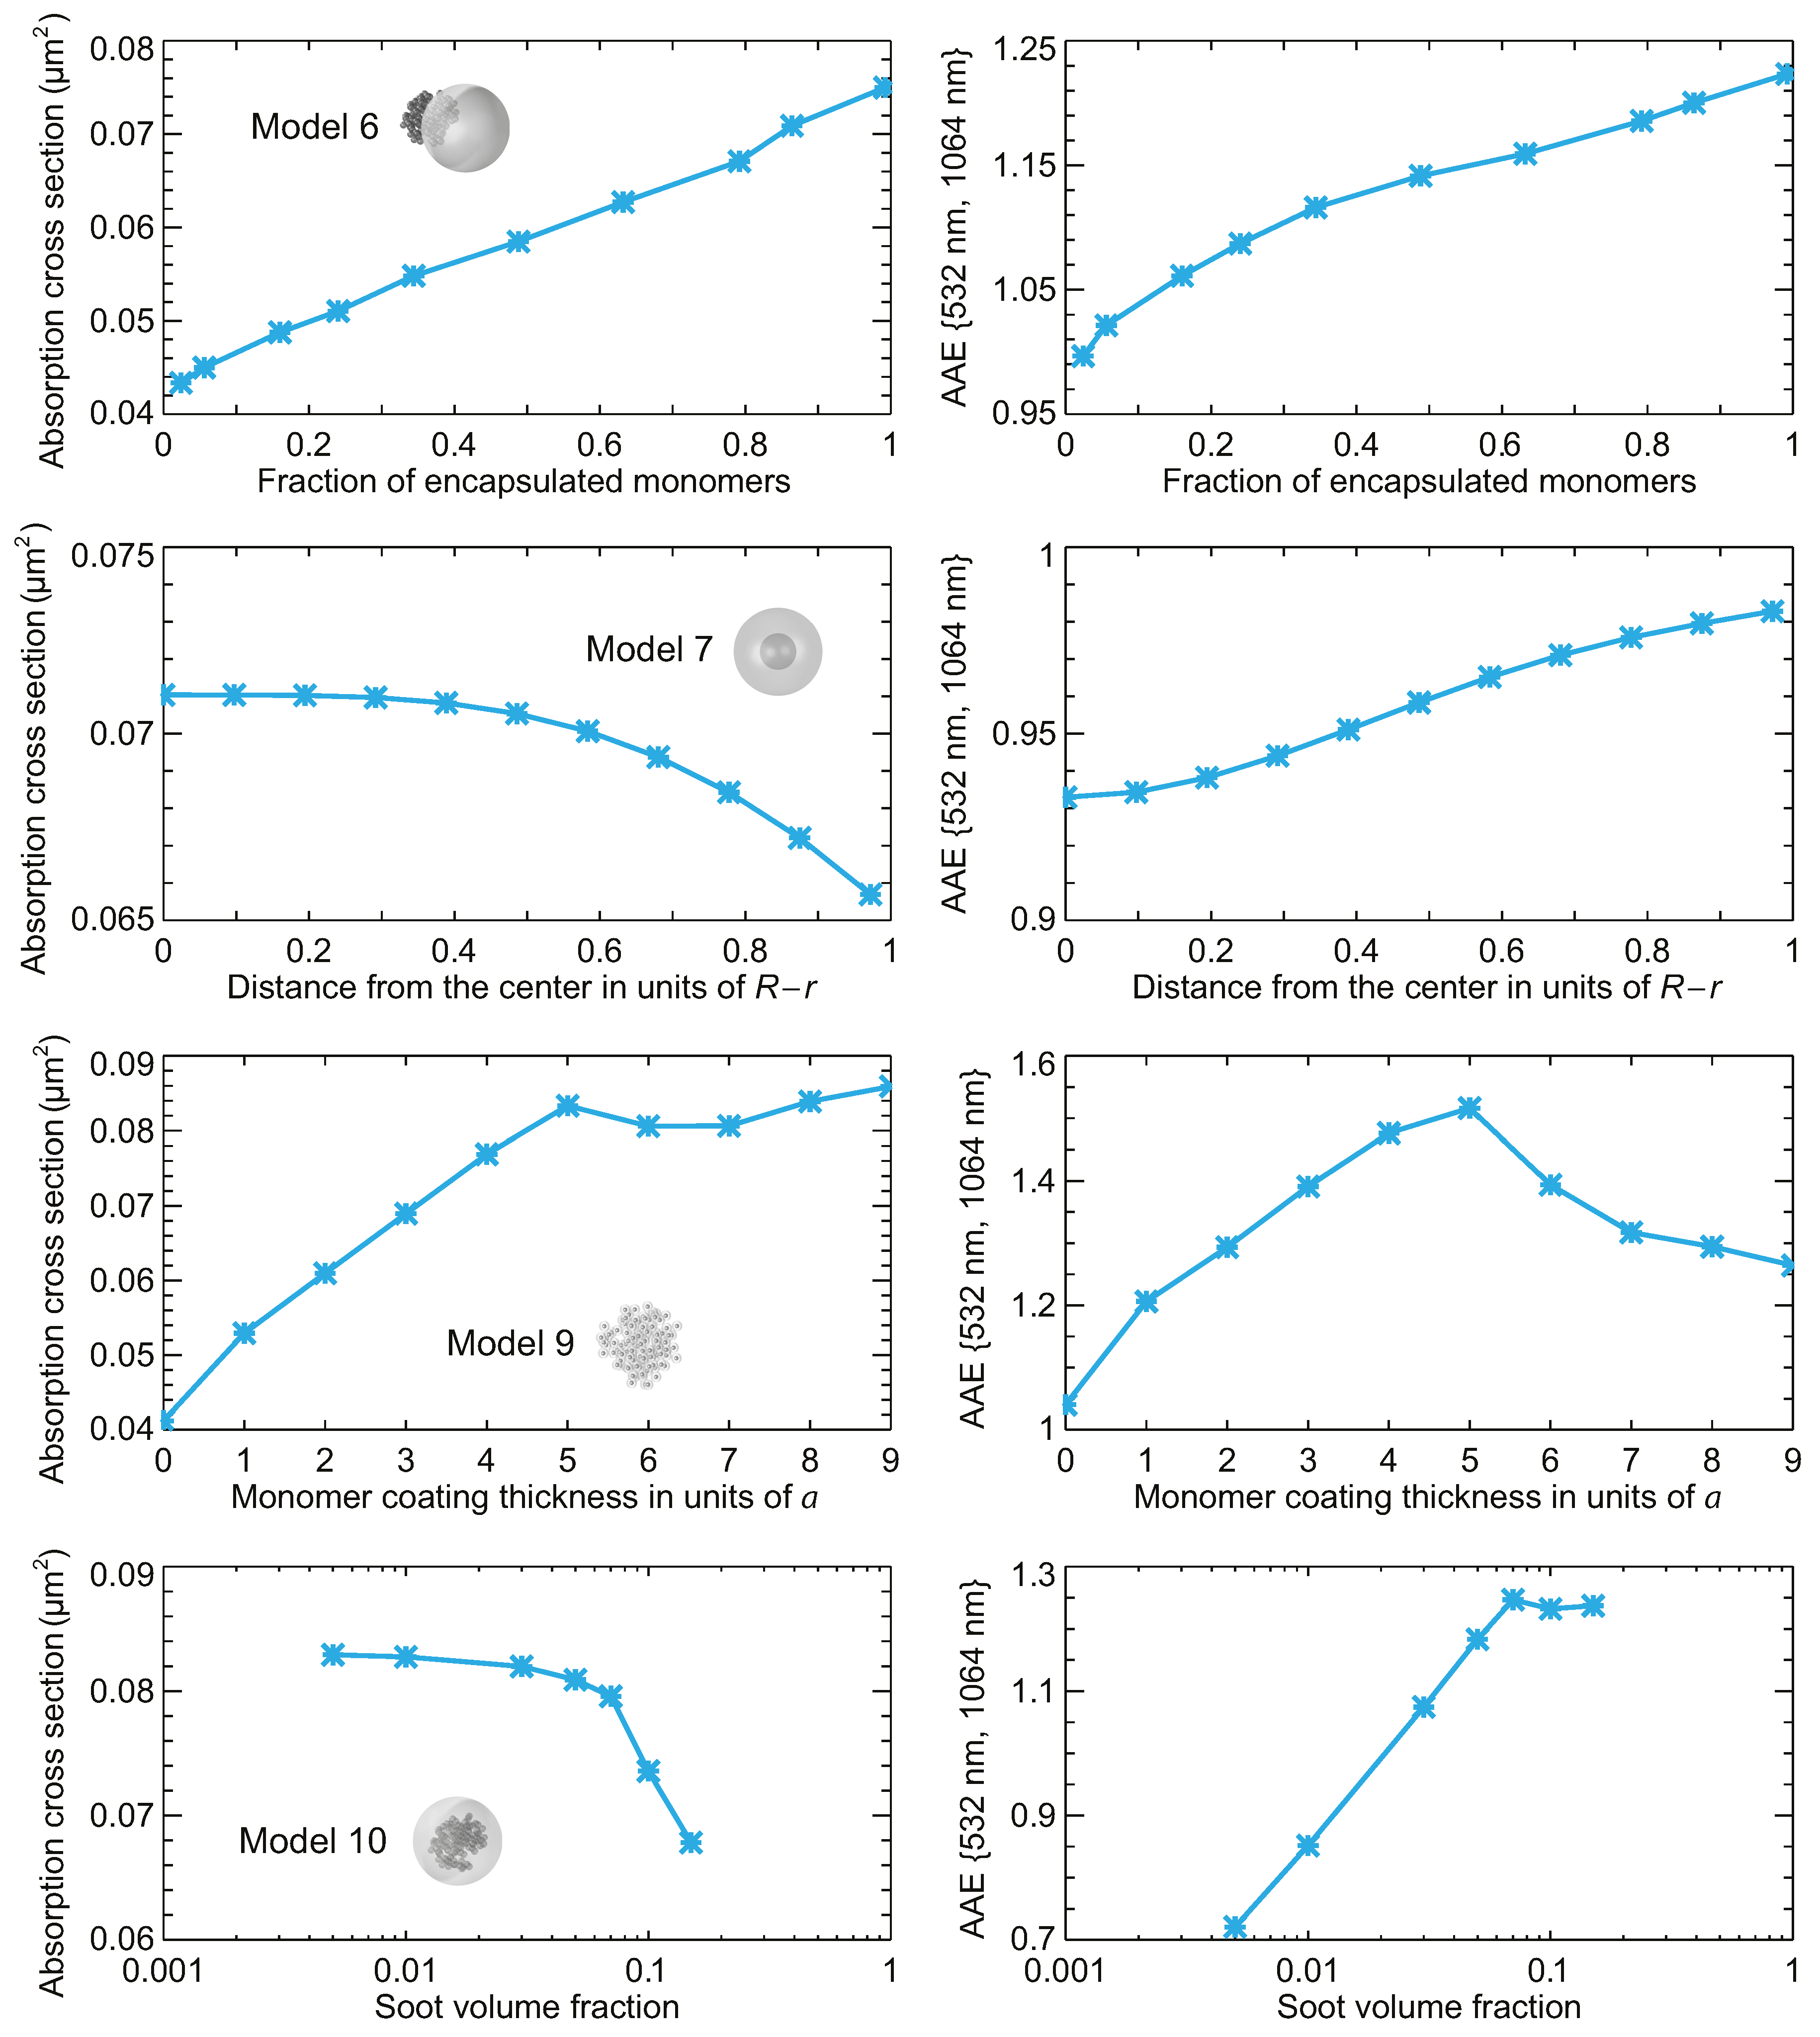
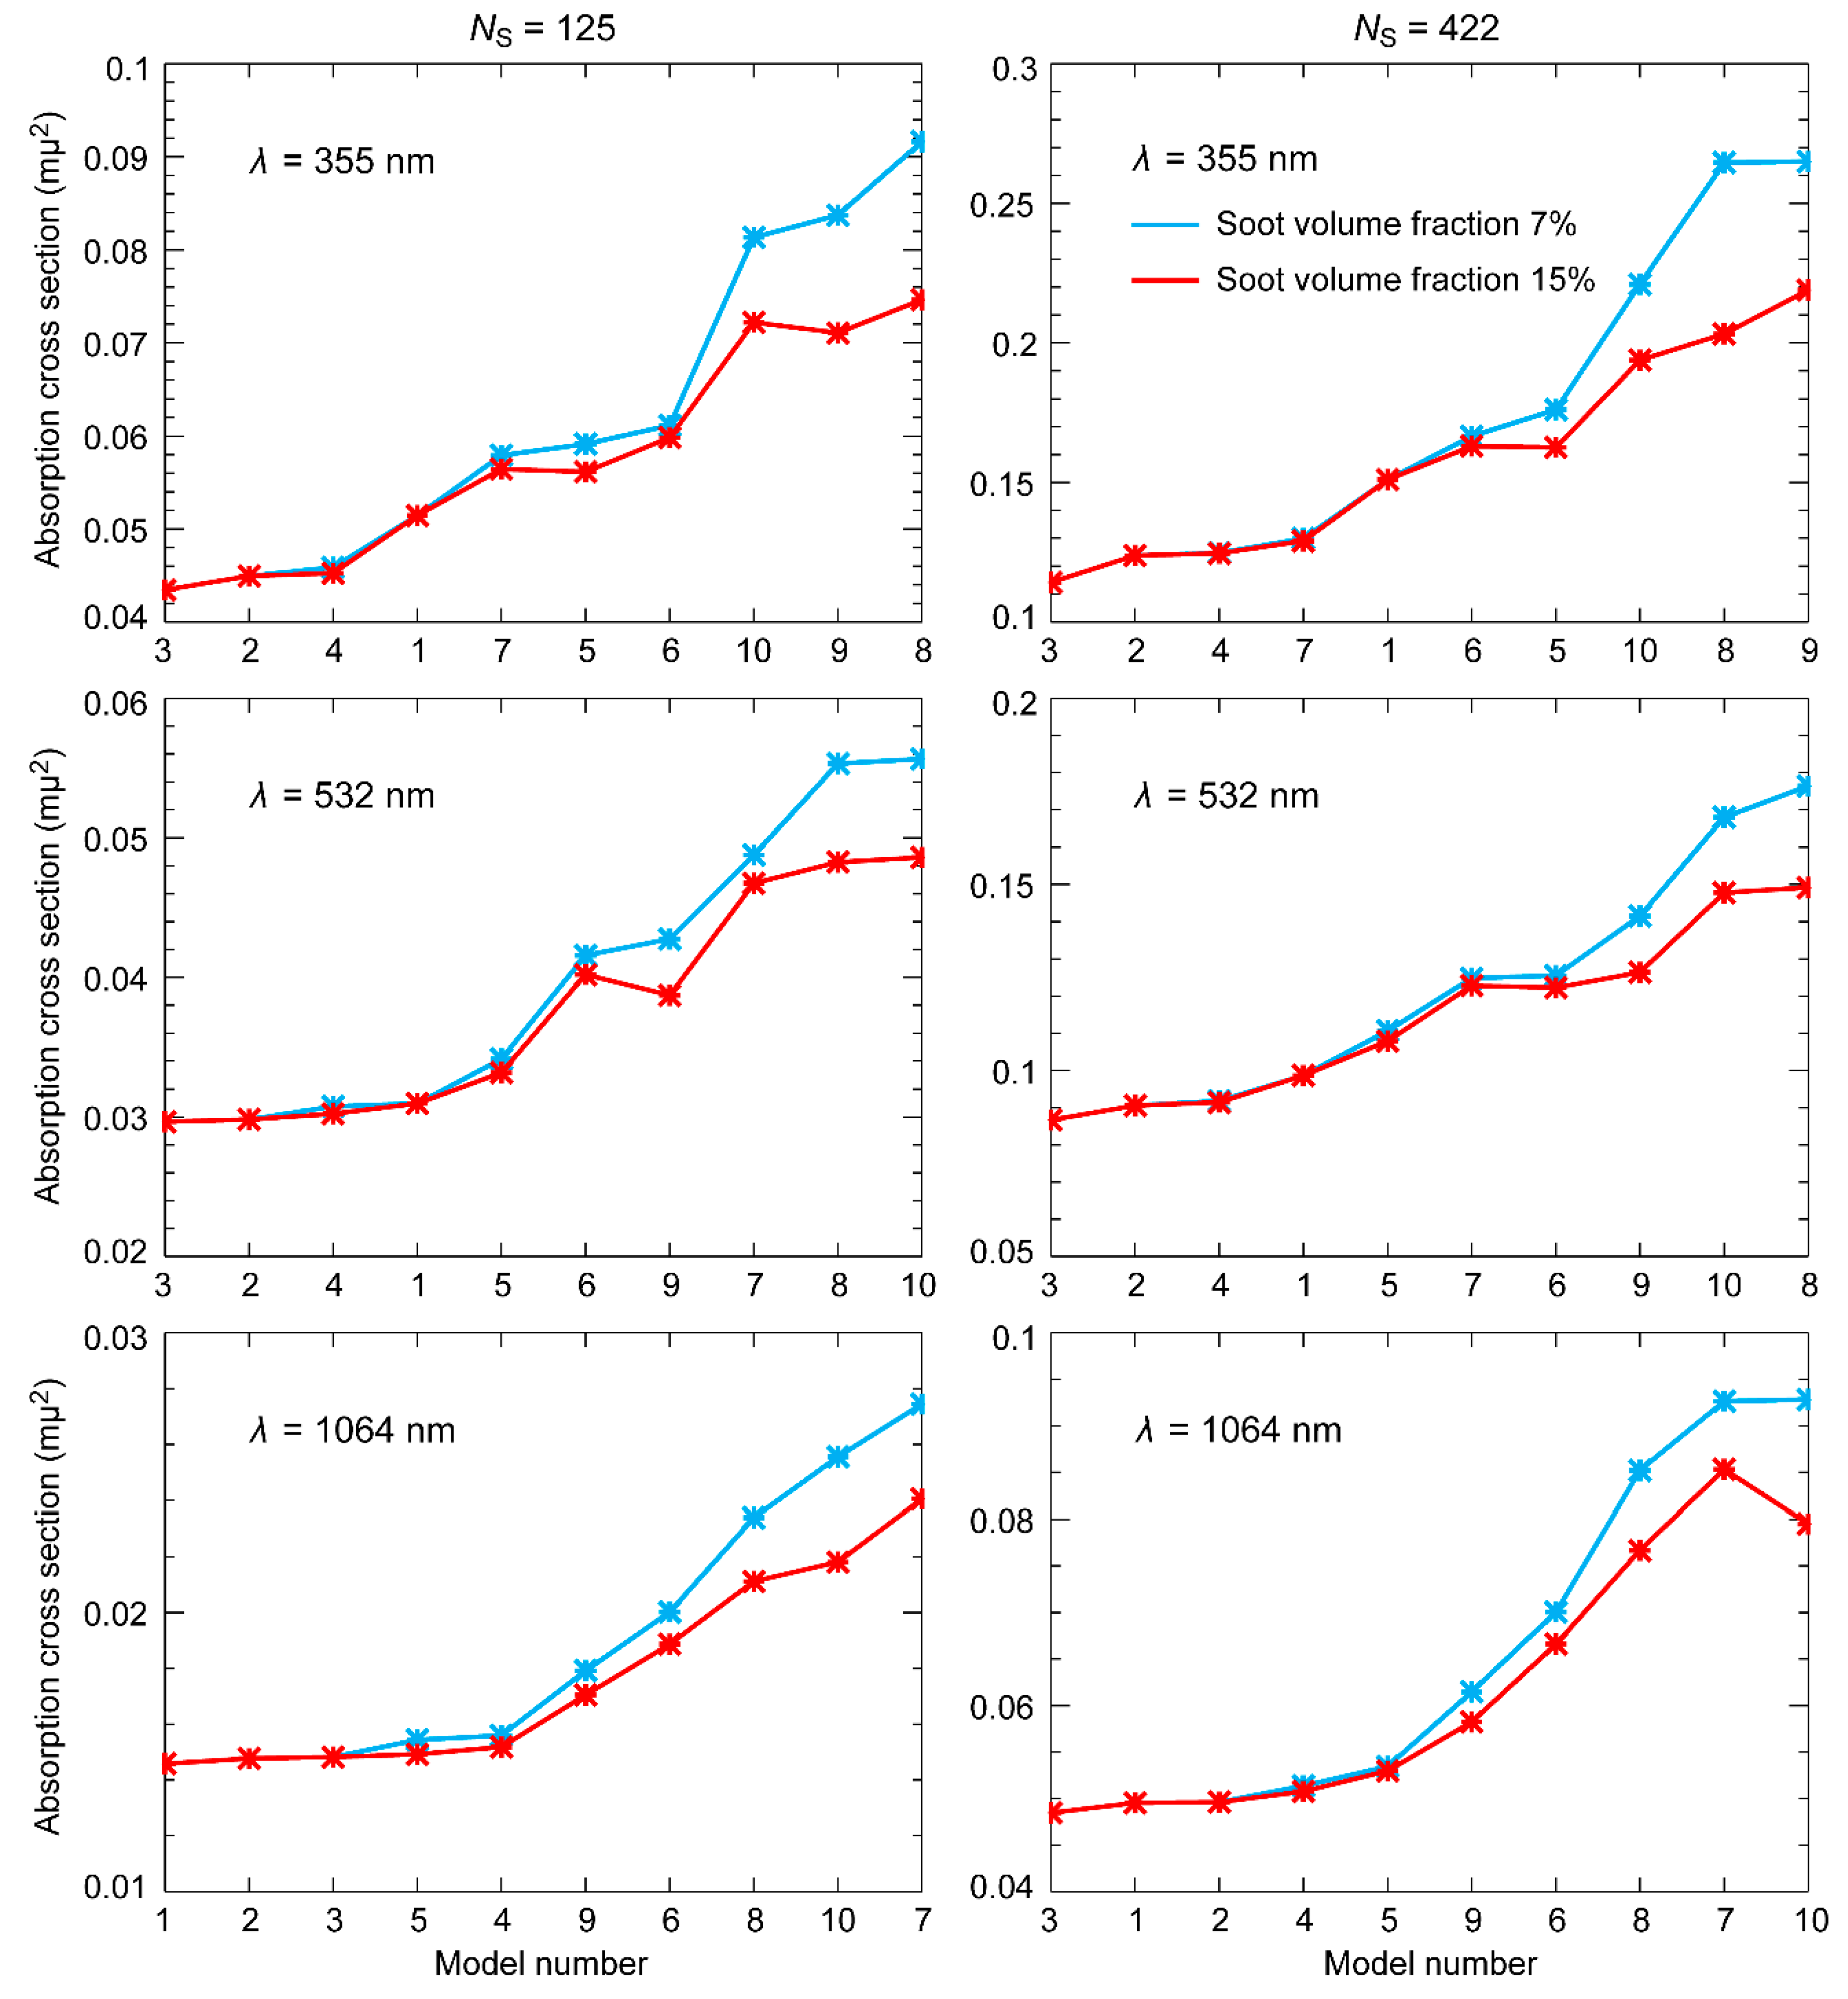
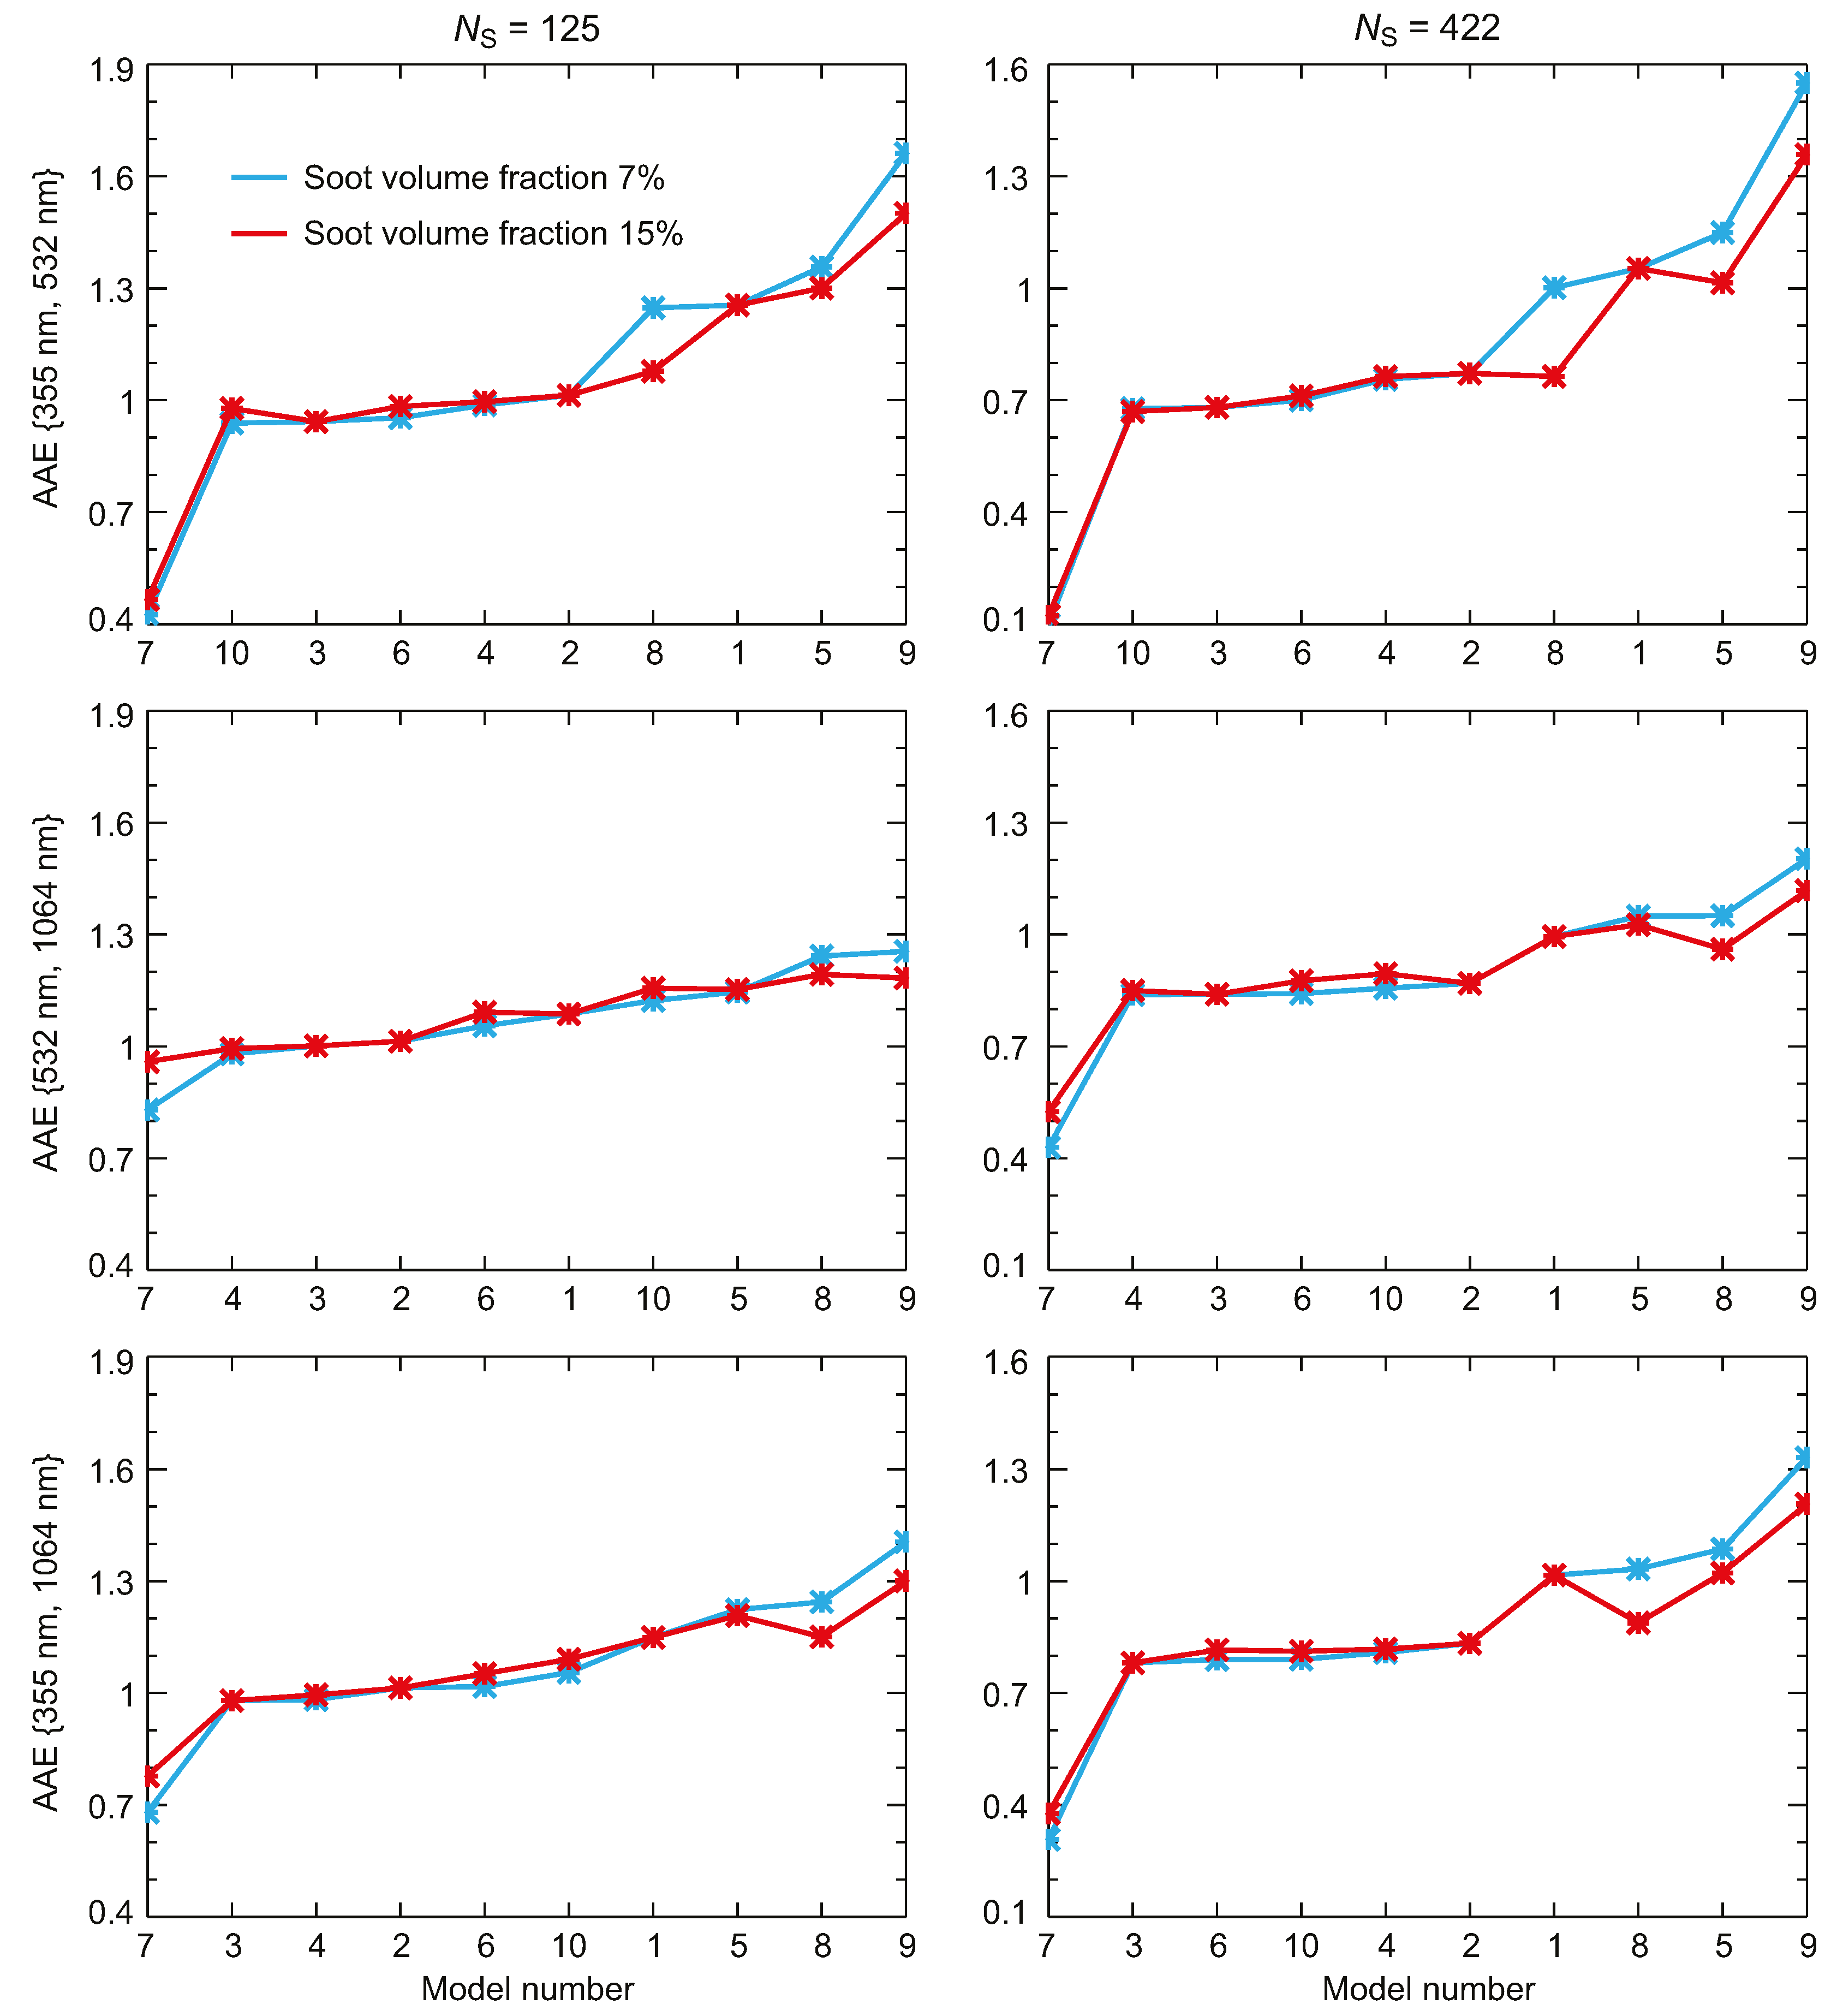
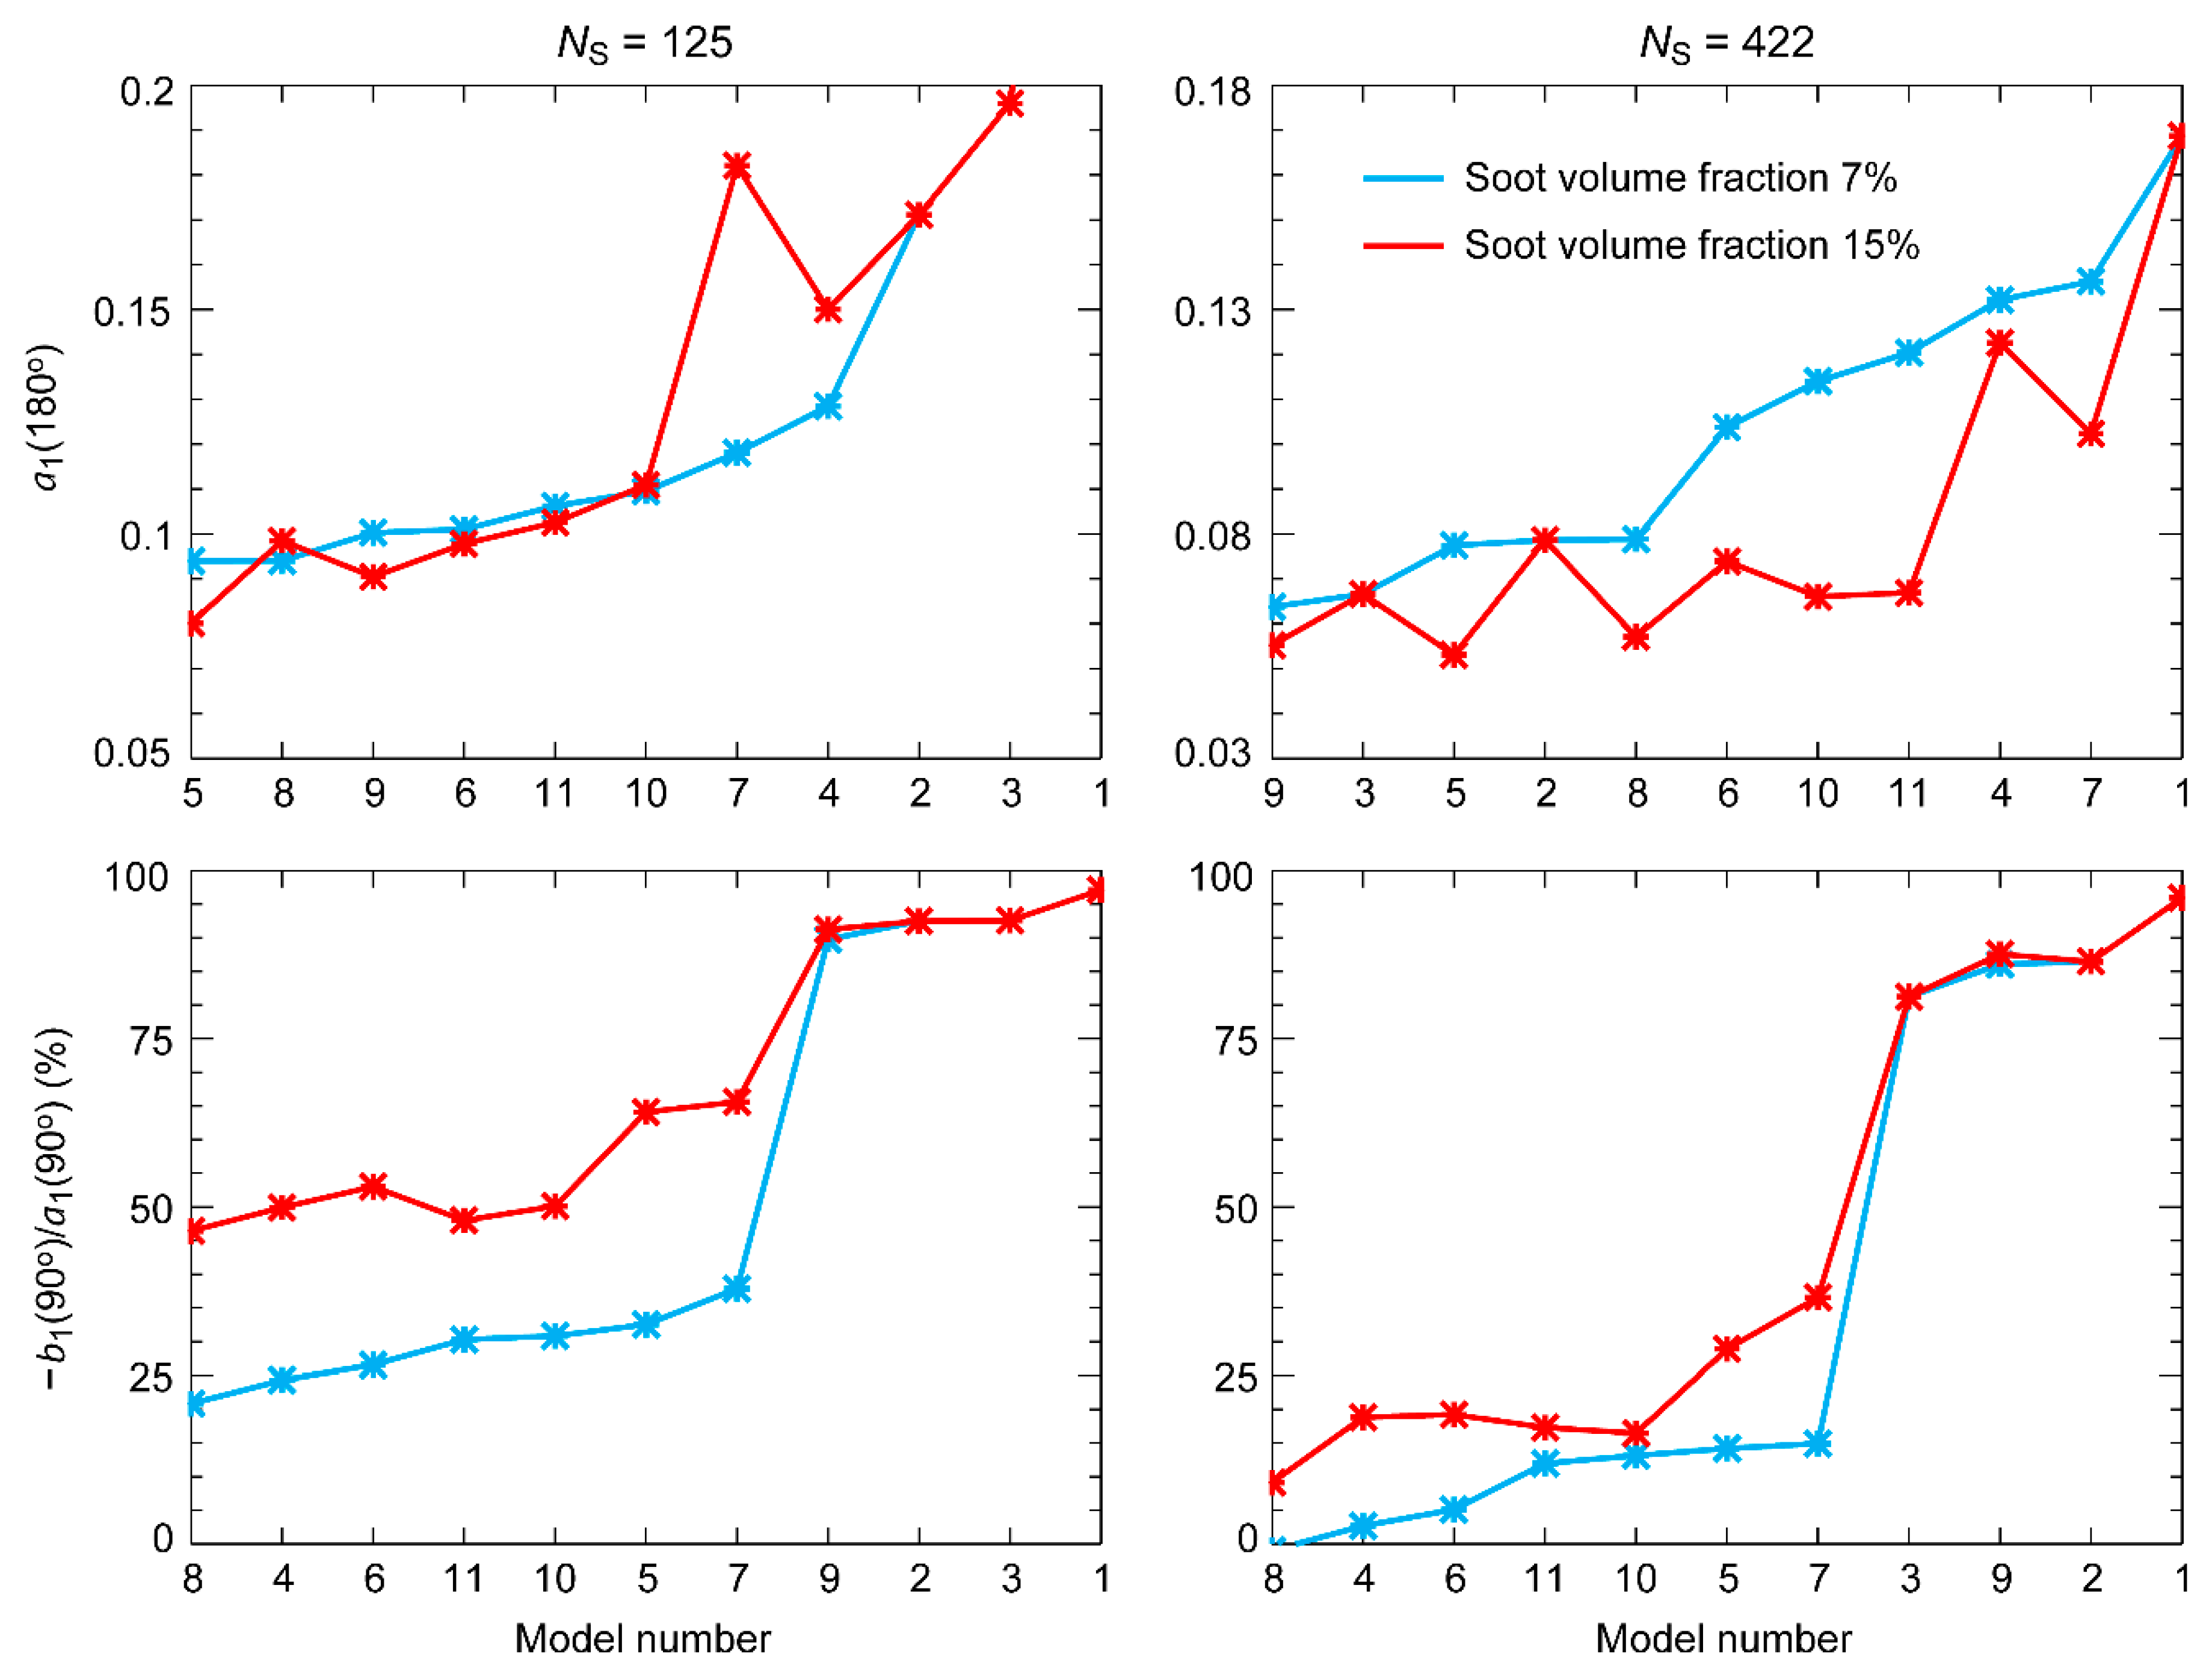
Table 1.
Spectral refractive indices used in this study.
| Wavelength (nm) | Soot | Sulfates | Brown Carbon |
|---|---|---|---|
| 355 | 1.66284 + 0.715235i | 1.3813 | |
| 532 | 1.73156 + 0.600028i | 1.3684 | 1.5316 + 0.0015i |
| 1064 | 1.81895 + 0.590511i | 1.3595 |
© 2018 by the authors. Licensee MDPI, Basel, Switzerland. This article is an open access article distributed under the terms and conditions of the Creative Commons Attribution (CC BY) license (http://creativecommons.org/licenses/by/4.0/).
Share and Cite
MDPI and ACS Style
Liu, L.; Mishchenko, M.I. Scattering and Radiative Properties of Morphologically Complex Carbonaceous Aerosols: A Systematic Modeling Study. Remote Sens. 2018, 10, 1634. https://doi.org/10.3390/rs10101634
AMA Style
Liu L, Mishchenko MI. Scattering and Radiative Properties of Morphologically Complex Carbonaceous Aerosols: A Systematic Modeling Study. Remote Sensing. 2018; 10(10):1634. https://doi.org/10.3390/rs10101634
Chicago/Turabian StyleLiu, Li, and Michael I. Mishchenko. 2018. "Scattering and Radiative Properties of Morphologically Complex Carbonaceous Aerosols: A Systematic Modeling Study" Remote Sensing 10, no. 10: 1634. https://doi.org/10.3390/rs10101634
Note that from the first issue of 2016, this journal uses article numbers instead of page numbers. See further details here.