1. Introduction
Here we demonstrate the instantaneous wide-area monitoring of multiple mechanized ocean vessels over 10,000 km
region present in two days of Passive Ocean Acoustic Waveguide Remote Sensing (POAWRS) during Spring 2014 in the Norwegian Sea. A large-aperture densely-sampled coherent hydrophone array system with 160-elements was deployed to record the underwater sound radiated from a large variety of oceanic sound sources [
1,
2]. The hydrophone array provides directional sensing in a 360-degree horizontal azimuth via coherent beamforming of the recorded underwater acoustic data. The POAWRS technique [
2,
3,
4,
5,
6,
7] is employed here to provide detection, localization and classification of mechanized ocean vessels from their underwater sounds received on the coherent hydrophone array. Between 10 to 25 distinct mechanized ocean vessels could be detected and tracked in roughly 8 h of POAWRS observation per day. The underwater sounds radiated from the mechanized ocean vessels were detected with significantly high Signal-to-Noise Ratios (SNR) after coherent beamforming of the acoustic data received on the hydrophone array, leading to detection ranges that are up to two orders of magnitude more distant than that for a single hydrophone [
2].
Our approach for POAWRS monitoring of ocean vessels from their underwater sounds measured on a coherent hydrophone array follows that of Ref. [
2] where the method was previously developed and calibrated for three known mechanized surface ships that are powered by either diesel or diesel-electric engines. They are Research Vessel (RV) Delaware II in the Gulf of Maine, RV Johann–Hjort and Fishing Vessel (FV) Artus in the Norwegian Sea. The Global Positioning System (GPS) measured latitude-longitude locations, available at high sample rate (1 s update), for each of these surface ships were utilized to extract the underwater sounds received by the coherent hydrophone array system. The ranges of the three ships from the coherent hydrophone array varied between 4.8 km to 31 km in the observation time period analyzed in Ref. [
2]. The underwater sound received from each of the three ships was found to be dominated by multiple distinct narrowband signals in the 100 Hz to 2 kHz frequency range that are either constant frequency tonals or have frequencies that waver or oscillate slightly in time [
2]. The source level of the dominant narrowband signals radiated by each of these three ships were estimated in Ref. [
2] and applied to determine the Probability of Detection (PoD) region in the Gulf of Maine or Norwegian Sea environment where the passive acoustic data were acquired. It was found that the 50% PoD region for the passive acoustic detection of these ships can extend roughly 100 km to 200 km from the coherent hydrophone array [
2] when propagation conditions are favorable. In general, the passive acoustic detection of ocean vessels with a coherent hydrophone array is dependent on signal source level, frequency, bandwidth, array beamwidth and bearing, as well as environmental ambient noise level and propagation conditions such as bathymetry, water column and sea floor sound speed.
Here, in order to simultaneously monitor the mechanized ocean vessels in a 360-degree horizontal azimuth about the coherent hydrophone array, we first extract signals that follow well-defined bearing-time trajectories dominated by narrowband signals that are either constant frequency tonals or have frequencies that waver or oscillate slightly over time, since these signals are characteristic of mechanized ocean vessels. We then cluster these signals and associate them with distinct ocean vessels using their time-frequency characteristics and their bearing-time trajectories. Each ocean vessel is next localized from its corresponding bearing-time trajectory of signal detections employing the Moving Array Triangulation (MAT) [
8] technique. Of the 30 mechanized ocean vessels detected in roughly 8 h observation time interval per day for two days, 20 of these could be identified as named commercial ships since their bearing-time trajectories and locations correspond well with those derived from GPS records in the satellite or terrestrial based Automatic Identification System (AIS) historical database of the region for these days. The remaining 10 ocean vessels could not be identified because of sparse or absent GPS information in the historical AIS database during the operation time of our array making it challenging to associate them with detected ocean vessels in our dataset.
The remote monitoring of ocean vessels over instantaneous wide areas from their sounds radiated underwater is essential in maritime surveillance and defence. The sound generated by ocean vessels contributes to environmental ambient noise [
9] and sets limiting ranges for detection in both passive and active sonar systems for a wide range of ocean remote sensing applications, as well as in man-made communication systems [
10,
11]. The vessel generated noise may also influence behavior of marine organisms [
9,
12,
13,
14], such as fish [
15,
16,
17,
18] and marine mammals [
19,
20,
21]. Signals generated by mechanized vessels form important components of the soundscape [
22,
23,
24] in most ocean environments.
Passive acoustic methods have been previously used to examine, characterize and quantify the sound radiated from ocean vessels. The majority of measurements in published literature is obtained using a single hydrophone [
25,
26] or a small number of widely-separated hydrophones [
27,
28,
29] located within a few hundred meters to a few kilometers from a ship. Ship-radiated sound has also been measured using a 128-element vertical hydrophone array [
30] and bottom-mounted hydrophones [
31]. In addition to SNR enhancement, an advantage of using a coherent hydrophone array, such as the one used here, is that the bearing of the sound radiated by the vessel can be estimated and tracked over time [
2]. This bearing-time trajectory of signal detections from a given vessel can be employed for estimating the horizontal position of the vessel in geographic space. In contrast, single hydrophone or sparse array measurements lead to low SNR in detections of a vessel’s underwater radiated sound, poor or no angular resolution to discriminate the direction of the sound sources, and significantly limited vessel detection ranges.
The mechanism of sound generation by ships is described in [
32,
33,
34,
35,
36,
37,
38,
39], with the main sources arising from machinery noise generated by propulsion and machinery such as engines, main motors and gears; propeller noise generated by cavitation at or near the propeller and propeller-induced resonant hull excitation; hydrodynamic noise from radiated flow noise, resonant excitation of cavities, plates, and appendages; and cavitation at struts and appendages. Ship noise has been previously found to be dominated by propeller cavitation, propeller singing due to physical excitation at the trailing edges of the blades, and propulsion or other reciprocating machinery.
Here we provide the time-frequency characteristics of the dominant narrowband signals received from each of the 30 distinct ocean vessels detected at varying ranges from roughly 5 km to over 150 km from the coherent hydrophone array (
Table 1,
Table 2,
Table 3 and
Table 4). These characteristics can be employed in future automatic classification systems for potential real-time passive acoustic identification of ocean vessels. The general analysis of ship-generated underwater sound and their characteristics can also be used to improve ship design [
2,
17,
18] to make them quieter, thereby reducing the overall ship radiated noise in the ocean.
3. Results
Here we provide detailed analysis of 14 ocean vessels detected by the coherent hydrophone array off the Lofoten archipelago of the Norwegian coast (region II in Figure 1 of Ref. [
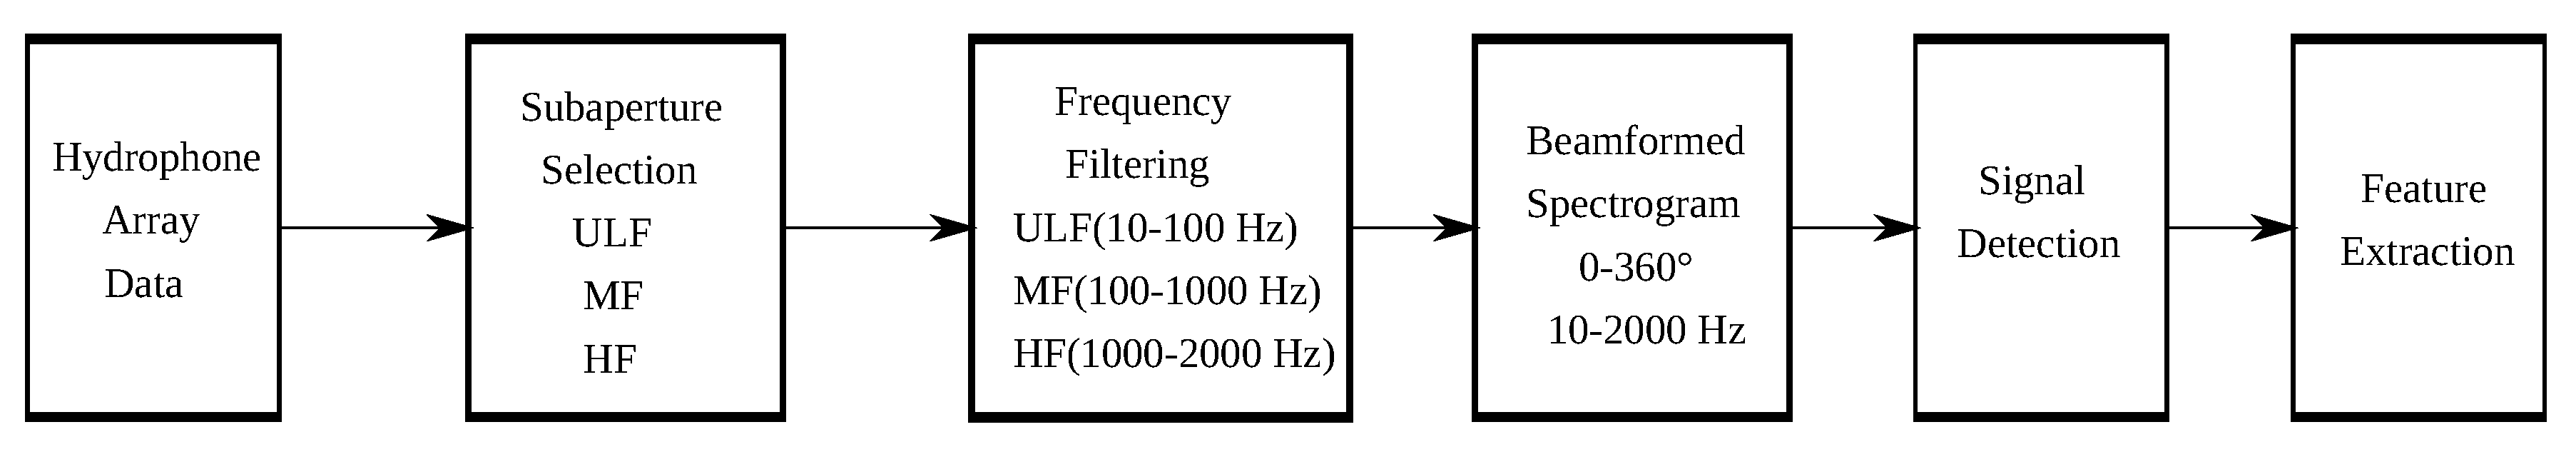
1]) on 23 February 2014. We first provide the bearing-time trajectories of the detected signals from these vessels against the backdrop of all detections for the day in three distinct frequency subbands, 10–200 Hz, 200–1000 Hz and 1000–2000 Hz, processed using the ULF, MF and HF subapertures, respectively. The mean horizontal positions of the detected vessels estimated using the MAT-MMSE technique are next provided on a geographic map. For the identified commercial ships, their true mean positions based on GPS measurements are also indicated for comparison. Detailed time-frequency properties of the recorded sounds, including spectrograms and pitch-tracks, are provided as examples for two of the 5 identified commercial ships, and two out of nine unidentified vessels. Finally, the characteristics of the dominant narrowband signals received from each of the 14 vessels are summarized in
Table 1 and
Table 2. Similar analysis is applied to acoustic data acquired by the coherent hydrophone array off the northern Finnmark region (region III in Figure 1 of Ref. [
1]) of the Norwegian coast on 26 February 2014. The bearing-time trajectories of detected signals from 15 identified commercial ships and 1 unidentified ocean vessel are provided along with a summary of the time-frequency characteristics of the prominent narrowband signals in
Table 3 and
Table 4. Time-frequency characteristics of the tow ship generated noise are provided in the
Appendix A for comparison.
3.1. Simultaneous Passive Acoustic Detection and Localization of Multiple Ocean Vessels on 23 February off Lofoten Archipelago
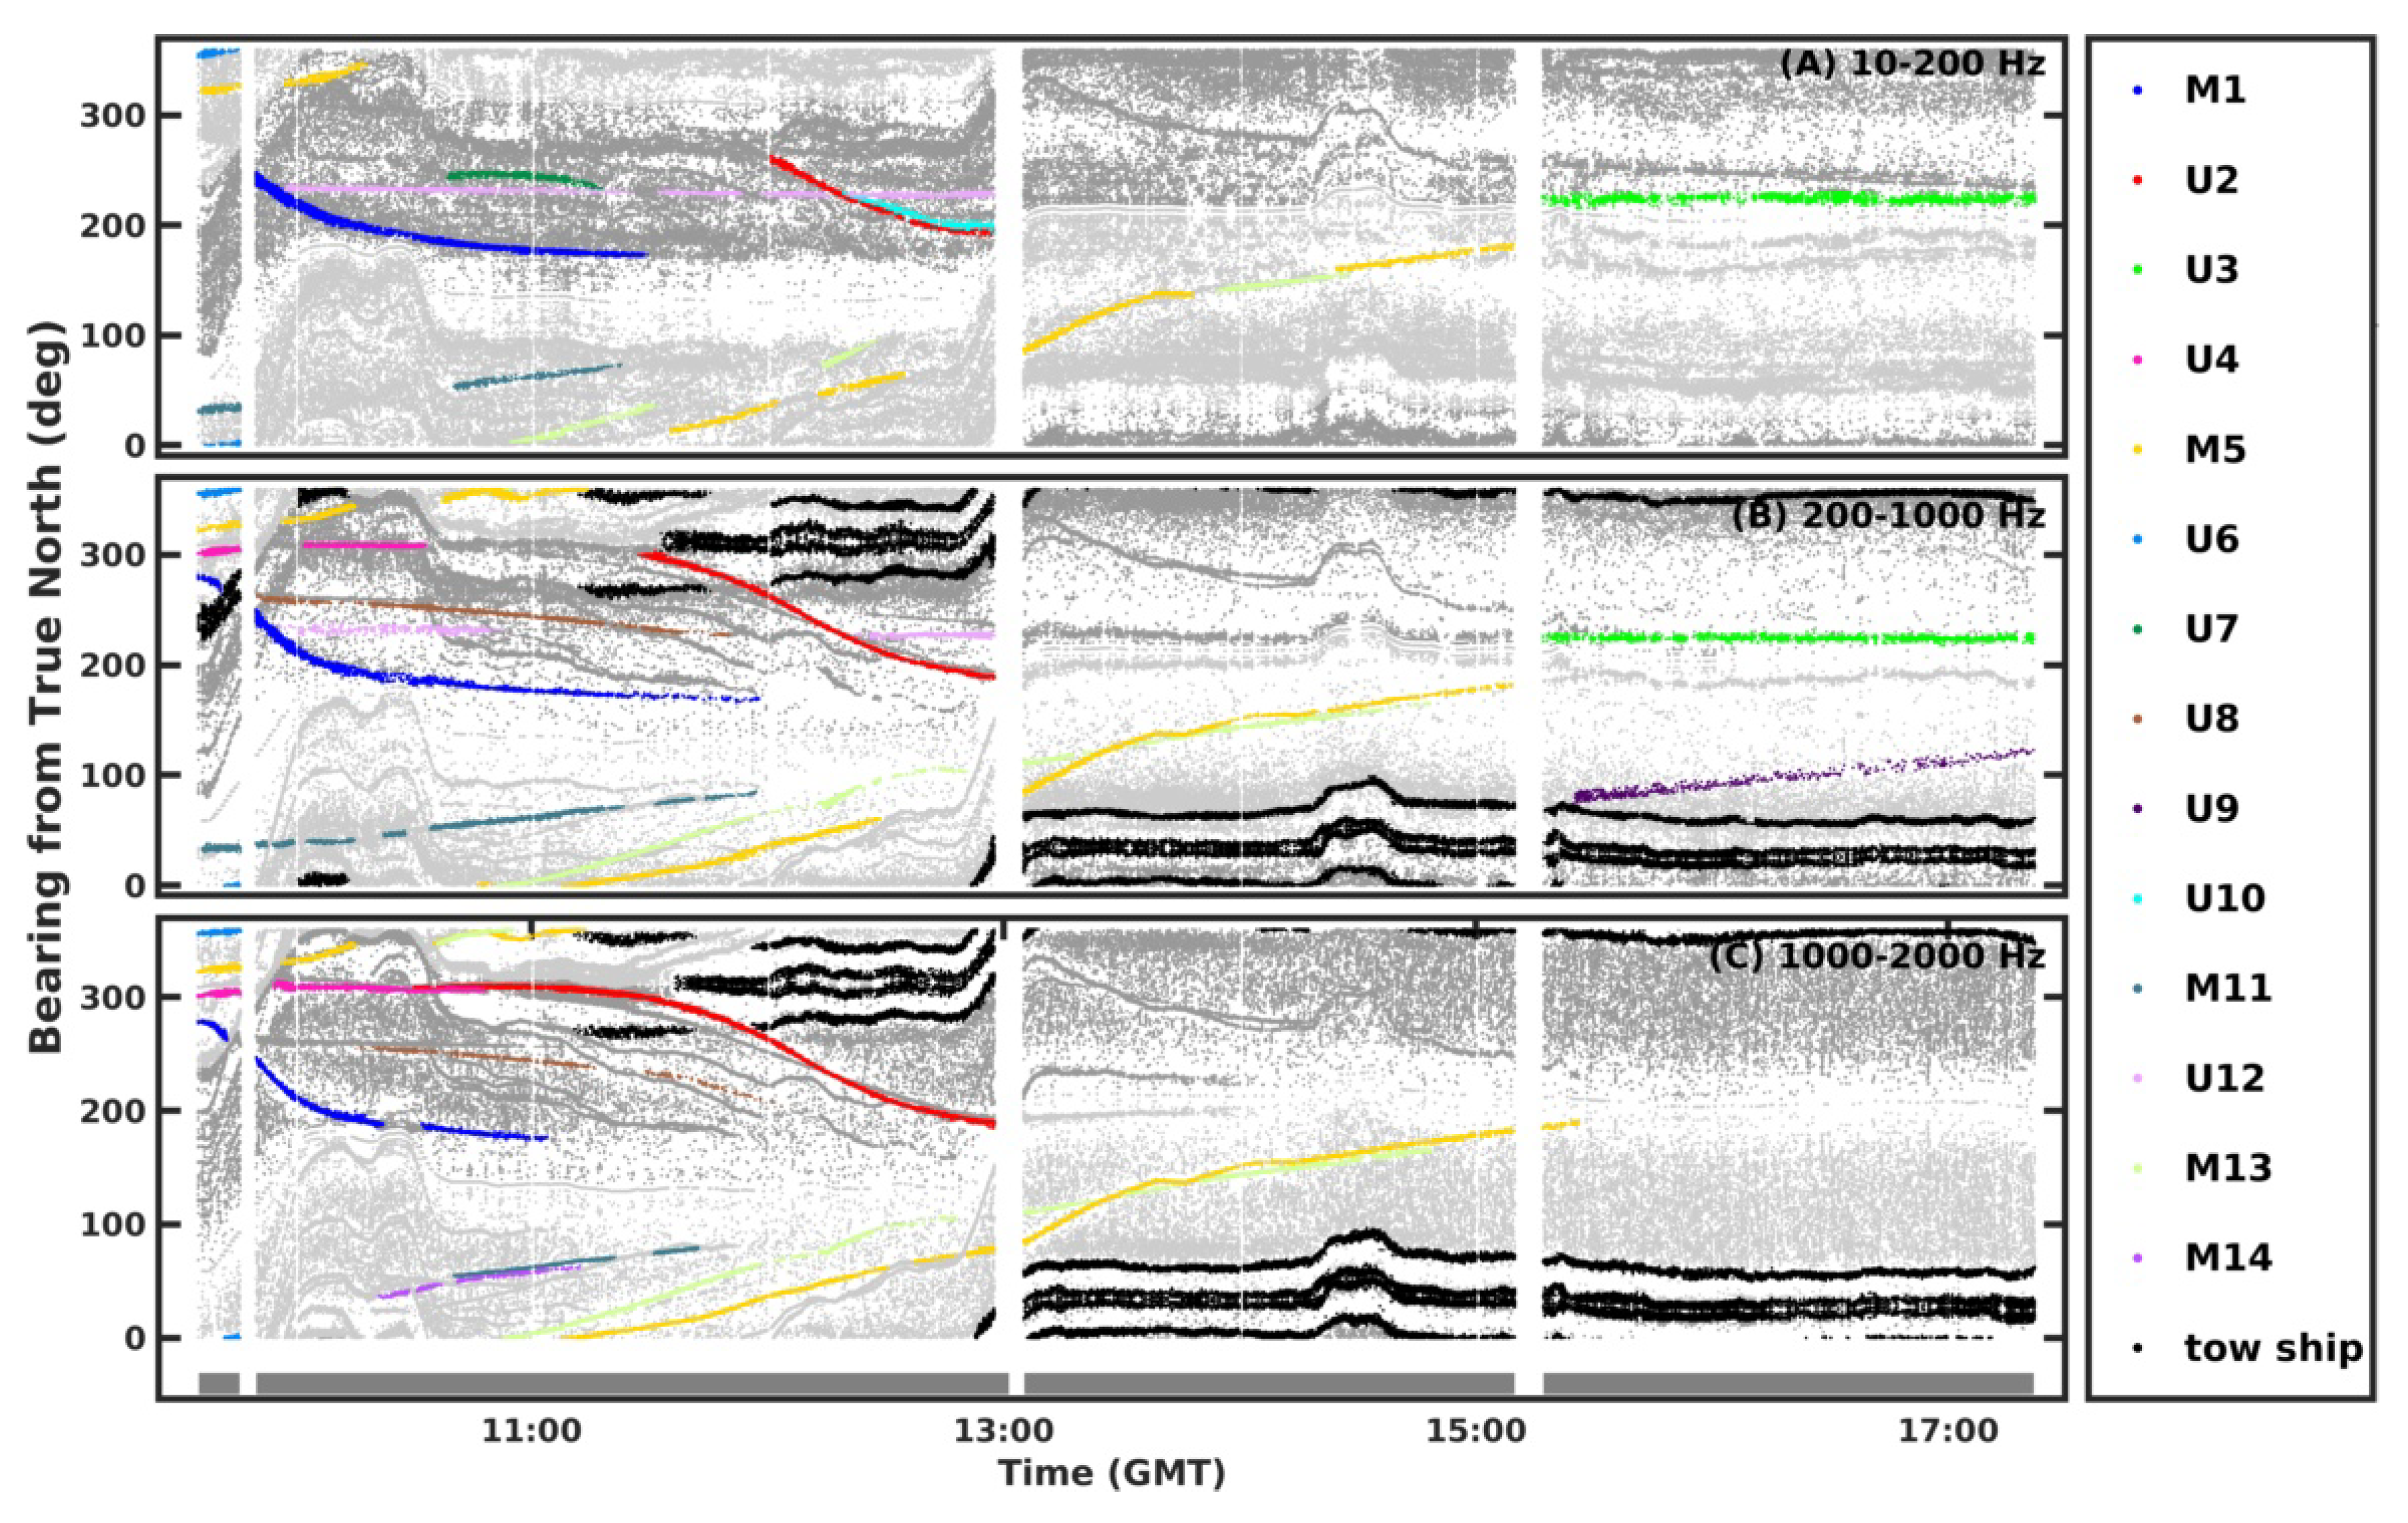
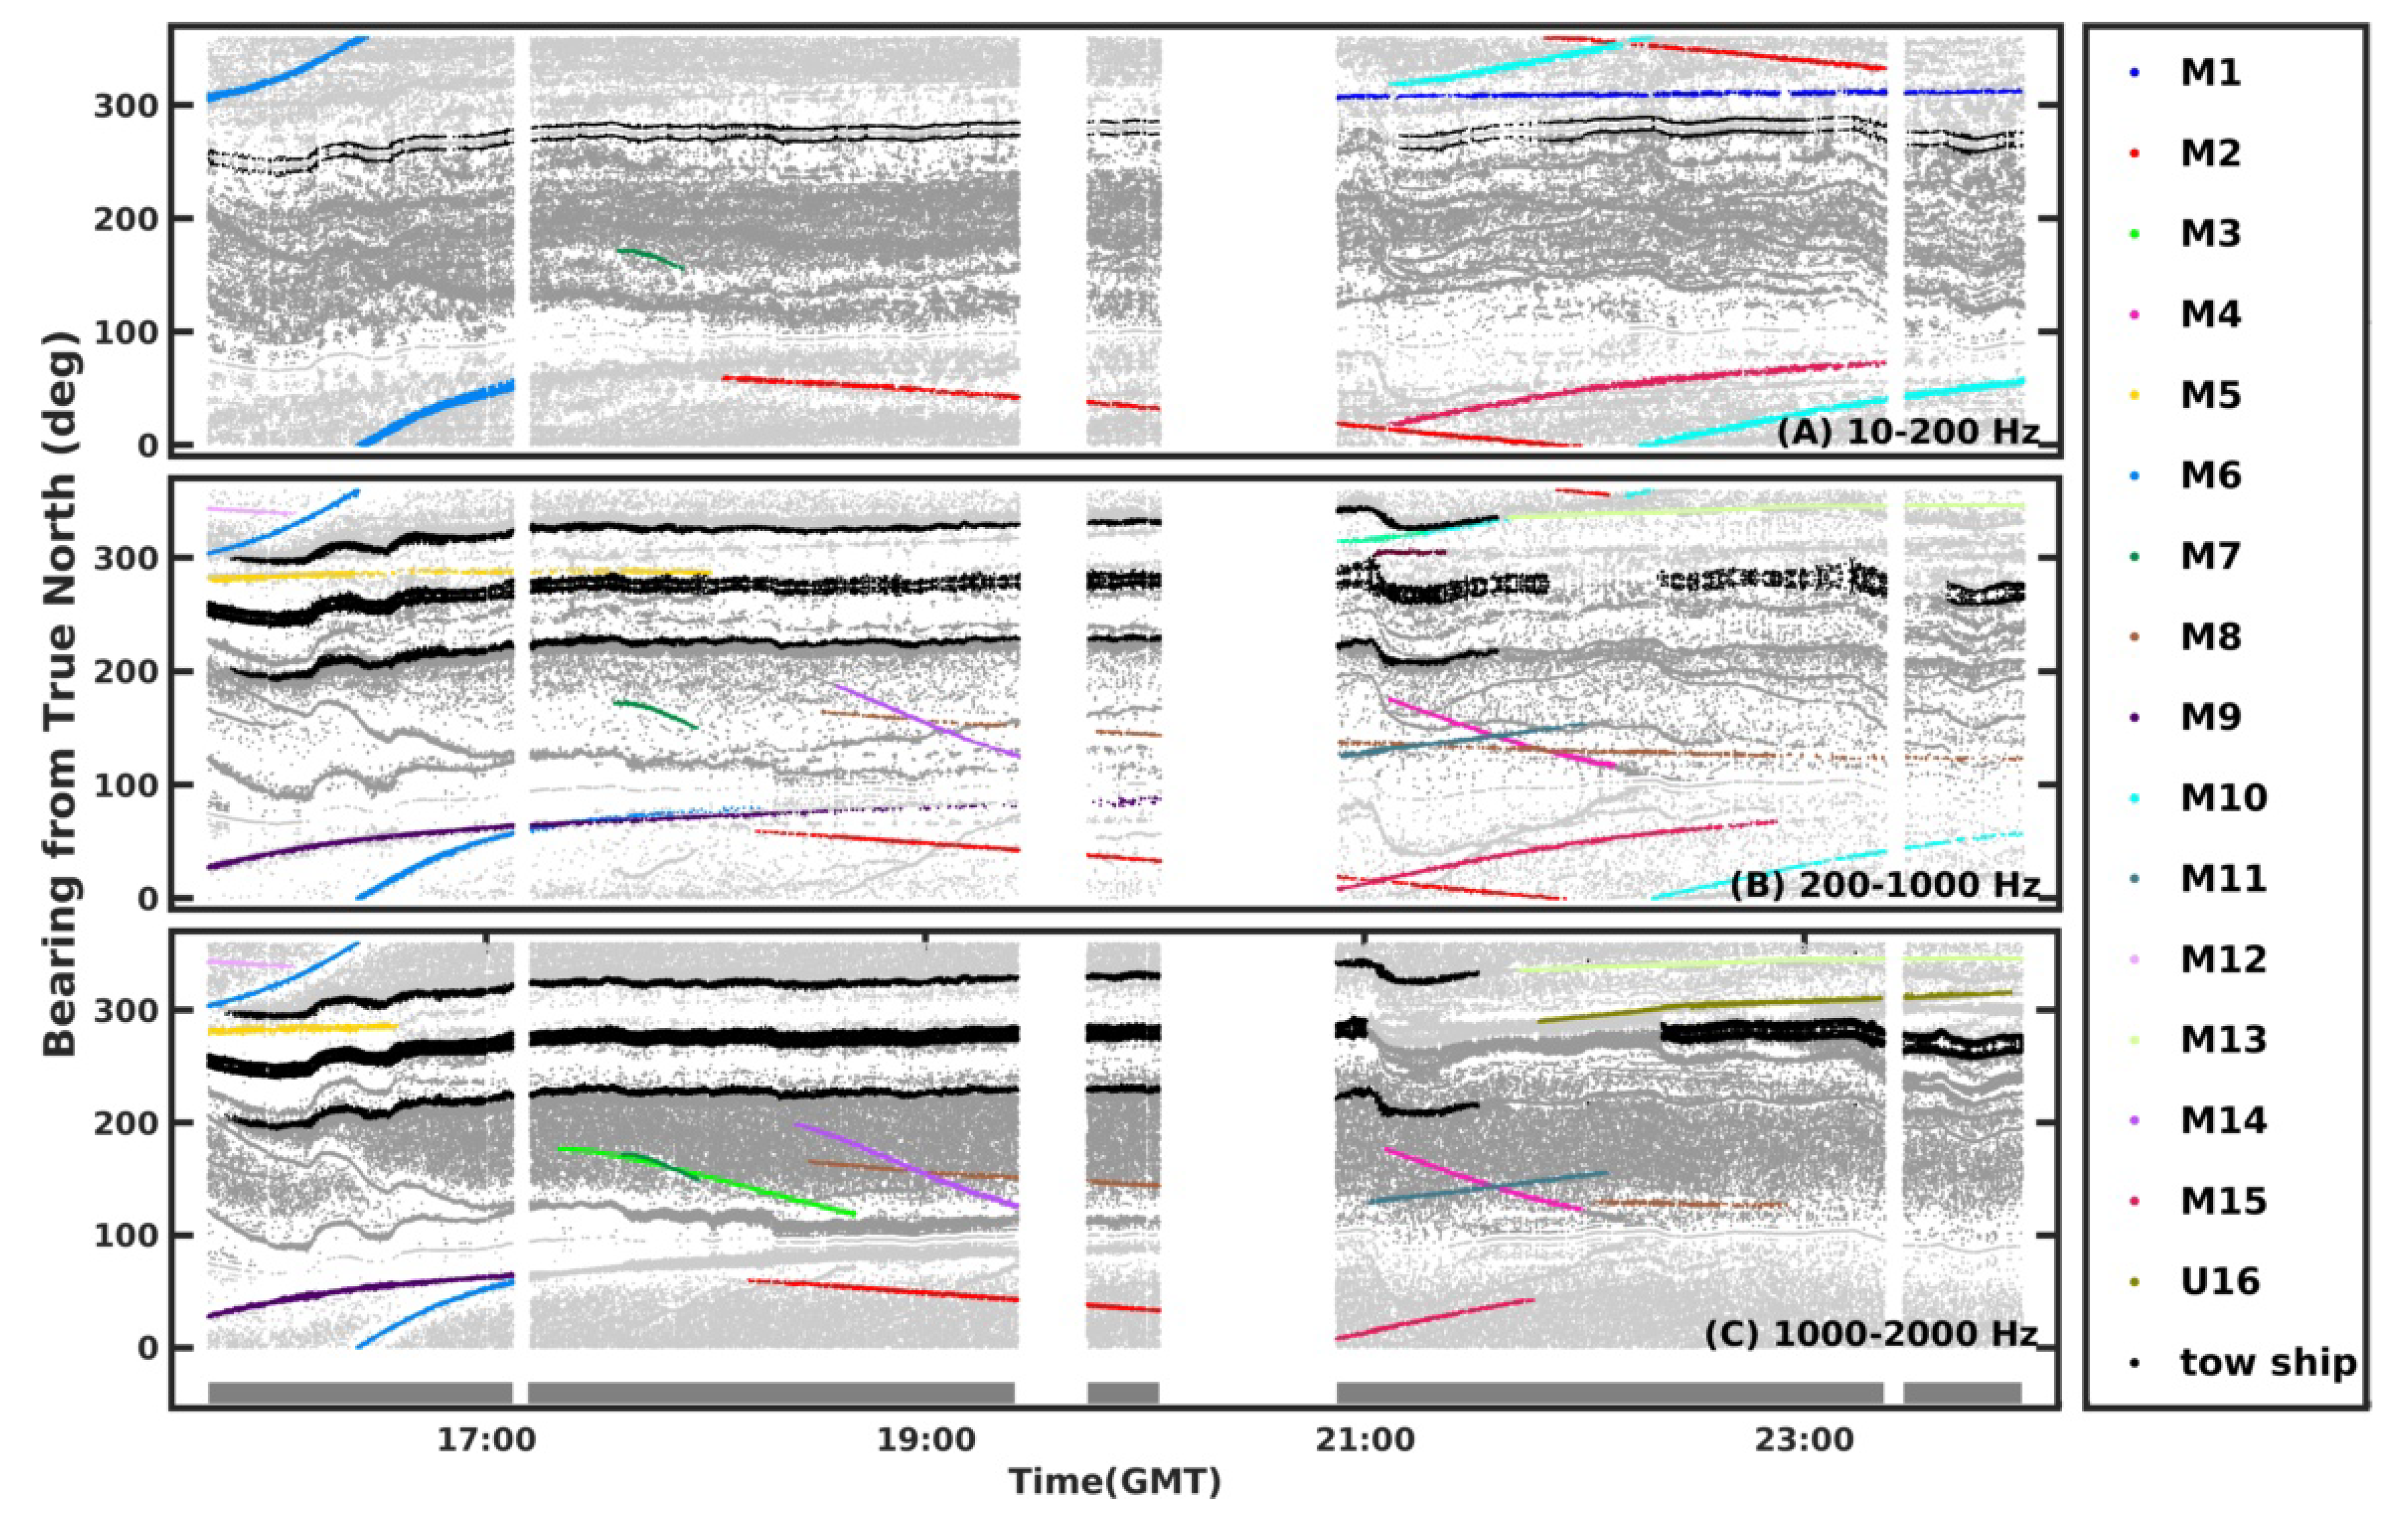
The bearing and time of all detected acoustic signals in the 10 Hz to 2000 Hz frequency range that stand at least 10 dB above the local ambient background noise in the beamformed spectrograms of 23 February 2014 are displayed as gray dots in
Figure 2A–C. In each of the three frequency subbands, there are more than 180,000 signal detections in the roughly 8 h observation time interval. In addition to sounds radiated by ocean vessels, the signal detections include marine mammal vocalizations [
1], sounds from fish and other ocean biology, as well as other either made-made or natural acoustic and seismic sources. The signal detections from the 14 vessels shown in color, follow distinct and well-defined bearing-time trajectories. Of the 14 vessels detected using passive acoustics, five are identified as commercial ships and labeled as M1, M5, M11, M13 and M14 with names provided in
Table 1. For these commercial ships, their bearing-time trajectories and positions derived from the coherent hydrophone array data match well with those derived from GPS measurements of the ships’ positions. The remaining nine vessels are unidentified since they could not be associated with other known ships in the region for the day. They are labelled as U2, U3, U4, U6, U7, U8, U9, U10 and U12 in
Figure 2A–C and
Table 2. These vessels either have sparse or absent GPS information in the historical AIS database to enable identification or confident association with passive acoustic detections.
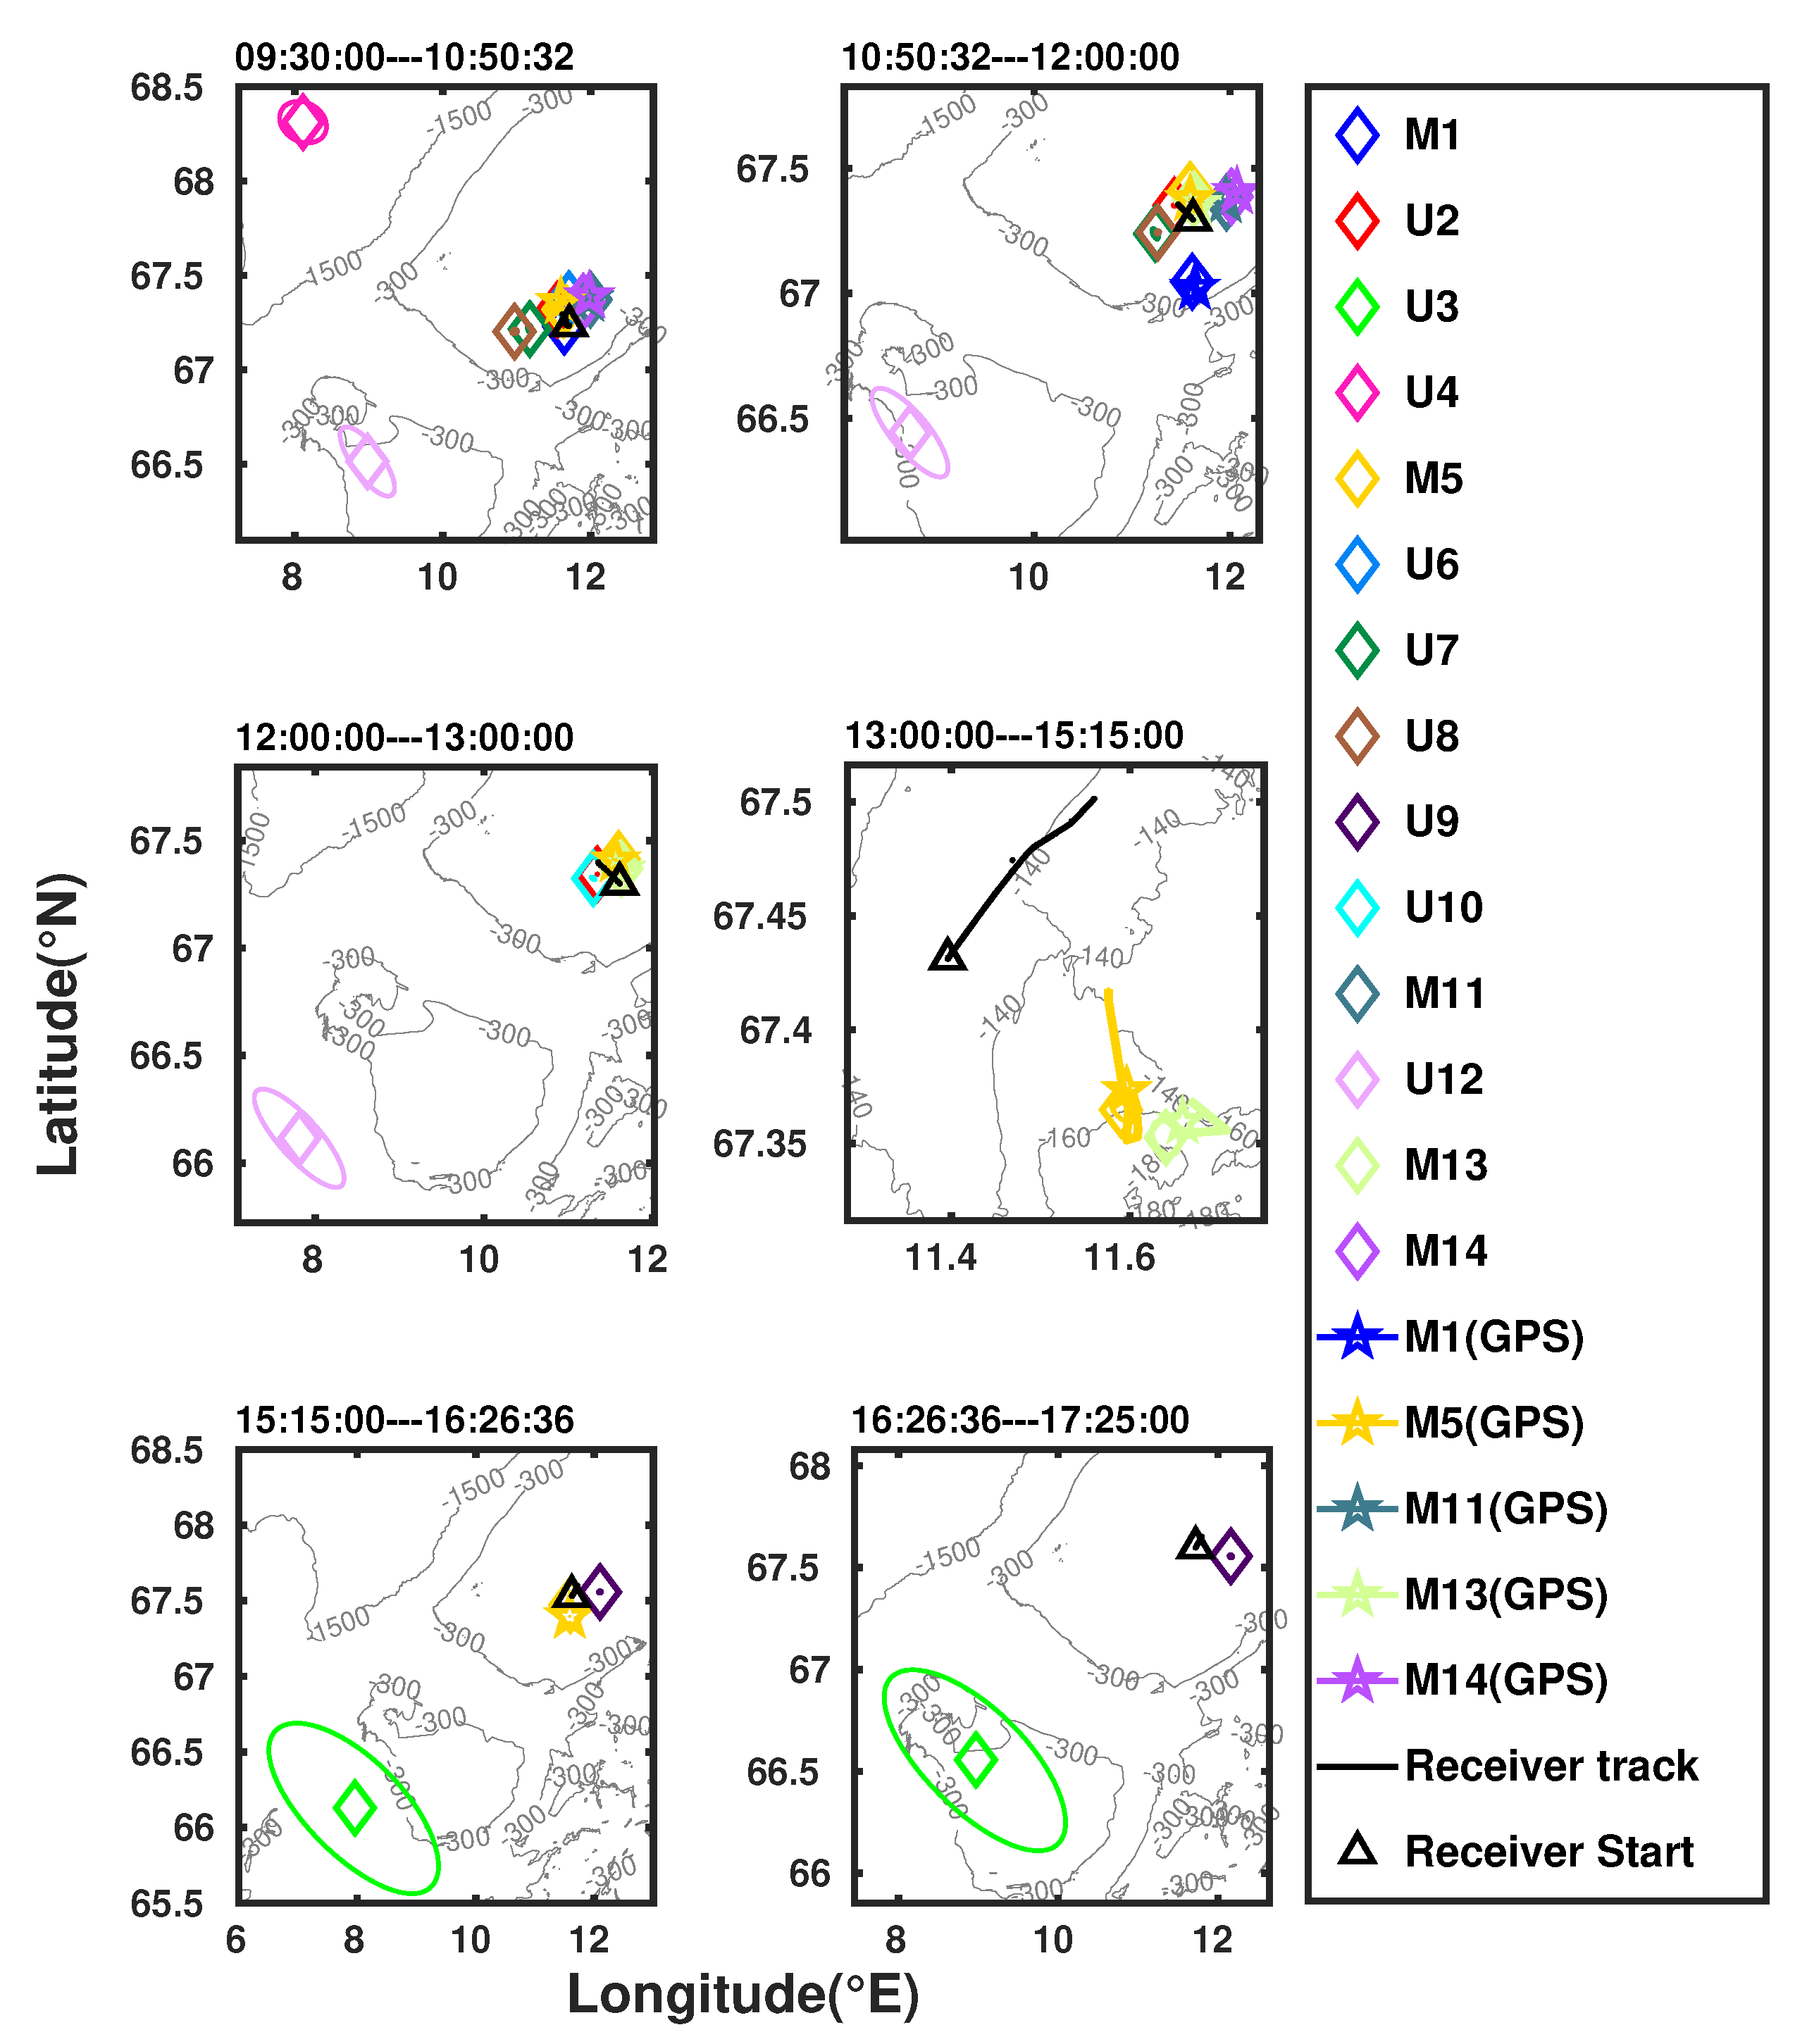
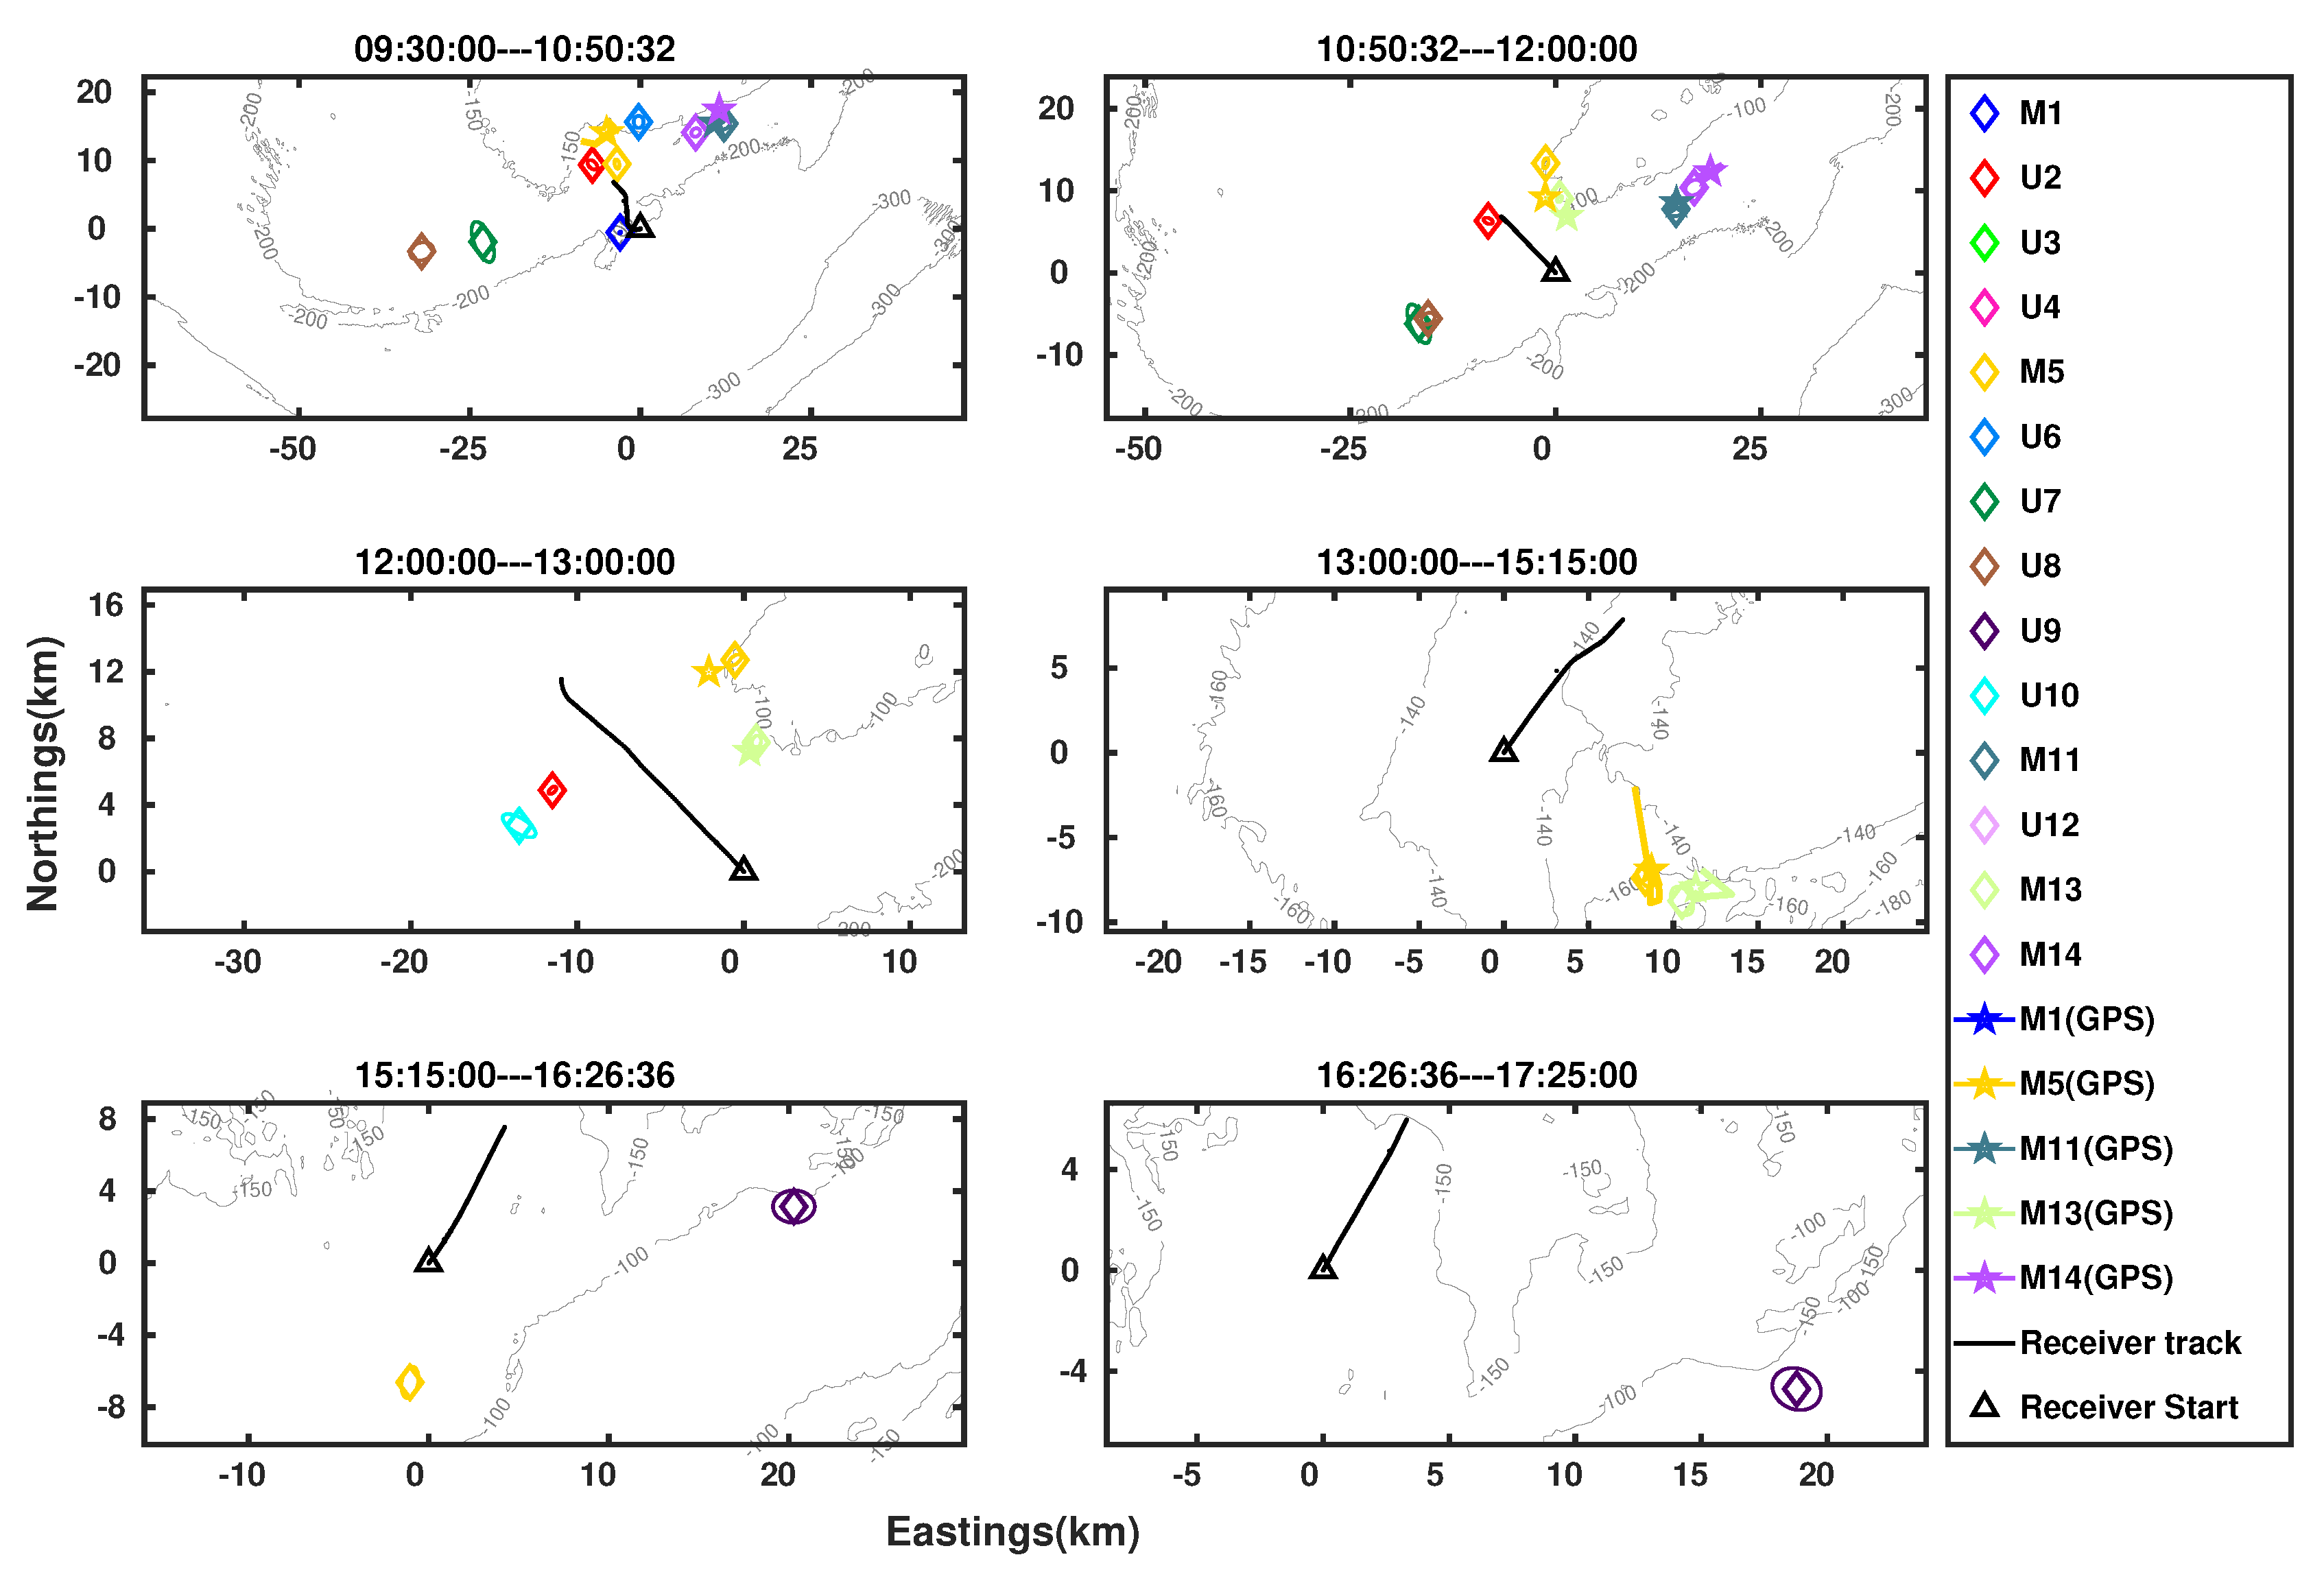
To localize the ocean vessels from their acoustic signal detections, the bearing-time trajectories of the detected signals are divided into 6 non-overlapping time segments and a mean position estimate is obtained for each vessel present in that time segment using the MAT-MMSE method and plotted in
Figure 3 and
Figure 4. Twelve of the passively detected ocean vessels are present within 30 km range of the hydrophone array, and three vessels are distant, more than 150 km away.
For the identified commercial ships, since their true positions are available from historical GPS records, the passive acoustic localization error using the MAT-MMSE method is quantified for these vessels, as the bias in the mean position estimate. The localization error varies between 4% to 45% with an average of roughly 16%, and depends on the bearing of the vessel from the coherent hydrophone array broadside direction, biases present in the beamformed and GPS derived bearings, as well as relative motion of the vessel and the tow ship (see
Table 5).
For each passively detected ocean vessel, multiple features have been extracted from the acoustic signal detections, among which, the center frequency and bandwidth provide the most distinctive characteristics that can be employed to classify the vessel. These two features are summarized for the signal detections from the five identified commercial ships in
Table 1 and the nine unidentified ocean vessels in
Table 2.
3.1.1. Commercial Ships Identified by GPS
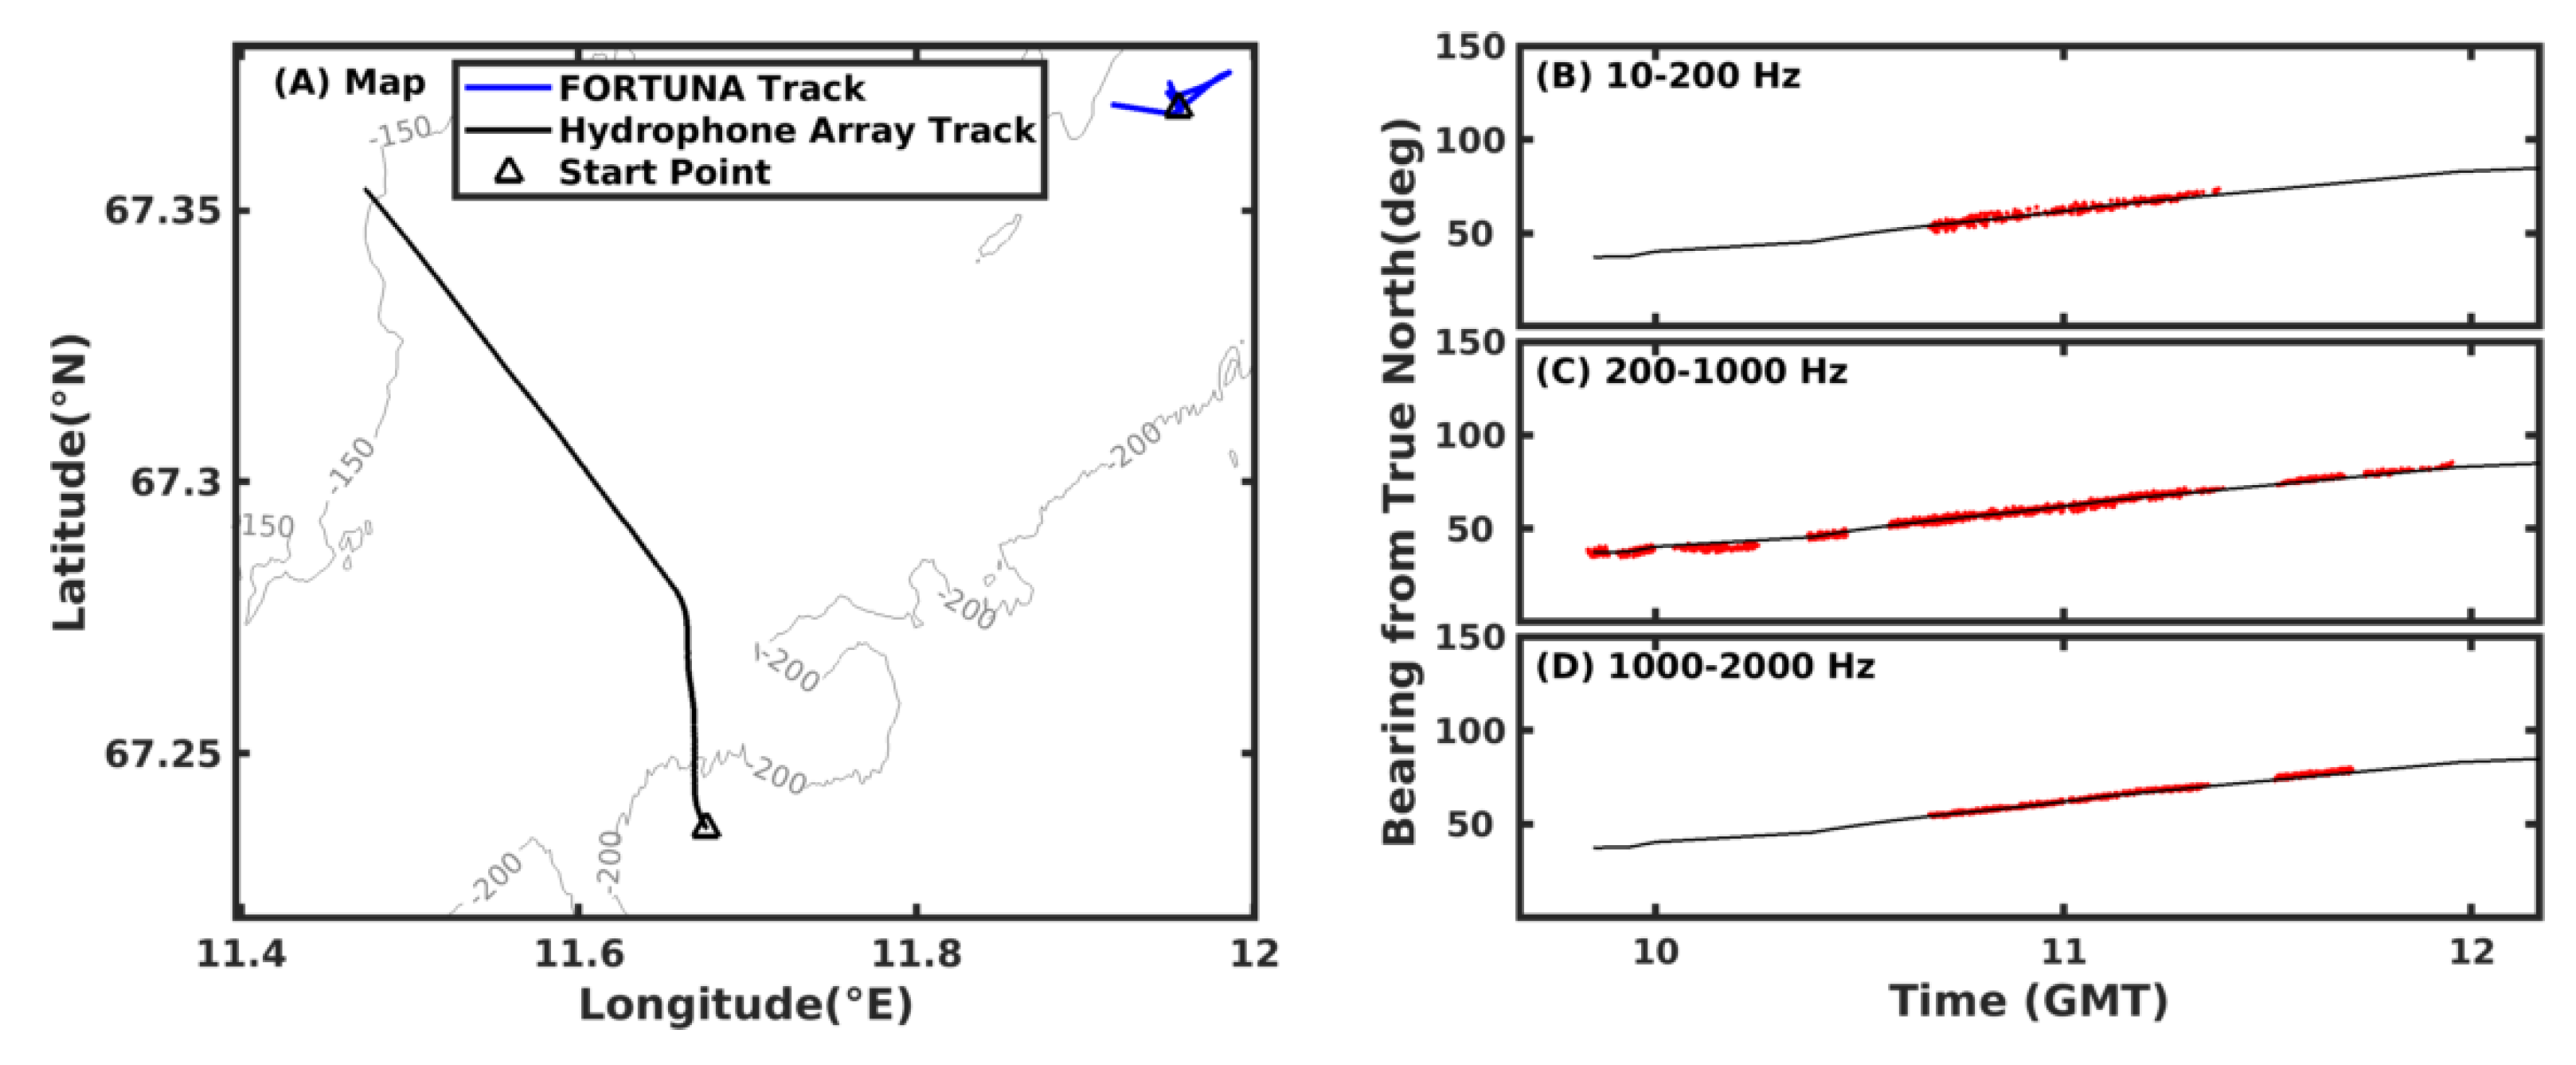
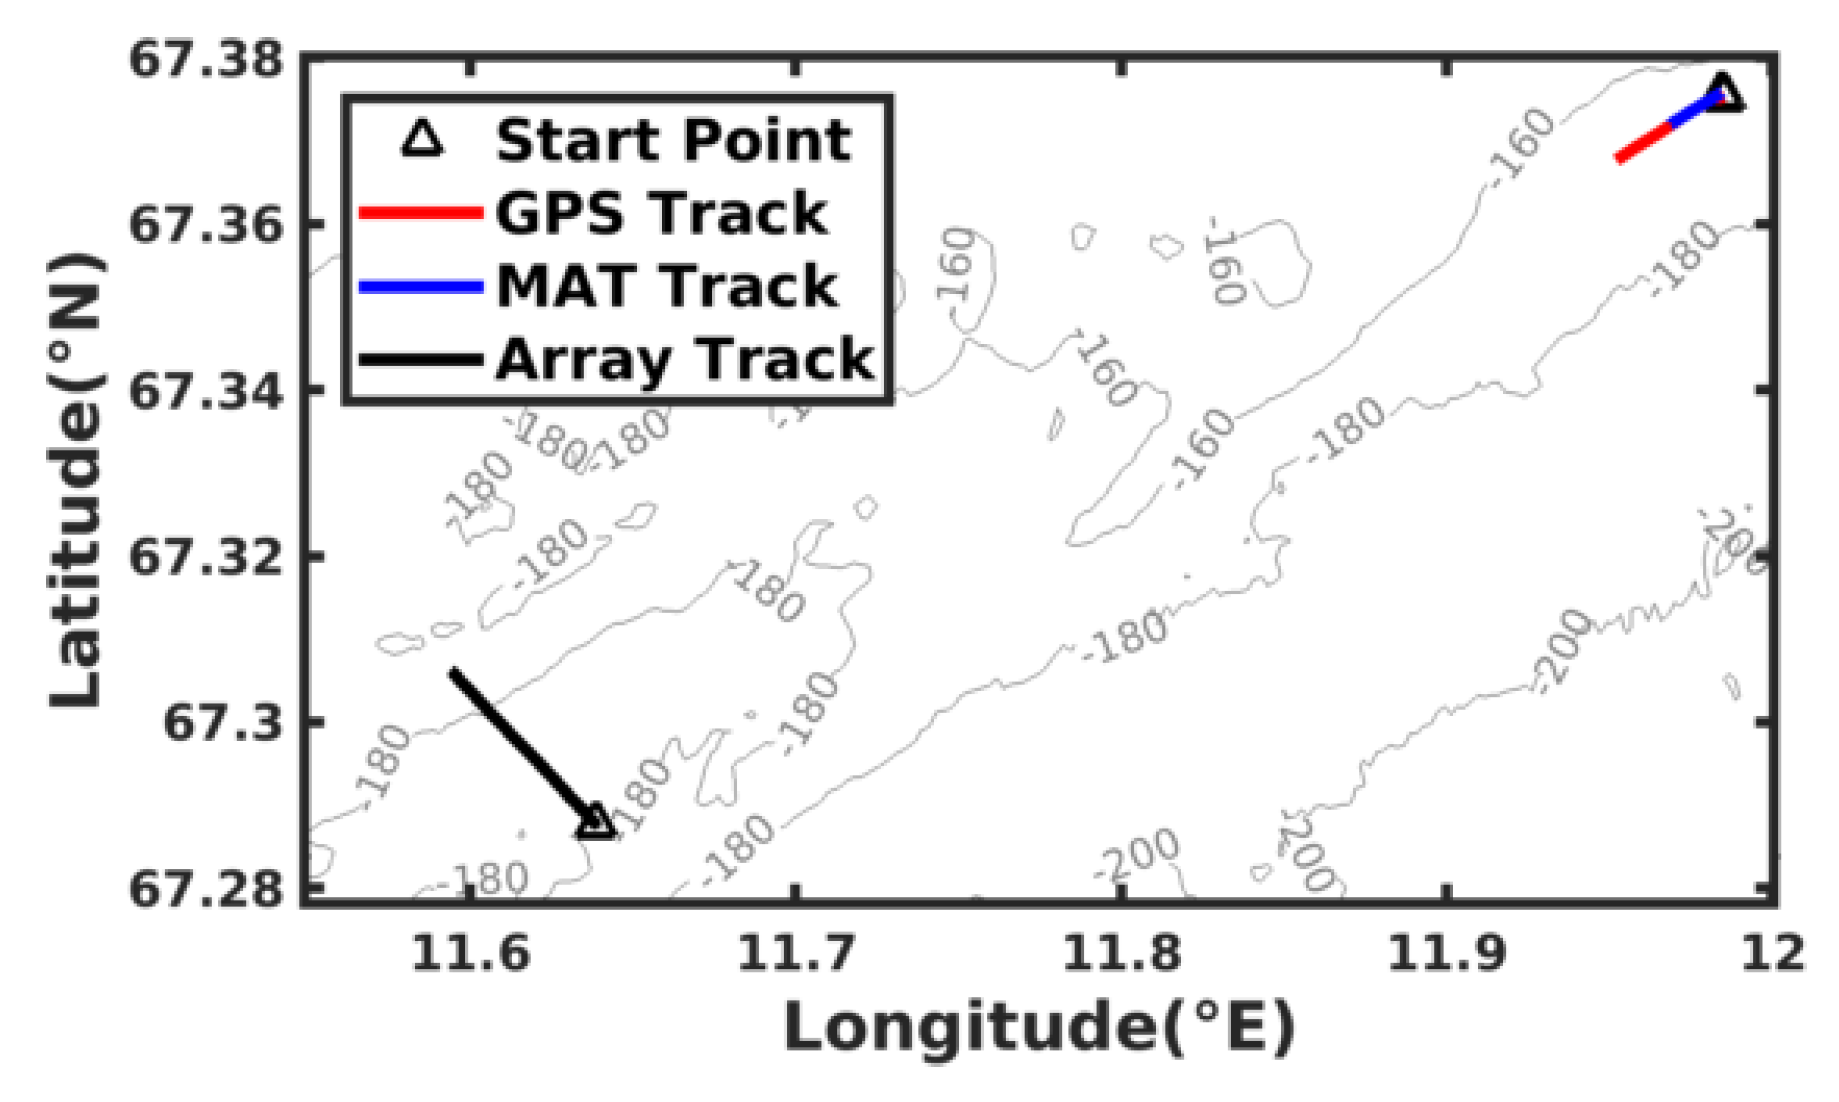
Here we provide detailed results from our analysis for two of the five identified commercial ships, fishing vessel (FV) Fortuna (labeled M11) and FV Fugloyhav (ship now renamed to FV Vikanoy, labeled M5). The tow tracks of the coherent hydrophone array and the corresponding locations of FV Fortuna on 23 February 2014 off the Lofoten archipelago during NorEx14 based on GPS measurements are shown in
Figure 5A. The bearing-time trajectories of detected signals measured by the coherent hydrophone array that are associated with FV Fortuna in the three frequency subbands, 10–200 Hz, 200–1000 Hz and 1000–2000 Hz are plotted in
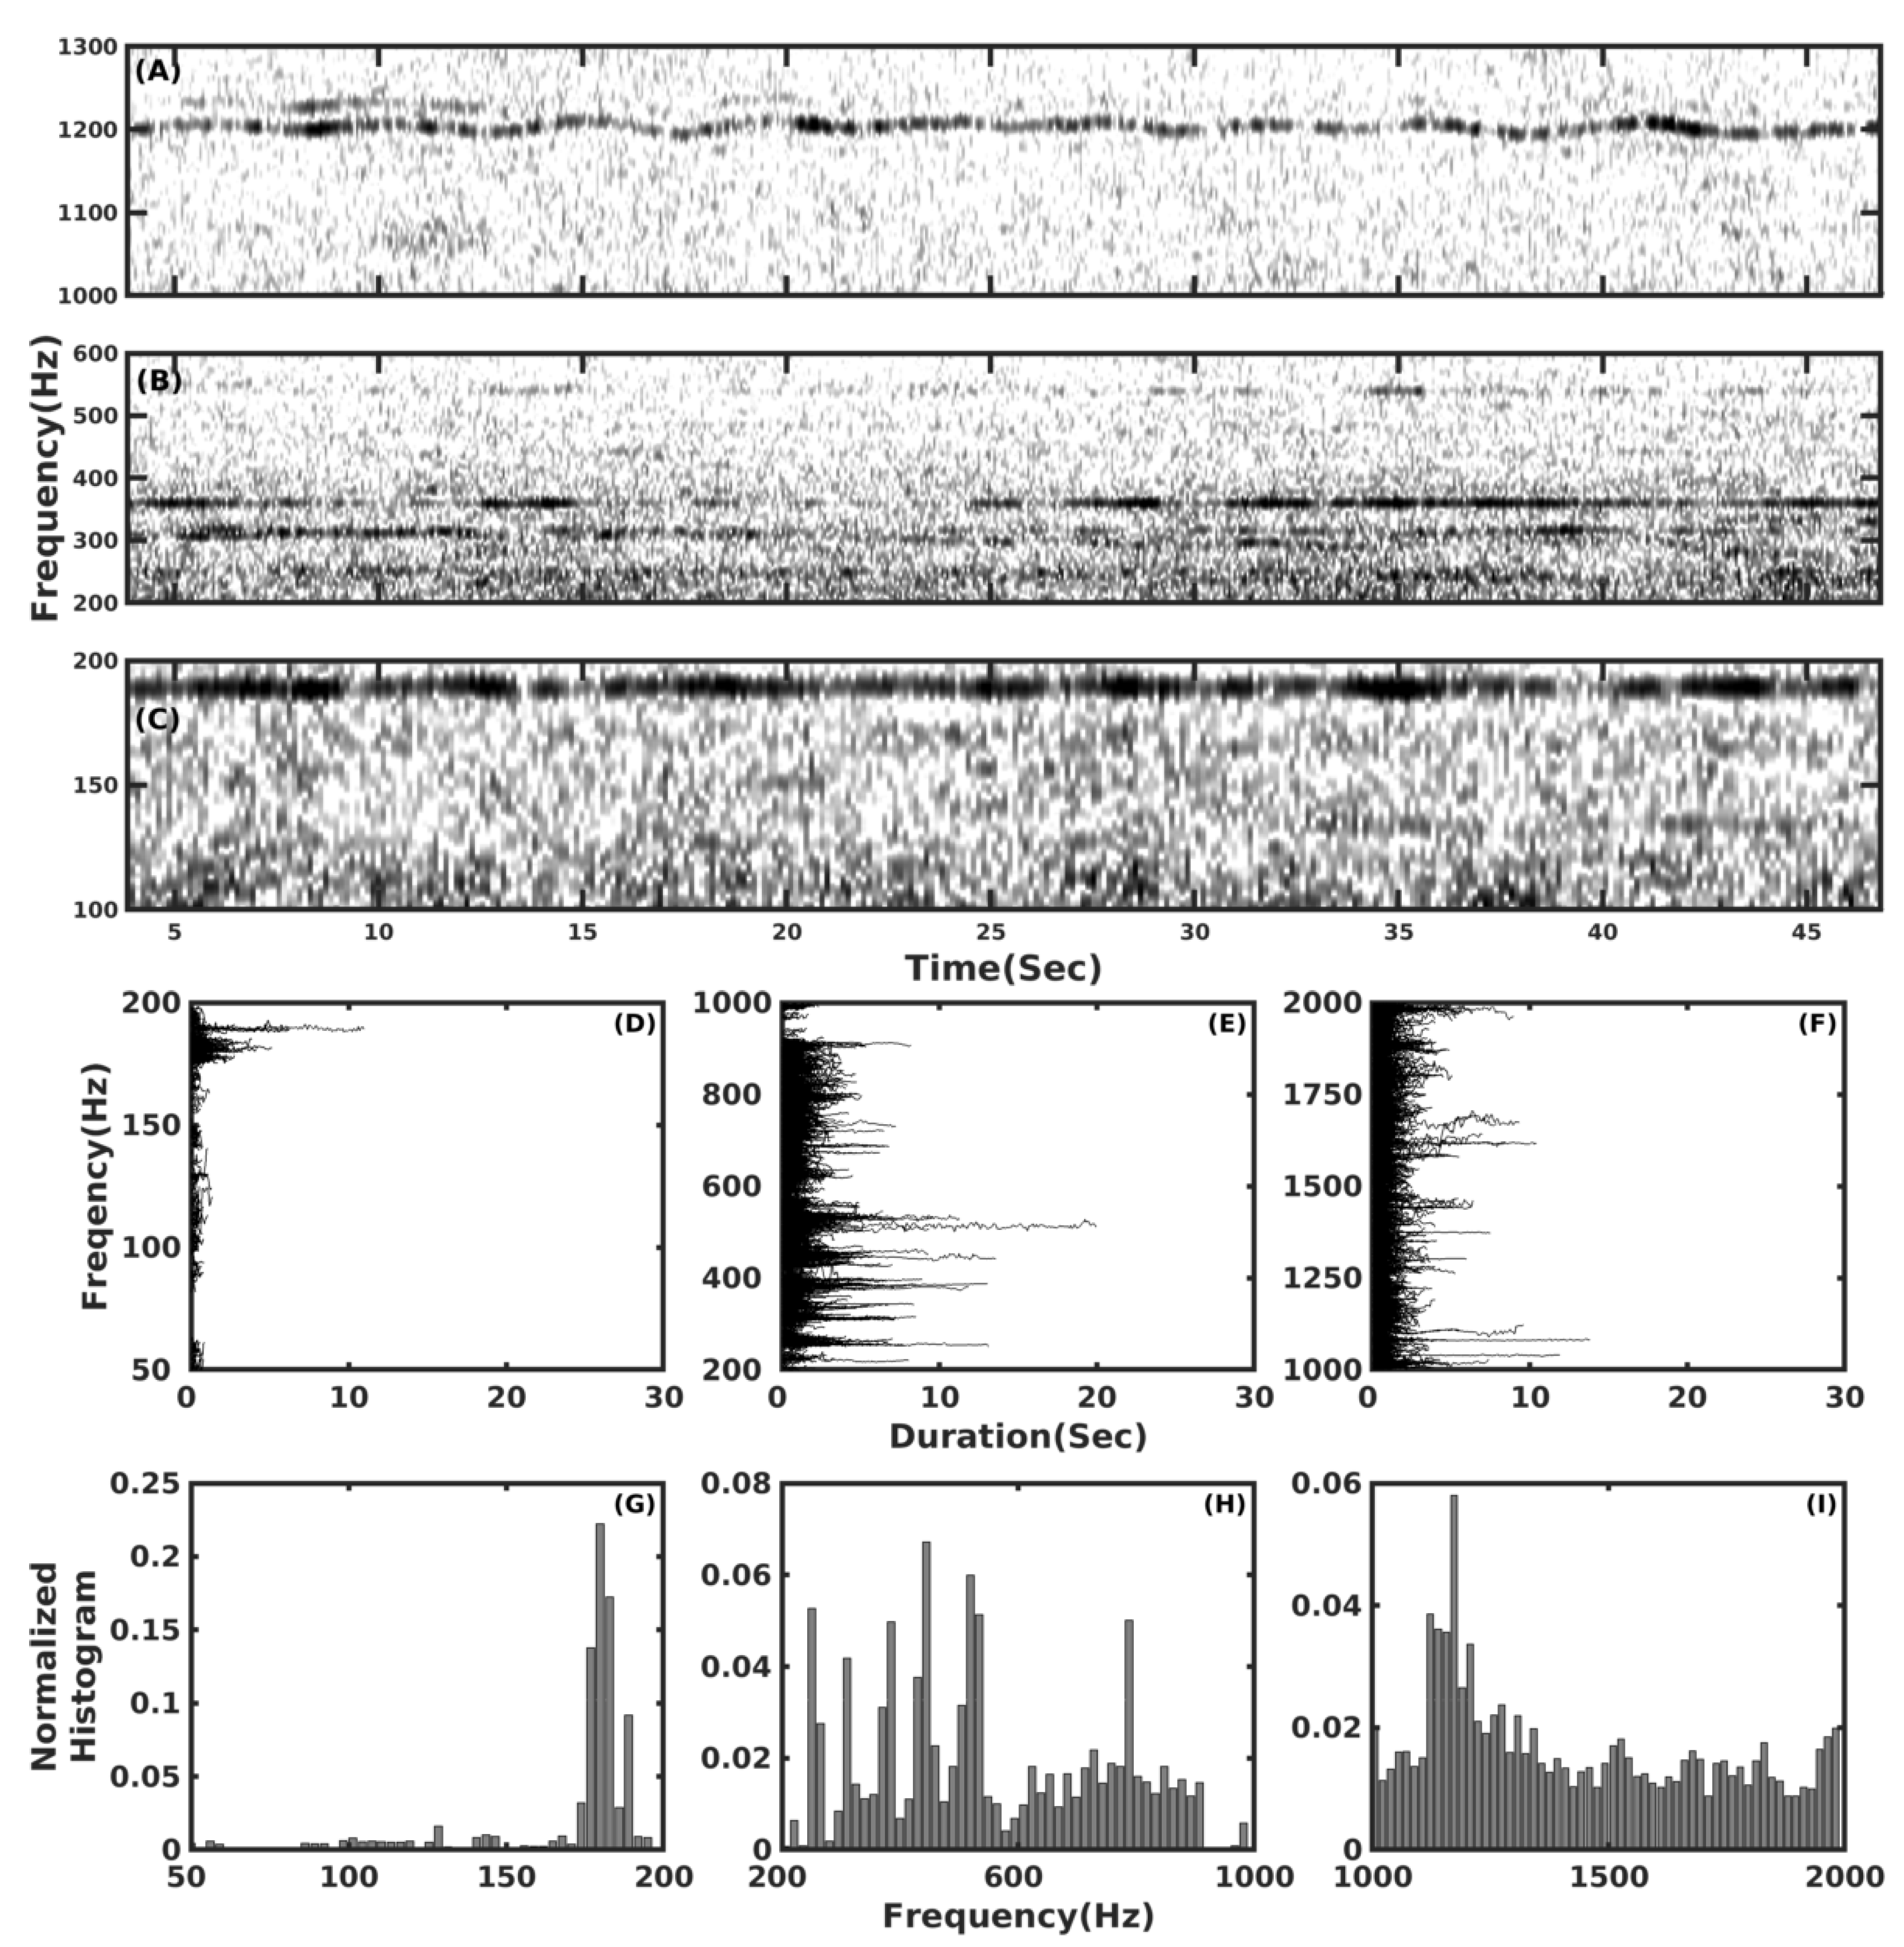
Figure 5B–D. The red dots represent the bearings of signal detections and the black curve are the true bearings of FV Fortuna derived from GPS-measurements. The bearings of detected signals overlap well with the true bearings in all three frequency subbands so that these acoustic signals can be associated with FV Fortuna. The time-frequency characteristics of the detected signals associated with FV Fortuna in the three frequency subbands are shown in
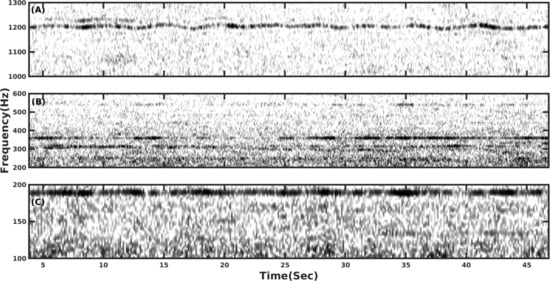
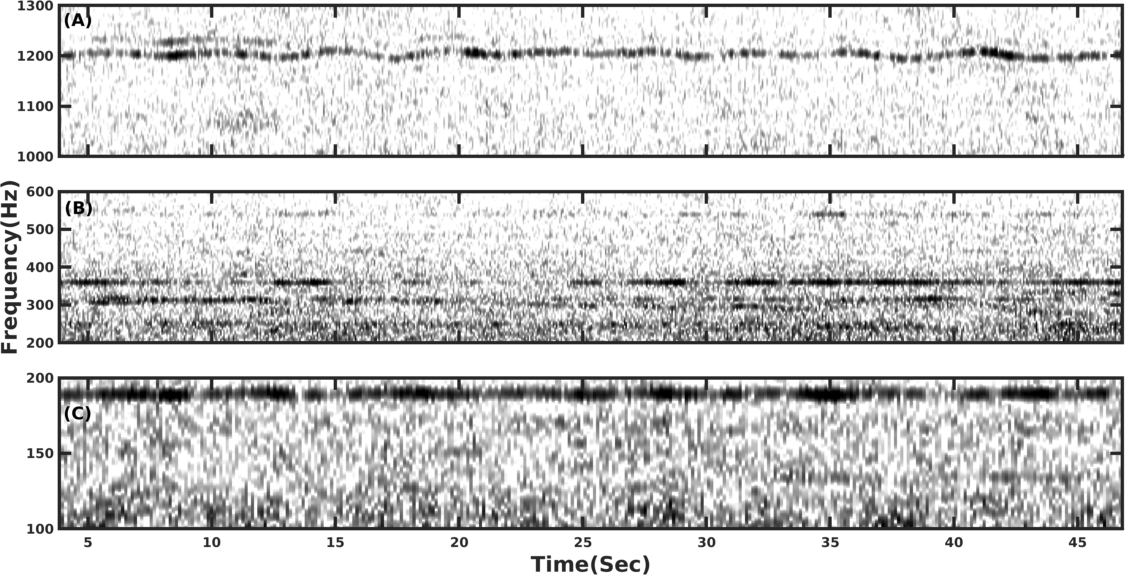
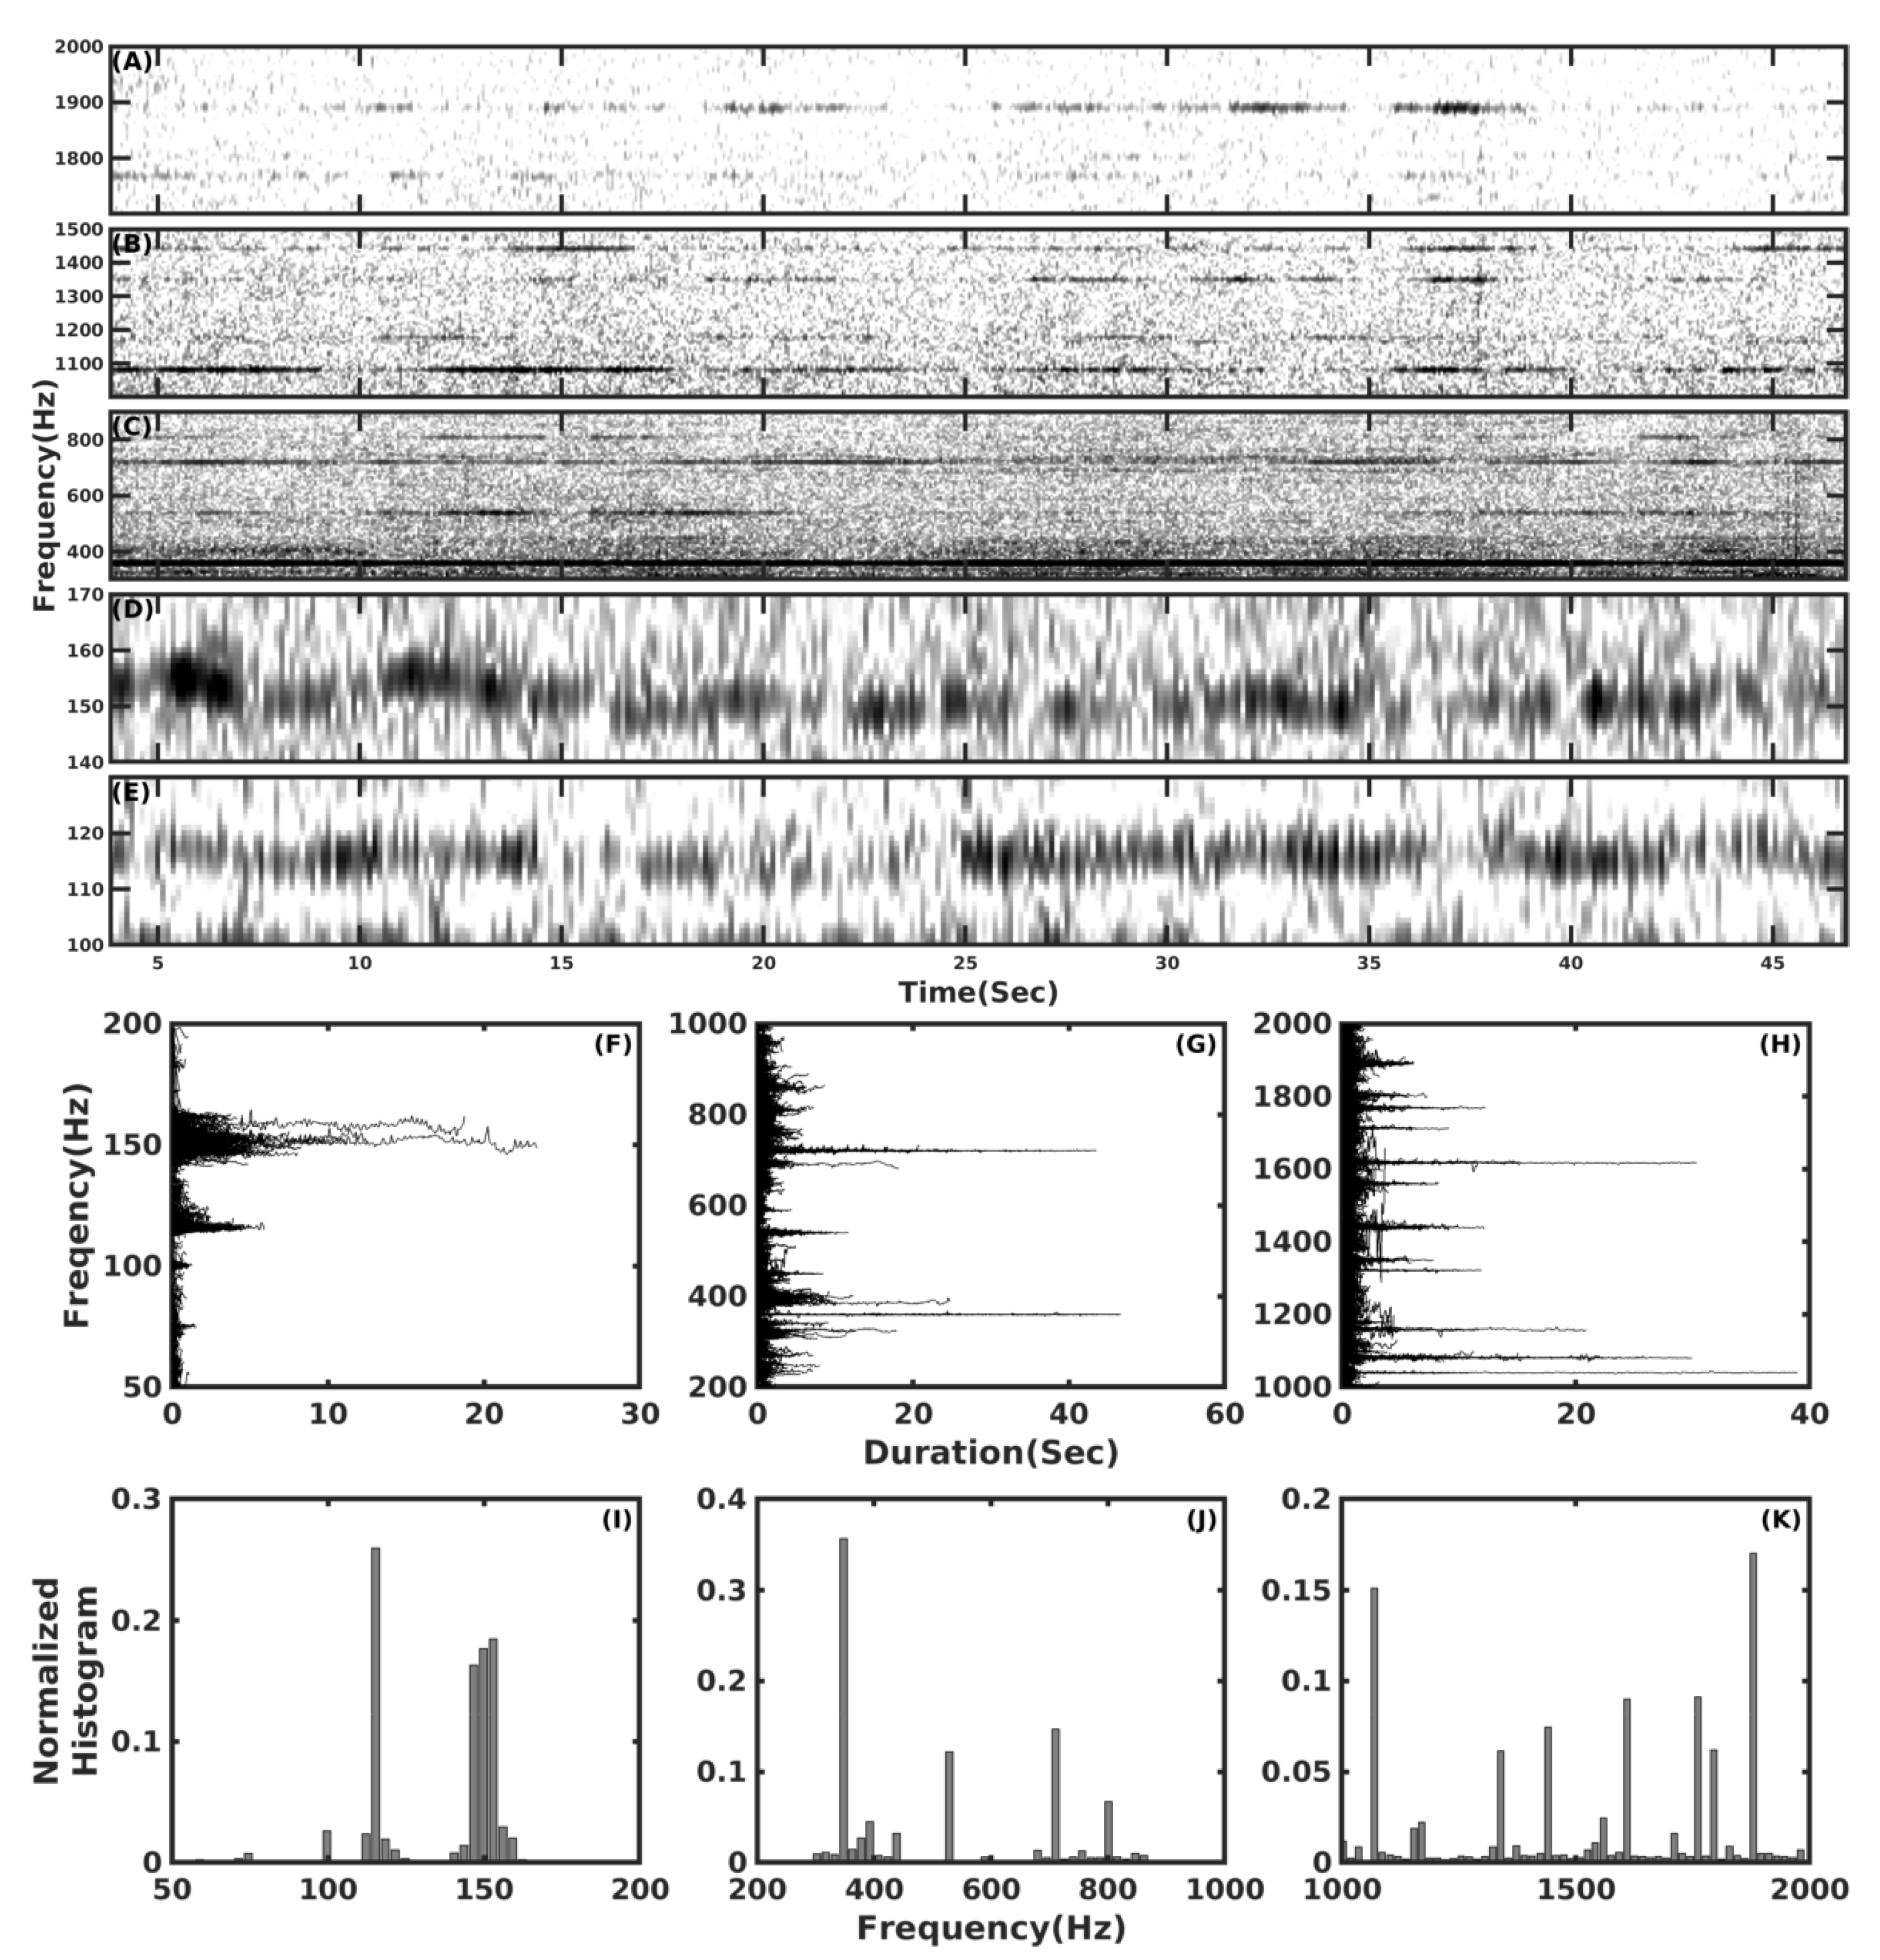
Figure 6. The sound radiated by FV Fortuna is dominated by several distinct narrowband signals which are tonals near 180 Hz, 256 Hz, 446 Hz and 553 Hz, as well as the wavering frequency signal centered around 1200 Hz. Examples of beamformed spectrograms containing these prominent narrowband signals, as well as other broadband and narrowband signals associated with FV Fortuna are shown in
Figure 6A–C. The ensemble of pitch tracks and the histogram of mean frequency weighted by signal duration [
2] for the ship-associated detections in the three frequency subbands are shown in
Figure 6D–I.
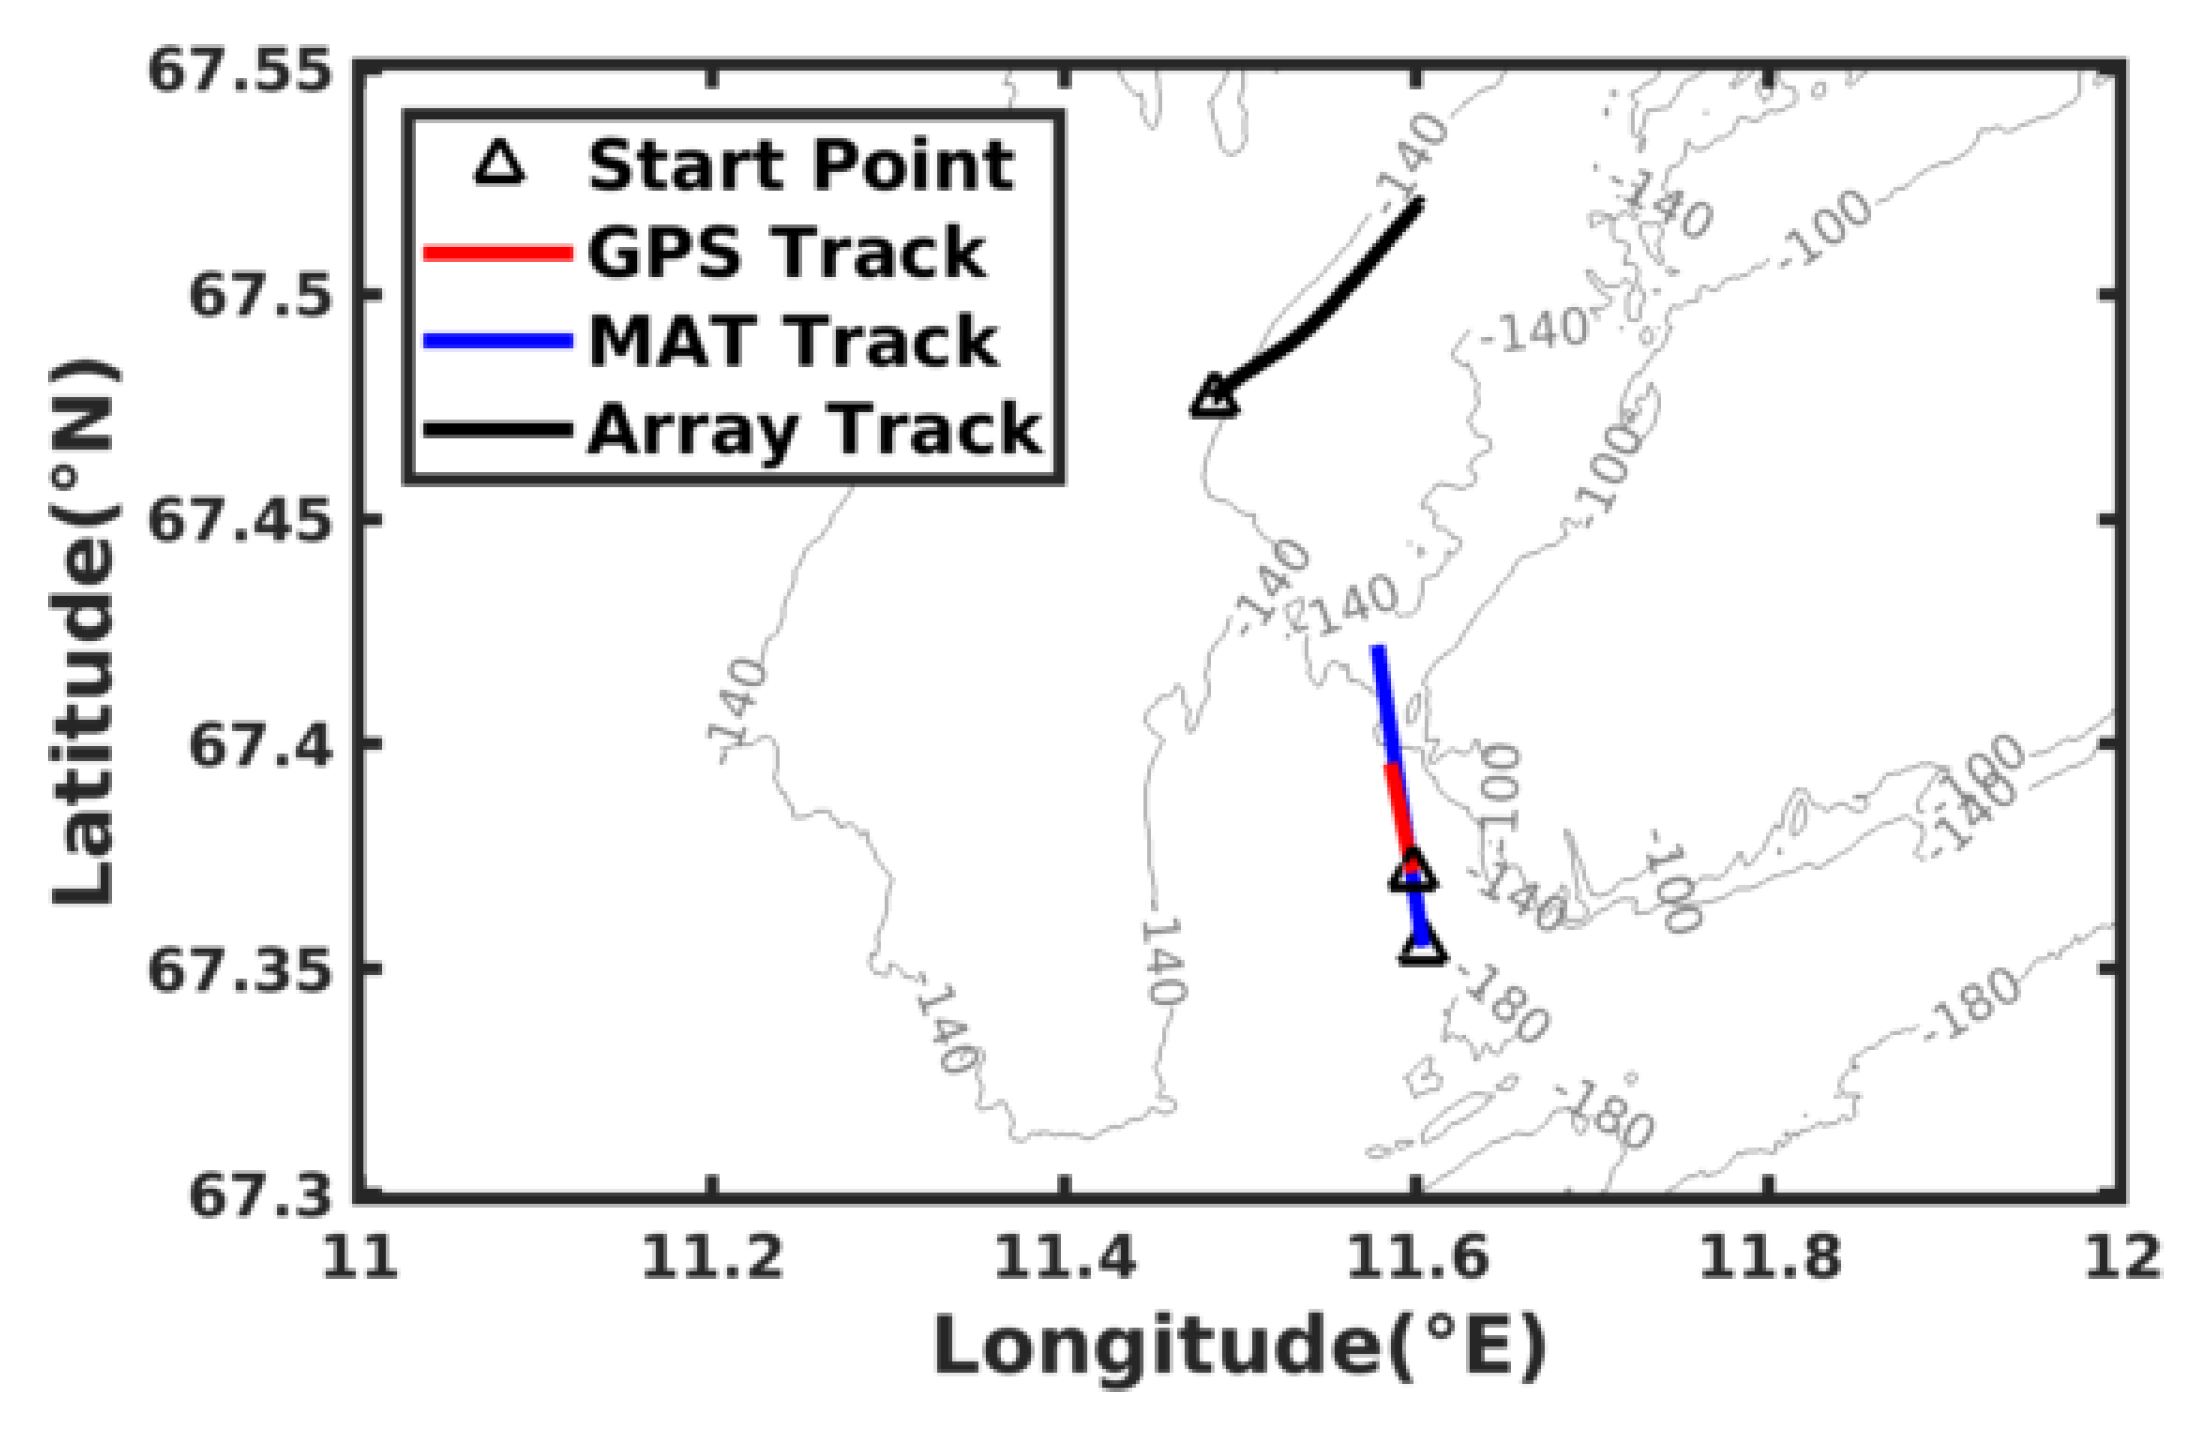
The horizontal track of FV FORTUNA in the time period from 10:45:05 a.m. to 11:06:50 a.m. GMT estimated from the bearing-time trajectory of its signal detections using the MAT technique is shown in
Figure 7, along with its true track based on GPS measurements. The estimated track of FV FORTUNA overlaps well with the true track, but is shorter than the true track. The mean localization error averaged over the entire track shown is roughly 5% of the true range.
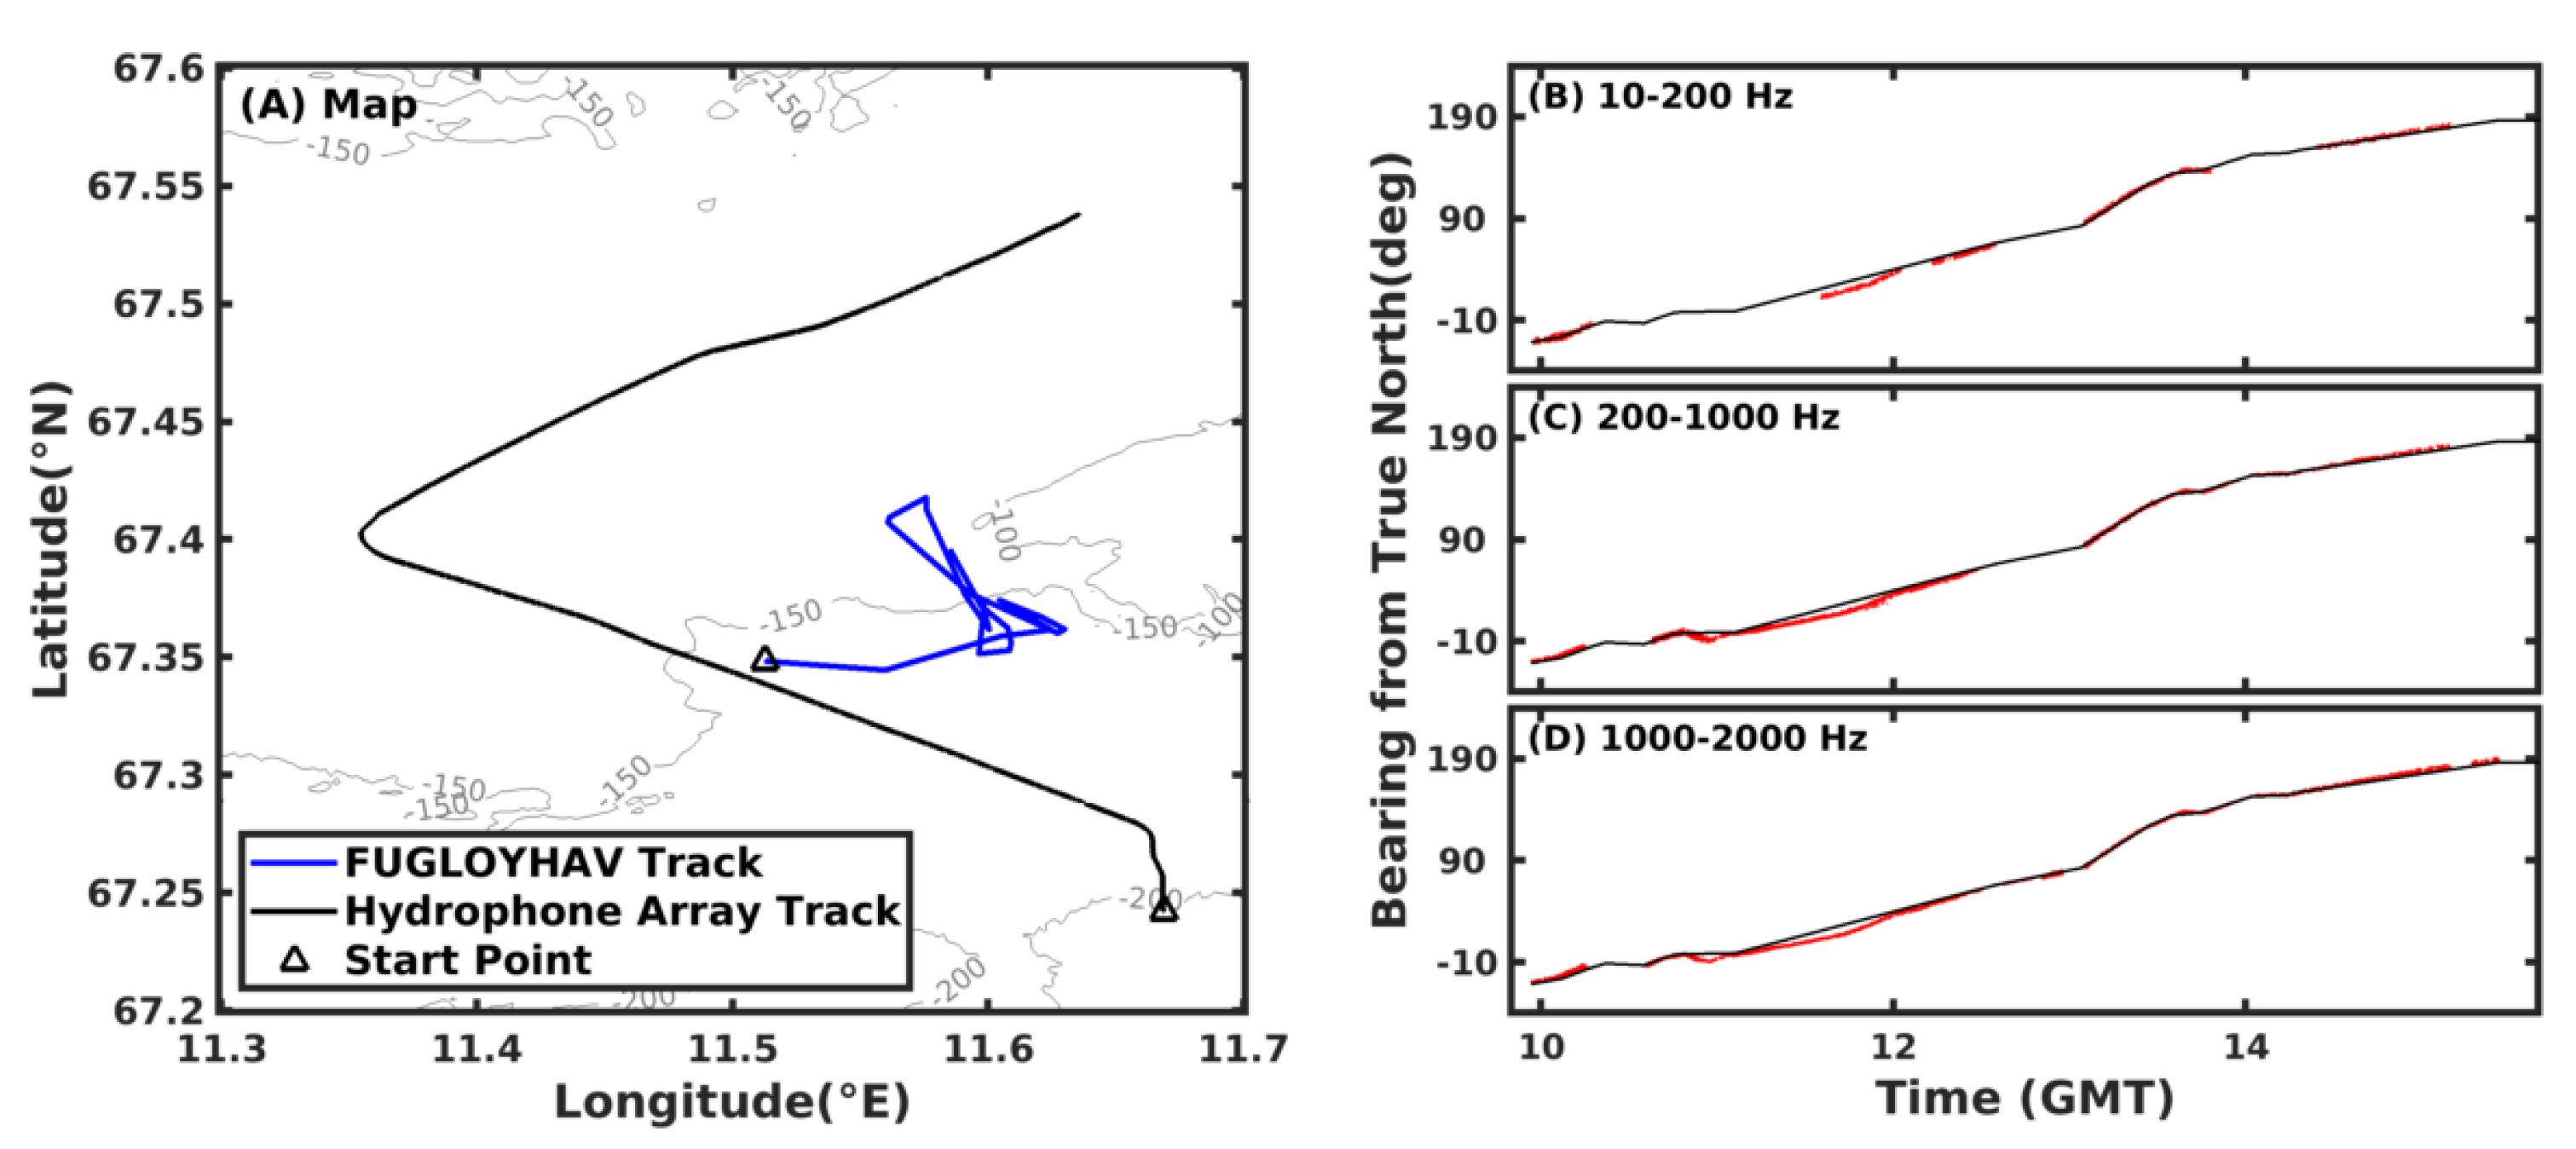
Similar analysis is conducted and presented for FV Fugloyhav. The estimated bearings of signal detections that overlap with its true bearings derived from GPS measurements in all three frequency subbands are shown in
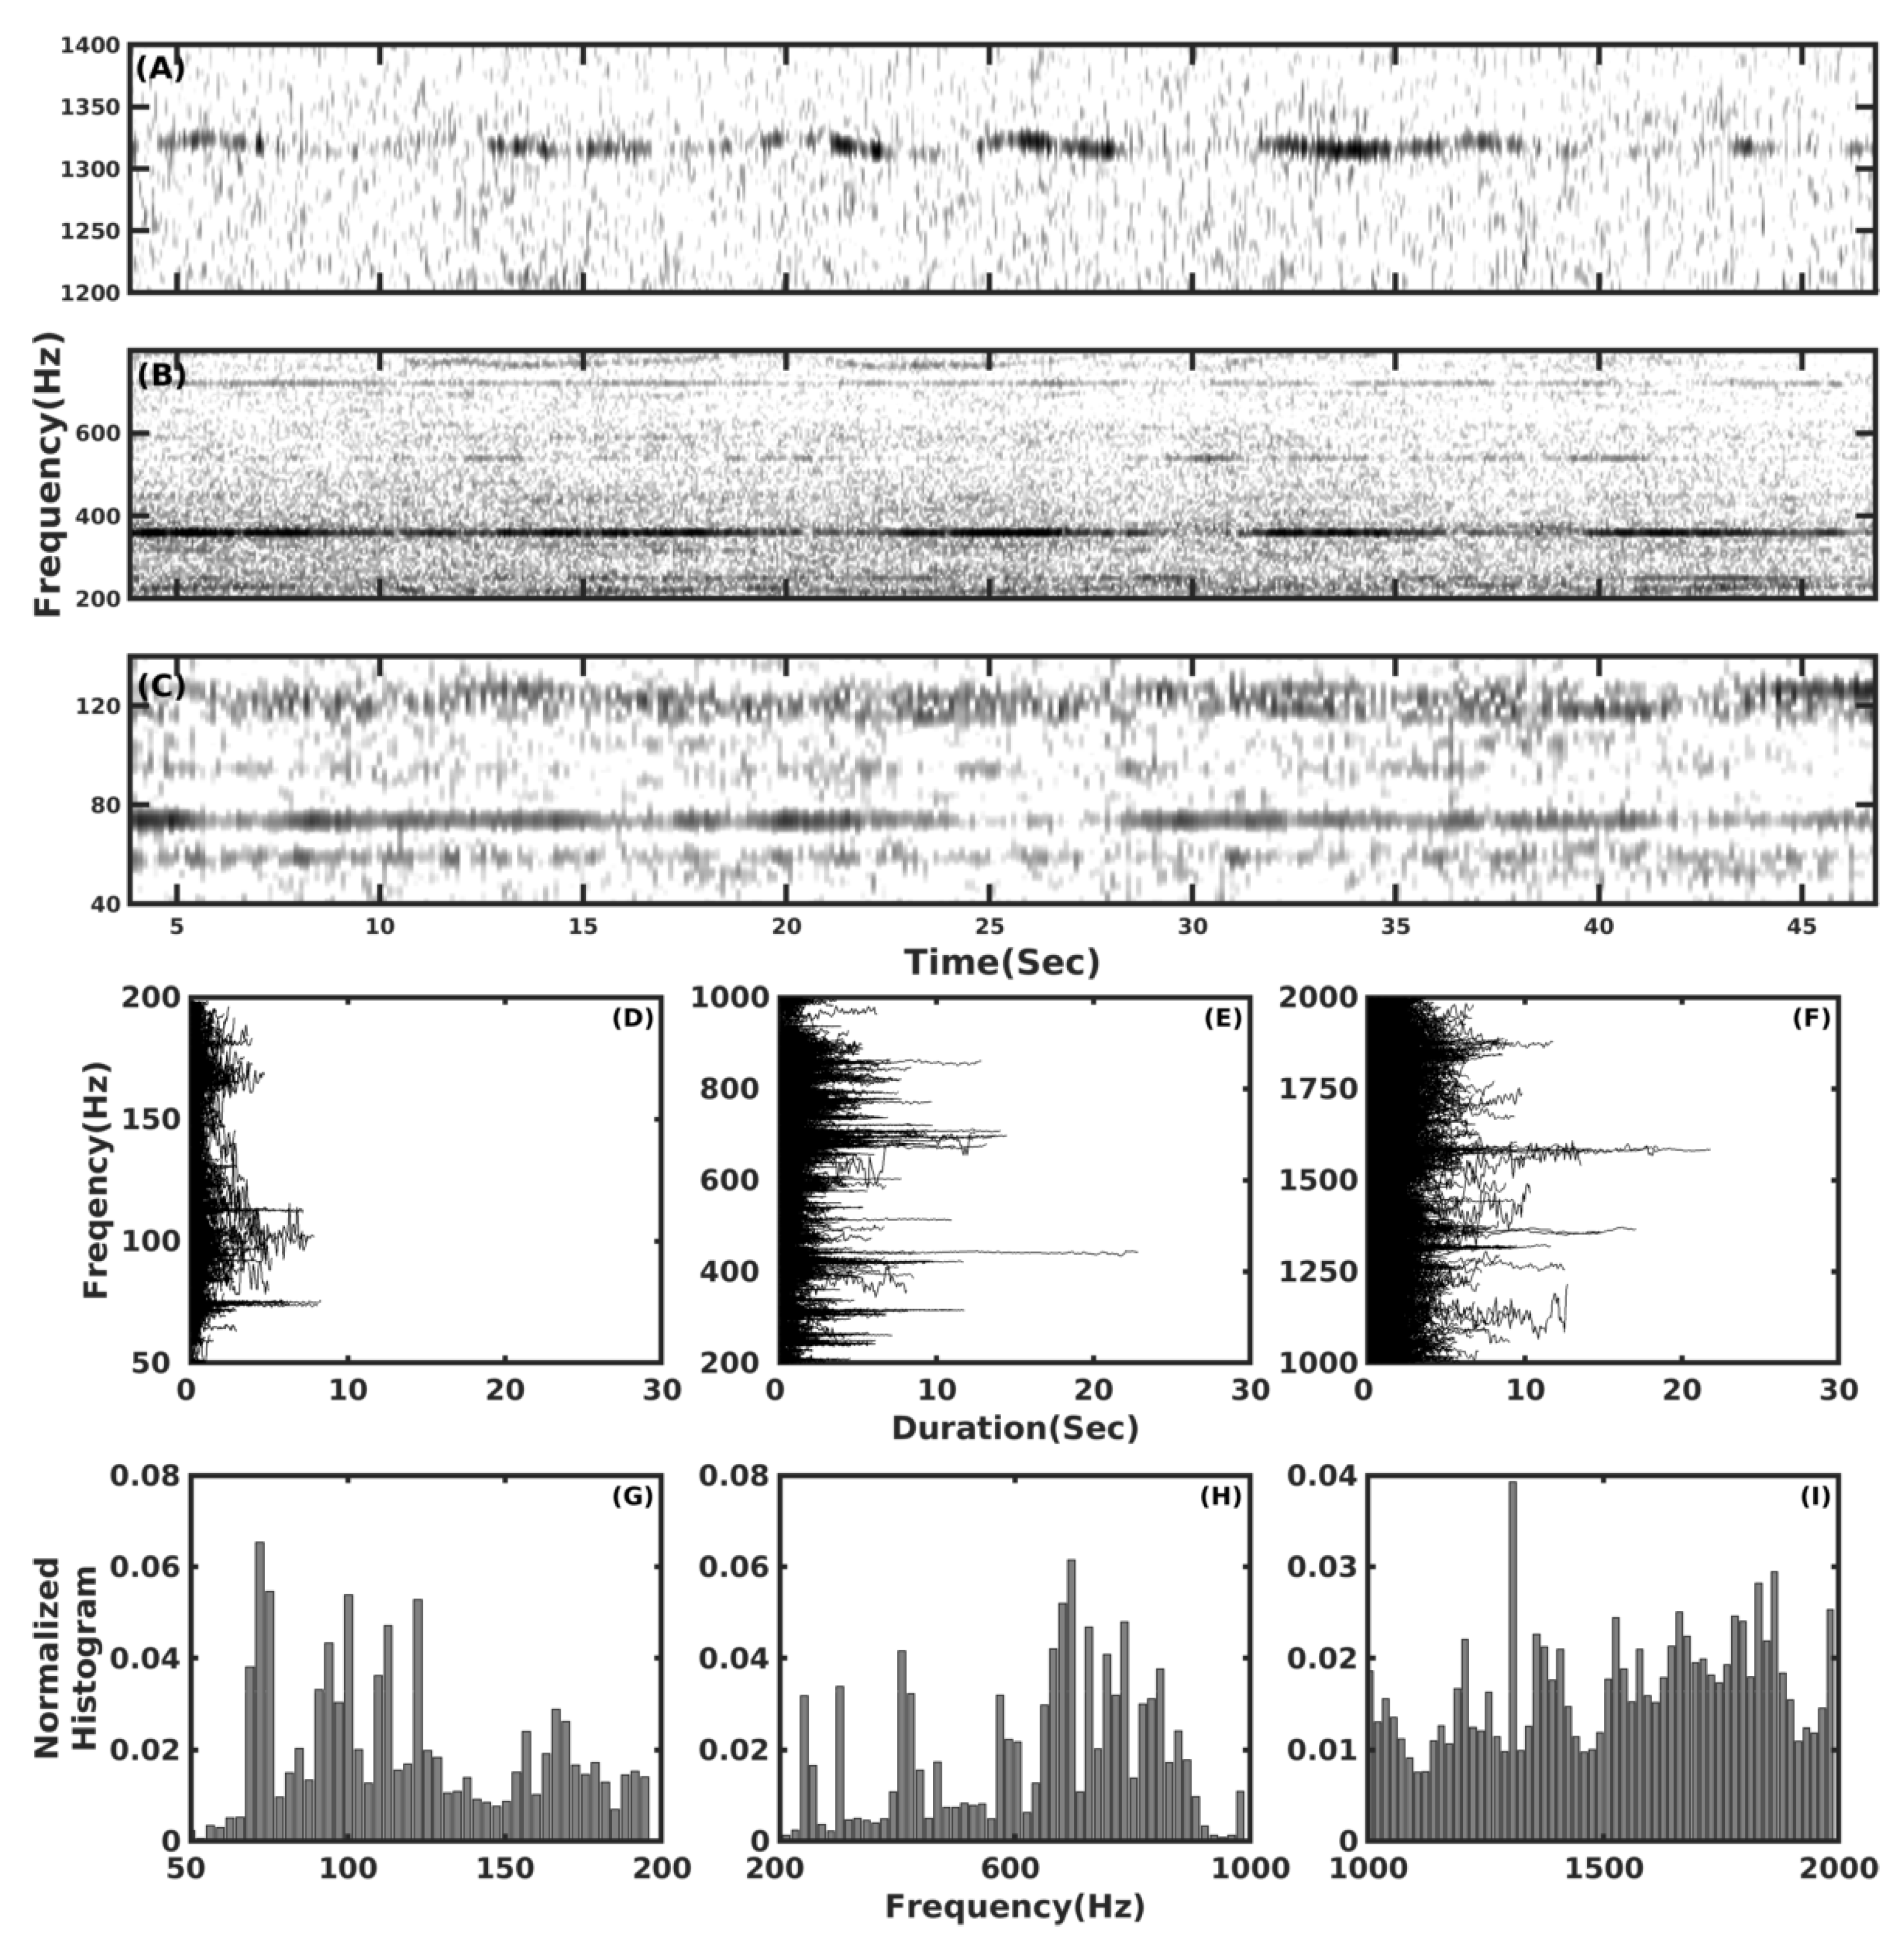
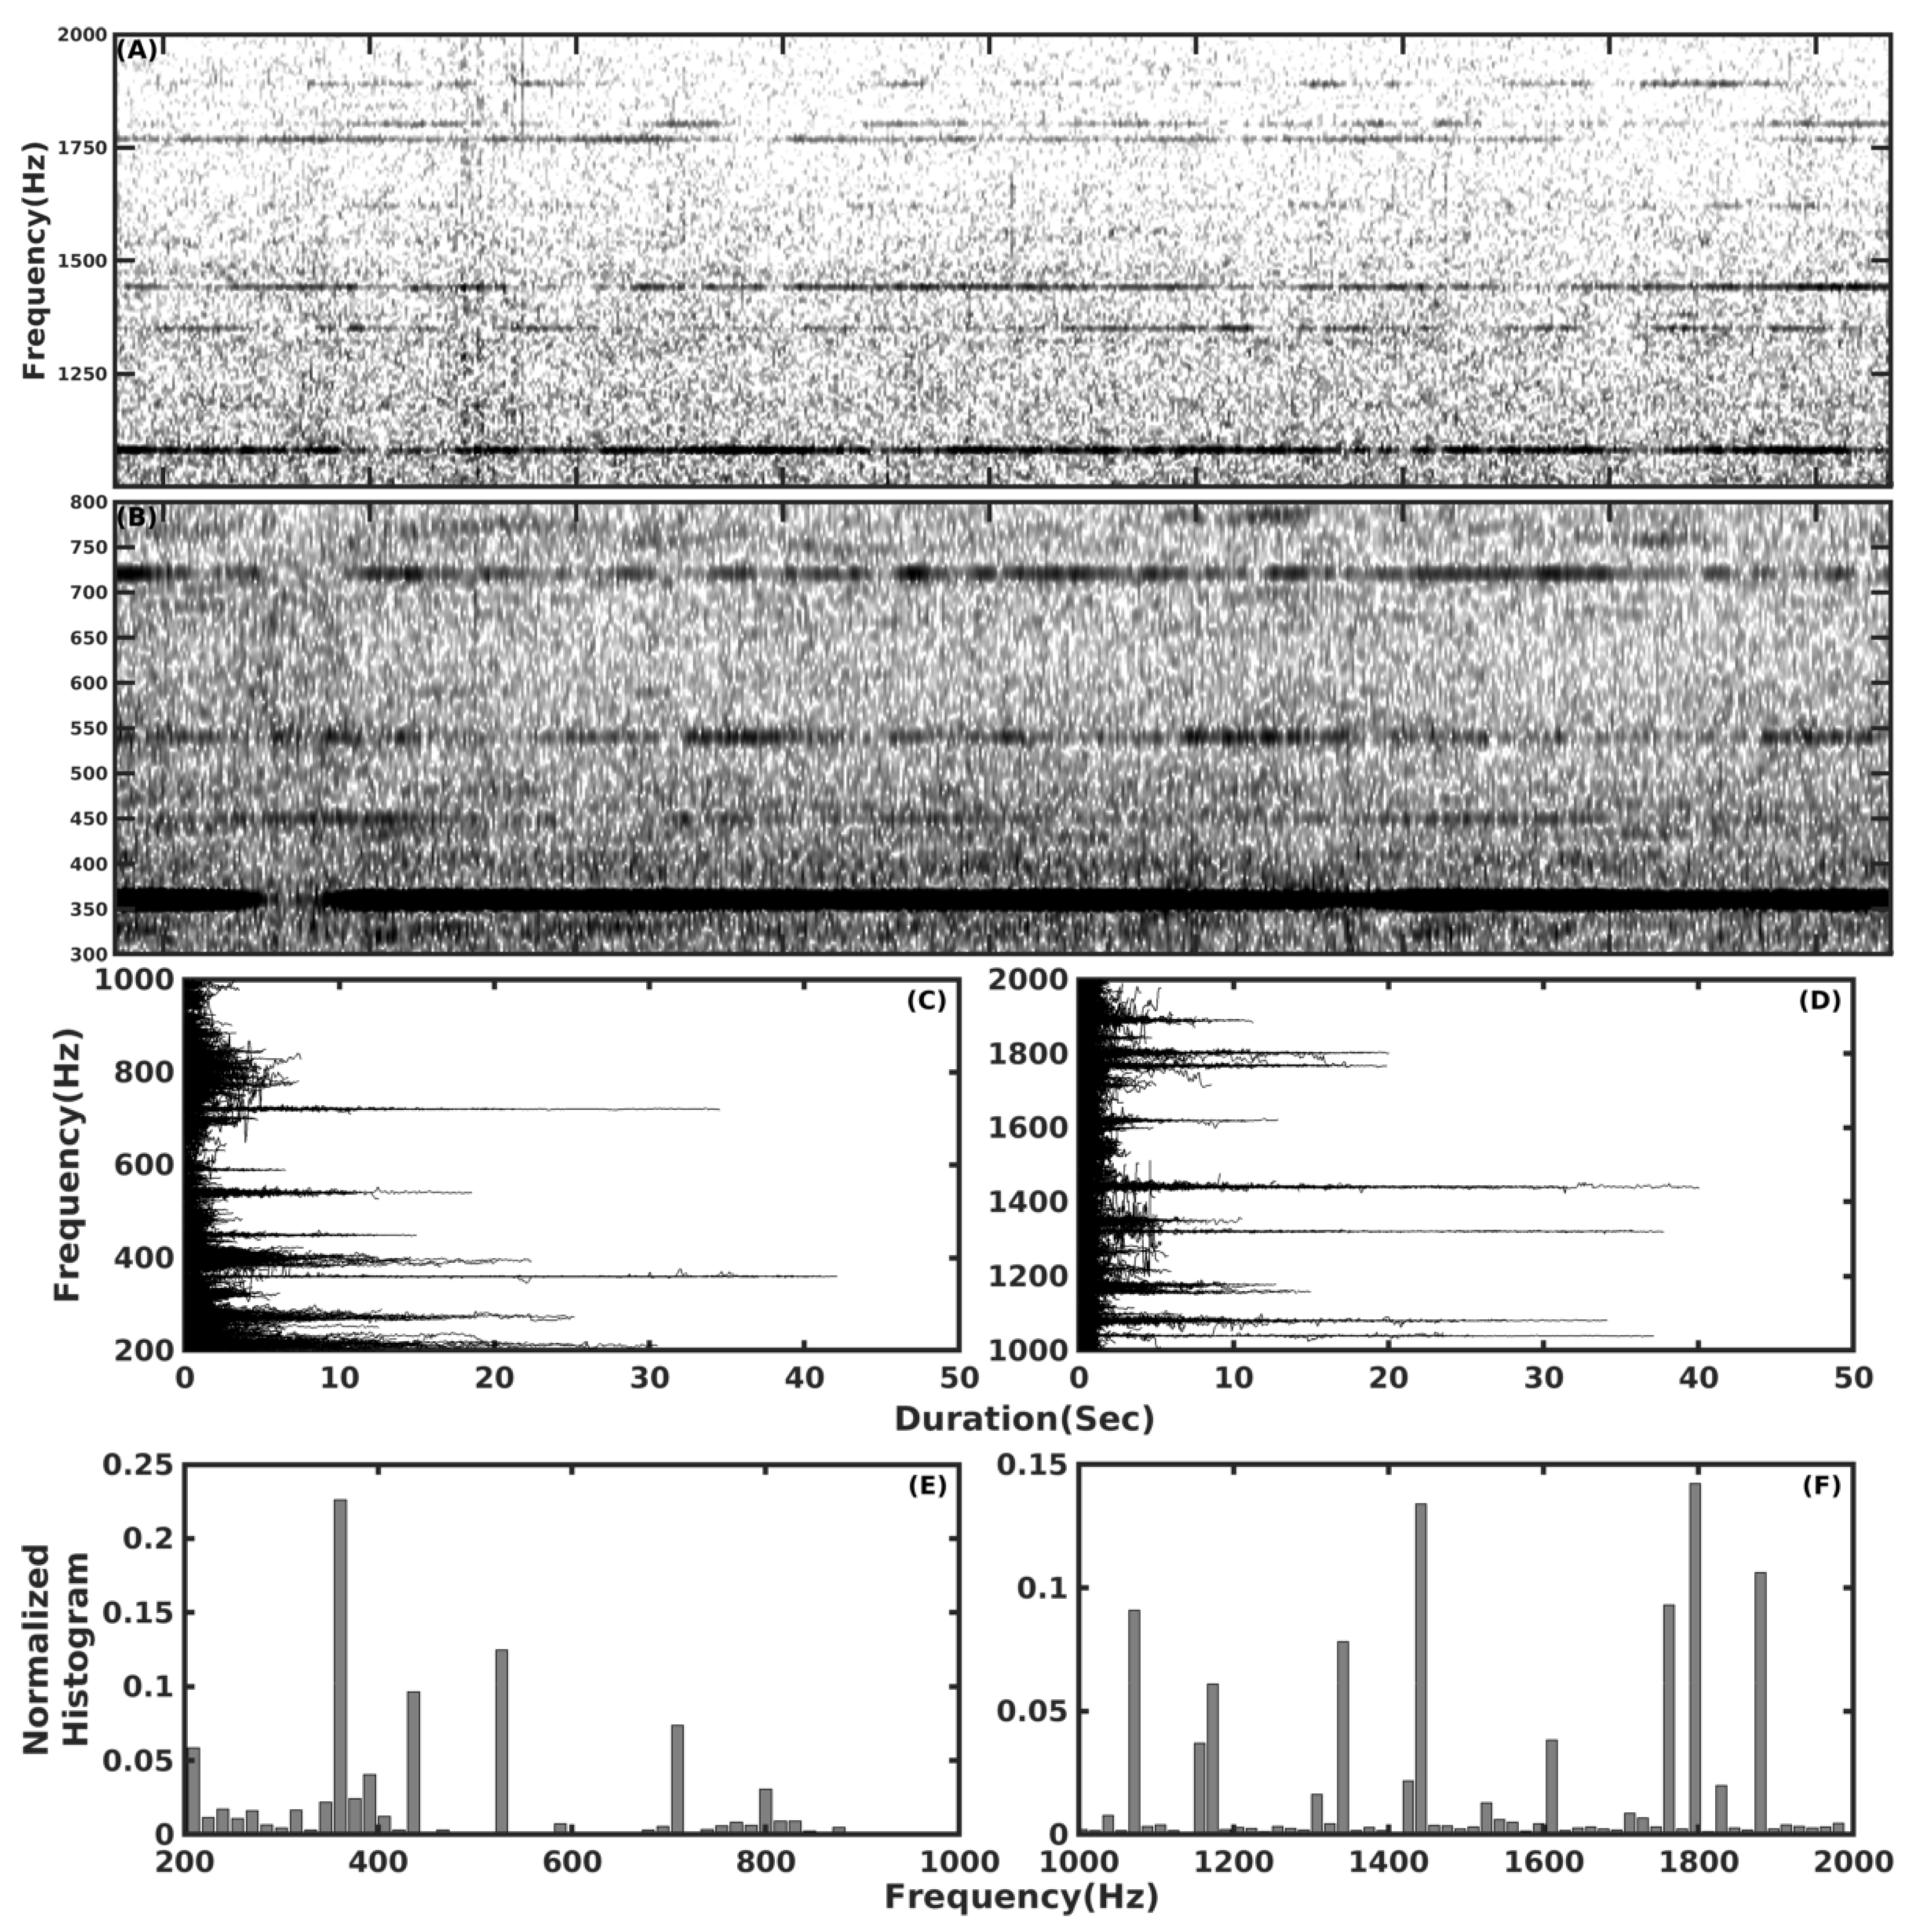
Figure 8B–D. The time-frequency characteristics of the detected signals associated with FV Fugloyhav in the three frequency subbands are shown in
Figure 9A–I. They include beamformed spectrogram examples containing key narrowband signals, ensemble of pitch tracks, as well as the histogram of mean frequency weighted by signal duration for the ship-associated detections.
The horizontal track of FV Fugloyhav in the time period from 14:19:05 to 15:09:05 GMT estimated from the bearing-time trajectory of it signal detections using the MAT technique is shown in
Figure 10, along with its true track based on GPS measurements. The estimated track of FV Fugloyhav overlaps well with the true track, but is longer than the true track in this case. The mean localization error averaged over the entire track shown is roughly 5.6% of the true range.
3.1.2. Vessels Unidentified by GPS
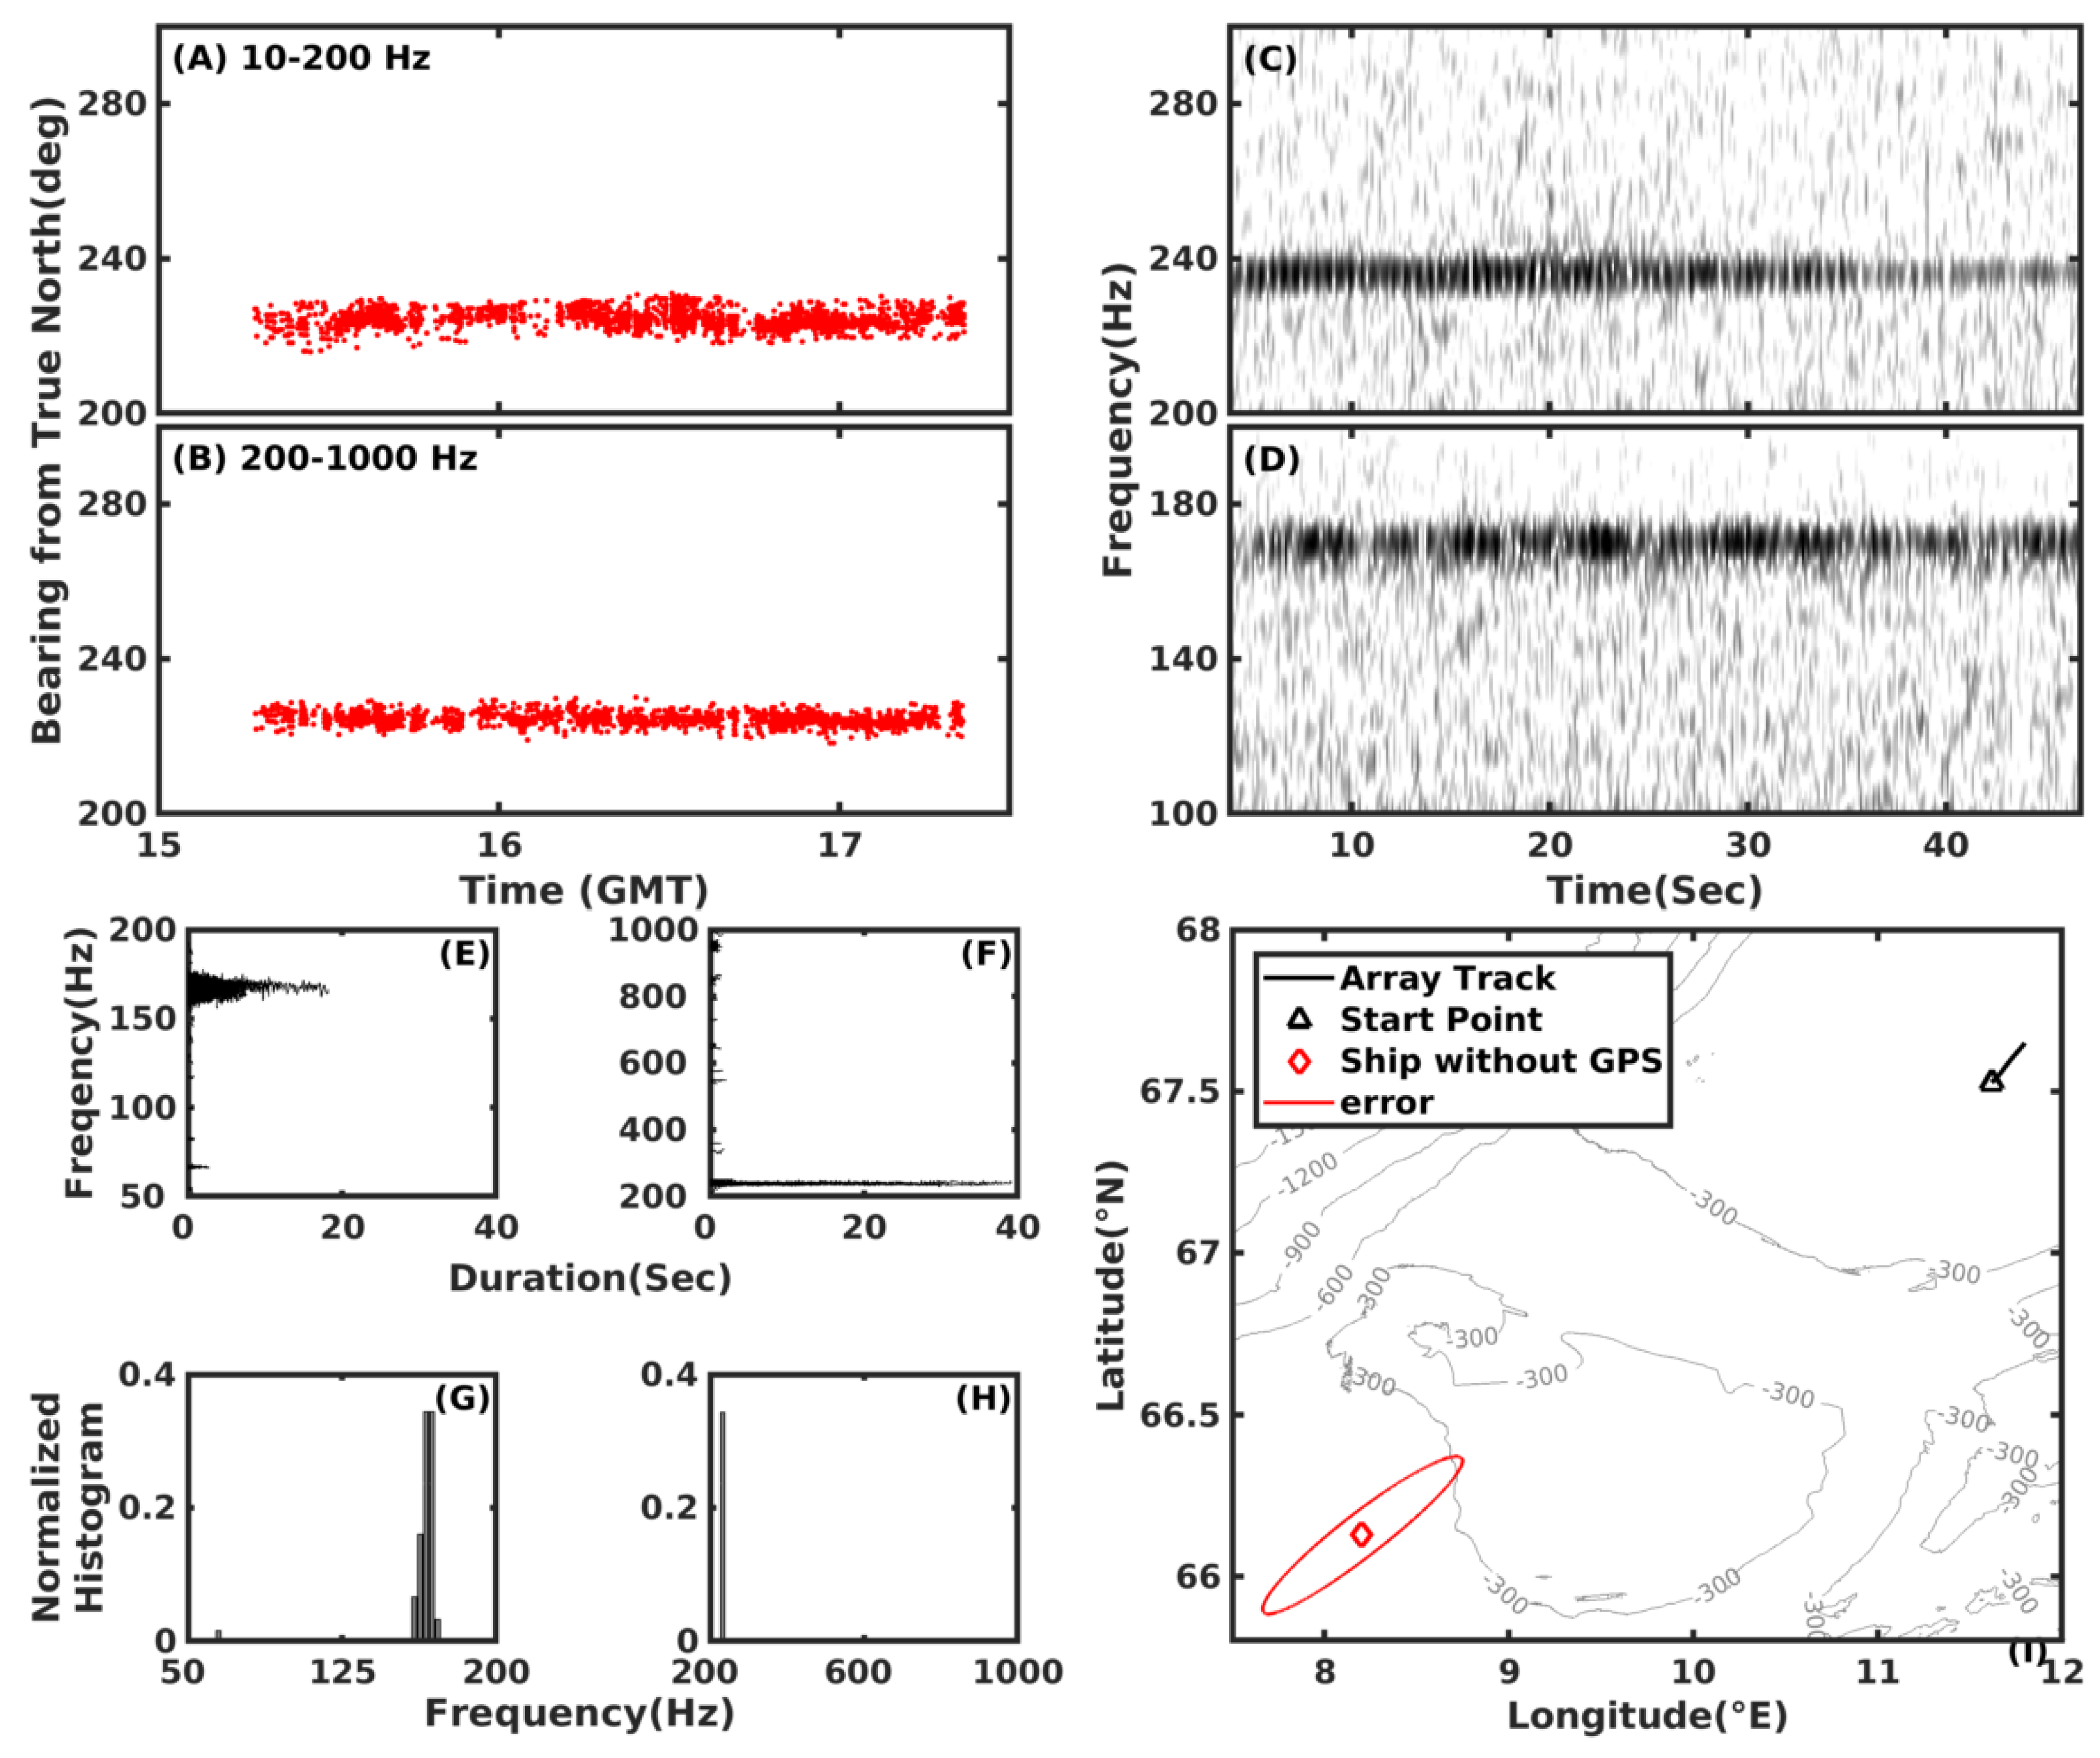
Nine of the 14 vessels detected by the coherent hydrophone array could not be identified based on the historical GPS record of ships accessible to us for that region. Here we provide more detailed results for two of the nine unidentified ships, which are labeled as vessels U3 and U2 in
Figure 2 and
Table 2, based on our analysis of the coherent hydrophone array passive acoustic data. For vessel U3, the bearing-time trajectories of signal detections and examples of beamformed spectrograms showing the detected signals are provided in
Figure 11A–D. The ensemble of pitch tracks and the histogram of mean frequency weighted by signal duration for the detections associated with vessel U3 are shown in
Figure 11E–H. There are only two strong narrowband tonals detected, which are centered at 167.3 Hz and 238.1 Hz. Since the mean bearing of signal detections is approximately constant over the two hour observation interval, and only tonals at very low frequencies <250 Hz are detected, the vessel U3 is probabaly located at very great distances from the coherent hydrophone array.
To localize vessel U3, the MAT-MMSE approach is employed to estimate its mean horizontal position and displayed in
Figure 11I, including the localization error ellipse. The estimated mean horizonal position of vessel U3 is roughly 200 km away from the coherent hydrophone array. The cross range position error, determined by the bearing estimation error, is smaller than the range estimation error which is roughly 10% of the estimated range, leading to an elliptical horizontal position estimation error about the mean. The large separation ≈200 km between vessel U3 and the coherent hydrophone array accounts for the fact that the narrowband signals detected from it have low frequencies <250 Hz. The higher frequency signals radiated by this vessel have undergone significant attenuation due to absorption losses in the oceanic waveguide that is proportional to frequency, making the high frequency tonals undetectable [
55,
56,
57].
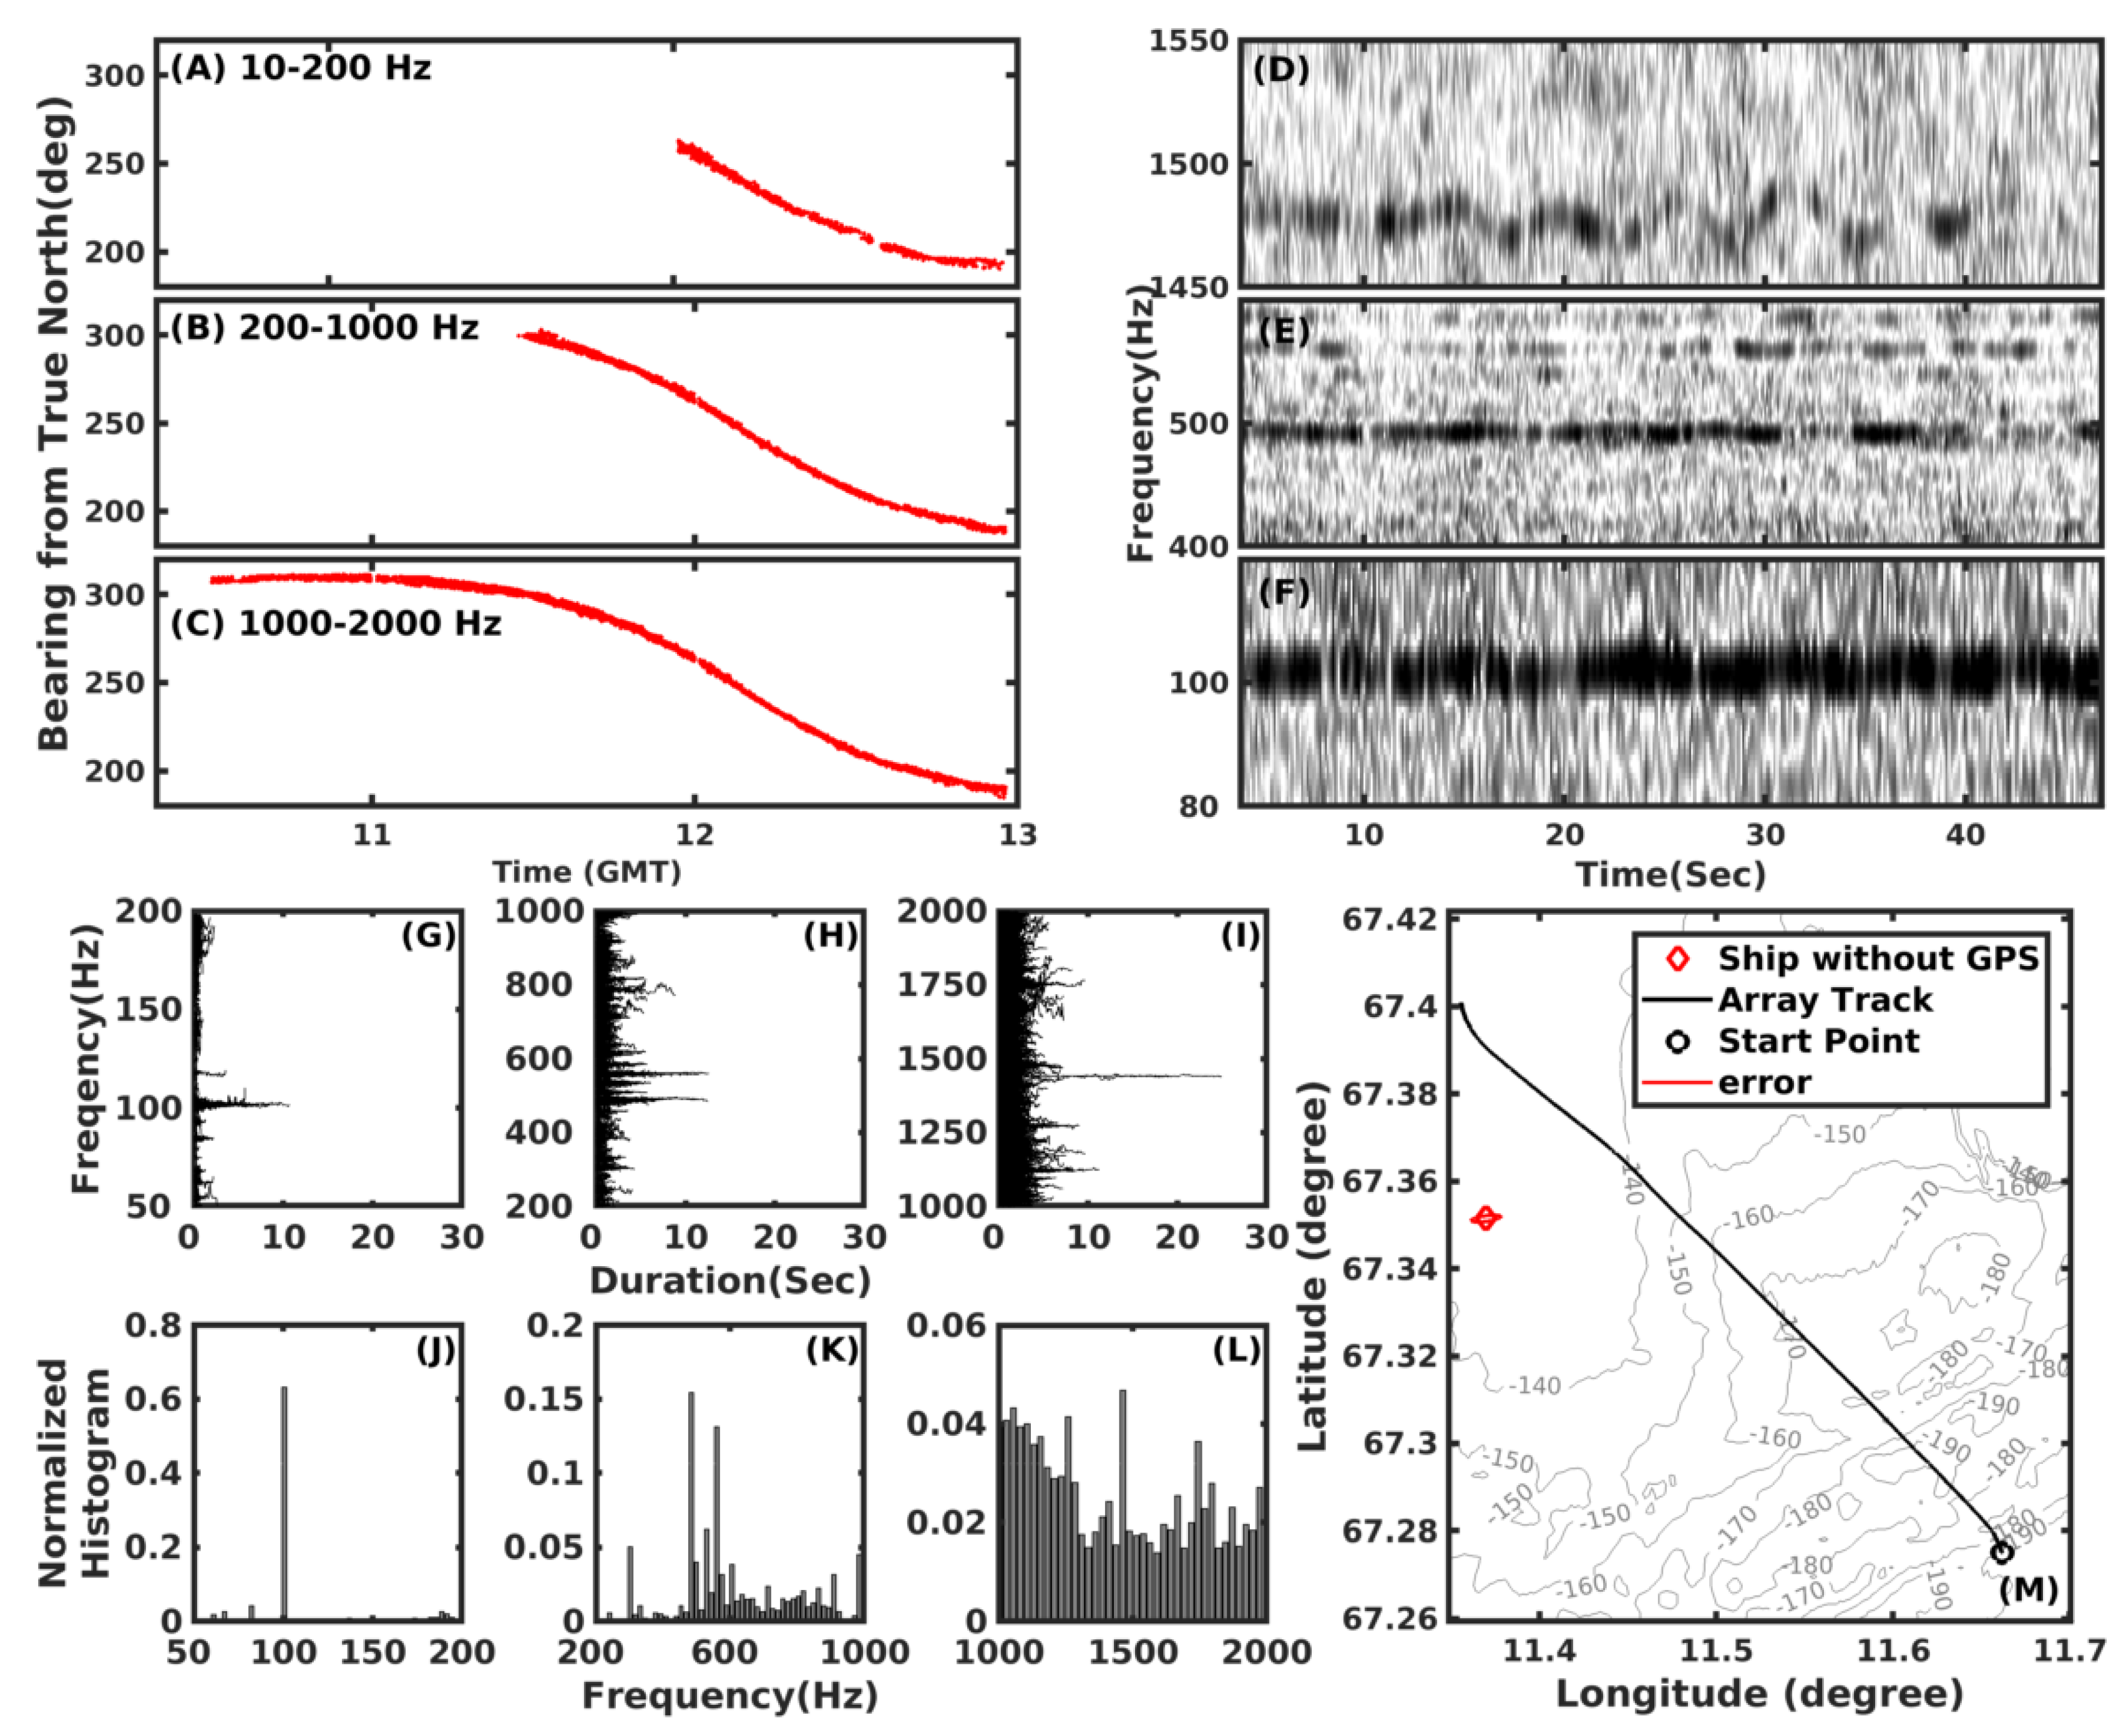
Similar analysis conducted for another unidentified vessel U2 and displayed in
Figure 12. Vessel U2 was nearby to the coherent hydrophone array since strong tonals were detected in all three frequency subbands from 10 Hz to 2000 Hz, with significant bearing variation of more than 100
over the observation time period of roughly 2.5 h. The estimated mean horizontal position of vessel U2 is shown in
Figure 12M, along with its position estimation error ellipse. The vessel U2’s estimated mean horizontal position is a couple to a few kilometers away from the coherent hydrophone array. This short range accounts for the detections of multiple narrowband signals in the broader frequency range from 10 Hz to 2000 Hz.
3.2. Simultaneous Passive Acoustic Detection and Localization of Multiple Ocean Vessels on 26 February off Northern Finnmark
Here we provide a summary of the ocean vessels detected by the coherent hydrophone array on 26 February 2014 off the Northern Finnmark region. The bearing and time of all detected acoustic signals in the 10 Hz to 2000 Hz frequency range that stand at least 5.6 dB above the local ambient background noise in the beamformed spectrograms are displayed as grey dots in
Figure 13A–C. In each of the three frequency subbands, there are once again more than 100,000 signal detections in the roughly 7.5 h observation time interval shown. In addition to sounds radiated by mechanized ocean vessels, the signal detections include marine mammal vocalizations [
1], sounds from fish and other ocean biology, as well as other either made-made or natural acoustic and seismic sources. The signal detections from the 16 vessels, shown in color, follow distinct and well-defined bearing-time trajectories. Of the 16 vessels detected using passive acoustics, 15 are identified as commercial ships by comparison with historical GPS information of ships in that region and coincident time period. Their labels and identities are provided in
Table 3. The remaining single unidentified vessel is labeled as U16 in
Figure 13C and
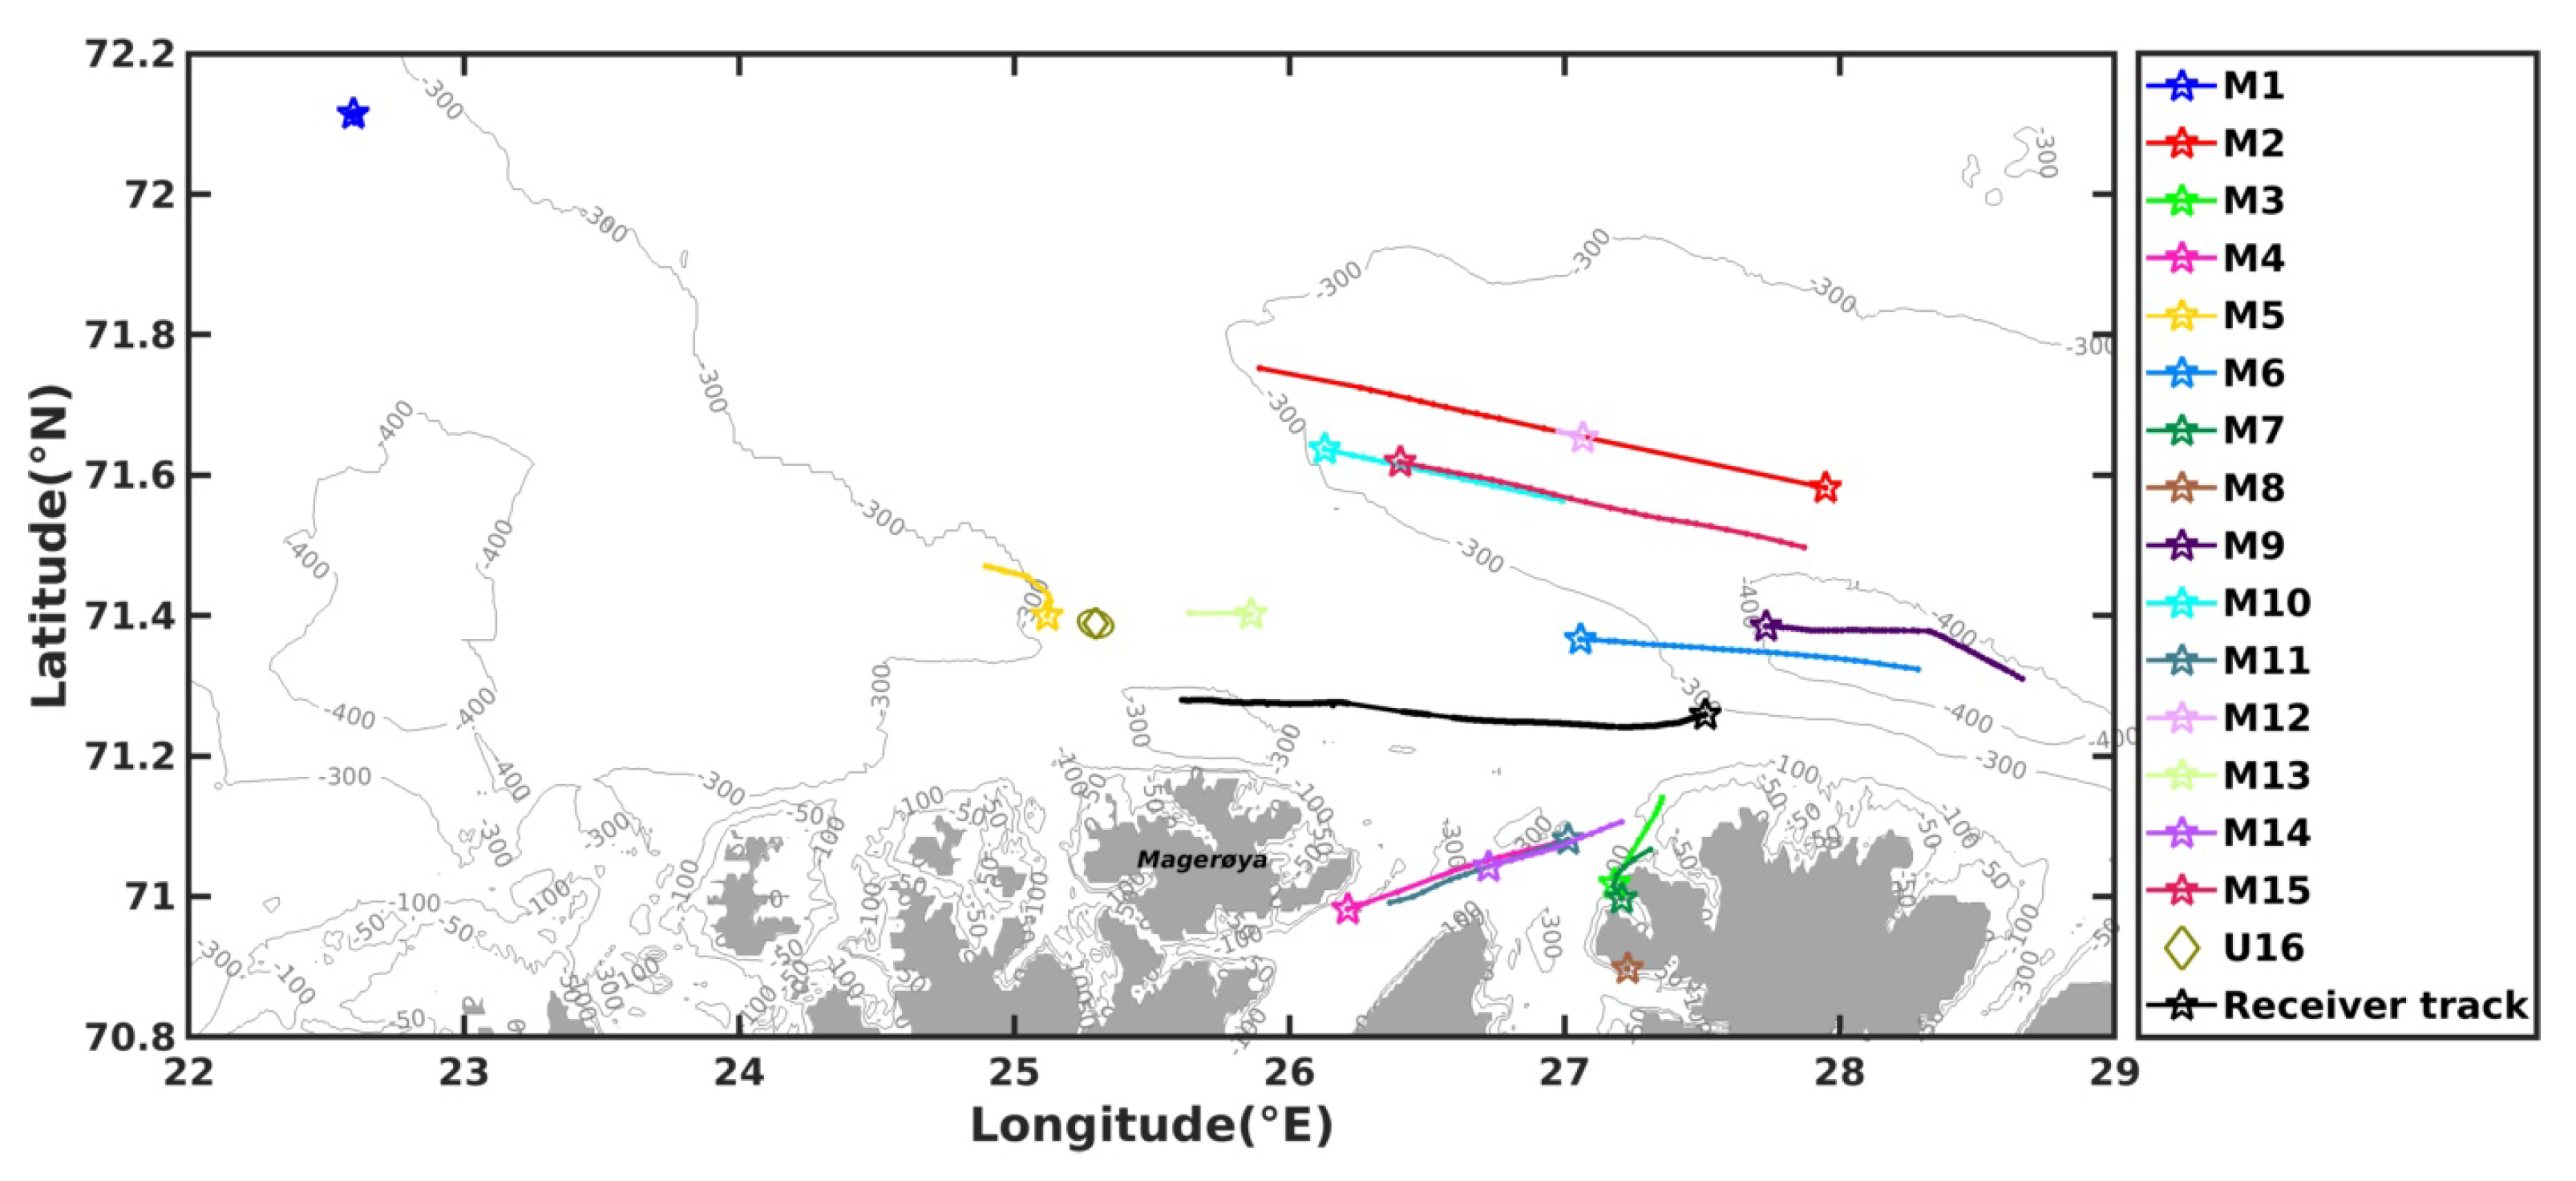
Table 4. The MAT-MMSE approach is employed to localize the single unidentified vessel and shown in
Figure 14. The GPS measured tracks are shown for the identified commercial ship and the tow ship in
Figure 14.
For each passively detected ocean vessel, the center frequency and bandwidth of the most prominent narrowband signals are provided in
Table 3 and
Table 4 for the identified commercial ships and the single unidentified vessel, respectively.
4. Discussion
Over the roughly 8 h observation interval per day for the two days analyzed here, a total of 30 mechanized ocean vessels have been identified and characterized based on acoustic recordings of its underwater radiated sound received by a coherent hydrophone array. Twenty of these vessels can be confidently identified since the bearing-time trajectories of the signal detections from these vessels and passively localized horizontal positions match well with coincident measured bearings and locations derived from historical GPS information. The GPS information from these ships is sufficiently dense to provide multiple points of bearing and location correspondence with those based on acoustic detections. The remaining 10 vessels could not be identified or confidently associated with historical GPS information. For instance, the unknown vessel U2 acoustically detected on 23 February 2014 off the Lofoten Archipelago could have been the Norwegian trawler Langoey. This is because the estimated position of vessel U2 corresponds well with the GPS measured location of trawler Langoey. However, the historical GPS position information available to us for the trawler Langoey is sparse in the time period from 09:50:00 to 13:00:00 GMT where we have significant acoustic detections. Only one measured GPS position is available in this time period and so has only one-point correspondence between the GPS derived and acoustic detection bearings. Similarly, the unknown vessel U12 could be the well stimulation vessel, Island Wellserver, again based on one point correspondence with GPS derived bearing and location as only one GPS measurement is present in the historical records during the acoustic detection time period. The vessel U12 could also be the vessel U3 because both these acoustic detections emanate at long ranges >200 km from the coherent hydrophone array and the localized positions match well (see
Figure 3). Furthermore, both these acoustic detection tracks include a low frequency tonal centered at 166-167 Hz. However, since they were detected at non-overlapping time intervals, and each has one other narrowband signal that doesn’t coincide in frequency, we assigned separate vessel labels to these acoustic detections. There are potential associations for a few of the other unidentified vessels based on bearing and localization result, but the acoustic detections and the GPS information are in mutually exclusive time periods. These potential associations include cargo ship Zapolyarye for unidentified vessel U4 and fishing vessel Almak for unidentified vessel U7 off the Lofoten archipelago.
The time-frequency characteristics of the narrowband signals radiated from each of the ocean vessels examined here and tabulated in
Table 1,
Table 2,
Table 3 and
Table 4 are based on analysis time periods of at least 30 min to over 4 h. Each ocean vessel radiates multiple dominant narrowband signals, with unique set of frequencies that can be employed to distinguish and classify the vessel [
28]. The time-frequency characteristics of the narrowband signals from the identified commercial ships and the unidentified vessels provided here can be employed for future real-time automated passive acoustic classification of these vessels. A variety of automated classification techniques [
53] such as logistic regression, decision tree [
58] and support vector machine (SVM) can employ the time-frequency characteristics of the ship radiated sound directly for classification. Other approaches, such as neural networks [
53,
59,
60,
61], can be trained using the beamformed time series or spectrogram images containing the ship radiated signals as inputs for direct classification.
In [
2], the speed and direction of a distant ship was found to change the relative level of importance of the narrowband signals, but did not significantly alter the frequencies of these signals. Doppler effects may become important for ocean vessel moving in close proximity to a receiver. Vessel activity, such as offshore piling, seismic profiling and fish trawling can lead to additional complexity in the sound field, can be accounted for after long term monitoring. The analysis of sound radiated from multiple ships presented here is expected to influence ship design [
2,
33,
62] and methods for reducing overall ship-radiated noise level and impact on biological organisms, as well as approaches for monitoring ships in ocean surveillance and shipping traffic regulation.

 ,
, 


