An Unmanned Aircraft System to Detect a Radiological Point Source Using RIMA Software Architecture
by
 , , and
Pablo Royo
1,*,† ,
,
Enric Pastor
1,†,
Miquel Macias
1,†,
Raul Cuadrado
1,†,
Cristina Barrado
1,† and
and
Arturo Vargas
2,† 1
Castelldefels School of Telecommunications and Aerospace Engineering—Technical University of Catalonia, 08860 Castelldefels, Spain
2
Institute of Energy Technologies (INTE)—Technical University of Catalonia, 08028 Barcelona, Spain
*
Author to whom correspondence should be addressed.
†
These authors contributed equally to this work.
Remote Sens. 2018, 10(11), 1712; https://doi.org/10.3390/rs10111712
Submission received: 28 September 2018
/
Revised: 22 October 2018
/
Accepted: 24 October 2018
/
Published: 30 October 2018
(This article belongs to the Special Issue Remote Sensing from Unmanned Aerial Vehicles (UAVs))
Abstract
:Unmanned Aircraft Systems (UASs), together with the miniaturisation of computers, sensors, and electronics, offer new remote sensing applications. However, there is a lack of hardware and software support to effectively develop the potential of UASs in different remote sensing applications, such as the detection of radioactive sources. This paper presents the design, development and validation of a UAS for the detection of an uncontrolled and point radioactive source. The article describes a flexible and reusable software architecture for detecting the radioactive source (NaTcO, containing Tc) with a gamma-ray Cadmium Zinc Telluride (CZT) spectrometer as a proof of concept. The UAS is equipped with multichannel air-ground communications to perform missions beyond line of sight and onboard computation to process samples in real time and thus react to any anomaly detected during the mission. An ad hoc ground control station (GCS) has also been developed for the correct interpretation of the radioactive samples taken by the UAS. Radiological spectra plots, contour mapping and waterfall plots are some of the elements used in the ad hoc GCS. The article shows the results obtained in a flight campaign performing different flights at different altitudes and speeds over the radiological source, demonstrating the viability of the system.
1. Introduction
Current Unmanned Aircraft System (UAS) technology offers feasible technical solutions for airframes, autopilots, communications and base stations [1]. The miniaturisation of computers, sensors and electronics allows new remote sensing applications to be offered. As a result, UASs are slowly becoming efficient platforms that can be applied to scientific/commercial remote sensing applications [2,3,4,5,6,7]. Even remote sensing in dangerous situations is now seen as possible because the human factor onboard the airborne platform is no longer present. This is the case of radiological incidents; UASs are suitable platforms since they allow us to obtain a mapping of a contaminated area without risking any human life. In addition, a UAS allows radiological measures to be carried out in areas of difficult access where people and vehicles could not access. In addition, a UAS allows measurements to be made quickly compared to walk measurements. Moreover, compared to measurements with manned helicopters, a UAS has much better spatial resolution.
In the framework of the European Metrology Programme for Innovation and Research (EMPIR) (EMPIR, https://msu.euramet.org/calls.html), the European project “Metrology for mobile detection of ionising radiation following a nuclear or radiological incident” (Preparedness, http://www.preparedness-empir.eu/) started on 1 August 2017, lasting three years. Within the framework of this project, one of the main objectives (WP1) is to develop unmanned aerial detection systems installed on aerial vehicles for the remote measurement of dose rates and radioactivity concentrations. The work presented in this paper is in the framework of WP1.
Flying a UAS is, up to a certain point, an easy task. Operating a remote sensing mission with a UAS may require many other assets on the ground and in the air to fulfil specific data collection objectives. To perform remote sensing operations, we have designed and implemented a flexible and reusable software architecture called RPAS Mission Management Architecture (RIMA). RIMA is the set of available software components running on top of a middleware to give support to most types of UAS civil missions. Functionalities like enhanced flight plans, air-ground communications, a mission control engine, data storage, onboard computation, autopilot management, etc. are offered.
This work describes the development and validation of UASs for the remote measurement of dose rates and radioactivity concentrations. The UAS provides an early indication of affected areas and quick and appropriate countermeasures, identifying possible stolen or lost radioactive sources. At present, these uncontrolled radiation sources are being detected using people on foot, land vehicles, manned aircraft or with sensors distributed on the ground. The UAS offers added value in terms of safety, cost and efficiency. For the search and detection of radioactive sources, we propose the use of two types of unmanned platforms: multi-rotors and helicopters. The proof of concept tests have been carried out with a multi-rotor. However, in a more realistic scenario, it is necessary to use platforms with more flight endurance. Therefore, we have developed the ARES unmanned helicopter (see [8,9] for more details). A rotary wing vehicle allows Vertical Take-Off and Landing (VTOL) operations, can hover, flies at slower speeds and is more manoeuvrable than fixed-wings. All of these features are highly useful for searching for low activity radioactive sources.
The use of UASs in the detection and location of radioactive sources is not new in the literature. MacFarlane et al. in [10] presented a new system for the detection and assessment of radionuclide contamination in the environment, using a small multi-rotor UAS, a microcontroller, a LIDAR and a GPS module. This system, which is capable of transmitting in real time the georeferenced radiation measurements, was used by Martin et al. in different studies over recent years. Martin et al. in [11] used the UAS carrying an integrated gamma radiation mapping unit to characterize radiologically a single legacy mining site. In addition in [12], Martin et al. used the same platform to produce a resolution map of contamination in three different locations near Fukushima. In 2016, Martin et al. realized another study implementing a LIDAR on the platform and generating a 3D point cloud of a Fukushima area with a rendered contamination map (see [13]). The last work presented by Martin et al. in 2016 showed a trial deployment of a UAS equipped with a lightweight radiation detection system on nuclear licenced sites (see [14]), where the number of geo-referenced counts per second were stored using an accurate GPS system and an external laser altimeter to display a contour map of the studied areas. All of these studies from MacFarlane and Martin proved the feasibility of using UASs to find radioactive sources at low speed and low altitude. Additionally, from these works, we can extract the success of installing a laser altimeter on the platform and using contour maps in the GCS. Jacoppo Aleotti et al. in [15] integrated a compact light CZT-based gamma ray detector on a commercially available UAS, implementing haptic teleoperation and using a 5 GHz Wi-Fi channel to transmit all the information to the ground station. This haptic teleoperation helped the operator to fly towards the direction of the maximum count rate and find the radioactive source. Carina Cai et al. in [16] developed UAS prototype radiation detection and mapping to safely identify irradiated areas in the event of a nuclear emergency, using two different channels to transmit video and position information through a 5.8 GHz Wi-Fi channel and LTE, respectively. Daniel Behnke et al. in [17] developed and validated a wide-area deployment of unmanned ground and aerial vehicles acting as an autonomous sensor swarm for the detection of radiological and nuclear material, by means of an ad hoc wireless communication infrastructure based on LTE and Wi-Fi channels. This study enabled a nearly fully-automated unmanned vehicle operation. One of the most recent works is the one presented by Bai Li et al. in [18] where a multi-rotor platform is proposed to automatically search uncontrolled radioactive sources, using Bluetooth and Wi-Fi networks to transmit all the data. Results showed three different algorithms to find these radioactive sources.
We have taken into account all these previous works to add to our architecture the software components needed to achieve the detection of a radiological point source. Besides the interesting functionalities found in the literature, we have added some more to our system. We believe that it is very interesting to use waterfall plots to represent radioactive spectra on the UAS ground control station. The use of waterfall plots in the field of radioactivity metrology with mobile detectors is common; however, we have not found this functionality in UAS ground stations. In addition, it is essential to have the possibility of configuring the contour map parameters. For instance, we can configure a threshold in the count rate in order to consider only counts over the background that improve visualization. We can also configure a maximum count rate in order to eliminate possible electronic noise in the detection system. This electronic noise can also be eliminated by including a threshold in a channel in order not to consider counts lower than this channel, as electronic noise is commonly in the low energy range. We have also observed the extended use in the commercial software of the ISO N42.42 format files for the measured pulse height spectra provided by the spectrometric detectors. Therefore, we have to be able to export the results of the flights to this file format. It is also crucial to add not only the position of where the spectra have been taken but also the entire attitude of the aircraft. Finally, we need the capacity to modify the flight plan of the aircraft in real time to re-analyse areas at a lower altitude and speed to corroborate the position of the point source.
To validate the system, we have performed flight tests over a point radiological source. The source used in the experimental campaign is a liquid solution of sodium pertechnetate (NaTcO, containing Tc). The aerial operation was carried out in two phases: A first phase where the UAS performs a scan pattern at a certain height and speed to cover the largest area possible. Then, a second phase where the UAS semi-autonomously performs a scan pattern at a lower height and speed in those areas where an anomaly has been detected. We say semi-autonomous because the UAS can calculate waypoints on its own under a given area (see [19] for more details), but it is always the GCS supervisor in charge who decides how to continue the mission. The source location, contour mapping, and the source activity obtained in flights will be provided in the results section. Once the activity of the source is calculated, then the radiological dose can be easily calculated.
Next, we will describe the hardware and software architectures used to detect a point source. In Section 2, we will present the materials and methods used to perform the UAS mission. The paper ends by discussing the results obtained in the flight campaigns and the conclusions derived.
2. Materials and Methods
This section introduces the hardware and software architecture developed to detect a radiological point source. We will place particular emphasis on the developments explicitly made for this application.
2.1. Hardware Architecture
Figure 1 shows a block diagram with the components that make up the system and their interactions. Basically, we have the air and the ground side. In the air side, we see that the flight control unit used is a Pixhawk [20,21]. Pixhawk is an open hardware project which provides autopilot hardware designs available to the academic, amateur and developer communities. Pixhawk supports both PX4 [22] and ArduPilot [23] as flight stacks. In our case, the combination used is the Pixhawk 1 board with Ardupilot flight stack.
The Pixhawk has connected, through an I2C port, an altimeter laser; specifically the SF11/C model from the manufacturer Lightware (Gauteng, South Africa) [24]. The autopilot uses a laser altimeter to obtain the height with high precision and rate and to navigate following the orography of the terrain. The SF11/C model is a long range (120 m), fast update rate (20 readings per second), lightweight (35 g) laser altimeter designed specifically for use on UASs with ±0.1 m accuracy. In addition, to know the position and direction of the aircraft, the flight control unit has a GPS module and a compass connected. In our case, the model is the new Ublox Neo-M8N GPS module that includes a HMC5883L digital compass, both integrated into the same device but with two different connectors. The GPS is connected to the flight control unit using a UART, and the compass is connected using the I2C port.
Finally, the flight control unit is connected to the 433 MHz telemetry radio and 2.4 GHz telecontroller receiver. The telemetry radio establishes a telemetry connection between the aircraft and a ground control station, in this case the mission planner [25]. The mission planner is software installed on a PC on the ground, which allows us to monitor the flight and manage the operation. The 2.4 GHz telecontroller receiver provides direct manual control of the aircraft by the backup pilot if required.
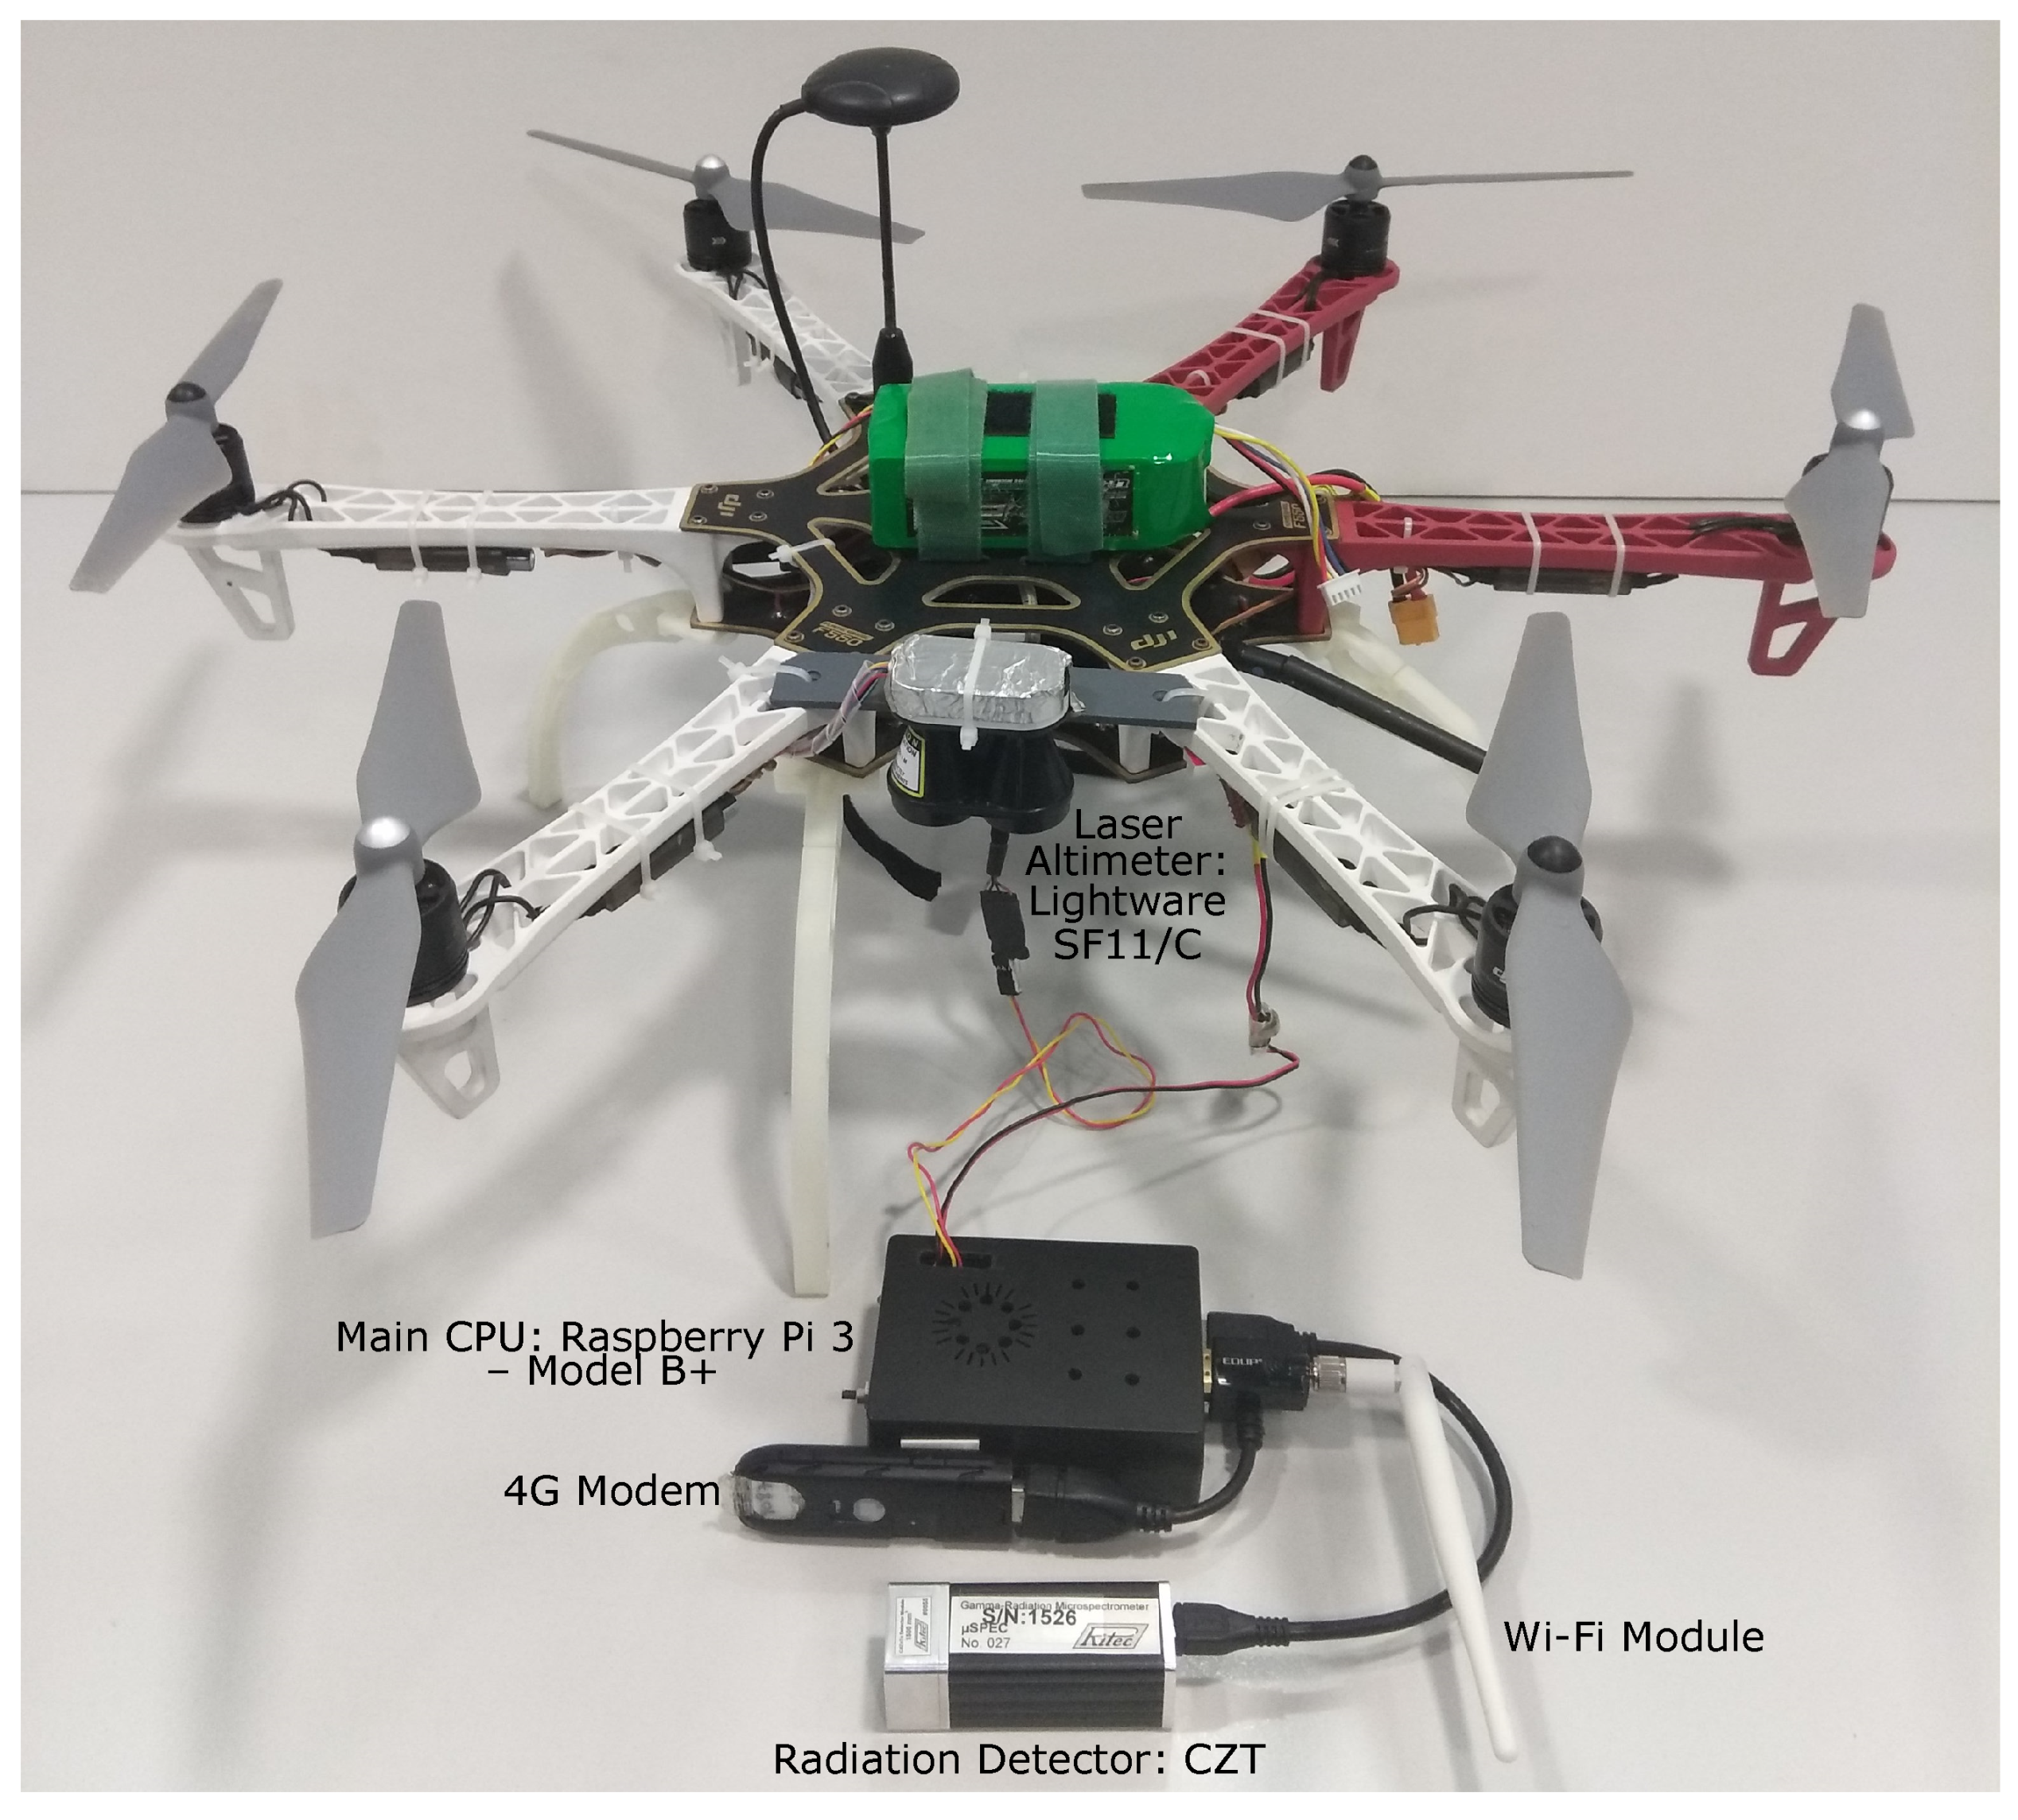
Regarding the payload, we have added the following components to carry out the search for a point radioactive source. First, we added an onboard main computer, specifically a Raspberry Pi 3 Model B+ [26]. This computer is excellent for prototyping due to its low weight, large number of ports for connecting devices and large support community. The Raspberry Pi 3 Model B+ has an ARM Cortex-A53 with 1.4 GHz and 1 GB SRAM. The board also has 2.4 GHz and 5 GHz IEEE 802.11.b/g/n/ac wireless LAN, Bluetooth 4.2, four USB 2.0 ports, Gigabit Ethernet over USB 2.0 and extended 40-pin General-Purpose Input/Output (GPIO) header. Connected to Raspberry Pi, through UART, is the Gamma-Radiation Micro spectrometer uSPEC from the manufacturer Ritec [27] (Riga, Latvia). The detector is a very compact high-performance device with changeable Cadmium Zinc Telluride (CdZnTe) detection modules. The air-ground communication with the onboard computer could be performed through private radio networks using serial radio modems for low throughput and low latency communications, while high throughput short-range communications could be performed through the Wi-Fi network by means of an IEEE 802.11 compatible board. For high/medium throughput and long-range communications, a 3G/4G compatible modem which provides connectivity to the internet is used. The 4G module attached to the onboard computer by USB is the 4G ZTE MF823 modem.
Using 3G/4G technologies allows us to measure radioactivity, without getting close, wherever the aircraft has coverage, no matter where the GCS is located. This is because, in addition to the spectra, we are able to send UAS navigation commands using 3G/4G. In the event of a disaster, it is possible that we will not have 3G/4G communications and therefore we will have to use other technologies such as private radio networks. The use of private radio networks using serial radio modems allows a range of a few km; the communication range depends on using a tracker antenna and antennas with a certain gain, and increasing the transmission power used.
2.1.1. Laser Altimeter
The laser altimeter allows the flight control unit to calculate extremely accurate Above Ground Level (AGL) altitude and also the rate of descent (by monitoring the altitude variation over time). Due to inaccurate GPS-INS measurements, especially in the vertical profile, accurate AGL values are fundamental for auto-landing operations and are also very useful for the correct geolocation of the remote sensed objects of interest such as the radiological point source. In addition, the accurate AGL is needed to calculate the activity of the radioactive source.
For the laser altimeter to work correctly, certain parameters must be configured (see Table 1).
- Zero datum offset: It sets the distance from the mounting point to the initial measurement point.
- Measuring mode: Quick response for low and off-water flights and long-range mode, to fly over water or at altitudes above 50 m.
- Median filter: It can be tuned to smooth the reading changes due to small rocks or bushes using Median filter and Median filter size parameters.
Some Pixhawk parameters must be modified to operate with a laser altimeter as a primary altitude source. First, SERIAL4_PROTOCOL specifies which protocol is needed, depending on the device used. Then, serial speed should be set to the specific value desired by the altimeter (the same as the Serial baud rate parameter) to enable proper communication, thus in the SERIAL4_BAUD parameter. Reading characteristics of the altimeter also have to be set in parameters called: RNGFND_TYPE, RNGFND_SCALING, RNGFND_MIN_CM, RNGFND_MAX_CM, and RNGFND_GNDCLEAR. These parameters define the altimeter brand, relationship between readings and real distances, minimum and maximum scale readings and the distance (in cm) from the mounting point of the altimeter to the starting point of measurements (same as Zero datum offset), respectively. All these parameter values have been selected to fulfil the chosen altimeter characteristics.
Parameters regarding extended Kalman filter (EKF) algorithm behaviour must be set up properly. In Pixhawk, which EKF works as primary, it is set using AHRS_EKF_USE and AHRS_EKF_TYPE. In addition, EK2_ALT_SOURCE must be changed to declare that the GPS altitude will be used over some percentage, specified in EK2_RNG_USE_HGT, of the laser altimeter maximum reading (see RNGFND_MAX_CM). In other words, the laser altimeter can be used as the primary height source below 84 m.
The EK2_GPS_TYPE controls the use of the GPS measurements. A value of 0 means that we use 3D velocity and 2D position. Finally, EK2_ALT_M_NSE and EK2_RNG_M_NSE can be adapted to prioritize laser altimeter readings and almost avoid barometric ones. These two last parameters have been adapted after performing some flight tests, to improve the flying behaviour of the UAV platform. All the values used in flights are shown in Table 1.
2.1.2. DJI F550 Airframe
The F550 is an almost-ready-to-fly (ARF) platform hex-rotor aircraft released by DJI (Shenzhen, China) [28]. The aircraft has a diagonal wheelbase of 550 mm and a take-off weight between 1200 g and 2400 g. The F550 ARF kit is equipped with 960 KV motors, specifically the model DJI 2314E. The propellers used are 9.4 inches in diameter and 5 inches in pitch. The electronic speed control (ESC) is the model 420 LITE with 20 A as the maximum allowable current, compatible with 3-cell and 4-cell batteries (see Figure 2). Using this setup and the components described in the previous section, the UAS achieves a flight time of approximately 10 min with a 4-cell and 10,400 mAh battery.
2.1.3. Radiation Detector
In order to select a detector to be mounted in a drone, there are several basic features that should be taken into account. One of the most important is the weight of the complete detector system; indeed, for the multi-rotor F550 with a low payload capacity used in the experimental campaign, the weight should be minimized. Another important feature is the robustness of the system. Sensitivity and energy resolution are the other important parameters related to an efficient measurement. Therefore, the selected detector is based on a semiconductor crystal of Cadmium Zinc Telluride (CdZnTe), which also includes the charge sensitive preamplifier, main amplifier, digital signal processor, high and low voltage power supplies and computer interface, all in a compact housing. It is communicated and powered from the main computer via a USB port and the maximum consumption is 100 mA (4.5–5.25 V). The selected model is the µSPEC1500 of 1500 cm volume, which is the biggest size provided by the company Ritec (Riga, Latvia).The dimensions of the detection system are 25 mm × 25 mm × 72 mm with a weight of 80 g. A good resolution of less than 3.5% is achieved by this detector which is much better than the typical NaI scintillator detectors that have a resolution of around 7% [29]. Another advantage of the semiconductor detector compared to the scintillator is that the semiconductor is almost not sensitive to temperature fluctuations, in contrast to the scintillator that has a significant channel shift in the energy calibration response. The energy range of the detected gammas is from 20 keV to 3.0 MeV, which includes both the main natural and artificial energies in case of a nuclear or radiological accident.
2.1.4. Point Radiological Source
The source used in the experimental campaign is a liquid solution of sodium pertechnetate (NaTcO, containing Tc), commonly used in nuclear medicine by hospitals, in a small Eppendorf vial. The activity of the source was 9.47 MBq at 8:30 a.m., which is lower than the activity limit for an exempt threshold of 10 MBq [30]. Exemption values are appropriate levels of risk below which regulation is either not necessary or can be “light touch”.
This source is convenient for use in such test experimental campaigns because it is exempted material according to radiological protection regulations. The Tc source has an emission gamma probability of 0.89 s per Bq with an energy of 140.5 keV.
The half-life (T) of Tc, the time required for the activity of the source to reduce to half its initial value, is 6.00072 h. Therefore, the activity during the measurement campaign is calculated with the following equation in order to consider this fast decay of the source:
The fluence rate at a point () in cm s is defined as the total number of particles incident on a small sphere of cross-sectional area per unit time and can be calculated with the following expression:
where
- A is the activity of the source in Bq,
- is the gamma emission yield for Tc energy of 140.5 keV: 0.89 s Bq,
- d is the distance of the source in cm,
- is the mass attenuation coefficient in air for Tc energy of 140.5 keV: 0.134 cm/g,
- is the air density: 1.2 × 10 g/cm
The fluence rate can be also calculated from the net counts per second (cps) detected with the following equation:
where is total counts in the photopeak, is background (The background is the spectra adquired when the source to be measured is not present.) counts in the photopeak region, t is acquisition time in seconds, and is the full-energy peak efficiency per incident fluence rate in cm for the mentioned energy, which is calculated using Equation (4):
where p is the detection probability per incident gamma photon for a monoenergetic parallel beam of 140.5 keV and surface area S. A common method to determine the efficiency () is by the use of Monte Carlo simulations. Monoenergetic parallel gamma beams incident to the detector were simulated using the software package PENELOPE/penEasy (v2015-05-30, https://inte.upc.edu/en/downloads/peneasy) [31]. The software provides the detection probability per emitted gamma of the parallel beam.
Knowing the net cps and the distance of the source, the activity in Bq is estimated by equalling Equations (2) and (3):
We will use all formulations to calculate the activity of the source, using the cps detected during the different flights performed. The results of these flights will be illustrated in Section 3.
2.2. Software Architecture: RPAS Mission Management Architecture (RIMA)
Orchestrating all the aircraft components described above to perform a semi-autonomous mission efficiently is no easy task. In many cases, ad hoc software solutions are developed for a specific application; this implies practically starting integration from scratch in the light of any type of component change such as autopilot, payload sensor, etc. The existence of an avionics framework package specifically designed for UASs may alleviate the development costs, reducing them to a simple configuration or parameterization. RIMA defines an architecture based on components and services. A framework has been developed based on this architecture to reduce “time to market” when creating a new UAS application, and to simplify the development of all systems required to implement the actual mission.
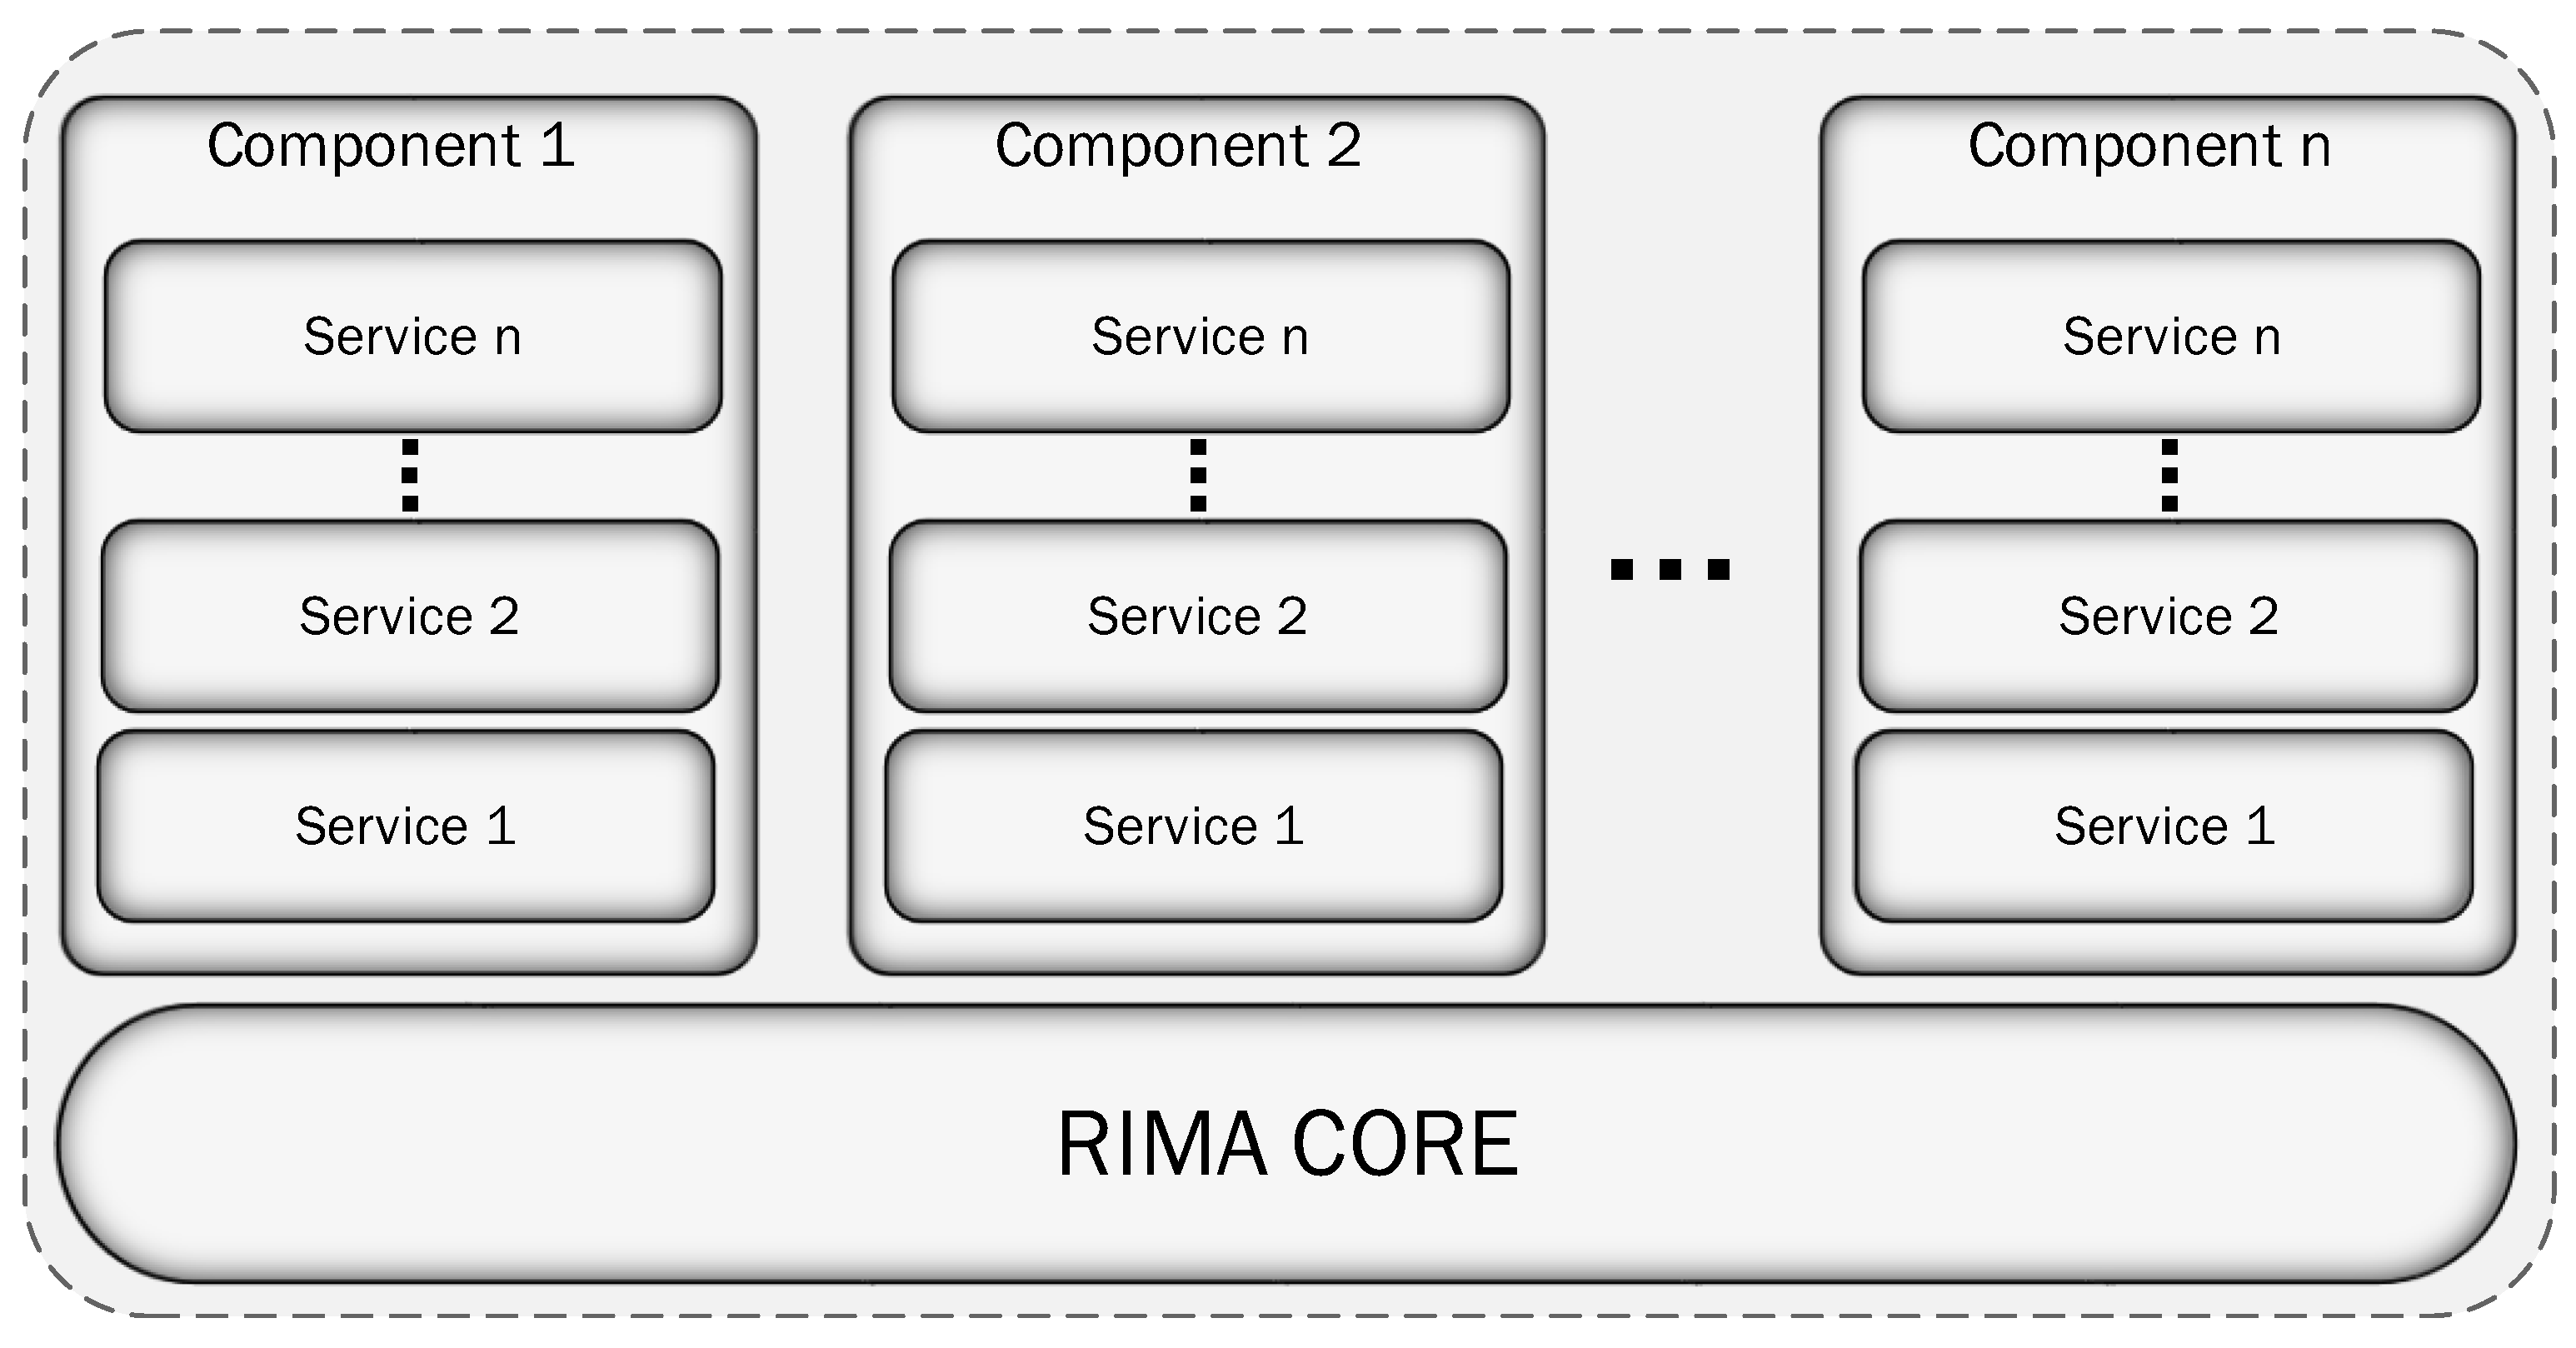
RIMA has been developed entirely in Java. This means that RIMA is a cross-platform, that is, a compiled RIMA program/executable runs on all platforms for which there is a Java Virtual Machine (JVM). The RIMA framework is based on independent components that can be loaded or not to make the configuration of the software that fulfils the requirements of the mission. As is shown in Figure 3, RIMA is composed of a core that provides the ability to communicate the upper software layers. These layers can be components/services or other systems or applications.
RIMA defines the following software concepts:
- System ID: The air and ground segments that are part of the mission have different “System IDs”. In this way, we can differentiate the aircraft and control stations. All the components of a “System ID” are visible within the Network communications (see Section 2.2.1 for more information). The communication of different “Systems ID” is carried out by means of Radio communications.
- Component: A component is a group of strongly related services that provides a complete functionality, or a technology abstraction such as cameras, embedded boards, etc. For example, the autopilot component interfaces with the autopilot providing a unique communication mechanism. It provides telemetry reading services, flight plan modifications and readings, and autopilot mode changes. Another example is the thermal camera component which contains all services related to taking pictures or changing thermal camera parameters.
- Service: A service provides a simple functionality. The service applies a process over input and output data. For example, inside the autopilot component, we have a service which is in charge of publishing the aircraft’s attitude and another service to publish the GPS data, among others.
Over the last four years, we have used previous configuration profiles of RIMA for different UAS applications: for example, searching hot-spots after a forest fire [8,32], search and rescue missions [33], or 4G at different height coverage measurements [34]. All these previous developments have allowed us to achieve a pool of reusable and common components for future applications. Therefore, many of the components that we are going to explain, or even RIMA core, have not been implemented for this particular application. However, it is necessary to describe them in order to correctly understand the work performed and the software technologies used for this remote sensing application.
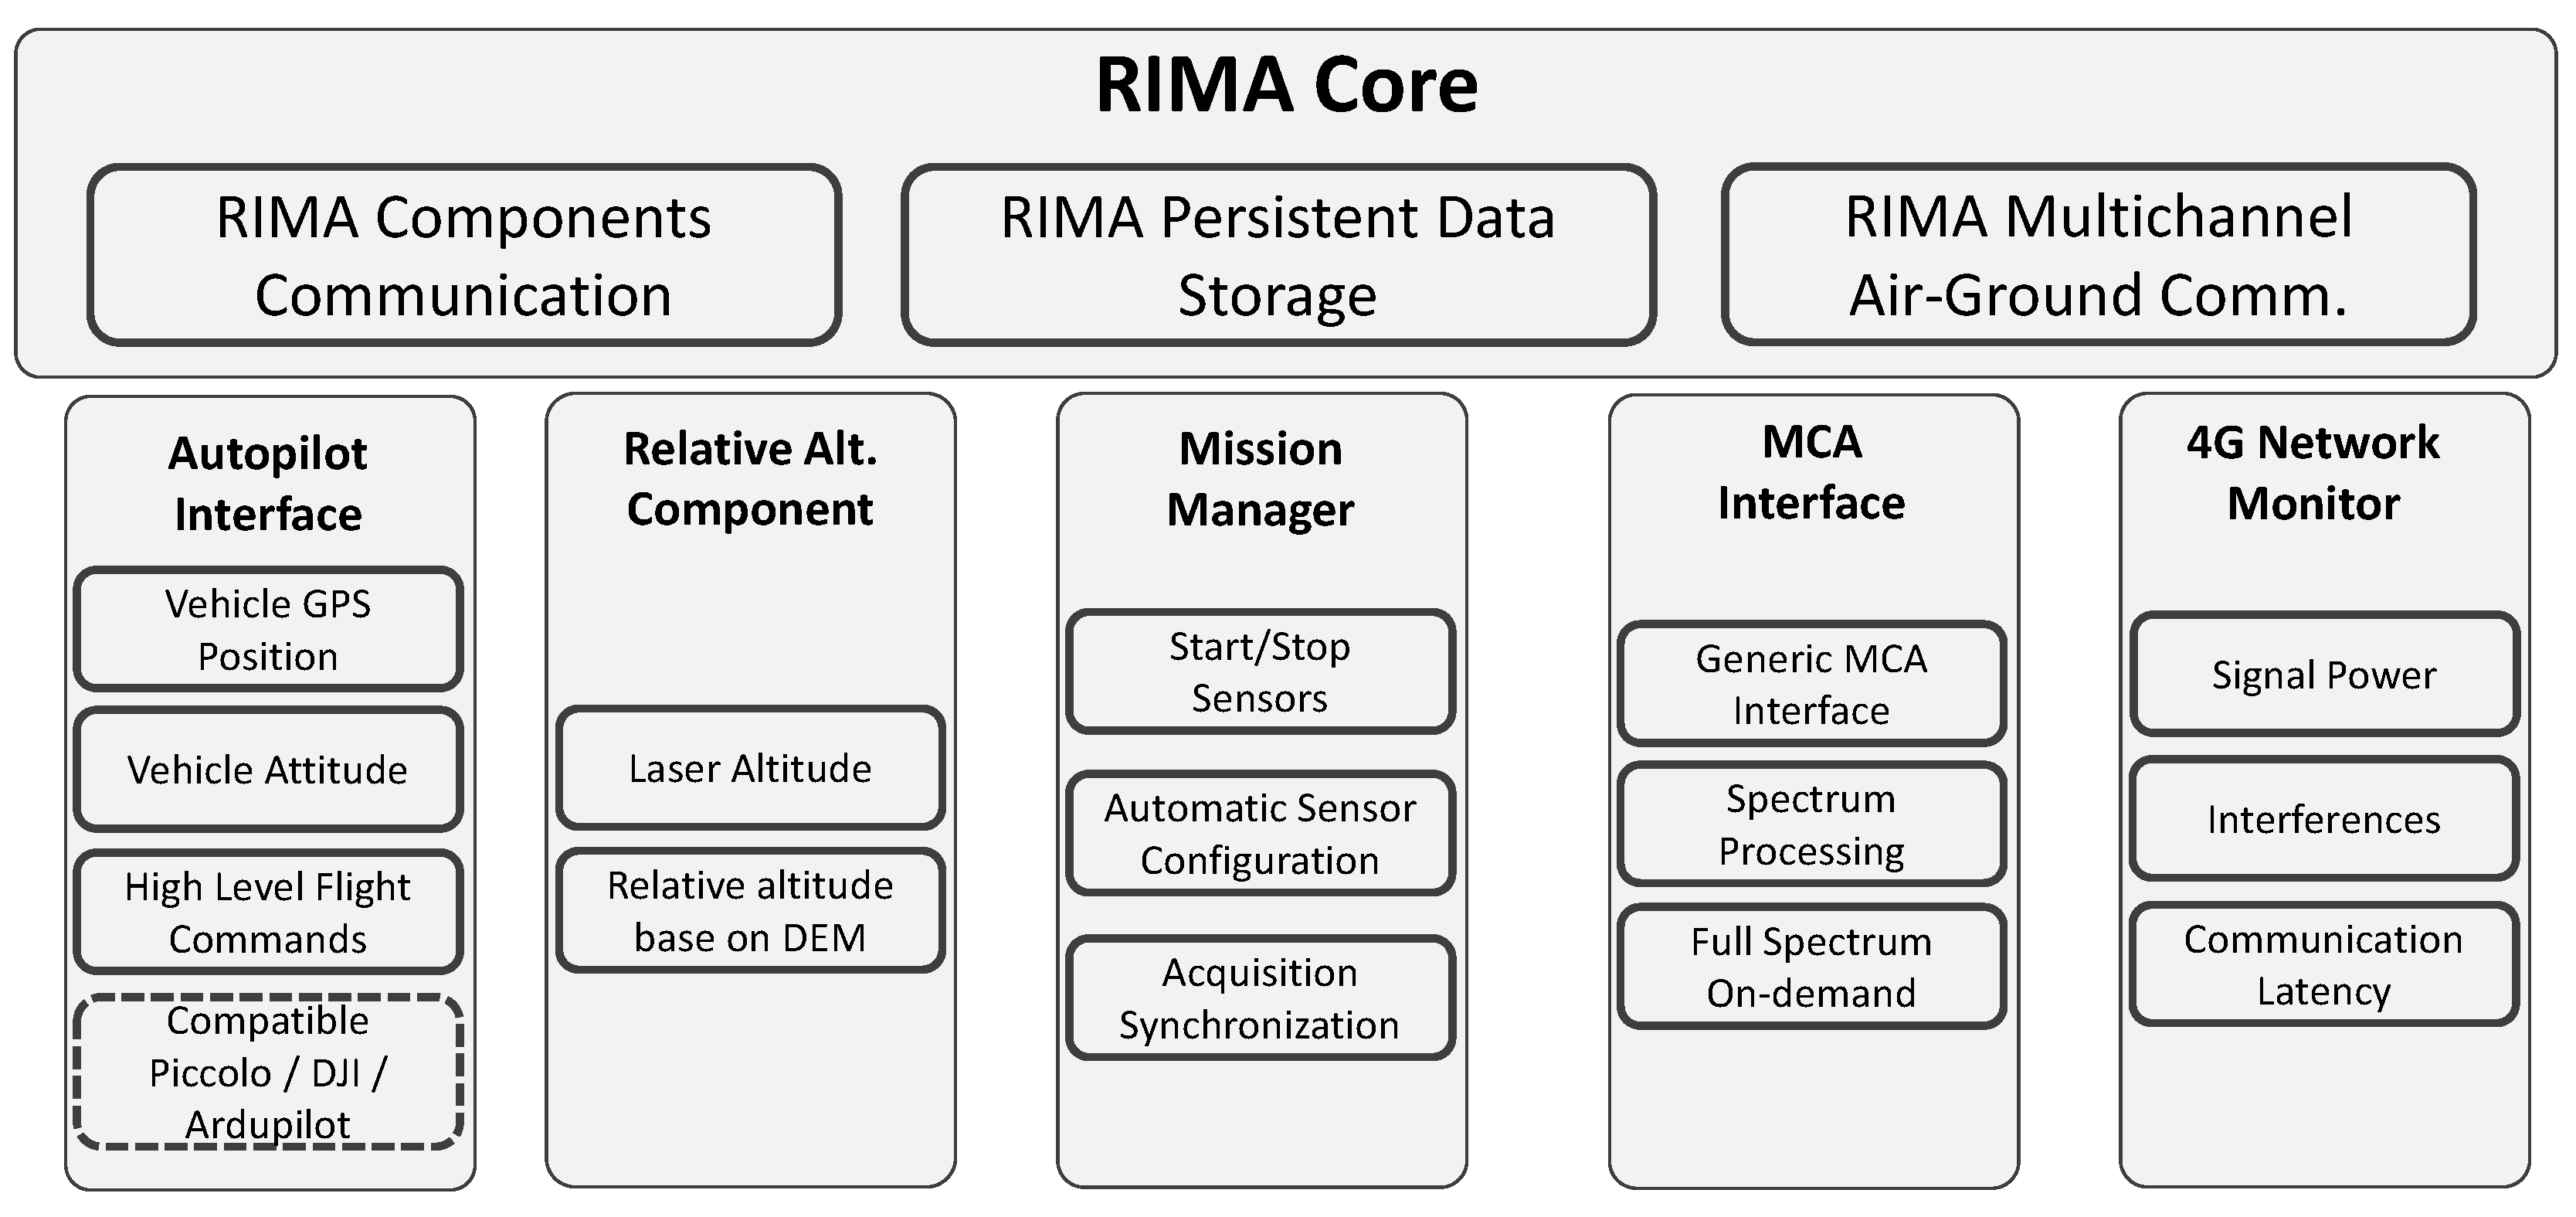
Figure 4 shows those concepts that are covered by RIMA. RIMA is autopilot independent because it is able to provide an interface to the functionalities offered by autopilots such as Ardupilot, PX4, DJI or Piccolo Autopilots [35]. Different components for each autopilot have been developed over the last four years. Therefore, when we use one autopilot or another, we only have to load the component that corresponds to that autopilot.
RIMA differentiates three types of communications: real-time communications between components, asynchronous communications between components and real-time communications between “System IDs”. RIMA is capable of exchanging messages following the publication/subscription paradigm. For the exchange of messages between services, we use Guava EventBus [36] or the MQTT protocol [37]. If more than one board is required, we can use the MQTT protocol.
Air-to-ground communications are formatted using Mavlink communications protocol messages [38]. RIMA has implemented three different communication networks: Private Radio Networks, Wi-Fi and 3G/4G. RIMA uses all three communication systems to send data, but it selects the communication system with less latency. When the aircraft has little coverage on any of the radio communications links, the latency will increase and the system will discard it to use another link with less latency. In that way, we can use Wi-Fi while the aircraft is in Visual Line-Of-Sight (VLOS) but in Beyond Line-Of-Sight (BLOS), we lose Wi-Fi coverage and air-ground communications are redirected to the 3G/4G device.
In many missions, it is impossible to download all the information acquired by the sensors to the ground in real time, either because of the size of the data or due to the low bandwidth available. RIMA has a mechanism to store all the information acquired by the different sensors or devices integrated into an SQL database.
Another exciting feature of RIMA is the ability to auto-generate code using XML files. When we want to exchange a new message in RIMA between services, we describe that message in Interactive Data Language (IDL), which is based in XML. Then, RIMA has a series of scripts to auto-generate the necessary Java code to encode and decode this message by any component that takes part in RIMA.
RIMA implements separate ground software components that are capable of interacting together in a particular GCS. RIMA provides a map engine for viewing 2D or 3D maps depending on the needs of the mission and ground station. Currently, we use JXMap for 2D and WorldWind for 3D to embed the map over a GCS application.
The configuration profile of RIMA used to carry out the search for a radioactive source has been called RIMASpec. When the RIMASpec configuration profile is loaded, RIMA loads the necessary software components to carry out an environmental radioactivity metrology mission.
Next, we are going to explain each of the software components that are loaded in RIMASpec for the air and ground segments. In addition, in the ground segment, we will see a description of the graphical components implemented in the GCS.
2.2.1. RIMASpec Air Segment Software Architecture
Figure 5 describes the software components used in the air segment of RIMASpec. In the upper part of the figure, we can see the three pieces of software that compose the RIMA core: components communications, persistent data storage and multichannel air-ground communications.
Communication between services is implemented in RIMA components communications, also called network communications. As we have mentioned before, this communication is done using the Guava EventBus or MQTT libraries. We mainly use Guava EventBus which allows communication between services that are executed in the same process. Guava EventBus allows publish–subscribe–style communication between components without requiring the components to explicitly register with one another.
RIMA persistent data storage allows data generated by the different components (autopilot, sensors, laser altimeter, etc.) to be stored, and at the same time to be consulted asynchronously to the generation. RIMA persistent data storage acts as a database and is implemented using Hibernate [39] and the database H2 [40]. While Hibernate allows a simplified use of SQL language, H2 offers us a light database engine with which it allows support for an embedded database, in memory and in server mode.
RIMA Multichannel Air-Ground Communications provide communication capability based on the combination of a scalable set of technologies, depending on availability and the performance of the networks. The communication between the vehicle and the ground station could be performed through private radio networks using serial radio modems for low throughput and low latency communications, while high throughput short-range communications could be performed through the Wi-Fi network by means of an IEEE 802.11 compatible board. Access to the mobile network is also supported using a 3G/4G compatible modem which provides connectivity to the internet. Access to the internet could be used to extend the range of vehicle and ground communications as well as enable the capability of sharing data among third party systems.
As we can see in Figure 6, proprietary communications are point-to-point and use a serial connection with the main onboard computer. In Wi-Fi communications, we use UDP connections, granting different IPs and identifiers to the aircraft. Mobile network communications are made using the Internet of Things (IoT) protocol MQTT. In MQTT, all communications pass through a broker. In our case, we have used the Mosquitto MQTT broker.
Returning to Figure 5, we can see the different software components and services that we have loaded to make the application. The first component we found is the interface with the autopilot. The autopilot interface component is responsible for communication between the different components of RIMA and the autopilot. This component has been implemented to support autopilots such as Pixhawk or based on DJI technologies. The services that take part in this component have the following functionalities:
- Publication of the GPS position of the vehicle.
- Publication of the attitude of the vehicle.
- Management of the flight plan.
- Management of direct commands to the autopilot.
The relative altitude component deals with the laser altimeter, if it is installed in the platform. Otherwise, relative altitudes are based on the Digital Elevation Model (DEM) where the UAS is going to fly. In RIMASpec, we have installed a laser altimeter to give high accuracy in altitude measurements.
The mission manager component allows the mission automation to be configured by means of a Mission Template Definition. This template is written in XML and allows us to load different parameters that will be useful when performing the mission. For example, in the case of RIMASpec, we need to know when the main computer should turn on the detector and start taking spectra, or what the integration time of the detector should be. The parameters sent from the ground must correspond with those defined in the air template.
The MCA interface component has three different services. First, we have the service called the Generic MCA Interface that interacts as an application program interface (API) with the CZT detector. Then, we have the Spectrum Processing service which is in charge of taking the spectra generated by the detector, compressing them, adding the necessary information from where they have been taken and sending them to the corresponding communications channel. Finally, the full spectrum on-demand service is in charge of acquiring a specific spectrum from the database and sending it to the ground before a specific request from the ground segment. The Raspberry 3 RAM and CPU consumption when acquiring, processing and sending spectra is 10% and 45%, respectively.
The 4G Network Monitor component allows the state of the network to be monitored in terms of signal strength and quality, and, on the other side, the performance of the network can be measured in terms of throughput, latency and interference. In this way, if the UAS is operating BLOS, we can know if we are entering an area with little 3G/4G coverage. This issue is important because, if we lose 3G or 4G coverage, we will lose the link to the aircraft.
2.3. Radiological Ground Control Station
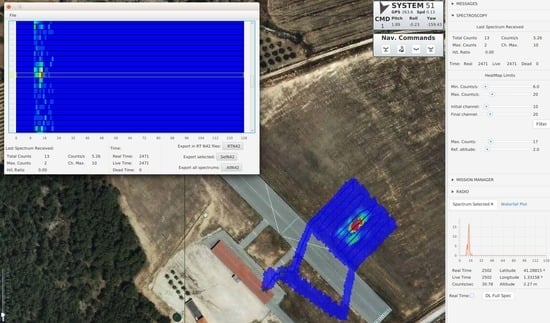
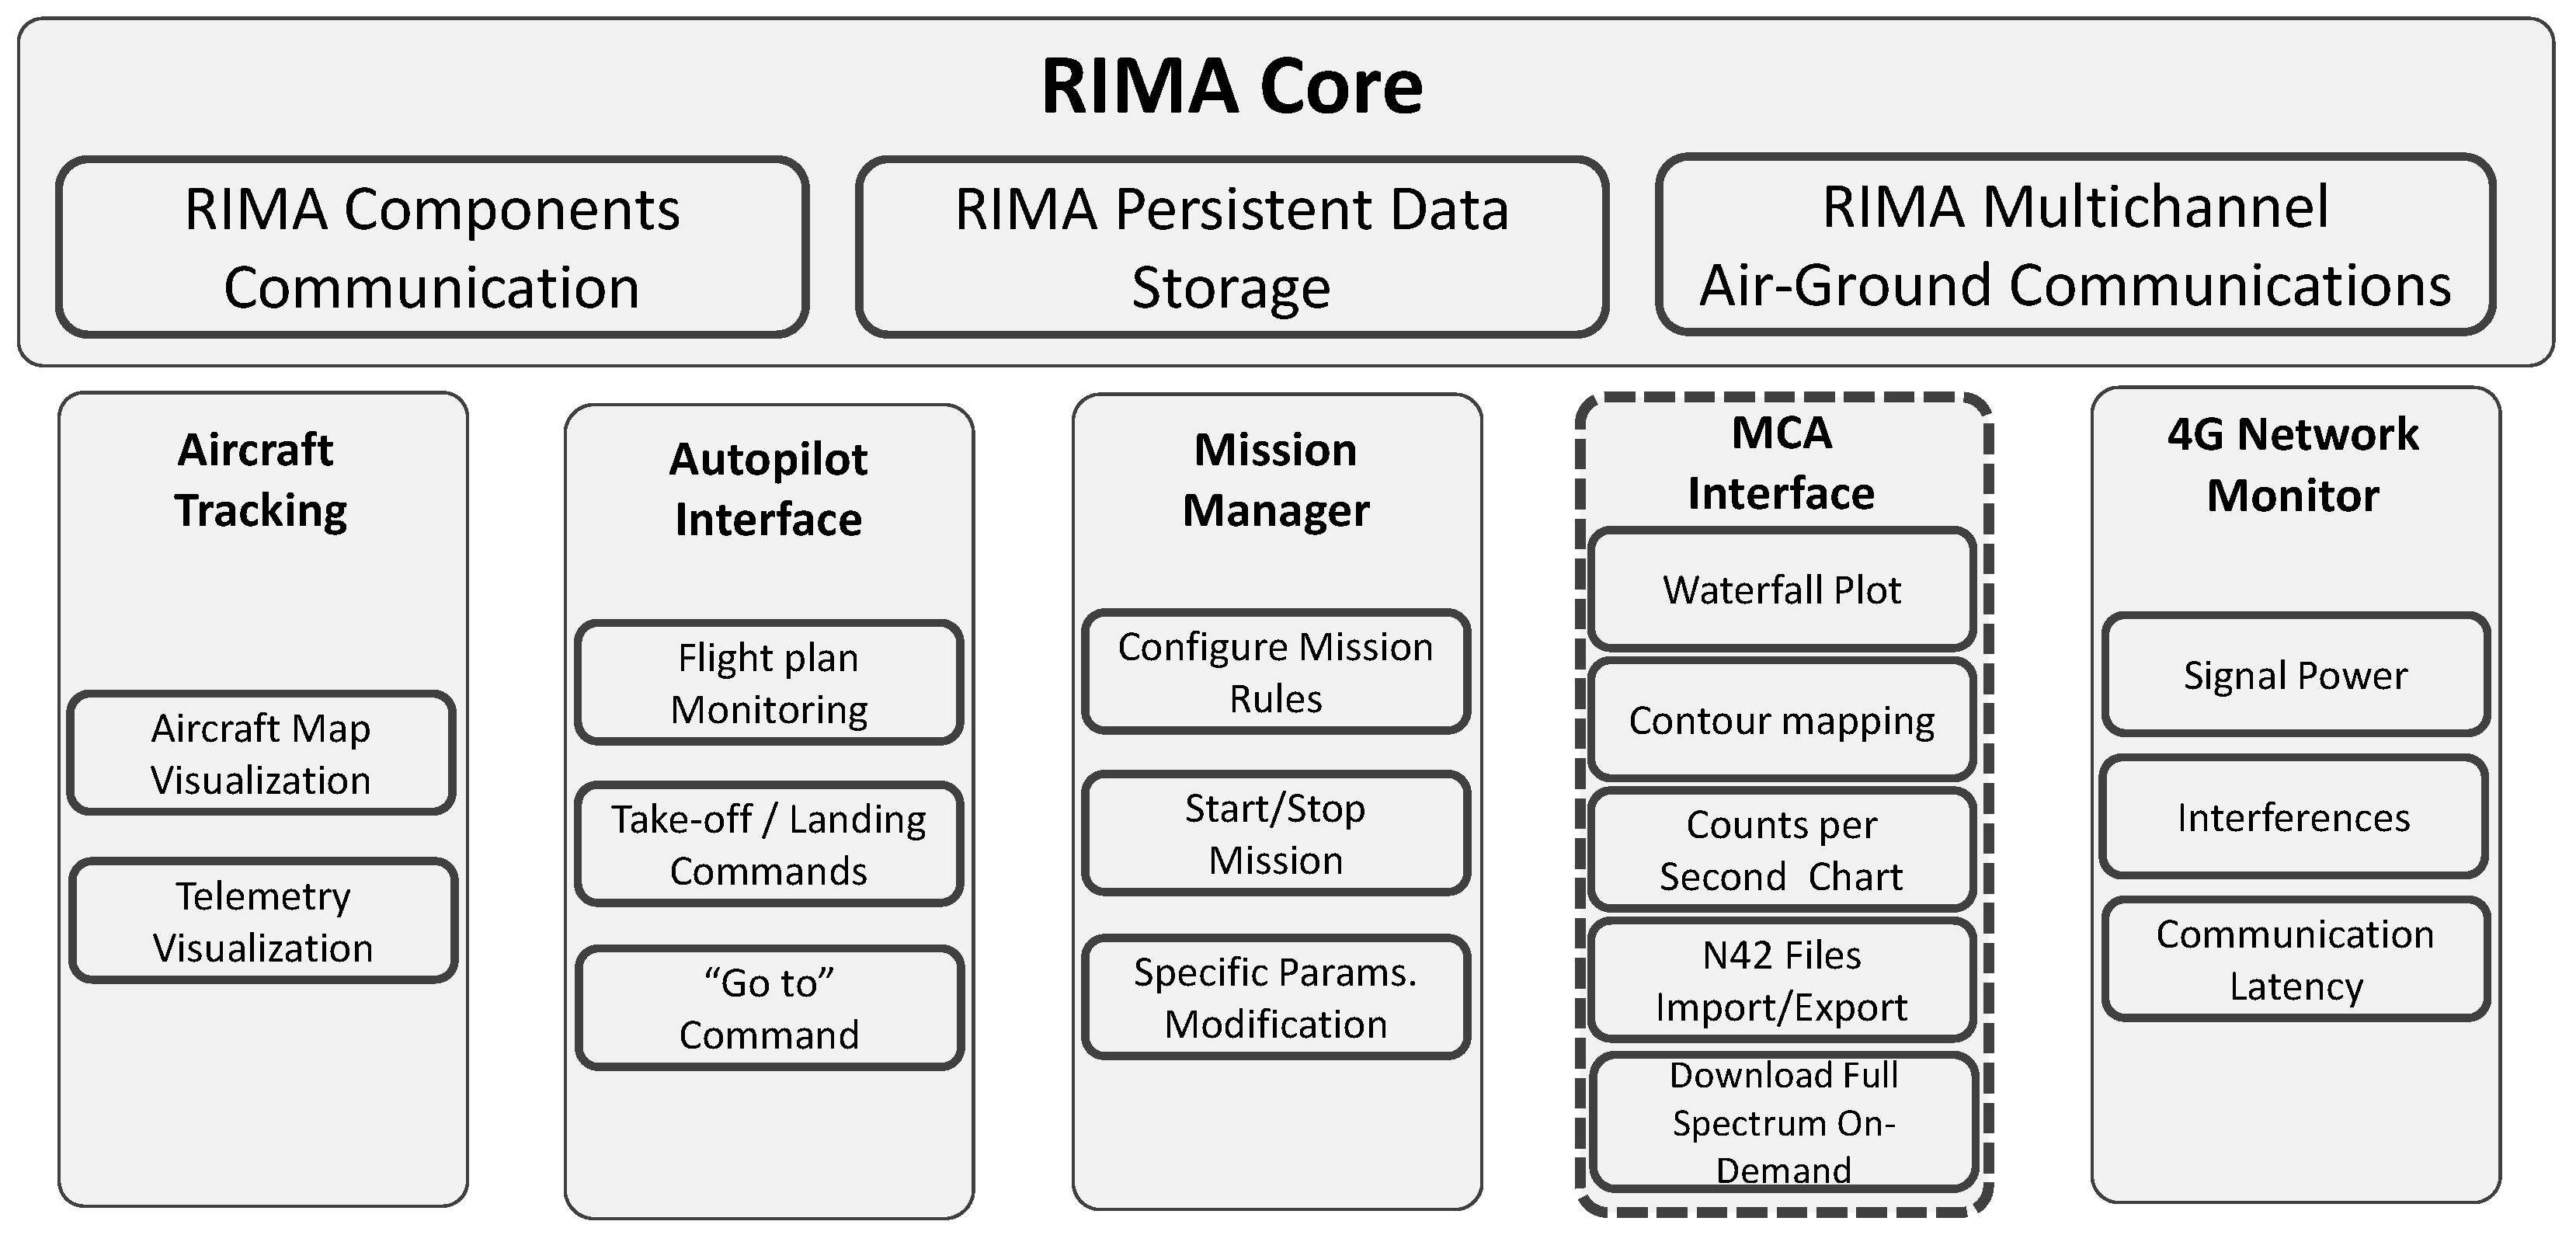
As mentioned in previous sections, to detect radiological point sources, we have developed new software components for RIMASpec. In Figure 7, we can see a block diagram with the main components of the GCS. The core of RIMA remains intact among all the applications and is the same for both air and ground segments. In the case of the components in the GCS, each one manages different services analogous to what happens in the air segment. In addition, all of them have an associated window in the GUI (Ground User Interface), or part of it, to display information and provide an interface to manage these services and to monitor the mission.
Most of the components used in the ground segment are not unique for this application, but instead will appear throughout all applications created with RIMA as they manage basic information for missions with UAS. For instance, the Aircraft Tracking Component manages and displays the position of the UAS in the map layer and the attitude; speed and altitude is in the Vehicle Overview Window (see Figure 8). Another example is the Autopilot Interface, which is in charge of managing the commands to monitor the flight plans (map layer) and provide the interface to change the flight modes of the drone (Command Window). On the other hand, the components Mission Manager and 4G Network Monitor show and facilitate the interaction with the air segment to send the mission commands and manage the information of the 4G link. This information would be shown in two of the tabs in the Overview Window shown in Figure 8; the tabs are minimized in this case.
The only software component created from scratch for this application is the one marked with a dotted line in Figure 7, and it has many different services, which are explained in the following paragraphs and related to GUI windows.
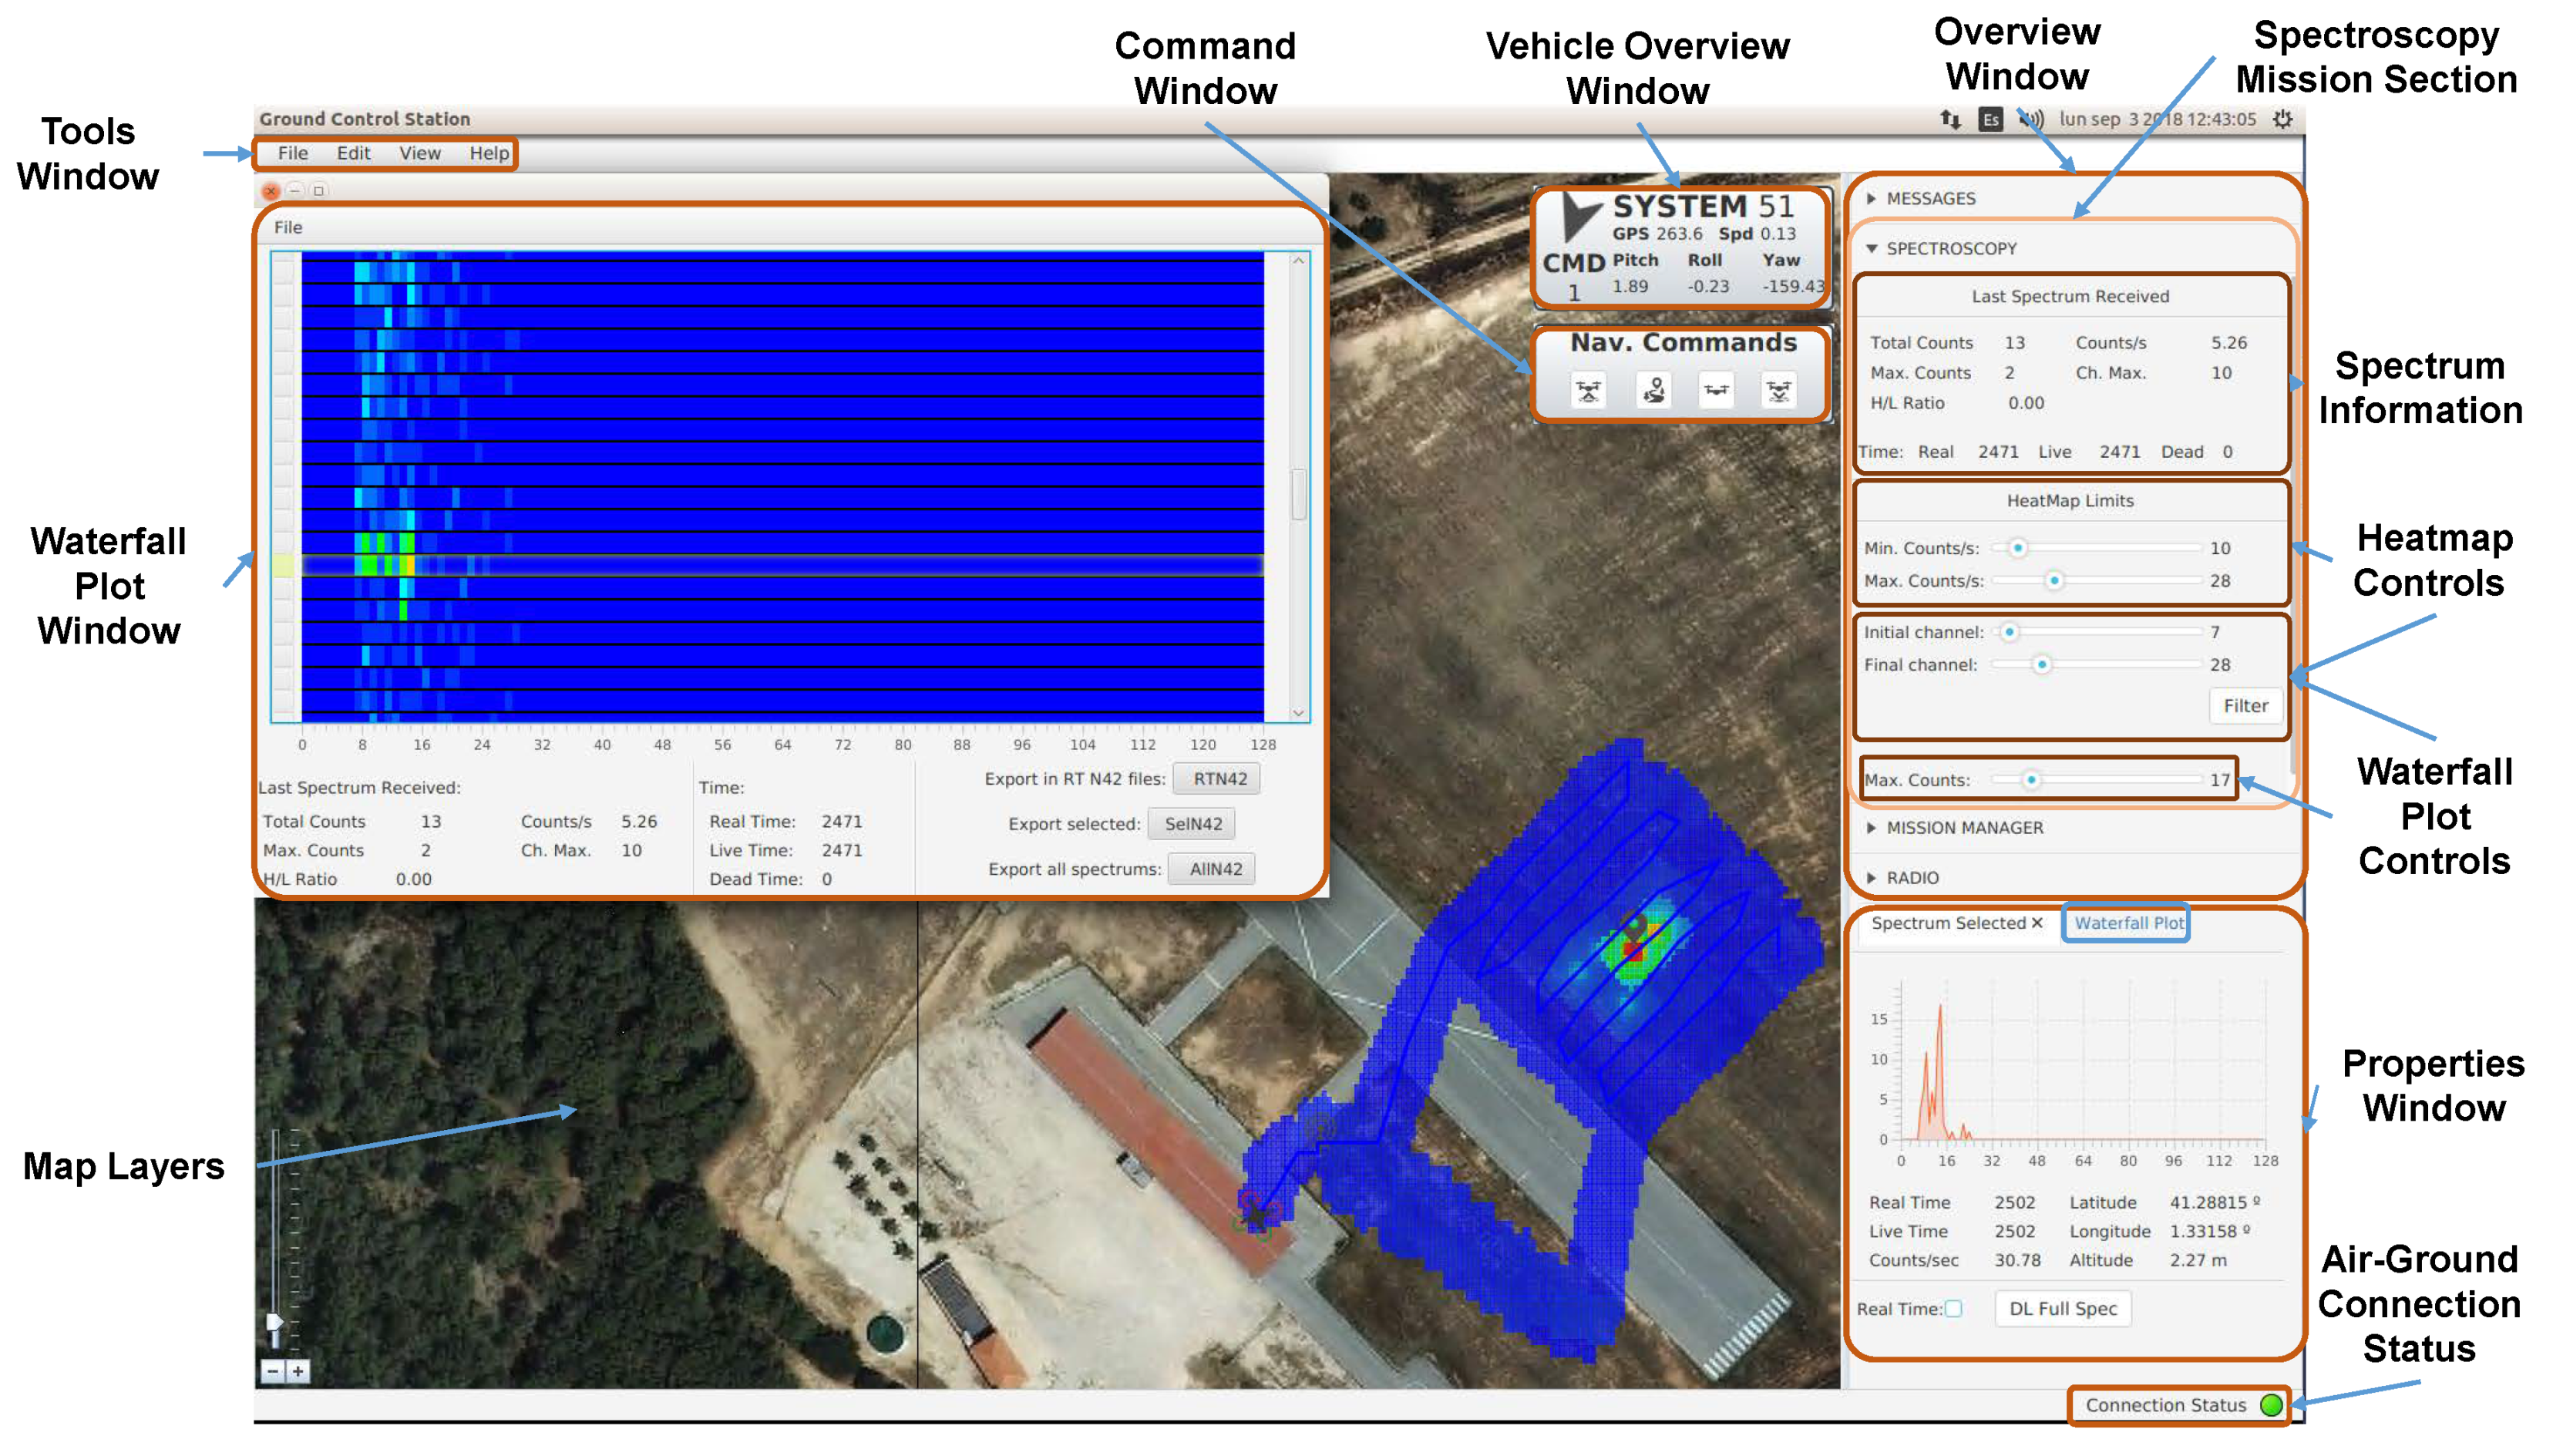
The spectroscopy mission tab in the Overview Window (see Figure 8) shows all the information about each of the received spectra from the air segment, which are captured by the radioactivity detector. This information includes the total counts in the spectra, the maximum number of counts in one channel and which channel has it. Finally, the counts per second are also shown, as well as the High/Low ratio. The High/Low ratio shows how counts are distributed along the channels to see if the radiation detected is natural or artificial, depending on which channels have more counts, the initial or the final ones, respectively. Three different types of times are displayed too. First, real time, which represents the detector’s total time of integration. This integration time can be divided in two; live time shows the exact amount of time that the detector has been measuring photons, and dead time, the remaining time of the integration that has not been used for measuring. The controls of the contour map and waterfall plot are also available in the same window.
The properties window has been prepared to show two different tabs; the one shown in Figure 8 displays every spectrum with greater precision showing the counts in each of the available channels (action made by counts/sec chart service). As the spectra are compressed to be sent from air to ground, each of the channels shown on the graph corresponds to the sum of eight real channels, since the sensor used captures 1024 channels and we sent 128. The position and time information about the spectra displayed on the graph are also provided. The button (“DL Full Spec”) appears on the same tab to download the full spectra with all 1024 channels and display them on the graph. The Download Full Spectrum On-Demand service of Figure 7 manages the functionality button. In the second tab, a smaller waterfall plot is displayed.
To obtain a full waterfall plot, it is necessary to open the waterfall plot window, which is managed by the Waterfall Plot Service. Each of the received spectra appears in this window but is displayed using a colour scale. Therefore, if any of the channels contain a large number of counts, they can be quickly identified. The operator can also see the evolution throughout the flight of all the received spectra because they accumulate in the waterfall plot windows. In addition, if there are any spectra that seem to be of greater interest, it is possible to click on them to see their location on the contour map and all the information in the properties window. Another facility offered by RIMASpec GCS is the ability to create xml files in the N42 format (N42 Files import/export service in Figure 7), used for radioactivity readings. Three buttons appear in the waterfall plot window. The first one is to export N42 files in real time (“RTN42”) as every spectrum arrives. The second one is only to export the selected spectrum file (“SelN42”), in case it is of great relevance. Finally, there is a button to export all the spectra at once (“AllN42”), normally used at the end of the flight to get all the N42 at once.
The radiological information not only appears on the waterfall plot or in the properties window but also appears on a contour map in the map layers (contour mapping service in Figure 7). The contour map shows the radiation levels at each of the analysis points (in counts per second) similar to the system used by the author [14]. In addition, everything is normalized to a height of one metre using the inverse-square scaling algorithm as in the works by the authors [11,12,14], the difference being that this normalization is also used for the waterfall plot colour scale. The detector provides not only the radiation of a small point located directly below the sensor but also of a larger area, considered to have a diameter of twice the altitude obtained by the laser altimeter (due to the aperture of the sensor). For each spectrum reaching the ground station, an area of the discussed size is painted, which causes areas to overlap; in this case, the distances from the centre point of their respective measurements are compared and the value is pondered appropriately.
In any case, depending on the irradiation of the source and the sensor used, the contour map and the waterfall plot often require slight tuning to improve visualization. This modification is made by means of the controls present in the overview window. Five controls are present in this window. First, the operator can modify the minimum and maximum number of counts per second to be taken into account, in order to eliminate the background radiation from the environment and therefore see the source in a more isolated way.
On the other hand, it is possible to filter which channels measured by the sensor should be used, so that possible electronic noise is eliminated. Using the last control, the maximum number of counts measured in a single channel can be modified, so that a larger peak can be simulated to see the change in the waterfall plot.
Finally, the air-ground connection status control shows the status of the connection between air and ground systems, turning the LED green, yellow or red if the connection is failing or there is no connection, respectively.
2.4. Data Acquisition
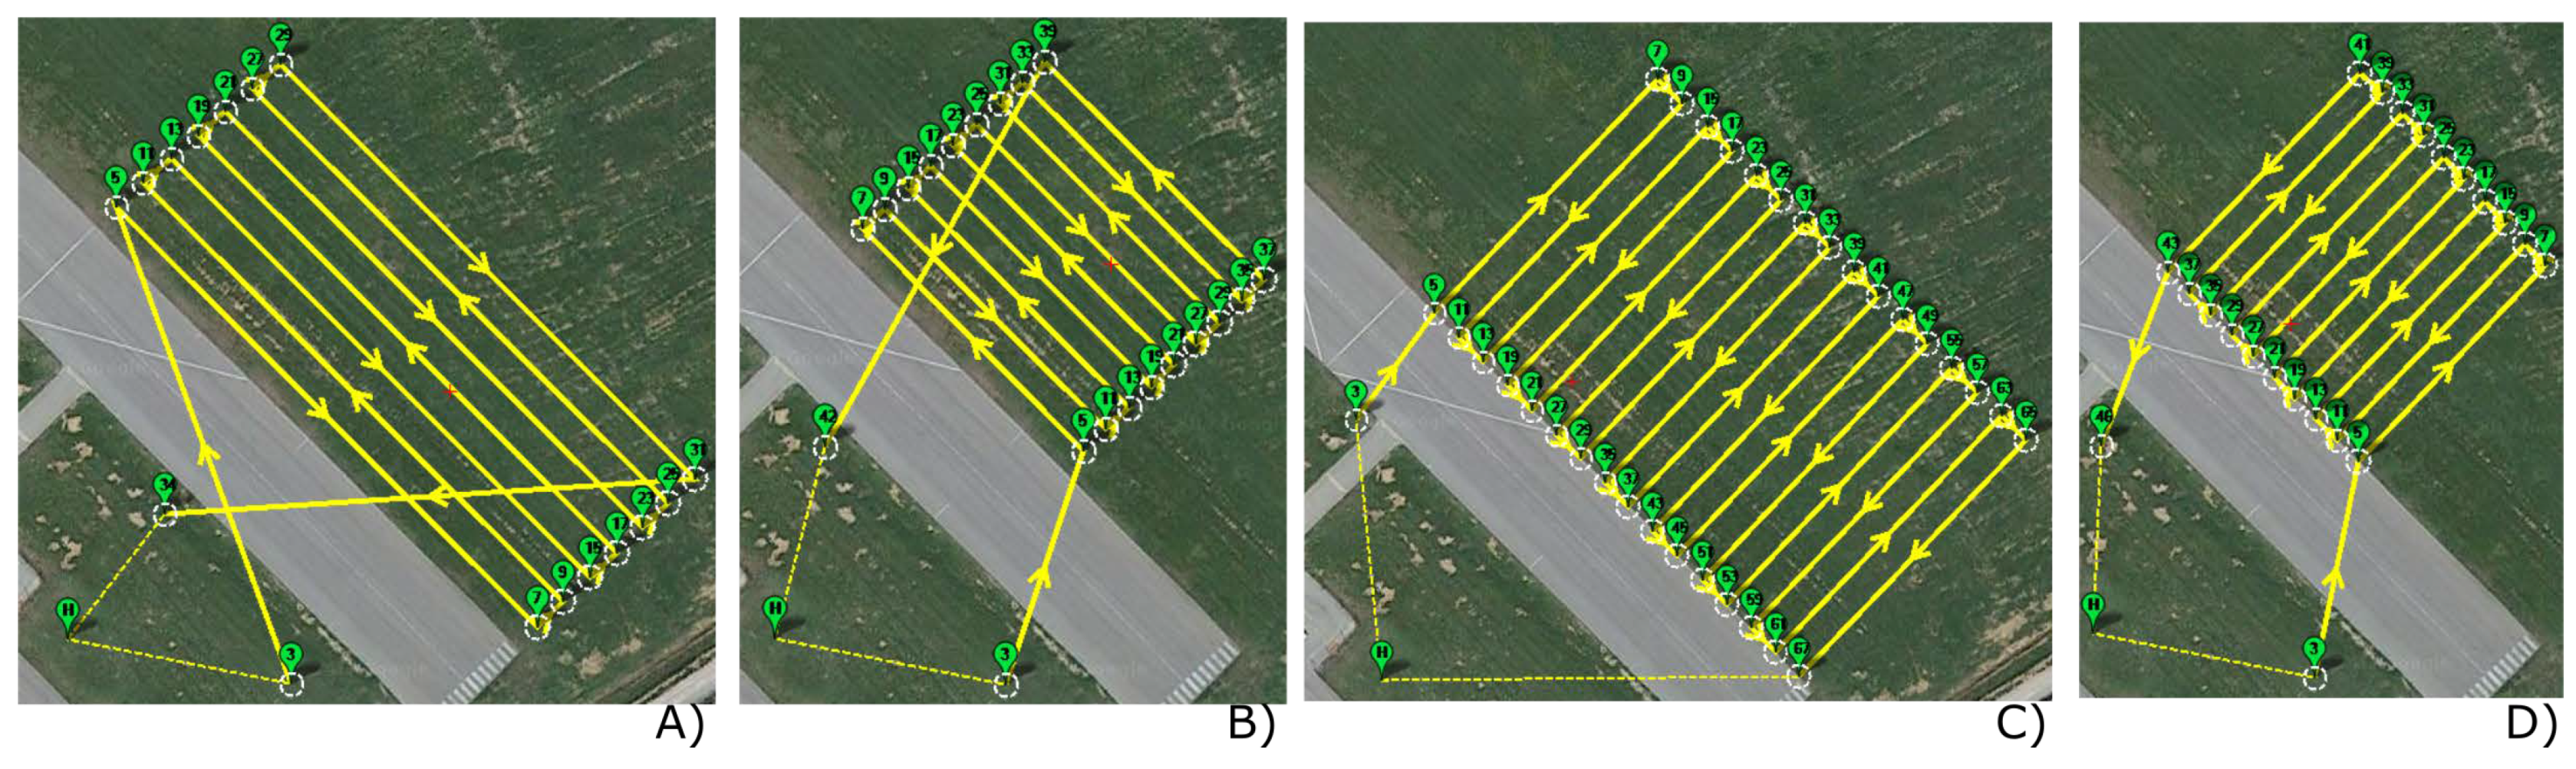
Data acquisition was carried out using a scan pattern with passes parallel to the runway (Figure 9A,B) and other passes in perpendicular (Figure 9C,D). The point source used in the experimental flight campaign is the one described in Section 2.1.4. The source was placed in an unknown place to try to be located by the UAS. To do this, we use a two-phase scheme. First, we do the scan (A) or (C) at a height of 4 or 3 m and 3 m/s speed and then we do a second smaller scan (B) or (D) at a height of 2 m and 2 m/s speed. With the first scan, we limit the area where the source is and through the second scan we can locate the source with greater accuracy. Performing both phases with the same batteries was risky. Therefore, for safety reasons, the transition from the 1st to 2nd phase was performed manually.
The altitude of the flight determines the spacing between tracks in flight plans. Since the detector footprints have a diameter of approximately twice the height carried by the UAS, the flight plan is adjusted so that there is a small overlapping of the measurements. In this way, in the 2-m flight, the flight plan tracks are separated to less than 4 m; in the flight with a height of 3 m, the flight plan tracks are spaced at less than 6 m, and in the 4-m flight, the flight plan tracks are almost 8 m away. Considering the flight plan tracks, the UAS endurance and the detector described in Section 2, the biggest area that can be covered is around 6900 m.
It is important to point out that for this type of source with low activity and with the detector that we have embarked, the flights have to be carried out at a very low height and speed. When we fly at an altitude of 5 m and 3 m/s, the detector does not receive enough counts to detect the source. For this reason, the flights were made at a maximum height of 4 m and a maximum speed of 3 m/s.
The system requires three operators throughout the whole operation, with one backup pilot for safety reasons and two operators within the ground control station:
- The backup pilot to manually operate the vehicle if necessary.
- One operator to supervise the UAS operation continuously, carrying out tasks such as monitoring the flight telemetry and alarm information of the UAS.
- The second operator to supervise the progress of the mission (especially the detector), such as reading the waterfall plot, checking the contour mapping and proposing plot and flight plan updates.
The task of the second operator is critical. This operator is an expert in the field of environmental radioactivity metrology and therefore knows how to interpret each spectrum quickly. In this way, the operator can carry out an adequate setup of the ground station in real time. Using the GCS slide bars, the operator configures the maximum and minimum number of cps and the channels to be displayed on the contour map. This correct configuration makes it easier to differentiate between background and radioactive activity.
3. Results and Discussion
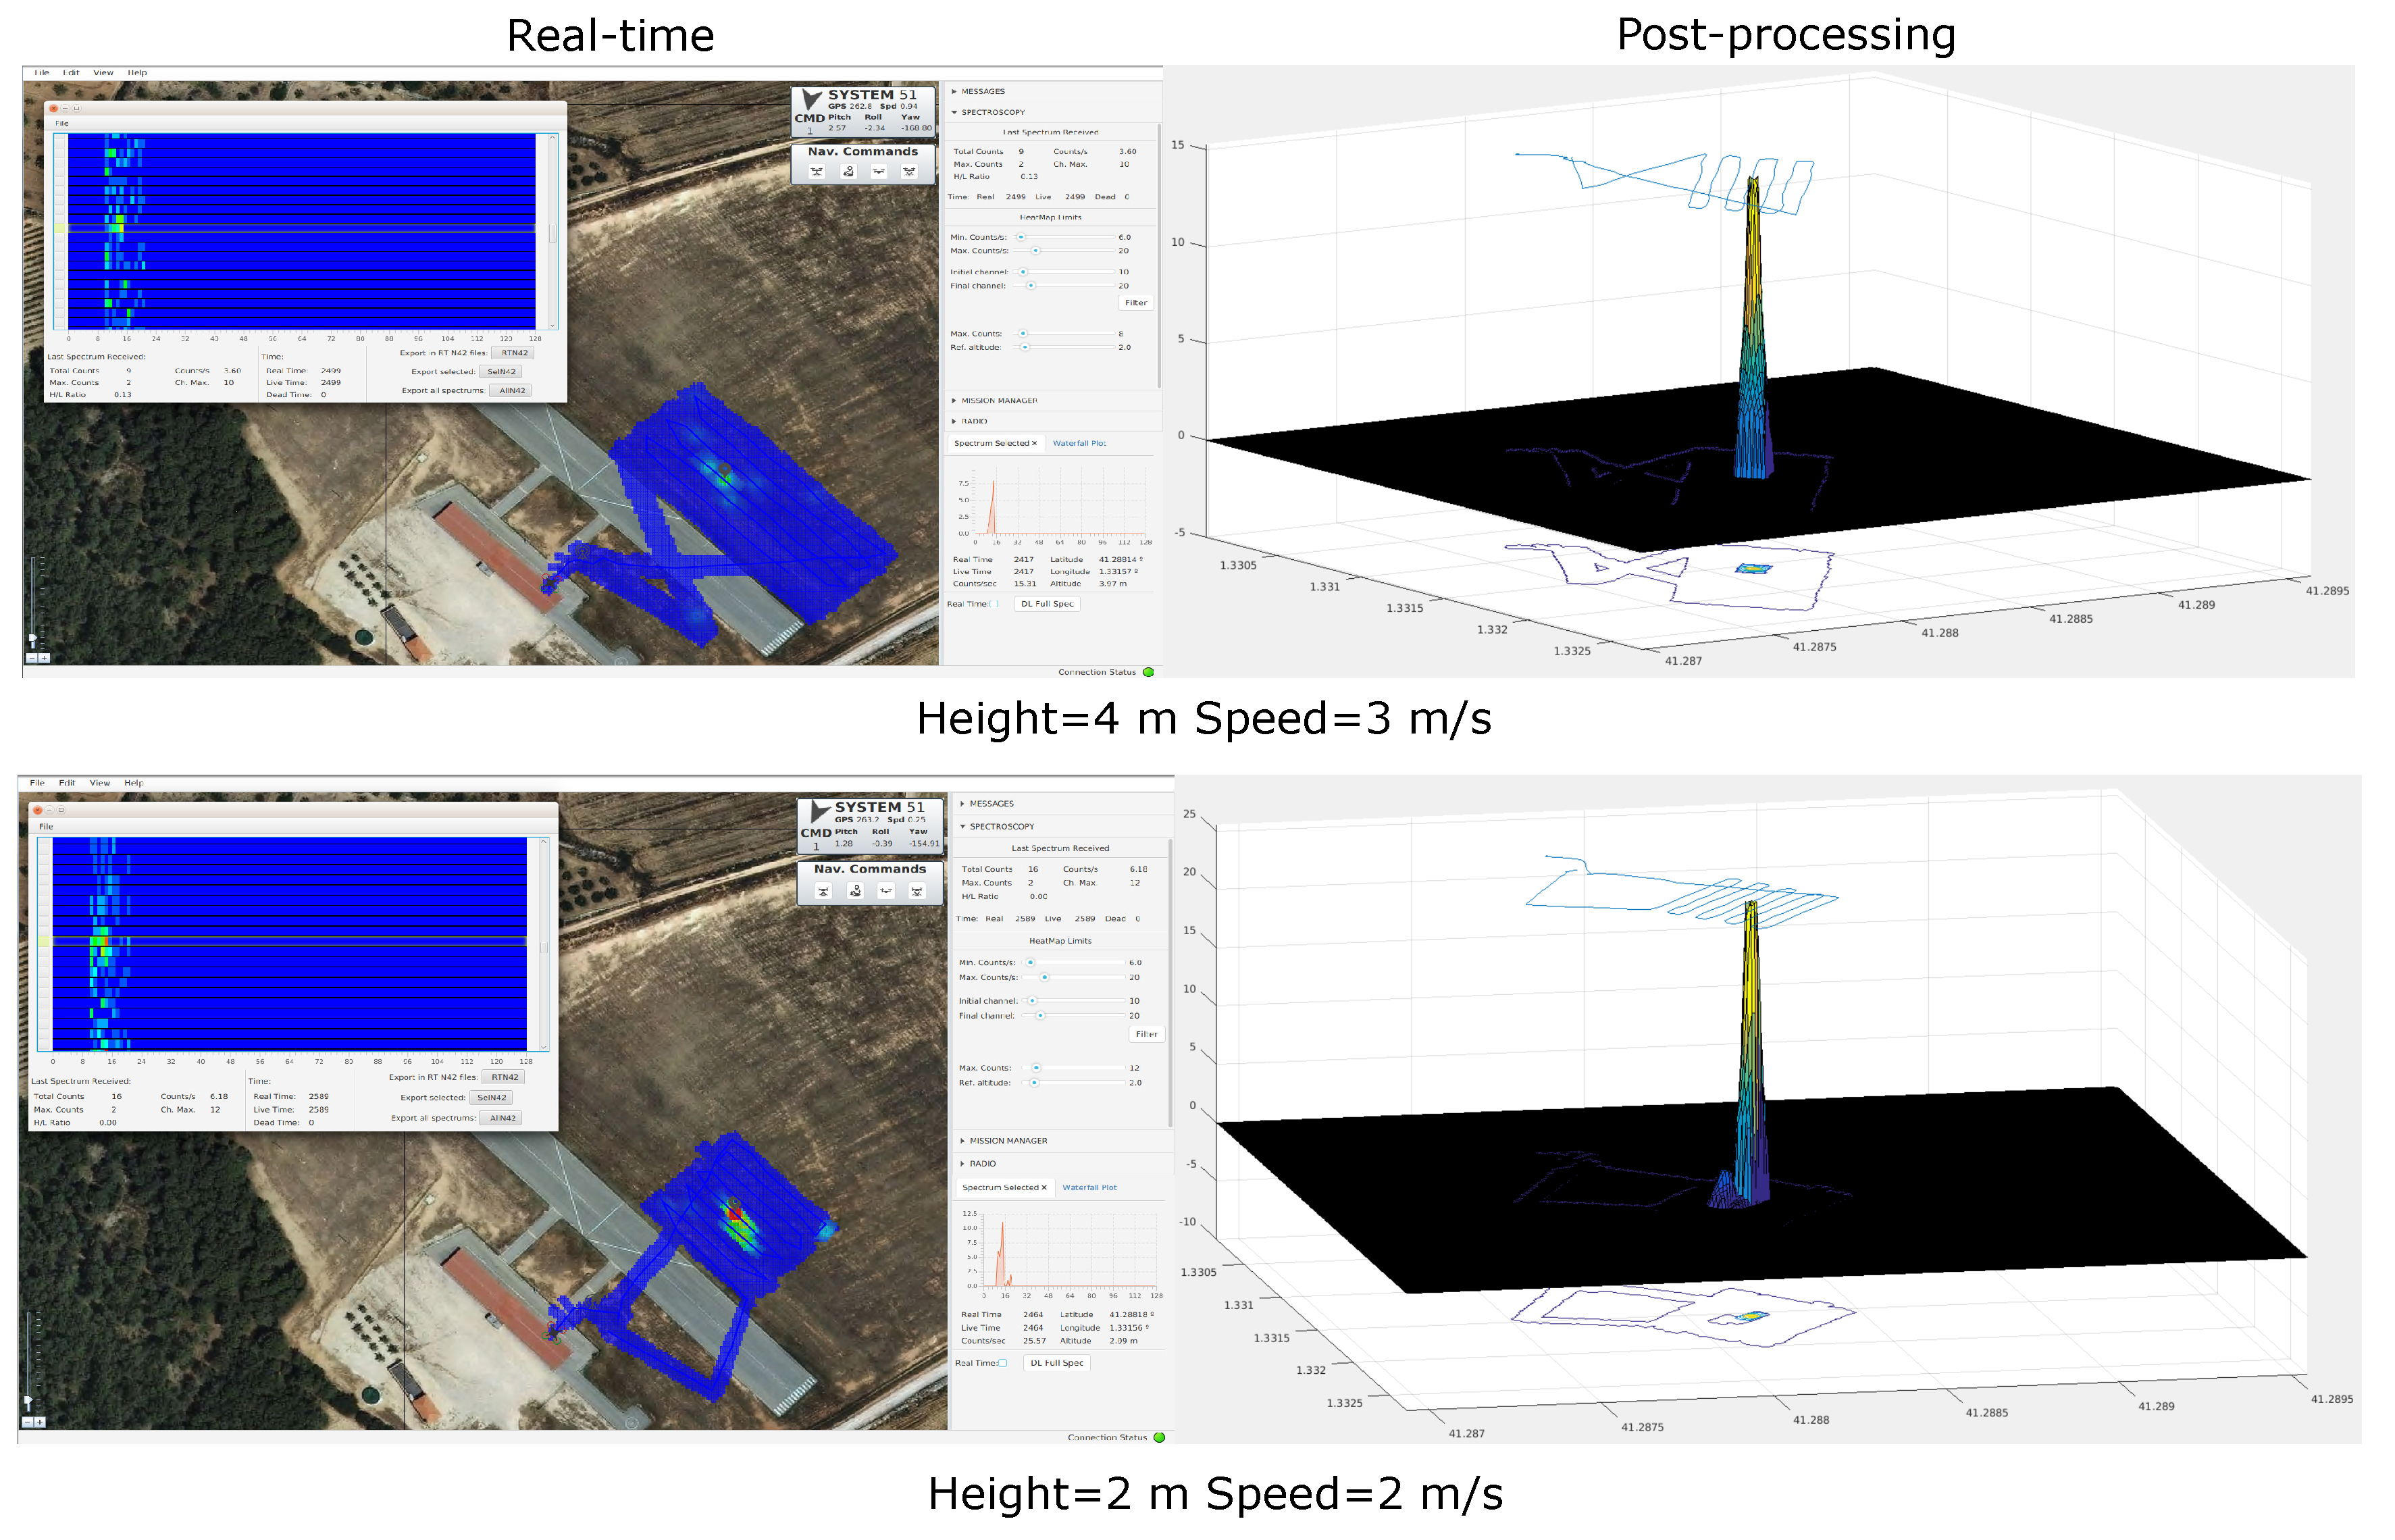
In Figure 10, Figure 11 and Figure 12, we can see the results obtained from the experimental flights. On the left of the figure is shown a screenshot of the GCS where the second operator is. On the right of the figures is a post-processing 3D plot using MATLAB (R2018b, The Mathworks Inc., Natick, MA, USA). All the flights were performed with the same GCS setup to see different contour mapping with the altitude variation.
To produce the 3D plots of the detected radiation distribution, brief post-processing of the grid, generated in the map layer to plot the contour map, has been used. To perform this post-processing, the grid is exported after tuning the contour map, modifying the channels to be used and establishing the minimum and maximum counts per second (using the controls previously presented in the RIMASpec GUI). Three files are exported: one with the position (latitude, longitude and altitude), another with the counts per second and, finally, the last one with the real track that the drone has followed throughout the flight. Then, using MATLAB, all positions that have a number of counts per second under the background noise (about 6–7 counts/s) are set to 0. Finally, the three data sets (position, counts and the flight track) are plotted in 3D to obtain the graphs presented.
Figure 10 shows that at 5 m and 3 m/s, the UAS is not capable of distinguishing between the background and the point radiological source. Only very low activity is detected in the post-processing plot.
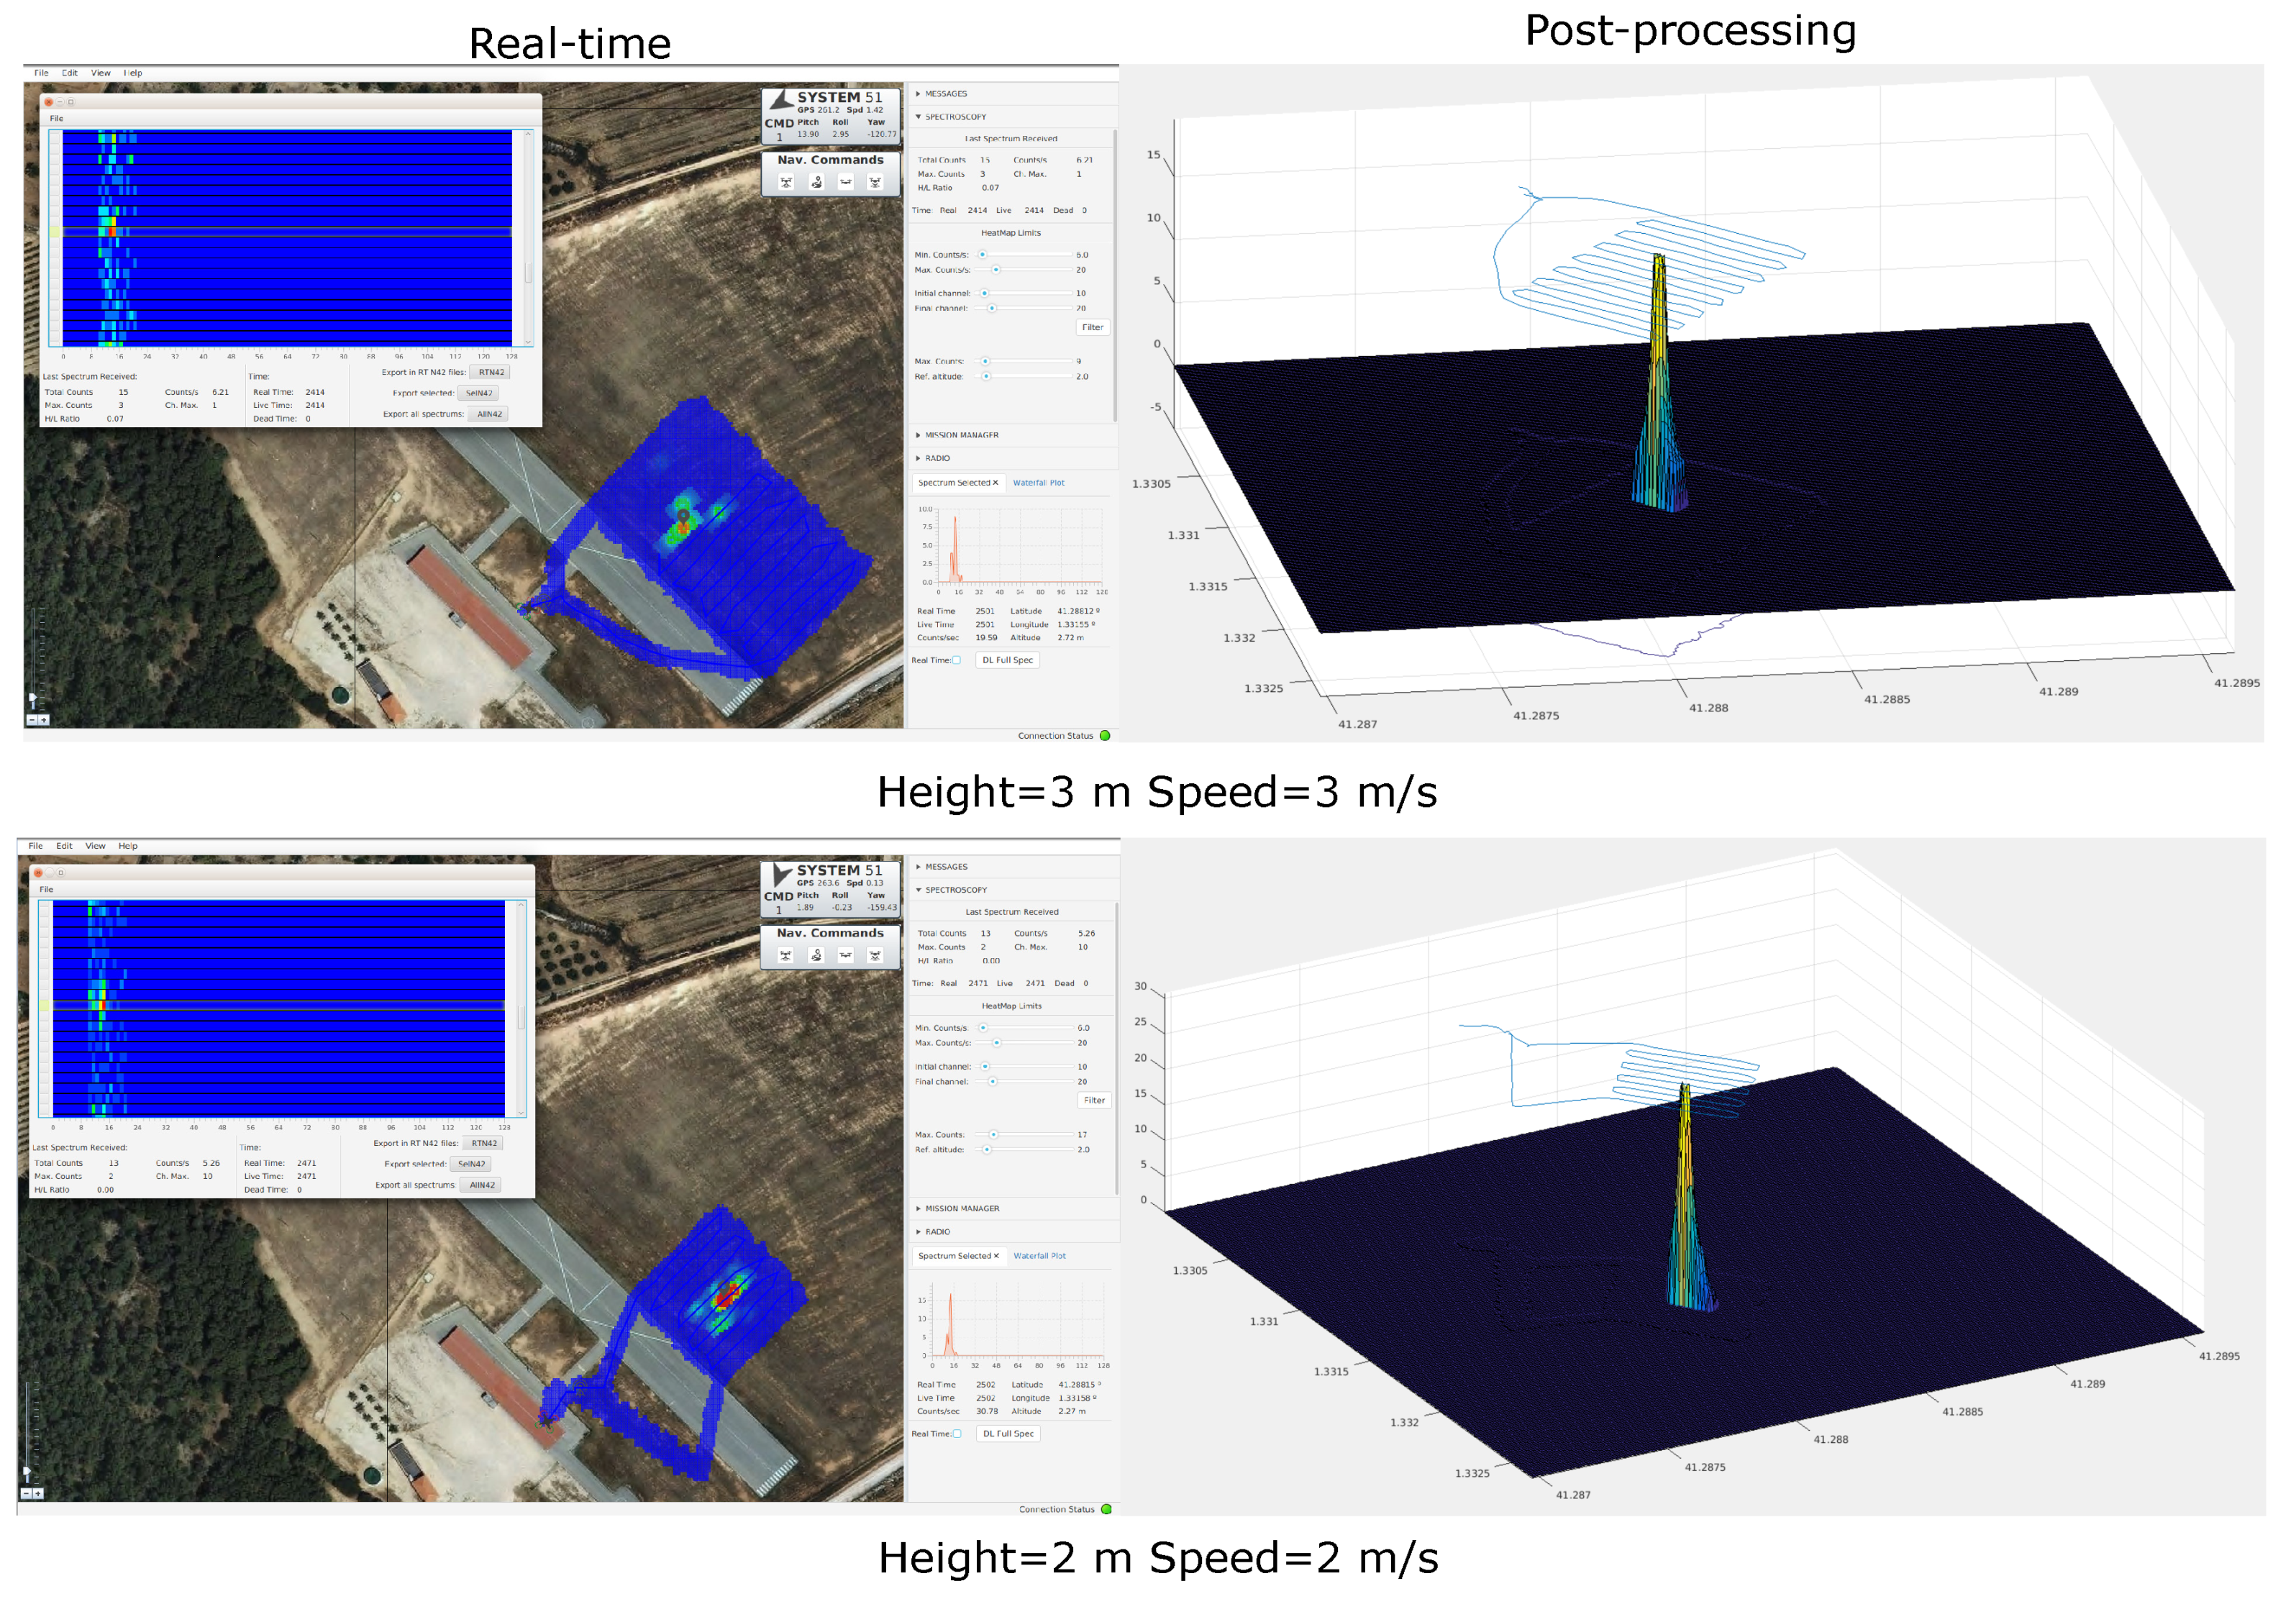
In Figure 11, we perform flights parallel to the runway in two phases as we noted at the beginning of this work. In the first, we fly a scan pattern at an altitude of 4 m and 3 m/s. Once we have an idea of where the point source can be, we perform a second pattern of scanning at a height of 2 m and 2 m/s. We see that, in this case, we locate the source inside one of the 2 m × 2 m squares of the contour map and in the waterfall plot. With a click on the waterfall plot, we can position the source on the contour map. In addition, in post-processing in 3D, there is no doubt of the approximate location of the source. We say approximate because we have the intrinsic errors of GPS.
In Figure 12, we perform flights perpendicular to the runway and in two phases as in the previous case. Again, we can locate the source more clearly because we detect more counts per second. In this case, we probably fly over the point source or very close to it by performing these perpendicular tracks.
By analysing the spectra individually, we can obtain the activity of the source calculated by the UAS and compare it with the real activity of the point source. A preliminary evaluation of the source activity has been carried out in order to evaluate the developed methodology. The activity was calculated when the detected number of counts was at its maximum (see Figure 12). In this measurement, it is considered that the UAS is flying over the source. The selected spectrum was acquired at 10 h 42 min 36 s at a height of 219 cm over the ground and an acquisition time of 2.50 s. The position measured by the GPS was 41.2881374 of latitude and 1.3315661 of longitude. The total number of counts detected in the photopeak is 32.
The background count rate was obtained using 20 spectra measured at more than 30 m from the source and at a height of around 2 m above the source. The average of these 20 spectra is 1.102 cps, which led to a background count of 2.76 for the 2.50 s acquisition time.
Expression (5) is used for estimating the activity of the source. Its uncertainty is calculated according to the EA-4/02 document [41]. The partial expressions for the uncertainty calculation are presented in Table 2. The term has a contribution to the standard uncertainty of less than 1%; therefore, it is not included in the table.
According to the measured data and considering that the standard uncertainty of the distance is 50 cm and for efficiency is 0.1 cm, the results are shown in Table 3.
Using Expression (1), an activity of the source of 7.4 MBq is calculated at 10:42 a.m. This value is quite close to the 7.1 Bq estimated with the UAS. However, it should be considered that only one value was calculated and the obtained precision can be much lower for other acquired spectra.
It is clear from the results that the parameters that have the most influence over the uncertainty contribution are the distance to the source and the low number of detected counts. This will be overcome in the next system developed by using a NaI scintillator. The much higher efficiency of the NaI compared to the CZT detector will allow flights to be carried out at a higher altitude.
4. Conclusions
With the results obtained, we can conclude that RIMA Spec is capable of detecting and locating point sources. The developed ground station brings new elements to those found in the literature that we consider very useful in the experimental flights. The use of 4G or point-to-point radio modems as ground-to-air communication technology is very suitable for this type of mission. In the event of a radiological incident, the operation must be performed out of the pilot’s line of sight, so long-range communications technologies will be necessary. The activity detected by the UAS is very similar to the real one as we have seen in the previous section. The real-time adjustment of the contour map is critical to be able to differentiate the source from the background. The location has some uncertainty, but we consider that there is enough precision to send a ground patrol to the point source. As we commented before, the parameters that most influence the uncertainty contribution are the distance to the source and the low number of detected counts. Therefore, we are integrating a 2”× 2” NaI detector that will allow us to perform flights at higher altitudes, higher speeds and more cps. Thanks to the software development (RiMASpec) done in this work, we only have to change the detector interface, in the air segment, to perform operations with the new detector.
Author Contributions
P.R. wrote the main part of the manuscript text and designed the field experiments. A.V. performed the calculation of the source activity and analyzed the data obtained, as well as writing the detector and source sections of the paper. P.R., E.P. and C.B. provided the original idea for the UAS software architecture. P.R., R.C. and M.M. implemented the air and ground software. P.R. and R.C. designed the UAS platform and R.C. was the UAS pilot. M.M. performed the validation and flight testing of the laser altimeter. E.P. and C.B. are the PIs of the Spanish grant that provides funding and supervises the study, and have carefully edited the paper. All authors reviewed the manuscript.
Funding
This work has been partially funded by the Ministry of Economy and Enterprise of Spain under contract TRA2016-77012-R and EMPIR within the 16ENV04 (Preparedness) project. The EMPIR initiative is co-funded by the European Union’s Horizon H2020 research and innovation programme and the EMPIR Participating States.
Conflicts of Interest
The authors declare no conflict of interest. The founding sponsors had no role in the design of the study; in the collection, analyses, or interpretation of data; in the writing of the manuscript, and in the decision to publish the results.
Abbreviations
The following abbreviations are used in this manuscript:
| UAS | Unmanned Aircraft System |
| CZT | Cadmium Zinc Telluride |
| GCS | Ground Control Station |
| GPS | Global Positioning System |
| VTOL | Vertical Take-Off and Landing |
| JVM | Java Virtual Machine |
| API | Application Program Interface |
| RPAS | Remotely Piloted Aircraft System |
References
- Watts, A.C.; Ambrosia, V.G.; Hinkley, E.A. Unmanned aircraft systems in remote sensing and scientific research: Classification and considerations of use. Remote Sens. 2012, 4, 1671–1692. [Google Scholar] [CrossRef]
- Dalamagkidis, K. “UAV Applications” in Handbook of Unmanned Aerial Vehicles; Springer: Berlin/Heidelberg, Germany, 2015; pp. 2639–2860. [Google Scholar]
- Salamí, E.; Barrado, C.; Pastor, E. UAV flight experiments applied to the remote sensing of vegetated areas. Remote Sens. 2014, 6, 11051–11081. [Google Scholar] [CrossRef] [Green Version]
- Whitehead, K.; Hugenholtz, C.H. Remote sensing of the environment with small unmanned aircraft systems (UASs), part 1: A review of progress and challenges. J. Unmanned Veh. Syst. 2014, 2, 69–85. [Google Scholar] [CrossRef]
- Gonzalez, L.F.; Montes, G.A.; Puig, E.; Johnson, S.; Mengersen, K.; Gaston, K.J. Unmanned aerial vehicles (UAVs) and artificial intelligence revolutionizing wildlife monitoring and conservation. Sensors 2016, 16, 97. [Google Scholar] [CrossRef] [PubMed] [Green Version]
- Achille, C.; Adami, A.; Chiarini, S.; Cremonesi, S.; Fassi, F.; Fregonese, L.; Taffurelli, L. UAV-based photogrammetry and integrated technologies for architectural applications—Methodological strategies for the after-quake survey of vertical structures in Mantua (Italy). Sensors 2015, 15, 15520–15539. [Google Scholar] [CrossRef] [PubMed] [Green Version]
- Bhardwaj, A.; Sam, L.; Bhardwaj, A.; Martín-Torres, F.J. LiDAR remote sensing of the cryosphere: Present applications and future prospects. Remote Sens. Environ. 2016, 177, 125–143. [Google Scholar] [CrossRef]
- Royo, P.; Pastor, E.; Barrado, C.; Cuadrado, R.; Barrao, F.; Garcia, A. Hardware Design of a Small UAS Helicopter for Remote Sensing Operations. Drones 2017, 1, 3. [Google Scholar] [CrossRef]
- Royo, P.; Barrado, C.; Cuadrado, R.; Pastor, E.; Barrao, F.; Garcia, A. Development of a small UAS helicopter for remote sensing operations. In Proceedings of the 2016 IEEE/AIAA 35th Digital Avionics Systems Conference (DASC), Sacramento, CA, USA, 25–29 September 2016; pp. 1–25. [Google Scholar] [CrossRef]
- MacFarlane, J.W.; Payton, O.D.; Keatley, A.C.; Scott, G.P.; Pullin, H.; Crane, R.A.; Smilion, M.; Popescu, I.; Curlea, V.; Scott, T.B. Lightweight aerial vehicles for monitoring, assessment and mapping of radiation anomalies. J. Environ. Radioact. 2014, 136, 127–130. [Google Scholar] [CrossRef] [PubMed]
- Martin, P.G.; Payton, O.D.; Fardoulis, J.S.; Richards, D.A.; Scott, T.B. The use of unmanned aerial systems for the mapping of legacy uranium mines. J. Environ. Radioact. 2015, 143, 135–140. [Google Scholar] [CrossRef] [PubMed]
- Martin, P.G.; Payton, O.D.; Fardoulis, J.S.; Richards, D.A.; Yamashiki, Y.; Scott, T.B. Low altitude unmanned aerial vehicle for characterising remediation effectiveness following the FDNPP accident. J. Environ. Radioact. 2016, 151, 58–63. [Google Scholar] [CrossRef] [PubMed]
- Martin, P.G.; Kwong, S.; Smith, N.T.; Yamashiki, Y.; Payton, O.D.; Russell-Pavier, F.S.; Fardoulis, J.S.; Richards, D.A.; Scott, T.B. 3D unmanned aerial vehicle radiation mapping for assessing contaminant distribution and mobility. Int. J. Appl. Earth Obs. Geoinf. 2016, 52, 12–19. [Google Scholar] [CrossRef]
- Martin, P.G.; Moore, J.; Fardoulis, J.S.; Payton, O.D.; Scott, T.B. Radiological assessment on interest areas on the sellafield nuclear site via unmanned aerial vehicle. Remote Sens. 2016, 8, 913. [Google Scholar] [CrossRef]
- Aleotti, J.; Micconi, G.; Caselli, S.; Benassi, G.; Zambelli, N.; Calestani, D.; Zanichelli, M.; Bettelli, M.; Zappettini, A. Unmanned aerial vehicle equipped with spectroscopic CdZnTe detector for detection and identification of radiological and nuclear material. In Proceedings of the 2015 IEEE Nuclear Science Symposium and Medical Imaging Conference (NSS/MIC), San Diego, CA, USA, 31 October–7 November 2015; pp. 1–5. [Google Scholar] [CrossRef]
- Cai, C.; Carter, B.; Srivastava, M.; Tsung, J.; Vahedi-Faridi, J.; Wiley, C. Designing a radiation sensing UAV system. In Proceedings of the 2016 IEEE Systems and Information Engineering Design Symposium (SIEDS), Charlottesville, VA, USA, 29 April 2016; pp. 165–169. [Google Scholar] [CrossRef]
- Behnke, D.; Rohde, S.; Wietfeld, C. Design and experimental validation of UAV-assisted radiological and nuclear sensing. In Proceedings of the 2016 IEEE Symposium on Technologies for Homeland Security (HST), Waltham, MA, USA, 10–11 May 2016; pp. 1–6. [Google Scholar] [CrossRef]
- Li, B.; Zhu, Y.; Wang, Z.; Li, C.; Peng, Z.R.; Ge, L. Use of multi-rotor unmanned aerial vehicles for radioactive source search. Remote Sens. 2018, 10, 728. [Google Scholar] [CrossRef]
- Royo, P.; Perez-Batlle, M.; Cuadrado, R.; Pastor, E. Enabling dynamic parametric scans for unmanned aircraft system remote sensing missions. J. Aircr. 2014, 51, 870–882. [Google Scholar] [CrossRef]
- mRo Pixhawk Flight Controller (Pixhawk 1). Available online: https://docs.px4.io/en/flight_controller/mro_pixhawk.html (accessed on 10 September 2018).
- Meier, L.; Tanskanen, P.; Heng, L.; Lee, G.H.; Fraundorfer, F.; Pollefeys, M. PIXHAWK: A Micro Aerial Vehicle Design for Autonomous Flight Using Onboard Computer Vision. Auton. Robots 2012, 33, 21–39. [Google Scholar] [CrossRef]
- PX4 Flight Stack. Available online: http://px4.io/ (accessed on 10 September 2018).
- Ardupilot Flight Stack. Available online: http://ardupilot.org/copter/ (accessed on 10 September 2018).
- SF11/C (120 m) Lightware Laser Altimeter. Available online: https://lightware.co.za/products/sf11-c-120-m (accessed on 10 September 2018).
- Mission Planner Overview. Available online: http://ardupilot.org/planner/docs/mission-planner-overview.html (accessed on 10 September 2018).
- Raspberrry Pi 3 Model B+. Available online: https://www.raspberrypi.org/products/raspberry-pi-3-model-b-plus/ (accessed on 10 September 2018).
- RITEC Radiation Micro Spectrometer uSPEC. Available online: http://www.ritec.lv/uspec.html (accessed on 10 September 2018).
- DJI F550 ARF. Available online: https://www.dji.com/es/flame-wheel-arf (accessed on 11 September 2018).
- Gilmore, G. Practical Gamma-Ray Spectroscopy; John Wiley & Sons Ltd.: West Sussex, UK, 2008. [Google Scholar]
- International Atomic Energy Agency (IAEA). Safety of Radiation Sources: International Basic Safety Standards, General Safety Requirements, IAEA Safety Standards Series No. GSR Part 3; IAEA Publications: Vienna, Austria, 2014. [Google Scholar]
- Sempau, J.; Badal, A.; Brualla, L. A PENELOPE-based system for the automated Monte Carlo simulation of clinacs and voxelized geometries—Application to far-from-axis fields. Med. Phys. 2011, 38, 5887–5895. [Google Scholar] [CrossRef] [PubMed]
- Gasull, M.; Royo, P.; Cuadrado, R. Design a RPAS Software Architecture over DDS. Master’s Thesis, Castelldefels School of Telecommunications and Aerospace Engineering, Castelldefels, Spain, 2016. [Google Scholar]
- Garro Fernandez, J.M. Drone Configuration for Seaside Rescue Missions. Master’s Thesis, Universitat Politècnica de Catalunya, Barcelona, Spain, 2017. [Google Scholar]
- Macias, M. Study of 4G Propagation Conditions Using Unmanned Aerial Systems. Ph.D. Thesis, Universitat Politècnica de Catalunya, Barcelona, Spain, 2018. [Google Scholar]
- Cloud Cap Technology. Piccolo II Product. 2017. Available online: http://www.cloudcaptech.com/products/detail/piccolo-ii (accessed on 7 July 2017).
- Guava EventBus. Available online: https://github.com/google/guava/wiki/EventBusExplained (accessed on 12 September 2018).
- Message Queuing Telemetry Transport (MQTT). Available online: http://mqtt.org/ (accessed on 12 September 2018).
- MAVLink Micro Air Vehicle Communication Protocol. Available online: http://qgroundcontrol.org/mavlink/start (accessed on 12 September 2018).
- Hibernate. Available online: http://hibernate.org/ (accessed on 12 September 2018).
- H2 Database Engine. Available online: http://www.h2database.com/html/main.html (accessed on 12 September 2018).
- European Accreditation. EA-4/02 M: 2013 Evaluation of the Uncertainty of Measurement in Calibration. 2013, p. 75. Available online: https://www.twirpx.com/file/1996254/ (accessed on 12 September 2018).
Figure 1.
Hardware architecture block diagram.

Figure 2.
Unmanned Aircraft Platform with the onboard computing.

Figure 3.
The main concepts of RIMA architecture.

Figure 4.
Main features of RIMA.

Figure 5.
RIMASpec Air Segment Block Architecture.

Figure 6.
RIMASpec Multichannel Air-Ground Communications.

Figure 7.
RIMASpec Ground Segment Block Architecture.

Figure 8.
RIMASpec Ground Control Station screenshot and description windows.

Figure 9.
Flight plans designed for the experimental flight campaign. Parallel to the runway (A,B), perpendicular to the runway (C,D). The width of the runway is 20 m.
Figure 9.
Flight plans designed for the experimental flight campaign. Parallel to the runway (A,B), perpendicular to the runway (C,D). The width of the runway is 20 m.

Figure 10.
Real-time and post-processing results of the flight experiments at 5 m.

Figure 11.
Real-time and post-processing results of the experimental flights parallel to the runway.
Figure 11.
Real-time and post-processing results of the experimental flights parallel to the runway.

Figure 12.
Real-time and post-processing results of the experimental flights perpendicular to the runway.
Figure 12.
Real-time and post-processing results of the experimental flights perpendicular to the runway.


Table 1.
Pixhawk and laser altimeter configuration parameters.
| PIXHAWK | LASER ALTIMETER | ||||
|---|---|---|---|---|---|
| Parameter Name | Value | Parameter Name | Value | Parameter Name | Value |
| SERIAL4_PROTOCOL | 9 | SERIAL4_BAUD | 19 | Zero Datum Offset | 0.10 |
| RNGFND_TYPE | 8 | RNGFND_SCALING | 1 | Measuring Mode | Quick response |
| RNGFND_MIN_CM | 1 | RNGFND_MAX_CM | 12,000 | Median Filter | On |
| RNGFND_GNDCLEAR | 10 | EK2_ALT_SOURCE | 2 | Median Filter Size | 5 |
| EK2_RNG_USE_HGT | 70 | EK2_GPS_TYPE | 0 | ||
| EK2_RNG_M_NSE | 9.5 | EK2_ALT_M_NSE | 1 | ||
| AHRS_EKF_USE | 1 | AHRS_EKF_TYPE | 2 | ||
Table 2.
Contributions to the combined uncertainty for the activity estimation.
| Quantity | Estimate | Type | Standard Uncertainty ) | Probability Distribution | Sensitivity Coefficient | Contribution to the Standard Uncertainty u (y) | |
|---|---|---|---|---|---|---|---|
| A | Normal | ||||||
| A | Normal | ||||||
| d | d (cm) | B | Experimental | Normal | |||
| (cm) | B | Experimental | Normal | ||||
| A | Equation (5) | Combined uncertainty (u) | |||||
| Expanded uncertainty (U) | |||||||
Table 3.
Results of the uncertainty contribution for the source activity.
| Quantity | Estimate | Standard Uncertainty ) | Sensitivity Coefficient | Contribution to the Standard Uncertainty (y) | |
|---|---|---|---|---|---|
| 32 | 5.7 | 235,584 | 1,332,664 | ||
| 2.76 | 1.7 | −235,584 | −391,382 | ||
| d | 219 | 50 | 62,876 | 3,143,800 | |
| 1.15 | 0.10 | −5,986,917 | −598,692 | ||
| 7.1 | Combined uncertainty (u) | 3.5 | |||
| Expanded uncertainty (U) k = 2 | 7.0 | ||||
© 2018 by the authors. Licensee MDPI, Basel, Switzerland. This article is an open access article distributed under the terms and conditions of the Creative Commons Attribution (CC BY) license (http://creativecommons.org/licenses/by/4.0/).
Share and Cite
MDPI and ACS Style
Royo, P.; Pastor, E.; Macias, M.; Cuadrado, R.; Barrado, C.; Vargas, A. An Unmanned Aircraft System to Detect a Radiological Point Source Using RIMA Software Architecture. Remote Sens. 2018, 10, 1712. https://doi.org/10.3390/rs10111712
AMA Style
Royo P, Pastor E, Macias M, Cuadrado R, Barrado C, Vargas A. An Unmanned Aircraft System to Detect a Radiological Point Source Using RIMA Software Architecture. Remote Sensing. 2018; 10(11):1712. https://doi.org/10.3390/rs10111712
Chicago/Turabian StyleRoyo, Pablo, Enric Pastor, Miquel Macias, Raul Cuadrado, Cristina Barrado, and Arturo Vargas. 2018. "An Unmanned Aircraft System to Detect a Radiological Point Source Using RIMA Software Architecture" Remote Sensing 10, no. 11: 1712. https://doi.org/10.3390/rs10111712
Note that from the first issue of 2016, this journal uses article numbers instead of page numbers. See further details here.