Monitoring Coastal Reclamation Subsidence in Hong Kong with Distributed Scatterer Interferometry

1
State Key Laboratory of Geodesy and Earth’s Dynamics, Institute of Geodesy and Geophysics, Chinese Academy of Sciences, 340 XuDong Rd, Wuhan 430077, China
2
University of Chinese Academy of Sciences, 19A Yuquan Rd., Beijing 100049, China
3
School of Earth Science and Engineering, Hohai University, 1 Xikang Rd., Nanjing 210098, China
4
Institute of Space and Earth Information Science, Chinese University of Hong Kong, Shatin, N.T., Hong Kong 999077, China
5
Geography and Resource Management, Chinese University of Hong Kong, Shatin, N.T., Hong Kong 999077, China
*
Author to whom correspondence should be addressed.
Remote Sens. 2018, 10(11), 1738; https://doi.org/10.3390/rs10111738
Submission received: 30 August 2018
/
Revised: 29 October 2018
/
Accepted: 1 November 2018
/
Published: 3 November 2018
(This article belongs to the Special Issue Imaging Geodesy and Infrastructure Monitoring)
Abstract
:Land subsidence has been a significant problem in land reclaimed from the sea, and it is usually characterized by a differential settlement pattern due to locally unconsolidated marine sediments and fill materials. Time series Synthetic Aperture Radar Interferometry (InSAR) techniques based on distributed scatterers (DS), which can identify sufficient measurement points (MPs) when point-wise radar targets are lacking, have great potential to measure such differential reclamation settlement. However, the computational time cost has been the main drawback of current distributed scatterer interferometry (DSI) for its applications compared to the standard PSI analysis. In this paper, we adopted an improved DSI processing strategy for a fast and robust analysis of land subsidence in reclaimed regions, which is characterized by an integration of fast statistically homogeneous pixel selection based (FaSHPS-based) DS detection and eigendecomposition phase optimization. We demonstrate the advantages of the proposed DSI strategy in computational efficiency and deformation estimation reliability by applying it to two TerraSAR-X image data stacks from 2008 to 2009 to retrieve land subsidence over two typical reclaimed regions of Hong Kong International Airport (HKIA) and Hong Kong Science Park (HKSP). Compared with the state-of-the-art DSI methods, the proposed strategy significantly improves the computational efficiency, which is enhanced approximately 30 times in DS identification and 20 times in phase optimization. On average, the DSI strategy results in 7.8 and 3.7 times the detected number of MPs for HKIA and HKSP with respect to persistent scatter interferometry (PSI), which enables a very detailed characterization of locally differential settlement patterns. Moreover, the DSI-derived results agree well with the levelling survey measurements at HKIA, with a mean difference of 1.87 mm/yr and a standard deviation of 2.08 mm/yr. The results demonstrate that the proposed DSI strategy is effective at improving target density, accuracy and efficiency in monitoring ground deformation, particularly over reclaimed coastal areas.
1. Introduction
Reclamation of land from the shallow sea to create new land has been a common practice to meet the increasing demand for urbanization and population growth in coastal regions worldwide [1,2]. The reclaimed areas are typically used for infrastructure constructions, such as skyscrapers, ports, airports and other municipal utilities. However, land subsidence has been a significant problem in reclaimed areas, because reclamation is usually carried out by dumping uncompacted fill materials onto a seabed of unconsolidated marine sediment [2,3]. In particular, reclamation settlement is generally characterized by a variable and localized settlement pattern, which can lead to damage to ground constructions (e.g., buildings, bridges, runways and highways), as well as underground facilities [3,4]. Therefore, accurate and detailed measurements of land subsidence are crucial for reducing geological hazards and economic losses in reclaimed regions [5].
Over the past two decades, a number of Synthetic Aperture Radar Interferometry (InSAR) techniques based on persistent scatterers (PS) [6,7,8,9], which are referred to as persistent scatter interferometry (PSI), have proven to be powerful remote sensing techniques for measuring and monitoring subtle displacements in the Earth’s surface over time, particularly in urban areas, with an unprecedented accuracy of up to mm/yr. Some of these PSI techniques have been exploited to investigate ground deformation related to land reclamation around the world [2,3,10,11,12]. Jiang et al. [3] retrieved the settlement rates and deformation history for Hong Kong International Airport (HKIA) using SAR Interferometric Point Target Analysis (IPTA) [8], and they revealed alluvium consolidation mechanisms of the residual reclamation settlement with an integrated analysis of SAR interferometric, geological and geotechnical multidisciplinary data. Jiang et al. [12] applied the IPTA technique using a total of 22 Envisat ASAR images acquired between 2006 and 2009 to analyse the spatial and temporal behaviour of reclamation settlements in the Macao region. Ng et al. [13] mapped the land subsidence in Jakarta, Indonesia with 17 ALOS PALSAR images acquired between 2007 and 2010 using GEOS-PSI analysis. However, PSI techniques only focus on point-wise radar targets with high reflectivity and stable phase characteristics over time, most of which belong to angular, man-made objects such as building facades and corners. Consequently, this PSI technique limitation usually leads to a low spatial density of PSs in coastal reclamation land characterized with natural targets or low reflectivity regions, especially for newly developed reclamation or some reclaimed civil infrastructures (e.g., highways, ports and airfields) [3,14,15,16].
In contrast to PSI techniques, another class of time series InSAR techniques (referred to as DS methods) extract information from radar targets known as distributed scatterers, which normally involve a coherent sum of many independent small scatterers without one being dominant [17,18]. The DS pixels are usually identified in correspondence to bare soil, sparsely vegetated land or highways. Several conventional DS-based InSAR techniques such as Small Baseline Subset (SBAS) [14,19,20], Poly-Interferogram Rate And Time-series Estimator (π-RATE) [21], and the Temporally Coherent Point InSAR (TCPInSAR) [22] were applied to monitor land deformation in reclaimed areas. Xu et al. [23] proposed an elaborated SBAS strategy to process an Envisat ASAR dataset acquired between 2007 and 2010 and analysed the evolution of land reclamation in Shenzhen. Wang et al. [24] utilized an advanced SBAS method to investigate the subsidence time series of reclaimed lands in Hong Kong with TerraSAR-X images acquired between October 2008 and December 2009. Wang et al. [25] combined multi-track interferograms from different viewing geometries to estimate a linear rate map for the Pearl River Delta based on the π-RATE method. While these DS techniques could improve the density of MPs to a certain degree, it is still a challenge to monitor differential reclamation settlement due to the degradation of image resolution in the multi-looking process, as well as the possible errors that occur during phase unwrapping [26,27].
Ferretti et al. [28] proposed a new generation distributed scatterer interferometry (DSI) approach named SqueeSAR™, which increases the density of MPs and extracts deformation from both PSs and DSs by considering the different statistical behaviour properties and processing them together. In this approach, an amplitude-based statistical test (Kolmogorov–Smirnov test) is exploited to adaptively select homogeneous pixels and accurately estimate the covariance matrix; a phase triangulation algorithm, which is based on a maximum likelihood (ML) estimator, is applied to each DS to retrieve the optimized phase estimates of the N−1 phase based on N(N−1)/2 interferograms generated from N SAR images. As demonstrated in [28,29,30,31,32], the SqueeSAR™ approach and its variants can significantly improve the density and quality of InSAR MPs over non-urban areas. However, this DSI techniques also have their drawbacks. First, the accuracy of selected homogeneous pixels is usually unsatisfactory for small stack sizes, since the low test power increases the false positive ratio, and the empirical distribution function (EDF) test is more susceptible to the data distribution shape variability [33]. Second, the ML estimator needs to iteratively solve the nonlinear optimal phase and ignores the different scattering components corresponding to the different scattering mechanisms [34,35]. Finally, from a computational standpoint, both the selection of statistically homogeneous pixels (SHPs) and phase triangulation algorithm are very time consuming [33,35]. Recently, some improved algorithms have tried to solve the above stated problems. A phase-decomposition-based persistent scatterer InSAR (PD-PSInSAR) was developed to perform the eigendecomposition phase optimization on a coherence matrix to estimate the phases corresponding to the different scattering mechanisms, as well as reduce the computational requirements [35]. Dong et al. [36] adopted the generalized likelihood ratio (GLR) test as an alternative to the KS test to robustly discern SHP pixels from small SAR data stacks, which was utilized to map landslide surface displacements.
In this paper, we aim to monitor reclamation subsidence in two well-known coastal reclaimed regions (Hong Kong International Airport and Hong Kong Science Park) with an improved DSI processing strategy, by joint use of both algorithms from fast statistically homogeneous pixel selection (FaSHPS) [33] and eigendecomposition [35]. The practical implementation involves the efficient and reliable identification of SHPs based on the FaSHPS algorithm and estimation of the optimal phase based on eigendecomposition. Further, the detected DSs and PSs are jointly processed in the conventional time series InSAR analysis within the IPTA framework [8] to retrieve and characterize spatiotemporal variations of ground deformation in reclaimed coastal areas of Hong Kong. Moreover, a comparison between DSI-derived results and levelling survey measurements is carried out in HKIA to validate the InSAR observations. Finally, the performance and computational efficiency of the proposed DSI strategy are discussed to demonstrate the effectiveness in monitoring ground deformation, particularly over reclaimed coastal areas.
2. Study Area and Data Used
2.1. Study Area
Land reclamation from the sea has long been used in mountainous Hong Kong to expand the limited supply of usable land, with a total of approximately 70.19 square kilometres of land reclaimed since 1887 [37]. In this study, two of the largest reclaimed areas in Hong Kong were selected for the investigation of reclamation subsidence using our proposed DSI strategy.
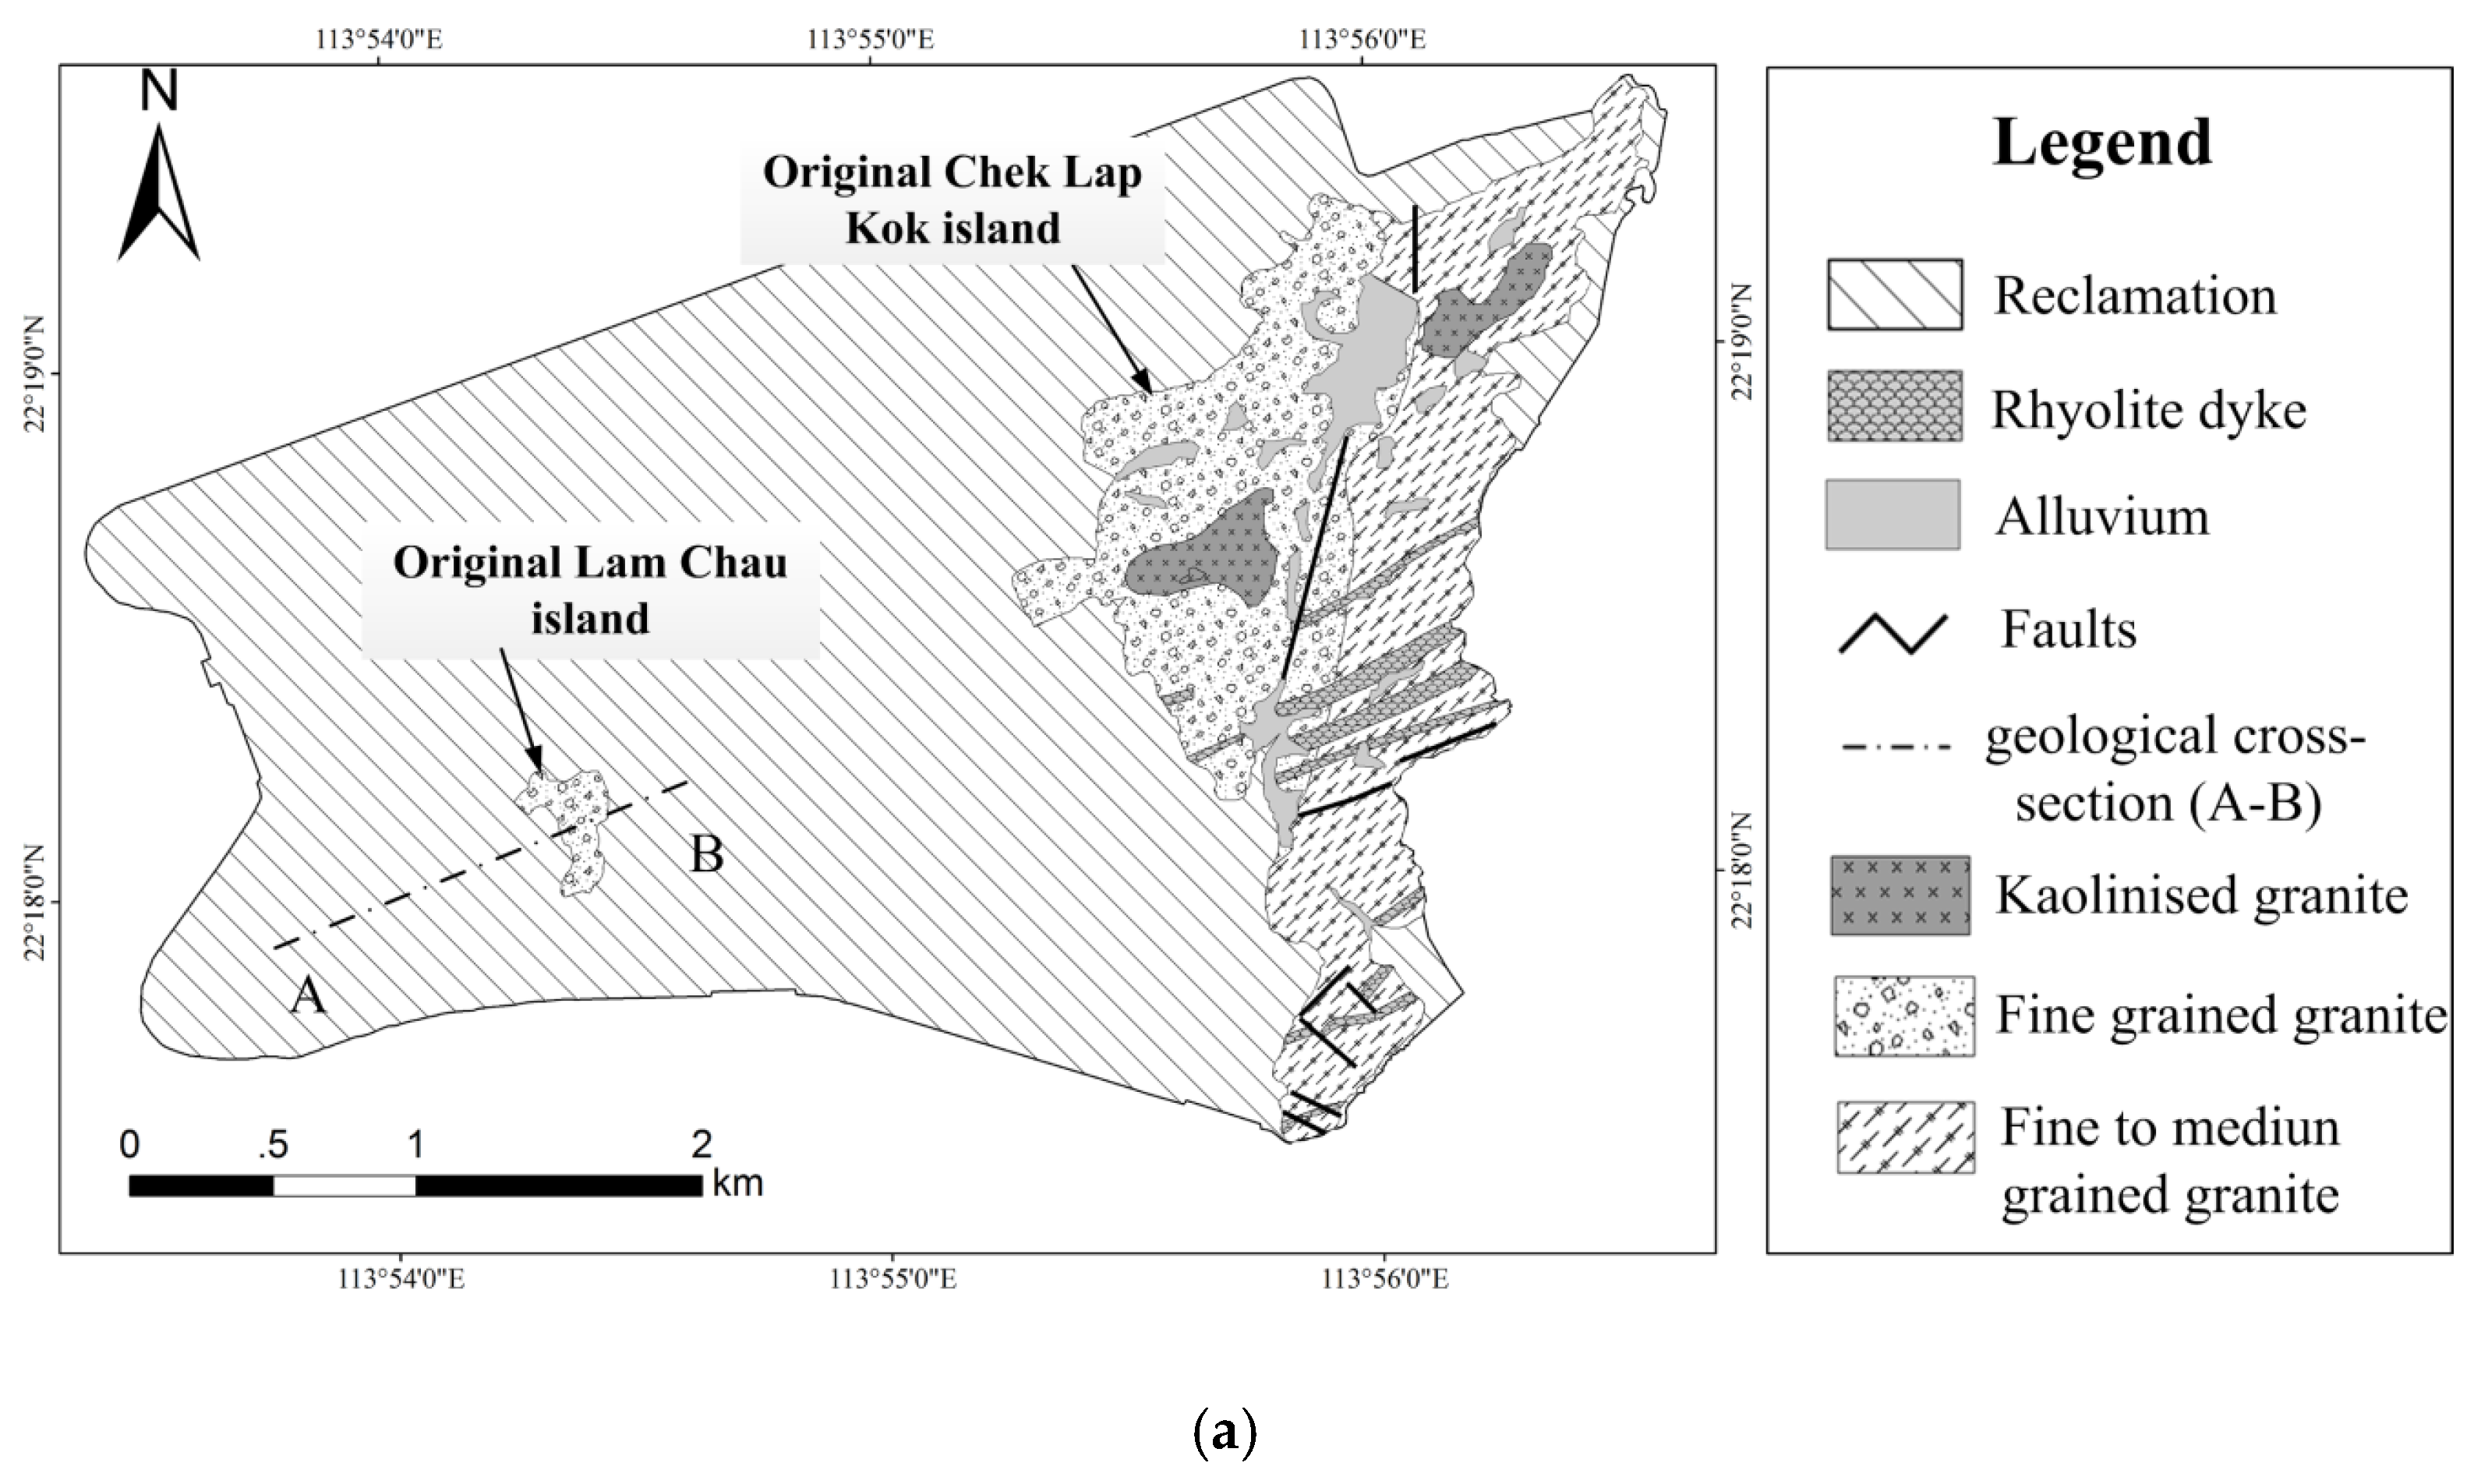
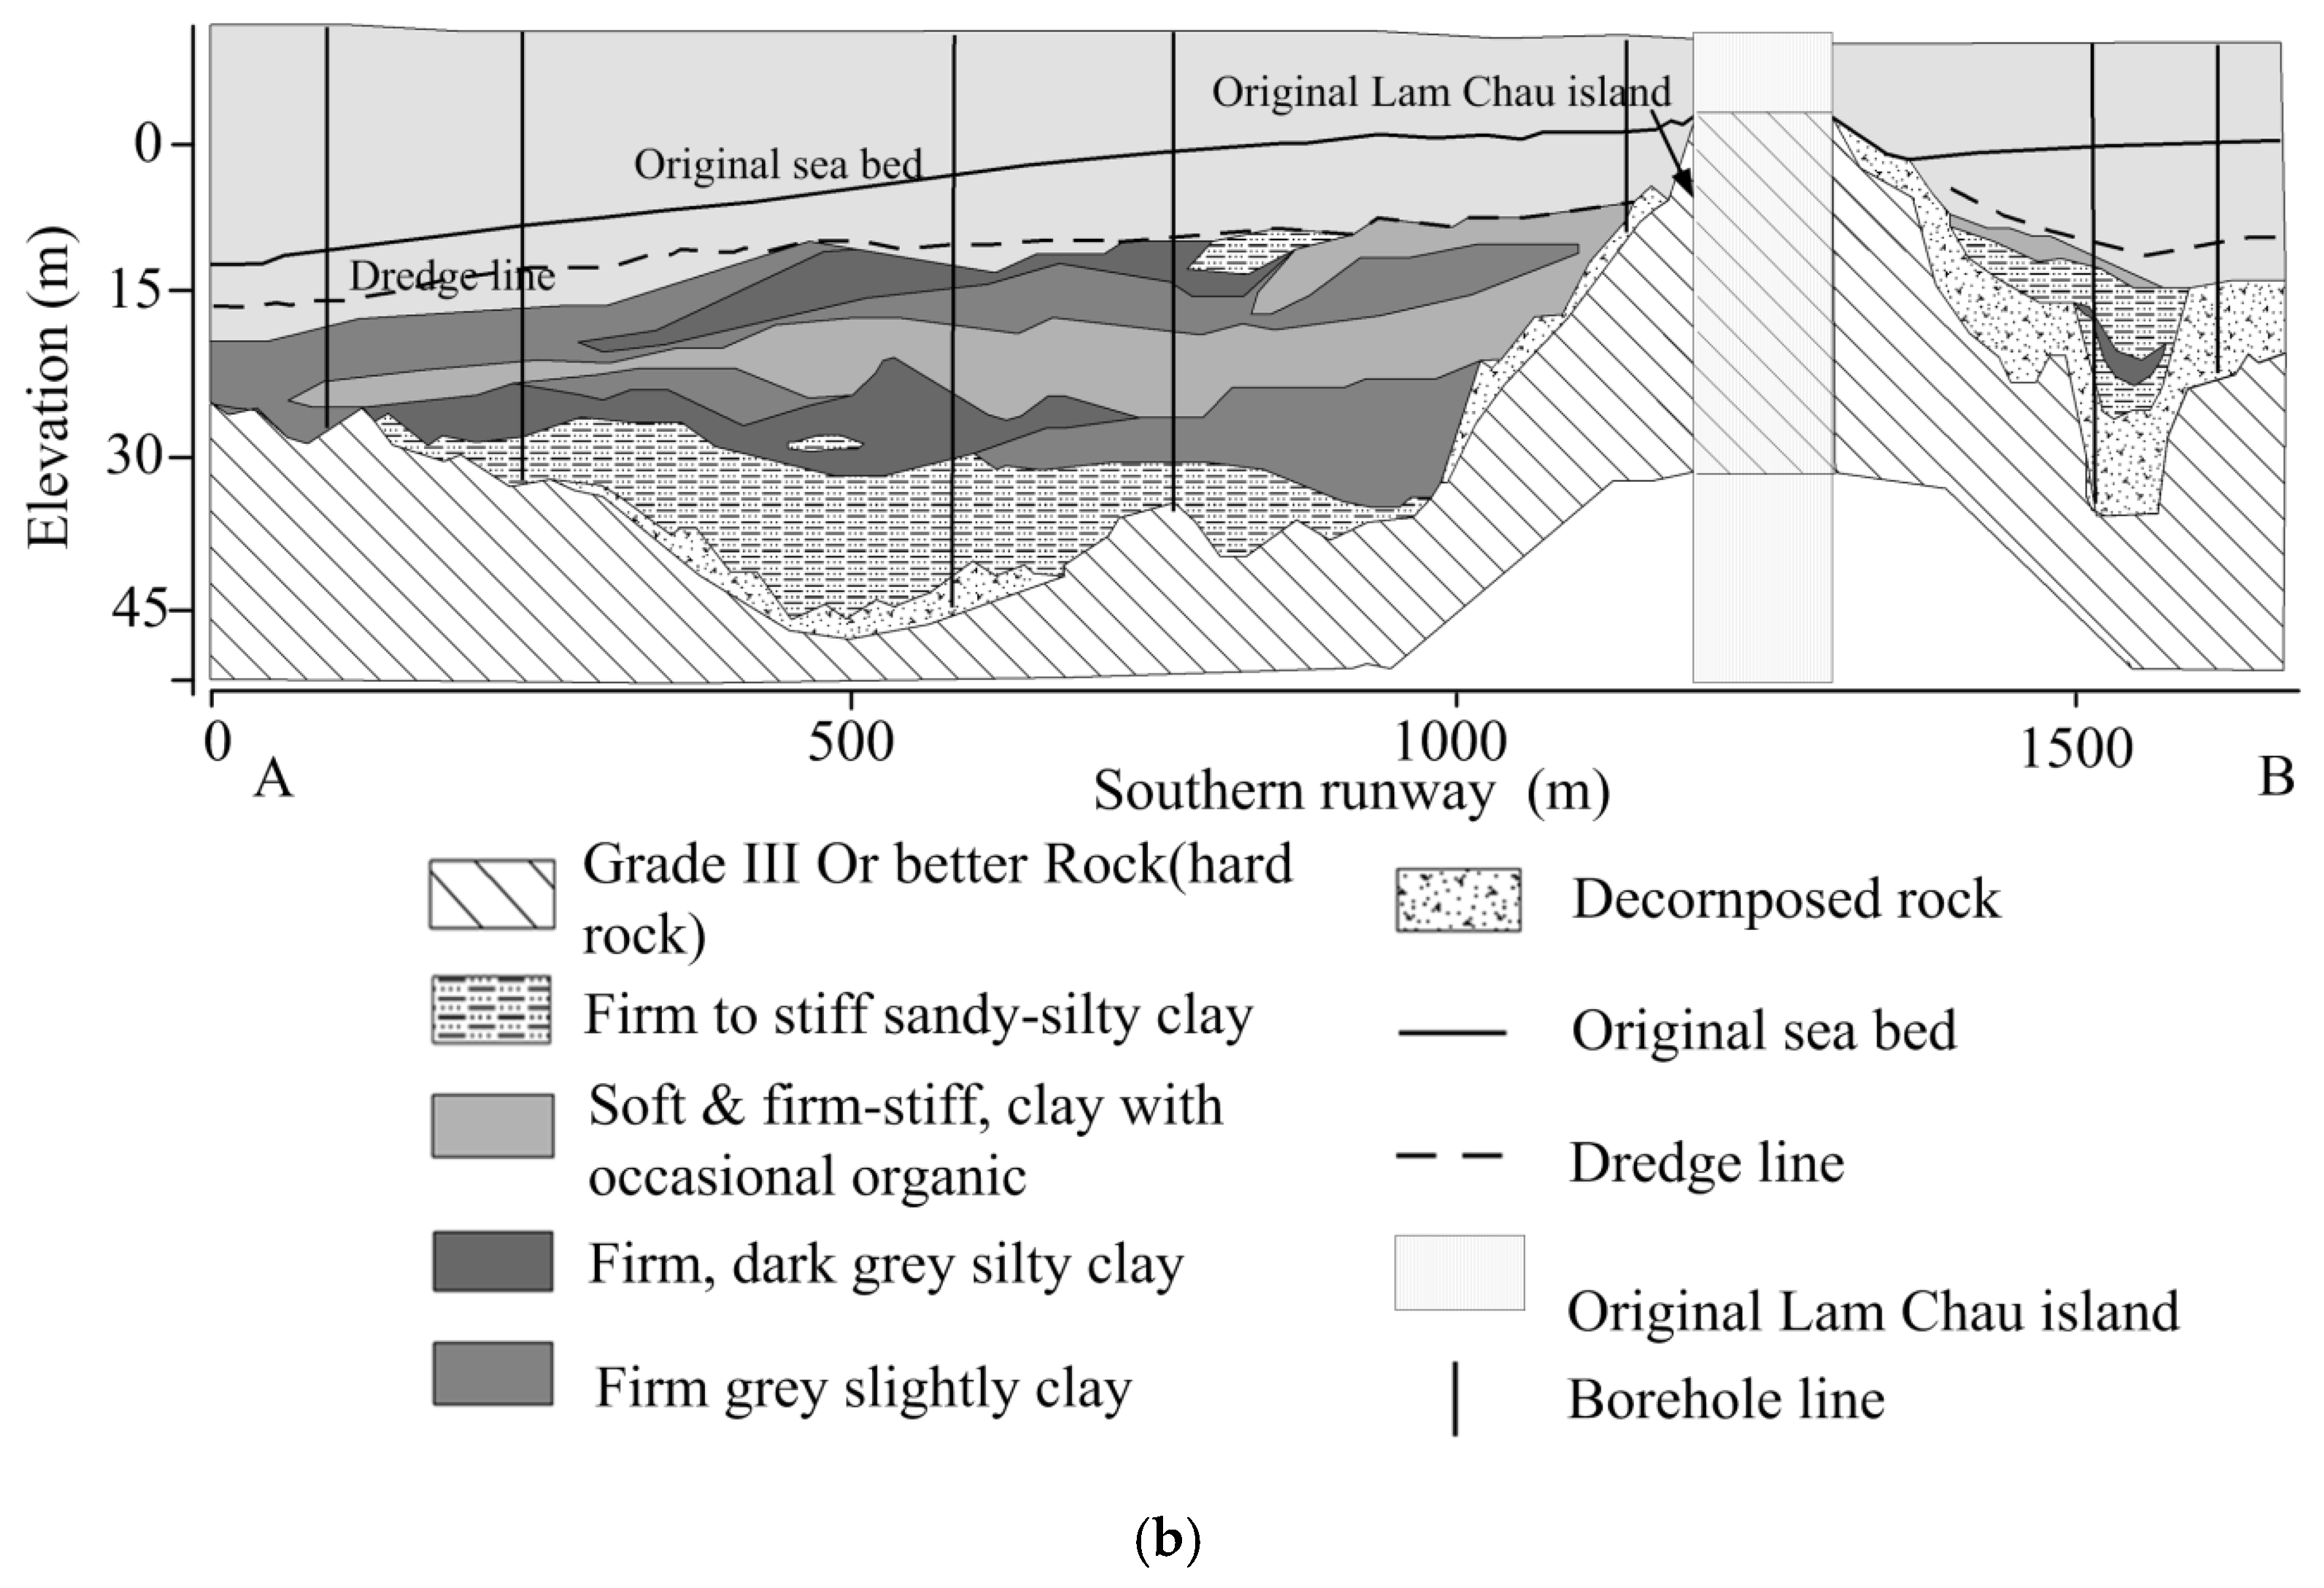
The first site is the Hong Kong International Airport (HKIA), which is located in the eastern part of the Pearl River estuary off the northern coast of Hong Kong’s largest island, Lantau Island. HKIA lies between 22°17’25″N and 22°19’28″N latitude and 113°53’35″E and 113°56’42″E longitude with a ground extent of 3.9 km × 4.9 km. The airport was reclaimed for 10 years and started operation on 6 July 1998. Three-quarters (9.38 km2) of the airport platform of 12.48 km2 was reclaimed from the sea, whereas the remaining quarter was formed by excavating two existing islands: Chek Lap Kok Island (3.02 km2) and its smaller neighbour, Lam Chau Island (0.08 km2) [38]. A zoomed-in view of the airport is shown in Figure 1. The bedrock geology and the geological cross-section along a portion of the southern runway of the airport is shown in Figure 2. It was dominated by a granitic geology in the two original islands, and there is a compressible alluvial stratum comprising soft to firm grey silts and clays occasionally with organic remains located in the cross-section of southern runway. Due to soil consolidation of the underlying unconsolidated marine sediments, the Airport’s platform has been experiencing ground subsidence in relation to various geotechnical characteristics since reclamation began in late 1992 [3,38,39].
The second site is Hong Kong Science Park (HKSP), which is situated in Pak Shek Kok, New Territories on the boundary of Sha Tin District and Tai Po District; this area is also next to the Chinese University of Hong Kong in Ma Liu Shui (see Figure 1). As a research base of approximately 9 square kilometres with superior and applied technology in Hong Kong, HKSP was reclaimed at the end of the last century, and the first phase of the project was completed in October 2004; therefore, this area still experiences land settlement even though more than twenty years have passed since the reclamation occurred [24]. As newly developed reclamation land, man-made structures are relatively scarce in this area, which were only distributed in the southeast corner of the area during the study period. Moreover, the northern area of HKSP is a rural region, which is mostly covered by short vegetation and bare soil; thus, this is an ideal area for testing our algorithm.
2.2. Dataset Used
Two datasets of time series TerraSAR-X images are exploited to investigate coastal reclamation subsidence with our proposed DSI strategy: 29 TerraSAR-X High Resolution Spotlight images over HKIA, which were acquired between October 2008 and December 2009; and 22 TerraSAR-X Stripmap images over HKSP, which were acquired between May 2008 and December 2009. The former images were acquired in descending orbit (Track 43) at VV polarization with a mean incidence angle of 38.7°, and the latter images were captured in ascending orbit (Track 51) at VV polarization with an average incidence angle of 37.3°. The SAR images acquired on 10 May 2009 in Spotlight mode and 23 February 2009 in Stripmap mode were selected as the master images. Temporal/perpendicular baseline plots of two SAR datasets are shown in Figure 3. Moreover, the three arc-second DEM acquired from the Shuttle Radar Topography Mission (SRTM) was used to derive the topographic phase and remove it from differential interferograms.
3. Methodology
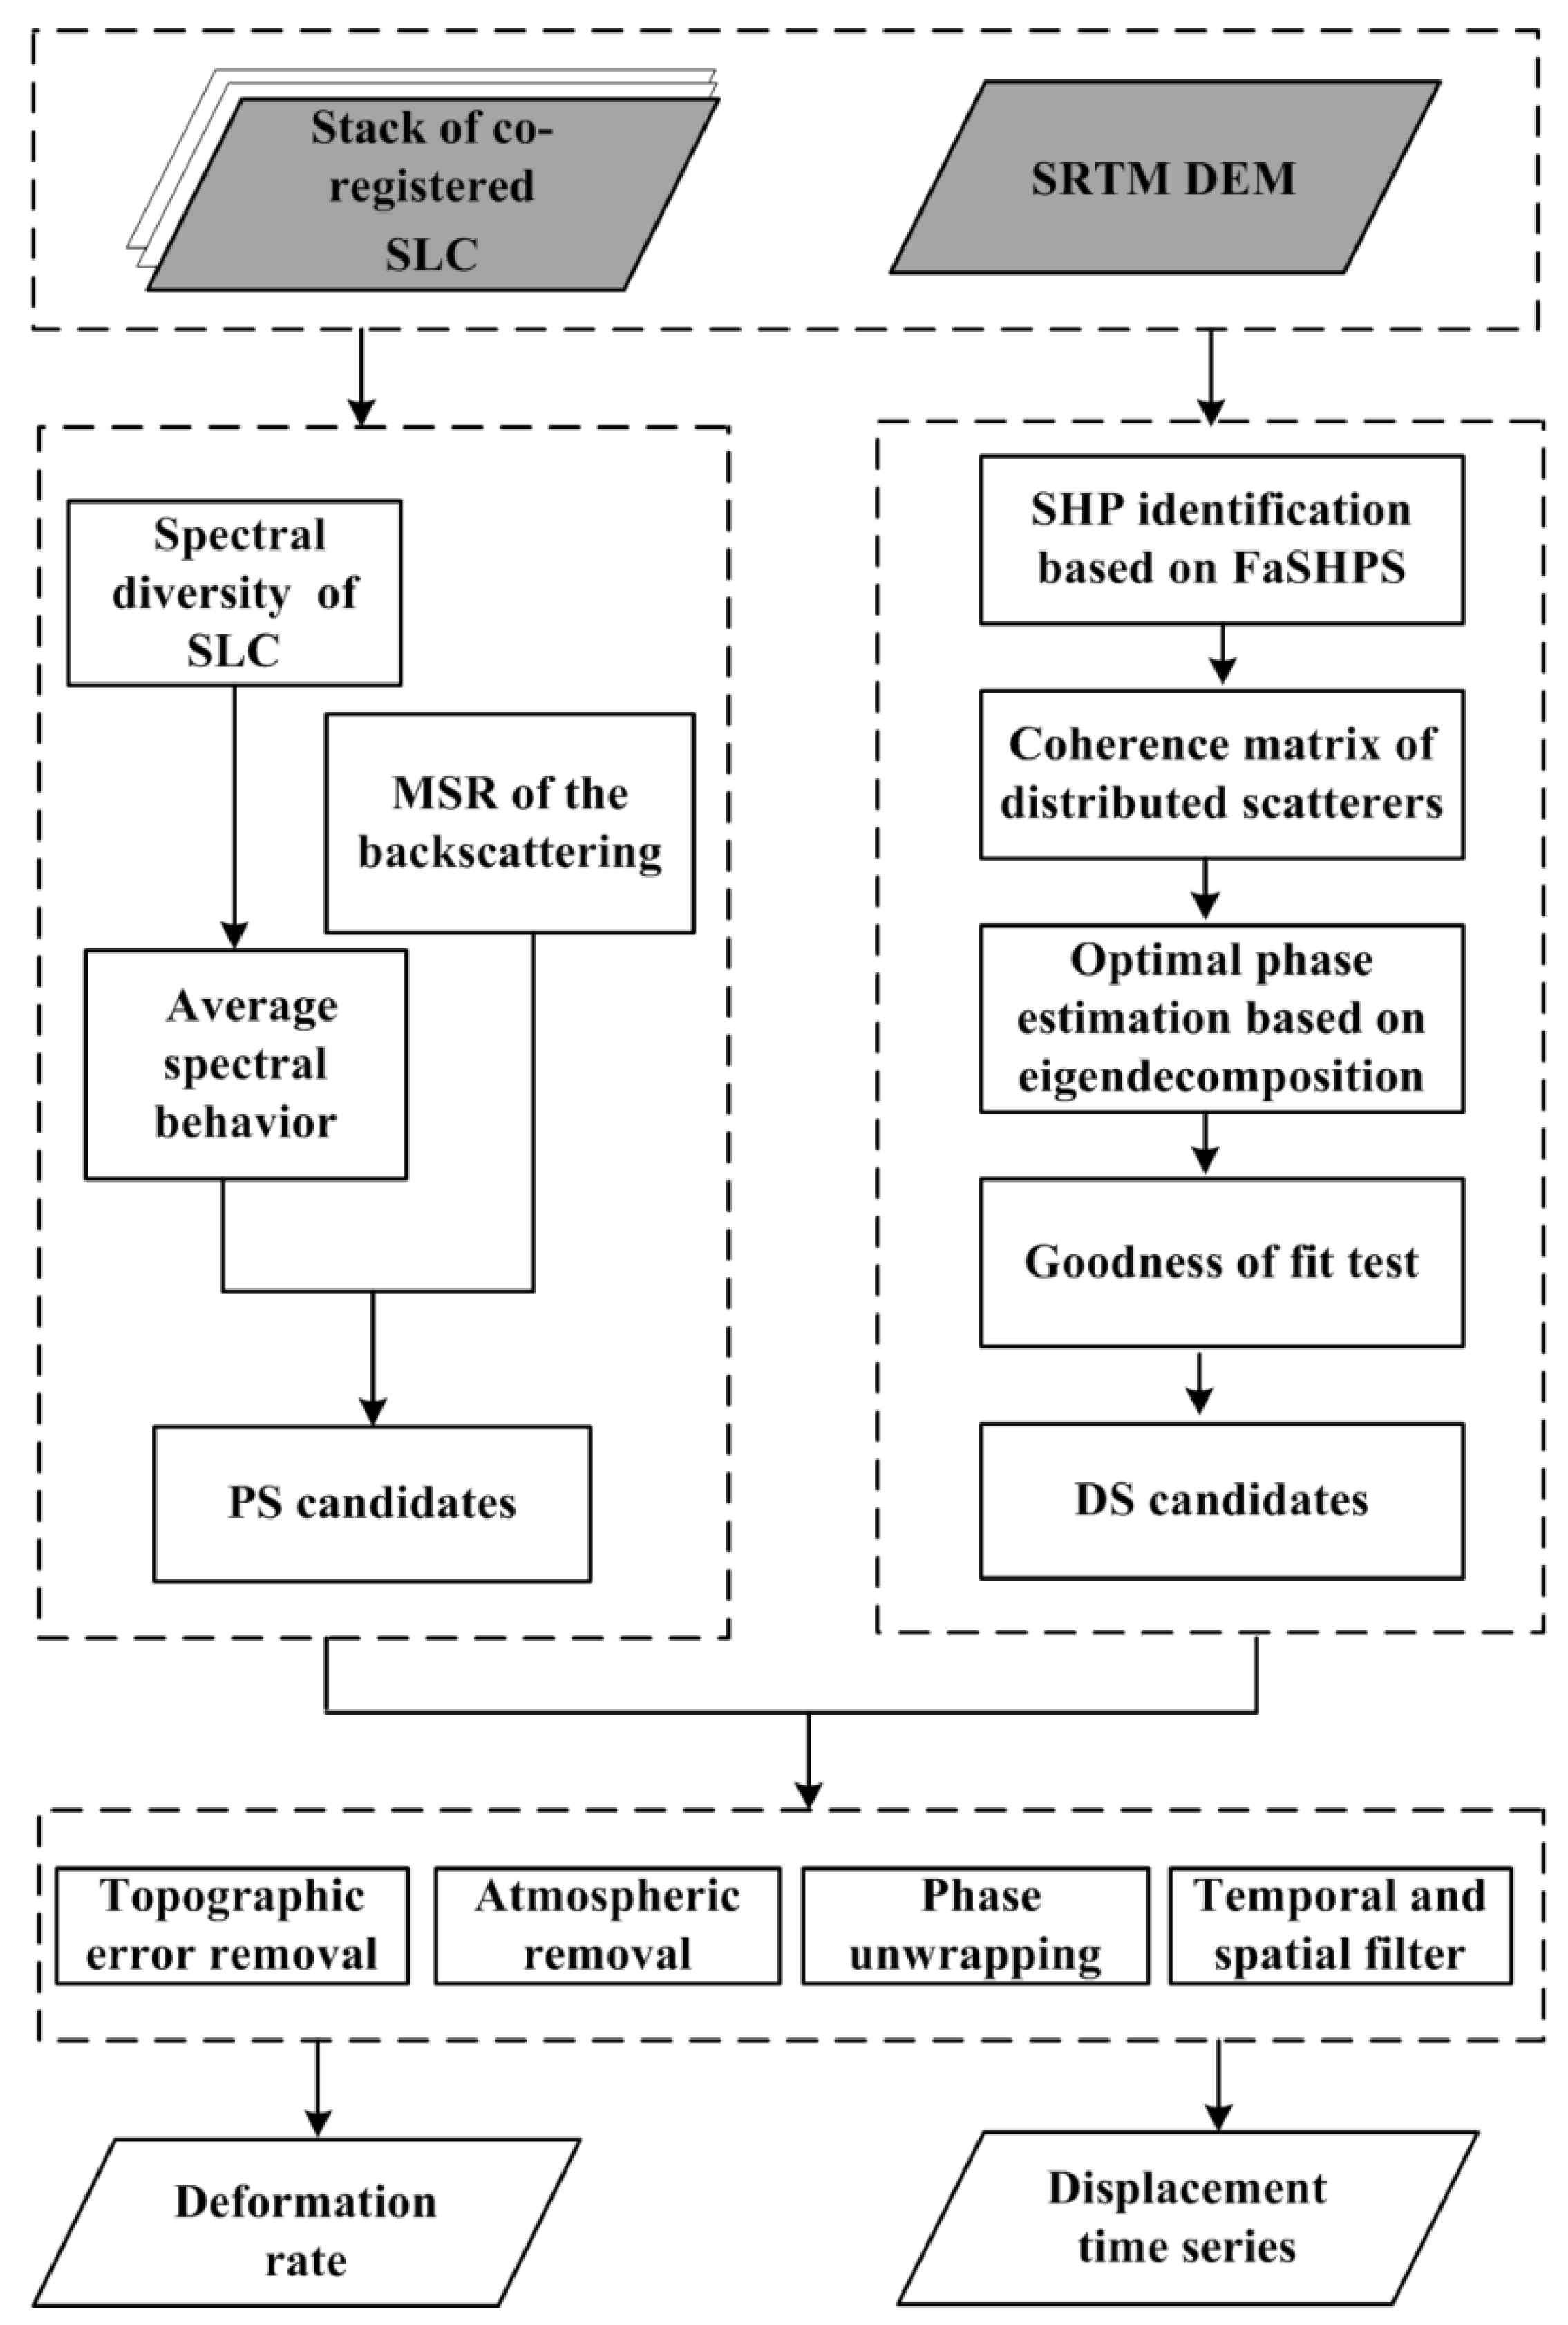
The workflow of the improved DSI processing strategy developed for data processing is graphically represented in Figure 4. In the following sections, the key steps will be explained in detail.
3.1. Selection of PS Points
Two methods are utilized in IPTA to select PS candidate points and then merged to a single point list [8]. The first method considers the spectral characteristics of the coregistered SLC to identify point targets based on low spectral phase diversity. The spectral characteristics are averaged over the stack of SLC and then the average spectral behavior is used to determine the candidate points. The second method is based on point targets that remain unchanged over time and therefore have low temporal intensity variability. The mean to standard deviation ratio (MSR) is used as the measure of the temporal variability of the backscattering. In this study, we consider only the pixels exhibiting average of the time series spectral diversity values greater than 0.4 and having MSR values greater than 1.5 as PS candidate points.
3.2 Selection of DS Targets
3.2.1. Identification of SHP
Various statistical techniques have been proposed in recent years to identify SHP such as the Kolmogorov–Smirnov test [28], Kullback–Leibler divergence test [26], Anderson–Darling test [20] and likelihood ratio test [35]. All these hypothesis methods are built based on the amplitude information to evaluate the similarity between two pixels, and these methods were used to determine if the two pixels belonged to the same distribution. However, these methods are very time consuming and have lower test power to reject a false null hypothesis (no significant difference in population from different groups), particularly for small stack samples [33].
We introduced the FaSHPS algorithm into the proposed DSI processing strategy to solve these above stated problems. It is a method that converts a hypothesis test problem into a confidence interval estimate under the Gaussian hypothesis. Assuming that Z is a single-look complex image (L = 1) which has a sufficiently large number of distributed targets within a resolution cell, the amplitude A = |Z| has a Rayleigh distribution, and its probability density function (PDF) is defined as p(A) = with a mean and variance . For a DS point to be estimated, its N time amplitude samples can be written as {}, and the point estimate of mean for pixel p is . Thus, according to the central limit theorem, the optimum interval containing the form of Jiang et al. [33] is as follows:
where is the percentile of the standard normal distribution.
The initial estimate of mean is determined by averaging neighbours lying in the interval under including pixels that are spatially connected and distant from the centre pixel. Then, Equation (1) is used again for the same neighbours with the refined value of , whose temporal sample mean located in the interval and connected to the centre pixel directly or through another SHP are regarded as the homogeneous pixels of the reference pixel.
3.2.2. Coherence Covariance Matrix
The coherence matrix between two SLCs plays a crucial role in characterizing the statistical parameters of each DS such as the interferometric phase and coherence [18,40]. Since actual values of the coherence matrix are difficult to obtain in practice, a spatial average of the pixels in a simple rectangular window is often used as a compromise. However, this average will suffer from a biased estimate of coherence observations due to the risk of indiscriminate averaging from different scattering properties. This problem can be mitigated by identifying the homogeneous pixels with the same statistical distribution to obtain a more accurate interference phase and coherence. After identification of the SHP of the reference pixel, the coherence matrix of the estimated sample SHPs can be given by the following:
where E is the expectation, is the normalized complex observation vector in the time series of the N SAR image, and = 1. The parameter. H indicates the Hermitian conjugation and Ω is a homogeneous patch containing the homogeneous pixel of that reference pixel. The absolute values and phase values of the off-diagonal elements of T are the estimated coherence value
and spatially filtered interferometric phase φ, respectively [28]. Therefore, T can be expressed as follows:
indicates the interferometric phases between the mth acquisition and nth acquisition [28,35].
3.2.3. Estimation of the Optimal Phase Based on Eigendecomposition
After the SHP identifications and coherence matrix calculation, the next step is estimation of the optimal interferometric phases associated with each DS pixel. SqueeSAR™ utilizes the phase triangulation algorithm to obtain the best estimates of the N − 1 phases from N(N − 1)/2 off-diagonal interferometric phases in the coherence matrix [28]. A main limitation of this method is the heavy computing burden and required iterative optimization process. To efficiently estimate the optimal phases corresponding to the different scattering mechanisms, we perform the eigendecomposition on a coherence matrix followed by [34,35]. The eigendecomposition of the covariance matrix T can be obtained as follows:
where is the eigenvalue and is the corresponding eigenvector. All the eigenvalues of T are sorted in descending order such as . Assuming that the effective phase was the first n feature matrix and the latter N − n was the noise phase, the coherence matrix can be rewritten as follows:
3.2.4. Goodness of Fit Test
The goodness of fit is used to evaluate the quality of the optimal phase with respect to each DS pixel. Assuming that the estimated optimal phase was and the original interferometric phase of the nth SLC and the kth SLC was , the goodness of fit test can be expressed by the following [28]:
According to the given threshold, only an initial DS candidate point exhibiting a value higher than the threshold was retained and substituted the phase value of the original SAR images with their optimized values.
3.3. Time Series InSAR Analysis
The DS targets with estimated optimal phases are equivalent to quasi-PS targets, and they can be combined with PS targets for further analysis using a standard PSI tool [28,35,36]. In this study, only initial DS candidates exhibiting an index higher than 0.75 are processed together with the PSs using the time series InSAR analysis within the IPTA framework [8] to derive the displacement time series for each MP. Following the previous literature [28,35,36], we assumed that the final DS targets contain the same atmospheric signal as the PS in our study. First, the 2D linear regression analysis of the interferometric phase has been performed for phase unwrapping in the temporal domain and for solving both height correction with respect to an external DEM and deformation rate of the point target relative to the reference. Then the residual phases were calculated by removing the phase contribution due to model parameters. The atmospheric phase and nonlinear deformation of the residual phase could be discriminated based on their different spatial and temporal behaviour. Finally, iterative regression analysis is used to improve the model parameters including the point height, the linear deformation rate and the atmospheric phases.
4. Results
4.1. Hong Kong International Airport
4.1.1. PSI vs. DSI
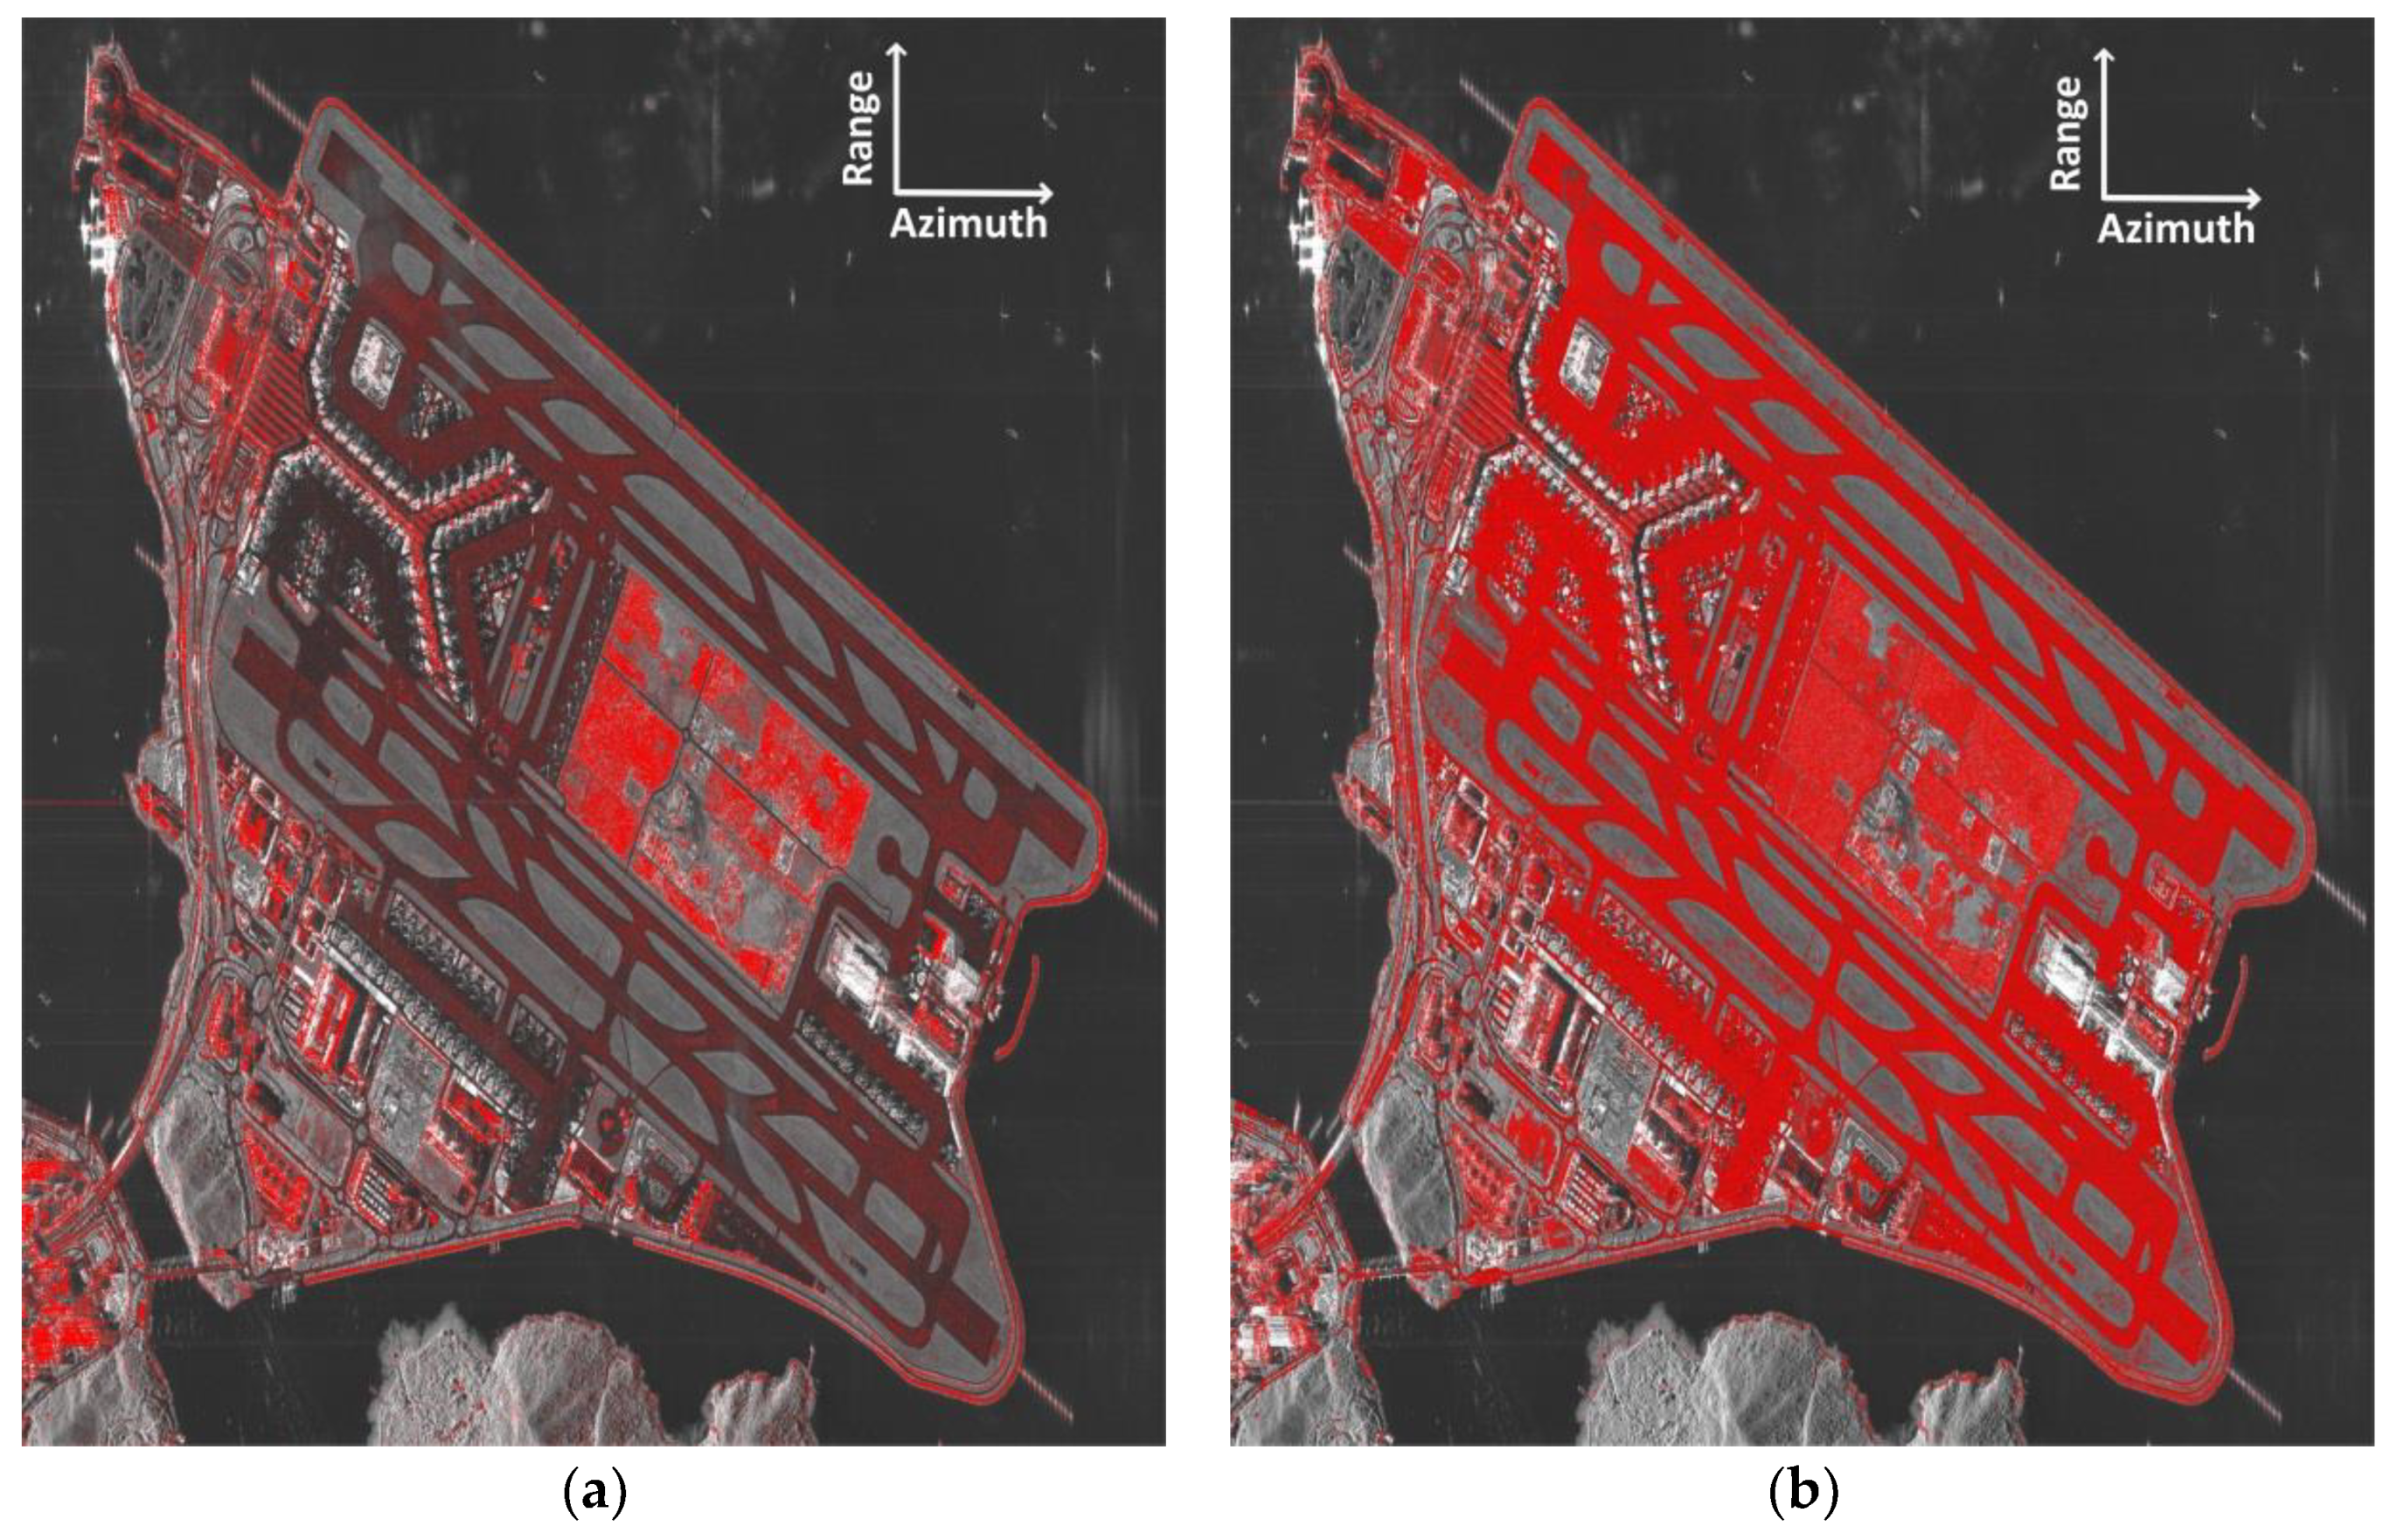
Figure 5 illustrates a comparison of MPs over the HKIA site identified by a PSI method (IPTA implementation) and the proposed DSI strategy. Overall, the DSI strategy retrieved approximately 8 times the number of MPs compared to using the PSI method, with the spatial density (total number) of MPs increasing from 46,000/km2 (574,637) with PSI to 360,000/km2 (4,495,561) with DSI. The PSI method provided very good coverage over most parts of the man-made structures such as roofs, buildings, rail tracks and the seawall of the airport. However, the proposed DSI strategy provides extra information over the area covered with sparse vegetation, asphalt ground, non-cultivated land with short vegetation or other development regions. The MPs on both the southern and northern runways were also increased greatly. This stems from the runway being very smooth, and the received radar reflected echo signal is weak, which cannot be effectively identified by the PSI method.
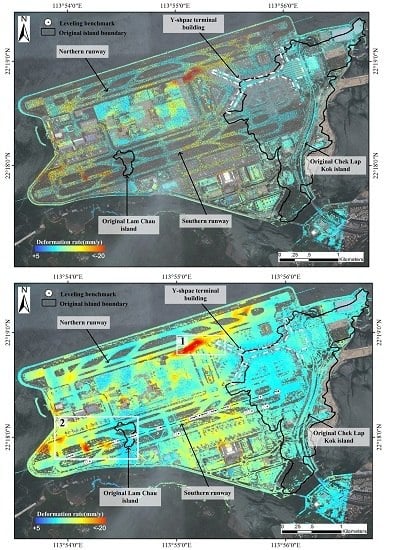
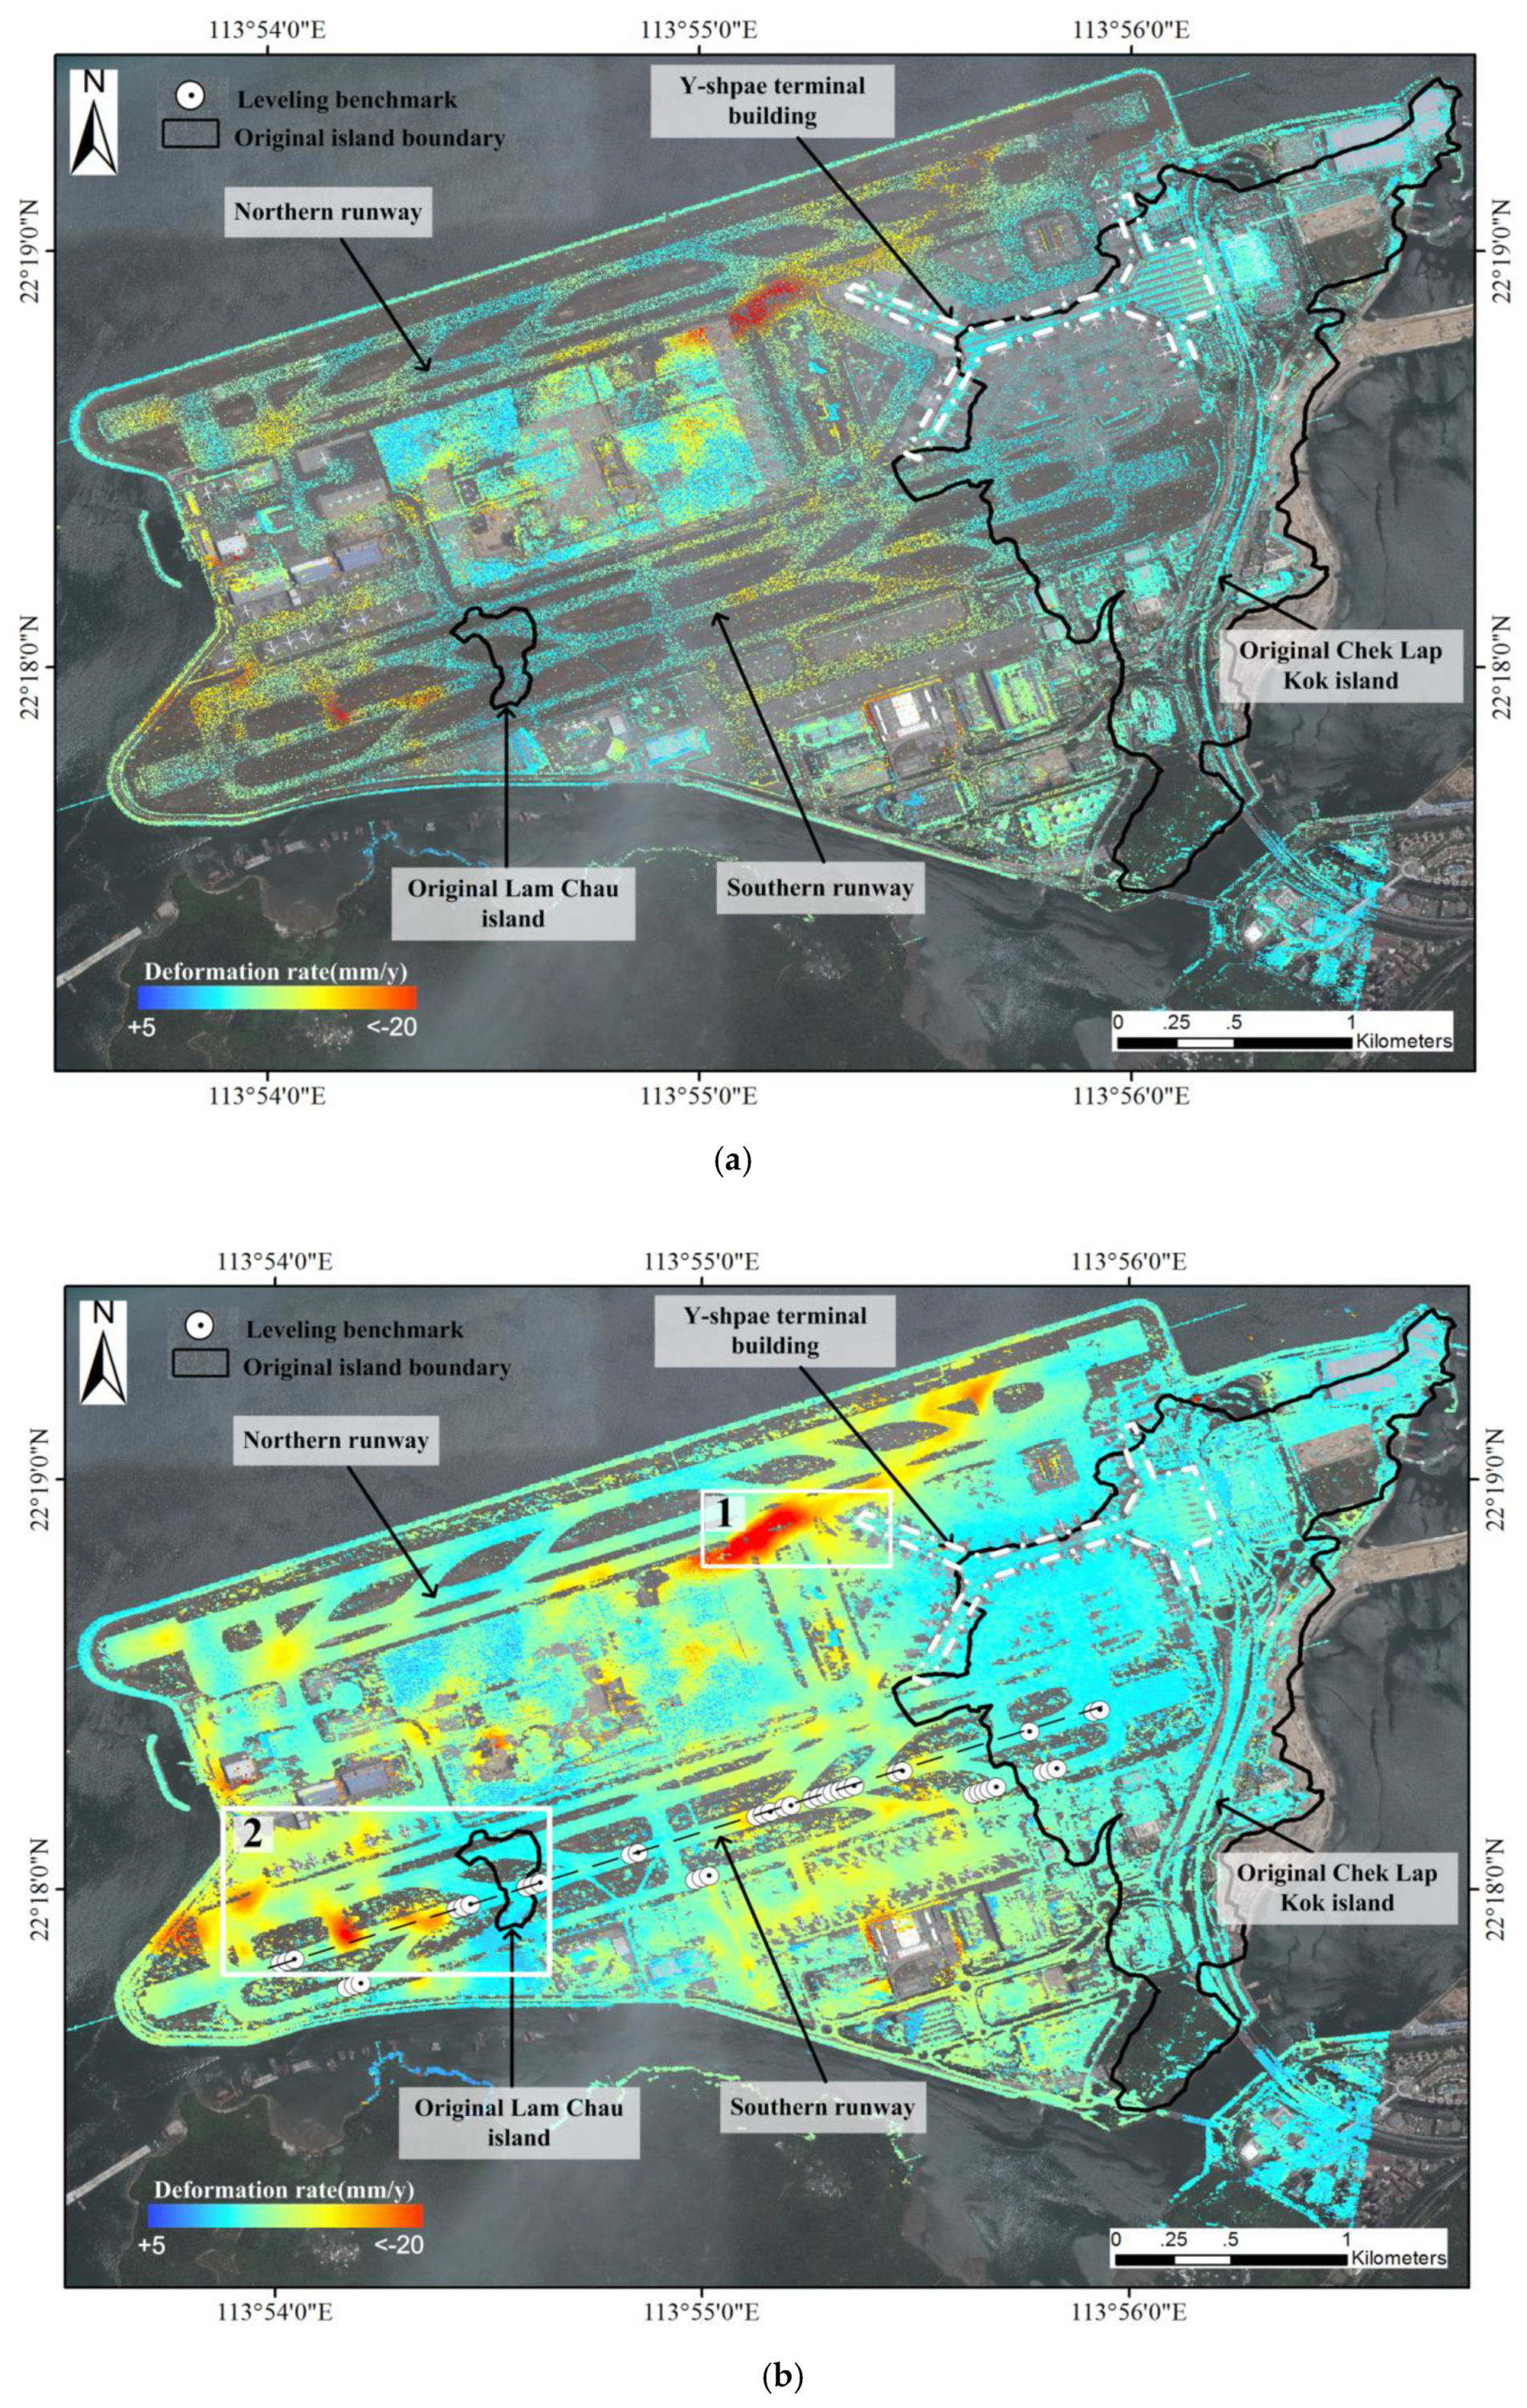
Figure 6a,b illustrates the linear deformation velocity results at HKIA in the radar line-of-sight (LOS) direction retrieved by the PSI and DSI strategy, respectively. Although the two results have similar deformation patterns, our strategy provides much denser measurements in both deformation and stable areas. In particular, the DSI results indicate that the middle part between the two original islands has experienced a large amount of subsidence with a maximum subsidence of greater than 15 mm/yr, whereas it is not clearly detected using the PSI result due to sparse measurements. A more detailed analysis from the DSI results on the spatiotemporal characterization of land subsidence will be presented in subsequent subsections.
4.1.2. DSI-Derived Settlement Behaviours
In general, the observed InSAR-derived deformation pattern is directly related to the reclamation geological conditions underlying the airport. The DSI-derived results in Figure 6b indicate a homogenous and stable pattern within both original islands of Chek Lap Kok and Lam Chau. This is attributed to the geological conditions of the two original islands, which are dominated by fine-grained and fine-to-medium-grained granite bedrock (see Figure 2a) [3]. In contrast to the homogeneous and stable behaviour of the two original islands, a complex settlement pattern with relatively large deformation rates and a local spatial variability was detected in the reclamation zones, which are characterized by highly compressible, recent alluvial deposits (see Figure 2a) [3]. Moderate (light yellow, between −3 to −10 mm/yr) to strong (red, less them −20 mm/yr) settlement rates and localized settlement patterns were observed in the majority of the reclaimed area of the airport, e.g., both ends of the northern runway, particularly near the Y-shaped terminal building (see zone 1 in Figure 6b), western end of the southern runway (see zone 2 in Figure 6b), mid-field development region and reclamation region between the two original islands west of Chek Lap Kok Island.
Here, we focus on the analysis of the spatial-temporal deformation patterns over two apparently subsiding zones (represented by white rectangles in Figure 6b). In zone 1, the northern runway near the Y-shaped terminal building experienced spatially continuous land subsidence (see Figure 6b). A significant subsidence pattern with a deformation rate of −10 mm/yr to −23 mm/yr is highlighted on the zoomed-in deformation velocity map (see Figure 7a), and the deformation time series corresponding to the three typical pixels (labelled as points A, B and C in Figure 7a) are illustrated in Figure 7b. Specifically, points A and C have undergone a linear deformation of approximately −23 mm/yr, and point B had linear displacement trends of −16 mm/yr, respectively. One possible explanation for this anomalous subsidence in zone 1 may rely on the natural consolidation process of the underlying compressible soil [3]. However, the Y-shaped terminal building on the airport platform, even within the reclamation areas, appears to be nearly stable. This can be explained by the fact that the buildings have mostly been constructed on piled foundations that reach the granite bedrock below (see Figure 2a) [38].
Another strongly subsiding zone (zone 2, represented by white rectangle 2 in Figure 6b), which is located in the southern runway of the airport, west of the original Lam Chau Island, is characterized by an exceptional differential settlement. In zone 2, three distinct subsidence bowls with a maximum subsidence rate of 20 mm/yr are detected. This is because in the western sector of Lam Chau Island, there is a highly compressible alluvial stratum that is 5–10 m thick, comprising soft to firm grey silts and clays and occasional organic remains (see Figure 2b) [3]. To more clearly highlight the observed subsidence, we present a zoomed-in deformation rate map of this region in Figure 8a. Major subsidence is detected in these areas, which show high densities of MPs based on the DSI results. Several points are selected to show the time series deformation in Figure 8b (labelled as points A, B and C in Figure 8a). Clearly, point B was rapidly deforming (−22.6 mm/yr) between January 2009 and October 2009, and this deformation slowed down (−12.4 mm/yr) after October 2009. Although the subsidence rates at point A and point C are slightly different, the time series pattern matched well. Figure 8c presents the deformation time series corresponding to two typical pixels (labelled in Figure 8a as points E and F) within the original Lam Chau Island. In contrast, the displacements of these two points exhibit almost no deformation signal (mostly between −3 mm and 3 mm). It can be observed that the reclamation subsidence trend is slowing down in the first and in the last part of the monitoring period (winter periods from Oct. to Dec. of 2008 and 2009), and the displacements of two points within the original Lam Chau Island exhibit a slight cyclical uplift (about 2 mm–3 mm) correspondingly in these two periods (see grey areas in Figure 8b and Figure 8c). We assume that this anomalous behaviour might be related to groundwater or complex hydrogeological environment in the reclamation. The seasonal variations of the groundwater table level due to tide fluctuation and rainfall typically have a significant influence on a short-time settlement process in coastal areas [3,11,38].
Figure 9 illustrates the LOS displacement time series over the entire HKIA. The acquisition from October 13, 2008 is set as the reference image, and the spatial-temporal subsidence evolution is clearly visible over time. The maximum accumulative subsidence is up to 30 mm over the whole monitoring period.
4.1.3. Validation of DSI-Derived Deformation Rates
An accuracy assessment of the InSAR-derived displacement results was performed by comparing the results to the precise levelling measurements located mainly on the southern runway. The field data, which was provided by the Hong Kong Airport Authority, were repeatedly collected by first-order spirit levelling surveys during the period between March 2006 and July 2008. Jiang et al. [3] suggested that secondary compression process was dominant in HKIA after 2005. Although the period is different between levelling surveys and interferometric analysis, we assume that the deformation rate is linear and current natural and anthropogenic deformation will persist throughout the two periods since the time interval is short. A total of 42 levelling benchmark locations are presented in Figure 6b. To enable the comparison, the levelling measurements have been projected along the radar LOS direction. The basic idea is tantamount to comparing all MPs identified in a defined circle (50 m) around the levelling benchmark position, and then, the average and standard deviation of the absolute difference of deformation rate between the selected MPs and corresponding benchmark is calculated.
Figure 10 illustrates a scatterplot with error bars for two groups of averaged velocities for PSI and DSI compared to the levelling measurements. As shown in Figure 10a, the correlation coefficient between the PSI and levelling measurements is 0.861, and the two validation parameters (average and standard deviation of the velocity absolute difference) are μ = 1.81 mm/yr and δ = 2.10 mm/yr, which implies that the PSI results agree well with the levelling survey measurements. Compared with the PSI method, the proposed DSI achieves a slight improvement of these parameters in the accuracy assessment: the correlation coefficient is 0.875, μ = 1.87 mm/yr and δ = 2.08 mm/yr (see Figure 10b). The DSI error bars become shorter for more samples involved in statistics, which reveals that the DSI measurements are less uncertainty and more reliable. The systematic difference in Figure 10 might be caused by inconsistent acquisition periods of levelling measurements and InSAR observations. In addition, atmospheric phases and the inconsistent spatial location of levelling measurements and InSAR observations will also affect the accuracy assessment.
For further analysis between observed settlements and levelling survey measurements, we focused on the residual settlements at the southern runway of the airport, which is characterized by complicated reclamation geology due to variations in alluvial deposit thicknesses and lithologies (see Figure 2b) [42]. Figure 11 indicates that the deformation rates retrieved by both PSI and DSI agree well with the levelling measurements profile along the southern runway (represented by the black dotted line in Figure 6b). Moreover, the higher residual settlement rates tend to be in further parts of the southern runway, which are generally away from the original islands. The recorded behaviours of the differential settlement agree well with underlying engineering and geological conditions.
4.2. Hong Kong Science Park
4.2.1. PSI vs. DSI
The same PSI and DSI processing procedures used at HKIA are also applied in this study area. The distribution of PSs and DSs at the HKSP site is shown in Figure 12. Obviously, the DSI reveals a great improvement in the density of MPs with respect to the PSI, and an incredible ability to identify MPs across various land covers in reclaimed areas, which are typically unfavourable for conventional InSAR approaches. While the PSI method only tends to exist in areas dominated by point-like scatterers such as building structures in developed areas, the seawall, and highways, the number of MPs identified with the DSI (90,374 DSs) increases by over 3.5 times compared with the PSI (33,483 PSs). The increased MPs are concentrated mainly in non-urban areas such as bare soil, sparse vegetated areas and asphalt pavement, particularly in the undeveloped area of HKSP (see Figure 12). Neither the PSI or DSI strategy are able to effectively extract the monitoring points in the developing area, because this area was undergoing large-scale construction activities during the monitoring period, which led to severe temporal decorrelation.
4.2.2. Settlement Pattern Based on InSAR Measurements
Figure 13 illustrates the land subsidence rates of the HKSP site from May 2008 to December 2009 acquired by both the PSI and DSI methods, in which the deformation patterns are generally similar to each other. Overall, a relatively stable and homogeneous pattern is detected in three distinct regions of the site including the Chinese University of Hong Kong and the transportation infrastructures of the East Rail Line, both of which are located on rocky ground, and the developed area of the southern HKSP reclamation land where the buildings have mostly been constructed on piled foundations.
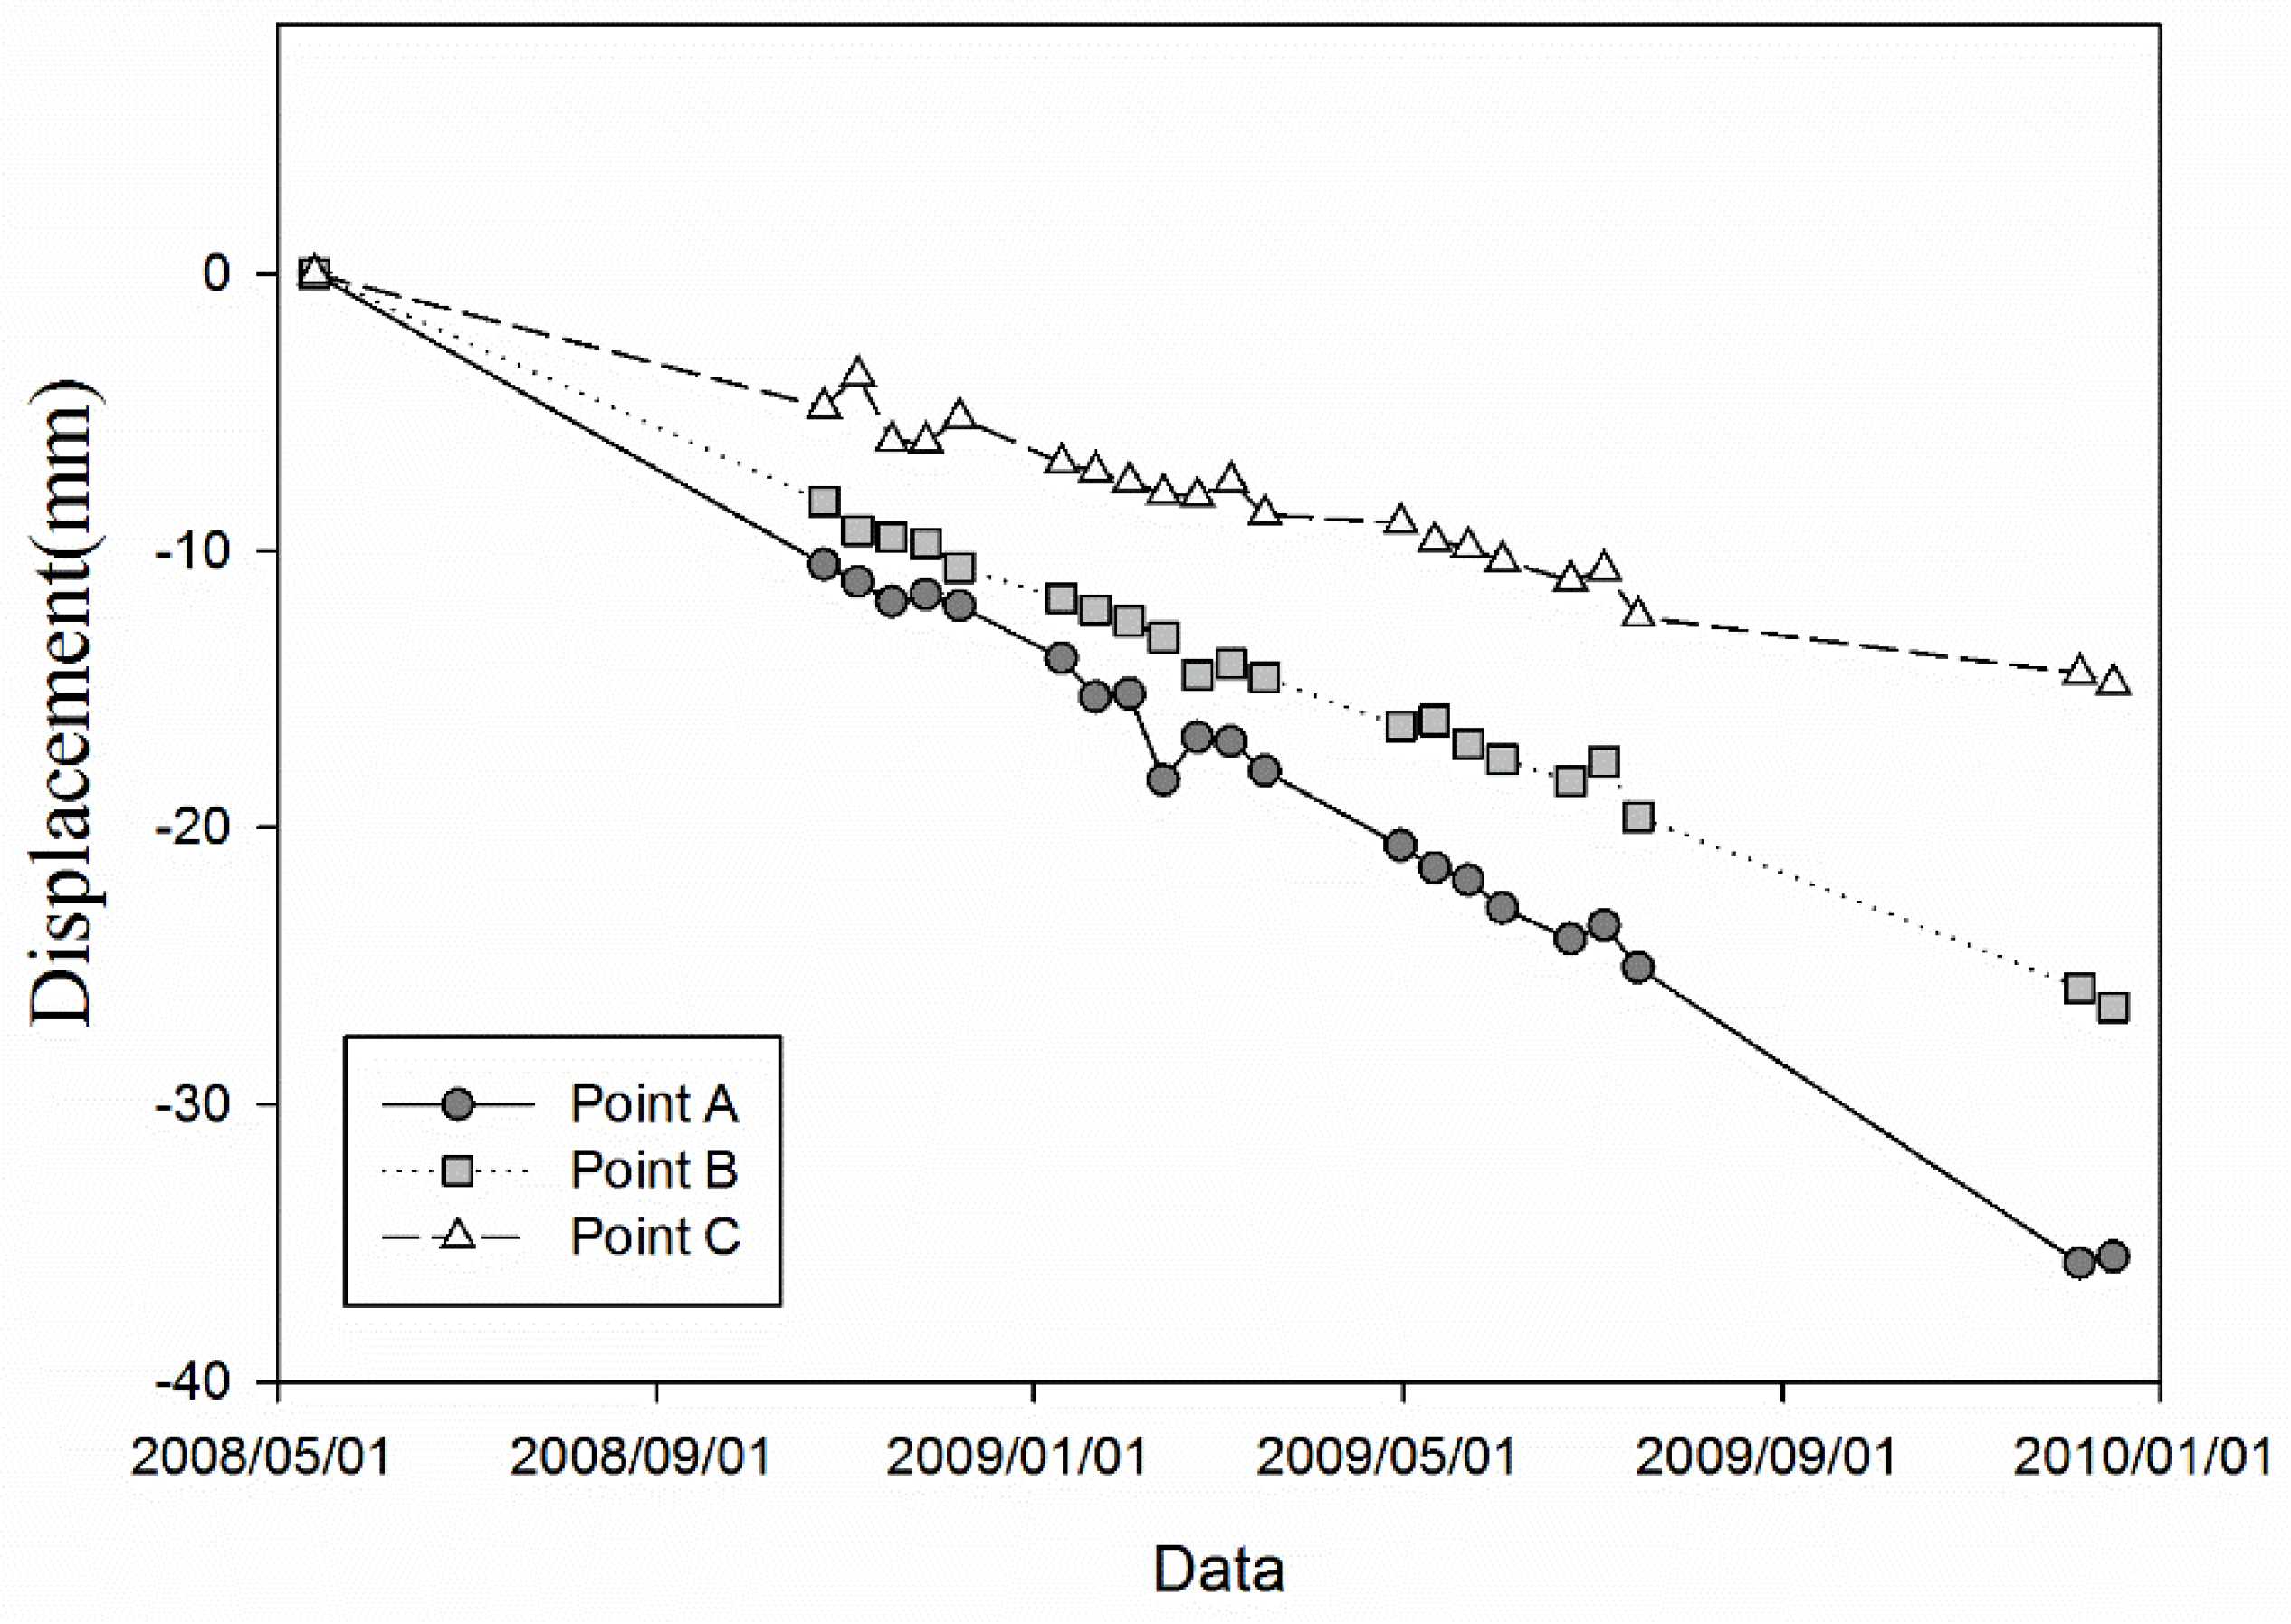
In contrast, the InSAR results reveal three exceptional, localized subsiding zones (zones 1, 2 and 3) in the HKSP reclamation land, which is shown in Figure 13b. Severe reclamation settlements with relatively sparse MPs are detected within zone 1 in the developing area of the HKSP with a maximum reclamation settlement of −27 mm/yr. One possible explanation for this anomalous phenomenon may rely on the heavy construction activities that occurred during the monitoring period. Moderate settlement patterns are detected in the undeveloped areas of the HKSP reclamation land (zones 2 and 3), which range from −5 mm/yr to −15 mm/yr. This is because these undeveloped areas experienced a consolidation process of underlying soft soils. Moreover, these exceptional subsidence signals are further represented by a deformation time series relevant to the typical pixels in zones 1, 2 and 3 (labelled in Figure 13b as points A, B and C, respectively), which is illustrated in Figure 14. The cumulative displacement of points A, B and C for the whole period are −35 mm, −26 mm and 15 mm, respectively.
5. Discussion
5.1. Performance Evaluation of SHP Identification and Optimal Phase Estimation
To assess the reliability of our results in terms of performance of SHPs over areas with multiple types of land cover and highly complex scattering characteristics, we select the HKSP reclaimed area for this purpose, since the reclamation land at this site was underdeveloped during the TerraSAR-X data acquisition period, and the land contained various types of terrain targets such as bare soils, buildings, roads, sparse vegetation and mixed land covers (see Figure 15a). Figure 15 illustrates a comparison between the homogeneous pixels identified by the KS test and FaSHPS on the stack of 22 TerraSAR-X images for the HKSP site using a 15 * 15 window size, in which the central pixel would be selected as initial DS candidates if the number of SHPs exceeded 20 pixels [28]. Overall, as expected, point-like targets (e.g., building and other man-made structures) have a lower number of SHPs than bare soil, sparse vegetation or the sea surface for both algorithms, whereas the image detail and identification reliability of SHPs are quite different. For example, delineations of the road boundaries are blurred in the KS test due to its lower test power when the central pixel has different scattering properties from the adjacent terrain targets; the FaSHPS reveals its discriminative power in different groups and delineates linear features well. Moreover, the KS test has limited capabilities to distinguish mixed land covers in the changed areas, which makes the SHP identification unreliable. The KS test clearly misidentified the initial DS candidates in the mixed land covers area, and the number of SHPs in these areas is up to 210 (see Figure 15e), whereas the FaSHPS identifies far fewer SHPs in the mixed land cover areas compared to the KS test (see Figure 15f). This is also due to the KS test being more sensitive to the variability, and it cannot correctly reject the null hypothesis.
Figure 16a. illustrates that the KS test can lead to a higher number of SHPs on the right tail of the histogram. Due to a lower rejection rate in the KS test, a total of 43169 central pixels (nearly 4.3%) are identified as the SHP with a full window size (window size is 15 * 15), i.e., 225 pixels. In contrast, Figure 16b shows that the FaSHPS has a higher rejection rate and a lower number of SHP on the right tail of the histogram. Practically no pixels (only two) identify the SHP with a full window size. It makes sense that the higher rejection rate in FaSHPS correlates to better delineations between different ground features and reliable SHP identification. Aside from allowing a more robust SHP identification, the FaSHPS algorithm has a significant advantage in terms of computation efficiency, which is much higher than the KS algorithms. A detailed comparison will be presented in Section 5.2.
In addition, the performance of optimal phase estimation is investigated. The phase optimization procedure based on eigendecomposition greatly improve the quality of differential interferograms in comparison with the original phases of DSs (see Figure 17). The advantage of optimized phases is not only well smoothed in the homogeneous regions, but it also maintains better edge and shape preservation. Moreover, a very high computation efficiency is achieved by the phase optimization method based on the eigendecomposition, which will be discussed in detail in Section 5.2.
5.2. Computational Efficiency and Sensitivity Analysis
As mentioned in Section 3, the state-of-the-art DSI methods involve two important but time-consuming steps: the SHP identification and the optimal phase estimation. To demonstrate the advantages of the proposed DSI strategy, we evaluated the computational efficiency of three DSI strategies in terms of different combinations of the two key steps. Strategy I utilized the KS test to detect SHP and extract the optimal phases based on a maximum likelihood (ML) estimator [28,43]. Strategy II adopted the KS test to detect SHPs and an eigendecomposition algorithm to estimate the optimal phases, in which the latter step can largely speed up the computation, but the former step is still considerably expensive in terms of computational cost. In our proposed DSI strategy (Strategy III), two fast and robust algorithms based on FaSHPS and eigendecomposition have been integrated to identify SHPs and estimate the optimal phases, which enables a significant increase in computational efficiency with respect to the current DSI methods.
To quantitatively illustrate the computational efficiency of three combined strategies, we select a subset image (1000 * 1000 pixels) of time series TerraSAR-X datasets acquired in the HKSP and test it with the MATLAB software on a 2.0 GHz processor. Table 1 presents computational efficiency of among these three strategies for 1000 * 1000 pixels. Strategy I processing requires approximately 8.98 h and 71.8 h for KS test and ML estimator, respectively. Strategy II requires 8.98 h and 3.59 h for KS test and optimal phase based on eigendecomposition. The situation can be greatly improved by our proposed strategy, which only requires approximately 0.32 h and 3.59 h for FaSHPS and eigendecomposition, respectively. The calculation of the coherence matrix is included in the time consumed during phase estimation. This demonstrates that the computational efficiency of our proposed strategy could be enhanced 30 times in the initial DS candidate identification and 20 times in the DS phase optimization.
Furthermore, Figure 18 presents a parameter sensitivity analysis for the computational time of FaSHPS and eigendecomposition using different stack sizes and estimate window sizes. Clearly, the proposed strategy including FaSHPS and eigendecomposition is less affected by stack size (see Figure 18a). As the number of images used for homogeneous pixel selection increases, the computational burden is less influenced. FaSHPS only uses the mean of the central pixel in the entire time series for homogeneous pixel selection, and the efficiency of the eigendecomposition is less affected by the matrix dimension. However, the computational time increases slightly with a larger window size estimate (see Figure 18b), which implies that the efficiency of both FaSHPS and eigendecomposition is sensitive to the window size. For example, the computing burden of FaSHPS and eigendecomposition require 755 s and 11,383 s when the estimate window size is set to 11 * 11 with a fixed 15 stack size, whereas it increases to approximately 2924 s and 3748 s, respectively, when the window size increases to 27 * 27.
6. Conclusions
In this study, a fast and robust DSI analysis of spatial and temporal behaviours of reclamation settlements in Hong Kong was carried out by applying an improved DSI processing strategy, which is a combinatorial innovation of the FaSHPS and eigendecomposition algorithms, to a total of 29 TerraSAR-X High Resolution Spotlight images over HKIA and 22 TerraSAR-X Stripmap images over HKSP acquired between 2008 and 2009. As expected, the DSI strategy reveals remarkably detailed reclamation subsidence fields over these two coastal reclaimed regions, with a significant increase in the MPs densities by 7.8 and 3.7 times for HKIA and HKSP, respectively, compared with the conventional PIS method. Moreover, the accuracy assessment compared to the levelling survey measurements at HKIA verifies the DS-derived deformation results, with a mean difference of 1.87 mm/yr and a standard deviation of 2.08 mm/yr. At HKIA, the InSAR results reveal moderate (between −3 to −10 mm/yr) to strong (up to −20 mm/yr) subsidence rates and a localized differential settlement pattern within the majority of the reclaimed portion of the airport platform. At HKSP, an exceptionally severe subsiding zone is detected in the northern developing area of reclamation land, which shows a maximum subsidence rate of 20 mm/yr. In particular, the integration of both the FaSHPS and eigendecomposition algorithms enables the proposed strategy to archive an unprecedented, high computational efficiency that is well beyond that of the state-of-the-art DSI methods, in which the efficiency could be enhanced 30 times during the DS identification and 20 times during the DS phase optimization. The results demonstrate the advantages of the proposed DSI strategy in computational efficiency and estimation reliability in monitoring ground deformation, particularly over reclaimed coastal areas.
Finally, the current Earth Observation (EO) scenario is characterized by the availability of large amounts of SAR data over the course of the last 20 years [29,44]. In particular, the new generation SAR missions, such as the Sentinel-1 constellation of the Copernicus SAR satellites and RADARSAT Constellation missions (RCM), are designed with higher spatial resolutions, more systematic wide-area coverage and shorter revisit cycles, which enables global-scale monitoring of the Earth at high temporal and spatial resolutions [29]. The large volume of SAR data will greatly promote the development and applications of InSAR in monitoring ground deformation [29,45]. Due to the insensitivity of stack sizes and the very high computational efficiency, our proposed DSI strategy has great potential to handle the InSAR Big Data applications well [45], especially for mapping and measuring ground deformation over non-urban areas, including permafrost thaw, volcanoes, earthquakes, landslides and so on.
Author Contributions
L.J. conceived and designed the experiments; Q.S. performed the experiments and carried out the data analysis. M.J., H.L., P.M. and H.W. contributed to experiment implementation and result interpretation; and all authors contributed to paper writing and revision.
Acknowledgements
The work in this study was supported by the National Natural Science Foundation of China (Grant No. 41590854, 41621091 and 41431070), the National Key R&D Program of China (Grant No. 2018YFC1406102 and 2017YFA0603103), the Key Research Program of Frontier Sciences of the Chinese Academy of Sciences (Grant No. QYZDB-SSW-DQC027 and QYZDJ-SSW-DQC042), and the Strategic Priority Research Program of the Chinese Academy of Sciences (Grant No. XDA19070104). The authors would like to thank the Hong Kong Airport Authority for providing the levelling survey data used in this paper, as well as DLR for providing the TerraSAR-X datasets (AO project No. CAL0390).
Conflicts of Interest
The authors declare no conflict of interest.
References
- Stuyfzand, P.J. The impact of land reclamation on groundwater quality and future drinking water supply in the Netherlands. Water Sci. Technol. 1995, 31, 47–57. [Google Scholar] [CrossRef]
- Kim, S.W.; Lee, C.W.; Song, K.Y.; Min, K.; Won, J.S. Application of L-band differential SAR interferometry to subsidence rate estimation in reclaimed coastal land. Int. J. Remote Sens. 2005, 26, 1363–1381. [Google Scholar] [CrossRef]
- Jiang, L.; Lin, H. Integrated analysis of SAR interferometric and geological data for investigating long-term reclamation settlement of Chek Lap Kok Airport, Hong Kong. Eng. Geol. 2010, 110, 77–92. [Google Scholar] [CrossRef]
- Pickles, A.; Tosen, R. Settlement of reclaimed land for the new Hong Kong International Airport. Proc. Inst. Civ. Eng. Geotech. Eng. 1998, 131, 191–209. [Google Scholar] [CrossRef]
- Tosen, R.; Pickles, A.; Jaros, M. Assessment of Differential Settlement at Chek Lap Kok Airport Reclamation Site. In Proceedings of the A Seminar on the Geotechnical Aspects of the Airport Core Projects; Kong Institution Hongof Civil Engineers: Hong Kong, China, 1998. [Google Scholar]
- Ferretti, A.; Prati, C.; Rocca, F. Permanent scatterers in SAR interferometry. IEEE Trans. Geosci. Remote Sens. 2001, 39, 8–20. [Google Scholar] [CrossRef] [Green Version]
- Hooper, A.; Zebker, H.; Segall, P.; Kampes, B. A new method for measuring deformation on volcanoes and other natural terrains using InSAR persistent scatterers. Geophys. Res. Lett. 2004, 31, 23. [Google Scholar] [CrossRef]
- Wegmüller, U.; Werner, C.; Strozzi, T.; Wiesmann, A. Multi-Temporal Interferometric Point Target Analysis. In Analysis of Multi-Temporal Remote Sensing Images; World Scientific: Singapore, 2004; pp. 136–144. [Google Scholar]
- Costantini, M.; Falco, S.; Malvarosa, F.; Minati, F. A new method for identification and analysis of persistent scatterers in series of SAR images. In Proceedings of the 2008 IEEE International Geoscience and Remote Sensing Symposium, Boston, MA, USA, 7–11 July 2008; pp. 449–452. [Google Scholar]
- Teatini, P.; Tosi, L.; Strozzi, T.; Carbognin, L.; Wegmüller, U.; Rizzetto, F. Mapping regional land displacements in the Venice coastland by an integrated monitoring system. Remote Sens. Environ. 2005, 98, 403–413. [Google Scholar] [CrossRef]
- Teatini, P.; Strozzi, T.; Tosi, L.; Wegmüller, U.; Werner, C.; Carbognin, L. Assessing short-and long-time displacements in the Venice coastland by synthetic aperture radar interferometric point target analysis. J. Geophys. Res. Earth Surf. 2007, 112, F1. [Google Scholar] [CrossRef]
- Jiang, L.; Lin, H.; Cheng, S. Monitoring and assessing reclamation settlement in coastal areas with advanced InSAR techniques: Macao city (China) case study. Int. J. Remote Sens. 2011, 32, 3565–3588. [Google Scholar] [CrossRef]
- Ng, A.H.-M.; Ge, L.; Li, X.; Abidin, H.Z.; Andreas, H.; Zhang, K. Mapping land subsidence in Jakarta, Indonesia using persistent scatterer interferometry (PSI) technique with ALOS PALSAR. Int. J. Appl. Earth Obs. Geoinf. 2012, 18, 232–242. [Google Scholar] [CrossRef]
- Casu, F.; Manzo, M.; Lanari, R. A quantitative assessment of the SBAS algorithm performance for surface deformation retrieval from Dinsar data. Remote Sens. Environ. 2006, 102, 195–210. [Google Scholar] [CrossRef]
- Goel, K.; Adam, N. An advanced algorithm for deformation estimation in non-urban areas. ISPRS J. Photogramm. Remote Sens. 2012, 73, 100–110. [Google Scholar] [CrossRef]
- Bruno, M.F.; Molfetta, M.G.; Mossa, M.; Morea, A.; Chiaradia, M.T.; Nutricato, R.; Nitti, D.O.; Guerriero, L.; Coletta, A. Integration of multitemporal SAR/InSAR techniques and NWM for coastal structures monitoring: Outline of the software system and of an operational service with COSMO-SkyMed data. In Proceedings of the 2016 IEEE Workshop on Environmental, Energy, and Structural Monitoring Systems (EESMS), Bari, Italy, 13–14 June 2016; pp. 1–6. [Google Scholar]
- Goodman, J.W. Some fundamental properties of speckle. J. Opt. Soc. Am. 1976, 66, 1145–1150. [Google Scholar] [CrossRef]
- Bamler, R.; Hartl, P. Synthetic aperture radar interferometry. Inverse Prob. 1998, 14, R1. [Google Scholar] [CrossRef]
- Berardino, P.; Fornaro, G.; Lanari, R.; Sansosti, E. A new algorithm for surface deformation monitoring based on small baseline differential SAR interferograms. IEEE Trans. Geosci. Remote Sens. 2002, 40, 2375–2383. [Google Scholar] [CrossRef]
- Goel, K.; Adam, N. A distributed scatterer interferometry approach for precision monitoring of known surface deformation phenomena. IEEE Trans. Geosci. Remote Sens. 2014, 52, 5454–5468. [Google Scholar] [CrossRef]
- Biggs, J.; Wright, T.; Lu, Z.; Parsons, B. Multi-interferogram method for measuring interseismic deformation: Denali Fault, Alaska. Geophys. J. Int. 2007, 170, 1165–1179. [Google Scholar] [CrossRef] [Green Version]
- Zhang, L.; Ding, X.; Lu, Z. Ground settlement monitoring based on temporarily coherent points between two SAR acquisitions. ISPRS J. Photogramm. Remote Sens. 2011, 66, 146–152. [Google Scholar] [CrossRef]
- Xu, B.; Feng, G.; Li, Z.; Wang, Q.; Wang, C.; Xie, R. Coastal subsidence monitoring associated with land reclamation using the point target based SBAS-InSAR method: A case study of Shenzhen, China. Remote Sens. 2016, 8, 652. [Google Scholar] [CrossRef]
- Wang, M.; Li, T.; Jiang, L. Monitoring reclaimed lands subsidence in Hong Kong with InSAR technique by persistent and distributed scatterers. Nat. Hazard. 2016, 82, 531–543. [Google Scholar] [CrossRef]
- Wang, H.; Wright, T.J.; Yu, Y.; Lin, H.; Jiang, L.; Li, C.; Qiu, G. Insar reveals coastal subsidence in the Pearl River Delta, China. Geophys. J. Int. 2012, 191, 1119–1128. [Google Scholar] [CrossRef]
- Parizzi, A.; Brcic, R. Adaptive InSAR stack multilooking exploiting amplitude statistics: A comparison between different techniques and practical results. IEEE Geosci. Remote Sens. Lett. 2011, 8, 441–445. [Google Scholar] [CrossRef]
- Sica, F.; Reale, D.; Poggi, G.; Verdoliva, L.; Fornaro, G. Nonlocal adaptive multilooking in SAR multipass differential interferometry. IEEE J. Sel. Top. Appl. Earth Obs. Remote Sens. 2015, 8, 1727–1742. [Google Scholar] [CrossRef]
- Ferretti, A.; Fumagalli, A.; Novali, F.; Prati, C.; Rocca, F.; Rucci, A. A new algorithm for processing interferometric data-stacks: Squeesar. IEEE Trans. Geosci. Remote Sens. 2011, 49, 3460–3470. [Google Scholar] [CrossRef]
- Ansari, H.; De Zan, F.; Bamler, R. Sequential estimator: Toward efficient InSAR time series analysis. IEEE Trans. Geosci. Remote Sens. 2017, 55, 5637–5652. [Google Scholar] [CrossRef]
- Shi, G.; Lin, H.; Ma, P. A Hybrid Method for Stability Monitoring in Low-Coherence Urban Regions Using Persistent and Distributed Scatterers. IEEE J. Sel. Top. Appl. Earth Obs. Remote Sens. 2018, 3811–3821. [Google Scholar] [CrossRef]
- Lin, K.-F.; Perissin, D. Identification of Statistically Homogeneous Pixels Based on One-Sample Test. Remote Sens. 2017, 9, 37. [Google Scholar] [CrossRef]
- Shamshiri, R.; Nahavandchi, H.; Motagh, M.; Hooper, A. Efficient Ground Surface Displacement Monitoring Using Sentinel-1 Data: Integrating Distributed Scatterers (DS) Identified Using Two-Sample t-Test with Persistent Scatterers (PS). Remote Sens. 2018, 10, 794. [Google Scholar] [CrossRef]
- Jiang, M.; Ding, X.; Hanssen, R.F.; Malhotra, R.; Chang, L. Fast statistically homogeneous pixel selection for covariance matrix estimation for multitemporal InSAR. IEEE Trans. Geosci. Remote Sens. 2015, 53, 1213–1224. [Google Scholar] [CrossRef]
- Fornaro, G.; Verde, S.; Reale, D.; Pauciullo, A. CAESAR: An approach based on covariance matrix decomposition to improve multibaseline–multitemporal interferometric SAR processing. IEEE Trans. Geosci. Remote Sens. 2015, 53, 2050–2065. [Google Scholar] [CrossRef]
- Cao, N.; Lee, H.; Jung, H.C. A phase-decomposition-based PSInSAR processing method. IEEE Trans. Geosci. Remote Sens. 2016, 54, 1074–1090. [Google Scholar] [CrossRef]
- Dong, J.; Zhang, L.; Tang, M.; Liao, M.; Xu, Q.; Gong, J.; Ao, M. Mapping landslide surface displacements with time series SAR interferometry by combining persistent and distributed scatterers: A case study of Jiaju landslide in Danba, China. Remote Sens. Environ. 2018, 205, 180–198. [Google Scholar] [CrossRef]
- Survey and Mapping Office, Lands Department of Hong Kong. Practice Notes and Publications. 2005. Available online: https://www.landsd.gov.hk/mapping/en/publications/reclamation.htm. (accessed on 23 January 2018).
- Plant, G.W.; Covil, C.S.; Hughes, R.A. Site Preparation for the New Hong Kong International Airport; Thomas Telford: London, England, 1998. [Google Scholar]
- Ding, X.; Liu, G.; Li, Z.; Li, Z.; Chen, Y. Ground subsidence monitoring in Hong Kong with satellite SAR interferometry. Photogramm. Eng. Remote Sens. 2004, 70, 1151–1156. [Google Scholar] [CrossRef]
- De Zan, F.; Rocca, F. Coherent processing of long series of sar images. In Proceedings of the 2005 IEEE International Geoscience and Remote Sensing Symposium, Seoul, South Korea, 29–29 July 2005; pp. 1987–1990. [Google Scholar]
- Cao, N.; Lee, H.; Jung, H.C. Mathematical framework for phase-triangulation algorithms in distributed-scatterer interferometry. IEEE Geosci. Remote Sens. Lett. 2015, 12, 1838–1842. [Google Scholar] [CrossRef]
- James, J.; Evans, C.; Crosby, A.; Humphreys, B. An Interpretation of the Marine Geology for the Replacement Airport at Chek Lap Kok; Bgs Technical Report wb/93/34r; British Geological Survey (BGS): Hong Kong, China, 1994. [Google Scholar]
- Du, Z.; Ge, L.; Li, X.; Ng, A. Subsidence monitoring over the Southern Coalfield, Australia using both L-band and C-band SAR time series analysis. Remote Sens. 2016, 8, 543. [Google Scholar] [CrossRef]
- Casu, F.; Manunta, M.; Agram, P.; Crippen, R. Big remotely sensed data: Tools, applications and experiences. Remote Sens. Environ. 2017, 202, 1–2. [Google Scholar] [CrossRef]
- De Luca, C.; Zinno, I.; Manunta, M.; Lanari, R.; Casu, F. Large areas surface deformation analysis through a cloud computing P-SBAS approach for massive processing of DInSAR time series. Remote Sens. Environ. 2017, 202, 3–17. [Google Scholar] [CrossRef]
Figure 1.
The geographic location of HKIA and HKSP in Hong Kong.
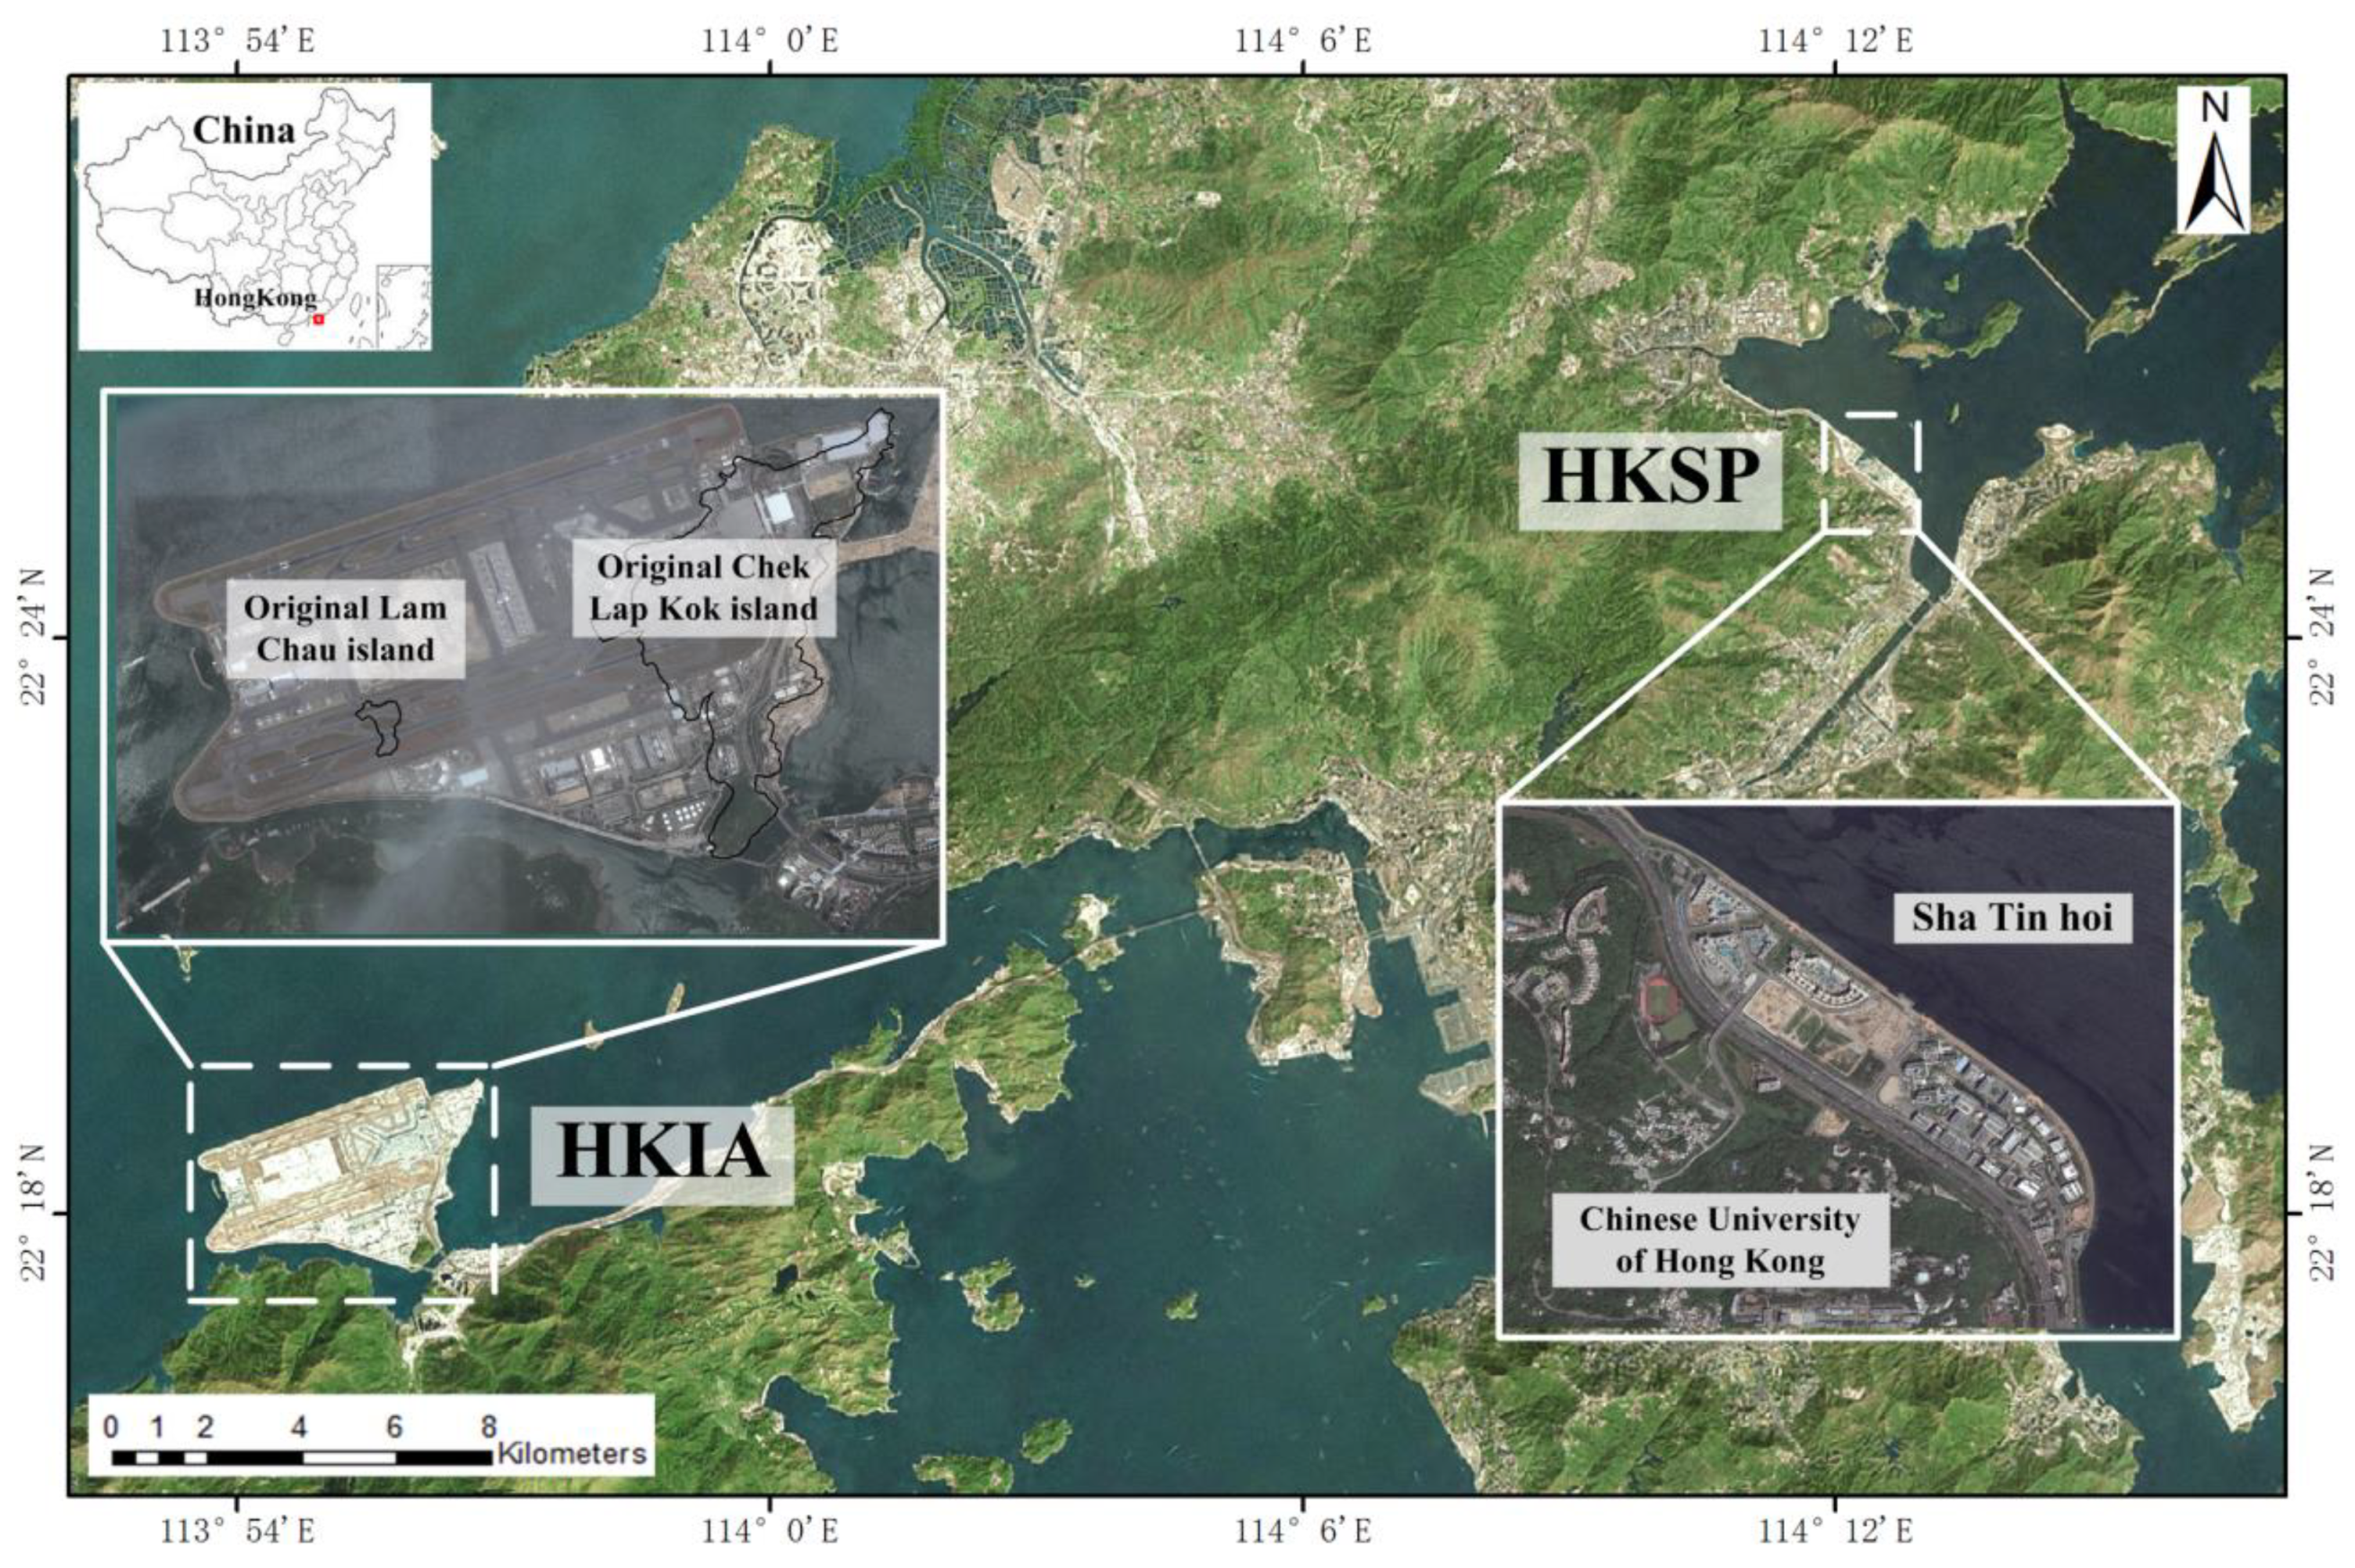
Figure 2.
The geological setting and cross sections of HKIA. (a) The bedrock geology of HIAK, (b) the geological cross-section of the southern runway of the airport, the location of which is labeled as white dotted line A-B in Figure 2a (after Figure 1 and Figure 3 in [3]).


Figure 3.
Temporal/perpendicular baseline plots. (a) TerraSAR-X Spotlight images for HKIA and (b) TerraSAR-X Stripmap images for HKSP.
Figure 3.
Temporal/perpendicular baseline plots. (a) TerraSAR-X Spotlight images for HKIA and (b) TerraSAR-X Stripmap images for HKSP.

Figure 4.
Workflow of the improved DSI processing strategy.

Figure 5.
The MPs identified using PSI method (a) and proposed DSI strategy (b) at HKIA.

Figure 6.
Comparison between the LOS velocity map [mm/yr] at HKIA from TerraSAR-X Spotlight images retrieved by (a) the PSI method and (b) the proposed DSI strategy. The white dotted line represents the boundary of the Y-shaped building.
Figure 6.
Comparison between the LOS velocity map [mm/yr] at HKIA from TerraSAR-X Spotlight images retrieved by (a) the PSI method and (b) the proposed DSI strategy. The white dotted line represents the boundary of the Y-shaped building.

Figure 7.
DSI results of the northern runway near the Y-shaped terminal building from TerraSAR-X Spotlight images, the location of which is represented by the white rectangle (zone 1) in Figure 6b. (a) Linear deformation rate superimposed on Google Earth image and (b) displacement time series of points A, B and C in Figure 7a. Grey areas approximately indicate the winter periods from Oct. to Dec. of 2008 and 2009.
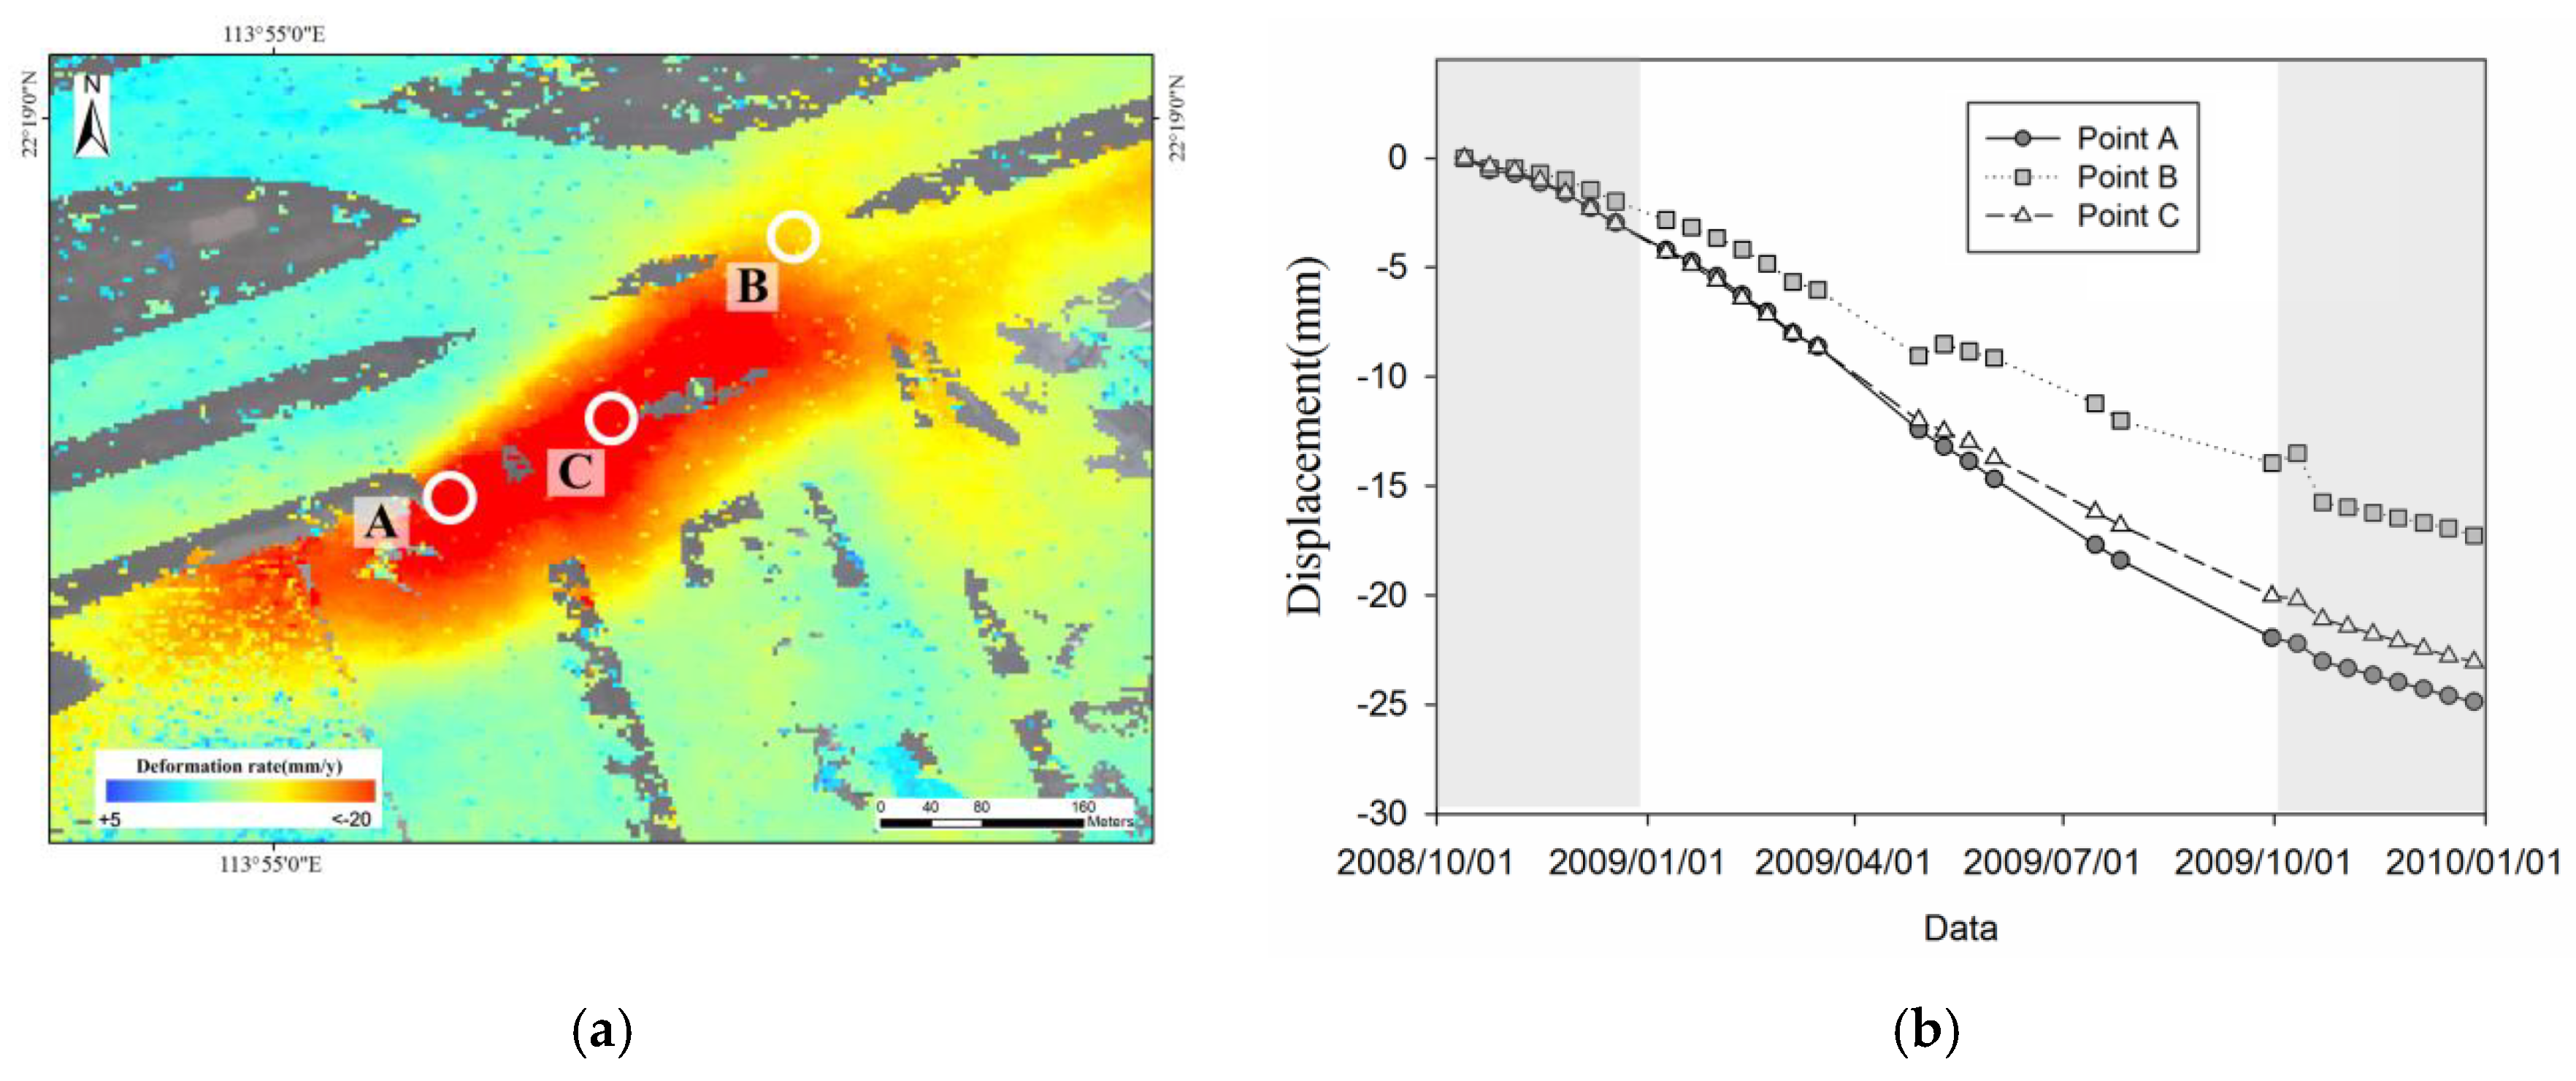
Figure 8.
DSI results of the southern runway from TerraSAR-X Spotlight images, west of the original Lam Chau Island, the location of which is represented by the white rectangle (zone 2) in Figure 6b. (a) Linear deformation rate superimposed on Google Earth image, (b) displacement time series of points A, B and C, and (c) displacement time series of point D and E in Figure 8a. Grey areas approximately indicate the winter periods from Oct. to Dec. of 2008 and 2009.
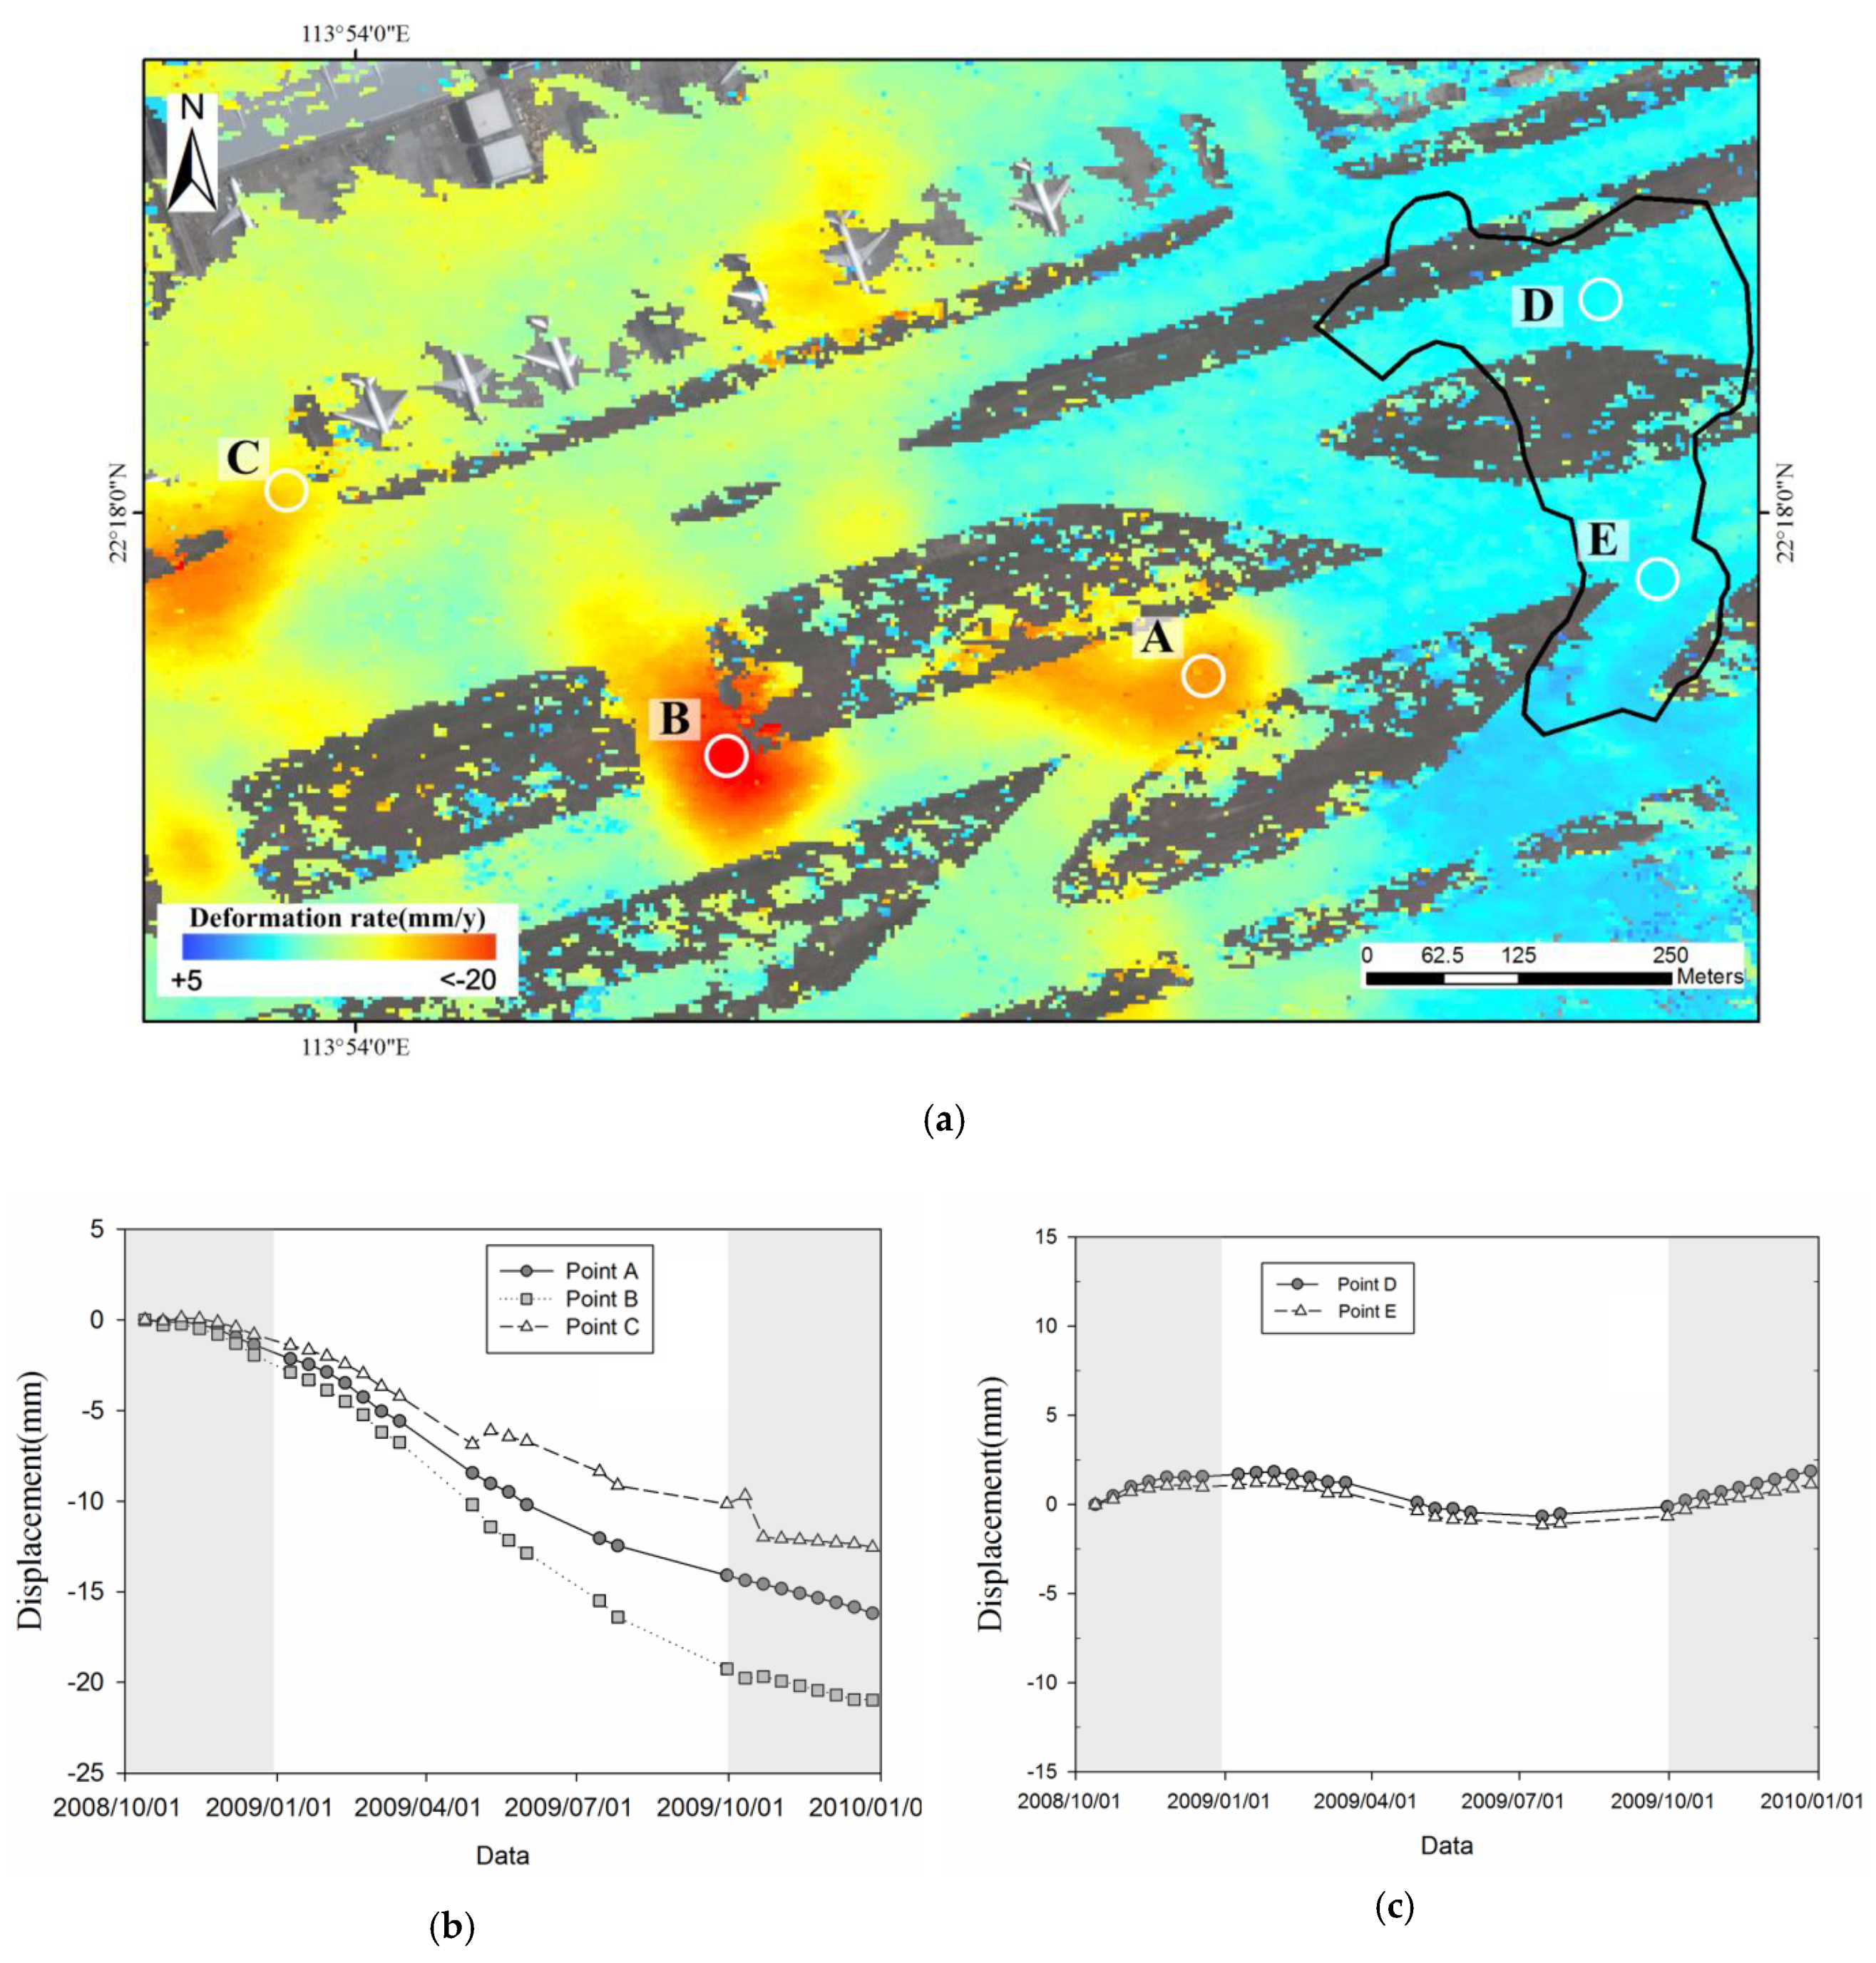
Figure 9.
The LOS displacement time series over HKIA retrieved by the proposed DSI strategy from TerraSAR-X Spotlight images.
Figure 9.
The LOS displacement time series over HKIA retrieved by the proposed DSI strategy from TerraSAR-X Spotlight images.
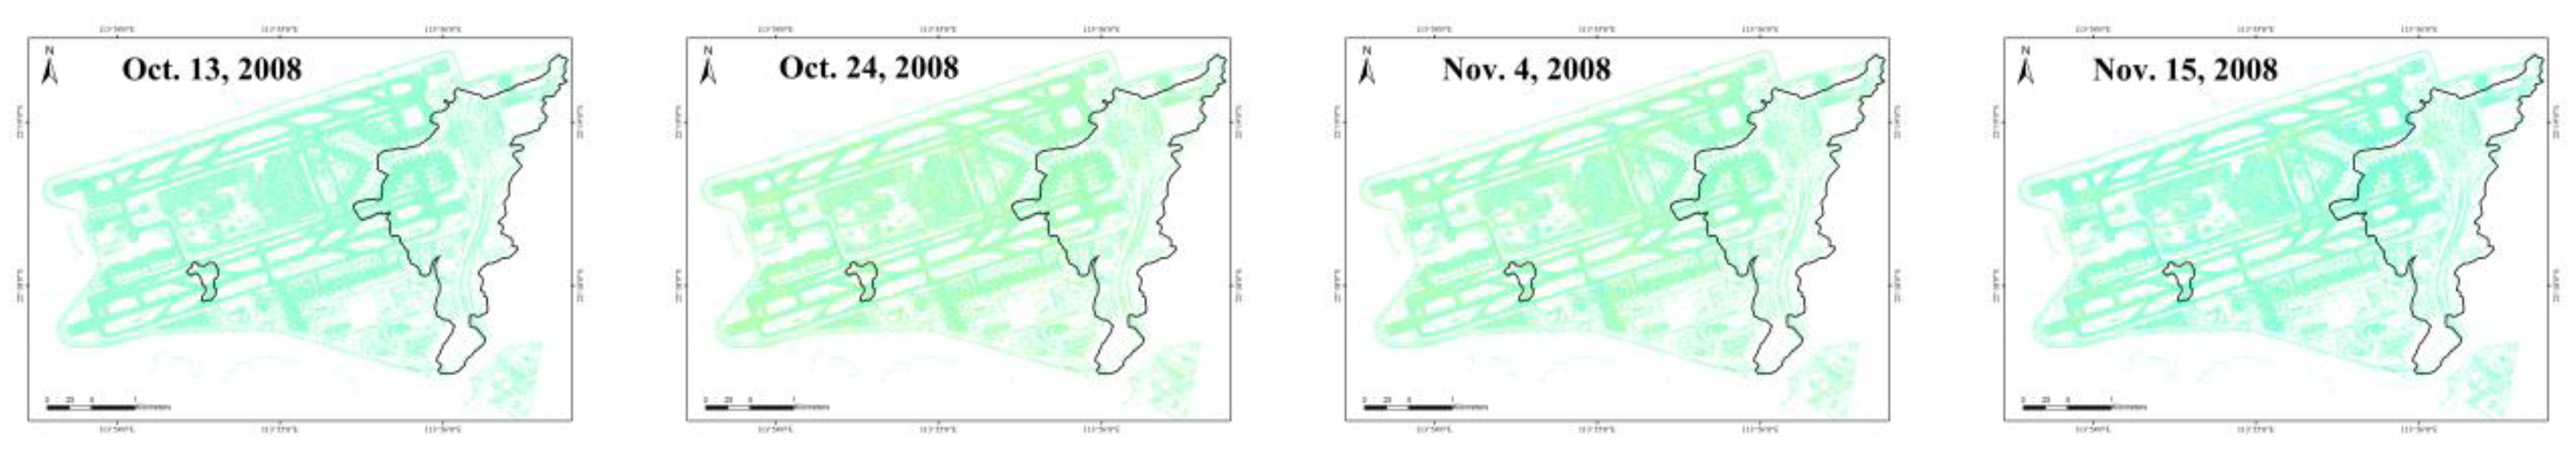

Figure 10.
Scatterplot with error bars for the InSAR-retrieved deformation rates and levelling measurements: (a) PSI method and (b) DSI strategy.
Figure 10.
Scatterplot with error bars for the InSAR-retrieved deformation rates and levelling measurements: (a) PSI method and (b) DSI strategy.

Figure 11.
Comparison between the InSAR-retrieved deformation rates and benchmark levelling measurements (represented by white circles in Figure 6b) along the southern runway: (a) PSI method, and (b) DSI strategy. Grey areas approximately indicate the boundaries of the original islands of Chek Lap Kok and Lam Chau. The segment A–B of the black line shows the location of geological cross-section in Figure 2a.

Figure 12.
Comparison of MPs at the HKSP site identified by the PSI method (a) and the proposed DSI strategy (b).
Figure 12.
Comparison of MPs at the HKSP site identified by the PSI method (a) and the proposed DSI strategy (b).

Figure 13.
The LOS deformation velocity results of HKSP from TerraSAR-X Stripmap images retrieved by the PSI method (a) and the proposed DSI strategy (b).
Figure 13.
The LOS deformation velocity results of HKSP from TerraSAR-X Stripmap images retrieved by the PSI method (a) and the proposed DSI strategy (b).

Figure 14.
Displacement time series corresponding to the pixels labelled points A, B and C in Figure 13b.
Figure 14.
Displacement time series corresponding to the pixels labelled points A, B and C in Figure 13b.

Figure 15.
(a) The TerraSAR-X temporally averaged amplitude image over HKSP. (b,c) represent the number of SHP maps identified by the KS test and FaSHPS with 15 * 15 window sizes. (d–f) are the zoomed-in maps in the white rectangles in (a–c), respectively.
Figure 15.
(a) The TerraSAR-X temporally averaged amplitude image over HKSP. (b,c) represent the number of SHP maps identified by the KS test and FaSHPS with 15 * 15 window sizes. (d–f) are the zoomed-in maps in the white rectangles in (a–c), respectively.

Figure 16.
Histograms of the SHP number identified by (a) KS test and (b) FaSHPS. Horizontal axis is the number of SHPs based on a 15 * 15 window. Vertical axis is the pixel count at each corresponding SHP number.
Figure 16.
Histograms of the SHP number identified by (a) KS test and (b) FaSHPS. Horizontal axis is the number of SHPs based on a 15 * 15 window. Vertical axis is the pixel count at each corresponding SHP number.
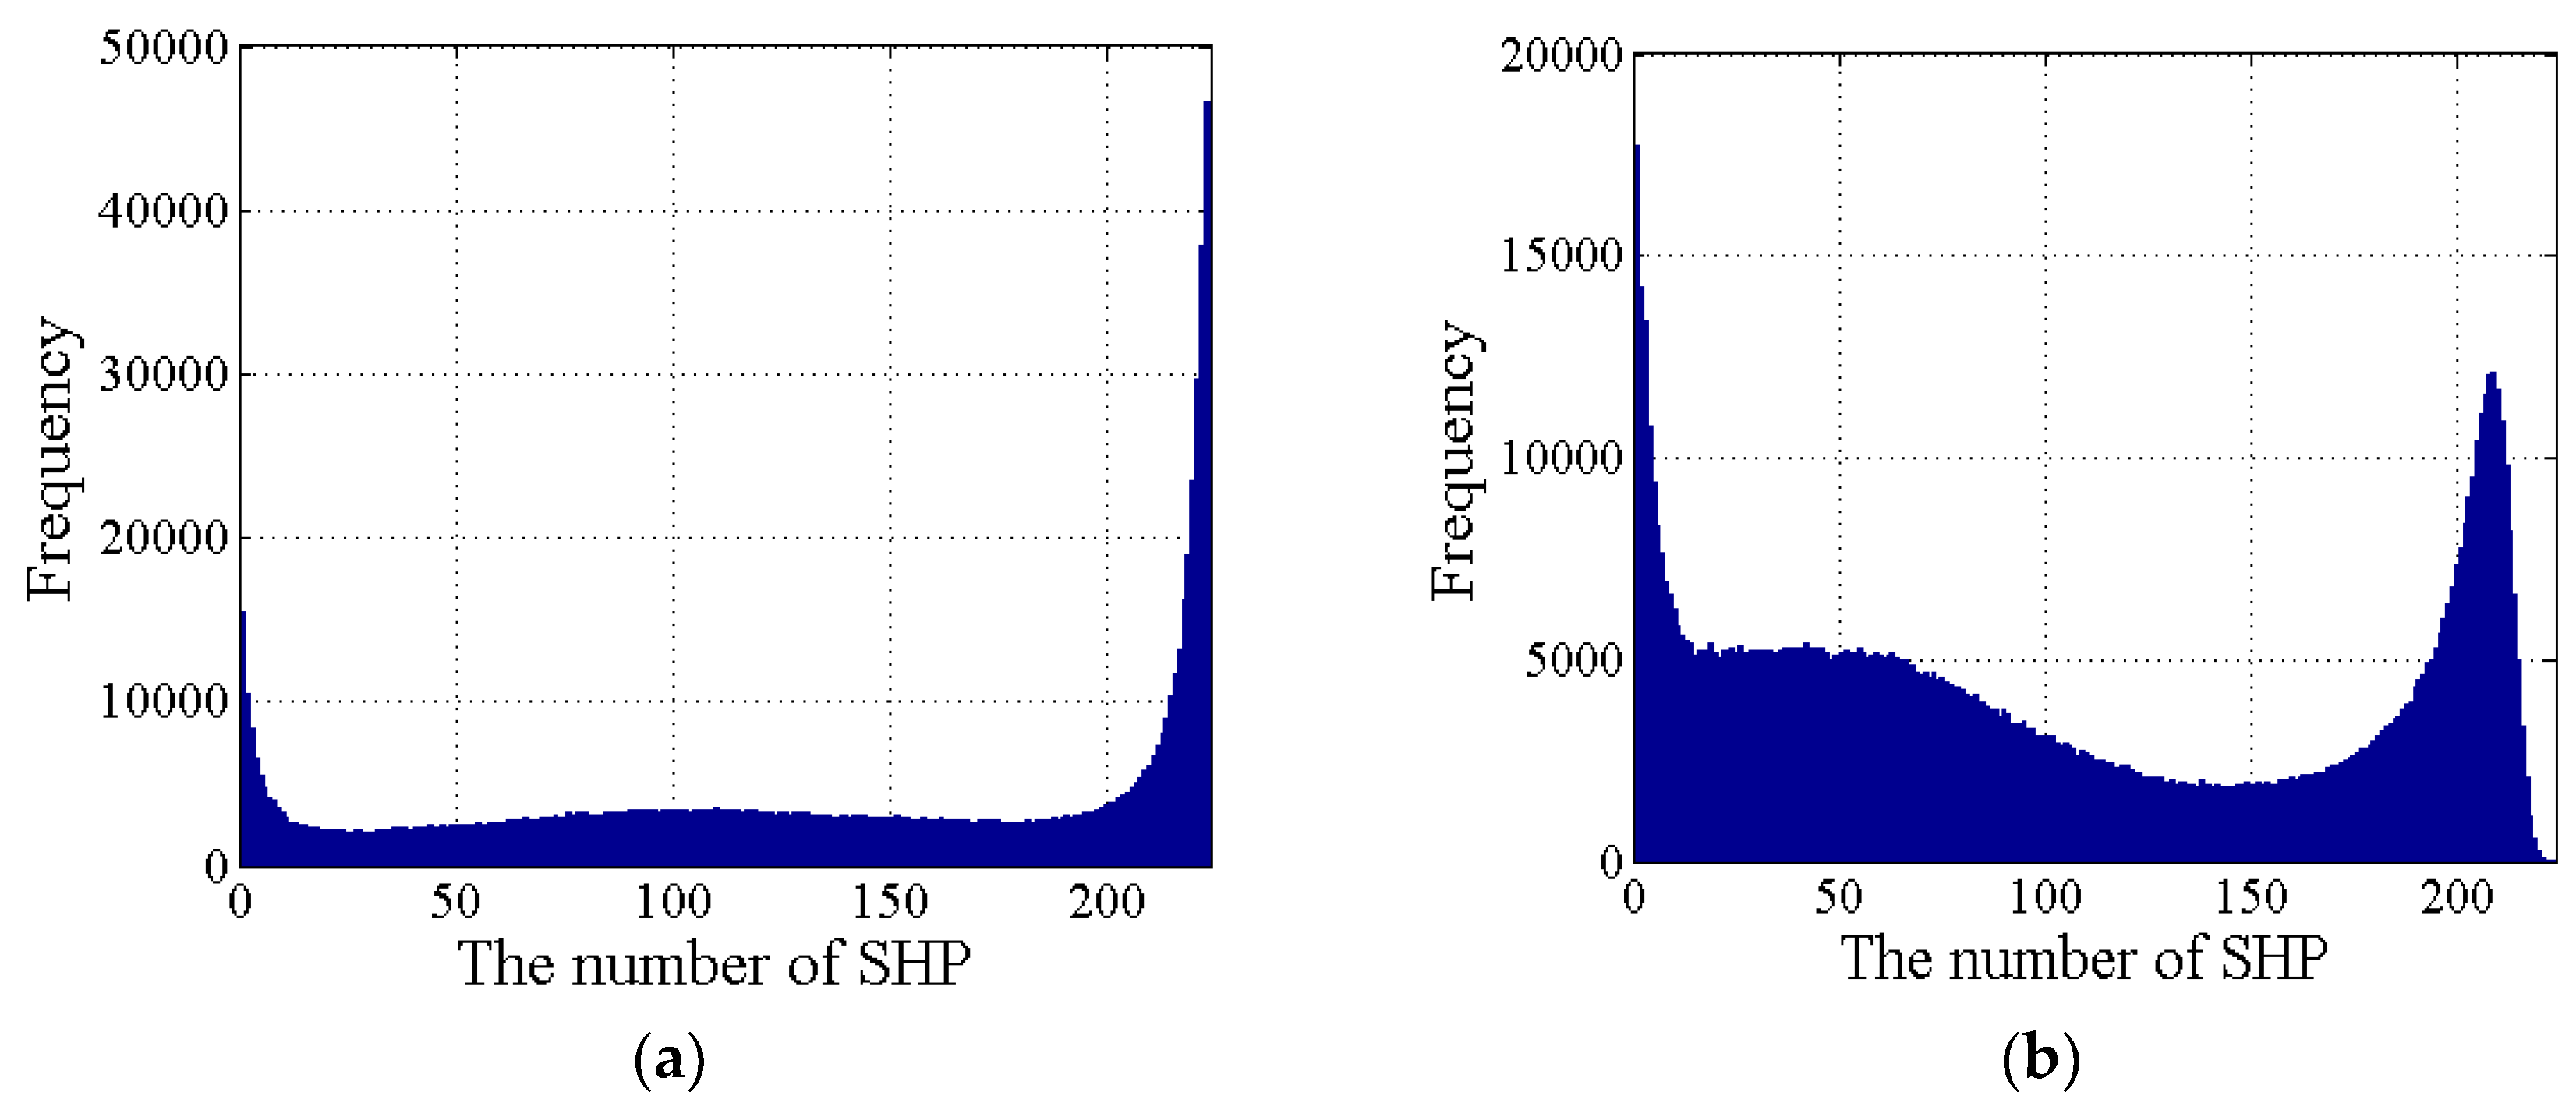
Figure 17.
Comparison between (a) the original phases of DSs and (b) the optimized phases obtained by the eigendecomposition algorithm.
Figure 17.
Comparison between (a) the original phases of DSs and (b) the optimized phases obtained by the eigendecomposition algorithm.
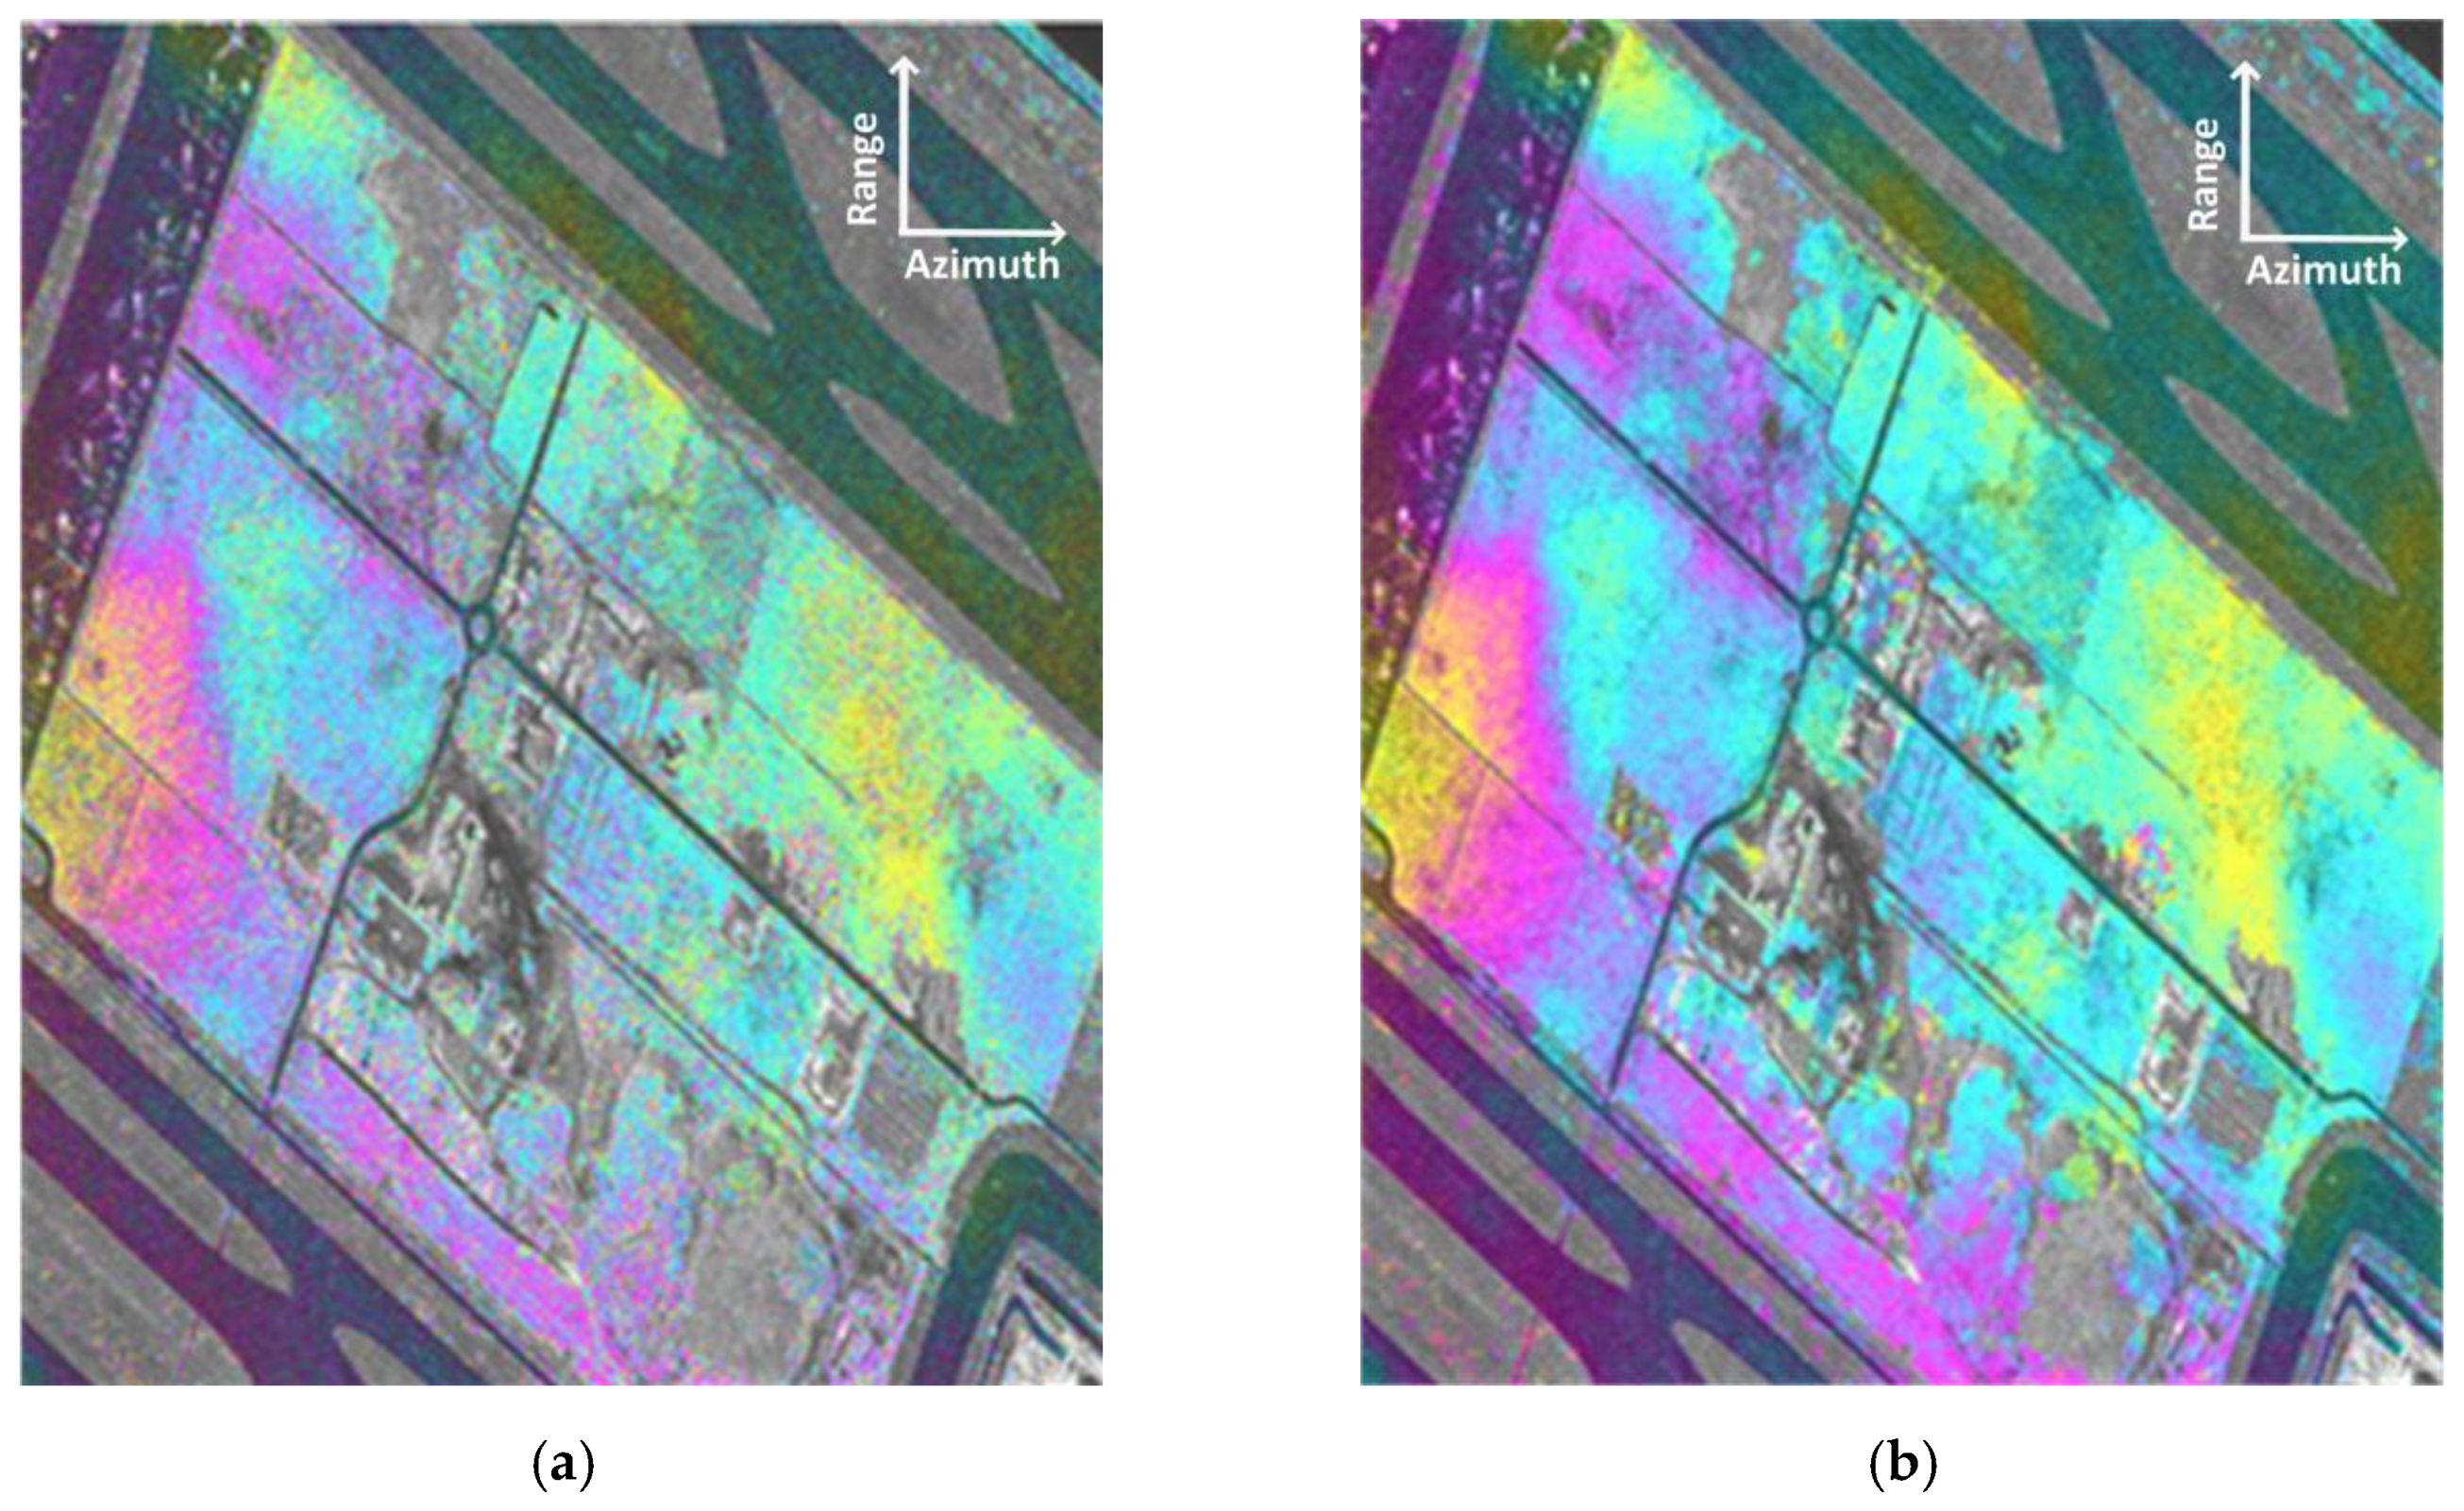
Figure 18.
Computational time for FaSHPS and eigendecomposition using (a) different stack sizes and (b) estimated window sizes for 1000 * 1000 pixels.
Figure 18.
Computational time for FaSHPS and eigendecomposition using (a) different stack sizes and (b) estimated window sizes for 1000 * 1000 pixels.


Table 1.
Comparison of computational efficiency of three combined strategies for 1000 * 1000 pixels.
Table 1.
Comparison of computational efficiency of three combined strategies for 1000 * 1000 pixels.
| Strategy | SHP Identification | Time (h) | Phase Estimation | Time (h) | Computation Efficiency |
|---|---|---|---|---|---|
| I | KS test | 8.98 | ML estimator | 71.8 | low |
| II | KS test | 8.98 | Eigendecomposition | 3.59 | moderate |
| III | FaSHPS | 0.32 | Eigendecomposition | 3.59 | very high |
© 2018 by the authors. Licensee MDPI, Basel, Switzerland. This article is an open access article distributed under the terms and conditions of the Creative Commons Attribution (CC BY) license (http://creativecommons.org/licenses/by/4.0/).
Share and Cite
MDPI and ACS Style
Sun, Q.; Jiang, L.; Jiang, M.; Lin, H.; Ma, P.; Wang, H. Monitoring Coastal Reclamation Subsidence in Hong Kong with Distributed Scatterer Interferometry. Remote Sens. 2018, 10, 1738. https://doi.org/10.3390/rs10111738
AMA Style
Sun Q, Jiang L, Jiang M, Lin H, Ma P, Wang H. Monitoring Coastal Reclamation Subsidence in Hong Kong with Distributed Scatterer Interferometry. Remote Sensing. 2018; 10(11):1738. https://doi.org/10.3390/rs10111738
Chicago/Turabian StyleSun, Qishi, Liming Jiang, Mi Jiang, Hui Lin, Peifeng Ma, and Hansheng Wang. 2018. "Monitoring Coastal Reclamation Subsidence in Hong Kong with Distributed Scatterer Interferometry" Remote Sensing 10, no. 11: 1738. https://doi.org/10.3390/rs10111738
Note that from the first issue of 2016, this journal uses article numbers instead of page numbers. See further details here.