MISR Radiance Anomalies Induced by Stratospheric Volcanic Aerosols
by
Dong L. Wu
1,*, 
Tao Wang
2,
Tamás Várnai
3,
James A. Limbacher
4,
Ralph A. Kahn
1, 
Ghassan Taha
5,
Jae N. Lee
3,
Jie Gong
5 and
Tianle Yuan
2 1
NASA Goddard Space Flight Center, Greenbelt, MD 20771, USA
2
Earth System Science Interdisciplinary Center, University of Maryland, College Park, MD 20740, USA
3
Joint Center for Earth Systems Technology, University of Maryland, Baltimore County, MD 21250, USA
4
Science Systems and Applications, Inc., Lanham, MD 20706, USA
5
Universities Space Research Association, Columbia, MD 21046, USA
*
Author to whom correspondence should be addressed.
Remote Sens. 2018, 10(12), 1875; https://doi.org/10.3390/rs10121875
Submission received: 7 October 2018
/
Revised: 15 November 2018
/
Accepted: 20 November 2018
/
Published: 23 November 2018
(This article belongs to the Special Issue MISR)
Abstract
:The 16-year MISR monthly radiances are analyzed in this study, showing significant enhancements of anisotropic scattering at high latitudes after several major volcanic eruptions with injection heights greater than 14 km. The anomaly of deseasonalized radiance anisotropy between MISR’s DF and DA views (70.5° forward and aft) is largest in the blue band with amplitudes amounting to 5–15% of the mean radiance. The anomalous radiance anisotropy is a manifestation of the stronger forward scattering of reflected sunlight due to the direct and indirect effects of stratospheric volcanic aerosols (SVAs). The perturbations of MISR radiance anisotropy from the Kasatochi (August 2008), Sarychev (June 2009), Nabro (June 2011) and Calbuco (April 2015) eruptions are consistent with the poleward transported SVAs observed by CALIOP and OMPS-LP. In a particular scene over the Arctic Ocean, the stratospheric aerosol mid-visible optical depth can reach as high as 0.2–0.5. The enhanced global forward scattering by SVAs has important implications for the shortwave radiation budget.
1. Introduction
Stratospheric volcanic aerosols (SVAs), a natural source of Earth’s climate variability, play an important role in cooling the surface temperature and the troposphere [1,2]. In the case of strong volcanic eruptions (e.g., Pinatubo 1991), the cooling can last for several months to over a year. The primary contributions are a direct increase in the top-of-atmosphere (TOA) albedo over clear areas as well as indirect increases in the albedo of cloudy areas [3]. Absent any major eruption, a background stratospheric aerosol layer produces a non-negligible, negative forcing compared to the recent global warming [4]. Potential indirect effects through cirrus seeding could further complicate the SVA’s role in the upper troposphere and lower stratosphere (UTLS) [5,6]. Their seeding of polar stratospheric clouds (PSCs) could cause more ozone loss by facilitating chlorine activation through heterogeneous reactions [7].
Satellite stratospheric aerosol observations have been largely based on limb sounding techniques including solar [8,9,10,11] or stellar [12] occultations, limb-scattered solar radiation [13,14,15,16], and limb thermal infrared (TIR) radiation [17,18]. The limb techniques have a good vertical resolution for separating stratospheric from tropospheric aerosols and good sensitivity to tenuous aerosol layers due to the long path length. Because stratospheric aerosols often have long lifetimes and great spatial extent, the limb measurements can be used to monitor long-term aerosol variations despite their sparse sampling [19].
Active spaceborne measurements, such as those from the Lidar in Space Technology Experiment (LITE) [20] and the Cloud-Aerosol Lidar with Orthogonal Polarization (CALIOP) [21], also offer superb vertical resolution for detecting stratospheric aerosol layers. By averaging the lidar scattering ratio (SR), the ratio of lidar backscatter over the Rayleigh background, the technique is able to detect relatively thin aerosol layers in the stratosphere. In the cases when stratospheric aerosols are enhanced by moderate volcanic eruptions, the SR can reach as high as 1.3–1.4 at 532 nm [22] where volcanic aerosol layers are readily seen in a single orbital pass [23].
Although tropospheric volcanic ash and aerosols are visible in nadir-viewing imagery, it is difficult to measure SVAs with such instruments from space because of low aerosol optical depth and poor contrast against the troposphere/surface background. However, the optically-thick volcanic ash plumes in the vicinity of eruptions are often observed with UV, visible and IR nadir-viewing imagers [24,25]. Guermazi et al. [26] analyzed the TIR sensitivity to moderate volcanic aerosol injection into the UTLS and found a potential 1–2 K signal from the SVA attenuation. Using the stereo matching technique with Multiangle Imaging SpectroRadiometer (MISR), Scollo et al. [27] characterized volcanic ash and sulfate/water dispersion and height from 20 Mt. Etna eruptions, and Flower and Kahn [28] analyzed the MISR plume heights and aerosol retrievals from Karymsky volcano in Kamchatka, where in both cases the detected plumes resided in the troposphere.
In this paper we report, for the first time, SVA-induced radiance anisotropy in space-based, multi-angle measurements at slant viewing angles. The signals are most pronounced at high latitudes where the scattering angle difference between MISR’s forward-backward observations is largest. The SVA-induced scattering anomalies can be extracted from monthly radiances by removing seasonal variations.
2. Multi-Angular Views of Volcanic Plumes and Aerosols
As detailed in reference [29], MISR measures reflected sunlight at nine viewing angles along-track at 70.5°, 60°, 45.6°, and 26.1° with respect to nadir in the forward and aft directions (namely DF, CF, BF, AF, AN, AA, BA, CA, DA) in each of four spectral bands at 446 (blue), 558 (green), 672 (red), and 866 nm (near infrared, NIR). All MISR’s 9-view and 4-band images are acquired within ~7 min for a given location, which plays an important role, as discussed later, in extracting the SVA-induced radiance anisotropy.
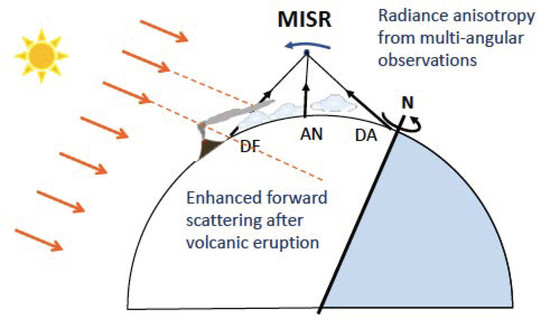
Figure 1 is a schematic diagram illustrating MISR stereoscopic viewing in the Northern Hemisphere (NH) high latitudes, with the DF and DA cameras viewing the scene at large forward and backward scattering angles, respectively. The Terra satellite’s sun-synchronous orbit has been maintained within a tight (<2 min) of its ascending 10:30 AM equator crossing time since 2002. Terra was initially at 10:45 shortly after launch, and it took ~2 years to stabilize its orbit at 10:30 AM. The 15 min local time difference has a significant impact on the cloud statistics observed by MISR [30]. The cloud/aerosol scattering properties retrieved from MISR at oblique angles are quite sensitive to view geometry differences due to the local time change; we therefore limit our analysis to MISR observations after 2002.
In addition to MISR data, in this study we also analyze (1) lidar level-1 backscatter data from Cloud-Aerosol Lidar and Infrared Pathfinder Satellite Observations (CALIPSO, 2006–present) [31], (2) aerosol data from Ozone Mapping and Profiler Suite Limb Profiler (OMPS-LP, 2012–present) [32], and (3) the Moderate resolution Imaging Spectroradiometer (MODIS) Collection 6 aerosol and cloud products [33]. To study and diagnose aerosol transport, we employ the reanalysis data from Modern-Era Retrospective analysis for Research and Applications, Version 2 (MERRA-2) [34].
2.1. The Sarychev Eruption, June 2009
Sarychev Peak (48.1°N, 153.2°E), in the northwest Pacific Kuril Islands, began erupting on 11 June 2009 and continued for approximately 10 days. Haywood et al. [35] provided an initial detailed study of the Sarychev eruption with satellite observations as well as climate model simulations for SO2 and sulfate aerosol transport. The observations and model simulations show that the SO2 plume was spread in both westward and eastward directions, but eventually the eastward dispersion was responsible for subsequent widespread enhancement and impact on the NH. In many aspects the Sarychev eruption is considered as one of the significant events during the post-Pinatubo period that generated and transported a large amount of stratospheric aerosols into the Arctic.
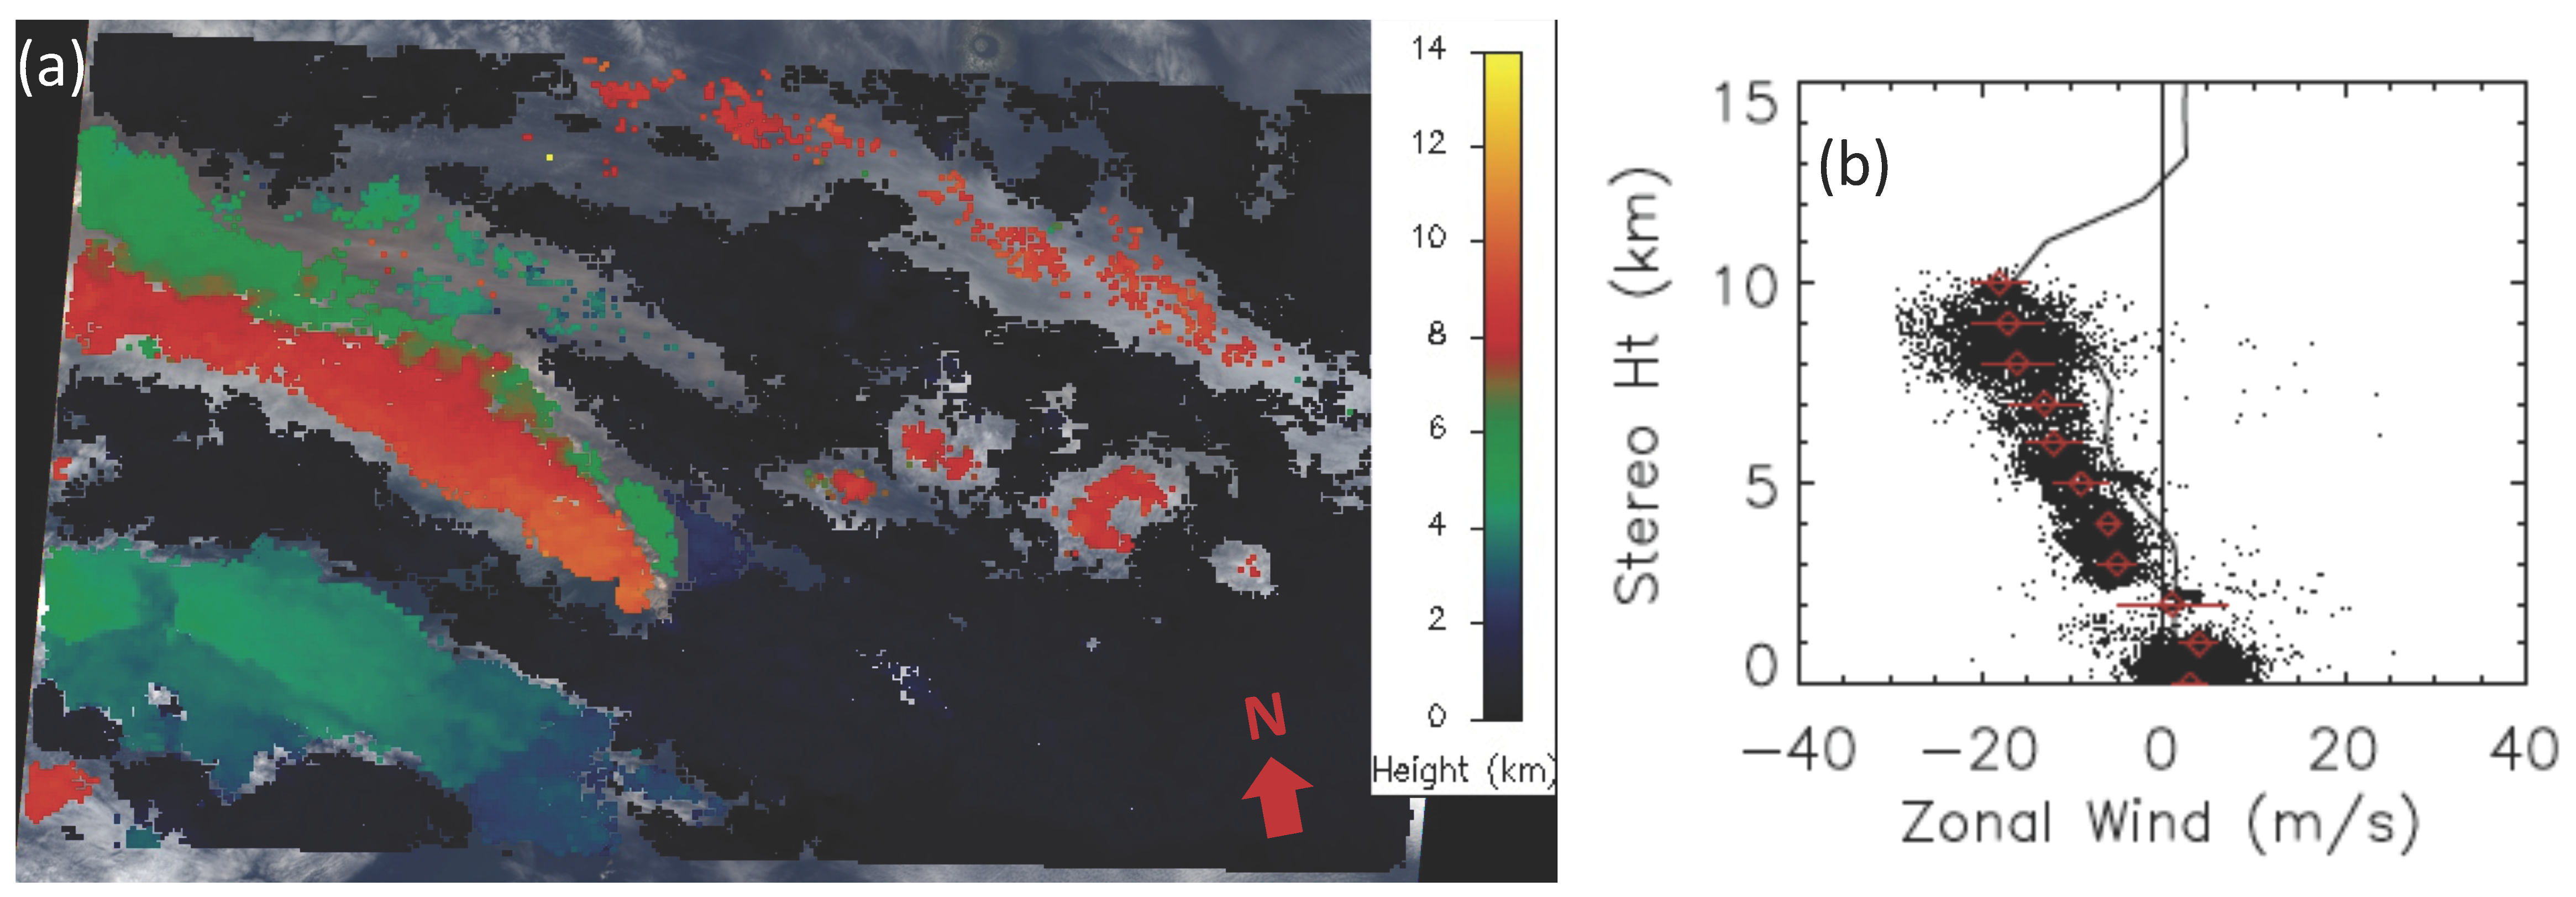
MISR had a clear view of the Sarychev eruption on 16 June 2009. As shown in Figure 2, the volcanic injection manifests itself as a narrow tower shooting up to ~11 km, which can be readily seen as a tall object from its parallax in the MISR DA and DF images. Volcanic ash plumes disperse mostly westward in the troposphere, but the wind reverses to the eastward in the UTLS, as revealed in the MERRA2 reanalysis (Figure 2d).
Using the MISR INteractive eXplorer (MINX) digitization software [36], we are able to retrieve the heights of volcanic clouds and ash plumes near Sarychev from the stereo imagery (Figure 3). On 16 June the region was mostly covered by low clouds at a height <2 km. The volcanic ash plumes/clouds dispersed to the west and appear to form two distinct layers at 5 and 8 km above sea level (ASL). The lower brownish plume in Figure 2a is located slightly to the north of the higher one. Although some light brown ash plumes are visible to the northeast of Sarychev, their optical depth is quite low, and the MINX pattern-matcher could not separate them from the bright low cloud underneath. (Generally, in the presence of multi-layer clouds/plumes, the wind and height patterns derived from stereo matching favor the higher-contrast scene elements.) Although the observed volcanic ash did not reach the stratosphere, volcanic SO2 gas can be injected to higher altitudes and transported long distances [37]. It generally takes a few days for stratospheric SO2 to be converted into sulfate aerosols in the presence of water vapor.
The eruption on 16 June appears to disturb the regional zonal winds to a large extent, which is evident in the time series of MERRA2 wind reanalysis (Figure 2d). The cloud-tracked winds derived with MINX agree quite well with the MERRA2 zonal wind on June 16, showing that the westward winds increase with height almost linearly up to ~10 km before reducing and reversing to a weak eastward flow. However, the assimilated wind anomaly in MERRA2 lags the MISR winds by 20 h in time, and has a slightly lower speed (Figure 3).
2.2. Stratospheric Aerosols from the Sarychev Eruption
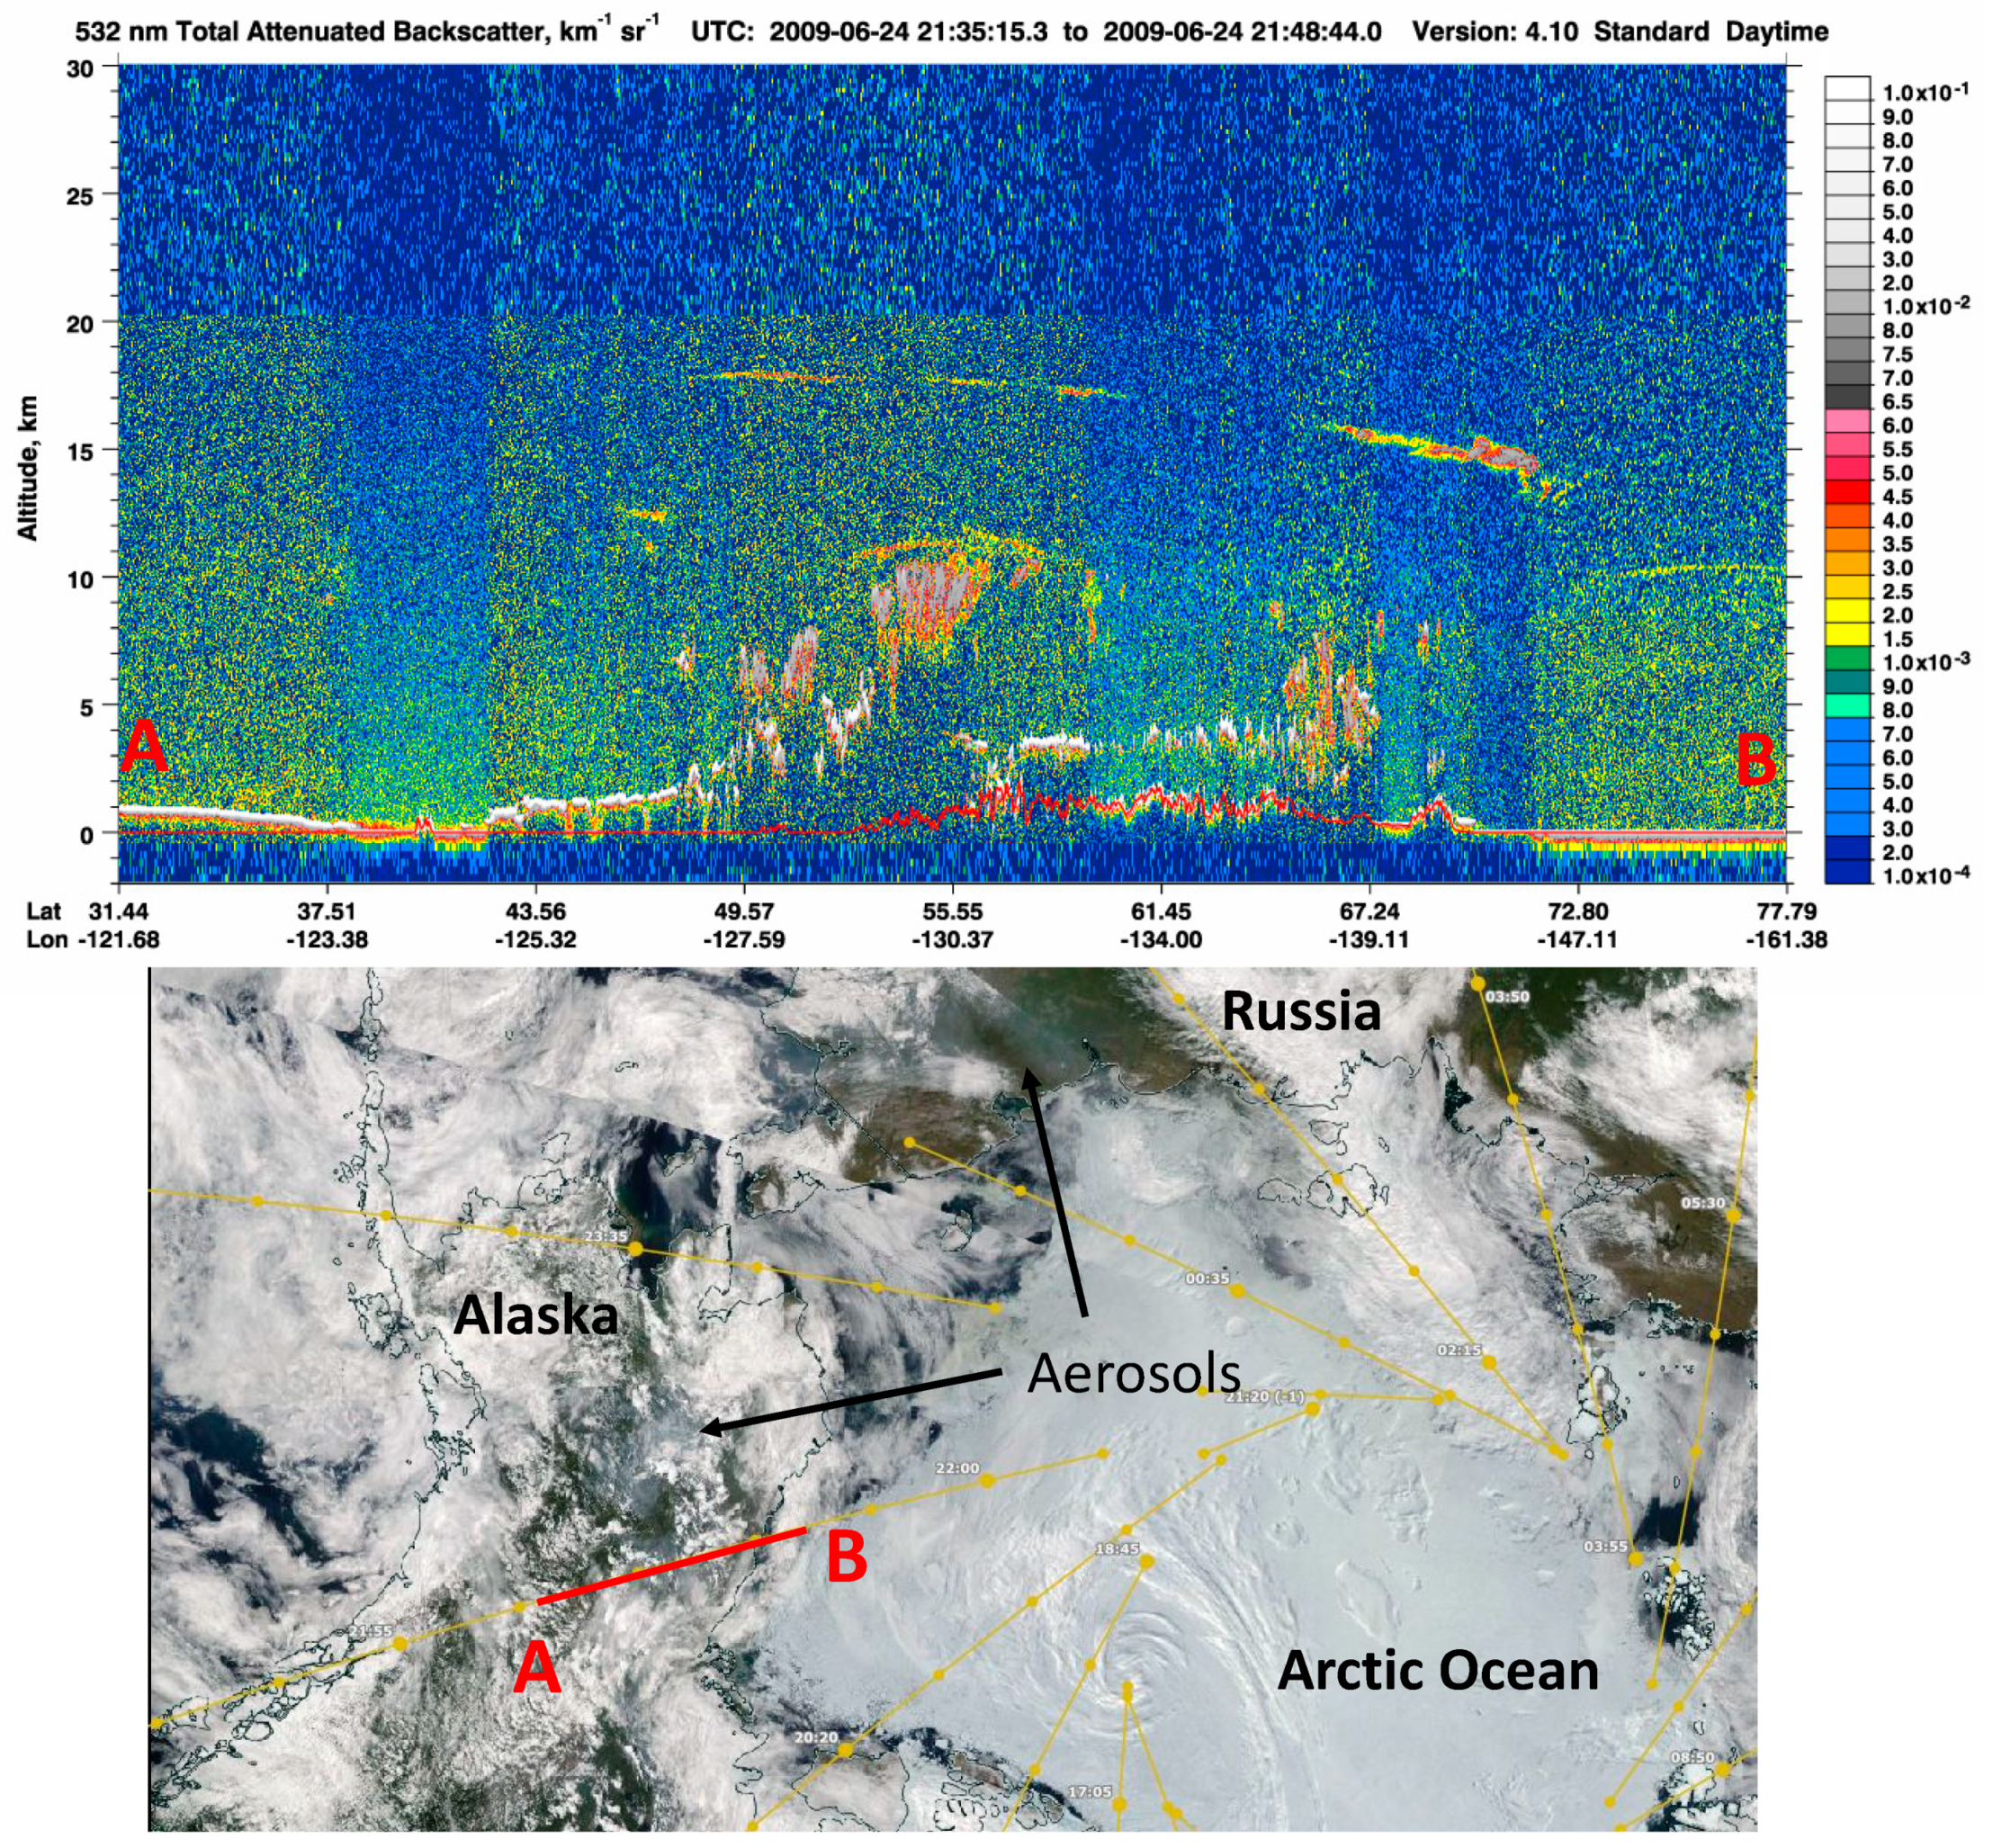
Shortly after the Sarychev eruption, hazy scenes could be found in MISR and MODIS images over the northern Pacific, north America and the Arctic Ocean. Especially in the MISR DF image, hazy aerosol layers stand out relative to images at other view angles. Unlike the cirrus strips with sharper contrast against a dark background, these layers are blurry compared to those in the same region before the eruption. Figure 4 shows a “blurry” clear-sky scene on 24 June over the Beaufort Sea where the DF camera observes strong forward scattering from aerosol layers. There are large differences between the forward (DF) and backward (DA) scattering angles, suggesting the presence of large aerosol particles relative to the blue wavelength.
Because these aerosol layers are bright enough over dark ocean, they produce sufficient contrast for the stereo height retrieval with MISR’s nine different view angles. In Figure 4c the MINX stereo height and wind retrievals suggest that the aerosol layers are mostly at ~15 km, significantly above the local tropopause (~10 km) according to the MERRA2 data. Moreover, the stereo height of MISR-observed aerosol layers is consistent with the layers in this region detected by the CALIPSO lidar at approximately same time (Figure 5). The CALIPSO backscatter measurements reveal that the stratospheric aerosol layer extends over at least 2000 km. The higher (at 17–18 km) layer is about ~200 m thick with a lower optical depth, whereas the lower layer (at 14–16 km) is about 0.5–1 km thick and has a higher optical depth. The location and altitude of the thicker layer matches well the MISR observation. From a broader perspective, the MODIS image shows that the hazy aerosol layers widely spread over Alaska and northeastern Russia (Figure 5, bottom).
To determine the origin of the MISR-observed aerosol layers over the Beaufort Sea, we carried out a back-trajectory calculation using the 6-hourly ERA-interim dynamics field from the European Center for Medium-range Weather Forecasting (ECMWF) model. As shown in Figure 4d,e, back trajectories indicate that the aerosol plumes captured by MISR and CALIPSO on 24 June, of likely volcanic origin, emanated from Sarychev volcano on Kuril Island. The back-trajectory calculation suggests that the plumes originated from Sarychev around 15 June, at an injection height of 18–20 km, or 418–419 K in potential temperature (theta). Along its path to the Beaufort Sea, the plume (SO2 gas or ash/sulfate aerosols) descended gradually in height. The calculated trajectory is similar to the SO2 plumes reported from satellite observations and model simulations [35,38].
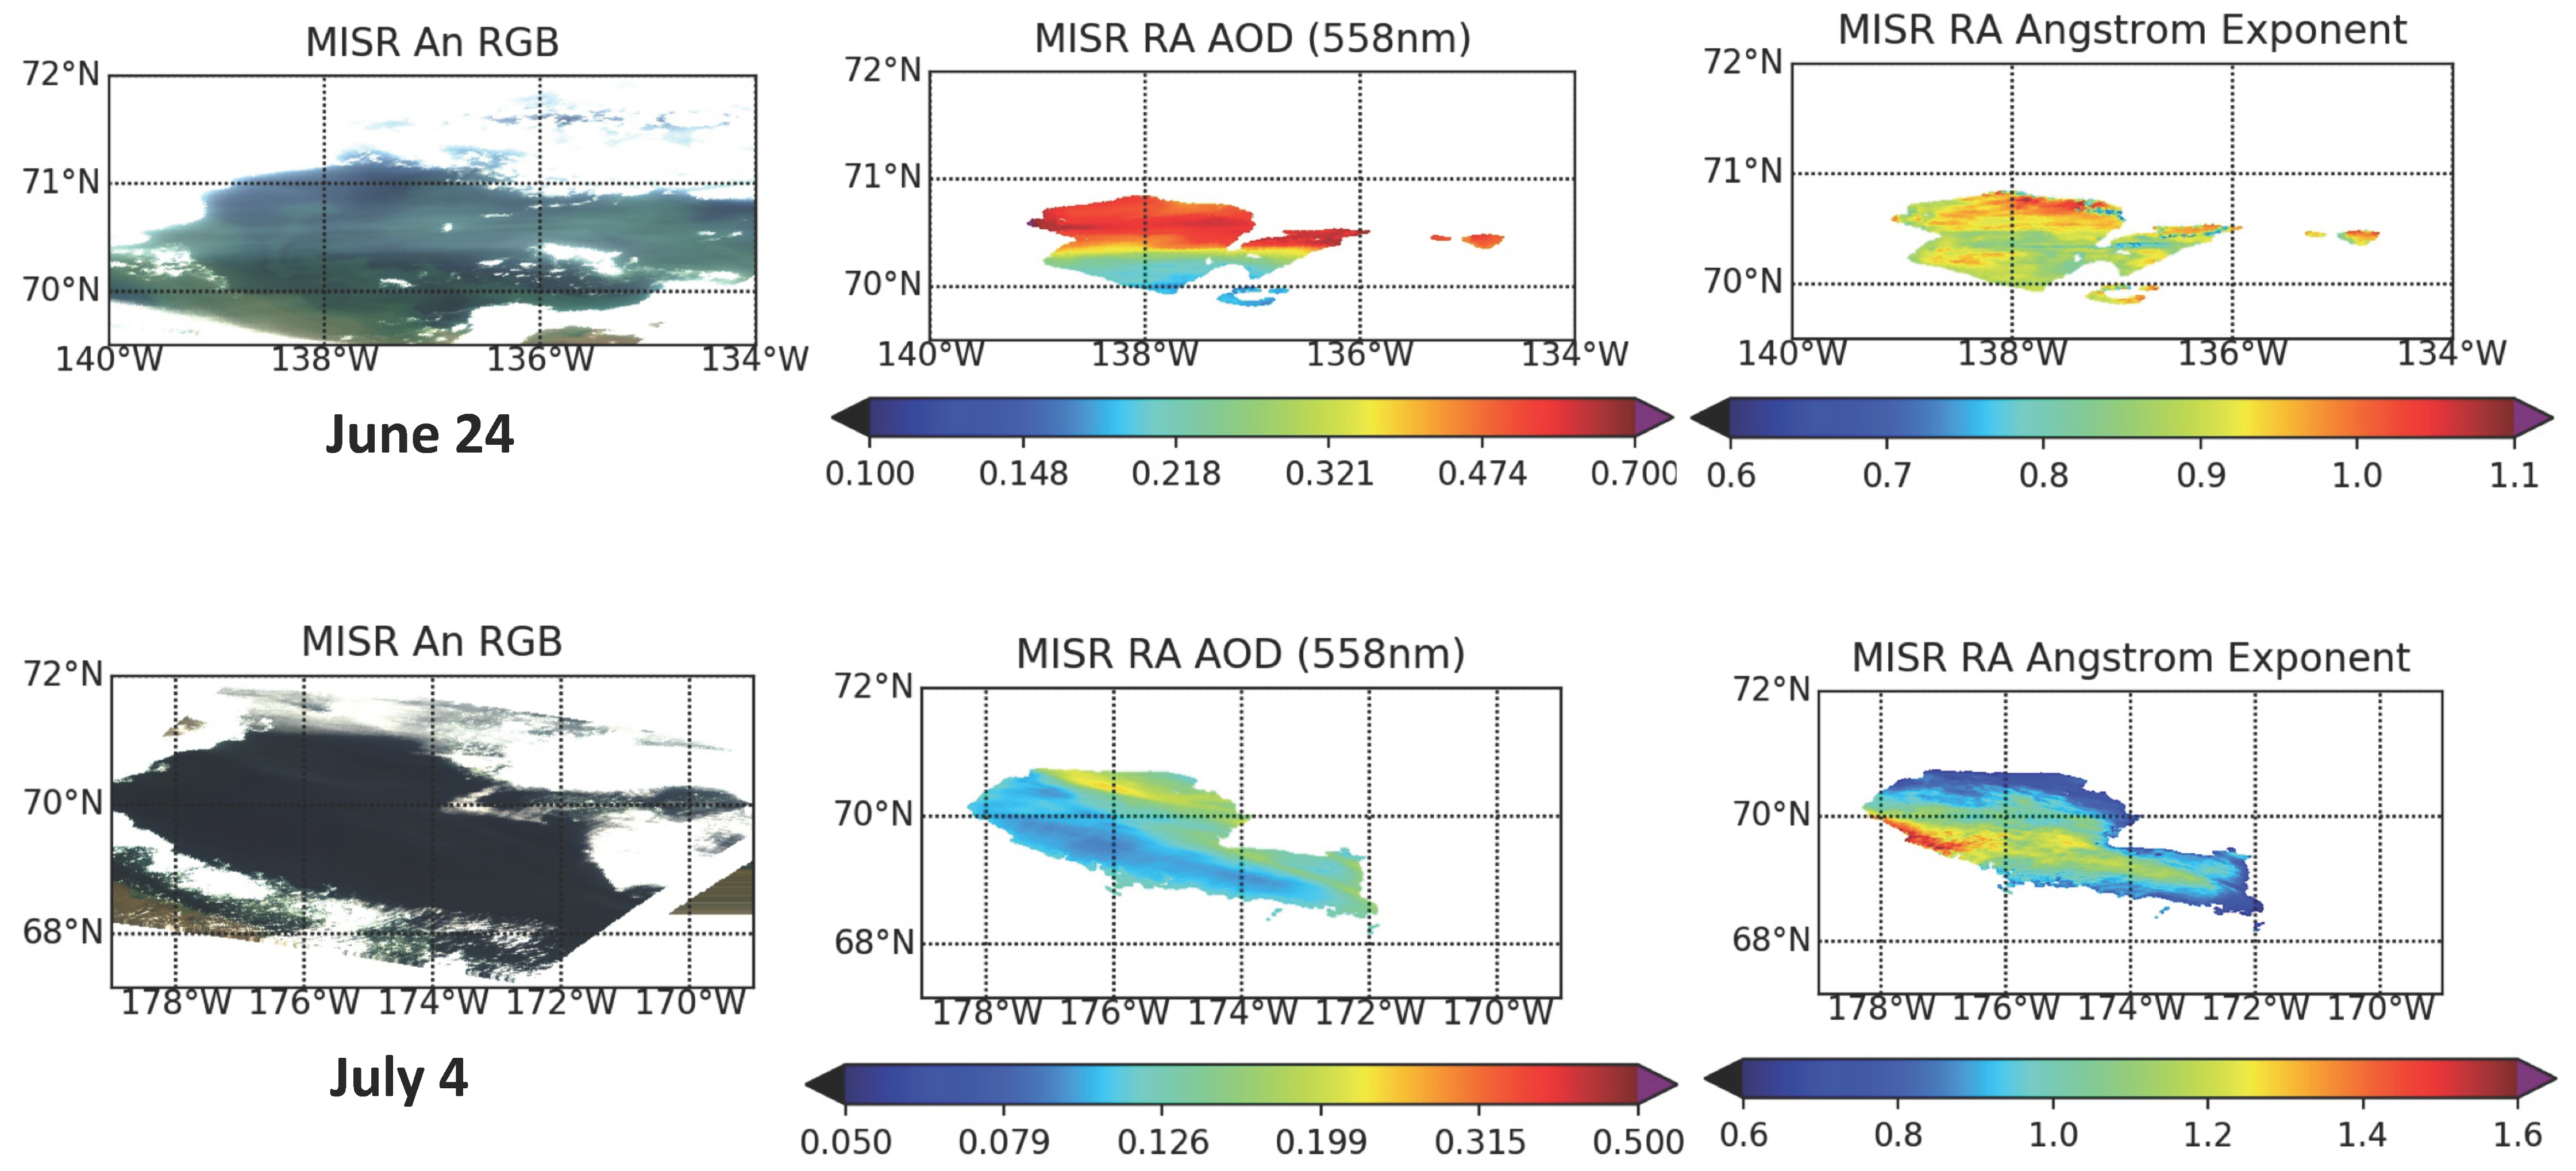
To evaluate the aerosol properties observed on 24 June in further detail, the MISR Research Aerosol retrieval algorithm (RA) is employed for deriving aerosol optical depth (AOD), Ångstrøm exponent, non-spherical AOD fraction, and single-scattering albedo (SSA) [39]. With the empirical stray-light correction for MISR radiance measurements [40], the RA algorithm is capable, under favorable conditions, of retrieving mid-visible AOD as low as a few hundredths, such as the typical values of stratospheric AOD (sAOD). The RA retrievals for the 24 June layer reveal mid-visible AOD of 0.2–0.5 (well above the detection limit). Derived particle properties indicate small-medium, mostly spherical, weakly or non-absorbing particles. (Specifically, Ångstrøm exponent of 0.85–1.05, and single-scattering albedo of 0.97–0.99, with 10–20% non-spherical particles; Figure 6, top.) The streaks in 24 June MISR image in Figure 6 are interpreted as medium, non-spherical, weakly light-absorbing volcanic ash-rich particles embedded in a more horizontally dispersed plume of small-medium, spherical, non-absorbing sulfate/water particles of likely volcanic origin. This interpretation is partly confirmed by a CALIPSO overpass crossing the same region, with an aerosol layer at 15 km elevation and a weak depolarization ratio at 532 nm wavelength, suggesting varying concentration of non-spherical ash within the plume.
Another RA AOD retrieval is demonstrated with a scene near (70°N, 175°W) where the MINX identifies a vertically thin plume at 15 km altitude on 4 July 2009 (Figure 6, bottom). The RA algorithm reports three elevated streaks ~100 km long, with mid-visible AOD ~0.25 and about 30% non-spherical particles within a wider plume of spherical particles with AOD ~0.1, which are consistent with the ground-based observations of Sarychev-induced enhancement in sAOD over the Arctic [23]. Again, the 4 July streaks observed by MISR are interpreted as volcanic ash-rich particles embedded in a more horizontally dispersed plume of sulfate/water particles of likely volcanic origin.
3. Anisotropy of MISR Monthly Radiances
Radiance anisotropy between the fore- and aft-viewing MISR camera pairs due to aerosol/cloud scattering is mediated primarily by solar geometry, so in addition to atmospheric aerosol, cloud and surface effects, it depends upon latitude, season, view angle, and the 10:30 AM equator crossing time of the Terra satellite. Although volcanic eruptions can produce significant radiance perturbations near the eruption site and over oceanic scenes, it is important to understand and quantify their global radiative effects. For this objective we further analyze MISR’s level-3 monthly radiance product, for which all images are averaged on a 0.5° × 0.5° longitude-latitude grid. Because MISR measurements of a given location on the surface are acquired near-simultaneously, the monthly mean radiances preserve and enhance the anisotropic scattering of slowly-varying atmospheric layers by reducing the noise from insufficient spatiotemporal sampling of rapidly-changing phenomena such as clouds. Simultaneous observations at multiple angles are critical for extracting the anisotropic scattering signal over contamination from fast processes, because the differencing between these angular measurements (e.g., DF-DA) is carried out almost on a pixel-by-pixel basis even though we study the monthly MISR radiance differences.
3.1. MISR Monthly Mean Radiances
The MISR monthly mean radiances, which report the reflected sunlight at the top of atmosphere (TOA), strongly depend on the time of year (shown for the blue band in Figure 7). The view angles at which the radiances are acquired from the nine cameras are nearly symmetric with respect to the MISR nadir view (AN) at all latitudes. Although the view angle difference (e.g., DF-DA) is nearly independent of location, the scattering angle difference between the forward and backward MISR views is larger at higher latitudes. The scattering angle difference between MISR’s symmetric camera views is smallest near the equator, where the Sun is nearly overhead. The observed radiances are generally larger at oblique view angles than those at the nadir because of increasing cloud optical thickness [41,42] and atmospheric path length for more slanted views. Similar angular and latitudinal dependences are found in other MISR spectral bands.
The anisotropic component of MISR monthly radiances is calculated by differencing the measurements from the views symmetric about the nadir (i.e., DF-DA, AF-AA). The MISR scattering anisotropy depends on the forward-backward scattering angle differences as well as on surface and cloud distributions, because surfaces and clouds can produce strong forward scattering. Both scattering angles and the surface/cloud climatology are strongly season-dependent. As expected due to the scattering angle differences, the MISR radiance anisotropy is larger between the oblique views (DF-DA) than between the near nadir views (AF-AA) and diminishes in the tropics, where the scattering angles for the forward and aft MISR view pairs are nearly symmetric. It should be noted that the radiance differences change sign between the NH and the Southern Hemisphere (SH), as the forward scattering changes from being observed in the forward-viewing MISR cameras in the NH to the aft cameras in the SH.
As shown in Figure 7, the mean radiances and their anisotropy vary significantly with season. Brighter radiances are seen in three latitude bands (tropics, middle-to-high SH and NH latitudes), which are mostly associated with cloudiness. Unlike the radiance seasonality, the seasonal variation of radiance anisotropy is weak in the tropics for the reason aforementioned. The anisotropic radiances are enhanced in two latitude bands (middle and high latitudes) in each hemisphere. The amplitude of the high-latitude anisotropy is largest in the D cameras, whereas the mid-latitude band anisotropy appears to be stronger in the B and C cameras. It is worth noting that the radiance anisotropy exhibits a much smoother variation with latitude than the mean radiance, which is evident in particular at mid-to-high latitudes in the NH in April and the SH in October.
3.2. SO2 Observations of High-Injection Volcanic Eruptions
Several well-known eruptions occurred during 2002–2018, injecting significant amount of SO2 into the lower stratosphere (Table 1). The volcanic SO2 emission and estimated injection height data in Table 1 are taken from the newly compiled from Total Ozone Mapping Spectrometer (TOMS) and Ozone Monitoring Instrument (OMI) [43,44]. The Kasatochi eruption in August 2008, combined with a weaker eruption from its neighbor Okmok in the Aleutian Islands that erupted earlier in June 2008, produced a rapid increase in sAOD, with an e-folding time of 6 months [45].
The Sarychev and Nabro eruptions also had significant impacts on the NH stratosphere, producing larger sAOD than Kasatochi in the ground-based lidar measurements at a mid-latitude site [46]. The Sarychev eruption had an e-folding time of 4–5 months [35] with extensive impacts on the Arctic, raising the background sAOD by ~50% [35,38]. The Nabro volcano had multiple eruptions from 12–18 June 2011, injecting a total of 1.5–2 Tg of SO2 into the stratosphere [47] and having a long e-folding time of ~4 months [48].
The Calbuco volcano in southern Chile (42.3°S, 72.6°W) erupted on 22 April 2015 with two intense explosive events recorded during the same week. The injection height was reported to be 20 km and produced 0.4 Tg SO2. Based on a synthesis of satellite and suborbital observations, it had effects in the stratosphere that lasted till late 2015 and early 2016 [49]. It was suggested in a model study that the Calbuco volcanic aerosols played a key role in chemical ozone depletion that resulted in the record-sized ozone hole of October 2015 [50].
3.3. MISR Radiance Anomalies Induced by Volcano Eruptions
In this study we analyze the time series of MISR monthly radiances and their anisotropy for 2002–2017, when the Terra equator crossing time was maintained within 2 min. of 10:30 AM. The time series of MISR blue-band radiances and the DF-DA difference show a strong seasonal cycle that is repeatable from year to year, driven largely by variations in solar and viewing geometry along with surface and atmospheric scattering (Figure 8). In the NH, the DA radiance is larger in spring whereas the DF-DA difference is larger in fall. The springtime high DA radiance and small DF-DA differences may be dominated by more isotropic reflection from rough snow and sea ice surfaces, whereas anisotropic reflection from clouds and open oceans may contribute more to the reflection in fall.
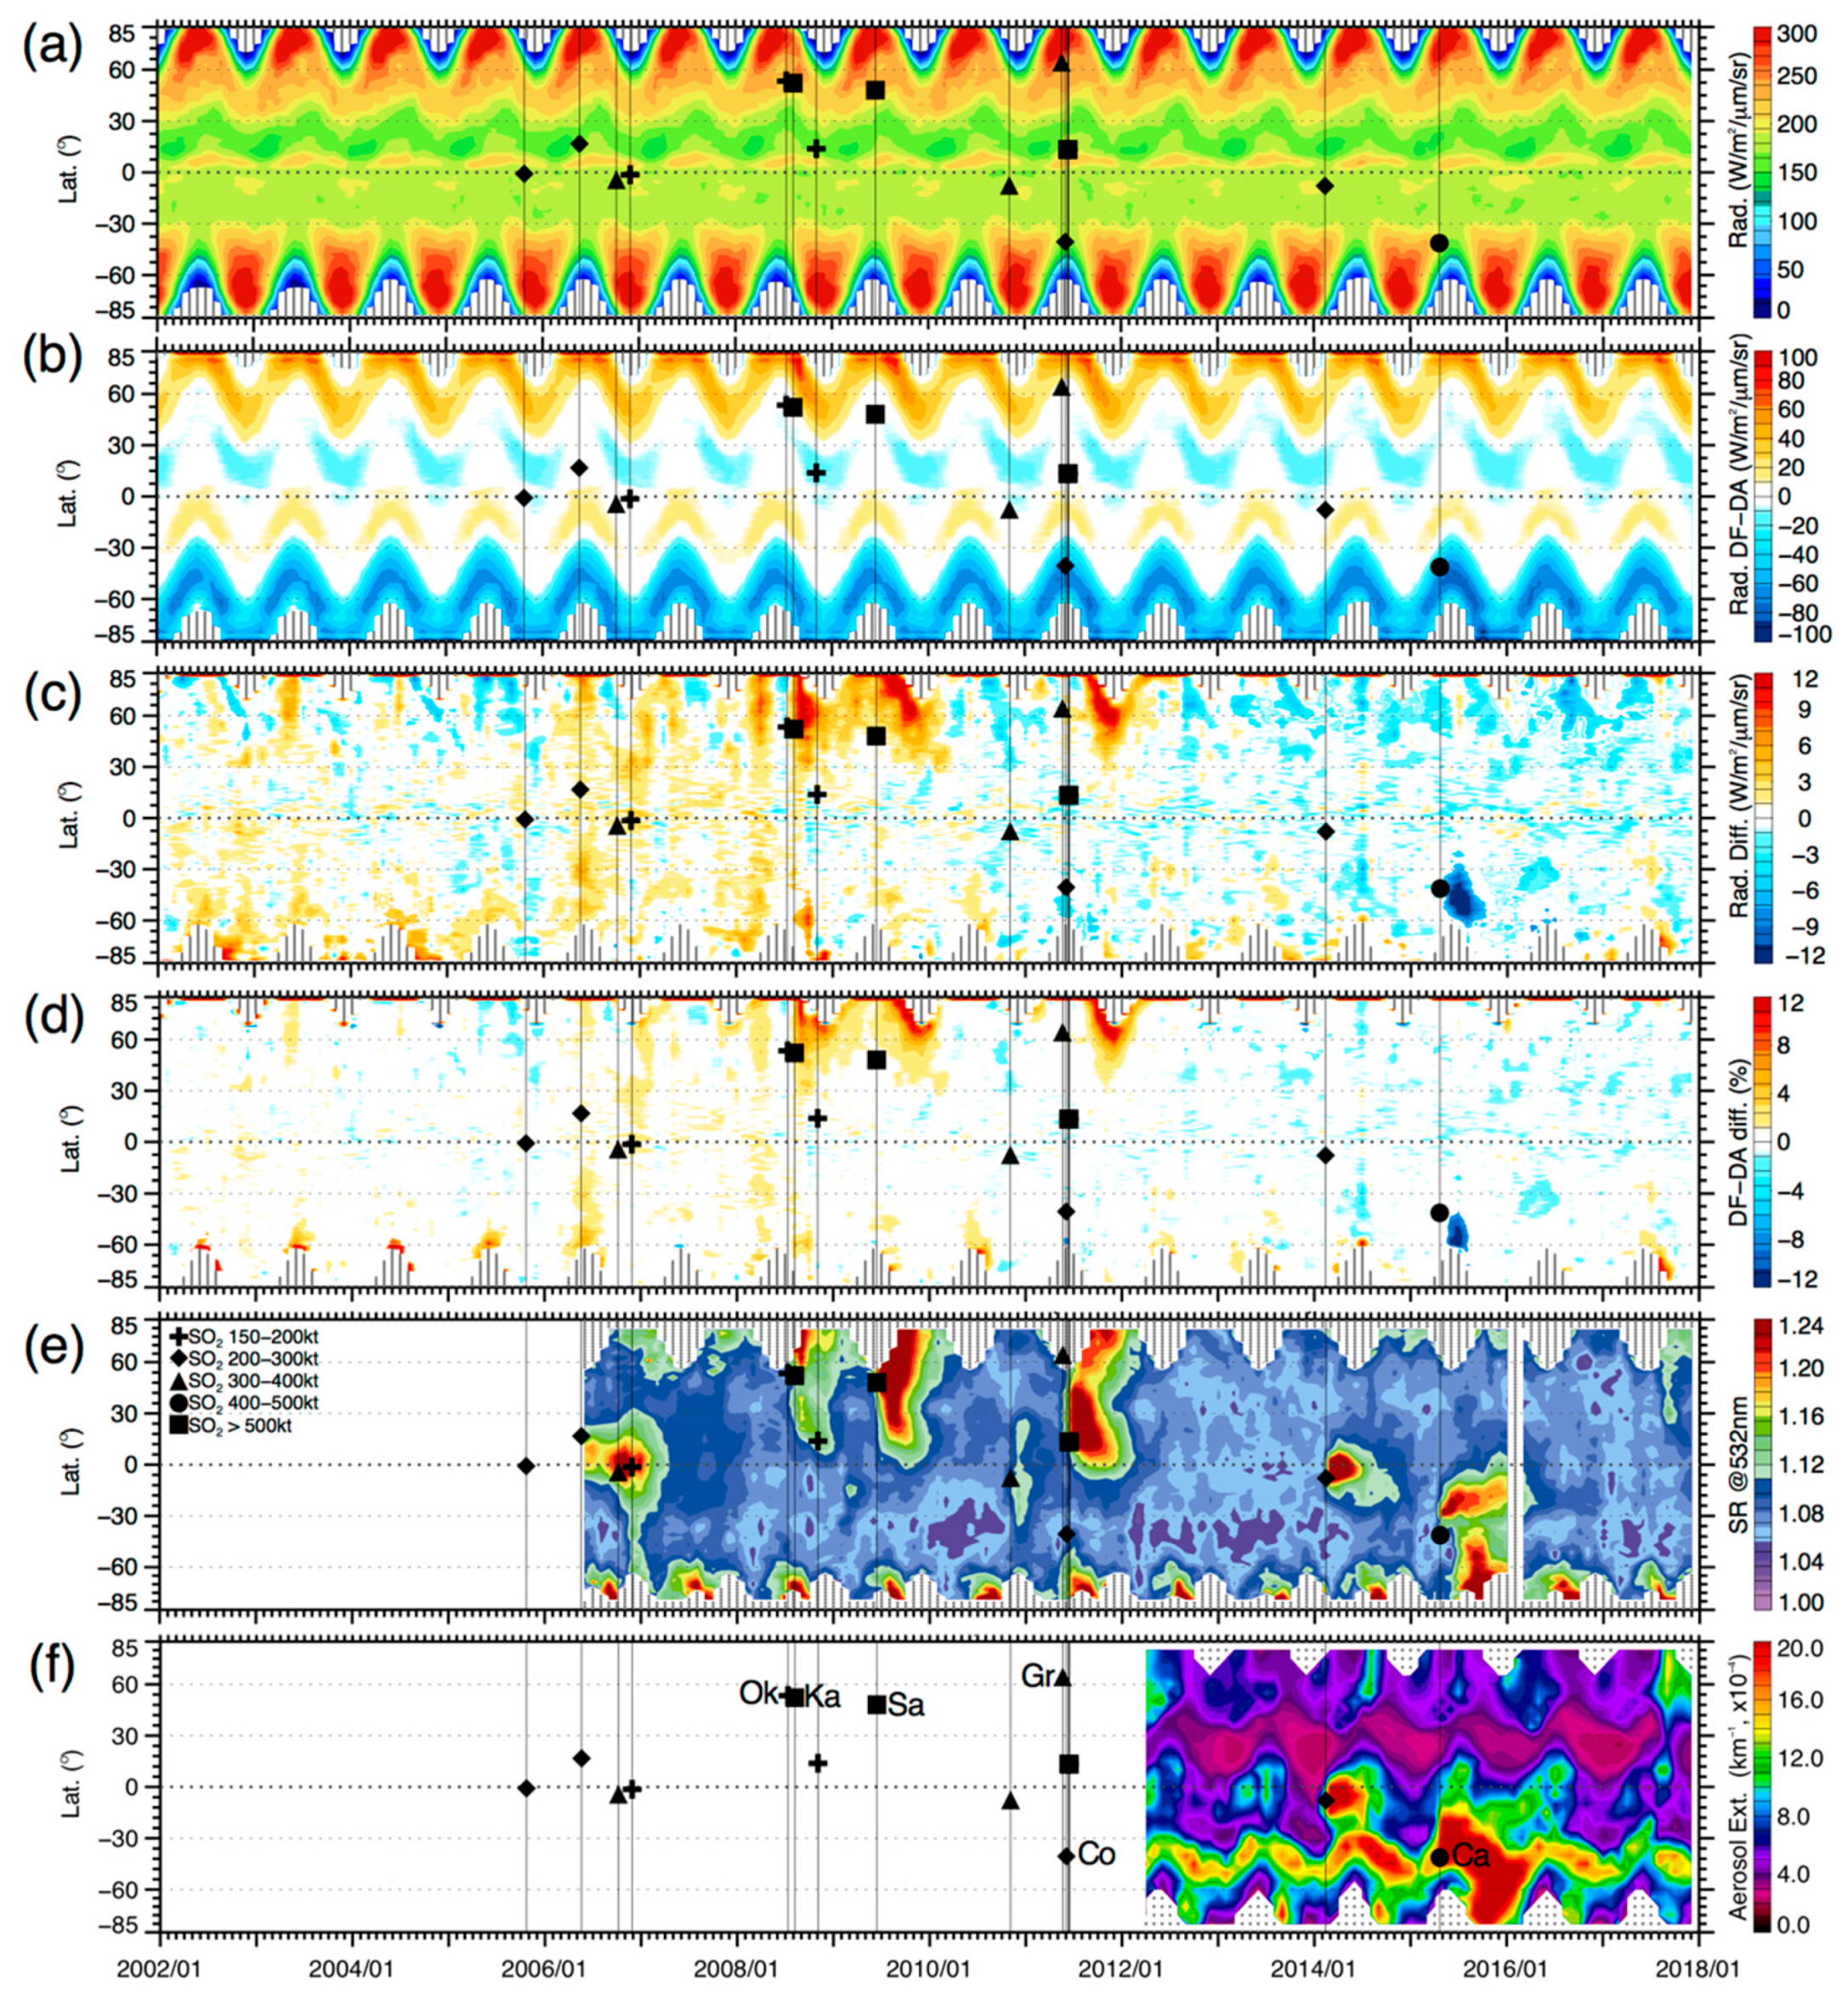
To isolate the contribution of volcanic aerosols, we deseasonalize the DF-DA time series by subtracting 16-year (2002–2017) monthly mean DF-DA radiances from individual monthly data. We refer to the de-seasonalized DF-DA difference as the anisotropy anomaly. Based on the timing of their occurrences, the remaining anisotropy anomalies appear to be the enhancements associated with the Kasatochi (August 2008), Sarychev (June 2009), Nabro (June 2011) and Calbuco (April 2015) eruptions (Figure 8c). These large anomalies amount to 5–15% of the mean radiance at high latitudes (Figure 8d), which represents a significant increase in forward-scattering after the eruptions. A weak anisotropy enhancement is also seen after the Cordon-Caulle (Jun 2011) eruption, which is known for producing ash/sulfate plumes that traveled a full circle of the globe [51]. As discussed above, the MISR technique loses sensitivity to forward-backward scattering anisotropy at low latitudes due to symmetry in the scattering geometry of the MISR forward and aft-viewing cameras. As a result, the amplitude of the derived anisotropic scattering decreases toward the equator, showing little response to those eruptions in the tropics.
To verify the SVA origin of the enhancements in MISR anisotropic scattering, CALIOP lidar 532-nm SR and OMPS-LP aerosol extinction data are brought for comparisons (Figure 8e,f). The lidar 532-nm SR is the ratio of the observed attenuated backscatter coefficient over the modeled molecular Rayleigh scattering. It has been used to detect weak scattering signals such as SVA. Following the method used by Vernier et al. [21], we calculated the nighttime CALIOP 532-nm SR from the monthly backscatter data (Version 4) and MERRA-2 atmospheric data on a 4° × 8° latitude-longitude grid. A 3% depolarization ratio (DP) is used to screen the SR data for cloud-aerosol classification. However, with these thresholds, contamination of polar stratospheric clouds (PSCs) is still present in the SR data. In addition, the region within longitude [90°W, 45°E] and latitude [55°S, 5°N] is excluded in the monthly zonal mean, to minimize the noise induced by the South Atlantic Anomaly (SAA) as suggested in [21]. The processed SR data are further integrated over 5 km above the tropopause (TP), as shown in Figure 8e, to represent the majority of stratospheric column of SVA.
The OMPS-LP aerosol extinction in Figure 8f is produced from the Version 1.5 algorithm [52]. The OMPS-LP instrument onboard Suomi National Polar-orbiting Partnership (Suomi NPP) images Earth’s limb between 0 and 80 km altitude at the aft view along the flight path, and employs three vertical slits separated horizontally in the 290–1000 nm wavelength range. The instrument measures limb scattering radiance and solar irradiance with near-global coverage in 3–4 days. It is installed at a fixed orientation relative to the spacecraft, which flies in a sun-synchronous ascending orbit with 1:30 PM equator crossing time. As a result, the observed solar scattering angle varies along the orbit, where the NH (SH) observations correspond to forward (back)-scattered solar radiation. In other words, the aerosol forward-scattering signal is much larger in the NH than the SH. As a result, the aerosol phase function magnitude varies by a factor of 50 over the course of OMPS orbit, and contributes largely to the aerosol extinction retrieval error [53]. Limb scattering retrievals require complex forward model calculations, and the aerosol retrieval in particular requires assuming aerosol size parameters. The current OMPS-LP algorithm uses the radiance measurements at a single wavelength (675 nm) to estimate the aerosol extinction coefficient profile. To improve the retrievals of large SVA values, the algorithm relaxed convergence criteria. As a result, the systematic seasonal variation in the SH could be a retrieval error from the loose convergence criteria.
CALIOP SR observations show how the aerosols from major volcanic eruptions spread to high latitudes (Figure 8e). The Kasatochi (52.2°N) and Sarychev (48.1°N) eruptions were located near the jetstream, allowing SO2 and sulfate aerosols to be advected rapidly to middle and high latitudes [23,38,45]. Although the Nabro (13.4°N) volcano erupted in the subtropics, its plumes entered and spread over the NH high-latitude stratosphere within a month of the eruption, causing a significant sAOD increase in the NH. The anticyclonic circulation above the Tibetan Plateau played a critical role in spreading Nabro SO2 from the subtropics to the mid-latitudes, and further to the entire NH [54].
The Calbuco (42.3°S) eruption in April 2015 produced two branches of SVAs: One going poleward and the other entering the tropical UTLS (till early 2016). The amplitude of the poleward branch grew with time as seen in CALIOP SR and OMPS-LP data. MISR is sensitive only to the poleward branch within ~3 months of the eruption, whereas the enhancement of OMPS-LP aerosol extinction seems to last beyond 2016. The Calbuco eruption appears to have an extended effect at high latitudes for two consecutive austral winters (2016 and 2017), as indicated by the MISR radiance anisotropy anomaly and CALIOP SR data. There is a hint of enhanced SVA from the Cordon-Caulle (40.6°S) eruption, showing an elevated SR extended to mid-latitudes where PSCs are rarely found.
The anomalies of MISR blue-band DF-DA radiance appear to match these post-eruption polar SR enhancements very well, suggesting a significant global impact of the high-injection volcanic eruptions. The DF-DA scattering anisotropy is also observed in other MISR spectral bands. The ratios of anisotropy amplitude with respect to the blue-band radiance are typically 0.77, 0.60, and 0.34 for green, red and NIR, respectively. A large part of the decreasing ratio with wavelength is due to the color ratios of MISR radiances with respect to blue-band, which are 0.89, 0.73, and 0.49 for green, red and NIR, respectively.
To locate where the SVA-induced anisotropy occurs, we map out the DF-DA enhancement after the Sarychev (June 2009) eruption over the Arctic, to compare the August anisotropy in the eruption year (2009) with the normal year (2011). As shown in Figure 9, the DF-DA enhancements in August 2009 occur mostly over the Arctic Ocean and in part of Alaska, Siberia and East Greenland. Despite the striping effects from MISR insufficient sampling, it is evident that the anisotropic scattering in August 2009 is generally larger than that in 2011 over the Arctic. The sampling error is greatly reduced in the zonal mean average (Figure 8), because most of the oscillatory strips are cancelled out in the zonally-averaged DF-DA differences.
The SVA-induced radiance anomaly is only significant in MISR’s anisotropy measurements, not in its single-view radiances, nor in the MISR/CERES albedo and the MISR/MODIS cloud fraction measurements, even though the latter are derived for the same time period. A key difference is perhaps the viewing angles from which these measurements were derived. As shown in Figure 10, the deseasonalized MISR CF and AN radiance time series are overwhelmed by tropospheric/surface variabilities. Using the technique as illustrated in Figure 8, we are able to extract the SVA-induced enhancements in CF-CA (not shown). As expected for the scattering angle differences, the DF-DA anisotropy has the largest amplitude of SVA signals, but these signals are still detectable with the CF-CA, CF-AN, and DF-AN anisotropy. On the other hand, it is difficult to detect SVA-induced enhancements from the MISR’s AN or AF-AN time series. Similar to the MISR AN time series seen in Figure 10, MODIS cloud fraction and CERES albedo measurements are dominated by tropospheric and surface variations, as these products are derived primarily from single-view cross-track sampling. Hence, we did not find any significant SVA-induced enhancements in these measurements.
4. Discussion
4.1. Effects of Volcanic Injection Height
Unlike the satellite measurements derived from single-view observations, the MISR anisotropic scattering radiances provide new information on SVAs and aerosol direct and indirect effects on global radiation. By differencing the MISR monthly mean radiances at forward and backward scattering angles (e.g., DF-DA) and de-seasonalizing the time series of the radiance anisotropy, we are able to extract the SVA-induced anomalies at high latitudes. Simultaneous multi-angle measurements are critical for extracting such anisotropic scattering, because they are less prone to the contaminations from sampling errors and large variability associated with surface and clouds.
The anomaly in MISR radiance anisotropy is a collective effect of aerosol and cloud scattering. The lack of the response to volcanic eruptions with a low injection height suggests that MISR radiance anisotropy is sensitive to the aerosol direct or indirect effects induced at the UTLS altitudes. For example, the Iceland Eyjafjallajokull (April–May 2010) had an accumulated 0.5 Tg SO2 release between 3 and 8 km altitude over a period of two months. Yet, its effect on MISR radiances was not as significant as other eruptions with higher injection heights and comparable SO2 releases (e.g., the Cordon-Caulle eruption). Eruptions with higher injection tend to come from stronger explosions and produce large amounts of sulfate aerosols with longer-lasting effects on the atmosphere.
4.2. Implication for Shortwave Radiation
We investigated the aerosol particle size required to reproduce the observed enhancements in monthly-mean DF-DA reflectance (5–15%) from volcanic eruptions. For the 24 June 2009 event over the Beaufort Sea, we simulated MISR blue-band radiance anomaly as a function of mid-visible AOD and particle size, using the same viewing and solar geometry but for a range of assumed surface albedos (Figure 11). The retrieved AOD for this event ranged from 0.2–0.5. (The scattering angles observed by the DF and DA cameras are about 66° and 147°, respectively. The diffraction peaks for the aerosol particles end below 20° scattering angle). We use the radiative transfer code of the MISR RA retrieval algorithm [39] for this calculation, and adopt spherical, non-light-absorbing sulfate-analog particles with effective radii ranging from 0.06 to 1.28 microns. For a representative AOD of 0.35, only the spherical, non-absorbing sulfate optical analog with effective radius of about 0.12 microns, or between 0.06 and 0.12 microns, reproduce the reflectance anomaly of 5–15%. The percentage of anisotropy anomaly reduces proportionally as the background surface albedo increases. Note that this size range, obtained from the multi-angle, blue-band simulation, is consistent with the Angstrom Exponent derived for this case from the multi-spectral, multi-angle Research retrieval shown in Figure 6. We obtained the same result for the 4 July 2009 Beaufort Sea event (not shown).
On the other hand, clouds can also produce radiance anisotropy due to their large asymmetric scattering phase functions, and as such, might also contribute to the deseasonalized anisotropy time series. Cloud fraction and microphysical properties would have to change due to volcanic aerosol impacts (i.e., indirect effects). Thus, the observed radiance anisotropy anomalies after volcanic eruptions might include indirect effects (SVA-induced cloud scattering) in addition to the direct effects (volcanic aerosol scattering). Although SVAs are capable of producing indirect effects, such as enhanced cirrus, model assumptions and observation limitations have caused controversy in connecting cirrus enhancements due to volcanic aerosols [6,55,56,57,58]. However, volcanic aerosol indirect effects on low-level liquid clouds seem to be robust, based on a number of case studies [59,60]. MISR multi-angle measurements provide new information on this problem. The enhanced and delayed forward scattering in the MISR radiances following major volcanic eruptions appears to be consistent with indirect effects on cirrus, induced by SVAs. The effects appear to be global-scale and exhibit a strong forward-to-backward scattering ratio, which exceeds what aerosols alone can generate.
The enhanced scattering anisotropy is observed only in MISR’s forward-scattering radiance differences. In addition to the DF-DA radiance differences shown in Figure 8, the anisotropy enhancements are found in other pairs involved forward-scattering such as DF-AN in the NH and DA-AN in the SH. However, no significant SVA-induced anomalies appear in DF-AN in the SH and DA-AN in the NH, because backscattering does not exhibit the SVA-induced scattering anomaly with respect to the nadir view. In other words, the forward scattering carries most of the SVA-induced radiance anomaly. This creates a new challenge for accurate evaluation of the shortwave radiation induced by volcanic eruptions, because one must pay special attention to the reflected sunlight in forward scattering. As most satellite sensors do not measure forward scattering, it is perhaps the root cause of the difficulty in detecting SVA-induced indirect effects and the resulting controversy (e.g., Figure 10).
4.3. Roles of Stratospheric Water and Transport
Water vapor can impact aerosols and their optical properties directly through particle hydration and dehydration and can induce indirect chemical effects related to sulfate aerosol formation in the UTLS. Absorption and evaporation of water result in aerosol size variations, affecting aerosol visibility and AOD as observed by spaceborne sensors [61,62]. Such water-modulated SVA visibility is illustrated in Figure 12, which shows that aerosol extinction introduced into the UTLS tends to grow longer and stronger in water-rich regions and seasons. In addition, the large-scale Brewer-Dobson circulation and isentropic mixing help spread SVAs globally. As a result, the visibility of these SVA events to satellite sensors such as CALIOP and OMPS-LP is enhanced by aerosol growth and coagulation processes during dynamical transport. For MISR scattering anisotropy, it is necessary for SVAs to grow sufficiently large in size to generate a detectable signal, as seen in Figure 6. On the other hand, the aerosol sedimentation process involving clouds amounts to an indirect effect. If MISR-observed scattering anisotropy were largely by this indirect effect, it would imply subsequent aerosol sedimentation. Aerosols that survive sedimentation may evaporate and stay in the stratosphere longer, till the next water-rich cycle, and grow again from water absorption. This prolonged SVA impact might have contributed to the MISR-observed anisotropy anomalies in 2015 and 2016 following the Calbuco (2015) eruption.
Lastly, stratified layer structures may provide valuable insights into aerosol formation, growth, and transport processes in different UTLS environments. Multiple sub-kilometer stratified aerosol layers are often observed in the polar UTLS after strong volcanic eruptions, but multiple layers are rare at low and mid latitudes (Figure 13). Both the tropical and polar stratospheres show that SVAs can be advected long distances from their sources. The sub-kilometer multi-layer structures in the summertime Arctic suggest that poleward transport is highly stratified, with relatively weaker mixing/diffusion across isentropic surfaces than those thicker layers at the low-and-mid latitudes. Generally, compared to the tropical eruptions, high-latitude volcanic events tend to have shorter aerosol lifetimes, varying from 2 months in winter to 4 months in summer [63]. The UTLS water vapor and dynamics are believed to play a critical role in determining SVA lifetime and visibility.
5. Conclusions
We presented both case studies and a climatology of SVA-induced anomalies in MISR radiance measurements. Retrievals from a scene over the Arctic Ocean on 24 June 2009 yield AOD of 0.2–0.5, identified using the MISR Research Aerosol retrieval algorithm as small-medium, weakly to non-absorbing, mostly spherical particles.
The anisotropy in MISR monthly radiances (e.g., DF-DA difference) was significantly perturbed by SVAs from the Kasatochi (August 2008), Sarychev (June 2009), Nabro (June 2011) and Calbuco (April 2015) eruptions. These anomalous radiances were produced mostly by the forward scattering of reflected sunlight, representing 5–15% of the mean radiance at high latitudes. The radiance anisotropy enhancements are consistent with the poleward transported SVAs seen by CALIOP and OMPS-LP.
The anomalous anisotropy of MISR radiances is likely a collective effect of aerosol and cloud scattering from the UTLS region. In the case of the Sarychev eruption, the enhanced anisotropy was widespread across the Arctic, covering most of the Arctic Ocean. Our simulations showed that the amplitude of the calculated anisotropy based on aerosol retrieved with the MISR Research algorithm, likely of volcanic origin, can explain the observed anisotropy for several cases studied. Clouds can also produce large anomalous radiance anisotropy through small changes in cloud fractions and microphysical properties from volcanic aerosol impacts (i.e., indirect effects). As such, an SVA-induced cloud fraction anomaly, i.e., an aerosol indirect effect, could contribute to the observed anomalies in radiance anisotropy. The enhanced global forward scattering by SVAs has important implications for the shortwave radiation budget, as the radiative effect of volcanic eruptions still needs to be better quantified.
Author Contributions
Conceptualization, D.L.W. and T.V.; methodology, D.L.W.; software, J.A.L., T.V.; validation, T.W., J.A.L., R.A.K., G.T., J.N.L., J.G. and T.Y.; formal analysis, T.W., T.V.; investigation, T.V.; resources, D.L.W.; data curation, T.W.; writing—original draft preparation, D.L.W.; writing—review and editing, T.W., T.V., J.A.L., R.A.K. and G.T.; visualization, T.W.; supervision, D.L.W.; project administration, D.L.W.; funding acquisition, D.L.W.
Funding
This research was funded by NASA Terra/MISR and Aura Science Teams.
Acknowledgments
The MISR and CALIOP data were obtained from the NASA Langley Research Center Atmospheric Science Data Center. We thank Valentina Aquila for providing volcano data and Jean-Paul Vernier for advising CALIOP SR calculations. D.L.W. thanks David Liu of SSAI for providing the MERRA2 wind data.
Conflicts of Interest
The authors declare no conflict of interest.
References
- Hansen, J.; Lacis, A.; Ruedy, R.; Sato, M. Potential climate impact of Mount Pinatubo eruption. Geophys. Res. Lett. 1992, 19, 215–218. [Google Scholar] [CrossRef]
- Robock, A.; Mao, J. The volcanic signal in surface temperature observations. J. Clim. 1995, 8, 1086–1103. [Google Scholar] [CrossRef]
- Minnis, P.; Harrison, E.F.; Stowe, L.L.; Gibson, G.G.; Denn, F.M.; Doelling, D.R.; Smith, W.L., Jr. Radiative climate forcing by the Mount Pinatubo eruption. Science 1993, 259, 1411–1415. [Google Scholar] [CrossRef] [PubMed]
- Solomon, S.; Daniel, J.S.; Neely, R.R., III; Vernier, J.P.; Dutton, E.G.; Thomason, L.W. The persistently variable “background” stratospheric aerosol layer and global climate change. Science 2011, 333, 866–870. [Google Scholar] [CrossRef] [PubMed]
- Lohmann, U.; Karcher, B.; Timmreck, C. Impact of the Mount Pinatubo eruption on cirrus clouds formed by homogeneous freezing in the ECHAM4 GCM. J. Geophys. Res. 2003, 108, 4568. [Google Scholar] [CrossRef]
- Campbell, J.R.; Welton, E.J.; Krotkov, N.A.; Yang, K.; Stewart, S.A.; Fromm, M.D. Likely seeding of cirrus clouds by stratospheric Kasatochi volcanic aerosol particles near a mid-latitude tropopause fold. Atmos. Environ. 2012, 46, 441–448. [Google Scholar] [CrossRef]
- Solomon, S.; Sanders, R.W.; Garcia, R.R.; Keys, J.G. Enhanced chlorine dioxide and ozone depletion in Antarctica due to volcanic aerosols. Nature 1993, 363, 245–248. [Google Scholar] [CrossRef]
- Thomason, L.W. A diagnostic stratospheric aerosol size distribution inferred from SAGE II measurements. J. Geophys. Res. 1991, 96, 22501–22508. [Google Scholar] [CrossRef]
- Lumpe, J.D.; Bevilacqua, R.M.; Hoppel, K.W.; Krigman, S.S.; Kriebel, D.L.; Debrestian, D.J.; Randall, C.E.; Rusch, D.W.; Brogniez, C.; Ramananahérisoa, R.; et al. POAM II retrieval algorithm and error analysis. J. Geophys. Res. 1997, 102, 23593–23614. [Google Scholar] [CrossRef] [Green Version]
- Burton, S.P.; Thomason, L.W.; Sasano, Y.; Hayashida, S. Comparison of Aerosol Extinction Measurements by ILAS and SAGE II. Geophys. Res. Lett. 1999, 26, 1719–1722. [Google Scholar] [CrossRef]
- Thomason, L.W. Toward a combined SAGE II-HALOE aerosol climatology: An evaluation of HALOE version 19 stratospheric aerosol extinction coefficient observations. Atmos. Chem. Phys. 2012, 12, 8177–8188. [Google Scholar] [CrossRef] [Green Version]
- Vanhellemont, F.; Fussen, D.; Mateshvili, N.; Tétard, C.; Bingen, C.; Dekemper, E.; Loodts, N.; Kyrölä, E.; Sofieva, V.; Tamminen, J.; et al. Optical extinction by upper tropospheric/stratospheric aerosols and clouds: GOMOS observations for the period 2002–2008. Atmos. Chem. Phys. 2010, 10, 7997–8009. [Google Scholar] [CrossRef] [Green Version]
- Bourassa, A.E.; Degenstein, D.A.; Gattinger, R.L.; Llewellyn, E.J. Stratospheric aerosol retrieval with optical spectrograph and infrared imaging system limb scatter measurements. J. Geophys. Res. 2007, 112, D10217. [Google Scholar] [CrossRef]
- Ovigneur, B.; Landgraf, J.; Snel, R.; Aben, I. Retrieval of stratospheric aerosol density profiles from SCIAMACHY limb radiance measurements in the O2 A-band. Atmos. Meas. Tech. 2011, 4, 2359–2373. [Google Scholar] [CrossRef]
- Taha, G.; Rault, D.F.; Loughman, R.P.; Bourassa, A.E.; Savigny, C.V. SCIAMACHY stratospheric aerosol extinction profile retrieval using the OMPS/LP algorithm. Atmos. Meas. Tech. 2011, 4, 547–556. [Google Scholar] [CrossRef] [Green Version]
- Von Savigny, C.; Ernst, F.; Rozanov, A.; Hommel, R.; Eichmann, K.-U.; Rozanov, V.; Burrows, J.P.; Thomason, L.W. Improved stratospheric aerosol extinction profiles from sciamachy: Validation and sample results. Atmos. Meas. Tech. Discuss. 2015, 8, 8353–8383. [Google Scholar] [CrossRef]
- Lambert, A.L.; Grainger, R.G.; Remedios, J.J.; Rodgers, C.D.; Corney, M.A.; Taylor, F.W. Measurements of the evolution of the Mount Pinatubo aerosol clouds by ISAMS. Geophys. Res. Lett. 1993, 20, 1287–1290. [Google Scholar] [CrossRef]
- Massie, S.T.; Gille, J.C.; Edwards, D.P.; Bailey, P.L.; Lyjak, L.V.; Craig, C.A.; Cavanaugh, C.P.; Mergenthaler, J.L.; Roche, A.E.; Kumer, J.B.; et al. Validation studies using multiwavelength Cryogenic Limb Array Etalon Spectrometer (CLAES) observations of stratospheric aerosols. J. Geophys. Res. 1996, 101, 9757–9773. [Google Scholar] [CrossRef]
- Thomason, L.W.; Ernest, N.; Millán, L.; Rieger, L.; Bourassa, A.; Vernier, J.P.; Manney, G.; Luo, B.; Arfeuille, F.; Peter, T. A global space-based stratospheric aerosol climatology: 1979–2016. Earth Syst. Sci. Data 2018, 10, 469–492. [Google Scholar] [CrossRef] [Green Version]
- Osborn, M.T.; Kent, G.S.; Trepte, C.R. Stratospheric aerosol measurements by the Lidar in Space Technology Experiment. J. Geophys. Res. 1998, 103, 11447–11453. [Google Scholar] [CrossRef] [Green Version]
- Vernier, J.P.; Pommereau, J.P.; Garnier, A.; Pelon, J.; Larsen, N.; Nielsen, J.; Christensen, T.; Cairo, F.; Thomason, L.W.; Leblanc, T.; et al. Tropical stratospheric aerosol layer from CALIPSO lidar observations. J. Geophys. Res. 2009, 114, D00H10. [Google Scholar] [CrossRef]
- Vernier, J.P.; Fairlie, T.D.; Deshler, T.; Natarajan, M.; Knepp, T.; Foster, K.; Wienhold, F.G.; Bedka, K.M.; Thomason, L.; Trepte, C. In situ and space-based observations of the Kelud volcanic plume: The persistence of ash in the lower stratosphere. J. Geophys. Res. Atmos. 2016, 121, 11104–11118. [Google Scholar] [CrossRef] [PubMed]
- O’Neill, N.T.; Perro, C.; Saha, A.; Lesins, G.; Duck, T.J.; Eloranta, E.W.; Nott, G.J.; Hoffman, A.; Karumudi, M.L.; Ritter, C.; et al. Properties of Sarychev sulphate aerosols over the Arctic. J. Geophys. Res. 2012, 117, D04203. [Google Scholar] [CrossRef]
- Clarisse, L.; Prata, F. Chapter 11—Infrared Sounding of Volcanic Ash. In Volcanic Ash; Mackie, S., Cashman, K., Ricketts, H., Rust, A., Watson, M., Eds.; Elsevier: Amsterdam, The Netherlands, 2016; pp. 189–215. ISBN 9780081004050. [Google Scholar]
- Carn, S.A.; Krotkov, N.A. Chapter 12—Ultraviolet Satellite Measurements of Volcanic Ash. In Volcanic Ash; Mackie, S., Cashman, K., Ricketts, H., Rust, A., Watson, M., Eds.; Elsevier: Amsterdam, The Netherlands, 2016; pp. 217–231. ISBN 9780081004050. [Google Scholar]
- Guermazi, H.; Sellitto, P.; Serbaji, M.M.; Legras, B.; Rekhiss, F. Assessment of the Combined Sensitivity of Nadir TIR Satellite Observations to Volcanic SO2 and Sulphate Aerosols after a Moderate Stratospheric Eruption. Geosciences 2017, 7, 84. [Google Scholar] [CrossRef]
- Scollo, S.; Kahn, R.A.; Nelson, D.L.; Coltelli, M.; Diner, D.J.; Garay, M.J.; Realmuto, V.J. MISR observations of Etna volcanic plumes. J. Geophys. Res. 2012, 117, D06210. [Google Scholar] [CrossRef]
- Flower, V.J.; Kahn, R.A. Karymsky volcano eruptive plume properties based on MISR multi-angle imagery and the volcanological implications. Atmos. Chem. Phys. 2018, 18, 3903–3918. [Google Scholar] [CrossRef] [PubMed] [Green Version]
- Diner, D.J.; Beckert, J.C.; Reilly, T.H.; Bruegge, C.J.; Conel, J.E.; Kahn, R.A.; Martonchik, J.V.; Ackerman, T.P.; Davies, R.; Gerstl, S.A.; et al. Multi-angle Imaging SpectroRadiometer (MISR) instrument description and experiment overview. IEEE Trans. Geosci. Remote Sens. 1998, 36, 1072–1087. [Google Scholar] [CrossRef]
- Davies, R.; Jovanovic, V.M.; Moroney, C.M. Cloud heights measured by MISR from 2000 to 2015. J. Geophys. Res. Atmos. 2017, 122, 3975–3986. [Google Scholar] [CrossRef]
- Winker, D.M.; Vaughan, M.A.; Omar, A.; Hu, Y.; Powell, K.A.; Liu, Z.; Hunt, W.H.; Young, S.A. Overview of the CALIPSO mission and CALIOP data processing algorithms. J. Atmos. Oceanic Technol. 2009, 26, 2310–2323. [Google Scholar] [CrossRef]
- Jaross, G.; Bhartia, P.K.; Chen, G.; Kowitt, M.; Haken, M.; Chen, Z.; Xu, P.; Warner, J.; Kelly, T. OMPS Limb Profiler instrument performance assessment. J. Geophys. Res. Atmos. 2014, 119. [Google Scholar] [CrossRef]
- Levy, R.C.; Mattoo, S.; Munchak, L.A.; Remer, L.A.; Sayer, A.M.; Patadia, F.; Hsu, N.C. The Collection 6 MODIS aerosol products over land and ocean. Atmos. Meas. Tech. 2013, 6, 2989–3034. [Google Scholar] [CrossRef] [Green Version]
- Gelaro, R.; McCarty, W.; Suárez, M.J.; Todling, R.; Molod, A.; Takacs, L.; Randles, C.A.; Darmenov, A.; Bosilovich, M.G.; Reichle, R.; et al. The modern-era retrospective analysis for research and applications, version 2 (MERRA-2). J. Clim. 2017, 30, 5419–5454. [Google Scholar] [CrossRef]
- Haywood, J.M.; Jones, A.; Clarisse, L.; Bourassa, A.; Barnes, J.; Telford, P.; Bellouin, N.; Boucher, O.; Agnew, P.; Clerbaux, C.; et al. Observations of the eruption of the Sarychev volcano and simulations using the HadGEM2 climate model. J. Geophys. Res. 2010, 115, D21212. [Google Scholar] [CrossRef]
- Nelson, D.L.; Garay, M.J.; Kahn, R.A.; Dunst, B.A. Stereoscopic Height and Wind Retrievals for Aerosol Plumes with the MISR INteractive eXplorer (MINX). Remote Sens. 2013, 5, 4593–4628. [Google Scholar] [CrossRef] [Green Version]
- Carn, S.A.; Lopez, T.M. Opportunistic validation of sulfur dioxide in the Sarychev Peak volcanic eruption cloud. Atmos. Meas. Tech. 2011, 4, 1705–1712. [Google Scholar] [CrossRef] [Green Version]
- Jégou, F.; Berthet, G.; Brogniez, C.; Renard, J.B.; François, P.; Haywood, J.M.; Jones, A.; Bourgeois, Q.; Lurton, T.; Auriol, F.; et al. Stratospheric aerosols from the Sarychev volcano eruption in the 2009 Arctic summer. Atmos. Chem. Phys. 2013, 13, 6533–6552. [Google Scholar] [CrossRef] [Green Version]
- Limbacher, J.A.; Kahn, R.A. Updated MISR dark water research aerosol retrieval algorithm—Part 1: Coupled 1.1 km ocean surface chlorophyll a retrievals with empirical calibration corrections. Atmos. Meas. Tech. 2017, 10, 1539–1555. [Google Scholar] [CrossRef]
- Limbacher, J.A.; Kahn, R.A. MISR empirical stray light corrections in high-contrast scenes. Atmos. Meas. Tech. 2015, 8, 2927–2943. [Google Scholar] [CrossRef] [Green Version]
- Loeb, N.G.; Davies, R. Angular dependence of observed reflectances: A comparison with plane parallel theory. J. Geophys. Res. 1997, 102, 6865–6881. [Google Scholar] [CrossRef] [Green Version]
- Várnai, T.; Marshak, A. View angle dependence of cloud optical thicknesses retrieved by Moderate Resolution Imaging Spectroradiometer (MODIS). J. Geophys. Res. 2007, 112, D06203. [Google Scholar] [CrossRef]
- Yang, K.; Liu, X.; Krotkov, N.A.; Krueger, A.J.; Carn, S.A. Estimating the altitude of volcanic sulfur dioxide plumes from space-borne hyper-spectral UV measurements. Geophys. Res. Lett. 2009, 36, L10803. [Google Scholar] [CrossRef]
- Carn, S.A.; Clarisse, L.; Prata, A.J. Multi-decadal satellite measurements of global volcanic degassing. J. Volcanol. Geotherm. Res. 2016, 311, 99–134. [Google Scholar] [CrossRef]
- Bourassa, A.E.; Degenstein, D.A.; Elash, B.J.; Llewellyn, E.J. Evolution of the stratospheric aerosol enhancement following the eruptions of Okmok and Kasatochi: Odin-OSIRIS measurements. J. Geophys. Res. 2010, 115, D00L03. [Google Scholar] [CrossRef]
- Khaykin, S.M.; Godin-Beekmann, S.; Keckhut, P.; Hauchecorne, A.; Jumelet, J.; Vernier, J.P.; Bourassa, A.; Degenstein, D.A.; Rieger, L.A.; Bingen, C.; et al. Variability and evolution of the midlatitude stratospheric aerosol budget from 22 years of ground-based lidar and satellite observations. Atmos. Chem. Phys. 2017, 17, 1829–1845. [Google Scholar] [CrossRef] [Green Version]
- Clarisse, L.; Hurtmans, D.; Clerbaux, C.; Hadji-Lazaro, J.; Ngadi, Y.; Coheur, P.F. Retrieval of sulphur dioxide from the infrared atmospheric sounding interferometer (IASI). Atmos. Meas. Tech. 2012, 5, 581–594. [Google Scholar] [CrossRef] [Green Version]
- Noh, Y.M.; Shin, D.H.; Müller, D. Variation of the vertical distribution of Nabro volcano aerosol layers in the stratosphere observed by LIDAR. Atmos. Environ. 2017, 154, 1–8. [Google Scholar] [CrossRef]
- Bègue, N.; Vignelles, D.; Berthet, G.; Portafaix, T.; Payen, G.; Jégou, F.; Benchérif, H.; Jumelet, J.; Vernier, J.-P.; Lurton, T.; et al. Long-range transport of stratospheric aerosols in the Southern Hemisphere following the 2015 Calbuco eruption. Atmos. Chem. Phys. 2017, 17, 15019–15036. [Google Scholar] [CrossRef] [Green Version]
- Ivy, D.J.; Solomon, S.; Kinnison, D.; Mills, M.J.; Schmidt, A.; Neely, R.R. The influence of the Calbuco eruption on the 2015 Antarctic ozone hole in a fully coupled chemistry-climate model. Geophys. Res. Lett. 2017, 44, 2556–2561. [Google Scholar] [CrossRef]
- Koffman, B.G.; Dowd, E.G.; Osterberg, E.C.; Ferris, D.G.; Hartman, L.H.; Wheatley, S.D.; Kurbatov, A.V.; Wong, G.J.; Markle, B.R.; Dunbar, N.W.; et al. Rapid transport of ash and sulfate from the 2011 Puyehue-Cordón Caulle (Chile) eruption to West Antarctica. J. Geophys. Res. Atmos. 2017, 122, 8908–8920. [Google Scholar] [CrossRef]
- Chen, Z.; Bhartia, P.K.; Loughman, R.; Colarco, P.; DeLand, M. Improvement of stratospheric aerosol extinction retrieval from OMPS/LP using a new aerosol model. Atmos. Meas. Tech. Discuss. 2018. [Google Scholar] [CrossRef]
- Loughman, R.; Bhartia, P.K.; Chen, Z.; Xu, P.; Nyaku, E.; Taha, G. The Ozone Mapping and Profiler Suite (OMPS) Limb Profiler (LP) Version 1 aerosol extinction retrieval algorithm: Theoretical basis. Atmos. Meas. Tech. 2018, 11, 2633–2651. [Google Scholar] [CrossRef]
- Sawamura, P.; Vernier, J.P.; Barnes, J.E.; Berkoff, T.A.; Welton, E.J.; Alados-Arboledas, L.; Navas-Guzmán, F.; Pappalardo, G.; Mona, L.; Madonna, F.; et al. Stratospheric AOD after the 2011 eruption of Nabro volcano measured by lidars over the Northern Hemisphere. Environ. Res. Lett. 2012, 7, 034013. [Google Scholar] [CrossRef] [Green Version]
- Jensen, E.J.; Toon, O.B. The potential effects of volcanic aerosols on cirrus cloud microphysics. Geophys. Res. Lett. 1992, 19, 1759–1762. [Google Scholar] [CrossRef]
- Wylie, D.P.; Menzel, W.P. Eight years of high cloud statistics using HIRS. J. Clim. 1999, 12, 170–184. [Google Scholar] [CrossRef]
- Luo, Z.; Rossow, W.B.; Inoue, T.; Stubenrauch, C.J. Did the eruption of the Mt. Pinatubo volcano affect cirrus properties? J. Clim. 2002, 15, 2806–2820. [Google Scholar] [CrossRef]
- Liu, X.; Penner, J.E. Effect of Mount Pinatubo H2SO4/H2O aerosol on ice nucleation in the upper troposphere using a global chemistry and transport model. J. Geophys. Res. 2002, 107, 4141. [Google Scholar] [CrossRef]
- Yuan, T.; Remer, L.A.; Yu, H. Microphysical, macrophysical and radiative signatures of volcanic aerosols in trade wind cumulus observed by the A-Train. Atmos. Chem. Phys. 2011, 11, 7119–7132. [Google Scholar] [CrossRef] [Green Version]
- McCoy, D.T.; Hartmann, D.L. Observations of a substantial cloud-aerosol indirect effect during the 2014–2015 Bárðarbunga-Veiðivötn fissure eruption in Iceland. Geophys. Res. Lett. 2015, 42, 10409–10414. [Google Scholar] [CrossRef]
- Stratosphere-Troposphere Processes and Their Role in Climate (SPARC). Assessment of Stratospheric Aerosol Properties (ASAP), WCRP-124, WMO/TD No. 1295, SPARC Rep. 4, 348p. 2006. Available online: http://citeseerx.ist.psu.edu/viewdoc/download?doi=10.1.1.465.2726&rep=rep1&type=pdf#page=9 (accessed on 22 November 2018).
- Kremser, S.; Thomason, L.W.; Hobe, M.; Hermann, M.; Deshler, T.; Timmreck, C.; Toohey, M.; Stenke, A.; Schwarz, J.P.; Weigel, R.; et al. Stratospheric aerosol—Observations, processes, and impact on climate. Rev. Geophys. 2016, 54, 278–335. [Google Scholar] [CrossRef]
- Robock, A.; Oman, L.; Stenchikov, G.L. Regional climate responses to geoengineering with tropical and Arctic SO2 injections. J. Geophys. Res. 2008, 113, D16101. [Google Scholar] [CrossRef]
Figure 1.
MISR viewing geometry at the NH high latitudes where the DF and DA views (70.5° from nadir) have relatively large forward and backward scattering angles.
Figure 1.
MISR viewing geometry at the NH high latitudes where the DF and DA views (70.5° from nadir) have relatively large forward and backward scattering angles.

Figure 2.
The Sarychev eruption captured by MISR (a) DA (70° aft), (b) AN (nadir), and (c) DF (70° forward) cameras on 16 June 2009 at UTC 00:53; and (d) in MERRA2 3-hourly zonal winds. Successive MERRA2 wind profiles are shifted by 5 m/s for illustration. The parallax of the ejecta (grey tower) is clearly seen in the three different angular views, shooting above the white cloud deck. Ash/Aerosol plumes are evident in the region above white clouds. MERRA2 zonal wind profiles near Sarychev show a large anomaly on June 16 at ~12 km. During 14–20 June, the zonal winds are westward in most of the troposphere and eastward in the UTLS.

Figure 3.
MINX stereo height (ASL) and wind retrievals at 2.2 km resolution for the 16 June plumes/clouds for the same domain shown in Figure 2. The ash tower reached ~10 km under a strong westward wind. The solid line is the MERRA2 zonal wind profile, showing sharp wind shear and reversal from westward to eastward.

Figure 4.
(a) MISR DF and (b) DA images over the Beaufort Sea at UTC 21:22:48 on 24 June 2009. Stratospheric aerosol layers make the DF image hazier than its symmetric DA image compared to the nadir view. (c) MINX stereo height retrievals, showing aerosol layer heights mostly at ~15 km. (d) MISR stratospheric aerosol plumes traced back to the Sarychev eruption on 15 June 2009 using dynamical fields from the ECMWF model (see text). (e) Descending air mass of the aerosol plumes during their transport from Sarychev to the Beaufort Sea, based on the ECMWF wind analysis.
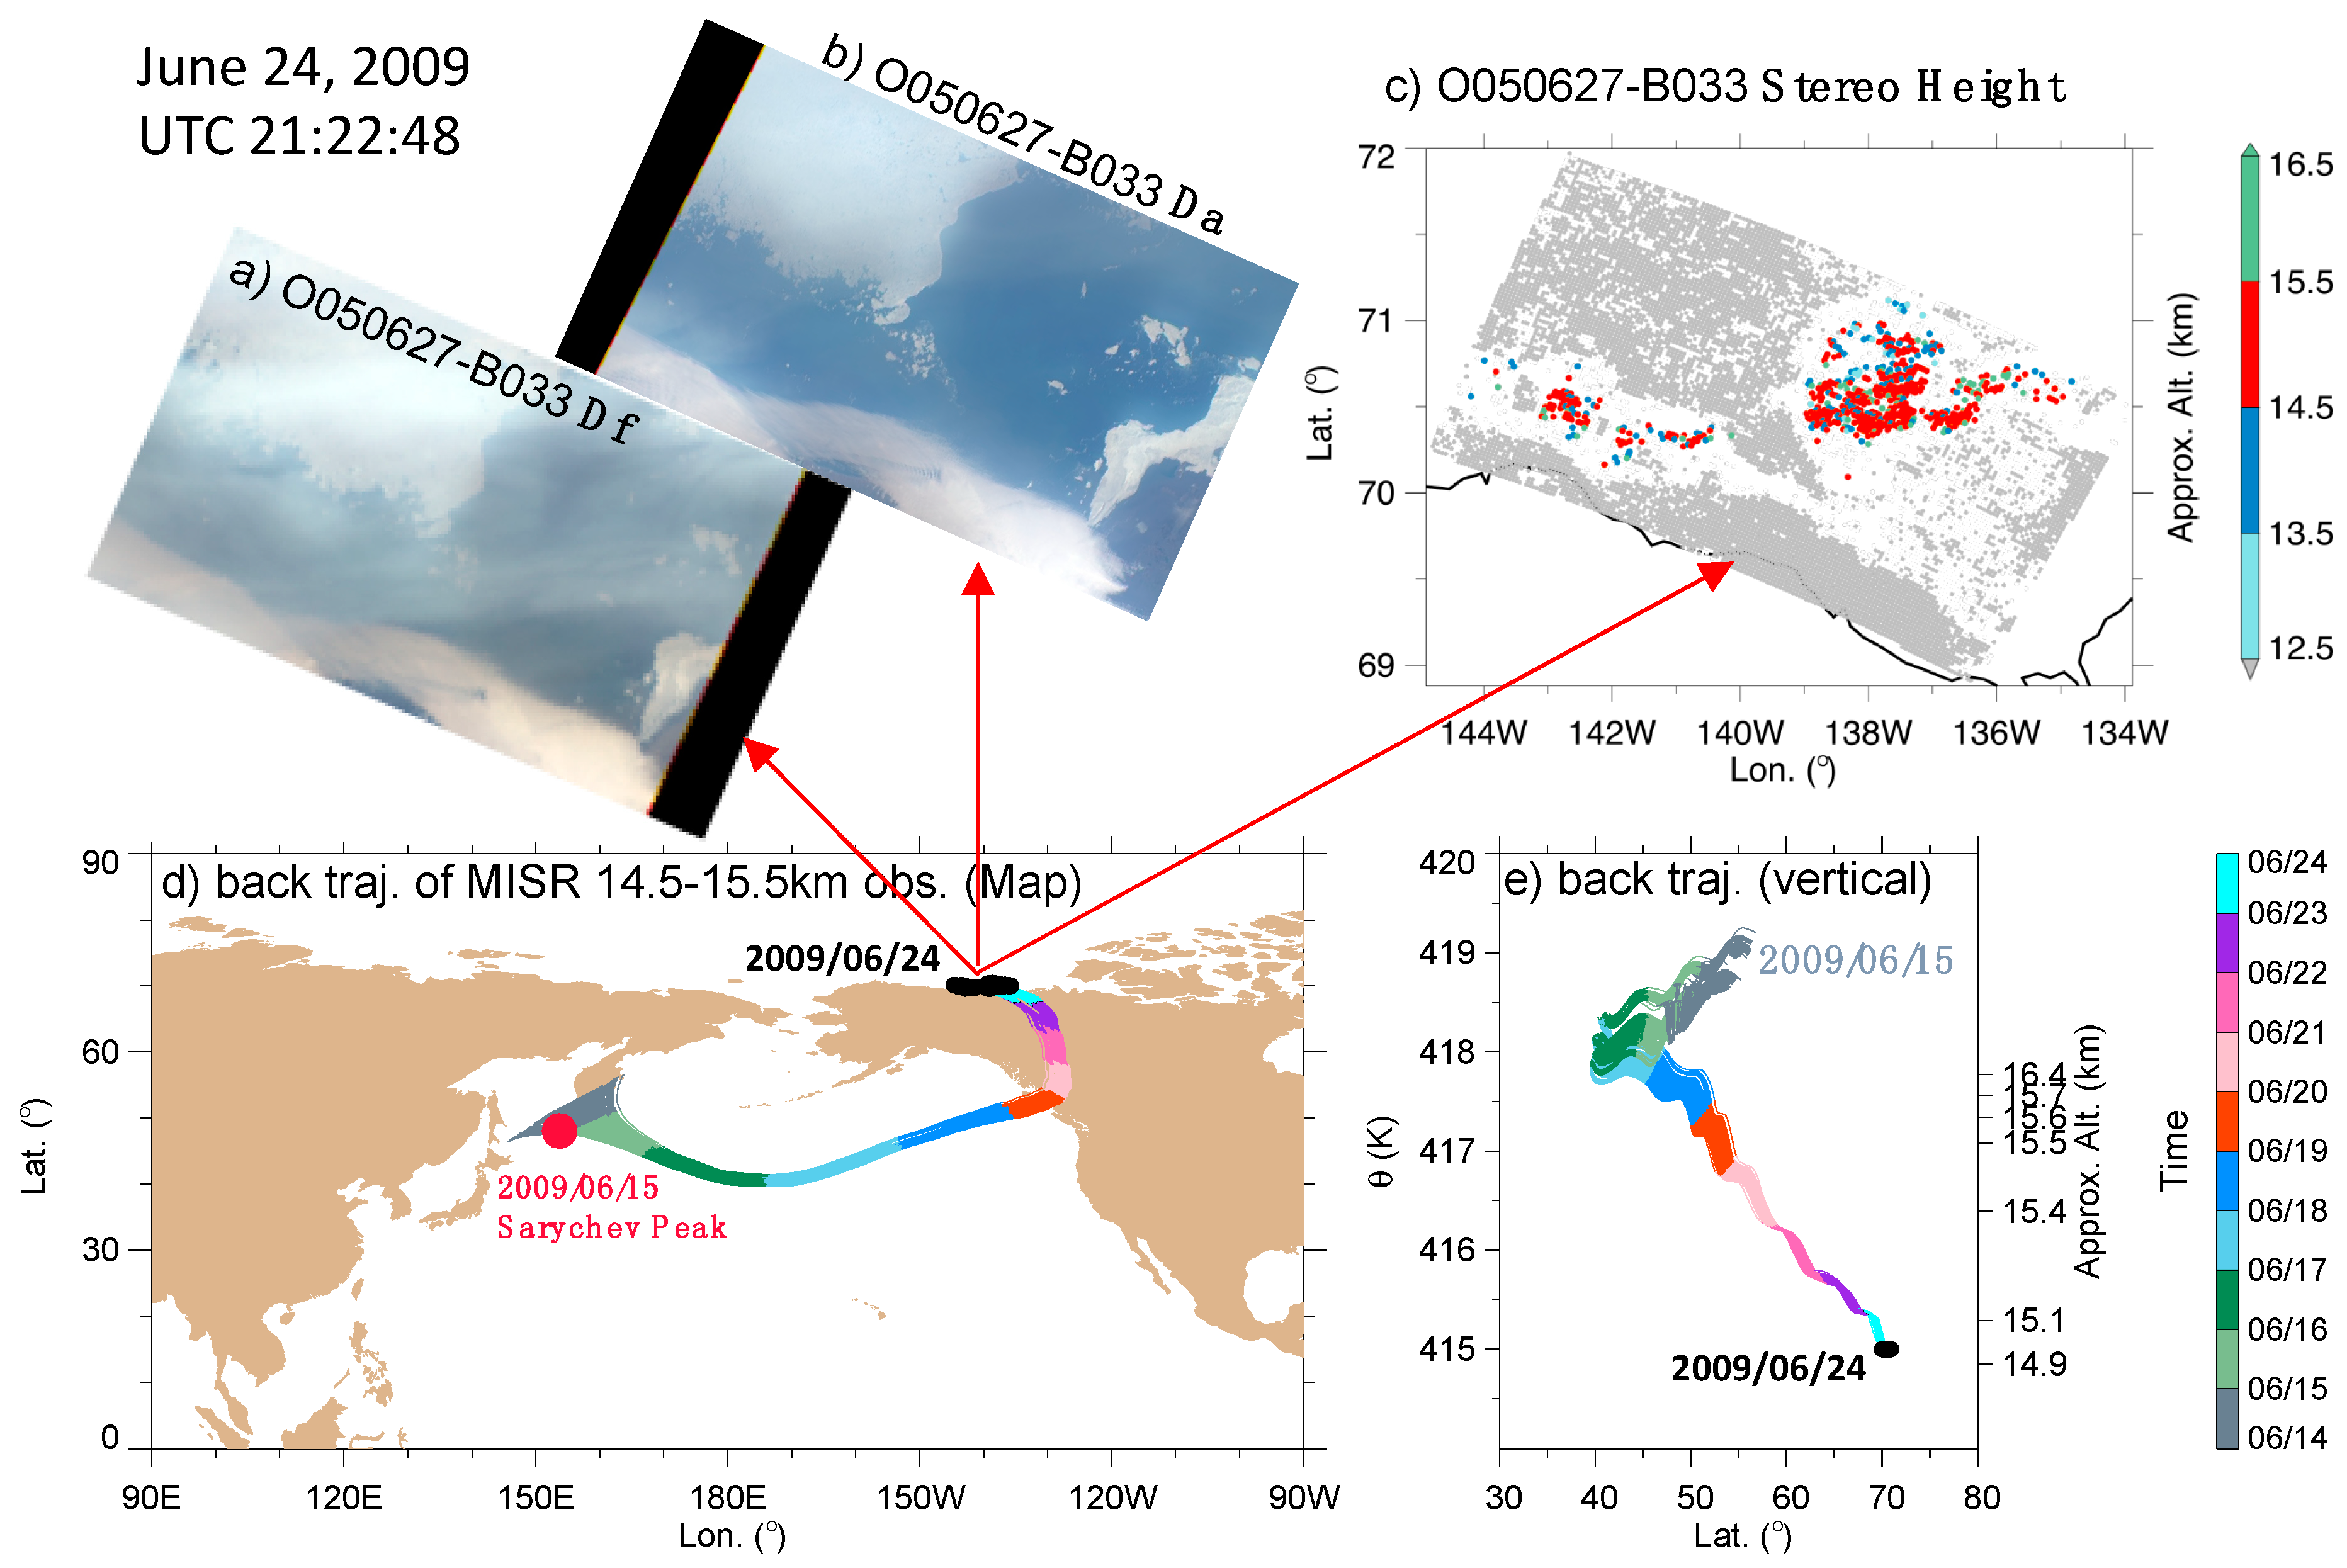
Figure 5.
(Top): CALIPSO lidar profiles acquired at UTC 21:35:15 on 24 June 2009, over the Beaufort Sea where a high (14–18 km) aerosol layer spans ~2000 km. This aerosol layer occurred in the vicinity of MISR-observed stratospheric aerosol plumes at approximately the same time. (Bottom): Hazy aerosol layers can be seen elsewhere over the Arctic in the MODIS image.

Figure 6.
Aerosol properties retrieved with the MISR research algorithm (RA) for cloud-free oceanic scenes in the Arctic on June 24 (top) and 4 July 2009 (bottom).
Figure 6.
Aerosol properties retrieved with the MISR research algorithm (RA) for cloud-free oceanic scenes in the Arctic on June 24 (top) and 4 July 2009 (bottom).

Figure 7.
MISR blue-band monthly radiance and radiance anisotropy for January, April, July, and October 2010. Radiances have units W/m2/nm/sr. The radiance anisotropy is calculated as the difference between each symmetric pair (e.g., DF-DA, CF-CA). A similar climatology is seen in other MISR spectral band radiances.

Figure 8.
Time series of MISR monthly radiances from the blue band (a) DF, (b) DF-DA, (c) de-seasonalized DF-DA radiance, (d) de-seasonalized DF-DA difference in %, (e) CALIPSO lidar SR integrated between tropopause (TP) and TP+5km, and (f) OMPS-LP v1.5 aerosol extinction between TP and TP+5km. Volcanic eruptions with injection height > 12 km and SO2 loading > 0.15 Tg are shown with symbols. MISR radiance units are W/m2/nm/sr.

Figure 9.
Distribution of MISR blue-band anisotropy anomaly in August 2009 after the Sarychev (June 2009) eruption. The August mean radiance anisotropy from 2010, 2012, and 2013 is used as the reference to highlight the anisotropy differences in the year with (2009) and without (2011) SVA impact. The MISR radiance and radiance difference units are W/m2/nm/sr. The striping in the maps is due to MISR sampling limitations.

Figure 10.
(a) MISR blue-band CF radiance, (b) deseasonalized CF radiance, (c) AN radiance, and (d) deseasonalized AN radiance. As in Figure 8, the MISR radiance and radiance difference units are W/m2/nm/sr.
Figure 10.
(a) MISR blue-band CF radiance, (b) deseasonalized CF radiance, (c) AN radiance, and (d) deseasonalized AN radiance. As in Figure 8, the MISR radiance and radiance difference units are W/m2/nm/sr.

Figure 11.
Simulated MISR blue-band anisotropy as a function of AOD558 and effective radius for the 24 June 2009 event over the Beaufort Sea (Figure 4) that originated from Sarychev volcano on 15 June. As constrained by MISR Research Algorithm retrievals (Figure 6 top), AOD is ~0.35 (0.2–0.5) and the particles are modeled as spherical, non-light-absorbing, sulfate analogs. The required particle size is larger than 0.6, which is consistent with the retrieved Angstrom exponent in Figure 4.
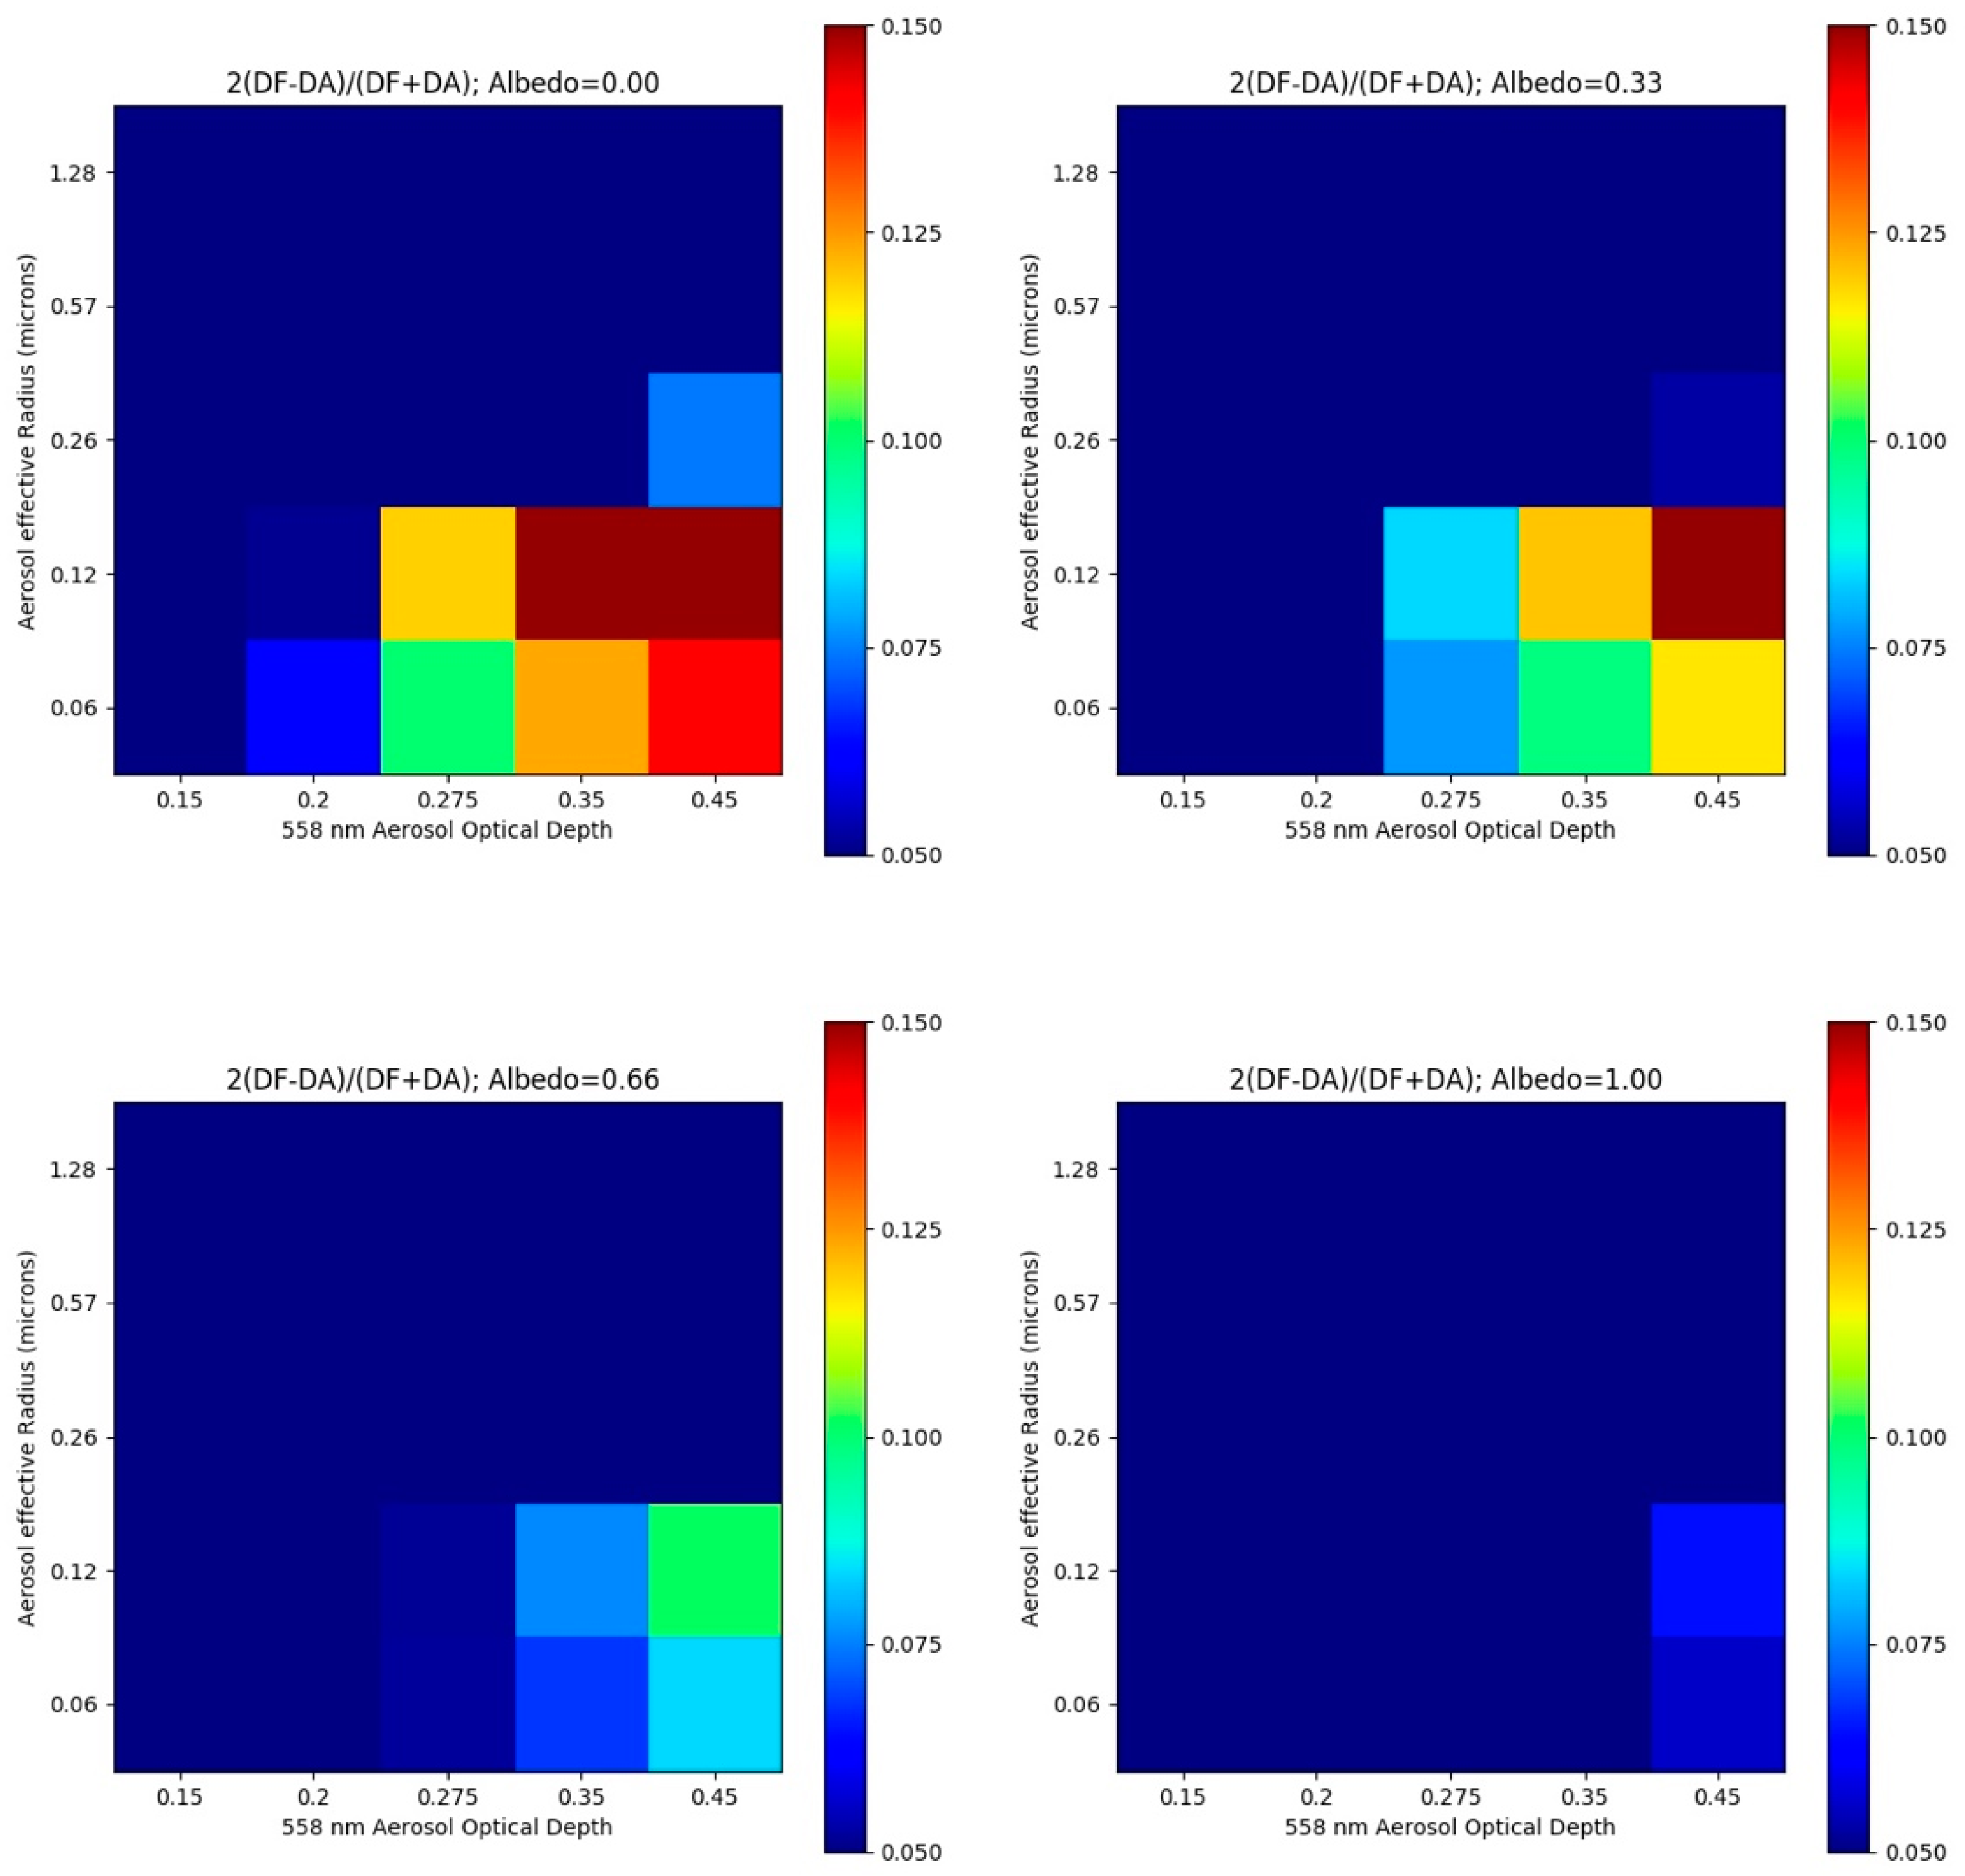
Figure 12.
Time series of MLS H2O and CALIOP SR for (a) the tropics (20°S–20°N) and (b) the layer between TP and TP+2km.
Figure 12.
Time series of MLS H2O and CALIOP SR for (a) the tropics (20°S–20°N) and (b) the layer between TP and TP+2km.

Figure 13.
(a) Multiple sub-km aerosol layers over the Arctic on 10 July 2009 after the Sarychev (June 2009) eruption; (b) Single 1–2 km aerosol layer at the low-to-mid latitudes on 11 July 2011 after the Nabro (June 2011) eruption.
Figure 13.
(a) Multiple sub-km aerosol layers over the Arctic on 10 July 2009 after the Sarychev (June 2009) eruption; (b) Single 1–2 km aerosol layer at the low-to-mid latitudes on 11 July 2011 after the Nabro (June 2011) eruption.


Table 1.
Volcano eruptions with significant SO2 injection into the stratosphere ‡.
| Volcano | Eruption | Location | Ht (km) | SO2 (Tg *) |
|---|---|---|---|---|
| Sierra_Negra (Si) | Oct 2005 | (0.8°S, 91.2°W) | 15 | 0.3 |
| Soufriere_Hills (So) | May 2006 | (16.7°N, 62.2°W) | 20 | 0.2 |
| Rabaul (Ra) | Oct 2006 | (4.3°S, 152.2°E) | 18 | 0.3 |
| Okmok (Ok) † | Jul 2008 | (53.4°N, 168.1°W) | 15 | 0.15 |
| Kasatochi (Ka) † | Aug 2008 | (52.2°N, 175.5°W) | 15 | 2.0 |
| Sarychev (Sa) † | Jun 2009 | (48.1°N, 153.2°E) | 17 | 1.2 |
| Merapi (Me) | Oct 2010 | (7.5°S, 110.4°E) | 17 | 0.3 |
| Grimsvotn (Gr) † | May 2011 | (64.4°N, 17.3°W) | 12 | 0.3 |
| Cordon_Caulle (Co) † | Jun 2011 | (40.6°S, 72.1°W) | 14 | 0.2 |
| Nabro (Na) | Jun 2011 | (13.4°N, 41.7°E) | 18 | 2.0 |
| Kelud (Ke) | Feb 2014 | (7.9°S, 112.3°W) | 19 | 0.2 |
| Calbuco (Ca) † | April 2015 | (42.3°S, 72.6°W) | 17 | 0.4 |
* Tg = one million metric tons; † High-latitude eruption; ‡ Volcano height and SO2 data are from NASA Goddard Earth Sciences (GES) Data and Information Services Center (DISC)
© 2018 by the authors. Licensee MDPI, Basel, Switzerland. This article is an open access article distributed under the terms and conditions of the Creative Commons Attribution (CC BY) license (http://creativecommons.org/licenses/by/4.0/).
Share and Cite
MDPI and ACS Style
Wu, D.L.; Wang, T.; Várnai, T.; Limbacher, J.A.; Kahn, R.A.; Taha, G.; Lee, J.N.; Gong, J.; Yuan, T. MISR Radiance Anomalies Induced by Stratospheric Volcanic Aerosols. Remote Sens. 2018, 10, 1875. https://doi.org/10.3390/rs10121875
AMA Style
Wu DL, Wang T, Várnai T, Limbacher JA, Kahn RA, Taha G, Lee JN, Gong J, Yuan T. MISR Radiance Anomalies Induced by Stratospheric Volcanic Aerosols. Remote Sensing. 2018; 10(12):1875. https://doi.org/10.3390/rs10121875
Chicago/Turabian StyleWu, Dong L., Tao Wang, Tamás Várnai, James A. Limbacher, Ralph A. Kahn, Ghassan Taha, Jae N. Lee, Jie Gong, and Tianle Yuan. 2018. "MISR Radiance Anomalies Induced by Stratospheric Volcanic Aerosols" Remote Sensing 10, no. 12: 1875. https://doi.org/10.3390/rs10121875
Note that from the first issue of 2016, this journal uses article numbers instead of page numbers. See further details here.