A Rational Function Model Based Geo-Positioning Method for Satellite Images without Using Ground Control Points


1
Shanghai Engineering Research Center of Hadal Science and Technology, Research Center for Ocean Mapping and Applications, College of Marine Sciences, Shanghai Ocean University, Shanghai 201306, China
2
College of Information Technology, Shanghai Ocean University, Shanghai 201306, China
*
Authors to whom correspondence should be addressed.
Remote Sens. 2018, 10(2), 182; https://doi.org/10.3390/rs10020182
Submission received: 6 December 2017
/
Revised: 19 January 2018
/
Accepted: 23 January 2018
/
Published: 26 January 2018
(This article belongs to the Section Remote Sensing Image Processing)
Abstract
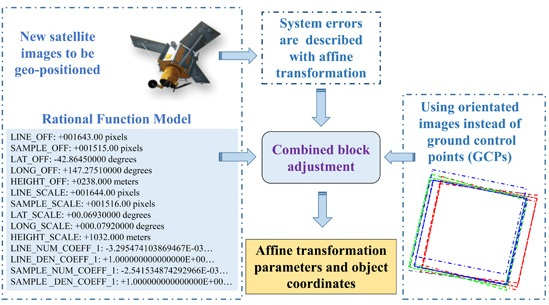
:Earth observation satellites with various spatial, spectral and temporal resolutions provide an invaluable means for mapping and monitoring the Earth’s environments. With the increasing demand of satellite images for remote and harsh environments and nature disaster areas such as earthquake, flooding, bushfires and other emergent events, quickly geo-positioning those images without using ground control points (GCPs) is much preferable and desirable. Built on the previously developed Spatial Triangulated Network (STN) concept by the first author, this paper presents a Rational Function Model (RFM) based geo-positioning method utilizing some pre-orientated image(s) as reference, instead of using GCPs. The experimental results indicate that the RFM method is more sensitive to the base-height ratio in the vertical accuracy than the physical model based geo-positioning method which was also developed by the first author. Compared to the traditional RFM based block adjustment using GCPs, the proposed RFM based method without GCP (using orientated images instead) can achieve similar accuracies when more than one orientated image, which have reasonable strong geometric relationships with the new images, are introduced into the proposed RFM based method. The proposed method is applicable to the scenarios in which geo-positioning is required for those new satellite images that only have RFM and no GCPs available, but where there exists some orientated images covering the same region.

1. Introduction
Earth observation satellites provide an invaluable means for mapping and monitoring the Earth’s environment through various spatial, spectral and temporal resolutions, such as mapping rivers and vegetation for environmental applications, creating feature and elevation maps for topography mapping, mapping coastlines for renewable natural resources applications, and so on [1]. In these mapping cases, accurate exterior orientation parameters (EOPs) and the consistent inner precision of the images are essential, which are obtained by the block adjustment method. Traditional block adjustment is generally executed to compensate for the systematic errors of the discrepancies between the measured and nominal observations with a mathematical model in order to improve the geo-positioning accuracy, and a number of ground control points (GCPs) are needed in this procedure. With the increasing demand of remote sensing images for remote and harsh environments and natural disaster events, such as earthquake, flooding, bushfires, and other emergent events, the fast geo-positioning of those images without using ground control points (GCPs) is much preferable and desirable.
Many researchers have paid attention to the geometric positioning for images without GCPs. The major source of errors in direct geo-positioning was analyzed in detail by using the physical characteristics [2], and a mathematical model describing the object-image relationship was developed to model the errors of the image deformation. For example, a mathematical model considering the thermo-elastic effects on the satellite was presented and applied to the UK-DMC images, and a geo-positioning accuracy of 0.5–1 km was achieved [3]. In another approach, “virtual” control points generated using the auxiliary data and imaging model were taken as an alternative of GCPs to be put into the adjustment [4]. A planimetric grid with 500-pixel spacing was defined on the image and a random elevation was given to each “virtual” control point, and the plane coordinates were calculated using an imaging model. The generated “virtual” control points were input to extract elevation from WorldView stereo data, in which vertical accuracy was about 2.5 m over the bare ground. Lots of ZY-3 images covering China were applied for the block adjustment using the “virtual” control points with other techniques, and the horizontal and vertical accuracies were less than 5 m [2]. Multiple satellite images from various sensors or strips were combined to perform the combined adjustment in order to improve the geo-positioning accuracy. For example, multiple strips of ZY-3 images were tested with bundle block adjustment without using GCPs, and the horizontal and vertical accuracies were around 13–15 m [5]. In another study, without using GCPs, the geo-positioning accuracy of a less accurate satellite image has been improved significantly with the aid of images with a high geo-positioning accuracy [6]. Built on the previously developed Spatial Triangulated Network (STN) concept [7], which is the extension and further development of the Metric Information Network (MIN) [8], instead of using GCPs, utilizing some existing orientated image(s) as the reference, a physical model based satellite imagery geo-positioning method without using GCPs was developed by the first author [7,9]. This paper presents the further development of this method to extend its application to the case where satellite imagery does not provide its physical model but a Rational Function Model (RFM) instead.
The STN is a database for a certain region, and this sophisticated database stores the spatial triangulation results of images in this region, including the EOPs and metadata of the orientated images, as well as the spatial coordinates and error covariance matrix of the ground points. The STN is very useful for geo-positioning the satellite images from the perspective of repetitive observations. The region is covered and observed repeatedly with multiple images from different view angles and different satellites, which can increase the redundant observations and improve base to height ratios, which are helpful in terms of the geo-positioning accuracy enhancement. In the practical geo-positioning processing, the suitable orientated images are extracted firstly from the STN in accordance with the overlaps with the new images; secondly, the corresponding points on the orientated and new images are matched; and finally, the combined adjustment is performed to achieve the EOPs of the new images [7,9].
The physical model based geo-positioning method using STN instead of using GCPs has been studied in the previous paper [9]. The mathematical model has been derived, in which the deviation between the interpolated orbit and attitude and the true values are compensated by a second order polynomial. The EOPs are introduced as pseudo-observations to avoid the instability caused by correlation among the EOPs, which is due to the high flight height and the narrow viewing angle of satellite linear array sensors leading to multicollinearity. At last, the unknowns are solved using the least square method. The results presented in [9] indicate that geo-positioning for stereo images using the proposed method could achieve better accuracy than the traditional forward intersection, and it can obtain the equivalent accuracy of the traditional block adjustment with GCPs [9].
In satellite photogrammetry, the sensor’s physical model describes the scene-to-ground relationship with the internal and external characteristics of the imaging system rigorously. The model involves the internal structure of the satellites and the complexity of ray projection. Satellite image vendors put considerable efforts to develop the rigorous physical models and usually request their proprietary software modules to produce accurate results [10]. In general, a satellite image is acquired over a period of time by a pushbroom sensor, and each scanline has its own projection center and orientation parameters which can be considered as a time function [10]. The complexity of the imaging system and the weak geometric relationship due to the narrow Angular Field of View (AFOV) increase the difficulties of geo-positioning of the physical model, and in order to keep the internal characteristics of the high-resolution satellite sensors confidential, most satellite vendors provide a mathematical approximation for the users to avoid the imaging process [11]. Rational Function Model (RFM), which is based on empirical formulation to describe the scene-to-ground mathematical relationship using polynomials, has been developed and widely adapted by many satellite image vendors and satellite photogrammetric software providers. In this case, the satellite vendors provide customers with the Rational Polynomial Coefficients (RPCs) instead of the complicated imaging internal and external parameters. Many studies demonstrated that high accuracy could be obtained using the RPCs while the systematic errors can be modeled using an affine transformation [12,13,14,15], where GCPs are requested in order to solve the affine transformation parameters.
In this paper, we propose an RFM based geo-positioning method and no GCP is required while making use of existing orientated image(s) extracted from the STN. In the following sections, the mathematical details of the RFM based geo-positioning method are presented, and several experiments are conducted to compare the accuracies between the physical model based geo-positioning method and the RFM based geo-positioning method, and improvements are made to stabilize the RFM based geo-positioning method under certain scenarios.
2. Methodology
2.1. Overview of the Proposed Method
STN is a database for the metric information, storing the outcomes of existing spatial triangulation of imagery over an area of interest, including orientated images with the EOPs and metadata, as well as 3D coordinates and their error covariance matrix of ground points measured by spatial triangulation. An efficient method of geo-positioning the new stereo images without the GCPs is proposed by the authors, using some existing orientated images as control, which are extracted from the STN. Combined adjustment is executed with the orientated images to achieve the EOPs of new non-orientated images without GCPs. Then the new images with the EOPs will be saved in the STN.
The RFM based geo-positioning method is developed for geo-positioning the new satellite images using the orientated satellite images stored in the STN without GCPs. The systematic errors of new images are populated in the directional way and are the main error sources, resulting in the inconsistencies between the measured and nominal coordinates of line and sample, and the major bias could be compensated by an affine transformation [10,12,13,14,15]. The adjustment terms, so called the unknowns, are the affine transformation parameters of the new images and three dimensional object coordinates of the tie points. Traditionally, those unknowns could be solved directly using Gauss-Newton method when enough GCPs are introduced into the block adjustment [10]. When GCPs are not available or not going to be used, in a mathematical sense, the coefficient matrix of the normal equation (Gauss-Newton method) is to be rank deficient and there will be many solutions. In this paper, the concept of utilizing orientated image(s) is presented. The observation equations of the tie points on the orientated image(s) are introduced, where the systematic errors of the orientated images could be compensated with the known affine transformation parameters stored in STN, and only the object coordinates of the tie points are the unknowns. The total observation equations of the RFM based geo-positioning method are constituted by the observation equations of the tie points on the orientated image(s) and the observation equations of the tie points on the new images. If sufficiently many orientated images are introduced into the combined block adjustment, a term of the coefficient matrix of the normal equation will be increased, and full rank of the coefficient matrix of the normal equation can be achieved and therefore the stable solution will be obtained.
The RFM based geo-positioning method is studied in this paper, which is taken as an effective way for satellite image geo-positioning without using GCPs, while no physical models are available for the satellite images. The workflow of the RFM based geo-positioning method without using GCPs is shown in Figure 1. The procedure is as follows: (1) the orientated images overlapped with the new images are extracted from the STN database employing the image retrieval method, in which intersections are detected on the basis of the image extents extracted from the metadata [9]; (2) sufficient tie points are selected on the overlapping areas of the new images and orientated images using the image matching techniques; (3) the initial values of affine transformation parameters and object coordinates of tie points are determined; (4) the observation equations are established on the basis of the RPCs and affine transformation, in which the discrepancies between the measured and the nominal line and sample coordinates of tie points are compensated by the affine transformation, and the affine transformation parameters are known for the orientated images, but unknown for the new images; (5) the weights of the observations are determined; (6) the unknowns are estimated, where an iterative method of correcting characteristic values is introduced to determine the affine transformation parameters for better converged solutions when the coefficient matrix of normal equation is rank-deficient. The Gauss-Newton method is used to calculate the optimal values of the affine transformation parameters of the new images when the coefficient matrix of the normal equation is full rank; and finally (7) the accuracy is assessed using some ground truth points. In Section 2.2, the mathematical details of the RFM based geo-positioning method describing the scene-to-ground relationship are presented in detail, in which an affine transformation is used to compensate the differences between the measured and the nominal line and sample coordinates of the tie point. In Section 2.3, the combined block adjustment is introduced, including selection of the tie points, establishment of the observation equation, weight determination, determination of the initial value of the unknowns, optimal parameter estimation and accuracy assessment.
2.2. The Mathematics of RFM
The RFM defines the relationship between the object coordinates and the image coordinates of a point as ratios of cubic polynomials as shown in Equation (1) [16].
where (l,s) and (P,L,H) are the normalized image coordinates (line, sample) and object coordinates (latitude, longitude, height) in the geographic projection coordinate system, respectively. u = [1 L P H LP LH PH L P H PLH L LP LH LP P PH LH PH H] is the term vector of the cubic polynomial, a = [a a a…a], b = [b b b…b], c = [c c c…c] and d = [d d d…d] are the so called RPCs.
The systematic errors of the ephemeris will be transmitted to the RPCs, resulting in the inconsistencies between the measured and nominal coordinates of line and sample. Previous research has shown that the bias could be compensated by an affine transformation [12,13,14,15], shown in Equation (2).
where p and r are the differences between the measured and nominal line and sample coordinates of a point, respectively; (l,s) are measured line and sample coordinates of a point; e, e, e, f, f, f are the adjustment parameters in the block adjustment, and e, e, e absorb all in-track effects causing errors in the line direction, f, f, f absorb all cross-track effects causing errors in the sample direction. They are known for the orientated images, but unknown for the new images which have not been geo-positioned yet.
The mathematical model of the RFM based geo-positioning method is obtained when Equation (2) is substituted into Equation (1), shown in Equation (3):
where LINE_SCALE and SAMPLE_SCALE are scale values for the two image coordinates, respectively; LINE_OFF and SAMPLE_OFF are offset values for the two image coordinates, respectively, and they are provided together with RPCs.
2.3. The Mathematics of the Proposed Method
- Selection of the tie points
Tie points, identified on the overlapped areas of orientated and new images, are necessary for the combined block adjustment. A combined correlation coefficient and least square matching (LSM) approach is utilized to obtain the tie points. The pyramid structures are generated for all images firstly, then the tie points are selected by distinctive image features on one selected master image’s full resolution pyramid levels, and their corresponding points on the rest images are searched based on the correlation coefficients, and the searching ranges are set based on the estimated maximal parallaxes, the correlation window size is set to 7 × 7 pixels and the threshold of the correlation coefficient is set to 0.8. Then, the LSM technique is applied to further improve the matching quality. The LSM matching window size is set to 5 × 5 pixels. This procedure is applied from the coarse level to the final level of the pyramids. In average, the final matching accuracy of 0.1–0.2 pixel is achievable for most tie points.
- Determination of the initial values of the unknowns
The object coordinates of tie points and the affine transformation parameters of new images are the unknowns and they are determined by an iterative Gauss-Newton method, and therefore the initial values of these unknowns are required. The initial values of affine transformation parameters are set to zero. The initial values of object coordinates of tie points are determined with the direct intersection method using the original RPCs of the new and orientated images.
- Establishment of the observation equations
The general observation equations are obtained when Equation (3) is linearized using the Taylor series expansion and the second-order terms are ignored, as shown in Equation (4):
where v and v are the observational residuals in the line and sample directions; de, de, de, df, df, df are the corrections to values of the affine transformation parameters; dφ, dλ, dh are corrections to values of the object coordinates (latitude, longitude and height); (l, s) are nominal line and sample coordinates of tie points computed by Equation (1); P represents the weight matrix for the observations.
A matrix version of the observation Equation (4) is shown in Equation (5), which is the observation equation of the traditional block adjustment with the RFM:
where V refers to the observational residual vector; A contains the partial derivatives of affine transformation parameters; A contains the partial derivatives of the parameters of object coordinates; X is the vector of corrections to the affine transformation parameters; X is the vector of corrections to the object coordinates; and L is the observation vector of points’ image coordinates.
Traditionally, those unknowns could be solved directly using the Gauss-Newton method when enough GCPs are introduced into the block adjustment. The following proposed method is assumed no GCP is available or going to be used.
Based on Equation (5), the observation equation of the proposed RFM based geo-positioning method is derived, shown in Equation (6), in which the unknowns are the affine transformation parameters of the new image and object coordinates of the tie points.
When GCPs are not available or not going to be used, the coefficient matrix of the normal equation from Equation (6) is to be rank deficient. In order to stabilize the solution of the normal equation, a commonly used solution is to introduce the EOPs into the observation equations as pseudo-observations and set some weights for the unknowns to stabilize the equation [9], however, it is hard to determine the weights using the RFM due to the ambiguous physical explanation of the RPCs. In this paper, the concept of utilizing orientated image(s) is presented. Equation (7), which is the observation equation of the tie points on the orientated image(s), is introduced, in which only the object coordinates of the tie points are the unknowns.
where V and V are the observational residuals of tie points on the new and orientated images; A is the coefficient matrix for affine transformation parameters corrections of the new image; A and A contain the partial derivatives of the parameters of object point coordinates; and L and L are the observation vectors of residual errors on the new and orientated images. P and P are the weights of tie points on the new and orientated images.
- Weight determination
In the matrix version of observation Equation (8), the weights P and P are computed based on the image resolution. Using the combined correlation and least square matching approach, the matching accuracy of a tie point is 0.1–0.2 pixel approximately, therefore the matching accuracy is related to the image resolutions. The weights of the points on the image with the highest resolution are set to one. Others are determined by Equation (9).
where P stands for the weight of the tie point; R is the resolution of the image i; and R represents the highest resolution among all the images.
- Estimates of the unknowns
The objective function of the proposed RFM based geo-positioning method is established using least squares, shown in Equation (10):
In order to minimize the objective function, the partial derivatives of the functions in Equation (10) with respect to [XX] are set to zero, and the normal equation is gained, shown in Equation (11):
where Ne = APA, Ne = APA, Ne = APA, Ne = APA + APA.
If sufficient orientated images are introduced into the adjustment, the term APA will be increased, and full rank of the coefficient matrix of the normal equation can be achieved and therefore enhance the stability of the solution. The convergent solution will be obtained from Equation (11), shown in Equation (12):
If very few orientated images are involved in the adjustment, the coefficient matrix of the normal equation may be still rank-deficient. An iterative method for correcting characteristic values is used to improve the ill-conditioned state [17], in which the matrix of unknowns is added to both sides of the normal equation as shown in Equation (13), and Equation (13) will be solved iteratively and the solution is shown in Equation (14):
where E and E are unit matrix.
where k − 1 is the previous iteration and k is the current iteration.
- Accuracy assessment
Although both the developed physical model and RFM based geo-positioning methods are not using any GCPs, GCPs are still used in the traditional geo-positioning method and acted as check points for the accuracy assessment and comparison purpose. The nominal object coordinates of these check points are calculated with the affine transformation parameters after adjustment and RPCs using the direct intersection method. The root mean square errors (RMSE) are computed based on the discrepancies between the ground truth values and nominal values of the check points, and the RMSE formula used are shown in Equation (15):
where , , infer to the RMSE of check points with three directions; infers to the RMSE in the horizontal direction; n refers to the number of check points; X, Y, Z are the truth ground coordinates of check points obtained via GPS techniques; and X, Y, Z are the nominal coordinates of check points. and are used to state the accuracies in the horizontal and vertical directions, respectively, in the following discussions.
3. Experimental Analysis and Discussion
In order to compare the accuracies between the RFM based geo-positioning method (the RFM method in short) and the physical model based geo-positioning method (the physical method in short), the results from the previous study [9] are listed in the following sections for the comparison purpose, and they are results from the physical model based direct intersection method, the physical model based block adjustment method with GCPs, and the physical model based geo-positioning method with orientated image(s). Because both the physical model and RFM are provided by the SPOT-5 satellite vendor, SPOT-5 data enables to test all methods (physical model based and RFM based).
Recently, most high resolution mapping satellite imagery does not provide its physical model but Rational Function Model (RFM) instead. In order to compare to the traditional RFM based geo-positioning methods, two commonly used methods (referred to as two traditional methods) were also implemented, one is the direct intersection method, which computes the point’s space coordinates using RPCs without using GCPs, and another is the block adjustment method, which adds an extra affine transformation to the existing RFM [10] and uses some GCPs to refine the imaging geometric model coefficients. In the following sections, two high-resolution satellite imagery datasets are used for testing these RFM based methods, they are the TH-1 satellite dataset and IKONOS satellite dataset, respectively. The experimental results of these methods are analyzed and discussed.
3.1. Tests with the SPOT-5 Data
3.1.1. Experimental Datasets
In order to compare the accuracies between the physical method and the RFM method, four SPOT-5 images covering an area in France were used, which include two images with the resolution of 5 m × 10 m acquired on 15 August 2002 and 18 August 2002 with the High Resolution Stereoscopic (HRS) sensor, one image with the resolution of 10 m/pixel, acquired on 14 August 2004 with the High Resolution Geometric (HRG) sensor and another one image with the resolution of 2.5 m/pixel acquired on 19 July 2002 with the super-resolution image processing mode. Basic information of four SPOT-5 images is given in Table 1. 26 GCPs were used for accuracy assessment. Figure 2 shows the extents of four SPOT-5 images and the GCPs distribution.
3.1.2. The Experimental Results of the SPOT-5 Images
More than 30 tie points were collected on the overlapping areas to perform various tests. The tests were designed, based on the same schemes as in the previous study [9]. The tests were divided into two groups. In the first group, the new images are SPOT5-Scene01 and SPOT5-Scene02, and they form the base to height ratio of 1.2, the biggest among four images. In the second group, the new images are SPOT5-Scene01 and SPOT5-Scene03, and they form the base to height ratio of 0.6, the smallest among four images. The RFM based direct intersection method, the RFM based block adjustment method and the RFM method with orientated image(s) were performed during various tests and the accuracies of these tests are shown in Table 2 and Table 3. The physical model based direct intersection method, the physical model based block adjustment method and the physical method with orientated image(s) had been performed in the previous study [9] and the accuracies from [9] are also listed in Table 2 and Table 3 for the comparison purpose.
- Geo-positioning for SPOT5-Scene01 and SPOT5-Scene02 with the biggest base to height ratio
The new images SPOT5-Scene01 and SPOT5-Scene02 were geo-positioned using the RFM based traditional methods: the direct intersection method and the block adjustment method, described as Test A and Test B in Table 2, respectively. Additionally the new images SPOT5-Scene01 and SPOT5-Scene02 were geo-positioned using the RFM method with SPOT5-Scene03 as the orientated image (Test C), with SPOT5-Scene04 as the orientated image (Test D), and with both SPOT5-Scene03 and SPOT5-Scene04 as the orientated images (Test E), respectively. In Test C and Test D, only one orientated image was introduced in the combined adjustment, and they have different resolutions. Their accuracies are shown in Table 2. The same tests in Table 2 had been executed by the physical model based methods with physical coefficients in the previous study, and their accuracies from [9] are listed in Table 2 used in order to compare to the RFM based traditional methods and the RFM method.
For the RFM based methods, Test B, which uses the block adjustment method with GCPs, has the highest accuracies in both directions (7.91 m horizontal and 3.12 m vertical). In Test C and D, only one orientated image was introduced in the combined adjustment, and the coefficient matrix of the normal equation was still rank-deficient. An iterative method for correcting characteristic values was used to improve the ill-condition, as described in Section 2.3. Comparing to the RFM based direct intersection method, the horizontal accuracies of the RFM method are increased from 48.16 m (Test A) to 43.83 m (Test C), 15.80 m (Test D), respectively, and the vertical accuracies for these three cases remain the same (19–24 m). In Test E, two orientated images were introduced in the combined adjustment, and the coefficient matrix of the normal equation was full rank. The horizontal accuracy is 8.74 m, close to the highest horizontal accuracy of the block adjustment method with using GCPs (Test B), however, the vertical accuracy remains near the same (19–24 m) with Test A, C and D.
From the results, it indicates that the RFM method can achieve a reasonable accuracy in the horizontal direction compared to the block adjustment method, and the more high resolution orientated images are used, the more accurate results can be obtained in the horizontal direction. However, the vertical accuracy remains the same with the direct intersection method.
The RFM based geo-positioning accuracies are compared with the physical model based methods. From Table 2, it shows that: the physical model based direct intersection method achieves a better result than the RFM based direct intersection method (Test A); the physical model based and RFM based block adjustment method give similar results (Test B); and the physical method with the orientated SPOT5-Scene03 (Test C), with the orientated SPOT5-Scene04 (Test D) and with both orientated SPOT5-Scene03 and SPOT5-Scene04 (Test E), achieves better results in the vertical direction than the RFM method does. The RFM method gives better results in Test D and E and worse result in Test C in the horizontal direction than the physical method does.
The comparison results illustrate that RFM based block adjustment method can achieve the similar accuracies with the physical model based block adjustment method. The physical model based direct intersection method is more accurate than the RFM based direct intersection method. The RFM method performs better in the horizontal direction than the physical method, however, the vertical accuracy of the RFM method is worse than the physical method and does not reach the optimal accuracy of the block adjustment method using GCPs. The reasons may be due to the fundamental differences of these two models and/or caused by the varying base to height ratios [18], and they are going to be investigated next.
- Geo-positioning for SPOT5-Scene01 and SPOT5-Scene03 with the smallest base to height ratio
The second group of tests were designed to geo-position the new images SPOT5-Scene01 and SPOT5-Scene03 with the slightly weak geometry (a base to height ratio of 0.6) using the traditional methods and the RFM method, their accuracies are shown in Table 3. The direct intersection method is described as Test A and the block adjustment method is described as Test B, respectively. The RFM method with the orientated SPOT5-Scene02, with the orientated SPOT5-Scene04, and with both orientated SPOT5-Scene02 and SPOT5-Scene04 are described as Test C, Test D and Test E, respectively. Their accuracies of the five tests with the physical model based methods in the previous study from [9] are also listed in Table 3 to compare to the RFM based traditional methods and the RFM method.
For the RFM based methods, in Tests C and D, only one orientated image was used to geo-position the new SPOT5-Scene01 and SPOT5-Scene03, and the coefficient matrix of the normal equation remained rank-deficient. The iterative method for correcting characteristic values was used to ensure the stability of the solution. Comparing to the direct intersection method, the horizontal accuracies of the RFM method are improved from 69.42 m (Test A) to 19.57 m (Test C) and 8.20 m (Test D), respectively, and the vertical accuracies are improved from 35.93 m (Test A) to 23.91 m (Test C). The vertical accuracy of Test D decreases to 57.73 m. Test E, which involved two orientated images and the coefficient matrix of the normal equation was full rank, achieves better accuracies than Test B with the block adjustment method with using GCPs.
From the results, it indicates that the RFM method can achieve high accuracies in both horizontal and vertical directions. The more accurate results can be obtained in the horizontal direction when the more high resolution orientated images are used. From the results of Tests C and D using only one orientated image, it demonstrates that the vertical accuracy can be improved while the base to height ratio is increased from 0.6 to 1.2 (Test C) compared to the direct intersection method (Test A); the introduction of orientated SPOT5-Scene04, which has the similar viewing angle of SPOT5-Scene03, does not increase the base to height ratio, in contrast it weakens the geometry with new images SPOT5-Scene01 and SPOT5-Scene03 (Test D), resulting in the worst vertical accuracy. Test E with two orientated images and a biggest base to height ratio performs best in the vertical directions among the five tests. Therefore, it can be said that the vertical accuracy of the RFM method is affected by the base to height ratio.
The accuracies of RFM based methods were compared to the physical model based methods. The physical model based direct intersection method performs better than the RFM based direct intersection method (Test A). The physical model based block adjustment method and the RFM based block adjustment method (Test B) obtain identical results. In Tests C and D, the physical method achieves better results than the RFM method in the vertical direction, however in opposite in the horizontal direction. In Test E, the RFM method obtains the similar accuracy with the physical method.
From the comparison results, it indicates that the physical model based direct intersection method performs better than the RFM based direct intersection method. Both the RFM and physical model based block adjustment methods with using GCPs could obtain similar results. In Tests C and D, the physical method performs better than the RFM method in the vertical direction, especially in Test D, in the case of weak geometry (small base to height ratio), the vertical accuracy with the physical method is still improved comparing with the Test A. Therefore, the RFM method is more sensitive to the base-height ratio in the vertical accuracy. The RFM method and the physical method can obtain the same results with the block adjustment method when more than one orientated images are utilized and the base to height ratio is improved.
In summary, both the RFM based and physical model based block adjustment methods can achieve similar results. Compared to the physical model based method, the RFM method is more sensitive to the base-height ratio in the vertical accuracy. When higher resolution and/or more orientated images are used, the horizontal accuracy of the RFM method can be improved significantly. Therefore, when the RFM method is going to be used and high accuracies are to be expected, it is suggested that more than one orientated image having reasonable strong geometric relationship with the new image(s) should be introduced in the process.
3.2. Tests with the TH-1 Data
3.2.1. Experimental Datasets
The TH-1 satellite is a Chinese stereo mapping satellite similar to ZY-3 satellite. A total of nine TH-1 images, grouped into three image sets, have been used to further test the accuracies of the proposed RFM method in another test area-Henan, China. The first image set contains TH1-Scene01, TH1-Scene02 and TH1-Scene03, acquired on 27 March 2013. The second image set includes TH1-Scene04, TH1-Scene05 and TH1-Scene06, taken on 15 June 2013. The third image set contains TH1-Scene07, TH1-Scene08 and TH1-Scene09, obtained on 30 August 2013. The TH-1 images are captured using the three-line scanning sensors and have a resolution of 5 m per pixel. Three images in each image set are acquired simultaneously from TH-1’s forward, nadir and backward imaging sensors, respectively. The detailed parameters of these nine images are shown in Table 4. The satellite vendor provides RPC files (RFM) for TH-1 satellite images. A total of 47 GCPs are used as check points for geo-positioning and accuracy assessment. These GCPs were firstly collected from the high-resolution aerial images and then measured in the filed using differential GPS units. The accuracies of these measurements are in centimeters. Figure 3 shows the extents of the nine TH-1 images and GCPs distribution.
3.2.2. The Experimental Results of the TH-1 Images
More than 50 tie points matched from the overlapping areas of nine TH-1 images were put into the block adjustment. Three groups of tests were designed to investigate the influences of the number of images and the spatial geometry of the images on the accuracy. Only the RFM based methods were used due to no physical model coefficients was supplied by the satellite vendors. In the first test group, the three images from the first image set were chosen as the new images, and the traditional methods (the direct intersection method and the block adjustment method) were applied and the results are shown in Table 5. In the second and third test groups, the RFM method with various images as orientated images was applied, and the results are shown in Table 5.
In the first test group, the direct intersection method was applied in Test A in Table 5 to geo-position the new TH1-Scene01, TH1-Scene02 and TH1-Scene03, and the horizontal and vertical accuracies are 9.27 m and 5.88 m, respectively. The accuracies were further improved when the systematic errors were compensated with an affine transformation using GCPs in the block adjustment process (Test B), and the horizontal and vertical accuracies of the block adjustment method are 3.23 m and 3.29 m, respectively.
In the second test group, different combinations of the second image set were introduced as orientated images to the RFM method, generating four tests, shown in Table 5. In Test A, the orientated images were TH1-Scene04 and TH1-Scene05, acquired from the forward and nadir imaging sensor. In Test B, the orientated images were TH1-Scene04 and TH1-Scene06, acquired from the forward and backward imaging sensor. In Test C, the orientated images were constituted with the nadir TH1-Scene05 and backward TH1-Scene06. In Test D, the orientated images were forward TH1-Scene04, nadir TH1-Scene05 and backward TH1-Scene06. The accuracies are shown in Table 5. The accuracies of the RFM method (Tests A–D in Table 5) are higher than the accuracies of the direct intersection method (Test A of the first test group) and very close to the accuracies of the block adjustment method (Test B of the first test group), particularly, Tests B and D. The explanation could be that the orientated TH1-Scene04 and TH1-Scene06 both in Test B and Test D are acquired from the forward and backward sensors, and they form a large geometric angle therefore increase the accuracies.
In the third test group, some images from the second and the third image sets were taken as orientated images. In Test A, all six images from the second and the third image sets were introduced as the orientated images. In Test B, the forward images TH1-Scene04, TH1-Scene07 and backward images TH1-Scene05, TH1-Scene09 were introduced as the orientated images. In Test C, the forward image TH1-Scene04 in the second image set and the backward image TH1-Scene09 in the third image set were introduced as the orientated images (they have the biggest base to height ratio among six images). The accuracies are shown in Table 5. All these three tests (Tests A–C) achieved the similar accuracies, which are similar to the accuracies of the block adjustment method in the first test group (Test B of the first test group).
3.3. Tests with the IKONOS Data
3.3.1. Experimental Datasets
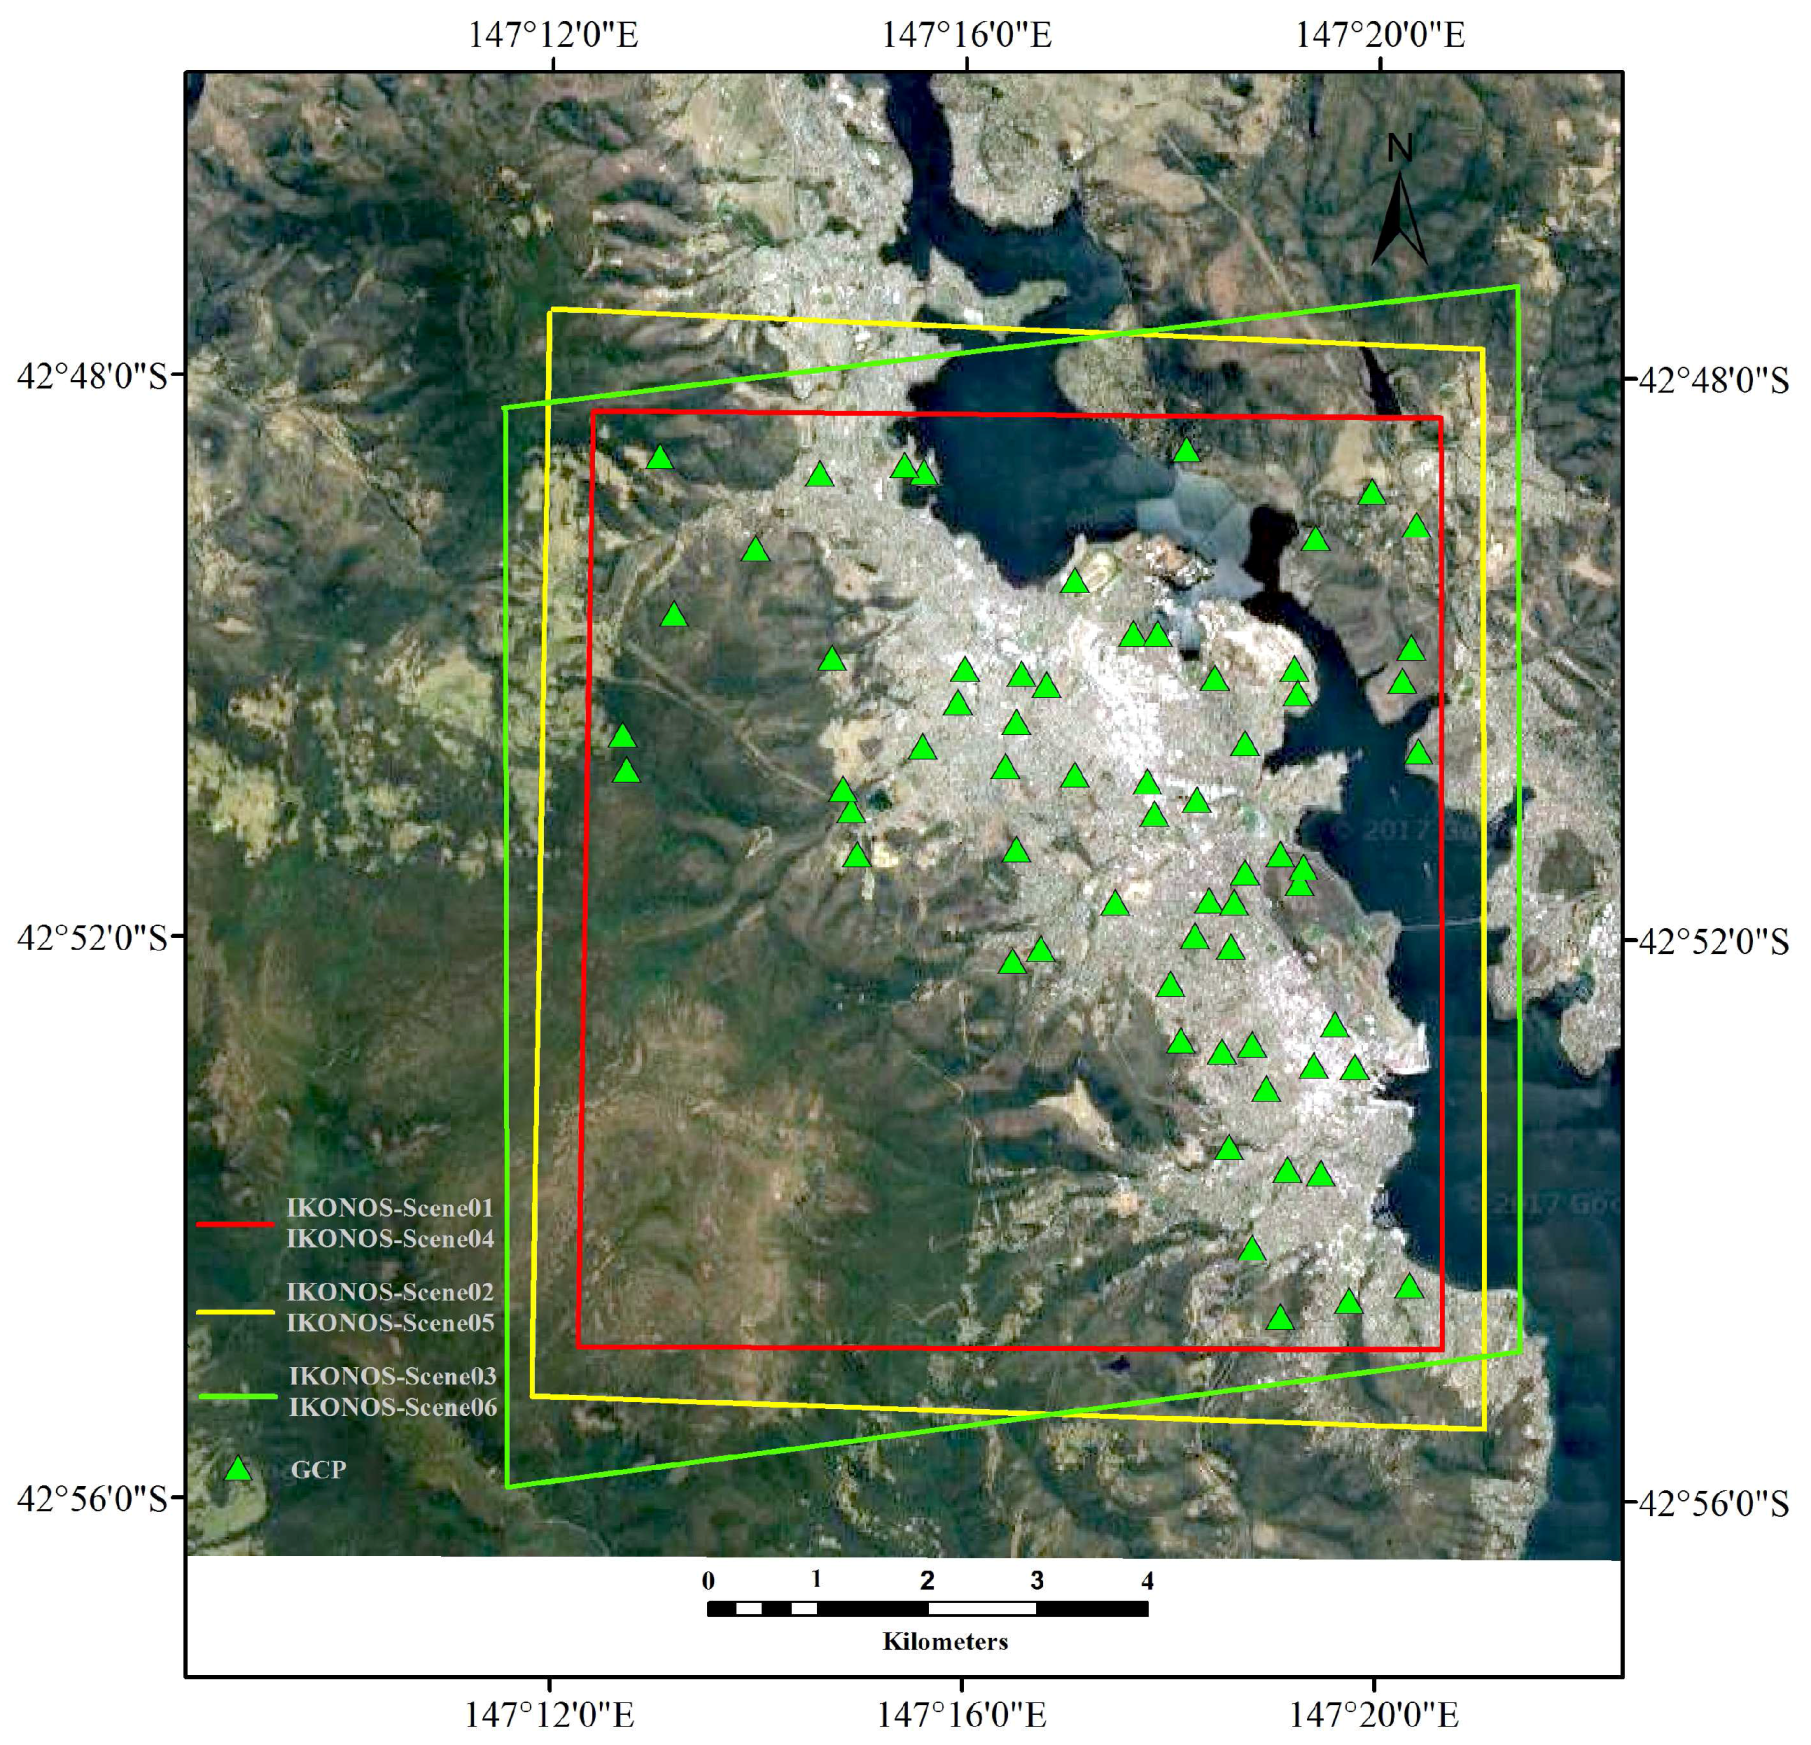
Six IKONOS images, downloaded from the International Society for Photogrammetry and Remote Sensing (http://www.isprs.org/data/ikonos_hobart/default.aspx), have been used to further verify the proposed RFM method. The location of the IKONOS images is Hobart, Australia. These images were acquired from three different viewing directions, where IKONOS-Scene01, IKONOS-Scene02 and IKONOS-Scene03 are panchromatic images with a resolution of 1 m, accordingly, IKONOS-Scene04, IKONOS-Scene05 and IKONOS-Scene06 are multispectral images with a resolution of 4 m, acquired at the same time and viewing directions with the three panchromatic images. The information of these 6 images are shown in Table 6. The RPC files (RFM) are provided for every image in the IKONOS datasets. A total of 112 GCPs are used as check points for geo-positioning and accuracy assessment. These GCPs were measured by the Department of Geomatics, University of Melbourne and provided together with the image datasets. Figure 4 shows the extents of six IKONOS images and GCPs distribution.
3.3.2. The Experimental Results of the IKONOS Images
More than 60 tie points were matched among the overlapping areas of six IKONOS images and used in the block adjustment. Only the RFM based methods were used due to no physical model coefficients was supplied by the satellite vendors. Two stereo multispectral image pairs with lower resolution were geo-positioned with the orientated panchromatic images with higher resolution. The first stereo multispectral image pair is constituted with IKONOS-Scene05 and IKONOS-Scene06, which has the highest base to height ratio among the images, and the second multispectral image pair is constituted with IKONOS-Scene04 and IKONOS-Scene05. The traditional methods (the direct intersection method and the block adjustment method) were applied to compare with the RFM based methods. The results are shown in Table 7 and Table 8.
The stereo multispectral image pair of IKONOS-Scene05 and IKONOS-Scene06 were geo-positioned with the traditional methods and the RFM based geo-positioning methods, and the results are shown in Table 7. The direct intersection method was executed in Test A, and the horizontal and vertical accuracies are 3.67 m and 4.54 m, respectively. The accuracies were improved with the traditional block adjustment using GCPs (Test B), and the horizontal and vertical accuracies are 3.03 m and 3.28 m, better than one pixel. The orientated images from different viewing directions were introduced in the RFM based method to geo-position IKONOS-Scene05 and IKONOS-Scene06, generating four tests, shown in Table 7. In Test C, the orientated image was IKONOS-Scene01. In Test D, the orientated images were IKONOS-Scene01 and IKONOS-Scene02. In Test E, the orientated images were IKONOS-Scene01, IKONOS-Scene02 and IKONOS-Scene03. In Test F, the orientated images were IKONOS-Scene02 and IKONOS-Scene03. In Test C, only one orientated image was introduced in the combined adjustment, and the coefficient matrix of the normal equation was rank-deficient. An iterative method for correcting characteristic values was used to improve the ill-condition, as described in Section 2.3. Compared to the traditional methods (Tests A and B), the horizontal accuracy is increased to 2.30 m (Test C), and the vertical accuracy was decreased to 5.65 m (Test C). In Tests D–F, more than one orientated images are introduced in the block adjustment, and the coefficient matrix of the normal equation was full rank. The accuracies of the RFM method (Tests D–F) are higher than the traditional methods (Tests A and B), and Tests E and F perform best among the tests. The explanation could be that the orientated IKONOS-Scene02 and IKONOS-Scene03 have higher resolution and they form a large intersection angle beneficial to the accuracy improvement.
The stereo multispectral image pair of IKONOS-Scene04 and IKONOS-Scene05 with smallest base to height ratio among the images were geo-positioned with the traditional methods and the RFM based geo-positioning methods, and the results are shown in Table 8. The direct intersection method was executed in Test A, and the horizontal and vertical accuracies are 9.66 m and 12.27 m, respectively. The accuracies were improved with the traditional block adjustment using GCPs (Test B), and the horizontal and vertical accuracies are 4.41 m and 9.79 m.
The orientated images from different viewing directions were introduced in the RFM based method to geo-position IKONOS-Scene04 and IKONOS-Scene05, generating five tests, shown in Table 8. In Test C, the orientated image was IKONOS-Scene03. In Test D, the orientated images were IKONOS-Scene01 and IKONOS-Scene03. In Test E, the orientated images were IKONOS-Scene01, IKONOS-Scene02. In Test F, the orientated images were IKONOS-Scene01, IKONOS-Scene02 and IKONOS-Scene03. In Test G, the orientated images were IKONOS-Scene02 and IKONOS-Scene03. In Test C, only one orientated image was introduced in the combined adjustment, and the coefficient matrix of the normal equation was rank-deficient. An iterative method for correcting characteristic values was used to improve the ill-condition, as described in Section 2.3. Comparing to the traditional methods (Tests A and B), the horizontal and vertical accuracy is increased to 2.21 m and 4.09 m (Test C). In Tests D–G, more than one orientated images are introduced in the block adjustment, and the coefficient matrix of the normal equation was full rank. The accuracies of the RFM method (Tests D–G) are higher than the traditional methods (Tests A and B), and Tests F and G perform best among the tests. The explanation could be that the orientated IKONOS-Scene02 and IKONOS-Scene03 have higher resolution and they form a large intersection angle beneficial to the accuracy improvement.
To summarize, in general, the proposed RFM method can achieve similar accuracies with the block adjustment method when more than one orientated image, which have reasonable strong geometric relationship with the new images, are introduced in the process. Even higher accuracy could be obtained as long as the established imaging geometric relationships improve base to height ratios. This could be achieved during image selections from the STN database, i.e., only images who have better base to height ratios with new images and higher resolution are selected to be included in the block adjustment.
4. Conclusions
In this paper, a Rational Function Model (RFM) based geo-positioning method utilizing some already orientated image(s) as the reference instead of using ground control points (GCPs) is presented, which is the RFM extension of the physical model based geo-positioning method previously developed by the first author [9]. The mathematical details of the RFM based geo-positioning method were developed, in which the systematic errors are compensated by an affine transformation and the rank-deficiency of the coefficient matrix of the normal equation is solved using an iterative method for correcting characteristic values and introducing orientated images method. The conclusion is obtained that, compared to the traditional RFM based block adjustment using GCPs, the RFM based geo-positioning method can achieve similar accuracies when more than one orientated image, which have reasonable strong geometric relationships with the new images, are introduced into the proposed RFM based method.
It is well studied that RFM is not the best choice for accurate photogrammetric tasks due to its intrinsic limitation [19], its various shortcomings include that it cannot model Charge-coupled Device (CCD) array distortions, its accuracy decreases if an image size is very big or has too high frequency of image distortion, and its polynomial terms may be insufficient for very steep terrain. However, instead of providing the rigorous physical model coefficients to users, more and more satellite imagery vendors choose to provide RFM of satellite images, the proposed method is applicable to these scenarios that geo-positioning is required for new satellite images which only have RFM and no GCPs available but there exist some orientated images covering the same region.
The experimental results of the RFM based methods demonstrate that it could be an alternative choice for RFM based satellite image geo-positioning without using GCPs. Three kinds of high resolution satellite imagery datasets are used for testing, they are from satellites SPOT-5, TH-1 and IKONOS, respectively. Comparing to the physical model based method, the SPOT-5 experimental results in this paper indicate that the RFM method is more sensitive to the base-height ratio in the vertical accuracy, when higher resolution and/or more orientated images are used, the RFM based geo-positioning method can achieve similar results with the physical model based geo-positioning method. Comparing to the traditional RFM based block adjustment using GCPs, the TH-1 and IKONOS experimental results indicate that when only one orientated image is introduced into the block adjustment, the coefficient matrix of the normal equation (Gauss-Newton method) is to be rank deficient, and the geo-positioning accuracy is lower, however, the proposed RFM based method can achieve similar accuracies when more than one orientated image, which have reasonable strong geometric relationships with the new images, are introduced into the combined block adjustment.
The RFM based method inherits the above mentioned intrinsic limitation of RFM, and the experimental results of RFM based method do not show significant improvements over physical model based method, therefore, more sufficient experiments are required in future to compare and investigate between the RFM based and physical model based methods, especially how to stabilize the errors of proposed RFM based method and make it an effective method for a wide range of sensors. All images in each dataset are mainly from the same sensor. In future research, the geo-positioning methods using the empirical RFM without GCPs applying multi-sourced satellite images with different spatial and spectral resolutions and acquired from very different time will be studied. Other aspects to improve the practical and efficient utilization of the methods include that how to automatically choose the candidate images from Spatial Triangulated Network (STN) database as the most suitable orientated images for new images, and how to improve the automation of tie point selection and matching among images.
Acknowledgments
This work was supported by the Shanghai Ocean University Research Initiation Funds for the Post-Doctorial Scholarship under Grant A2-0203-17-100311 and the Program for Professor of Special Appointment (Eastern Scholar) at Shanghai Institutions of Higher Learning No. TP2016038. The authors would like to thank Bincai Cao for his valuable discussions and suggestions. The authors would also like to thank Aerospace Surveying and Mapping and Remote Sensing Information Processing Center (Beijing, China) for providing the TH-1 images datasets. The authors would also like to thank International Society for Photogrammetry and Remote Sensing for providing the IKONOS images datasets, and thank the Department of Geomatics, University of Melbourne for providing the GCPs.
Author Contributions
Zhenling Ma conceived of the RFM geo-positioning idea, developed the method and performed the experiments and also wrote the draft paper. Wei Song and Junping Deng gave many good advices and revised the paper. Jiali Wang and Cancan Cui performed the processing of the image data and conducted the accuracy assessment.
Conflicts of Interest
No potential conflict of interest was reported by the authors.
References
- Schowengerdt, R.A. Remote Sensing: Models and Methods for Image Processing, 3rd ed.; Academic Press: New York, NY, USA, 2007; p. 2. ISBN 978-01-2369-407-2. [Google Scholar]
- Wang, M.; Yang, B.; Li, D.R.; Gong, J.Y.; Pi, Y.D. Technologies and Applications of Block Adjustment without Control for ZY-3 Images Covering China. Geomat. Inf. Sci. Wuhan Univ. 2017, 42, 427–433. [Google Scholar] [CrossRef]
- Mumtaz, R.; Palmer, P.L.; Waqar, M.M. Georeferencing of UK DMC Stereo-images without Ground Control Points by Exploiting Geometric Distortions. Int. J. Remote Sens. 2014, 35, 2136–2169. [Google Scholar] [CrossRef]
- Toutin, T.; Schmitt, C.V.; Wang, H. Impact of No GCP on Elevation Extraction from WorldView Stereo Data. ISPRS J. Photogramm. Remote Sens. 2012, 72, 73–79. [Google Scholar] [CrossRef]
- Zhang, Y.J.; Zheng, M.T.; Xiong, X.D.; Xiong, J.X. Multistrip Bundle Block Adjustment of ZY-3 Satellite Imagery by Rigorous Sensor Model without Ground Control Point. IEEE Geosci. Remote. Sens. Lett. 2015, 12, 865–869. [Google Scholar] [CrossRef]
- Tang, S.J.; Wu, B.; Zhu, Q. Combined Adjustment of Multi-Resolution Satellite Imagery for Improved Geo-positioning Accuracy. ISPRS J. Photogramm. Remote Sens. 2016, 114, 125–136. [Google Scholar] [CrossRef]
- Yan, L.; Ma, Z.L.; Wang, Q.J.; Wang, Y.D. Geopositioning for Optical Satellite Images Using Spatial Triangulated Network. Geomat. Inf. Sci. Wuhan Univ. 2015, 40, 938–942. [Google Scholar] [CrossRef]
- Dolloff, J.; Iiyama, M. Fusion of Image Block Adjustments for the Generation of a Ground Control Network. Proceeding of the 10th International Conference on Information Fusion, Val-Belair, QC, Canada, 9–12 July 2007. [Google Scholar]
- Ma, Z.L.; Wu, X.L.; Yan, L.; Xu, Z.L. Geometric Positioning for Satellite Imagery without Ground Control Points by Exploiting Repeated Observation. Sensors 2017, 17, 240. [Google Scholar] [CrossRef] [PubMed]
- Grodecki, J.; Dial, G. Block Adjustment of High-resolution Satellite Images Described by Rational Polynomials. Photogramm. Eng. Remote Sens. 2003, 69, 59–68. [Google Scholar] [CrossRef]
- Habib, A.; Shin, S.W.; Kim, K.; Kim, C.; Bang, K.I.; Kim, E.M.; Lee, D.C. Comprehensive Analysis of Sensor Modeling Alternatives for High Resolution Imaging Satellites. Photogramm. Eng. Remote Sens. 2007, 73, 1241–1251. [Google Scholar] [CrossRef]
- Fraser, C.; Hanley, H. Compensation in Rational Functions for IKONOS Satellite Imagery. Photogramm. Eng. Remote Sens. 2003, 69, 53–57. [Google Scholar] [CrossRef]
- Di, K.; Ma, R.; Li, R. Rational Functions and Potential for Rigorous Sensor Model Recovery. Photogramm. Eng. Remote Sens. 2003, 69, 33–41. [Google Scholar]
- Fraser, C.S.; Hanley, H.B. Bias-compensated RPCs for Sensor Orientation of High-resolution Satellite Imagery. Photogramm. Eng. Remote Sens. 2005, 71, 909–915. [Google Scholar] [CrossRef]
- Fraser, C.S.; Ravanbakhsh, M. Georeferencing Accuracy of GeoEye-1 Imagery. Photogramm. Eng. Remote Sens. 2009, 75, 634–638. [Google Scholar]
- Tao, C.V.; Hu, Y. A Comprehensive Study of Rational Function Model for Photogrammetric Processing. Photogramm. Eng. Remote Sens. 2001, 67, 1347–1357. [Google Scholar]
- Wang, X.Z.; Liu, D.Y.; Huang, H.L. The Co-factor Matrix of the Iteration Method by Correcting Characteristic Value. Geomat. Inf. Sci. Wuhan Univ. 2003, 28, 429–431. [Google Scholar] [CrossRef]
- Wang, R.X.; Hu, X. The Difficult Problem about Satellite Photogrammetry without Control Points. Sci. Surv. Mapp. 2004, 29, 3–5. [Google Scholar]
- Dowman, I.; Dolloff, J.T. An Evaluation of Rational Functions for Photogrammetric Restitution. In Proceedings of the International Archives of Photogrammetry and Remote Sensing, Amsterdam, The Netherlands, 16–23 July 2000. [Google Scholar]
Figure 1.
The workflow of the RFM based geo-positioning method without using GCPs.
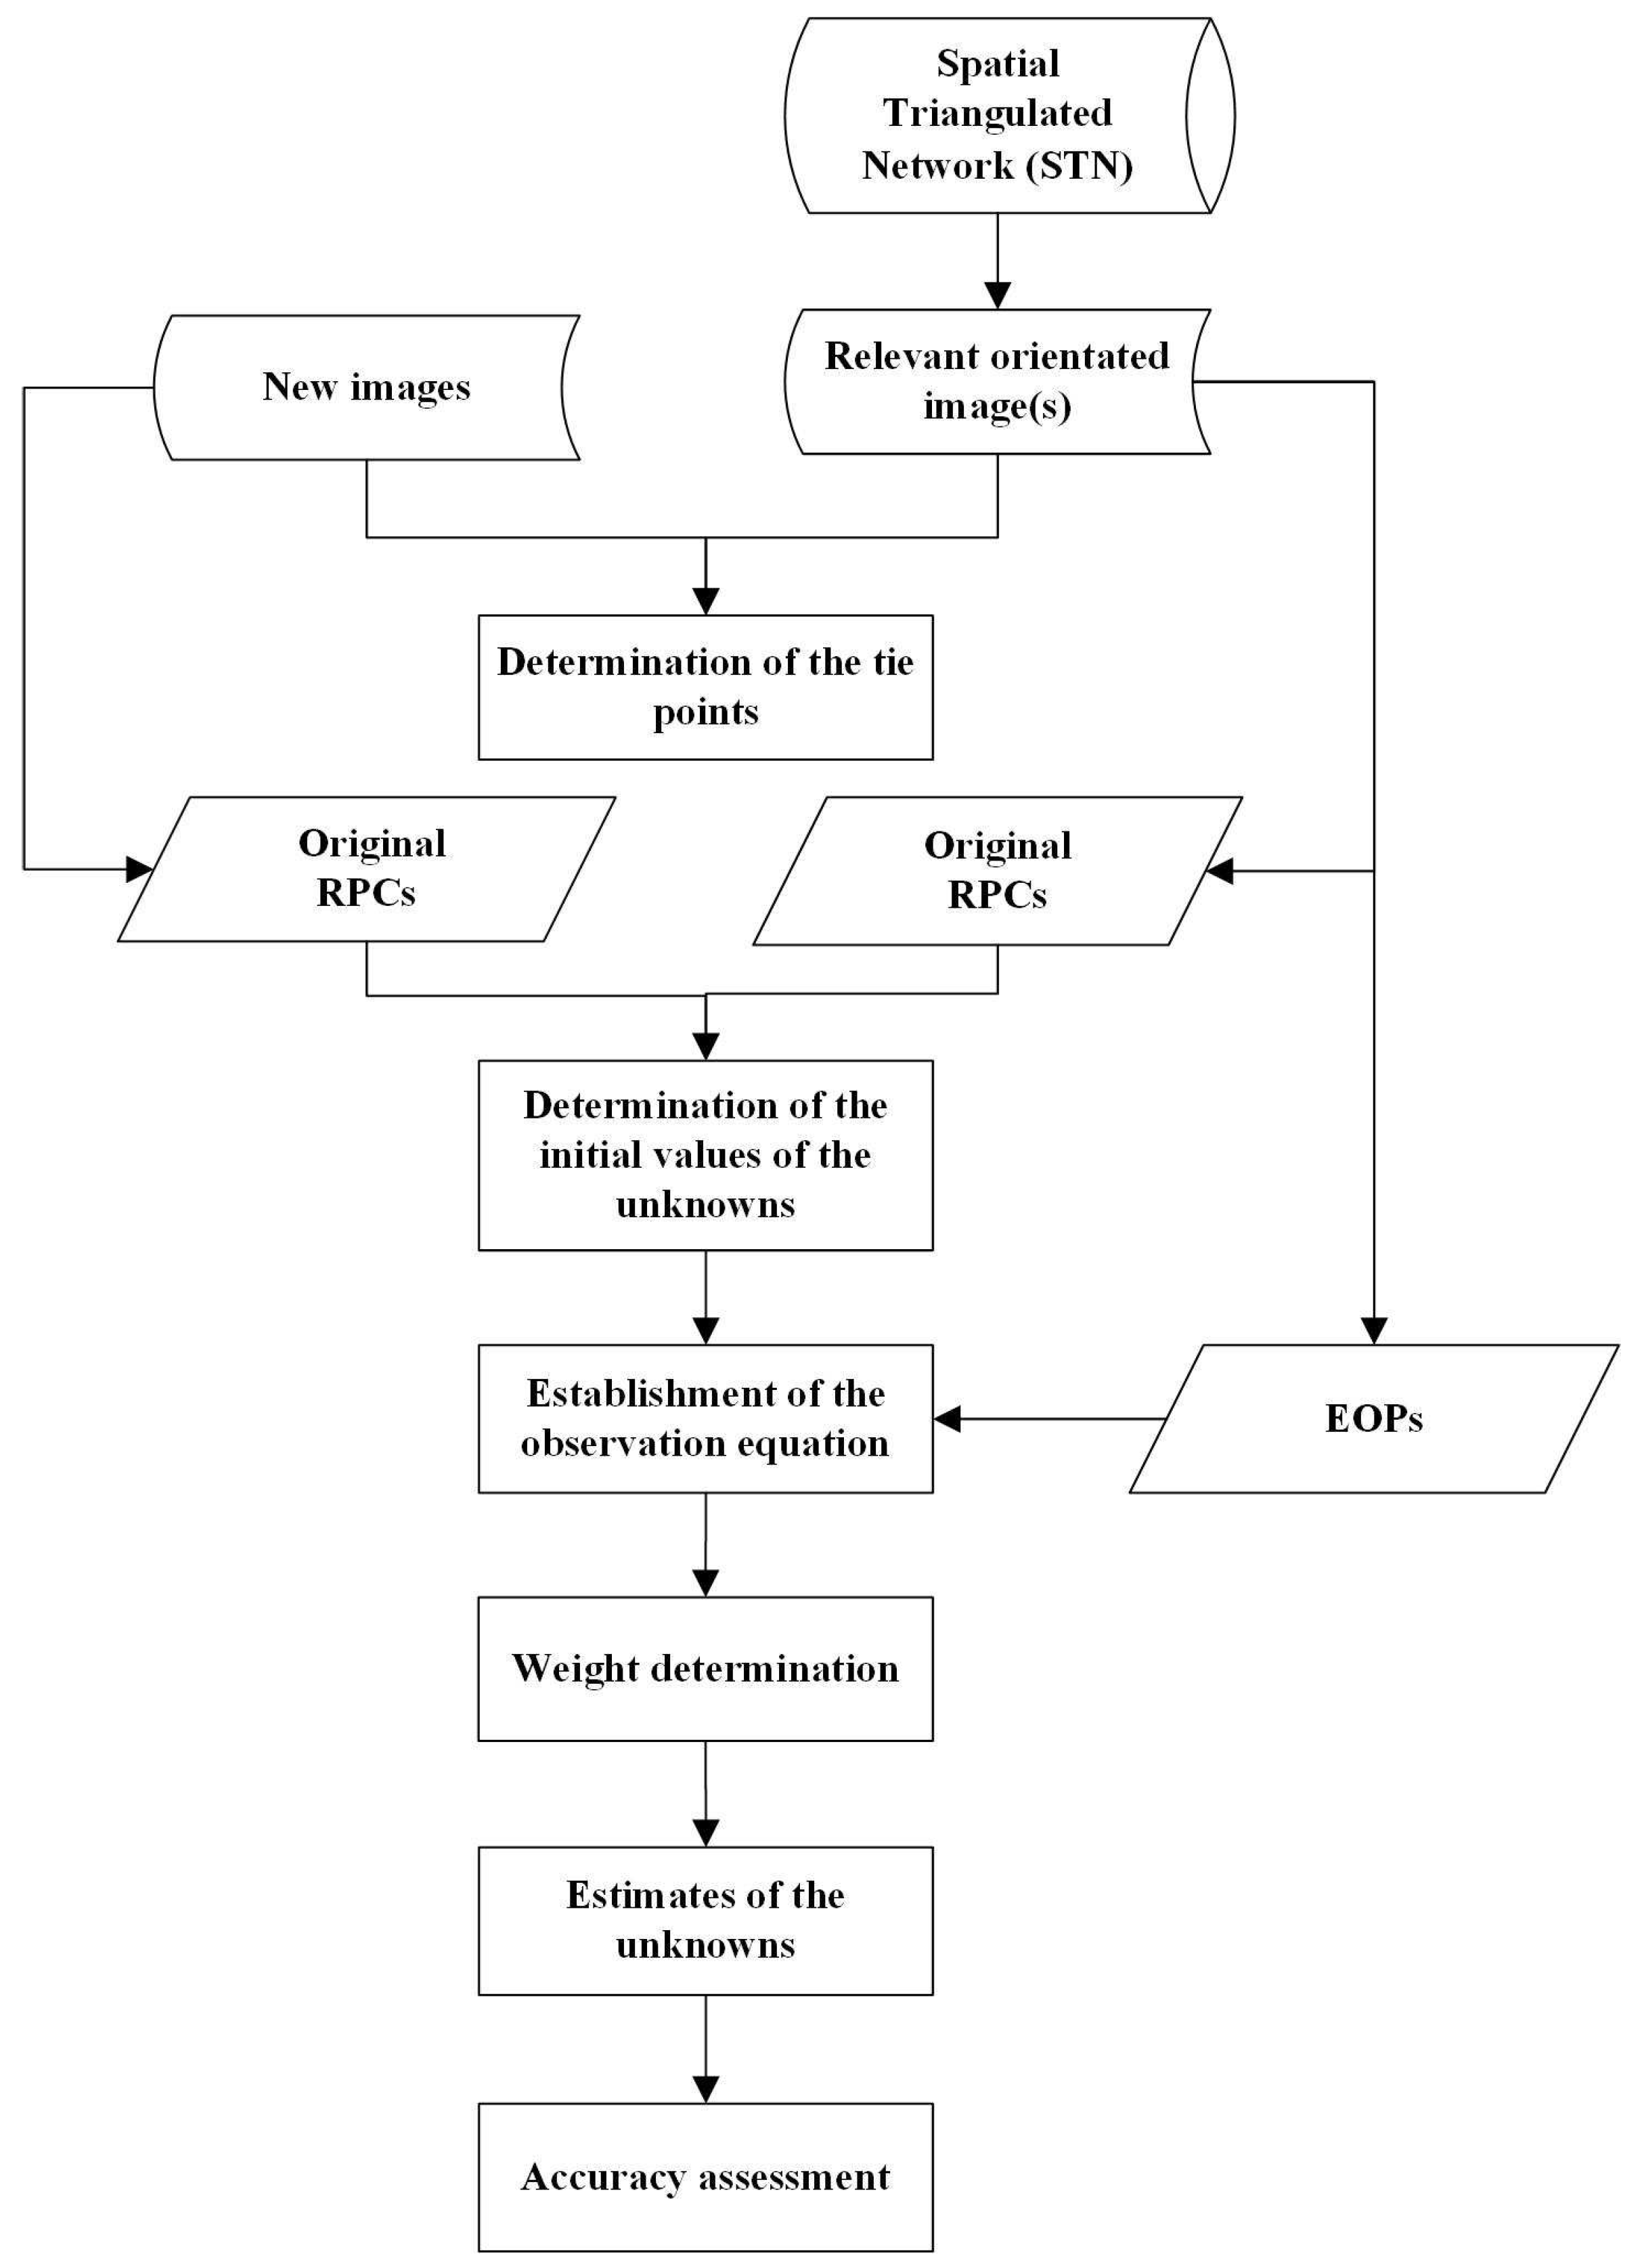
Figure 2.
The extents of 4 SPOT-5 images in France and the GCPs distribution (The background map is downloaded from the Google Maps).
Figure 2.
The extents of 4 SPOT-5 images in France and the GCPs distribution (The background map is downloaded from the Google Maps).
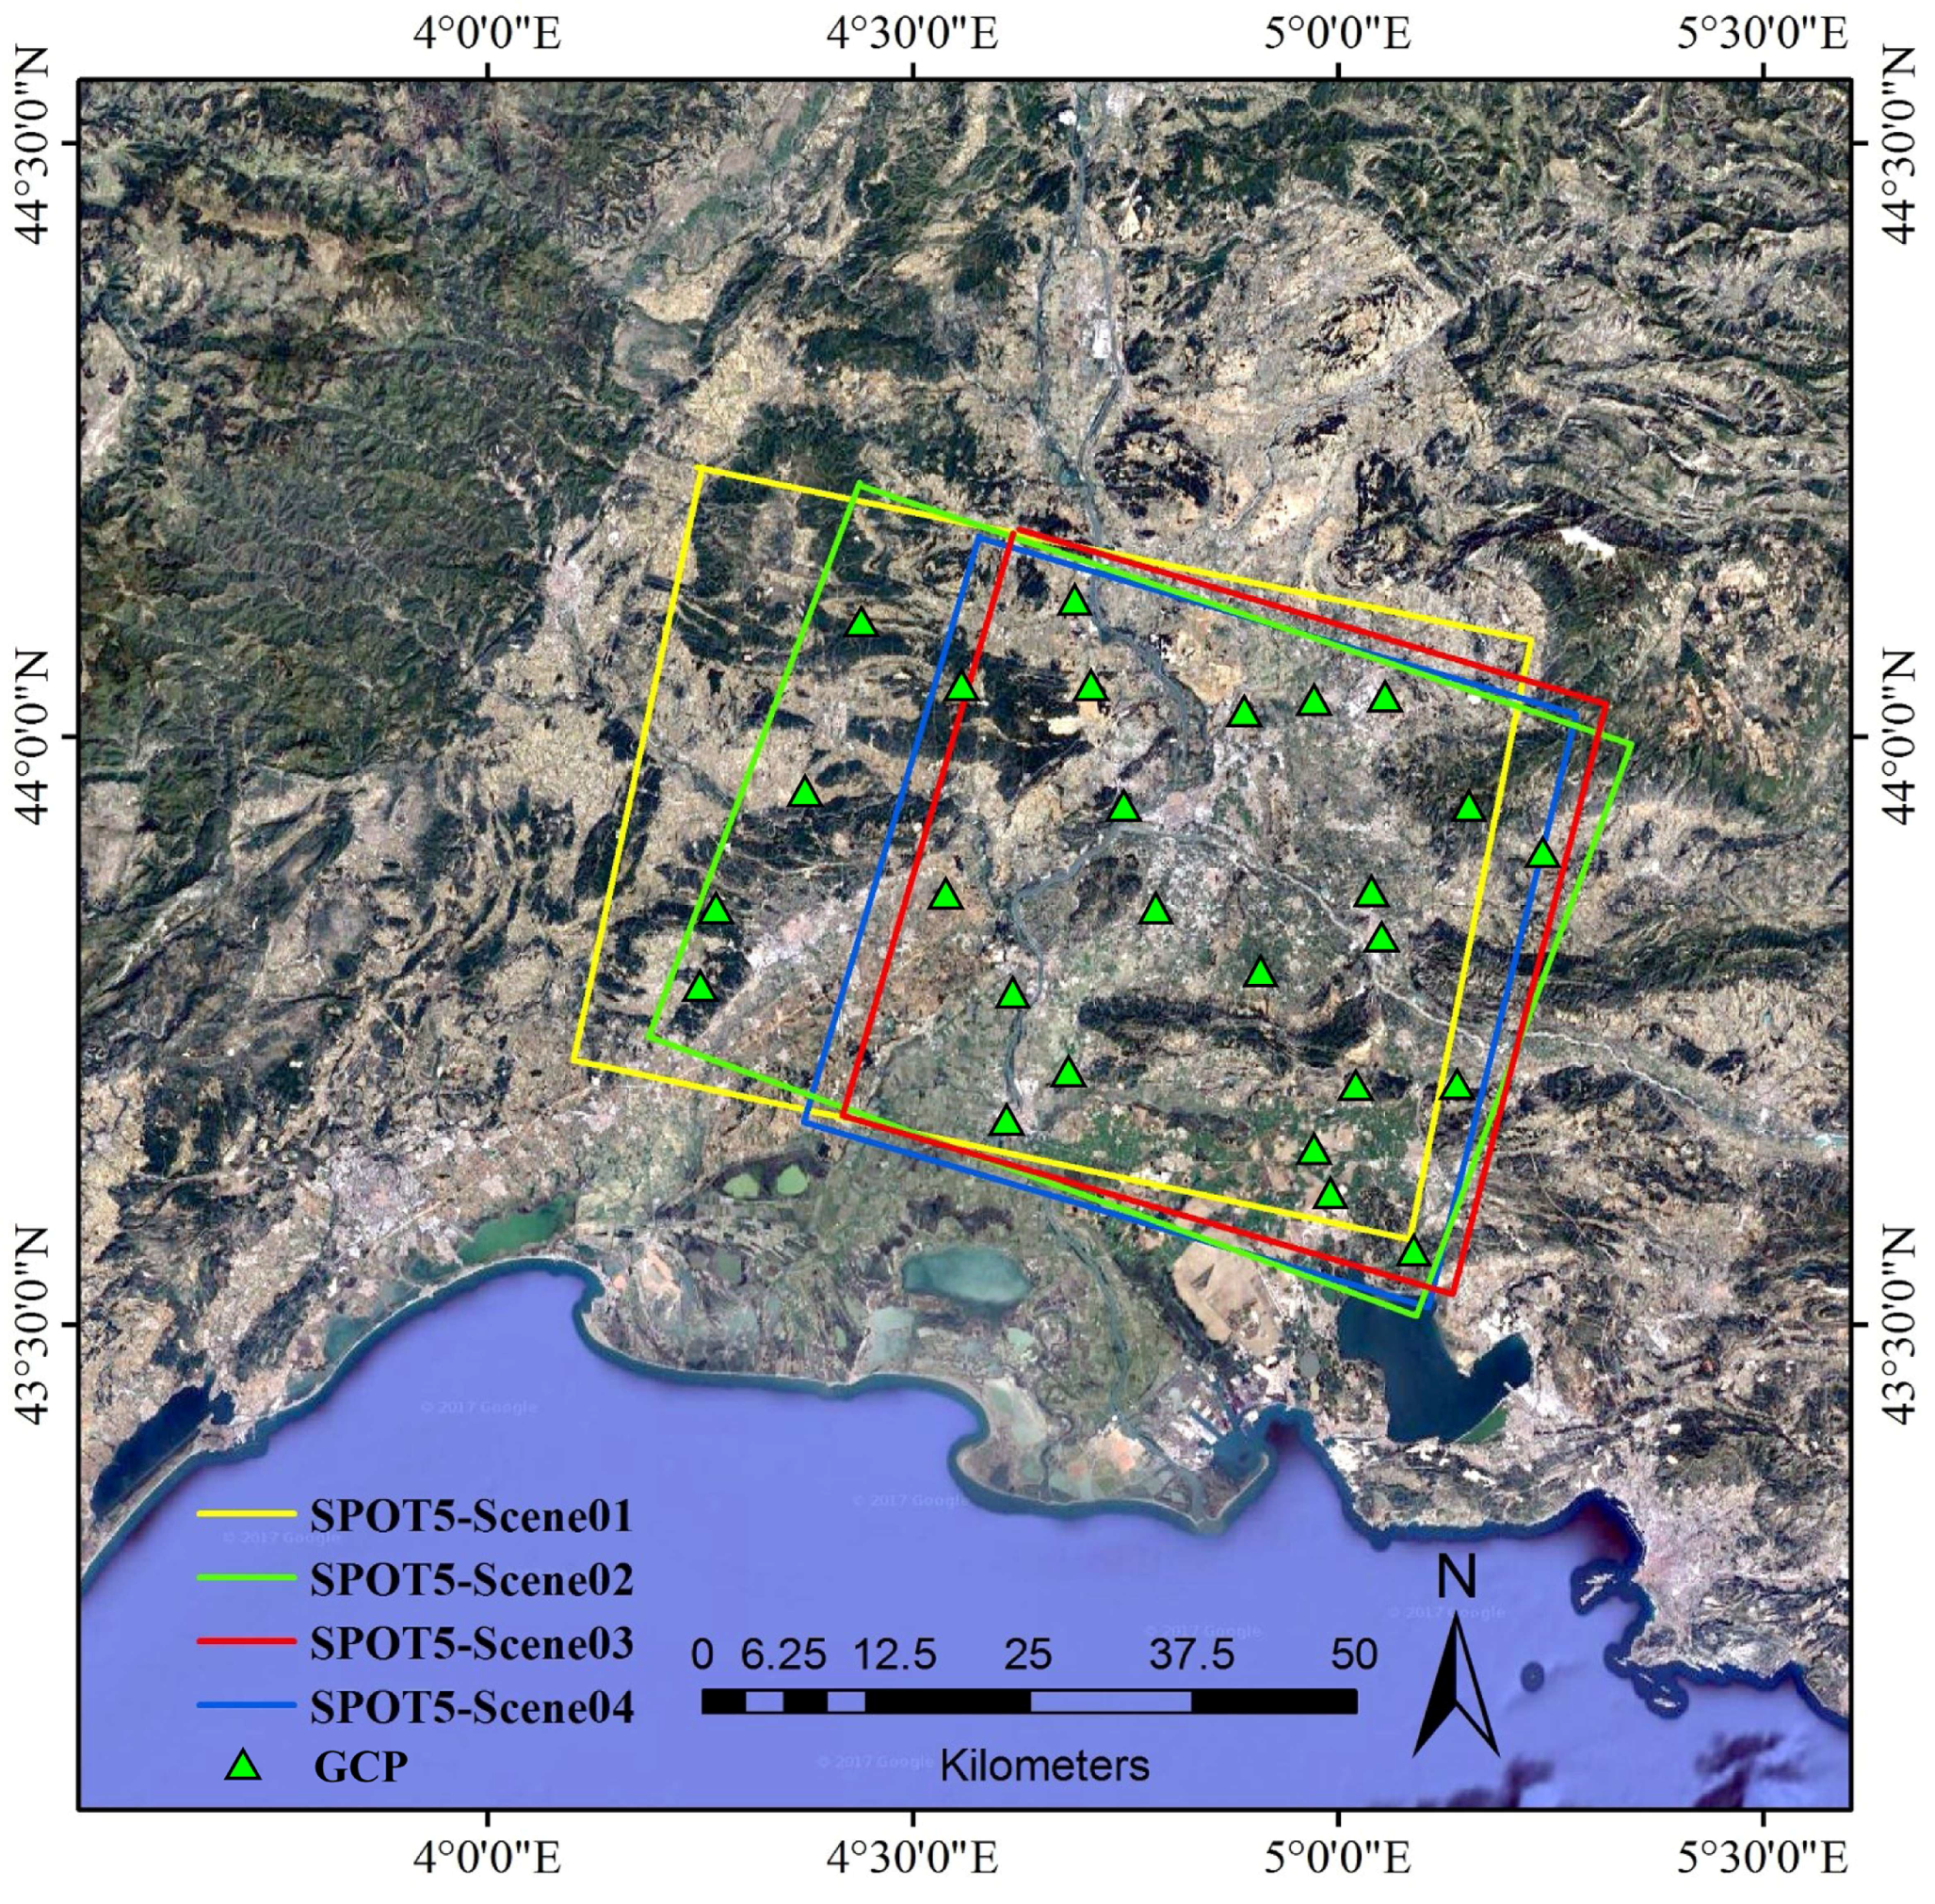
Figure 3.
The extents of the nine TH-1 images in China and the GCPs distribution (The background map is downloaded from the Google Maps).
Figure 3.
The extents of the nine TH-1 images in China and the GCPs distribution (The background map is downloaded from the Google Maps).
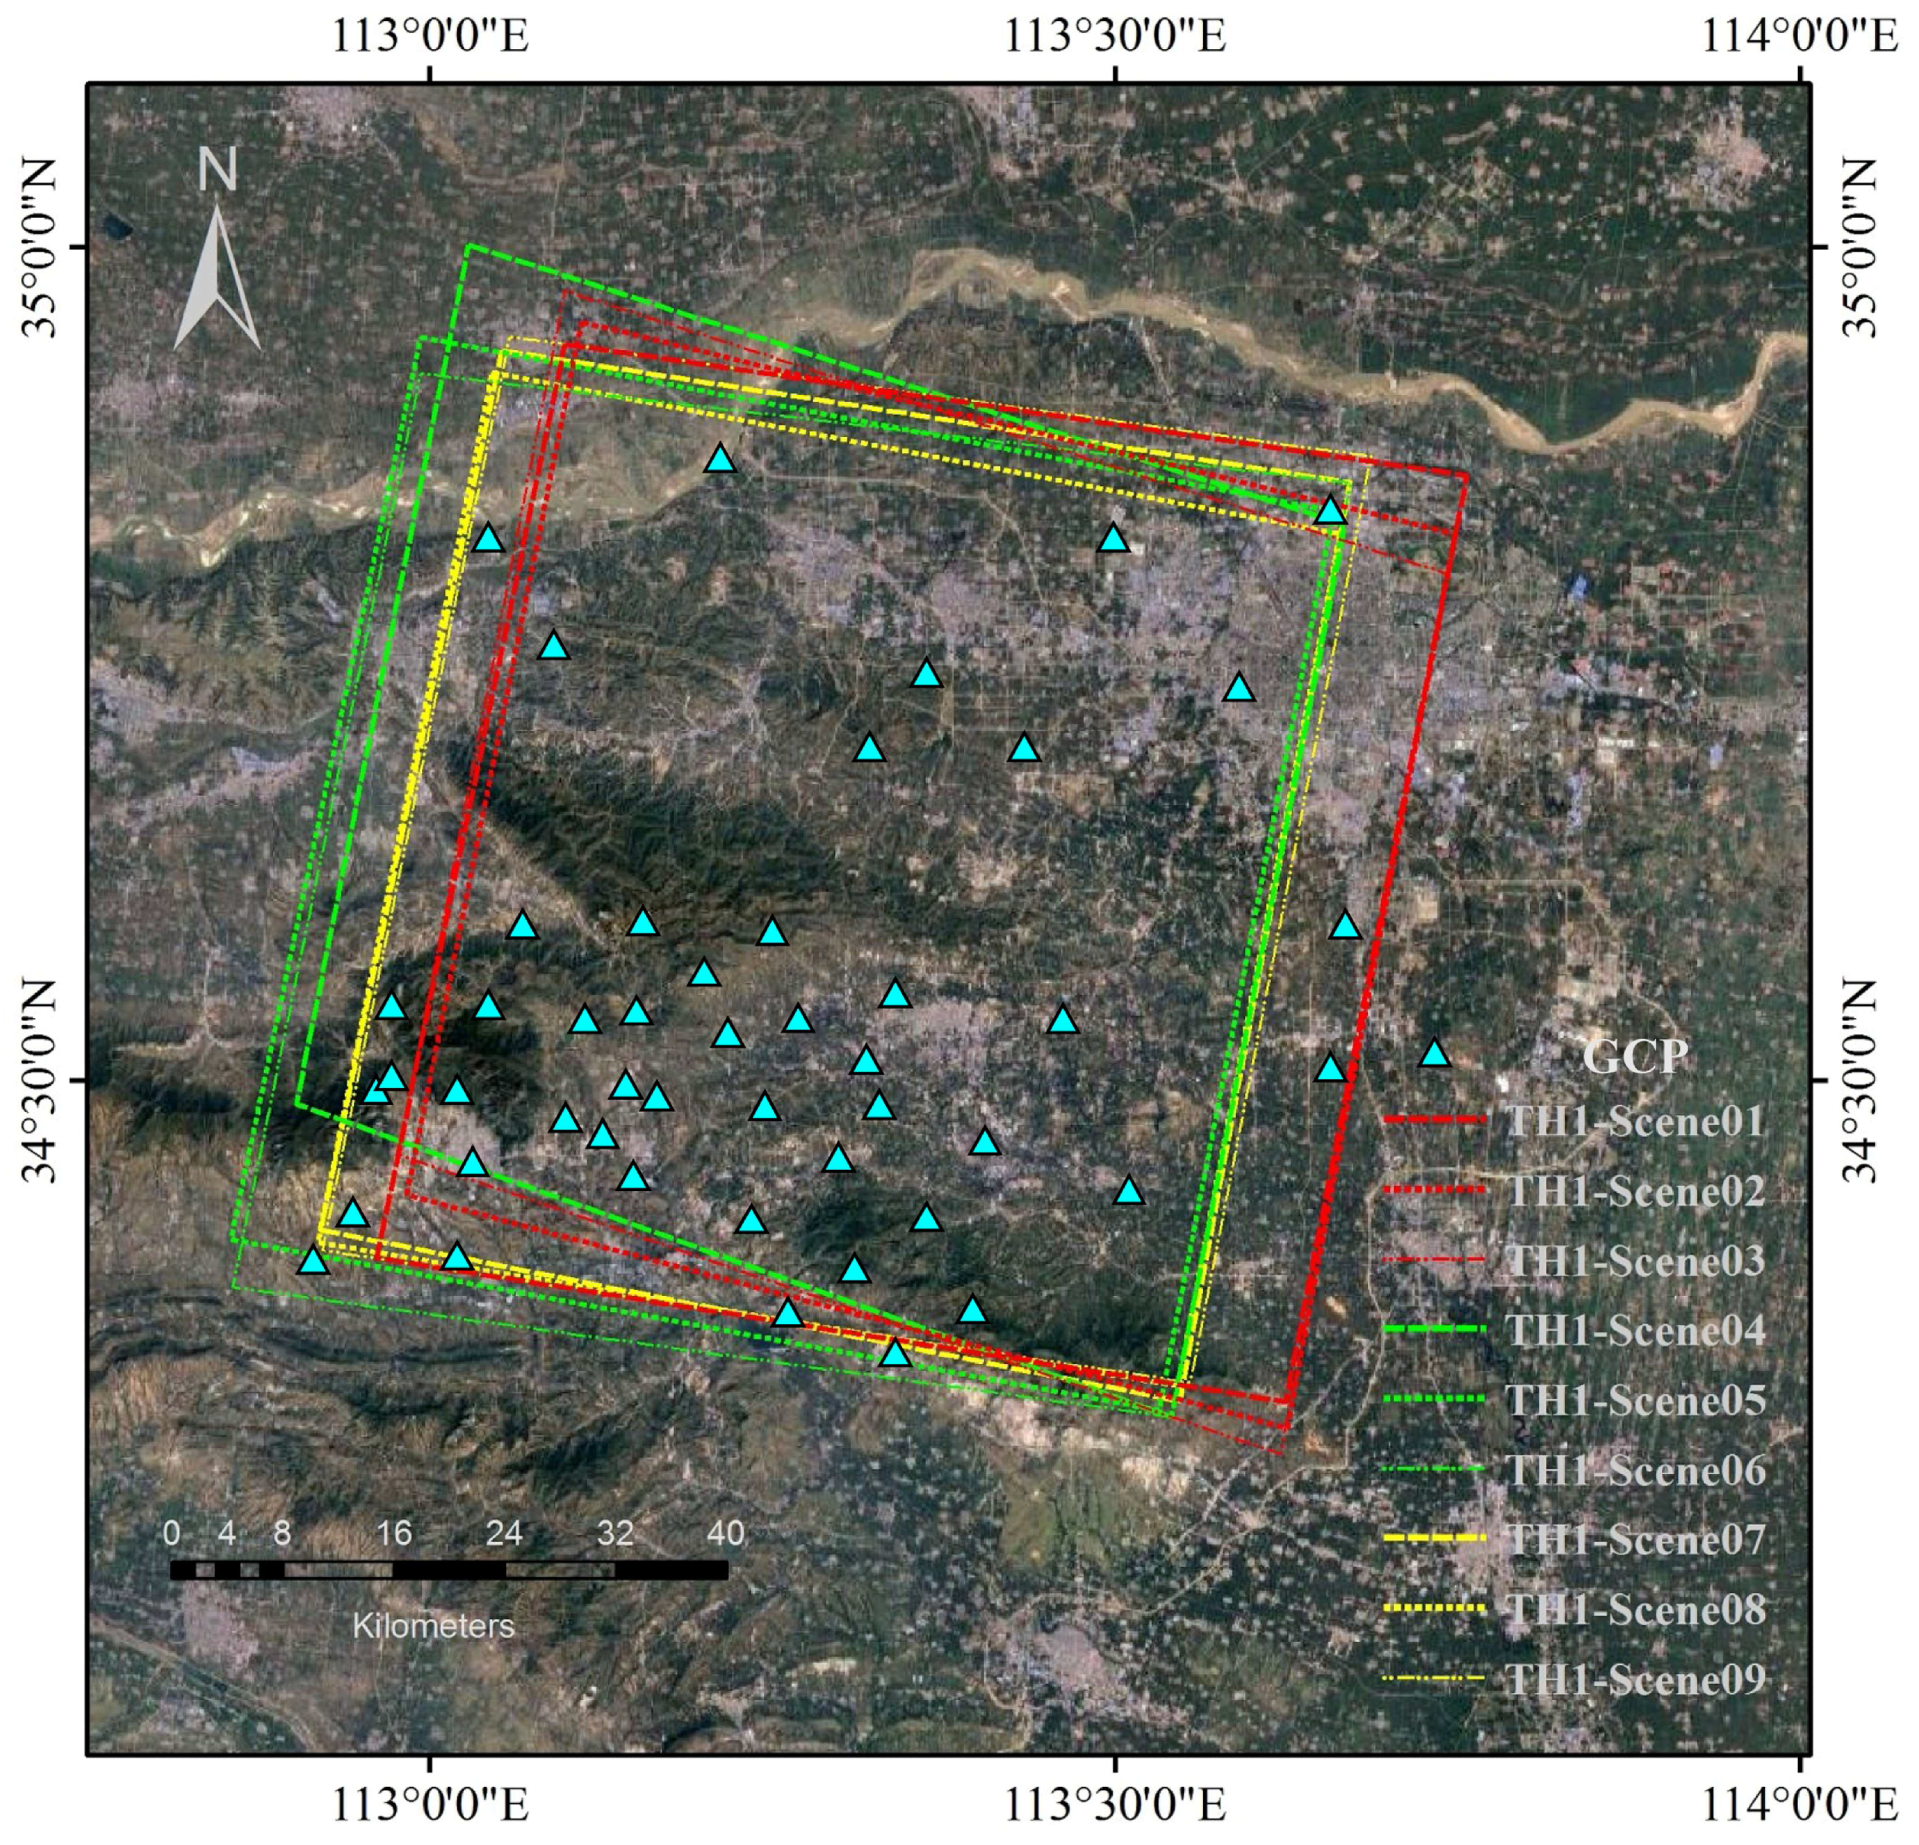
Figure 4.
The extents of 6 IKONOS images in Australia and the GCPs distribution (The background map is downloaded from the Google Maps).
Figure 4.
The extents of 6 IKONOS images in Australia and the GCPs distribution (The background map is downloaded from the Google Maps).

Table 1.
Information of four SPOT-5 images.
| Image | Acquisition Date | Resolution (m) | Image Size (Pixels) | Viewing Angle () |
|---|---|---|---|---|
| SPOT5-Scene01 | 15 August 2002 | 5 × 10 | 12,000 × 12,000 | 26.65 |
| SPOT5-Scene02 | 18 August 2002 | 5 × 10 | 12,000 × 12,000 | 26.13 |
| SPOT5-Scene03 | 14 August 2004 | 10 | 6000 × 6000 | 1.72 |
| SPOT5-Scene04 | 19 July 2002 | 2.5 | 24,000 × 24,000 | 1.85 |
Table 2.
Accuracies for SPOT5-Scene01 and SPOT5-Scene02 using the RFM based methods and the physical model based methods.
Table 2.
Accuracies for SPOT5-Scene01 and SPOT5-Scene02 using the RFM based methods and the physical model based methods.
| Test | RFM Based Geo-Positioning Accuracy (RMSE in Meters) | Physical Model Based Geo-Positioning Accuracy (RMSE in Meters) [9] | ||
|---|---|---|---|---|
| Horizontal | Vertical | Horizontal | Vertical | |
| Test A: the direct intersection method | 48.16 | 21.46 | 44.33 | 15.41 |
| Test B: the block adjustment method with GCPs | 7.91 | 3.12 | 7.45 | 3.38 |
| Test C: the proposed method using orientated SPOT5-Scene03 | 43.83 | 23.25 | 33.89 | 9.08 |
| Test D: the proposed method using orientated SPOT5-Scene04 | 15.80 | 19.65 | 22.71 | 8.95 |
| Test E: the proposed method using orientated SPOT5-Scene03 and SPOT5-Scene04 | 8.74 | 22.83 | 22.08 | 8.91 |
Table 3.
Accuracies for SPOT5-Scene01 and SPOT5-Scene03 using the RFM based methods and the physical model based methods.
Table 3.
Accuracies for SPOT5-Scene01 and SPOT5-Scene03 using the RFM based methods and the physical model based methods.
| Test | RFM Based Geo-Positioning Accuracy (RMSE in Meters) | Physical Model Based Geo-Positioning Accuracy (RMSE in Meters) [9] | ||
|---|---|---|---|---|
| Horizontal | Vertical | Horizontal | Vertical | |
| Test A: the direct intersection method | 69.42 | 35.93 | 48.32 | 28.15 |
| Test B: the block adjustment method with GCPs | 10.42 | 6.29 | 13.61 | 6.30 |
| Test C: the proposed method using orientated SPOT5-Scene02 | 19.57 | 23.91 | 23.29 | 11.74 |
| Test D: the proposed method using orientated SPOT5-Scene04 | 8.20 | 57.73 | 28.30 | 22.98 |
| Test E: the proposed method using orientated SPOT5-Scene02 and SPOT5-Scene04 | 8.20 | 4.74 | 7.76 | 4.49 |
Table 4.
Information of nine TH-1 images.
| Set | Image | Acquisition Date and Time | Viewing Direction | Resolution (m) | Image Size (Pixels) |
|---|---|---|---|---|---|
| TH1-Scene01 | 27 March 2013 14:10:10.589460 | Forward-looking | |||
| 1 | TH1-Scene02 | 27 March 2013 14:10:44.181070 | Nadir-looking | 5 | 12,000 × 12,000 |
| TH1-Scene03 | 27 March 2013 14:11:17.515107 | Backward-looking | |||
| TH1-Scene04 | 15 June 2013 14:16:52.561600 | Forward-looking | |||
| 2 | TH1-Scene05 | 15 June 2013 14:17:26.523569 | Nadir-looking | 5 | 12,000 × 12,000 |
| TH1-Scene06 | 15 June 2013 14:18:00.743533 | Backward-looking | |||
| TH1-Scene07 | 30 August 2013 14:14:01.525574 | Forward-looking | |||
| 3 | TH1-Scene08 | 30 August 2013 14:14:34.374359 | Nadir-looking | 5 | 12,000 × 12,000 |
| TH1-Scene09 | 30 August 2013 14:15:07.313879 | Backward-looking |
Table 5.
Accuracies for TH1-Scene01, TH1-Scene02 and TH1-Scene03 with traditional methods and the RFM method.
Table 5.
Accuracies for TH1-Scene01, TH1-Scene02 and TH1-Scene03 with traditional methods and the RFM method.
| Test | The First Test Group: Traditional Methods | The Second Test Group: The RFM Method Using the Orientated Images Taken from the Second Image Set | The Third Test Group: The RFM Method Using the Orientated Images Taken from the Second and and Third Image Sets | ||||||
|---|---|---|---|---|---|---|---|---|---|
| Test A | Test B | Test A | Test B | Test C | Test D | Test A | Test B | Test C | |
| Horizontal (m) | 9.27 | 3.23 | 3.11 | 3.37 | 3.26 | 3.17 | 2.37 | 2.56 | 3.05 |
| Vertical (m) | 5.88 | 3.29 | 4.70 | 3.69 | 4.61 | 3.77 | 3.06 | 3.12 | 2.60 |
Table 6.
Information of six IKONOS images.
| Image | Acquisition Date and Time | Sensor Azimuth () | Resolution (m) | Image Size (Pixels) |
|---|---|---|---|---|
| IKONOS-Scene01 | 22 February 2003 00:27:24.8 | 293.7 | ||
| IKONOS-Scene02 | 22 February 2003 00:27:03.8 | 329.4 | 1 | 12,124 × 13,148 |
| IKONOS-Scene03 | 22 February 2003 00:27:54.3 | 235.7 | ||
| IKONOS-Scene04 | 22 February 2003 00:27:24.8 | 293.7 | ||
| IKONOS-Scene05 | 22 February 2003 00:27:03.8 | 329.4 | 4 | 3031 × 3287 |
| IKONOS-Scene06 | 22 February 2003 00:27:54.3 | 235.7 |
Table 7.
Accuracies for IKONOS-Scene05 and IKONOS-Scene06 with traditional methods and the RFM method.
Table 7.
Accuracies for IKONOS-Scene05 and IKONOS-Scene06 with traditional methods and the RFM method.
| Test | The Traditional Methods | The RFM Method Using the Orientated Images | ||||
|---|---|---|---|---|---|---|
| Test A | Test B | Test C | Test D | Test E | Test F | |
| Horizontal (m) | 3.67 | 3.03 | 2.30 | 0.84 | 0.69 | 0.74 |
| Vertical (m) | 4.54 | 3.28 | 5.65 | 1.68 | 0.63 | 0.62 |
Table 8.
Accuracies for IKONOS-Scene04 and IKONOS -Scene05 with traditional methods and the RFM method.
Table 8.
Accuracies for IKONOS-Scene04 and IKONOS -Scene05 with traditional methods and the RFM method.
| Test | The Traditional Methods | The RFM Method Using the Orientated Images | |||||
|---|---|---|---|---|---|---|---|
| Test A | Test B | Test C | Test D | Test E | Test F | Test G | |
| Horizontal (m) | 9.66 | 4.41 | 2.21 | 0.93 | 0.93 | 0.71 | 0.76 |
| Vertical (m) | 12.27 | 9.79 | 4.09 | 1.33 | 1.83 | 0.64 | 0.64 |
© 2018 by the authors. Licensee MDPI, Basel, Switzerland. This article is an open access article distributed under the terms and conditions of the Creative Commons Attribution (CC BY) license (http://creativecommons.org/licenses/by/4.0/).
Share and Cite
MDPI and ACS Style
Ma, Z.; Song, W.; Deng, J.; Wang, J.; Cui, C. A Rational Function Model Based Geo-Positioning Method for Satellite Images without Using Ground Control Points. Remote Sens. 2018, 10, 182. https://doi.org/10.3390/rs10020182
AMA Style
Ma Z, Song W, Deng J, Wang J, Cui C. A Rational Function Model Based Geo-Positioning Method for Satellite Images without Using Ground Control Points. Remote Sensing. 2018; 10(2):182. https://doi.org/10.3390/rs10020182
Chicago/Turabian StyleMa, Zhenling, Wei Song, Junping Deng, Jiali Wang, and Cancan Cui. 2018. "A Rational Function Model Based Geo-Positioning Method for Satellite Images without Using Ground Control Points" Remote Sensing 10, no. 2: 182. https://doi.org/10.3390/rs10020182
Note that from the first issue of 2016, this journal uses article numbers instead of page numbers. See further details here.