Accuracy of CHIRPS Satellite-Rainfall Products over Mainland China

1
College of Resources and Environmental Science, Xinjiang University, Urumqi 830046, China
2
State Key Laboratory of Desert and Oasis Ecology, Xinjiang Institute of Ecology and Geography, Chinese Academy of Sciences, Urumqi 830011, China
3
University of Chinese Academy of Sciences, Beijing 100049, China
4
National Meteorological Information Center, Beijing 100081, China
5
State Key Laboratory of Soil Erosion and Dryland Farming on the Loess Plateau, Institute of Soil and Water Conservation, Northwest A&F University, Yangling 712100, China
6
Lanzhou Central Meteorological Observatory, Lanzhou 730020, China
*
Author to whom correspondence should be addressed.
Remote Sens. 2018, 10(3), 362; https://doi.org/10.3390/rs10030362
Submission received: 30 November 2017
/
Revised: 15 February 2018
/
Accepted: 18 February 2018
/
Published: 26 February 2018
Abstract
:Precipitation is the main component of global water cycle. At present, satellite quantitative precipitation estimates (QPEs) are widely applied in the scientific community. However, the evaluations of satellite QPEs have some limitations in terms of the deficiency in observation, evaluation methodology, the selection of time windows for evaluation and short periods for evaluation. The objective of this work is to make some improvements by evaluating the spatio-temporal pattern of the long-terms Climate Hazard Group InfraRed Precipitation Satellite’s (CHIRPS’s) QPEs over mainland China. In this study, we compared the daily precipitation estimates from CHIRPS with 2480 rain gauges across China and gridded observation using several statistical metrics in the long-term period of 1981–2014. The results show that there is significant difference between point evaluation and grid evaluation for CHIRPS. CHIRPS has better performance for a large amount of precipitation than it does for arid and semi-arid land. The change in good performance zones has strong relationship with monsoon’s movement. Therefore, CHIRPS performs better in river basins of southern China and exhibits poor performance in river basins in northwestern and northern China. Moreover, CHIRPS exhibits better in warm season than in Winter, owing to its limited ability to detect snowfall. Nevertheless, CHIRPS is moderately sensitive to the precipitation from typhoon weather systems. The limitations for CHIRPS result from the Tropical Rainfall Measuring Mission (TRMM) 3B42 estimates’ accuracy and valid spatial coverage.
1. Introduction
Precipitation is the main component of the global water cycle. The information of precipitation’s spatio-temporal pattern is a fundamental and crucial parameter for water resources management, natural hazards prevention, and insurance [1,2,3,4]. At present, the observation of precipitation are based on ground rain gauges, weather radar and satellite retrievals. The ground rain gauges and weather radar usually distributed near human settlements. However, the regions in which the ecological environment is vulnerable (e.g., Central Asia, Northern Africa and Tibetan Plateau) are monitored by the sparsely distributed weather observation networks [5,6]. Therefore, the satellite retrieval precipitation estimates could solve the scarcity of traditional precipitation observation in widespread remotely ungauged regions.
In 1997, the Tropical Rainfall Measuring Mission (TRMM) became the first professional precipitation detection program. Subsequently, a series of TRMM satellite precipitation retrieval algorithms have made kinds of quantitative precipitation estimates (QPEs), such as TRMM Multi-satellite Precipitation Analysis (TMPA) [7], Climate Prediction Center morphing technique (CMORPH) [8], Precipitation Estimation from Remotely Sensed Information using Artificial Neural Networks (PERSIANN) [9], and Global Satellite Mapping of Precipitation (GsMaP) [10]. In China, China Meteorological Administration (CMA) has undertaken several operational real-time precipitation production, such as blended CMORPH precipitation [11], precipitation based on Fengyun–2 geostationary satellite (http://data.cma.cn/data/online.html?t=6), and East Asian multi-satellite integrated precipitation (EMSIP) [12]. In 2014, the Global Precipitation Measurement (GPM) mission began to replace TRMM program and became the next-generation global precipitation observation system [13].
These satellite’s QPE mentioned above have been evaluated on multiple spatial and temporal scales in mainland China. The comparison among TRMM, GsMaP and CMORPH QPEs shows that CMORPH has better performance than GsMaP and PERSIANN over China, yet GSMaP_Gauge QPE produces better fractional coverage than TRMM, CMORPH and PERSIANN [14]. The GPM exhibits poor performance in Winter and low accuracy in northwestern China [15]. In northwestern China, CMORPH and PERSIANN have low ability of detecting the precipitation than TRMM series [16]. In the Tibet Plateau, TRMM 3B42 and CMORPH perform better than the TRMM 3B42RT and PERSIANN products [17]. Moreover, the TRMM 3B42 product performs better in daily precipitation probability distributions than CMORPH [18]. In the Yangtze River Basin, TRMM 3B42 V7 is basically superior to CMORPH and PERSIANN [19,20]. TRMM 3B42 V7 is also better than TRMM 3B42RT in Yellow River Basin, which is on the northern side of Yangtze River Basin [21]. Although the TRMM 3B42 V7 product has better performance than other satellite’s QPE, the evaluation results are quite distinguishable from different hydrological basins. Therefore, it is necessary to comprehensively evaluate the QPE products in different hydrological basins across China for scientific research and operational practice.
The scientific community has expended significant effort to downscale TRMM QPEs on finer spatial scales [22,23]. With the development of satellite sensors and precipitation retrieval algorithms, these scale problems should be solved. The Climate Hazards Group Infrared Precipitation Satellite (CHIRPS) is a new land-only climatic database for precipitation [24], which has excelled as compared with other QPEs in terms of long-terms series and high spatial resolution (Table 1). It merges three types of information, global climatology, satellite estimates and in situ observations. In addition, its temporal coverage is 1981-present and spatial resolution is higher, up to 0.05°. To date, CHIRPS precipitation production has been evaluated in Brazil [25], Cyprus [26], Nepal [27], Italy [28], Mozambique [29], and Vietnam’s Mekong River Basin [30]. The results show that CHIRPS can consistency with ground gauges. However, the CHIRPS’ reliability has not been ever analyzed in detail in the complex terrains of China.
In previous studies, it has been found that high-resolution QPEs, with a spatial resolution higher than 0.10°, has been evaluated on a regional scale with a 0.25° gridded observation [14,15,31,32]. The evaluation method can capture the climatological pattern of QPEs ignoring the regional precipitation’s spatial characteristics, which cannot validate high-resolution QPEs objectively. In western China or Central Asia, a mass of grids in 0.25° gridded observation covers no more than one station, when compared to three to ten stations in eastern China. This means that the gridded evaluation has great uncertainties and errors. Therefore, the point validation using high density of rain gauge networks in these area is relatively reasonable [33,34,35,36] for regional QPE evaluation, especially for high-resolution QPEs. Second, the categorical statistical indices are commonly used in quantitative validation with different rainfall intensity (e.g., light rain (<1 mm/day) and moderate rain (10 mm/day < precipitation ≤ 24.9 mm/day)) in some studies [32,17]. When precipitation is close to bin boundary, as both of 0.9 and 1.1 mm/day are close to 1 mm/day, the precipitation is binned into two classes. However, these precipitation intensities are almost the same even ignoring the observed errors (e.g., those of the rain gauge instrument and those from wind effects). Therefore, this binning method results in evaluations with significant uncertainties. Thus, the traditional statistical metrics, e.g., bias, integrated with categorical statistical indices would give insight into both categorical information and bias on precipitation. Third, the previous evaluations usually chose time windows on inter-annual and seasonal scales for their reliability on climatological patterns. Hence, these evaluations are not reliable for extreme precipitation events (e.g., floods, typhoons, and snowstorms), which limits the application for real-time operation. Finally, the previous evaluations have been done in short periods (usually less than 10 yrs) [33,37], which would be effected by different satellite sensors [15,38] and different satellite precipitation retrieval algorithms [39,40]. Hence, these evaluations lack robustness and stability.
The objective of this work is to evaluate the spatio-temporal pattern of CHIRPS QPEs over mainland China and to find the potential hydro-meteorological applications. In this study, high-density rain gauges network, which contains 2480 rain gauges across mainland China, and the component bias method are employed to evaluate the long-term CHIRPS QPEs during 1981–2014. In addition, the typical precipitation cases in Summer and Winter are analyzed to test the capture ability of the rain-bearing system’s evolution. This study gives insight into some practical improvements to evaluation of high-resolution satellite QPEs. It is a challenge to perfectly solve the problems mentioned regarding the deficiency in precipitation observation, evaluation methodology, and the selection of time windows for evaluation. This study attempts to give more information on the evaluation of high-resolution satellite’s QPE. The rest of this paper is organized as follows: In Section 2, we introduce the datasets and the evaluation methods. Section 3 contains the analysis of CHIRPS precipitation statistics and typical cases. Section 4 is the discussion about CHIRPS’ error sources and evaluation limitation. In Section 5, we present the key conclusions of the paper.
2. Methodology and Datasets
2.1. Study Area
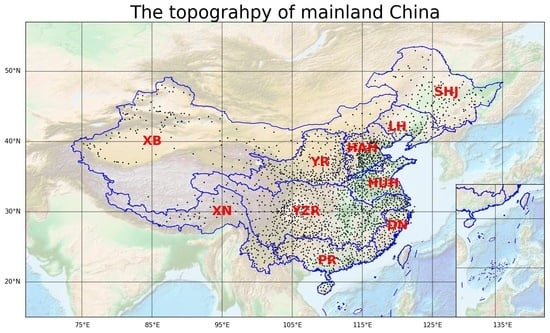
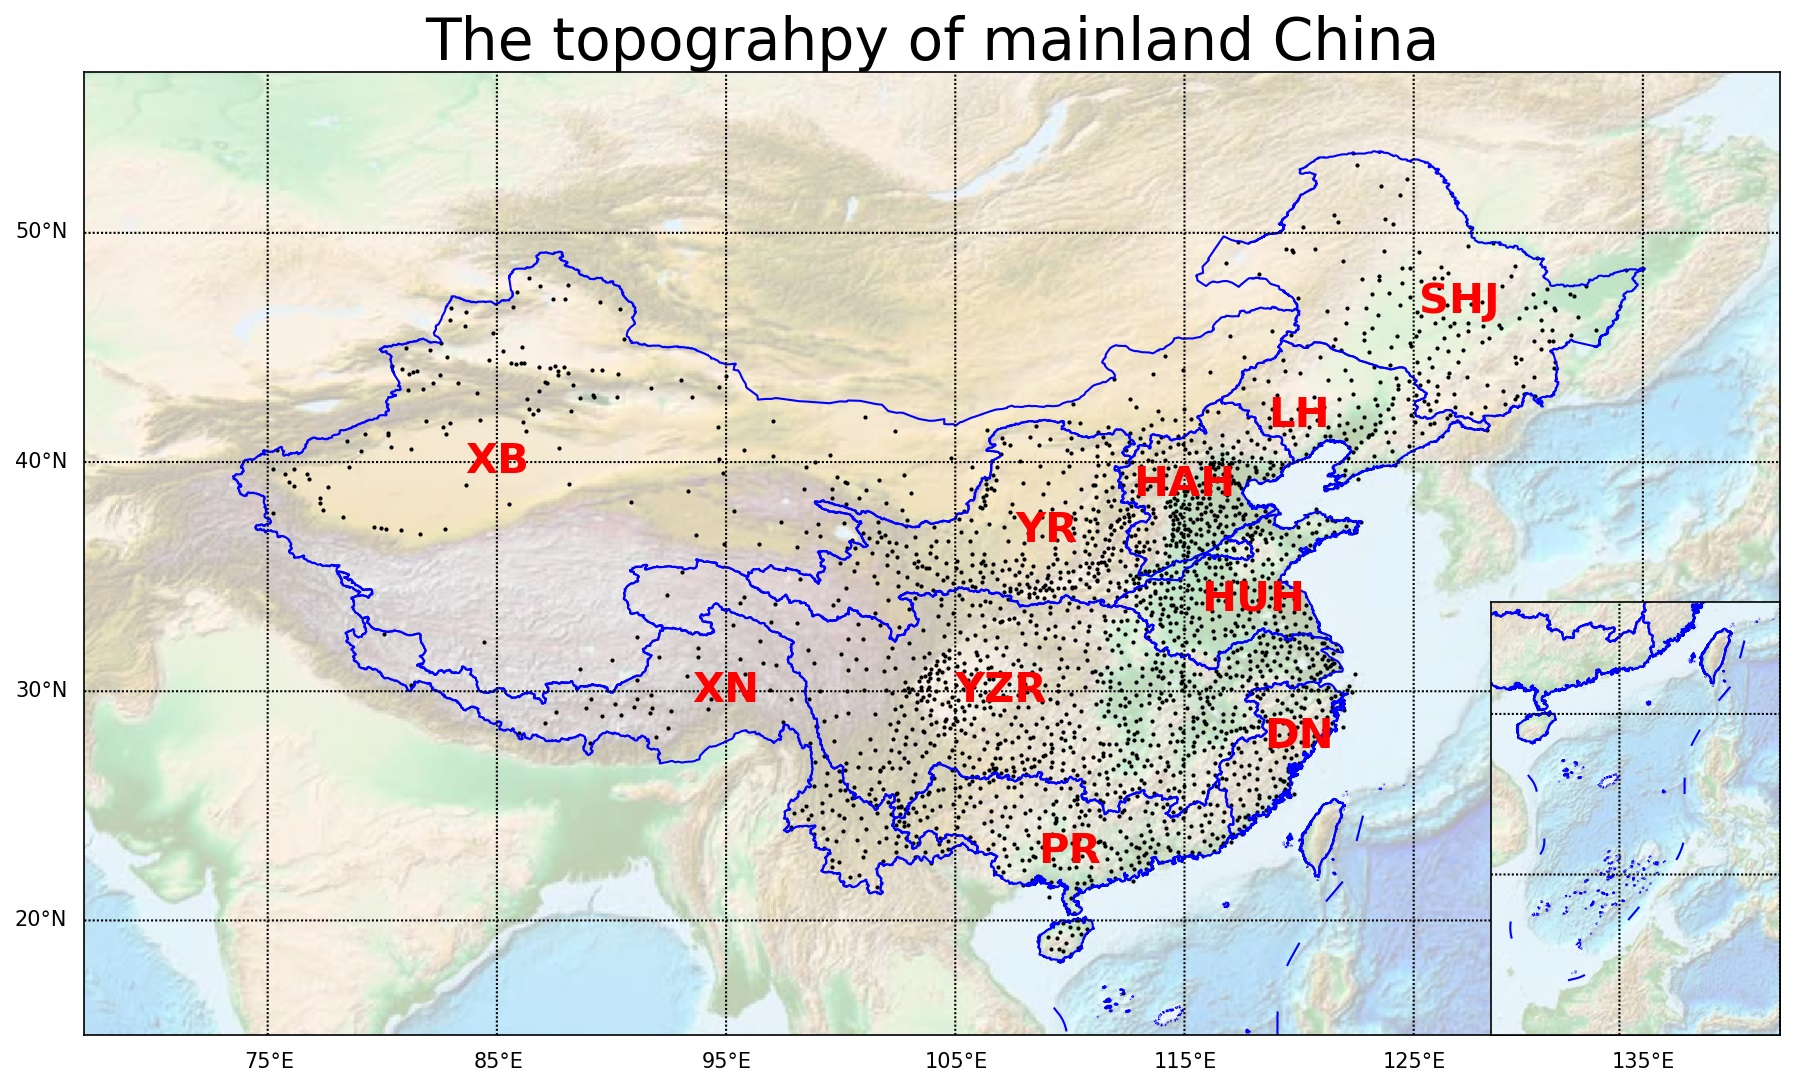
Figure 1 shows the topography of mainland China. Referring to previous studies on hydrologic research in China [41,42], this study uses the hydrologic model SWAT toolbox, Qgis software, and GTOPO30 DEM dataset (https://lta.cr.usgs.gov/GTOPO30) to automatically separate China’s mainland into ten sub-regions. These sub-regions are shown in Figure 1 and are as follows: (I) Songhua River Basin (SHJ), (II) Liaohe River Basin (LH), (III) river basins in northwest China (XB), (IV) Haihe River Basin (HAH), (V) Yellow River Basin (YR), (VI) Yangtze River Basin (YZR), (VII) Huaihe River Basin (HUH), (VIII) River Basins in Southeast China (DN), (IX) river basins in southwest China (XN), and (X) Pearl River Basin (PR). Region XB, contains several famous rivers: the Tarim River, which is the largest inland river in China; the Heihe River, located in the Hexi corridor in northwest China; the Ili River, an international river shared by Kazakhstan and China. Region XN is the origin of the Mekong River that crosses the Indochina Peninsula, which is also an international river that is flowing through other countries in Southeast Asia and China.
Generally, the rainy season in mainland China is affected by East Asian Summer Monsoon. The rainy season begins with the monsoon’s arrival and ends upon the monsoon’s withdrawal [43]. During the rainy season, the typhoons coming from Pacific Ocean usually bring an amount of precipitation to coastal regions. In Winter, the precipitation in northern China is controlled by mid-latitude westerlies, which bring ocean moisture [44]. Therefore, in this study, we choose typhoons and a snowstorm that was induced by westerlies for typical case evaluation.
2.2. Observation and Satellite Retrieval Precipitation Production
Daily rain gauge data were obtained from China Meteorological Administration (CMA), downloaded from http://data.cma.cn. This dataset concludes 2480 rain gauge stations from 1979 to 2014. Excluding the stations that have more than 1 yr. of missing data and does not be covered by CHIRPS, there are 2378 stations left that are consistent with the temporal coverage of CHIRPS. In addition to the point observation, this study collects several gridded precipitation products (e.g., APHRODITE [45], CN05.1 [46], and ITPCAS [47]). According to previous studies, APHRODITE shows smaller precipitation intensity and higher precipitation frequency [48]. ITPCAS uses the open dataset under WMO data sharing framework, which has the same stations as APHRODITE and CHIRPS. Although ITPCAS’s spatial resolution is higher, up to 0.10°, the same rain gauge data will cause higher autocorrelation and will make the evaluation results less objective. In China, meteorological observation follows the WMO standards, in which observation time is Coordinated Universal Time (UTC). The ground precipitation is accumulated from 00:00 UTC (08:00 Beijing Time) of the previous day to 00:00 UTC (08:00 Beijing Time) on the current day. The daily precipitation’s statistical time window is inconsistent with the most of the Global Historical Climatology Network (GHCN) and Global Surface Summary of the Day (GSOD) datasets, which CHIRPS uses.
The CN05.1 dataset was interpolated by more than 2400 stations in China, combined with the spatial pattern of climatological precipitation and DEM data. The rain gauge stations in CN05.1 included the data used in APHRODITE and ITPCAS. Therefore, the CN05.1’s precipitation is chosen for grid evaluation.
CHIRPS used in this study can be downloaded from the University of California, Santa Barbara (USA) website (ftp://chg-ftpout.geog.ucsb.edu/pub/org/chg/products/CHIRPS-2.0/global_daily/). The CHIRPS is produced in several steps. First, in each pentad of 1998–2012, the IR brightness temperature, which cloud top temperature is lower than 235 K, and TRMM 3B42 precipitation is modeled by local regression. Second, in each pentad of 1981–2012, the precipitation anomalies is calculated by IR-retrieved precipitation (IRP) and its long-term means. Third, the anomalies are multiplied with the Climate Hazards Precipitation Climatology (CHPClim) in each pentad. Finally, this adjusted IR-retrieved precipitation is blended with surface gauges to produce the final product, CHIRPS. In some cases, CFSR Reanalysis data is filled data gaps that are missing IRP values due to incomplete satellite coverage. CHIRPS has a horizontal resolution of 0.05° (5.4 km) and spatial coverage (50°S–50°N, 180°W–180°E) [24]. Thus, this study chooses the daily CHIRPS QPE from 1981 to 2014 for reliability assessment, and clips the quasi-global spatial coverage into China mainland domain.
2.3. Methodology for Evaluation
2.3.1. Statistical Metrics
The first and most basic statistical metric considered in this study is the PBias [Equation (1)], which is defined as:
where SPE and GND denote rainfall amounts from CHIRPS and rain gauges, respectively. In China, rain gauge range resolution in the CMA and Ministry of Water Resources is 0.1 and 0.5 mm, respectively. In this study, we use 0.5 mm/day as criterion to distinguish rainy days and non-rainy days. PBias is calculated when the daily SPE and daily GND are greater than 0.5 mm/day in 1981–2014. PBias represents a summary statistic bias over the entire dataset. Other statistical metrics helps us to gain additional insight into the performance accuracy of CHIRPS QPEs, as follows:
The mean error (ME) between CHIRPS and rain gauges data [Equation (2)] is used to assess the difference between CHIRPS and rain gauges. The root-mean-square error (RMSE) between CHIRPS and rain gauges data [Equation (3)] is used to assess the random error in the CHIRPS product. The Pearson correlation coefficient (r) is used to measure the linear correlation between CHIRPS and rain gauge data [Equation (4)].
2.3.2. Evaluation Indices
According to previous work [49], PBias can be decomposed into three parts: Hit PBias (HP), Missed PBias (MP), and False Alarm PBias (FP). Hit PBias shows the difference between CHIRPS precipitation and the ground rain gauge precipitation, when they both detect daily precipitation of over 0.5 mm/day [Equation (5)]. Missed PBias refers to the precipitation detected in the gauge data that is undetected by CHIRPS [Equation (6)]. False Alarm PBias denotes the total amount of falsely detected precipitation by CHIRPS [Equation (7)]. The formulas are
where SPE is CHIRPS’ QPE, and GND is in situ observation. PBias = 0, indicates an unbiased estimation whereas PBias < 0 and PBias > 0 indicate underestimation and overestimation, respectively. The False Alarm PBias (FP) varies from 0 ≤ FP ≤ 1. The indices mean that CHIRPS has precipitation but observation does not. The best score of FP is zero. The Hit PBias (HP) varies from −1 ≤ HP ≤ 1. The best score is zero. The Missed PBias (MP) varies from −1 ≤ MP ≤ 0. The indices mean that CHIRPS has no precipitation but observation does. The best score of MP is zero.
3. Results
3.1. Evaluation of Gridded Observation (CN05.1) with In Situ Point Observation
Figure 2 shows the monthly r between the CN05.1 precipitation and the rain gauges. It shows the number of rain gauge stations in eastern China is higher than those in western China, and the r for all of mainland China experiences significant seasonal change. In the first three months of a year (January–February–March), the r in eastern China is greater than 0.90, as is the r in northwestern China. However, the r in the central China varies in the range 0.40–0.80. The r in coastal areas of southern China begins to decrease from above 0.90 to 0.80–0.90 in April. In May, most regions in southern China exhibit r values of 0.80–0.90. The r in regions of northern China also decreased to 0.80–0.90 in June. In July, the r in northeast and central China decreased. In August, the r in south China decreased to 0.70–0.80. However, the r in south and northeastern China rebounds and increases to values above 0.90. In November and December, the r in central and western China decreased to 0.60, the same spatial pattern repeats in January. Generally, the r’s spatio-temporal change is related to the Eastern Asian Monsoon’s evolution in the course of a year.
Upon the onset of the rainy season, southern China receives a significant amount of precipitation. The precipitation data interpolated from the gridded observation in a 0.25° grid are usually less than that recorded by rain gauges at the same location. Thus, the ME increased and the r decreased. In western China west of 105°E, it is assumed that the gridded precipitation in the mountainous region is extrapolated by DEM using rain gauges in plain regions. Hence, the precipitation value interpolated from the gridded observation in a 0.25° grid are usually smaller than those that were recorded by the rain gauge at the same location. This hypothesis could explain the lower r in western China.
In northern China, ME of CN05.1 in a year is basically in the range 0–0.1 mm/day in contrast to the periodic transition observed in southern China (Figure 3). The ME in southern China indicates that the precipitation is underestimated by −0.4 to −0.1 mm/day. In the rainy season (April-September), the ME in southern China changes by 0.4 to −0.6 mm/day. This means that CN05.1 overestimates precipitation in southern China. Furthermore, it is found that the ME is randomly scattered over mainland China, which is basically due to the method of extrapolation. In the YZR’s downstream, the ME always remains in range −0.2 to −0.1 mm/day. Although 0.25° gridded observation is derived from rain gauges distributed across mainland China, it is in not complete agreement with the spatio-temporal pattern of rain gauges. When using the gridded observation, caution should be exercised when conducting evaluations in areas with high ME, especially in southern China.
Generally, CN05.1 has a high r and low ME over the course of a year. In the rainy season (May–September), the rainfall is underestimated only in southern China. Thus, CN05.1 can be applied to evaluate CHIRPS.
3.2. Evaluation of CHIRPS with the Gridded Observation (CN05.1)
3.2.1. Evaluation on Monthly Scale
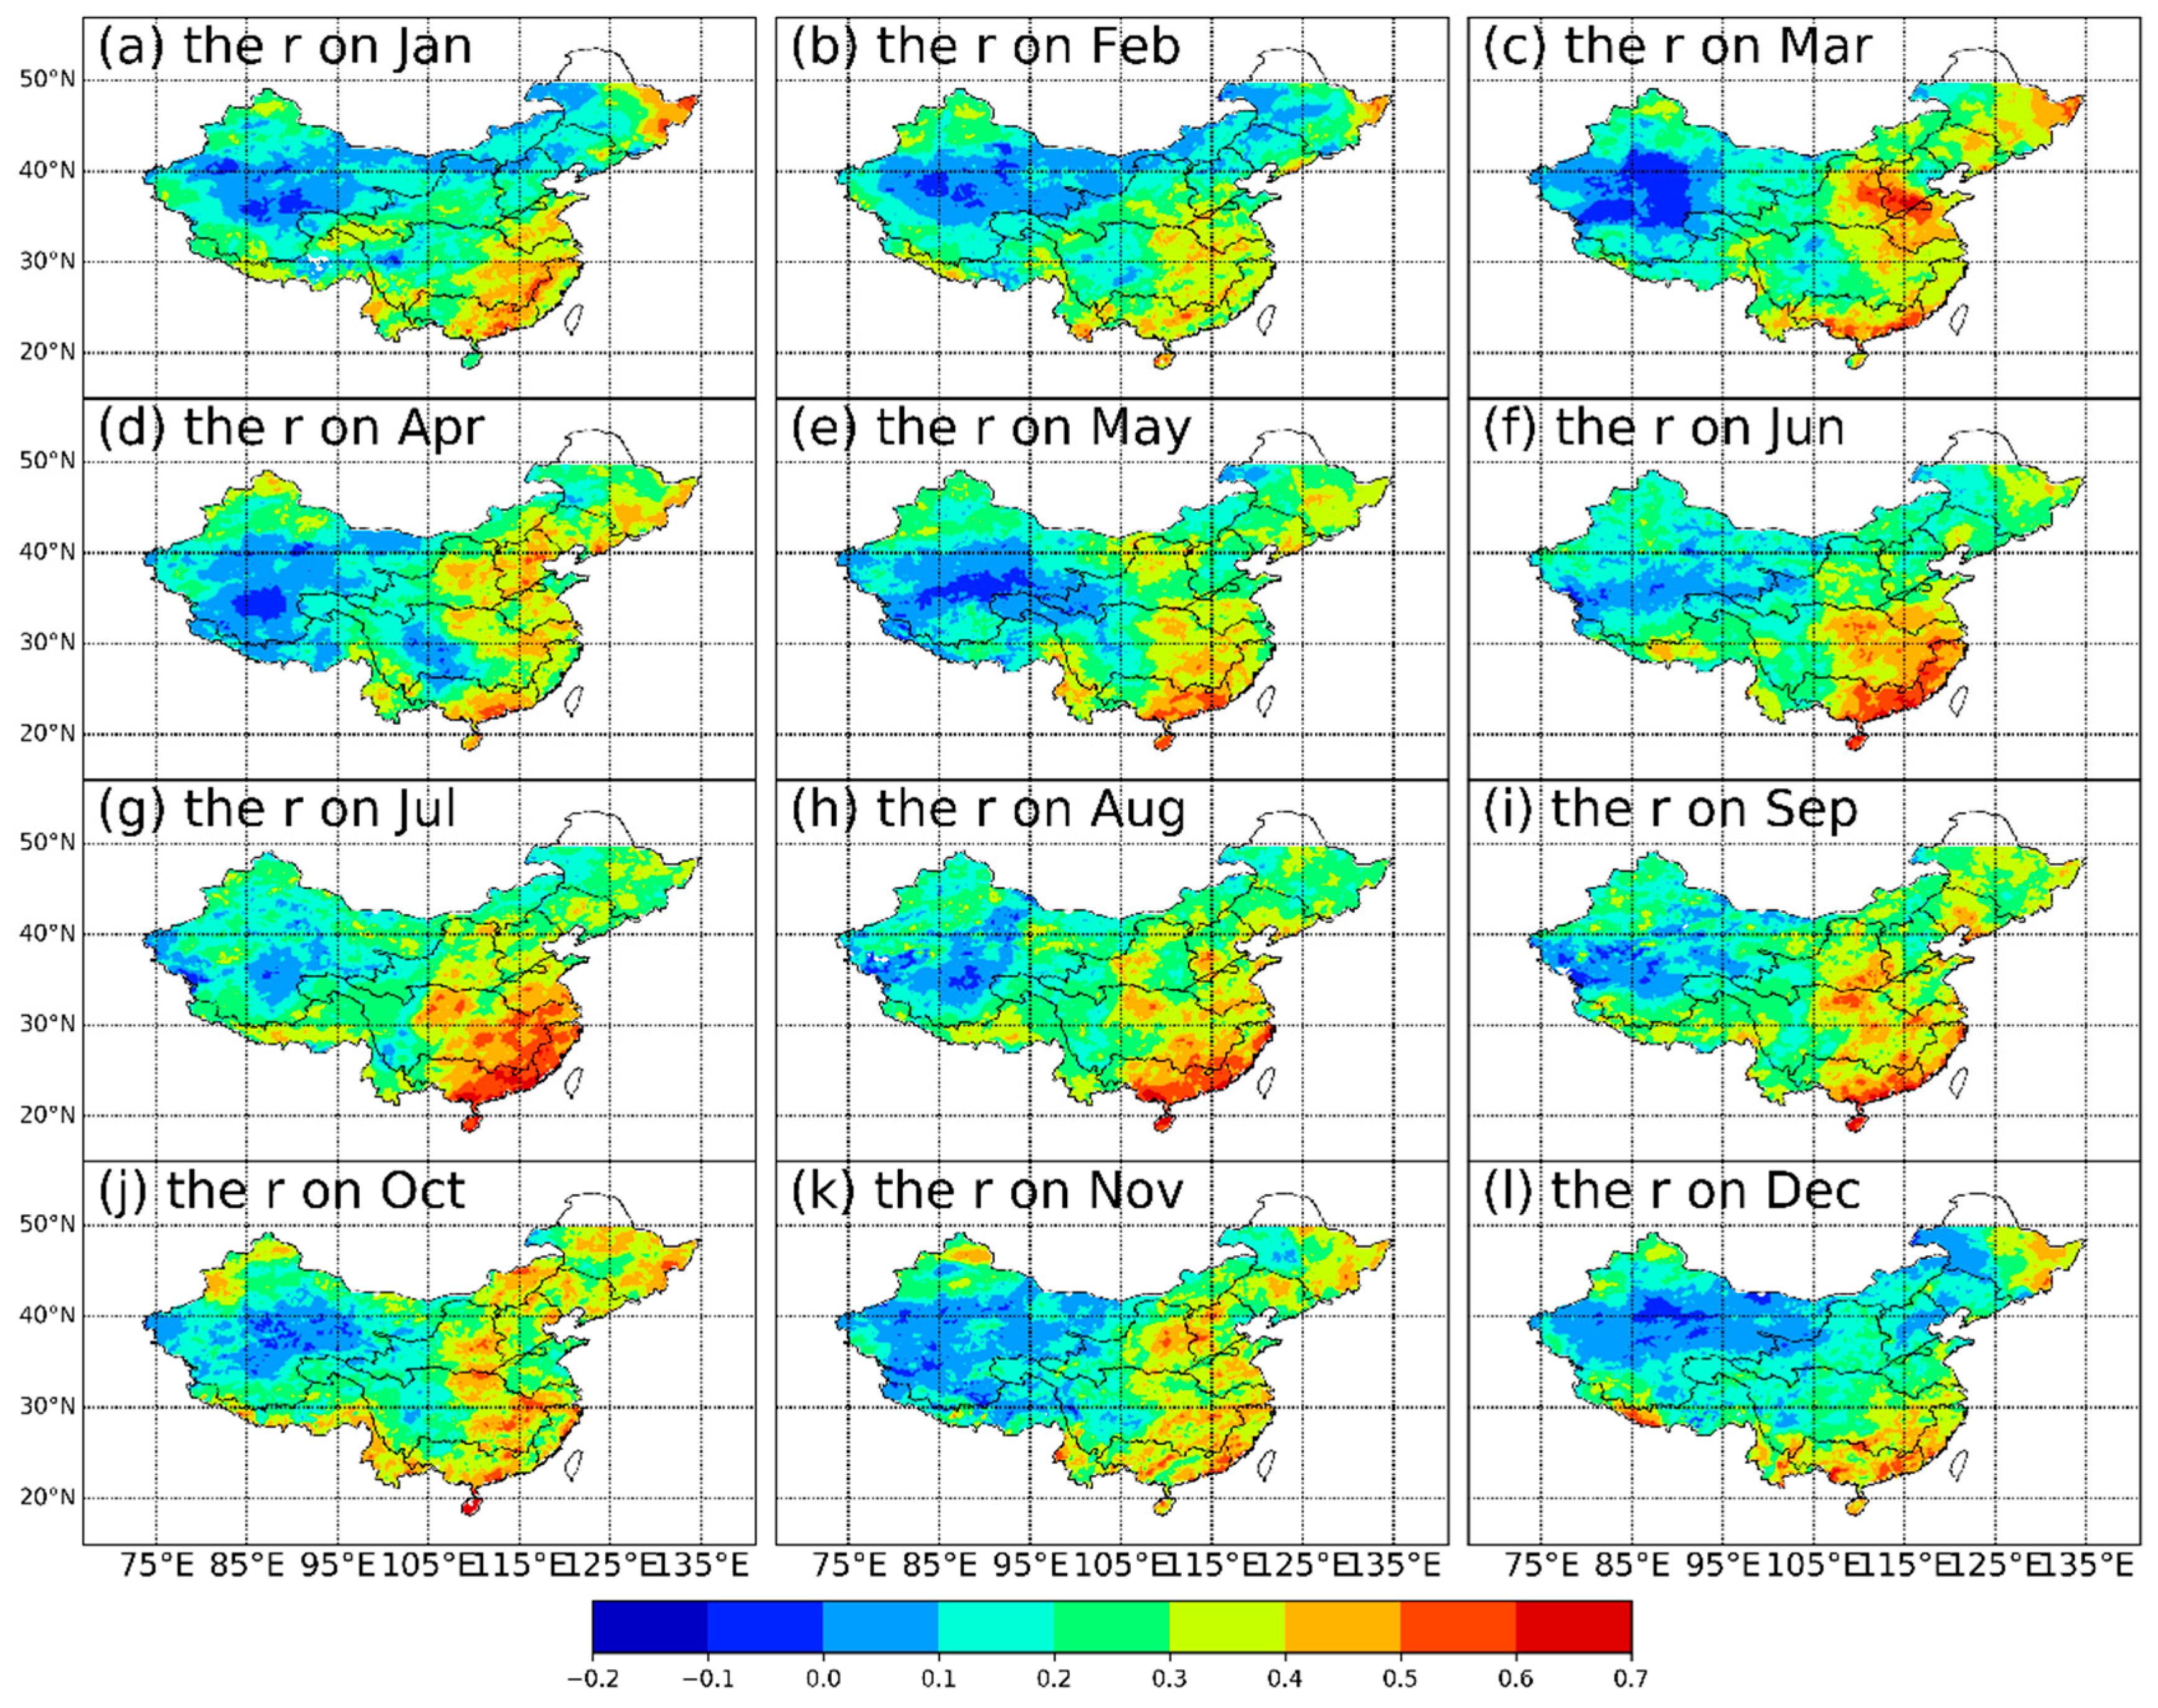
Generally, the r between CHIRPS and CN05.1 in eastern China is higher than that in western China, and the r in southern China is also higher than the r in northern China (Figure 4). The regions in western China exhibit r values in the range 0.10–0.40 while the regions in eastern China exhibit r values of 0.40–0.60. The r values in the consecutive month exhibit a similar evolution pattern on a seasonal scale. The change in seasonal cycle can be classified into four groupings as follows: December-February, March–April, June–July and August–September.
In northwestern China (XB), the r exhibits low value zones, which covers the Taklimakan Desert (85°E, 38°N) and Tengger Desert (103°E, 38°N). This illustrates that CHIRPS exhibits many false alarms and missed hits in these regions. Referring to the evaluation of CMORPH and PERSIANN [14], the same low-r belt zone is in these desert regions. This means that QPEs derived from IR or microwave sensors perform poorly in less rainy regions, not only CHIRPS QPEs.
In Winter, the ME between CHIRPS and CN05.1 is maintained in the range −0.4 to 0.4 mm/day, which is generally positive across mainland China (Figure 5). In January, the ME in the middle part of Pearl River is in the range −0.8 to −0.4 mm/day. In regions of XN, the ME in March and April is below 2 and above 2 mm/day, respectively. In May, when compared to a ME of below 1.8 mm/day in XN, the regions of DN and PR have a ME greater than 1.8 mm/day. In the following June–July–August, the ME in DN and PR show an increasing trend. During the entire rainy season, it is noticed that the southeastern regions of China have strong positive ME, as compared to the significant negative ME in southwestern China, although the CHIRPS QPE is corrected using rain gauges in China. In the following September–October–November, the spatial pattern of high ME in DN and PR decreases. In December, the spatial pattern over all of China is close to that in January. In October-November, the ME in Hainan Island, the southernmost of mainland China, has negative values.
3.2.2. Evaluation of CHIRPS in Sub-Regions
Table 2 gives the r and ME in hydrologic basin units. First, the rank of r on seasonal cycle is, in descending order, Autumn (0.335), Summer (0.325), Spring (0.292) and Winter (0.240). In hydrologic basins, the relatively high values of r for a year are located at DN (0.410) and PR (0.411). The lowest value of r is in XB (0.150). In Summer and Winter, the r in HAH, YR, HUH, DN, and PR exhibits a spatial pattern that indicates that r decreases with increasing latitude. In transition seasons (Spring and Autumn), this spatial pattern still exists, but with small variability. In northeast China, a similar spatial variability occurs in SHJ and LH.
The ME is higher in Summer (0.231 mm/day) and Spring (0.071 mm/day) and lower in Autumn (0.004 mm/day) and Winter (−0.006 mm/day). In hydrologic basins, the ME in LH (0.088 mm/day), DN (0.370 mm/day), XN (0.193 mm/day) and PR (0.115 mm/day) is greater than that in other regions. In Autumn, the ME in HUH (−0.111 mm/day), HAH (−0.092 mm/day), DN (0.204 mm/day) and XN (0.136 mm/day) is much higher than that in other basins. In winter, the ME in SHJ (−0.039 mm/day), LH (0.051 mm/day), HAH (0.013 mm/day) and PR (−0.104 mm/day) is much higher than that in other basins.
Overall, DN and PR exhibit superior values to other basins over the course of a year. In terms of these two basins’ locations, they are in coastal regions and near the tropics. Thus, according to the limitation of the TRMM precipitation retrieval algorithm analyzed above, it could explain that CHIRPS exhibits worse performance in regions of northern China, such as XB, LH and SHJ.
3.3. Evaluation of CHIRPS with In Situ Point Observation
3.3.1. Evaluation on Monthly Scale
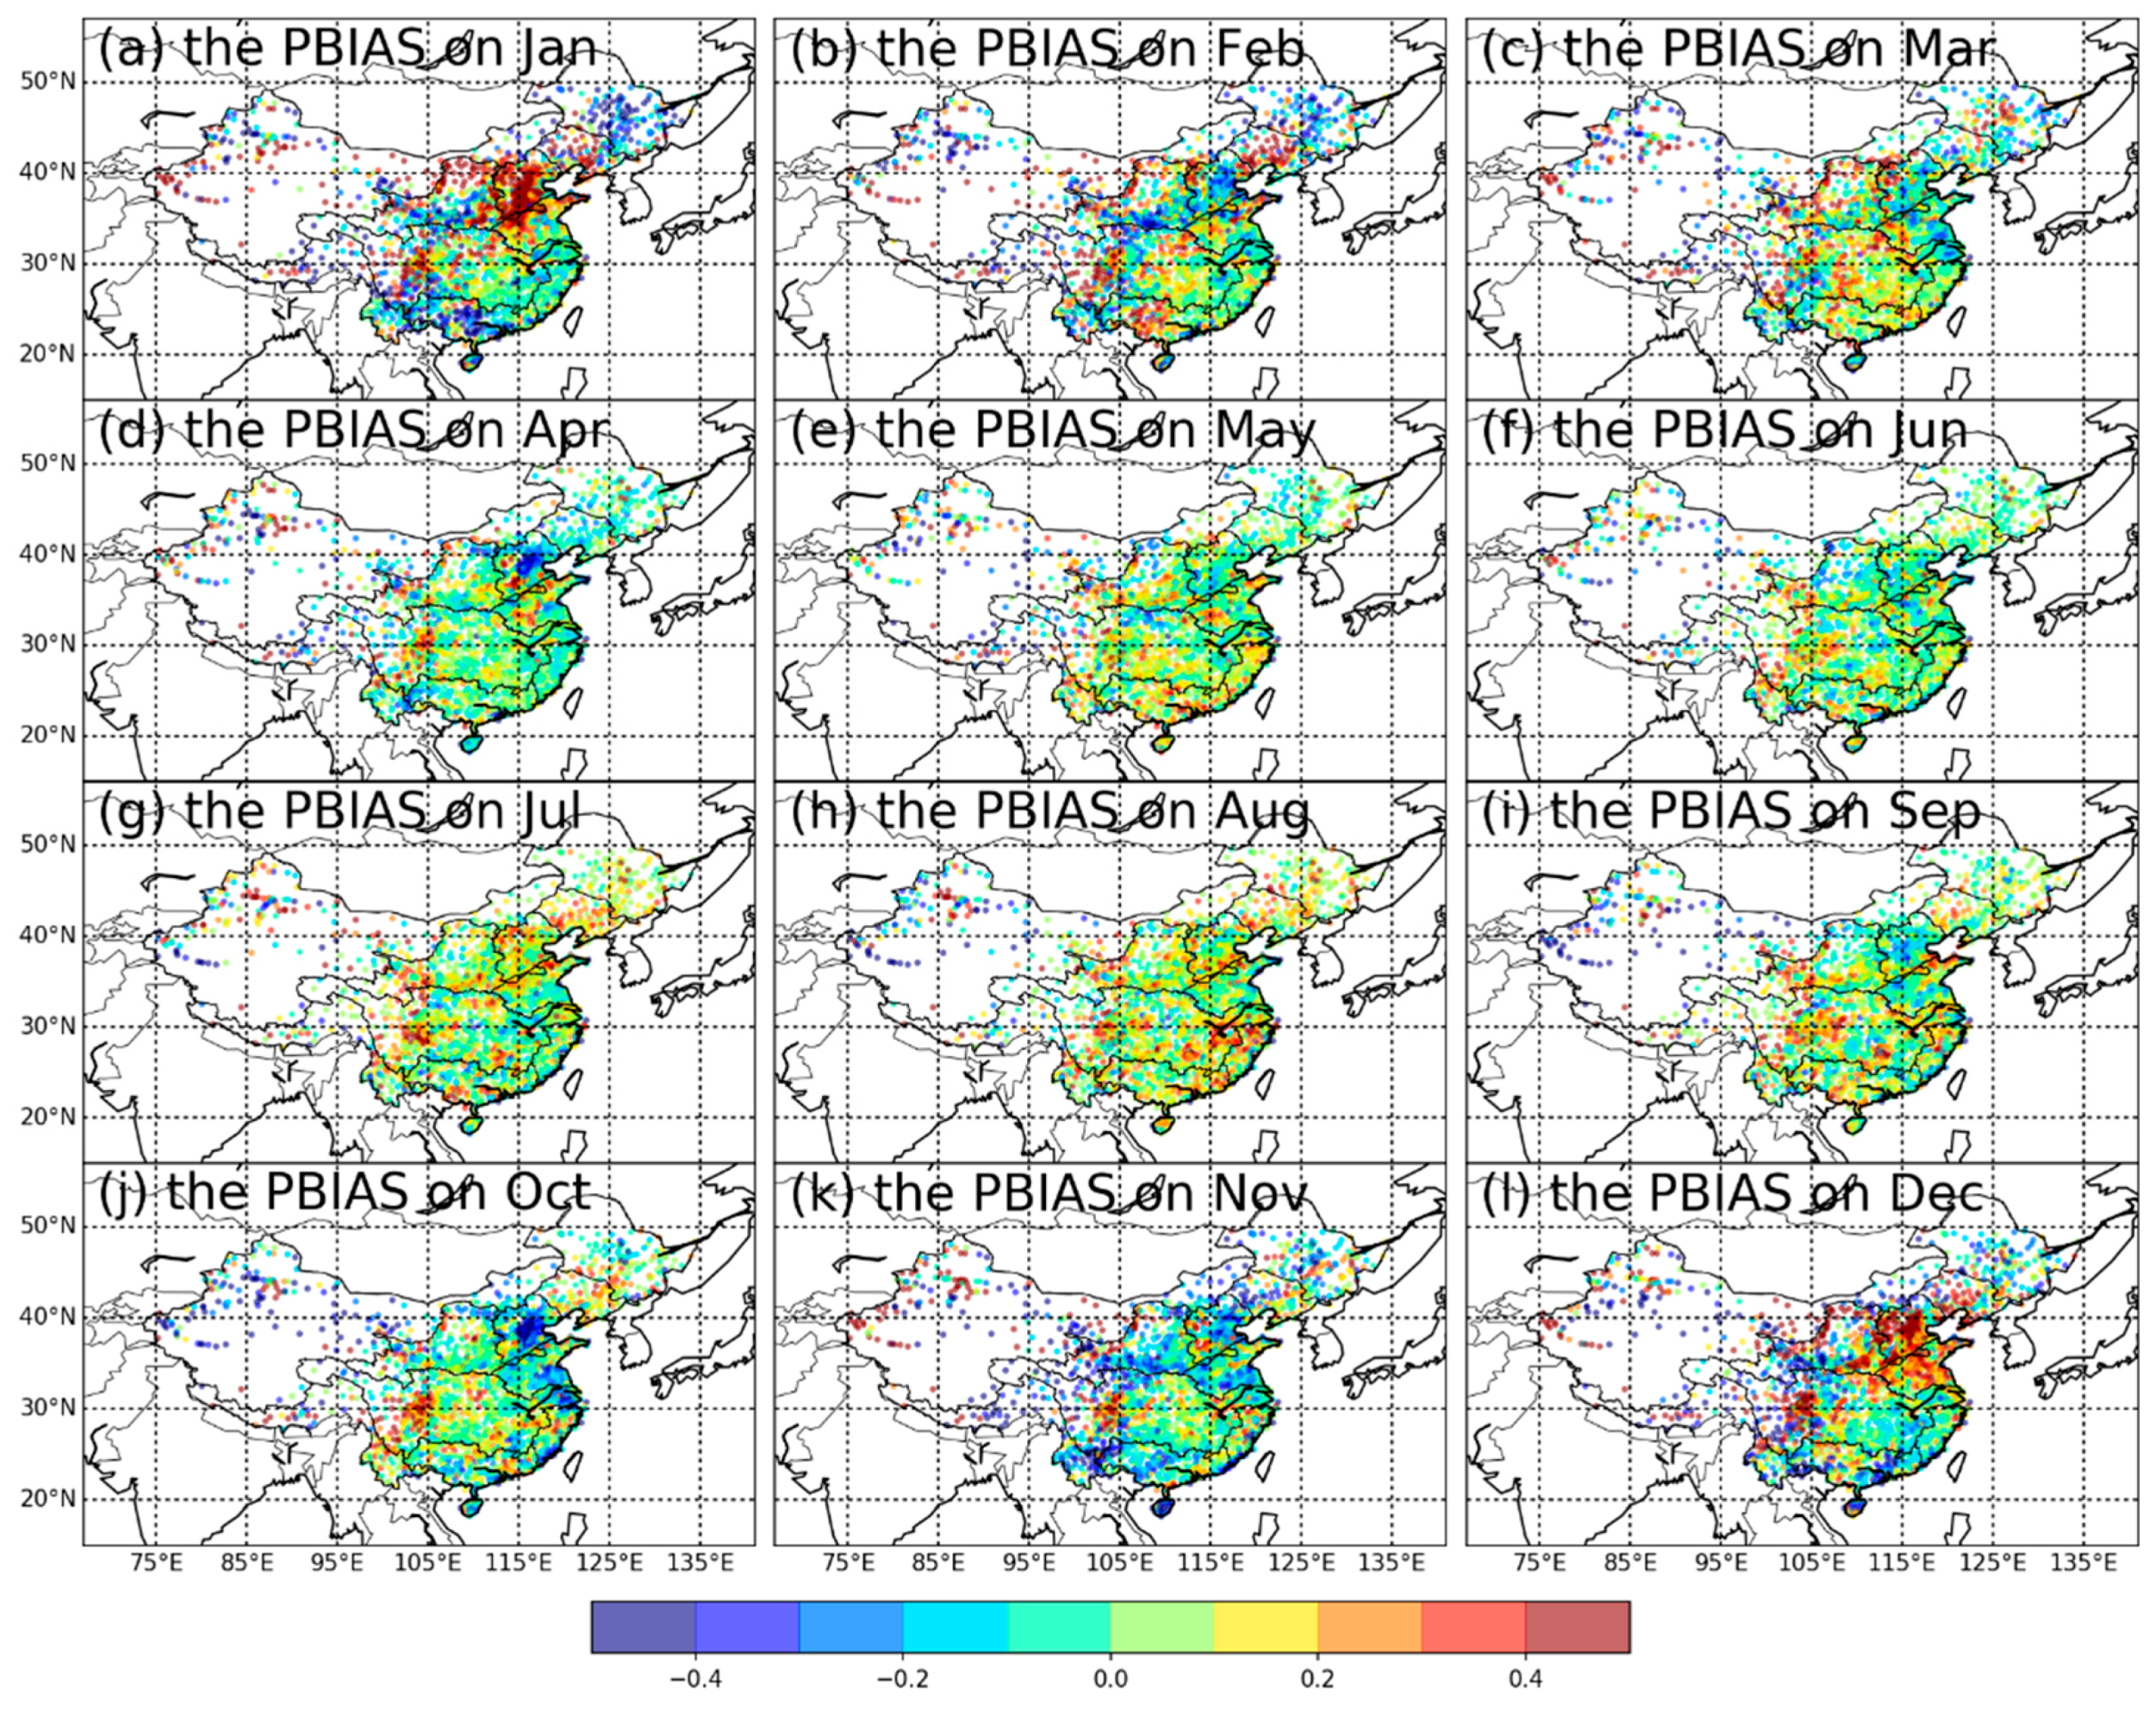
Figure 6 shows PBias in CHIRPS QPEs in January and December, LH’s and HAH's PBias is greater than 50% and PR’s and SHJ’s PBias is less than −20%. In February–March–April, PBias in HAH decreases to −20% and the midstream of YZR’s PBias decreases from 20% to approximately 10%. In May–June, PBias in all of the basins fluctuates between −10% and 10%. In July–August–September, PBias in eastern China shows an increasing trend. In October, PBias in HAH, HUH, the downstream of YZR, and western XB is below −20%. However, PBias in YZR and XB turns positive in November with while YR, PR, and HAH exhibit negative values.
When comparing Figure 5 with Figure 6, the signs of PBias and the ME are theoretically the same, since the gridded observation is derived from surface rain gauges. In Figure 5, the ME over mainland China is almost positive over the course of a year, in contrast to the seasonal change of PBias shown in Figure 6. In transition months (April, October and November), northern China (HAH) exhibits negative PBias, and becomes normal PBias. In Winter, however, PBias in HAH turns positive PBias. However, no significant seasonal change is observed in southern China. Therefore, the evaluation based on point and grid can be significantly distinguished.
Figure 7 illustrates the RMSE of CHIRPS precipitation in mainland China. Generally, the spatial pattern variability is related to the movement of the East Asian Monsoon. The RMSE of CHIRPS in northern China is within 2 mm/day in the non-monsoon period. The RMSE is slightly larger in HAH, the midstream of YZR, and eastern XN. In southern China, the RMSE in PR, DN, and the downstream of YZR is within 8–12 mm/day from February to April, while the RMSE of CHIRPS in southeastern China, which includes the regions PR, DN, and the downstream of YZR, is gradually increased, and it is just the beginning of the Meiyu season (i.e., from May to July). In the period May–June, the regions of high RMSE expand from the southeastern China to southern China. Meanwhile, it is the time that the zones of the Meiyu precipitation belt move to the midstream and downstream of YZR. In July–August, the regions of high RMSE reach the northern China, and retreat to southern China in September-October. In addition, the Summer wind from the Pacific Ocean becomes weaker when compared to the stronger Winter wind from land. In November–December, the value in high-RMSE zones decreases to 8–12 mm/day and the same spatial pattern is maintained in January. The RMSE in northwest China remains within 2 mm/day.
3.3.2. Evaluation of Technical Skill Indices
Figure 8 explains the missing PBias (MP) in CHIRPS precipitation. Overall, the MP in northern China is larger than that in southern China, and the MP in Winter is greater than that in Summer on a seasonal scale. In Winter (December–February), the MP in southeastern China is within −50% to −30%, in contrast to a MP greater than 70% in most of northern China. In Spring (March–May), the MP in southern China increases to −70% to −40%, when compared with a MP in northern China of −60% to −30%. In Summer (June–July–August), the MP in southern China decreases to −30% to −10%. In Autumn (September–November), the MP in eastern China increases to 20%.
The midstream of YZR, especially Sichuan Basin (105°E, 30°N), exhibits a large MP over the course of a year, except in Summer. In Sichuan Basin, the precipitation usually occurs at time (local time), when the surface experiences a strong updraft airflow, creating a convective system that is conducive to precipitation. It is difficult to obtain these precipitation conditions, so that the TRMM 3B42 QPEs have a higher misses [50,51]. As a derivative of TRMM, CHIRPS also exhibits poor performance in Sichuan, even though Sichuan is located at the edge of the tropics.
Figure 9 shows the Hit-PBias (HP) for CHIRPS. In November–February, the spatial pattern basically retains the same spatial distribution. In addition, the HP in the downstream of YR is higher and the HP in YR and PR is in the range −20% to −10%. In February–March, the HP (–40% to −10%) in southern China and the HP (10% to 40%) in northern China exhibits the reverse spatial distribution. In June, the HP in northern China and southern China is in balance. Thereafter in July–August, the HP in northern China turns positive. Meanwhile, the HP in southern China begins to decrease. In September–October, the HP in southern China and northern China is over 30%. The HP’s variability in northwest China is relatively steady and is in the range −20% to 10%.
In Winter, YR, HAH, LH and SHJ have negative Hit PBias, which means that CHIRPS underestimates the snowfall in northern China. Meanwhile, YZR and PR have positive HP, indicating that CHIRPS captures the rainfall events, but greatly overestimates the intensity. Subsequently, northern China enters the rainy season.
False-alarm PBias (FP) is displayed in Figure 10. In mainland China, the FP in northern China is larger when compared to the FP in southern China. In winter time (December–February), the FP is over 80% in HUH and LH. At the same time, the MP in southern China is within 30%. From March to June, the difference between the FPs in northern and southern China decreases. In July–August, the FP in central China increases to 40%. In September–November, the FP in north China significantly arises up. In contrast, the FP does not change significantly in southern China.
In Winter (December–March), the precipitation in northern China comes mainly in the form of snowfall, while in southern China it is rainfall. CHIRPS has a poor ability of detecting snowfall, so that more FPs are found in northern China. In XB, especially Xinjiang, the FP pattern is similar to that of HAH.
3.4. Interannual Variation of Statistic Metrics
Figure 11a shows that the r in 1981–2012 over mainland China can be partitioned into two periods: 1981–1997 and 1998–2012. The first period’s r is higher than the second period’s. According to the CHIRPS product’s procedure, CHIRPS uses CFSR reanalysis dataset as a background field before 1998, which would make CHIRPS’ data quality severe fluctuate between 1997 and 1998. Thus, the year of mutation should be 1998, but Figure 11a is shown it is 1997. Generally, HAH presents the lowest r versus to LH’s highest r. In 1998–2012, r in all of the basins exhibited a downward trend. However, r in 1981–1996 shows no significant trend.
Figure 11b shows the ME fluctuating across 10 basins in mainland China. Overall, the ME is negative, which indicates that CHIRPS underestimated the precipitation in 1981–2012. In addition, the trend of negative ME in 10 basins gradually decreases to zero. In 1996, the ME in all the basins mutates from negative to positive. The year of the mutation in ME is ahead of the r’s. The ME in XN, DN, and PR is larger than other basins’, which indicates that there is a larger ME in the area with larger precipitation amount.
3.5. Evaluation of Precipitation Intensity
In the rainy season, non-rainy season and all periods, CHIRPS overestimates precipitation intensity of <5 mm/day in all of the basins. Especially in the non-rainy season, CHIRPS overestimation is more notable than in rainy season and all periods. At the intensity of 20–55 mm/day, CHIRPS underestimates in all of the hydrological basins. It is illustrated that CHIRPS has limited ability to capture moderate and heavy precipitation, which limits its ability to detect extreme precipitation. In Figure 12, both observation and CHIRPS QPE in SHJ (3), LH (6), and XB (9) exhibit severe fluctuations in intensity of 20–55 mm/day. These basins have a smaller precipitation amount and lower precipitation frequency as compared to other basins in the non-rainy season. However, these basins’ precipitation bearing system is distinguished from that in rainy season. In addition, the precipitation phase is snowfall in the non-rainy season when compared to rainfall in the rainy season. In terms of precipitation intensity, the rainfall intensity of 10–25 mm/day is binned into moderate precipitation, but the snowfall intensity of >10 mm/day is called heavy snowfall. Thus, it is improper to compare the precipitation intensity in snowfall and rainfall together.
In the rainy season, the precipitation intensity in all the basins is larger than that in the non-rainy season. The annual precipitation’s probability-density-function (PDF) pattern is similar to that in the rainy season, which shows that CHIRPS can present the characteristics of precipitation in intensity and frequency over all basins. In previous study, it was found that PERSSIANN-CDR in northern China underestimates the precipitation in a year [14]. However, CHIRPS underestimates the intensity of 20–55 mm/day in all basins and overestimates the intensity of <5 mm/day in most basins.
Figure 13 demonstrates annual mean daily precipitation. CHIRPS QPE is overestimated compared to in situ observation in precipitation intensity less than 1 mm/day, and is underestimated when precipitation intensity is more than 1 mm/day. r in all of the river basins is over 0.80 and PBias is between −0.13 and −0.0, with min PBias in HAH (−0.050) and max PBias in PR(−0.129). The precipitation intensity in XB(c) is mainly 0–1 mm/day, and in SHJ(a), LH(b), HAH(d), YR(e), and XN(h), precipitation intensity is between 1 mm/day and 2 mm/day. The range of precipitation intensity in HUH(g), YZR(f), PR(i) and DN(j) is 1.5–2.5, 2–4, 3–6, and 4–6 mm/day, respectively.
3.6. Evaluations with Typical Cases
3.6.1. Snowfall
In winter, snowfall events seldom occur in southern China. Impacted by La Niña events, most regions in southern China suffered the heavy snowfall event on 10 January 2008 (Beijing time) that lasted a month. Before the strong snowfall began on 10 January (UTC time), the precipitation belt in CHIRPS (Figure 14a) covered the midstream and downstream of YZR, which is approximately 8–12 mm/day. Meanwhile, scattered precipitation of 4–8 mm/day appeared in the downstream of YR. On 11 January (UTC time), the precipitation belt (Figure 14b) shrank and moved to regions in DN. Figure 14c shows the gridded observation on 11 January, indicating the strong precipitation belt that passed across the downstream of YR and YZR, which was greater than 14–20 mm/day. In the midstream of YR, the weak precipitation belt was 4–8 mm/day. When compared with observations, the CHIRPS precipitation underestimated the daily precipitation intensity and did not estimate the precipitation belt in the midstream and downstream of YR and YZR during the extreme snowfall event in 2008. All satellite QPE performances are worse in Winter than in Summer [51], and CHIRPS has the same performance as other QPEs even in low-latitude regions, yet CHIRPS is derived from the combination of IR and microwave sensor’s information, as is PERSIANN. Therefore, only convective precipitation in warmer seasons can be characterized by satellite QPE [52,53]. The GPM with new sensors and a new retrieval algorithm has the ability to detect the snowfall in Winter, and GPM’s QPEs in Winter should be comprehensively validated in the future.
3.6.2. Typhoon Events
Every year, typhoons will make landfall on mainland China in flood season, and bring a mass of precipitation to coastal regions. To verify the accuracy of CHIRPS, in this case study we choose two well-known typhoon events in recent years.
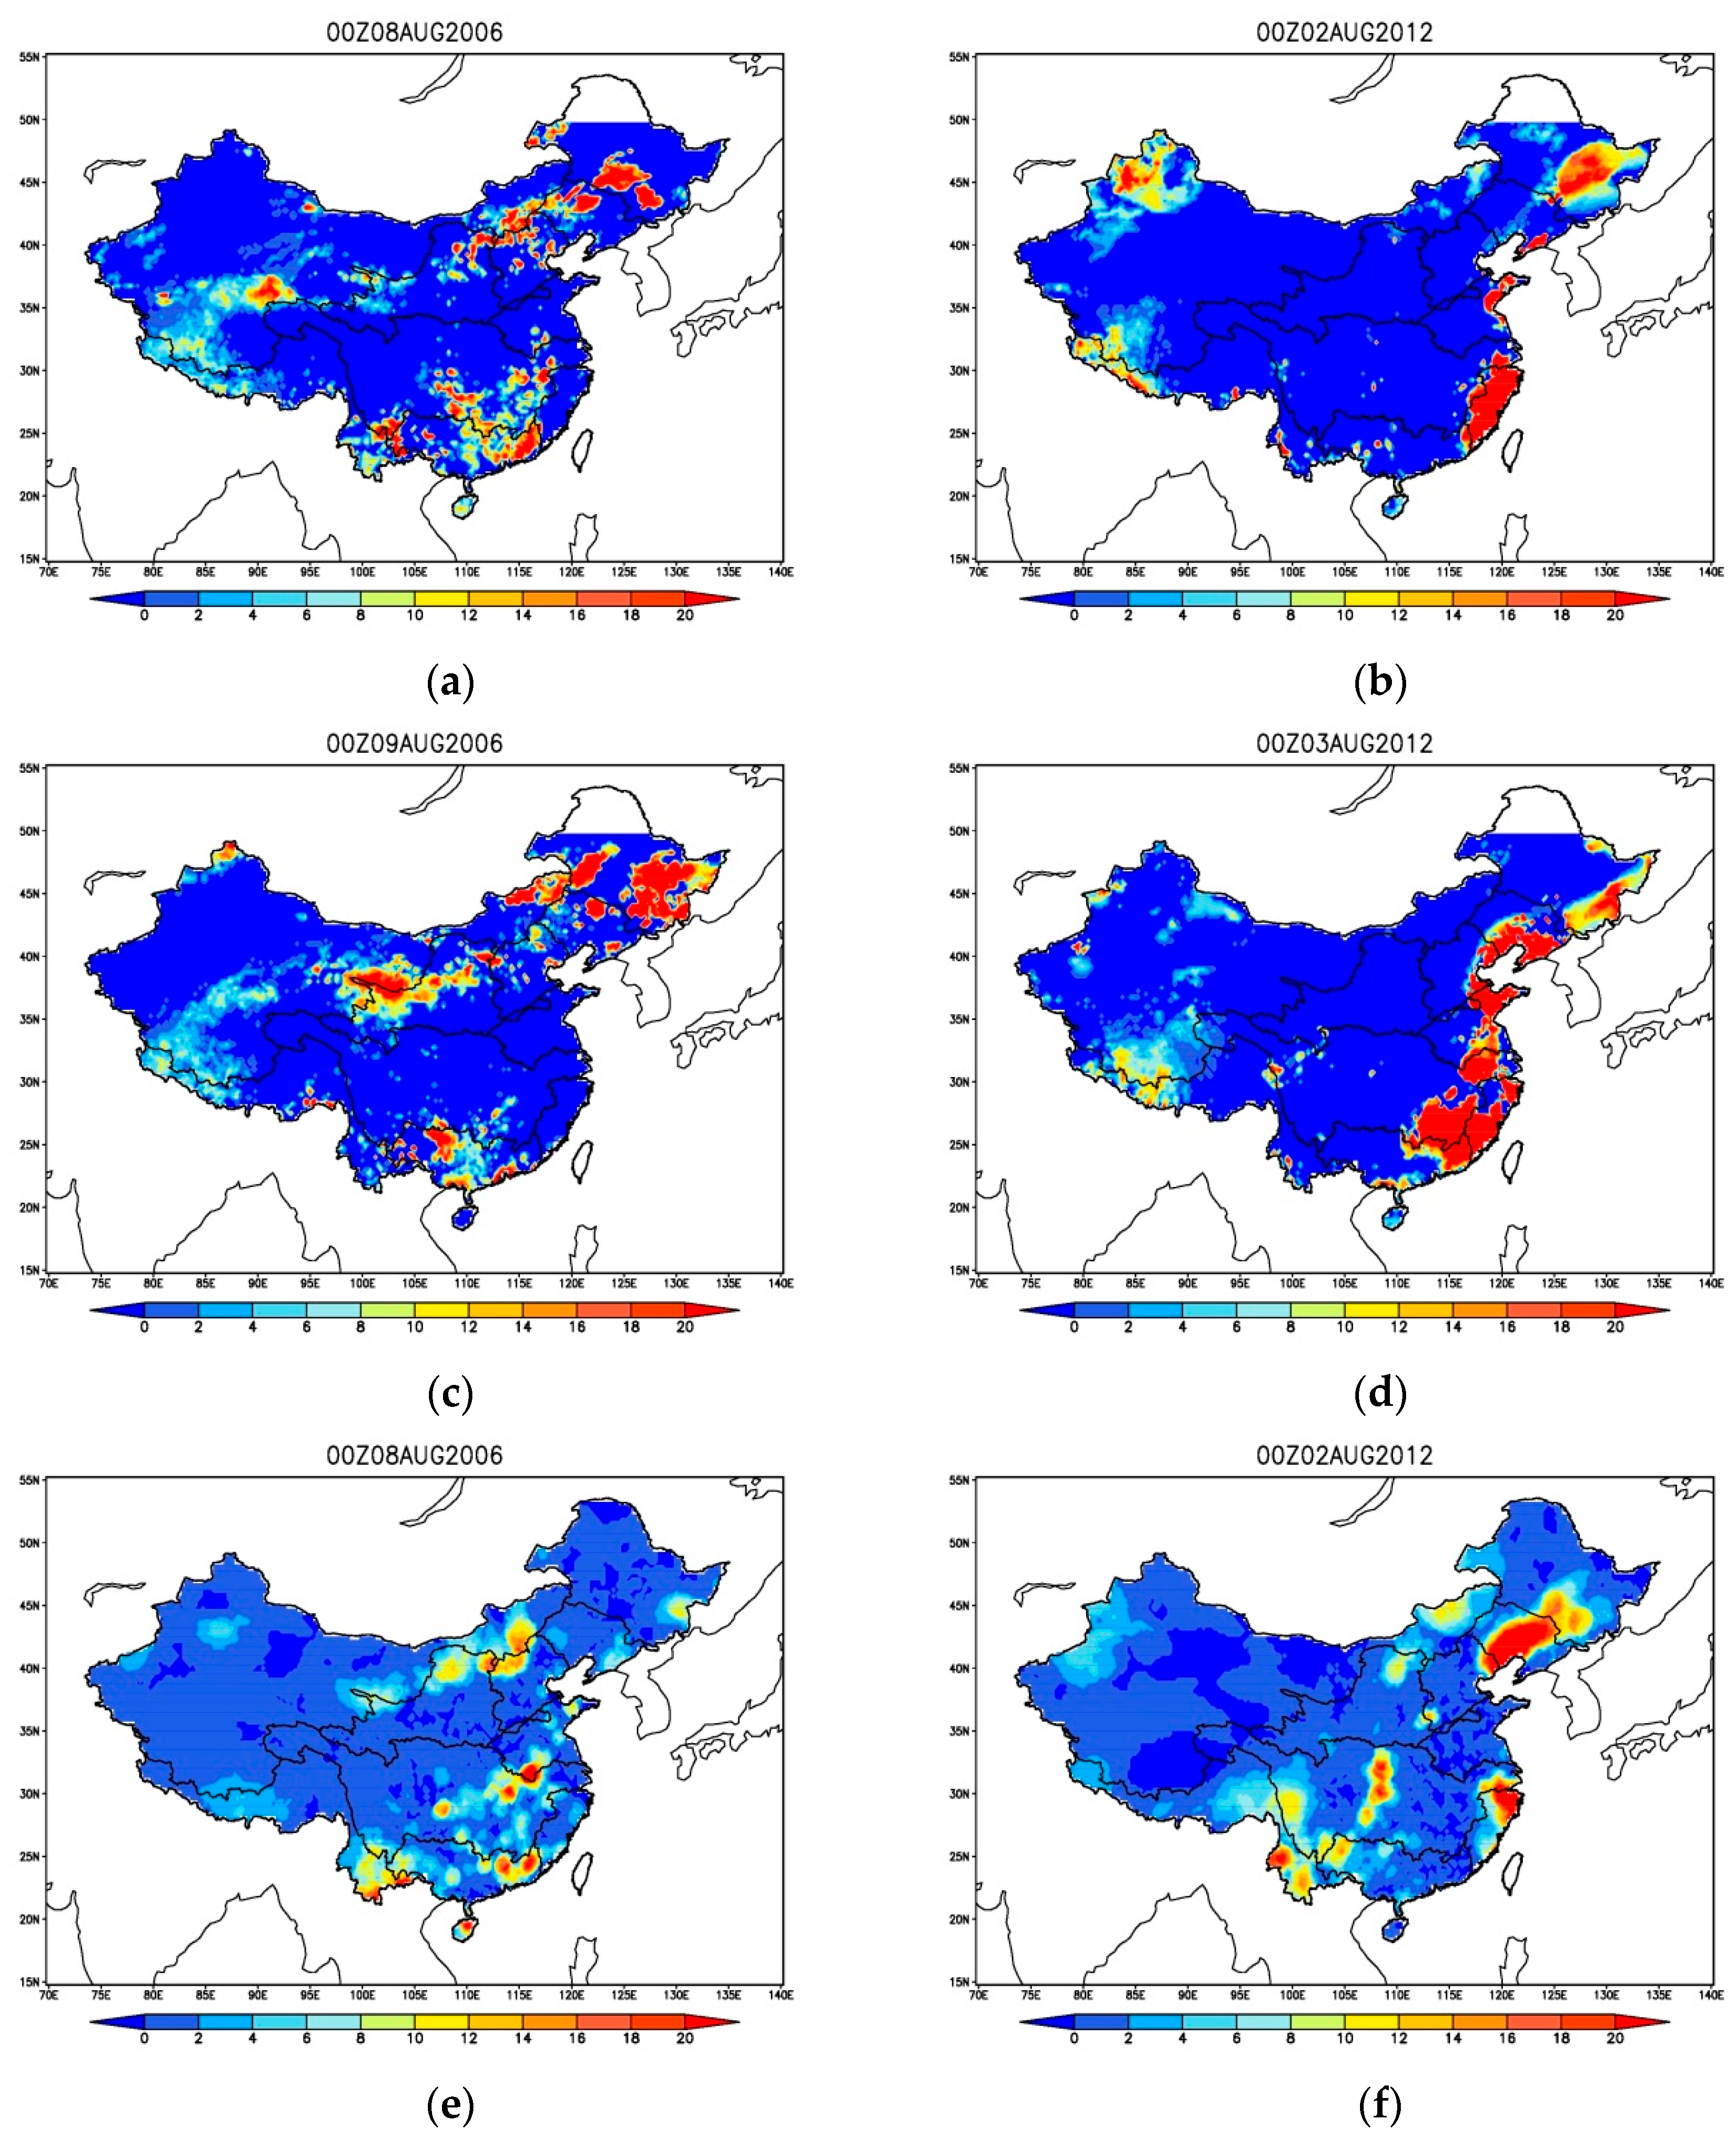
Typhoon Saomei originated in the western Pacific Ocean on 5 August 2006. It made landfall in the regions of DN on 8 August. Figure 15a shows the spatial pattern of CHIRPS precipitation on 8 August. The precipitation in CHIRPS covered the regions of PR and the middle and downstream of YZR at higher than 16 mm/day. In the intersection between PR and DN, a precipitation belt measuring greater than 20 mm/day was detected. Figure 15e shows the observed precipitation. The observed precipitation exhibits a spatial pattern similar to CHIRPS in PR and the downstream of YZR. On 9 August (UTC time), the CHIRPS precipitation spatial pattern (Figure 15c) was same to observed precipitation’s spatial pattern.
Typhoon Soala originated in the northwest Pacific Ocean on 28 July 2012, and made landfall on Fujian Province(DN), China on 2 August. Figure 15b shows that the CHIRPS precipitation in DN and HUH was over 20 mm/day. In the view of the observed precipitation (Figure 15f), the precipitation belt in midstream of YZR was over 20 mm/day. Overall, the CHIRPS precipitation detected the features of Typhoon Soala’s landing event, but the precipitation zones and intensity differ greatly from observed precipitation.
From the above analysis of the two typhoon events, it is found that CHIRPS has the ability to characterize the precipitation induced by typhoons in coastal regions. It is also found that CHIRPS fails to characterize the spatial pattern of precipitation in northeastern and northwestern China. On one hand, the origin model for the precipitation retrieval algorithm in CHIRPS is the TRMM series, which is specialized for convective precipitation detection in tropical or sub-subtropical regions in warm seasons. Therefore, this algorithm is not suitable for frontal system precipitation in middle-latitude regions over northern China. On the other hand, both Figure 15a,e illustrate that the Qilian Mountains(100°E, 37°N) experienced moderate rainfall on 8 August, but the gridded observation shows more areas experiencing moderate rain than CHIRPS. This could be explained by the fact that the two datasets have different resolutions (0.05° grid for CHIRPS and 0.25° grid for CN05.1). However, the CN05.1 has a great uncertainties due to a few gauges in Qilian Mountains and extrapolating methods. Hence, it is not wise to use gridded observation directly to evaluation high-resolution QPEs in remote regions lacking rain gauges’ coverage.
4. Discussion and Future Work
This study has evaluated the high resolution and long-term QPEs of CHIRPS over China for forcing datasets application in land surface hydrological models. The limitations and possible sources of CHIRPS’ errors is shown as following:
First, it is found in this study that PBias (Figure 6), MP (Figure 8) and FP (Figure 10) indicate CHIRPS in the Sichuan Basin (105°E, 30°N) and Northern China Plain (115°E, 40°N) exhibits poor performance compared with adjacent regions in a year, especially in winter. The phenomenon is probably related to complex orography induced by great elevation differences. The first procedure making in CHIRPS is to make the raw QPE (CHIRP) using the local regression method in a pentad with IR’s brightness temperature and TRMM 3B42 QPE. Therefore, it is necessary to consider IR and microwave based QPE drawbacks. It is found high rainfall rates related cold clouds, in which the cloud top’s temperature is very low [54].
In a pentad, CHIRP chooses IR brightness temperature and TRMM 3B42 QPE when the cloud top temperature is less than 235 K. In the Sichuan Basin (XN) and Northern China Plain (HAH), clouds move from western mountains into plains, a process that makes the cloud height lower and the cloud top temperature warmer than CHIRP’s threshold, especially in winter time’s frontal bearing system (PBias in Figure 6a and MP in Figure 8a). Thus, the cloud top temperature is colder estimated with high precipitation, which results in overestimation. On the contrary, when cloud climbs from lower land to mountains, the cloud top temperature is higher estimated with lower precipitation, for which the orographic process underestimates the precipitation in mountainous areas. The PERSIAN-CDR QPEs, one of the IR based QPEs, reveals this kind of underestimation in complex terrain in China [14] and eastern Africa [55]. It is the same for microwave radiometer algorithms. The QPEs are estimated by signals from cloud ice particles’ scatter. In mountainous areas, the warm cloud created by orographic processes contains little ice particles in cloud. Therefore, the QPEs retrieved by microwave radiometer algorithms are often underestimated (e.g., the Himalayans [56]). Moreover, the precipitation radar carried by the TRMM platform has the valid spatial coverage in 38°N–38°S. CHIRPS is derivative of TRMM 3B42 and assumed to have the similar features. In Figure 2, SHJ, LH, XB, HAH and northern YR exceeded the TRMM valid spatial coverage, which may be the reason why the statistical metrics are poor in Table 2.
In previous studies, it is noticed that TRMM has better performance in the rainy season than in non-rainy season on a temporal scale [16,57]. This can explain the CHIRPS derived from TRMM exhibits poor performance in non-rainy season (r in Figure 4 and ME in Figure 5). In addition, TRMM 3B42 exhibits relatively poor performance on precipitation intensity (e.g., overestimation of heavy precipitation in southeastern China and underestimation of light and moderate precipitation in northwestern China) [58]. The different versions of TRMM present the similar performance in China with the only significant difference being in the Qinghai-Tibet Plateau [59]. TRMM TMPA has higher Hit Bias and Missed Bias in humid regions and False Bias in arid regions, especially in Winter [60]. The raw CHIRP is derived from TRMM, so these deficiencies can be also found in CHIRPS. The multi dataset blending technique, which uses IR based QPEs, microwave based QPEs, radar based QPEs and a numerical prediction model’s precipitation as input and blends them in minimum variance, can significantly enhance the accuracy of blending precipitation, e.g., MSWEP [61] and CMORPH-CMA (http://www.cma.gov.cn/2011qxfw/2011qsjgx/). In the future, particularly for creating the climatologically long-terms QPEs, the multi datasets and blending technique was a promising method in the period before the TRMM era.
Second, CHIRPS QPEs should be comprehensively evaluated in different spatio-temporal scales. In previous studies, TRMM 3B43, which is the monthly QPE derived from TRMM 3B42 with ground rain gauges’ calibration, is proved to be prior to daily TRMM 3B42 (e.g., northeastern China [62]). This is because 3B43 QPE has been calibrated with an abundance of in situ observation or the gridded datasets derived from these in situ observations. If study regions were covered by these calibrated stations, the evaluation usually would have better performance and vice versa (e.g., XN and XB). From the point of view of spatial scale, previous studies have found that the performance of TRMM 3B42V7 is superior to GPM IMERGE [63], although GPM IMERGE’s horizontal resolution is higher to 0.10°. Table 3 is CHIRPS upscaled to 0.25° to evaluate with CN05.1. In all 10 river basins, the r in 0.05° evaluation is higher in 0.25° evaluation, which illustrates that the evaluation at different resolutions have significant differences. In future, the performance of CHIRPS on horizontal resolution of 0.05° and 0.10° should be give insight into evaluation of spatial scale uncertainty.
Third, in complex terrain over China, rain gauges are usually located in the bottom of valleys for the convenience of traffic and easily maintaining losing of sight of precipitation micro-distribution (e.g., precipitation spatial distribution on windward and leeward, and the precipitation’s vertical distribution.). In mountainous areas, gridded datasets, which are extrapolated by traditionally mathematical methods (e.g., IDW, Krieger and Spline) into grids of 0.25° and 0.10°, usually have smaller areal precipitation than naturally areal precipitation. Some studies use empirical models with DEM extrapolation for precipitation (e.g., The PRISM Climate Group’s PRISM [64]). In terms of the non-linear relationship between precipitation and elevation, there are still great uncertainties in mountainous areas with scarce rain gauges. Thus, any gridded datasets (e.g., CN05.1 [46], CMAP [11], APHRO [45], and ITPCAS [47]) present great uncertainties in complex terrain, which make the evaluation with gridded observation less reliable. There, in western China, the grid evaluation with CN05.1 has great uncertainty (Figure 4 and Figure 5). In future, it is wise and reliable to evaluate the QPEs only when a grid cell covers at least one rain gauge on a different scale.
Finally, except for traditionally statistical methods for quantitative evaluation, some studies use hydrological models [e.g., Coupled routing and excess storage (CREAST) hydrological model [39,40], Variable infiltration capacity (VIC) semi-distributed hydrological model [17,65] to evaluate precipitation. This method is suitable for ungauged regions or regions with scarce rain gauges (e.g., XB and XN). In future, it will be an effective approach using hydrological models to evaluate CHIRPS in multiple scales.
5. Conclusions
Satellite QPEs are widely applied in hydrological and ecological research. In this study, we compared the daily precipitation estimates from CHIRPS with the data from 2480 rain gauges located across China and gridded observation using several statistical metrics in the long terms period 1981–2014, to find the potential hydro-meteorological application. The main conclusions reached are the following:
- Limited to the resolution, the gridded observations do not completely agree with the data from high-density rain gauge networks across mainland, China, especially in complex terrain areas (e.g., XN). Overall, the gridded observation, CN05.1, has an r value above 0.90 over the course of a seasonal cycle. However, the evaluation results are quite different when comparing point evaluation and grid evaluation.
- The CHIRPS precipitation is mainly based on the statistical model based on IR data and TRMM 3B42’s precipitation in pentad time. In mainland China, the CHIRPS QPEs have better performance in DN and PR, in southern China, and poor performance in XB, YR, SHJ, LH, and HAH. The ME and RSME exhibits significant variation with seasonal change, which are caused by the limitations of TRMM, which is suitable only for tropical regions, not middle-latitude regions. Thus, CHIRPS exhibits good performance in southern China.
- CHIRPS also exhibits better performance for areas that experience large amounts of precipitation (e.g., southern China) as compared to areas characterized by arid and semi-arid land (e.g., northwest China). In addition, the change in good performance zones change is strongly related to monsoon movement.
- Generally, the accuracy of CHIRPS is better in warm seasons than in Winter. It has limited ability to detect snowfall of any intensity.
- CHIRPS is moderately sensitive to the precipitation from typhoon weather systems.
Acknowledgments
This work is financially supported by the Xinjiang Uygur Autonomous Province’s Innovation Project (Grant No. XJGRI2015017), Key Program of National Natural Science Foundation of China (Grant No. 91437220), Science & Technology Basic Resources Investigation Program of China (Grant No. 2017FY100501_5), and National Natural Science Foundation of China (Grant No. 41501301). We acknowledge Xinjiang Key Laboratory of Water Cycle and Water Utilization in Arid Area for providing computing resources of Cluster Labrador for data processing. We thank Accdon for its linguistic assistance during the preparation of this manuscript.
Author Contributions
Lei Bai wrote this paper, performed the experiments, and analyzed the data. Lanhai Li provided technical guidance. Chunxiang Shi collected observation data and provided technical guidance. Yanfen Yang revised the paper. Jing Wu provided technical guidance and revised the paper.
Conflicts of Interest
The authors declare no conflict of interest.
References
- Yan, D.-H.; Han, D.-M.; Wang, G.; Yuan, Y.; Hu, Y.; Fang, H.-Y. The evolution analysis of flood and drought in Huai River Basin of China based on monthly precipitation characteristics. Nat. Hazards 2014, 73, 849–858. [Google Scholar] [CrossRef]
- Correa, S.W.; de Paiva, R.C.D.; Espinoza, J.C.; Collischonn, W. Multi-decadal Hydrological Retrospective: Case study of Amazon floods and droughts. J. Hydrol. 2017, 549, 667–684. [Google Scholar] [CrossRef]
- Zhang, Q.; Gu, X.; Singh, V.P.; Kong, D.; Chen, X. Spatiotemporal behavior of floods and droughts and their impacts on agriculture in China. Glob. Planet. Chang. 2015, 131, 63–72. [Google Scholar] [CrossRef]
- Scheel, I.; Hinnerichsen, M. The Impact of Climate Change on Precipitation-related Insurance Risk: A Study of the Effect of Future Scenarios on Residential Buildings in Norway. Geneva Pap. Risk Insur. Issues Pract. 2012, 37, 365–376. [Google Scholar] [CrossRef]
- Yao, J.; Yang, Q.; Mao, W.; Zhao, Y.; Xu, X. Precipitation trend-Elevation relationship in arid regions of the China. Glob. Planet. Chang. 2016, 143, 1–9. [Google Scholar] [CrossRef]
- Yang, P.; Xia, J.; Zhang, Y.; Hong, S. Temporal and spatial variations of precipitation in Northwest China during 1960–2013. Atmos. Res. 2017, 183, 283–295. [Google Scholar] [CrossRef]
- Huffman, G.J.; Adler, R.F.; Bolvin, D.T.; Gu, G.; Nelkin, E.J.; Bowman, K.P.; Hong, Y.; Stocker, E.F.; Wolff, D.B. The TRMM multisatellite precipitation analysis (TMPA): Quasi-global, multiyear, combined-sensor precipitation estimates at fine scales. J. Hydrometeorol. 2007, 8, 38–55. [Google Scholar] [CrossRef]
- Joyce, R.J.; Janowiak, J.E.; Arkin, P.A.; Xie, P.P. CMORPH: A method that produces global precipitation estimates from passive microwave and infrared data at high spatial and temporal resolution. J. Hydrometeorol. 2004, 5, 487–503. [Google Scholar] [CrossRef]
- Sorooshian, S.; Hsu, K.-l.; Gao, X.; Gupta, H.V.; Imam, B.; Braithwaite, D. Evaluation of PERSIANN System Satellite-Based Estimates of Tropical Rainfall. Bull. Am. Meteorol. Soc. 2000, 81, 2035–2046. [Google Scholar] [CrossRef]
- Kubota, T.; Shige, S.; Hashizume, H.; Aonashi, K.; Takahashi, N.; Seto, S.; Takayabu, Y.N.; Ushio, T.; Nakagawa, K.; Iwanami, K. Global Precipitation Map Using Satellite-Borne Microwave Radiometers by the GSMaP Project: Production and Validation. IEEE Trans. Geosci. Remote Sens. 2007, 45, 2259–2275. [Google Scholar] [CrossRef]
- Shen, Y.; Zhao, P.; Pan, Y.; Yu, J. A high spatiotemporal gauge-satellite merged precipitation analysis over China. J. Geophys. Res. Atmos. 2014, 119, 3063–3075. [Google Scholar] [CrossRef]
- Xu, B.; Xie, P.; Xu, M.; Jiang, L.; Shi, C.; You, R. A Validation of Passive Microwave Rain-Rate Retrievals from the Chinese FengYun-3B Satellite. J. Hydrometeorol. 2015, 16, 1886–1905. [Google Scholar] [CrossRef]
- Hou, A.Y.; Kakar, R.K.; Neeck, S.; Azarbarzin, A.A.; Kummerow, C.D.; Kojima, M.; Oki, R.; Nakamura, K.; Iguchi, T. The global precipitation measurement mission. Bull. Am. Meteorol. Soc. 2014, 95, 701–722. [Google Scholar] [CrossRef]
- Guo, H.; Chen, S.; Bao, A.; Hu, J.; Yang, B.; Stepanian, P.M. Comprehensive Evaluation of High-Resolution Satellite-Based Precipitation Products over China. Atmosphere 2016, 7, 6. [Google Scholar] [CrossRef]
- Guo, H.; Chen, S.; Bao, A.; Behrangi, A.; Hong, Y.; Ndayisaba, F.; Hu, J.; Stepanian, P.M. Early assessment of Integrated Multi-satellite Retrievals for Global Precipitation Measurement over China. Atmos. Res. 2016, 176, 121–133. [Google Scholar] [CrossRef]
- Yang, Y.; Luo, Y. Evaluating the performance of remote sensing precipitation products CMORPH, PERSIANN, and TMPA, in the arid region of northwest China. Theor. Appl. Climatol. 2014, 118, 429–445. [Google Scholar] [CrossRef]
- Tong, K.; Su, F.; Yang, D.; Hao, Z. Evaluation of satellite precipitation retrievals and their potential utilities in hydrologic modeling over the Tibetan Plateau. J. Hydrol. 2014, 519, 423–437. [Google Scholar] [CrossRef]
- Wu, L.; Zhai, P. Validation of daily precipitation from two high-resolution satellite precipitation datasets over the Tibetan Plateau and the regions to its east. Acta Meteorol. Sin. 2012, 26, 735–745. [Google Scholar] [CrossRef]
- Li, X.; Zhang, Q.; Xu, C.-Y. Assessing the performance of satellite-based precipitation products and its dependence on topography over Poyang Lake basin. Theor. Appl. Climatol. 2014, 115, 713–729. [Google Scholar] [CrossRef]
- Li, Z.; Yang, D.; Hong, Y. Multi-scale evaluation of high-resolution multi-sensor blended global precipitation products over the Yangtze River. J. Hydrol. 2013, 500, 157–169. [Google Scholar] [CrossRef]
- Jiang, S.H.; Zhou, M.; Ren, L.L.; Cheng, X.R.; Zhang, P.J. Evaluation of latest TMPA and CMORPH satellite precipitation products over Yellow River Basin. Water Sci. Eng. 2016, 9, 87–96. [Google Scholar] [CrossRef]
- Immerzeel, W.W.; Rutten, M.M.; Droogers, P. Spatial downscaling of TRMM precipitation using vegetative response on the Iberian Peninsula. Remote Sens. Environ. 2009, 113, 362–370. [Google Scholar] [CrossRef]
- Jia, S.; Zhu, W.; Lu, A.; Yan, T. A statistical spatial downscaling algorithm of TRMM precipitation based on NDVI and DEM in the Qaidam Basin of China. Remote Sens. Environ. 2011, 115, 3069–3079. [Google Scholar] [CrossRef]
- Funk, C.; Peterson, P.; Landsfeld, M.F.; Pedreros, D.; Verdin, J.P.; Rowland, J.; Romero, B.E.; Husak, G.; Michaelsen, J.C.; Verdin, A. A Quasi-Global Precipitation Time Series for Drought Monitoring; USGS Professional Paper; Data Series 832; U.S. Geological Survey: Reston, VA, USA, 2014.
- Paredes-Trejo, F.J.; Barbosa, H.A.; Kumar, T.V.L. Validating CHIRPS-based satellite precipitation estimates in Northeast Brazil. J. Arid Environ. 2017, 139, 26–40. [Google Scholar] [CrossRef]
- Katsanos, D.; Retalis, A.; Michaelides, S. Validation of a high-resolution precipitation database (CHIRPS) over Cyprus for a 30-year period. Atmos. Res. 2016, 169, 459–464. [Google Scholar] [CrossRef]
- Mainali, J.; Pricope, N.G. High-resolution spatial assessment of population vulnerability to climate change in Nepal. Appl. Geogr. 2017, 82, 66–82. [Google Scholar] [CrossRef]
- Tuo, Y.; Duan, Z.; Disse, M.; Chiogna, G. Evaluation of precipitation input for SWAT modeling in Alpine catchment: A case study in the Adige river basin (Italy). Sci. Total Environ. 2016, 573, 66–82. [Google Scholar] [CrossRef] [PubMed]
- Tote, C.; Patricio, D.; Boogaard, H.; van der Wijngaart, R.; Tarnavsky, E.; Funk, C. Evaluation of Satellite Rainfall Estimates for Drought and Flood Monitoring in Mozambique. Remote Sens. 2015, 7, 1758–1776. [Google Scholar] [CrossRef]
- Guo, H.; Bao, A.; Liu, T.; Ndayisaba, F.; He, D.; Kurban, A.; de Maeyer, P. Meteorological Drought Analysis in the Lower Mekong Basin Using Satellite-Based Long-Term CHIRPS Product. Sustainability 2017, 9, 901. [Google Scholar] [CrossRef]
- Sun, R.; Yuan, H.; Liu, X.; Jiang, X. Evaluation of the latest satellite-gauge precipitation products and their hydrologic applications over the Huaihe River basin. J. Hydrol. 2016, 536, 302–319. [Google Scholar] [CrossRef]
- Guo, H.; Chen, S.; Bao, A.; Hu, J.; Gebregiorgis, A.S.; Xue, X.; Zhang, X. Inter-Comparison of High-Resolution Satellite Precipitation Products over Central Asia. Remote Sens. 2015, 7, 7181–7211. [Google Scholar] [CrossRef]
- Hirpa, F.A.; Gebremichael, M.; Hopson, T. Evaluation of High-Resolution Satellite Precipitation Products over Very Complex Terrain in Ethiopia. J. Appl. Meteorol. Climatol. 2010, 49, 1044–1051. [Google Scholar] [CrossRef]
- Tan, M.L.; Ibrahim, A.L.; Duan, Z.; Cracknell, A.P.; Chaplot, V. Evaluation of Six High-Resolution Satellite and Ground-Based Precipitation Products over Malaysia. Remote Sens. 2015, 7, 1504–1528. [Google Scholar] [CrossRef]
- Katsanos, D.; Lagouvardos, K.; Kotroni, V.; Huffmann, G.J. Statistical evaluation of MPA-RT high-resolution precipitation estimates from satellite platforms over the central and eastern Mediterranean. Geophys. Res. Lett. 2004, 31. [Google Scholar] [CrossRef]
- Huang, Y.; Chen, S.; Cao, Q.; Hong, Y.; Wu, B.; Huang, M.; Qiao, L.; Zhang, Z.; Li, Z.; Li, W.; et al. Evaluation of Version-7 TRMM Multi-Satellite Precipitation Analysis Product during the Beijing Extreme Heavy Rainfall Event of 21 July 2012. Water 2014, 6, 32–44. [Google Scholar] [CrossRef]
- Pena-Arancibia, J.L.; van Dijk, A.I.; Renzullo, L.J.; Mulligan, M. Evaluation of Precipitation Estimation Accuracy in Reanalyses, Satellite Products, and an Ensemble Method for Regions in Australia and South and East Asia. J. Hydrometeorol. 2013, 14, 1323–1333. [Google Scholar] [CrossRef] [Green Version]
- Tan, M.L.; Duan, Z. Assessment of GPM and TRMM Precipitation Products over Singapore. Remote Sens. 2017, 9, 720. [Google Scholar] [CrossRef]
- Xue, X.; Hong, Y.; Limaye, A.S.; Gourley, J.J.; Huffman, G.J.; Khan, S.I.; Dorji, C.; Chen, S. Statistical and hydrological evaluation of TRMM-based Multi-satellite Precipitation Analysis over the Wangchu Basin of Bhutan: Are the latest satellite precipitation products 3B42V7 ready for use in ungauged basins? J. Hydrol. 2013, 499, 91–99. [Google Scholar] [CrossRef]
- Chen, Z.; Qin, Y.; Shen, Y.; Zhang, S. Evaluation of Global Satellite Mapping of Precipitation Project Daily Precipitation Estimates over the Chinese Mainland. Adv. Meteorol. 2016. [Google Scholar] [CrossRef]
- Zhang, X.; Tang, Q. Combining satellite precipitation and long-term ground observations for hydrological monitoring in China. J. Geophys. Res.-Atmos. 2015, 120, 6426–6443. [Google Scholar] [CrossRef]
- Zhang, X.; Cong, Z. Trends of precipitation intensity and frequency in hydrological regions of China from 1956 to 2005. Glob. Planet. Chang. 2014, 117, 40–51. [Google Scholar] [CrossRef]
- Zhou, T.; Wu, B.; Scaife, A.A.; Broennimann, S.; Cherchi, A.; Fereday, D.; Fischer, A.M.; Folland, C.K.; Jin, K.E.; Kinter, J.; et al. The CLIVAR C20C project: which components of the Asian-Australian monsoon circulation variations are forced and reproducible? Clim. Dyn. 2009, 33, 1051–1068. [Google Scholar] [CrossRef] [Green Version]
- Bothe, O.; Fraedrich, K.; Zhu, X. Precipitation climate of Central Asia and the large-scale atmospheric circulation. Theor. Appl. Climatol. 2012, 108, 345–354. [Google Scholar] [CrossRef]
- Yatagai, A.; Kamiguchi, K.; Arakawa, O.; Hamada, A.; Yasutomi, N.; Kitoh, A. APHRODITE Constructing a Long-Term Daily Gridded Precipitation Dataset for Asia Based on a Dense Network of Rain Gauges. Bull. Am. Meteorol. Soc. 2012, 93, 1401–1415. [Google Scholar] [CrossRef]
- Wu, J.; Gao, X.-J. A gridded daily observation dataset over China region and comparison with the other datasets. Chin. J. Geophys.-Chin. 2013, 56, 1102–1111. (In Chinese) [Google Scholar] [CrossRef]
- Yang, K.; He, J.; Tang, W.; Qin, J.; Cheng, C.C.K. On downward shortwave and longwave radiations over high altitude regions: Observation and modeling in the Tibetan Plateau. Agric. For. Meteorol. 2010, 150, 38–46. [Google Scholar] [CrossRef]
- Han, Z.; Zhou, T. Assessing the Quality of APHRODITE High-Resolution Daily Precipitation Dataset over Contiguous China. Chin. J. Atmos. Sci. 2012, 36, 361–373. (In Chinese) [Google Scholar] [CrossRef]
- Tian, Y.; Peters-Lidard, C.D.; Eylander, J.B.; Joyce, R.J.; Huffman, G.J.; Adler, R.F.; Hsu, K.-L.; Turk, F.J.; Garcia, M.; Zeng, J. Component analysis of errors in satellite-based precipitation estimates. J. Geophys. Res.-Atmos. 2009, 114. [Google Scholar] [CrossRef]
- Yang, Y.; Cheng, G.; Fan, J.; Sun, J.; Weipeng, L. Accuracy validation of TRMM 3B42 data in Sichuan basin and the surrounding areas. J. Meteorol. Sci.-Chin. 2013, 5, 526–535. (In Chinese) [Google Scholar] [CrossRef]
- Qin, Y.; Chen, Z.; Shen, Y.; Zhang, S.; Shi, R. Evaluation of Satellite Rainfall Estimates over the Chinese Mainland. Remote Sens. 2014, 6, 11649–11672. [Google Scholar] [CrossRef]
- Gottschalck, J.; Meng, J.; Rodell, M.; Houser, P. Analysis of multiple precipitation products and preliminary assessment of their impact on global land data assimilation system land surface states. J. Hydrometeorol. 2005, 6, 573–598. [Google Scholar] [CrossRef]
- Tian, Y.; Peters-Lidard, C.D. A global map of uncertainties in satellite-based precipitation measurements. Geophys. Res. Lett. 2010, 37. [Google Scholar] [CrossRef]
- Maidment, R.I.; Grimes, D.; Allan, R.P.; Tarnavsky, E.; Stringer, M.; Hewison, T.; Roebeling, R.; Black, E. The 30 year TAMSAT African Rainfall Climatology and Time series (TARCAT) data set. J. Geophys. Res.-Atmos. 2014, 119, 10619–10644. [Google Scholar] [CrossRef]
- Kimani, M.W.; Hoedjes, J.C.B.; Su, Z. An Assessment of Satellite-Derived Rainfall Products Relative to Ground Observations over East Africa. Remote Sens. 2017, 9, 430. [Google Scholar] [CrossRef]
- Bharti, V.; Singh, C. Evaluation of error in TRMM 3B42V7 precipitation estimates over the Himalayan region. J. Geophys. Res.-Atmos. 2015, 120, 12458–12473. [Google Scholar] [CrossRef]
- Zeng, H.; Li, L.; Hu, J.; Liang, L.; Li, J.; Li, B.; Zhang, K. Accuracy validation of TRMM Multisatellite Precipitation Analysis daily precipitation products in the Lancang River Basin of China. Theor. Appl. Climatol. 2013, 112, 389–401. [Google Scholar] [CrossRef]
- Zhao, T.; Yatagai, A. Evaluation of TRMM 3B42 product using a new gauge-based analysis of daily precipitation over China. Int. J. Climatol. 2014, 34, 2749–2762. [Google Scholar] [CrossRef]
- Chen, S.; Hong, Y.; Cao, Q.; Gourley, J.J.; Kirstetter, P.-E.; Yong, B.; Tian, Y.; Zhang, Z.; Shen, Y.; Hu, J.; et al. Similarity and difference of the two successive V6 and V7 TRMM multisatellite precipitation analysis performance over China. J. Geophys. Res.-Atmos. 2013, 118, 13060–13074. [Google Scholar] [CrossRef]
- Yong, B.; Chen, B.; Tian, Y.; Yu, Z.; Hong, Y. Error-Component Analysis of TRMM-Based Multi-Satellite Precipitation Estimates over Mainland China. Remote Sens. 2016, 8, 440. [Google Scholar] [CrossRef]
- Beck, H.E.; van Dijk, A.I.J.M.; Levizzani, V.; Schellekens, J.; Miralles, D.G.; Martens, B.; de Roo, A. MSWEP: 3-hourly 0.25 degrees global gridded precipitation (1979–2015) by merging gauge, satellite, and reanalysis data. Hydrol. Earth Syst. Sci. 2017, 21, 589–615. [Google Scholar] [CrossRef]
- Cai, Y.; Jin, C.; Wang, A.; Guan, D.; Wu, J.; Yuan, F.; Xu, L. Comprehensive precipitation evaluation of TRMM 3B42 with dense rain gauge networks in a mid-latitude basin, northeast, China. Theor. Appl. Climatol. 2016, 126, 659–671. [Google Scholar] [CrossRef]
- Yuan, F.; Zhang, L.; Win, K.W.W.; Ren, L.; Zhao, C.; Zhu, Y.; Jiang, S.; Liu, Y. Assessment of GPM and TRMM Multi-Satellite Precipitation Products in Streamflow Simulations in a Data-Sparse Mountainous Watershed in Myanmar. Remote Sens. 2017, 9, 302. [Google Scholar] [CrossRef]
- Daly, C.; Neilson, R.P.; Phillips, D.L. A Statistical-Topographic Model for Mapping Climatological Precipitation Over Mountain Terrain. J. Appl. Meteorol. 1994, 33, 140–158. [Google Scholar] [CrossRef]
- Hao, Z.-C.; Tong, K.; Liu, X.-L.; Zhang, L.-L. Capability of TMPA products to simulate streamflow in upper Yellow and Yangtze River basins on Tibetan Plateau. Water Sci. Eng. 2014, 7, 237–249. [Google Scholar] [CrossRef]
Figure 1.
High-density rain gauge observation network (black dots) and main hydrological basins in China(blue outline). Base map is the topography of mainland China (Map Registration No. GS (2016)2885). The lower-right subplot displays the South China Sea. The 10 sub regions used in this study are as follows: (a) Songhua River Basin (SHJ), (b) Liaohe River Basin (LH), (c) river basins in northwest China (XB), (d) Haihe River Basin (HAH), (e) Yellow River Basin (YR), (f) Yangtze River Basin (YZR), (g) Huaihe River Basin (HUH), (h) River Basins in Southeast China (DN), (i) river basins in southwest China (XN), and (j) Pearl River Basin (PR).
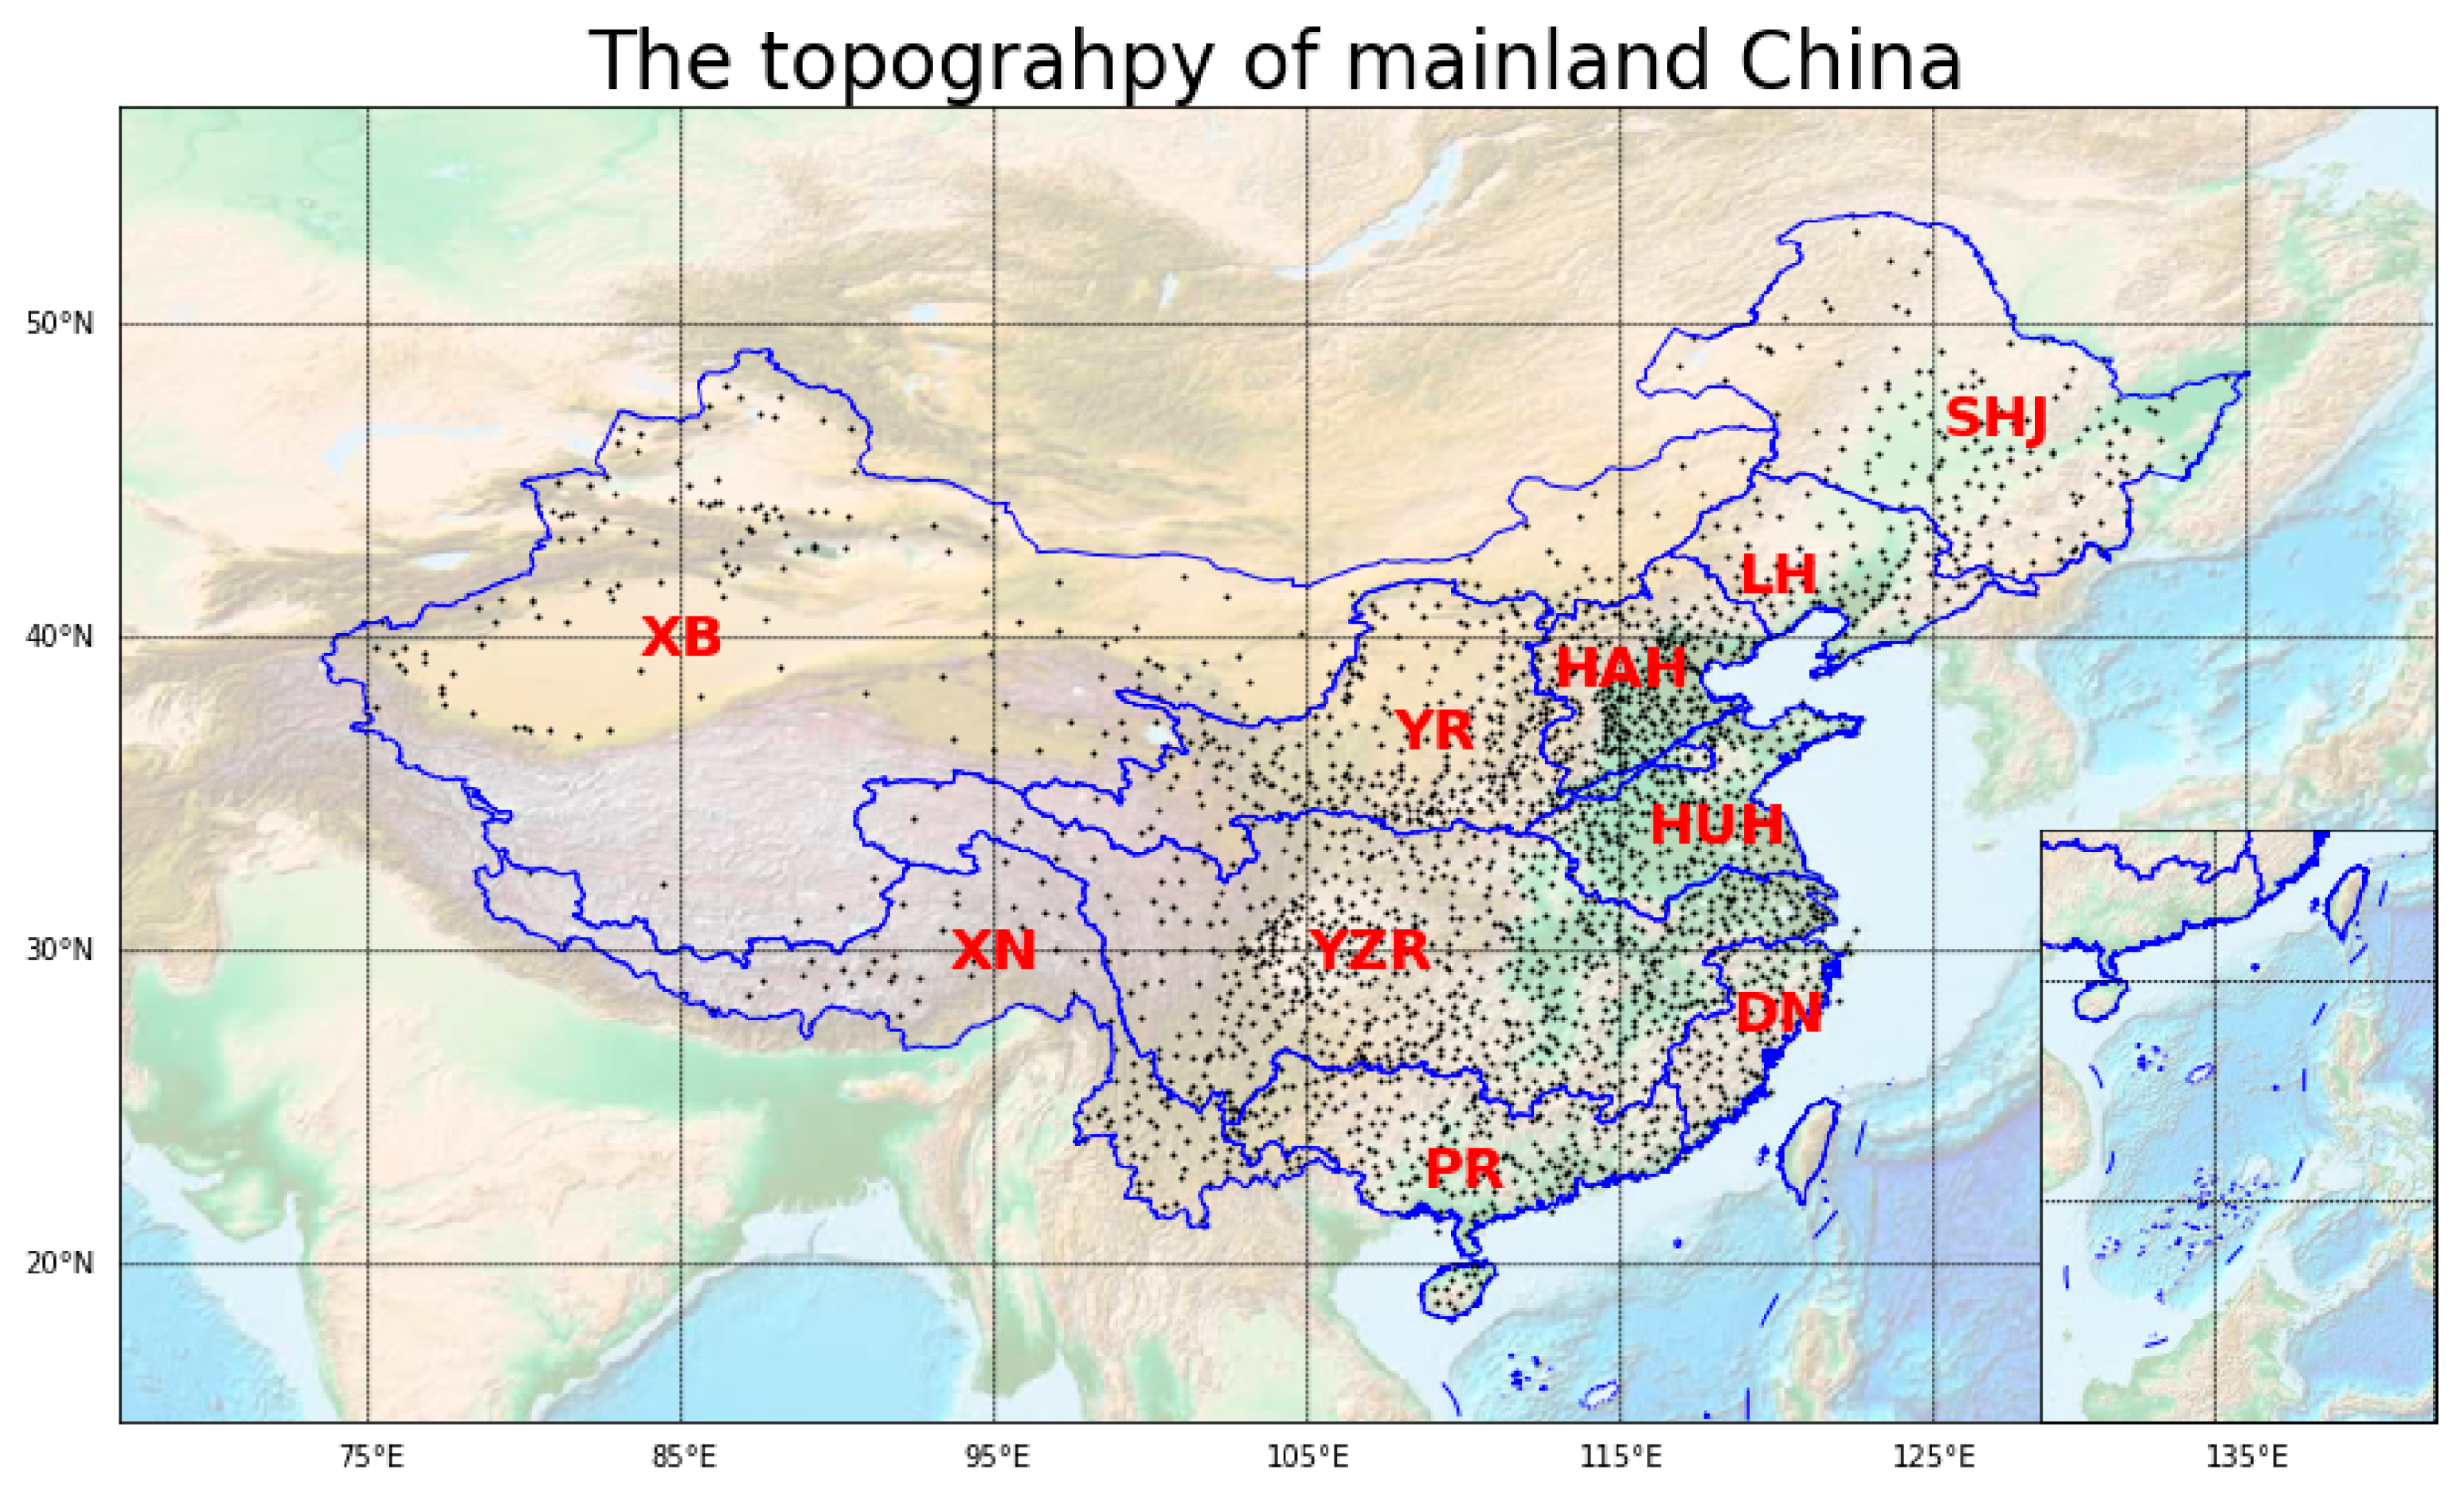
Figure 2.
Comparison of correlation coefficient(r) between CN05.1’s precipitation and in situ observation during 1981–2014. Subplots (a–l) denote the r’s evolution from January and December.
Figure 2.
Comparison of correlation coefficient(r) between CN05.1’s precipitation and in situ observation during 1981–2014. Subplots (a–l) denote the r’s evolution from January and December.
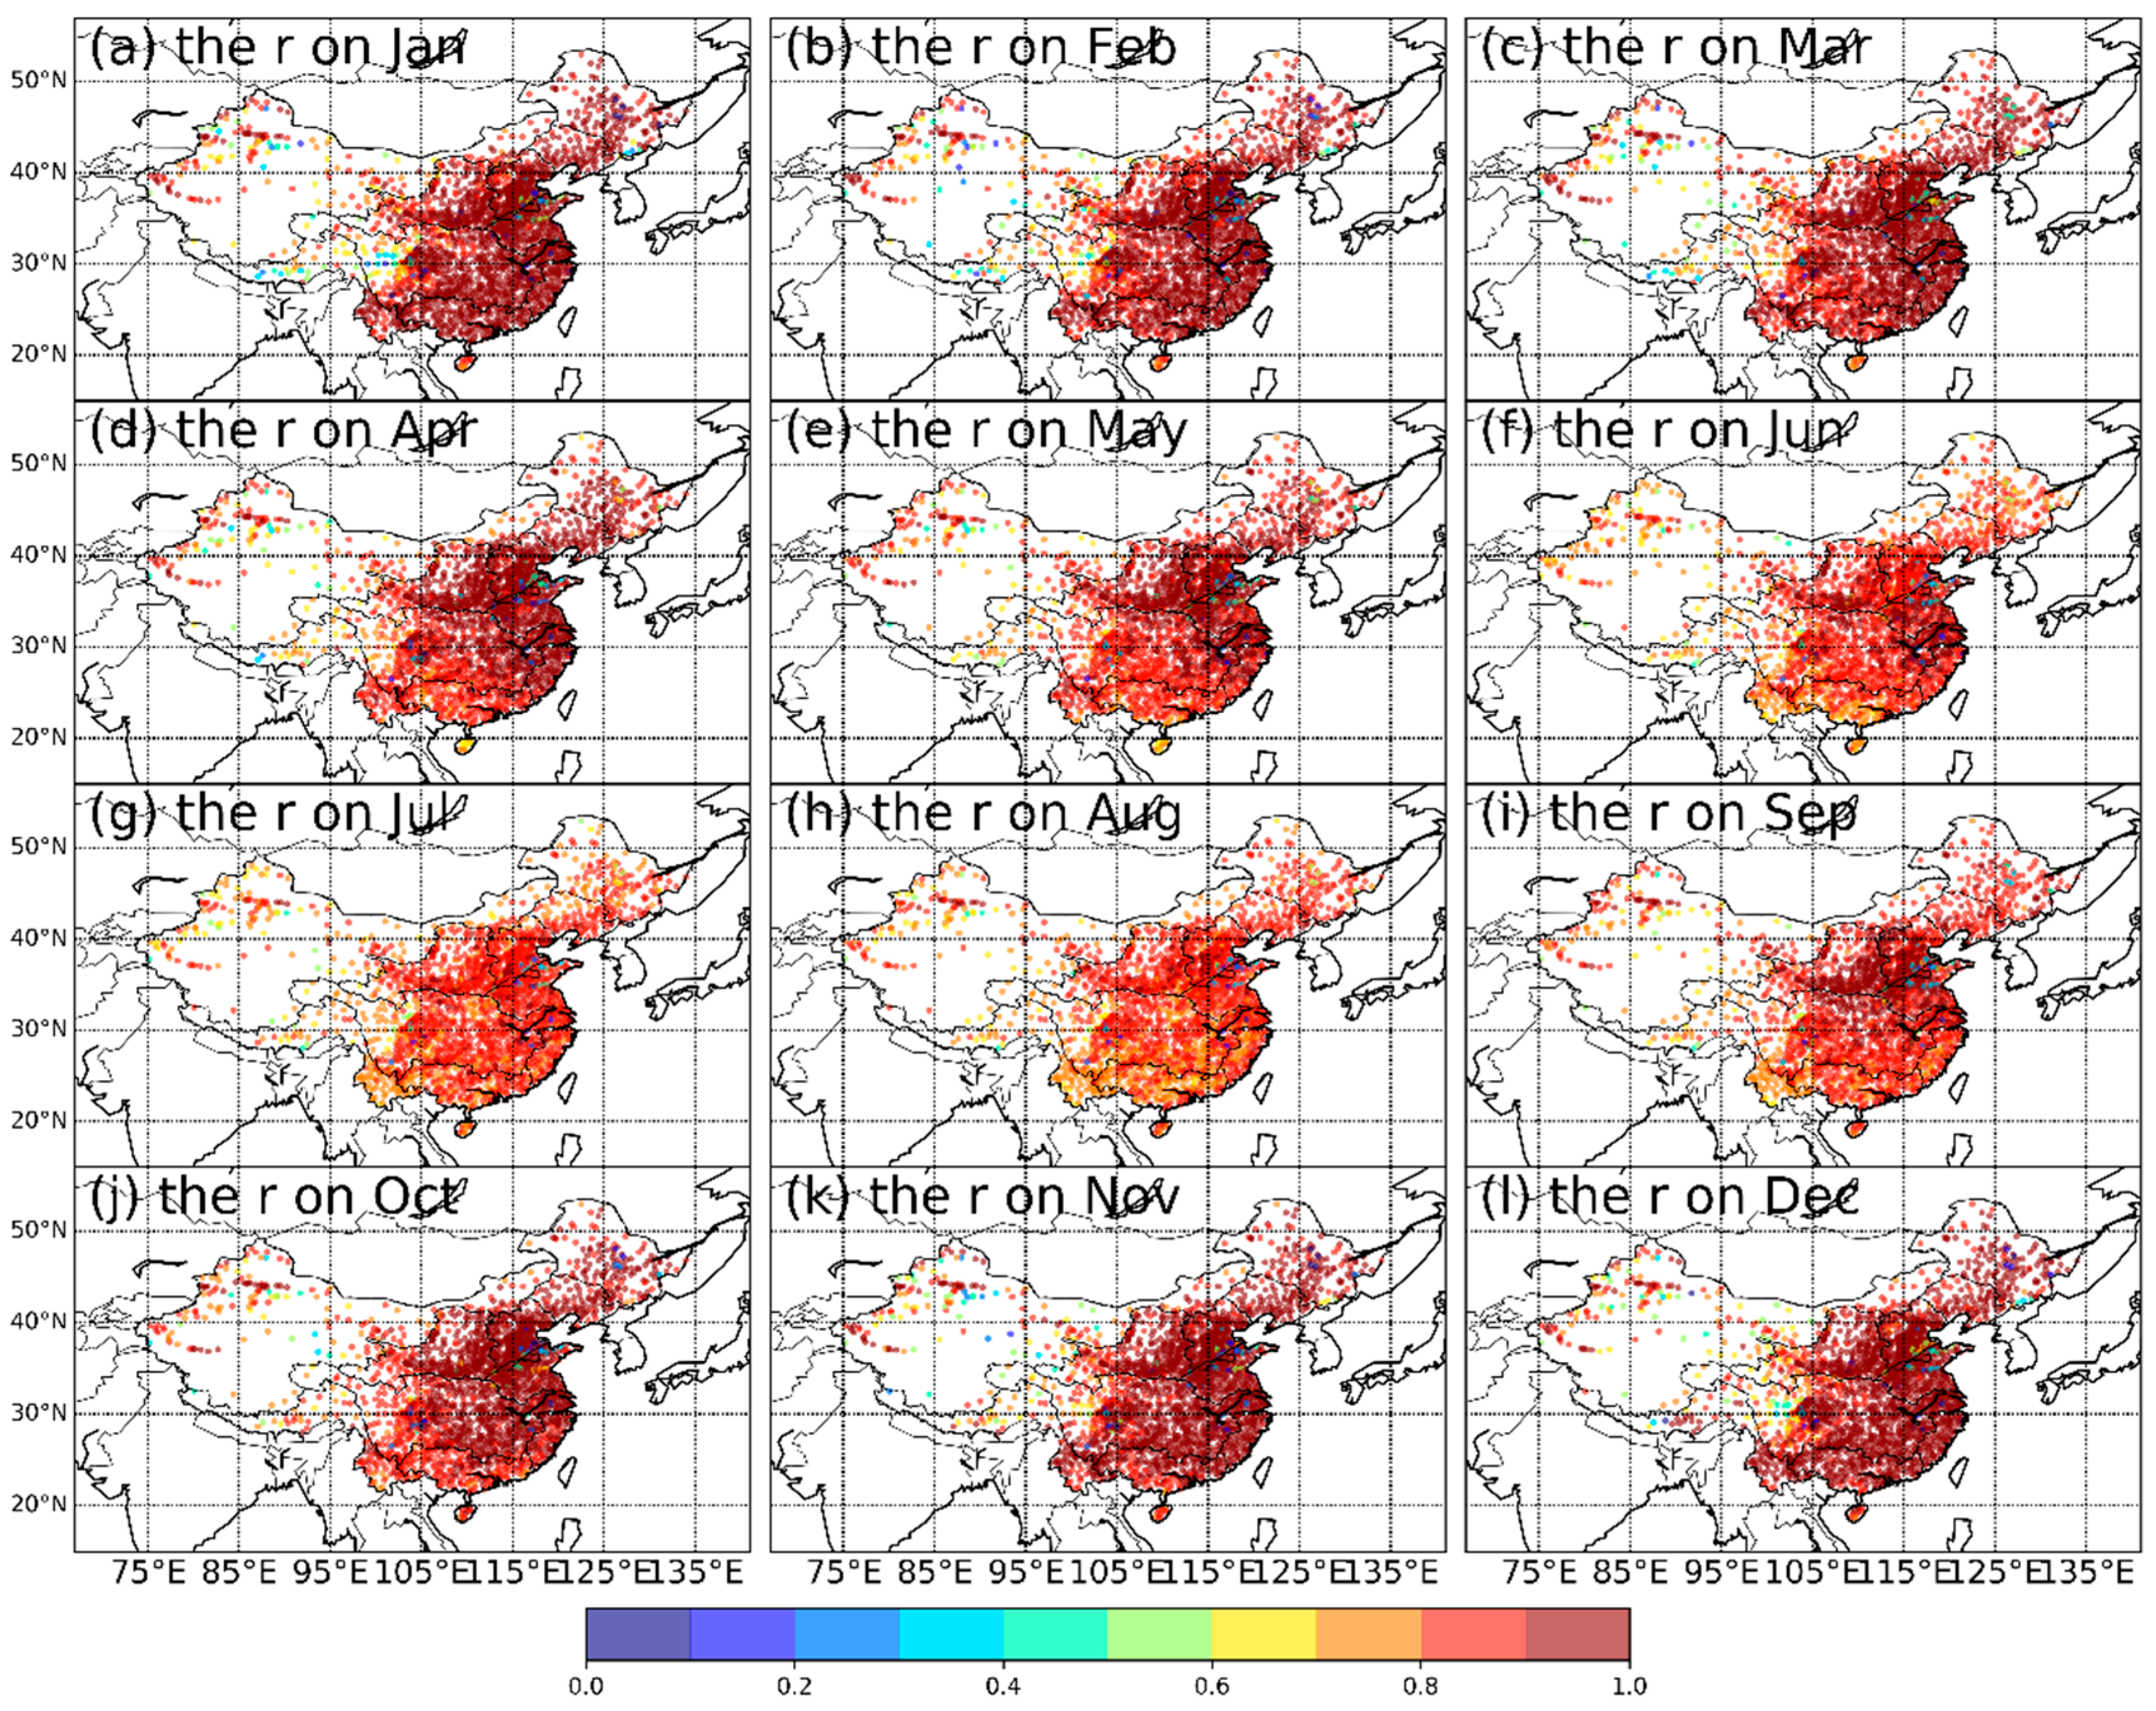
Figure 3.
Comparison of mean error (ME) between CN05.1’s precipitation and in situ observation during 1981–2014 (units of mm/day). Subplots (a–l) denote the ME’s evolution from January and December.
Figure 3.
Comparison of mean error (ME) between CN05.1’s precipitation and in situ observation during 1981–2014 (units of mm/day). Subplots (a–l) denote the ME’s evolution from January and December.
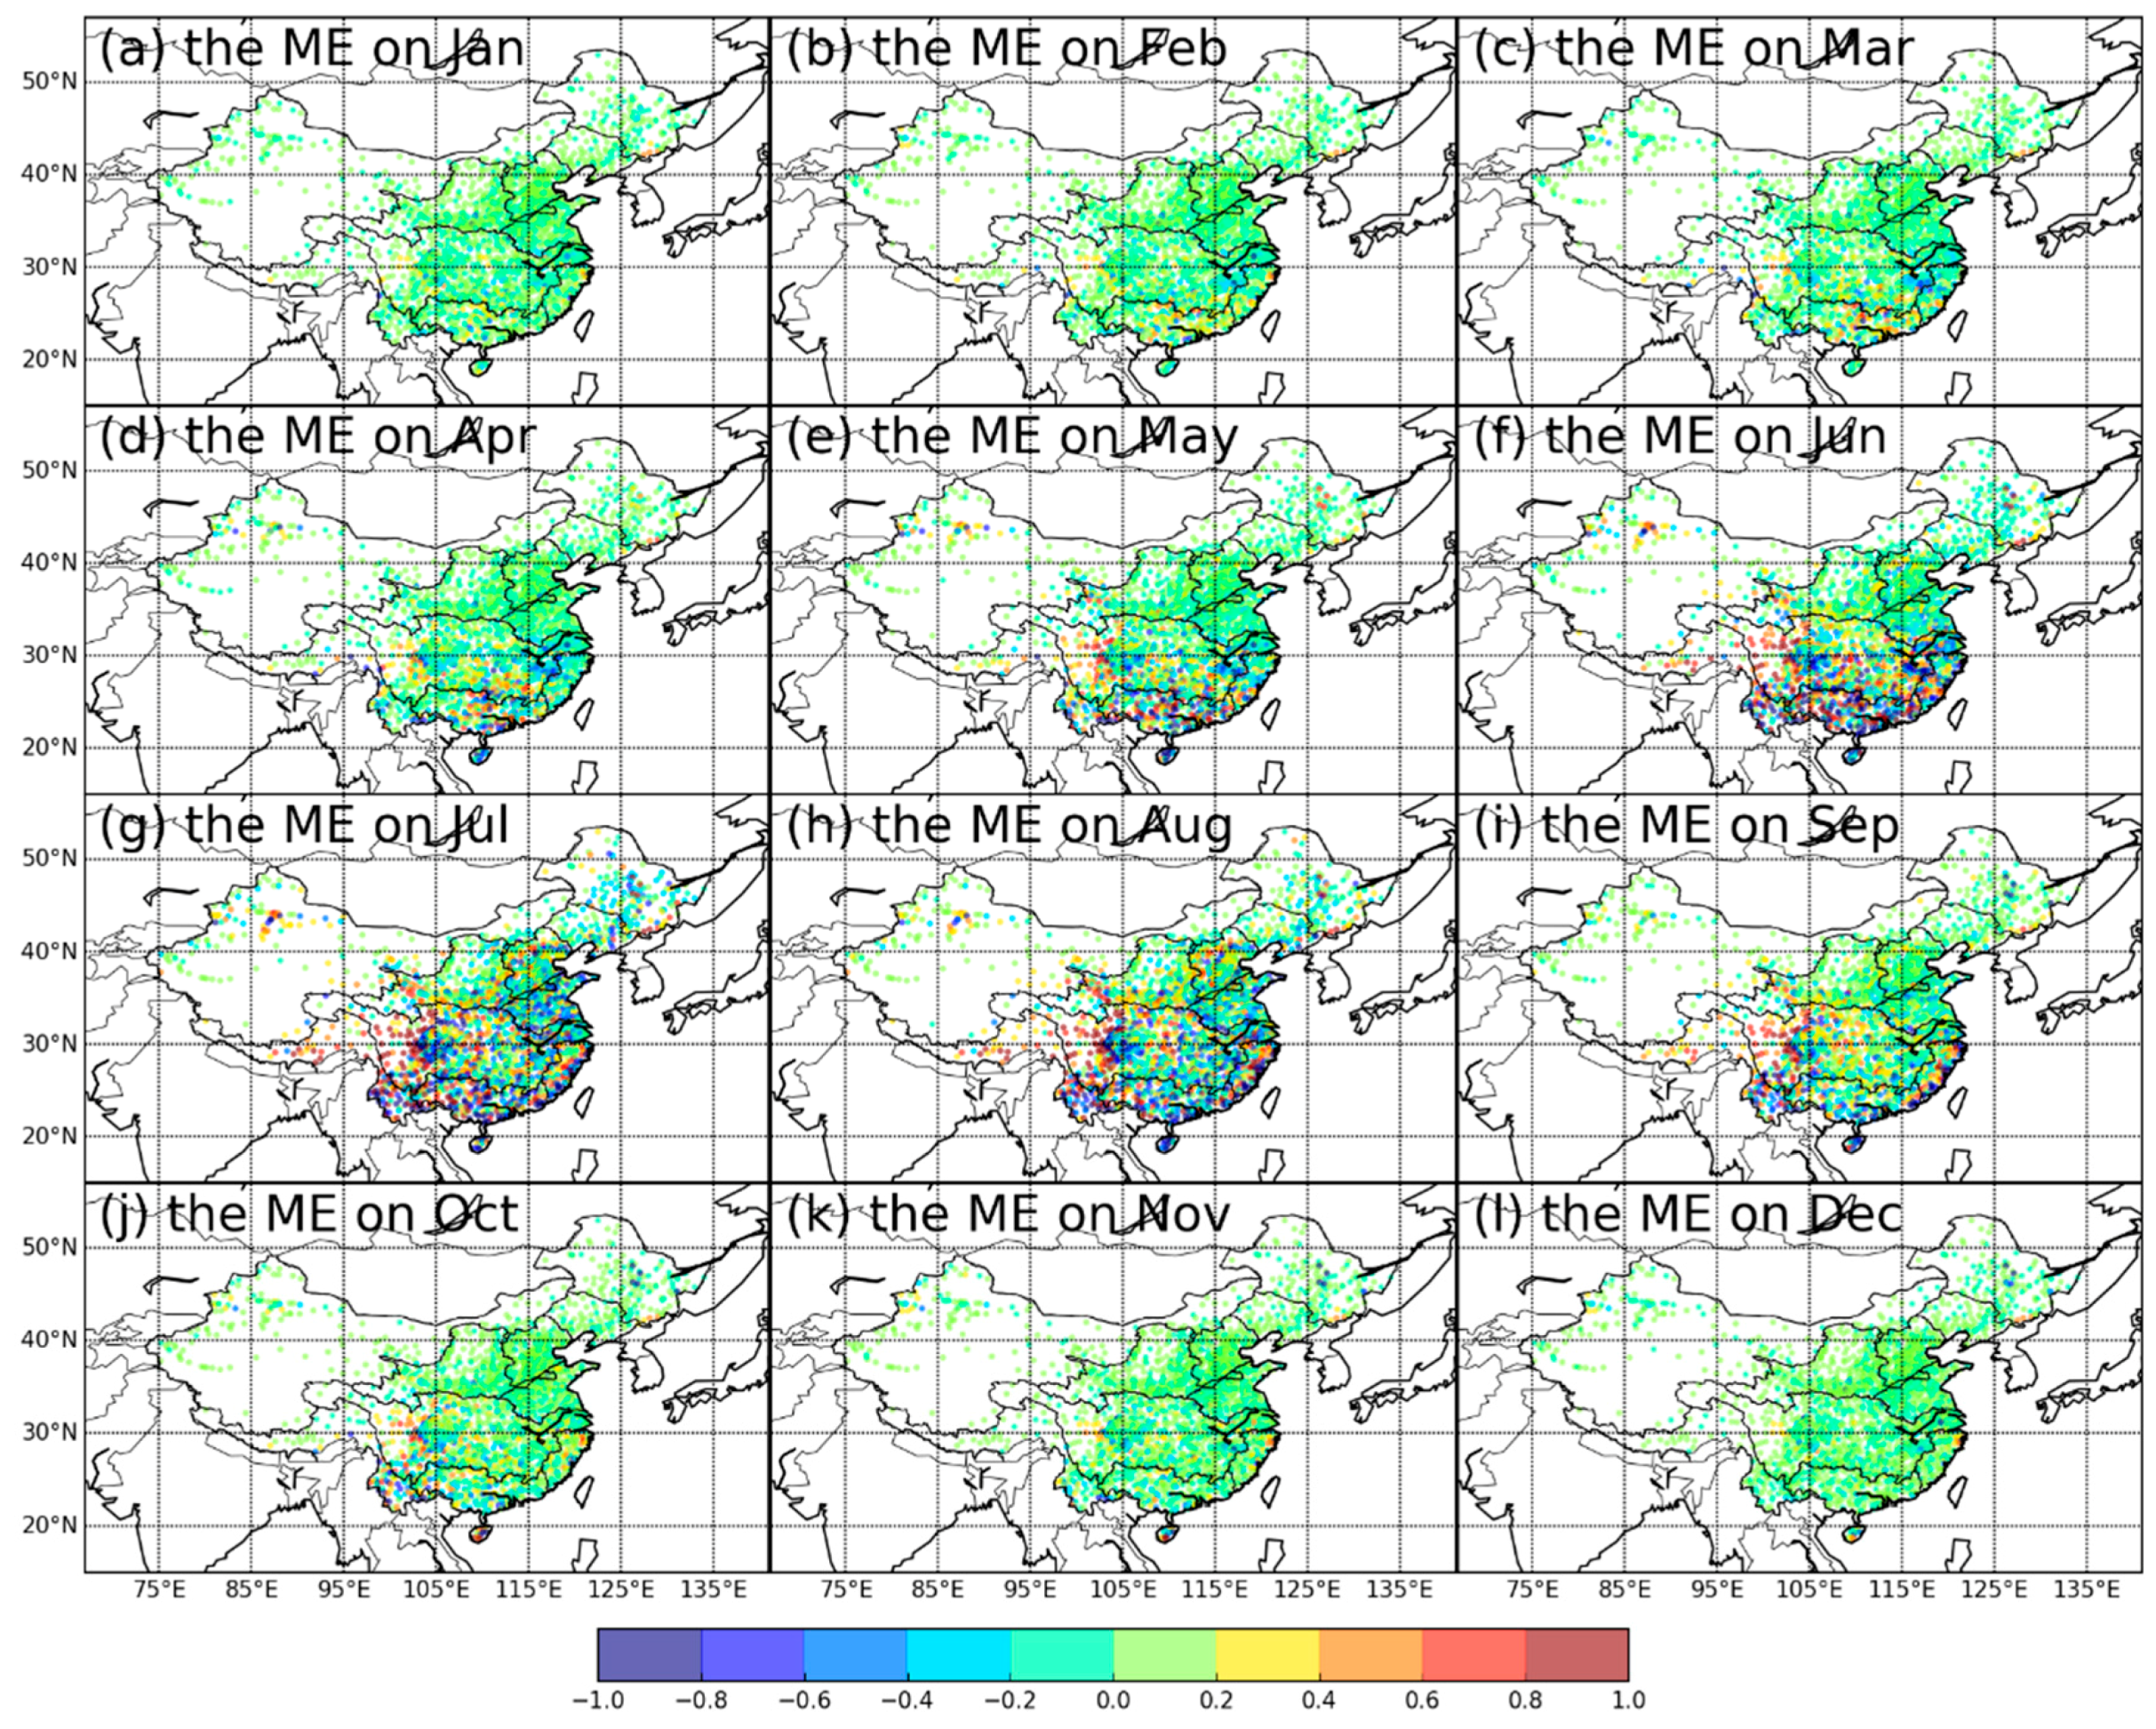
Figure 4.
Correlation coefficient(r) between Climate Hazards Group Infrared Precipitation Satellite (CHIRPS)’ precipitation and gridded observation during 1981–2014. Subplots (a–l) denote the r’s evolution from January and December.
Figure 4.
Correlation coefficient(r) between Climate Hazards Group Infrared Precipitation Satellite (CHIRPS)’ precipitation and gridded observation during 1981–2014. Subplots (a–l) denote the r’s evolution from January and December.

Figure 5.
Comparison of mean error (ME) between CHIRPS precipitation and observation during 1981–2014 (units of mm/day). Subplots (a–l) denote the ME’s evolution from January and December.
Figure 5.
Comparison of mean error (ME) between CHIRPS precipitation and observation during 1981–2014 (units of mm/day). Subplots (a–l) denote the ME’s evolution from January and December.
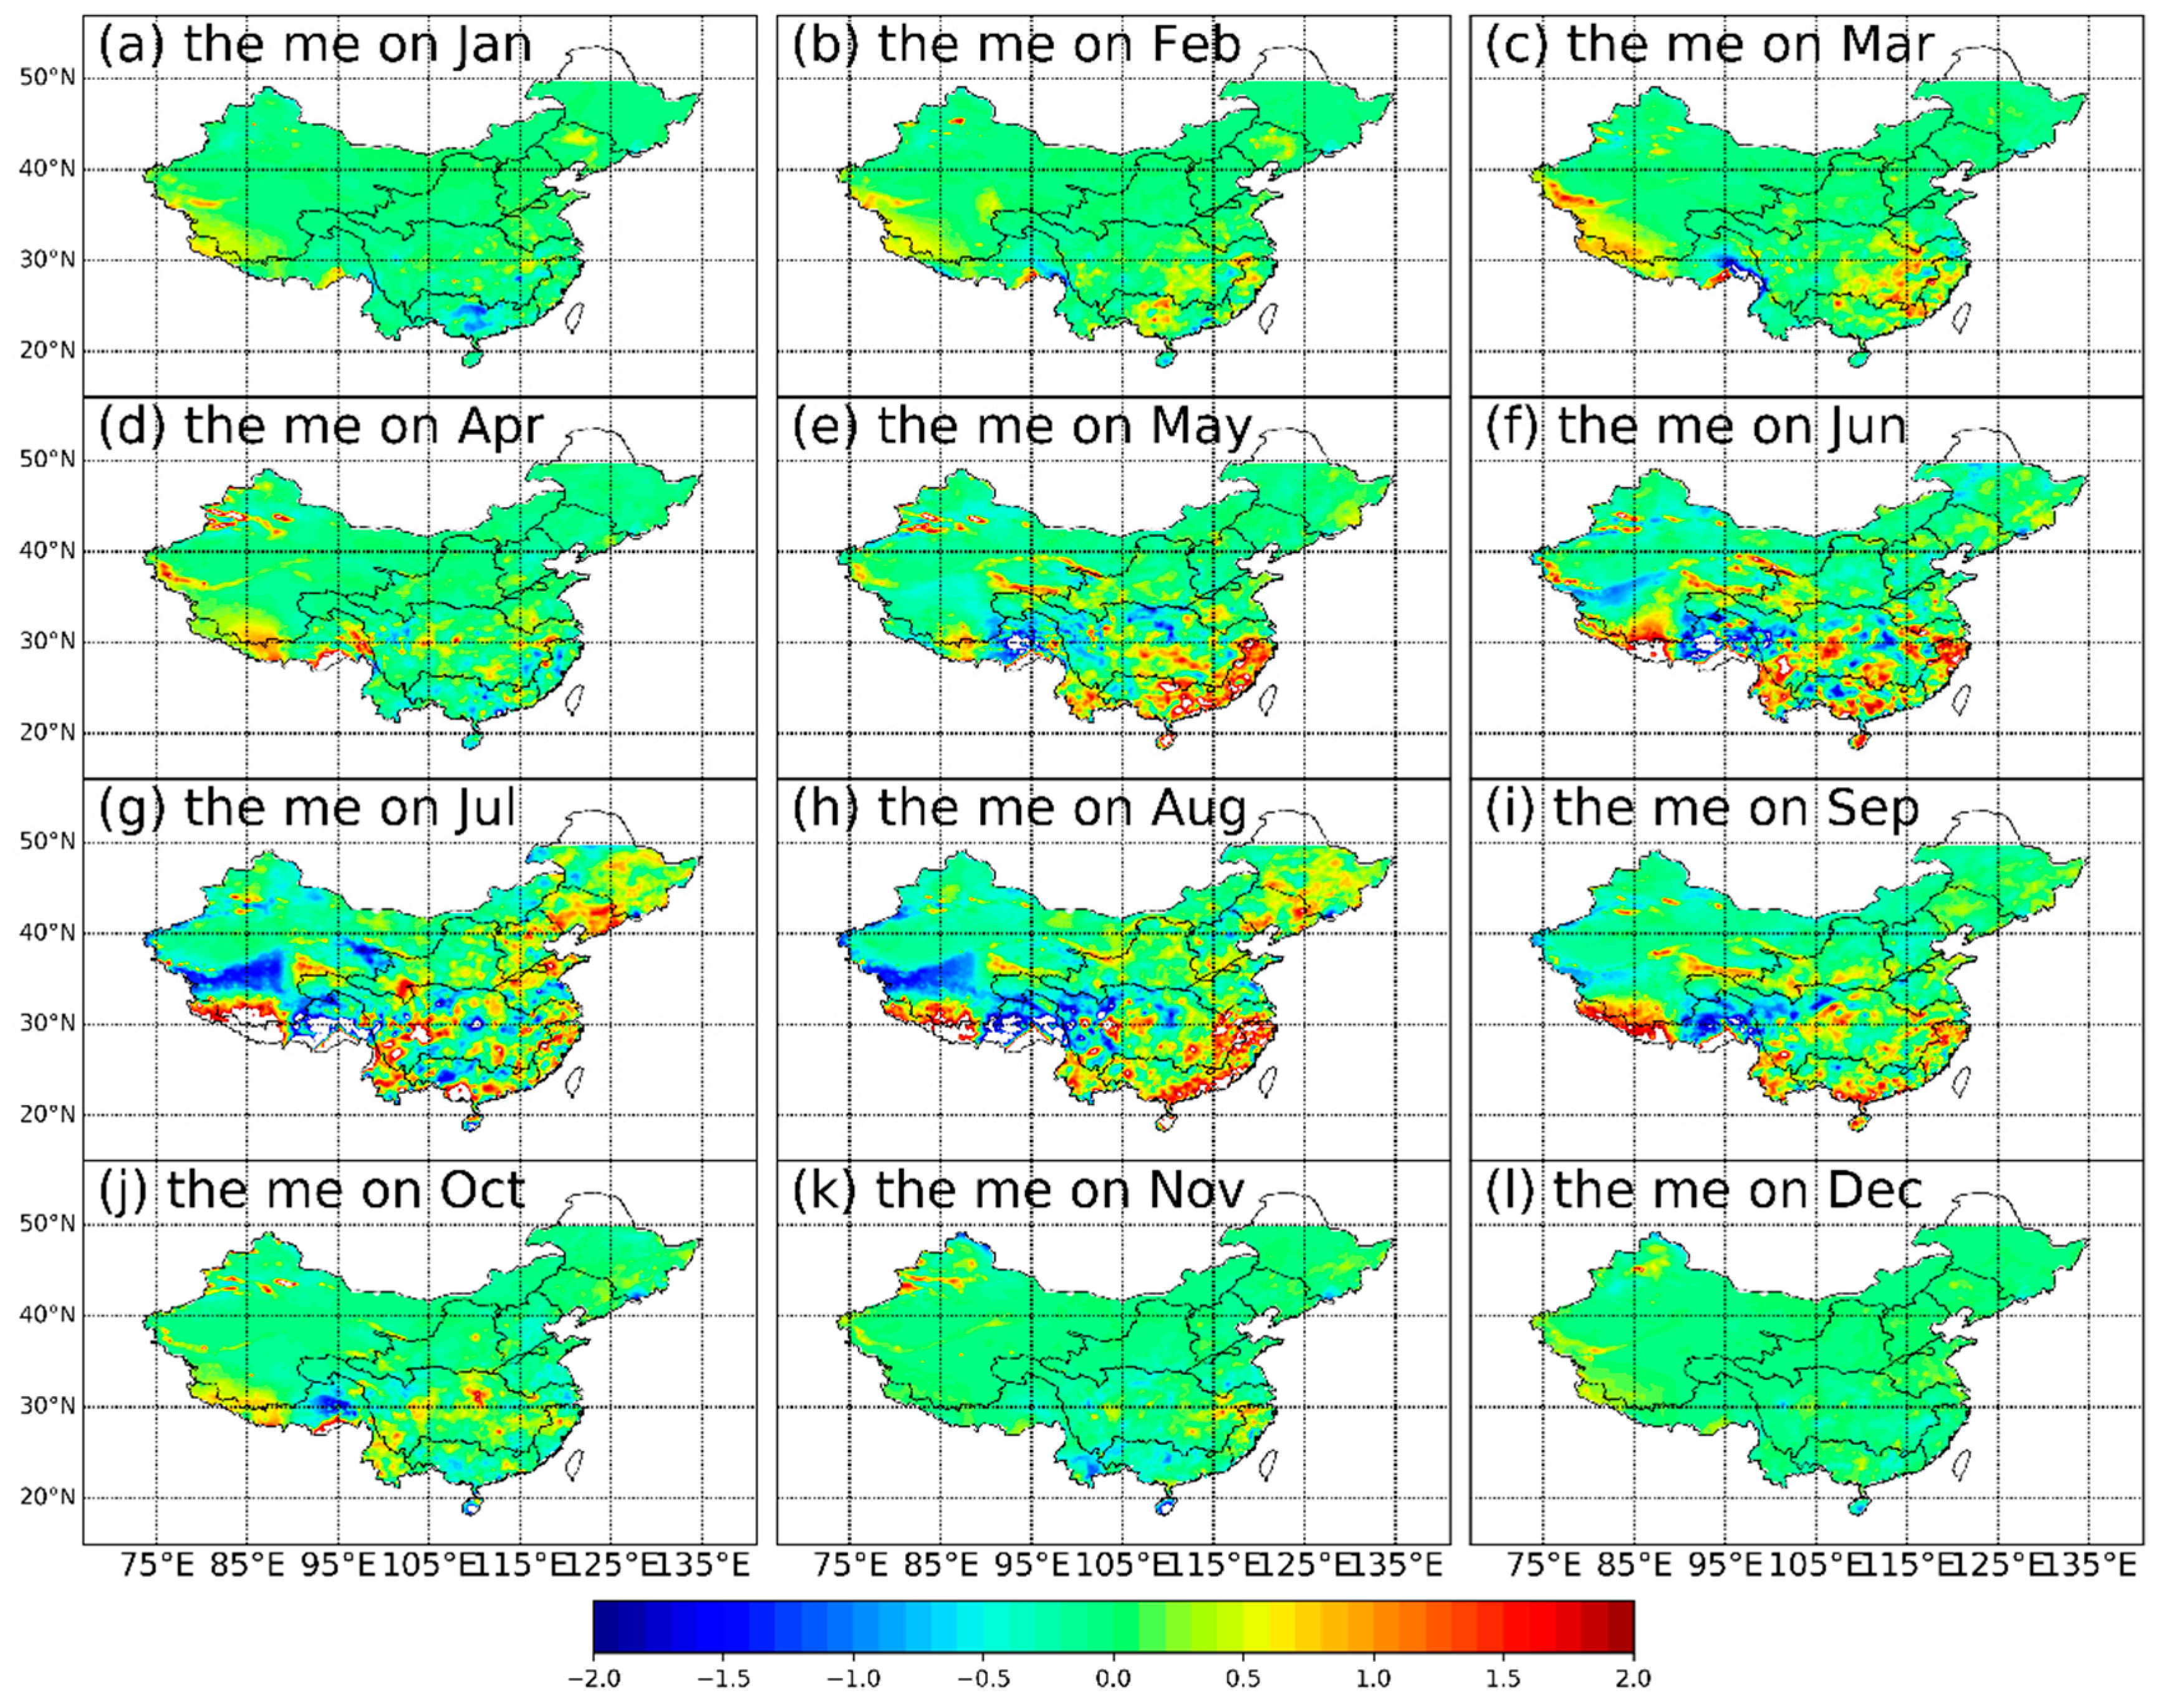
Figure 6.
Spatial patterns of monthly PBIAS in CHIRPS. Subplots (a–l) show the PBIAS from January to December.
Figure 6.
Spatial patterns of monthly PBIAS in CHIRPS. Subplots (a–l) show the PBIAS from January to December.

Figure 7.
Spatial patterns of monthly RSME in CHIRPS precipitation (units of mm/day). Subplots (a–l) denote the RSME’s evolution from January and December.
Figure 7.
Spatial patterns of monthly RSME in CHIRPS precipitation (units of mm/day). Subplots (a–l) denote the RSME’s evolution from January and December.
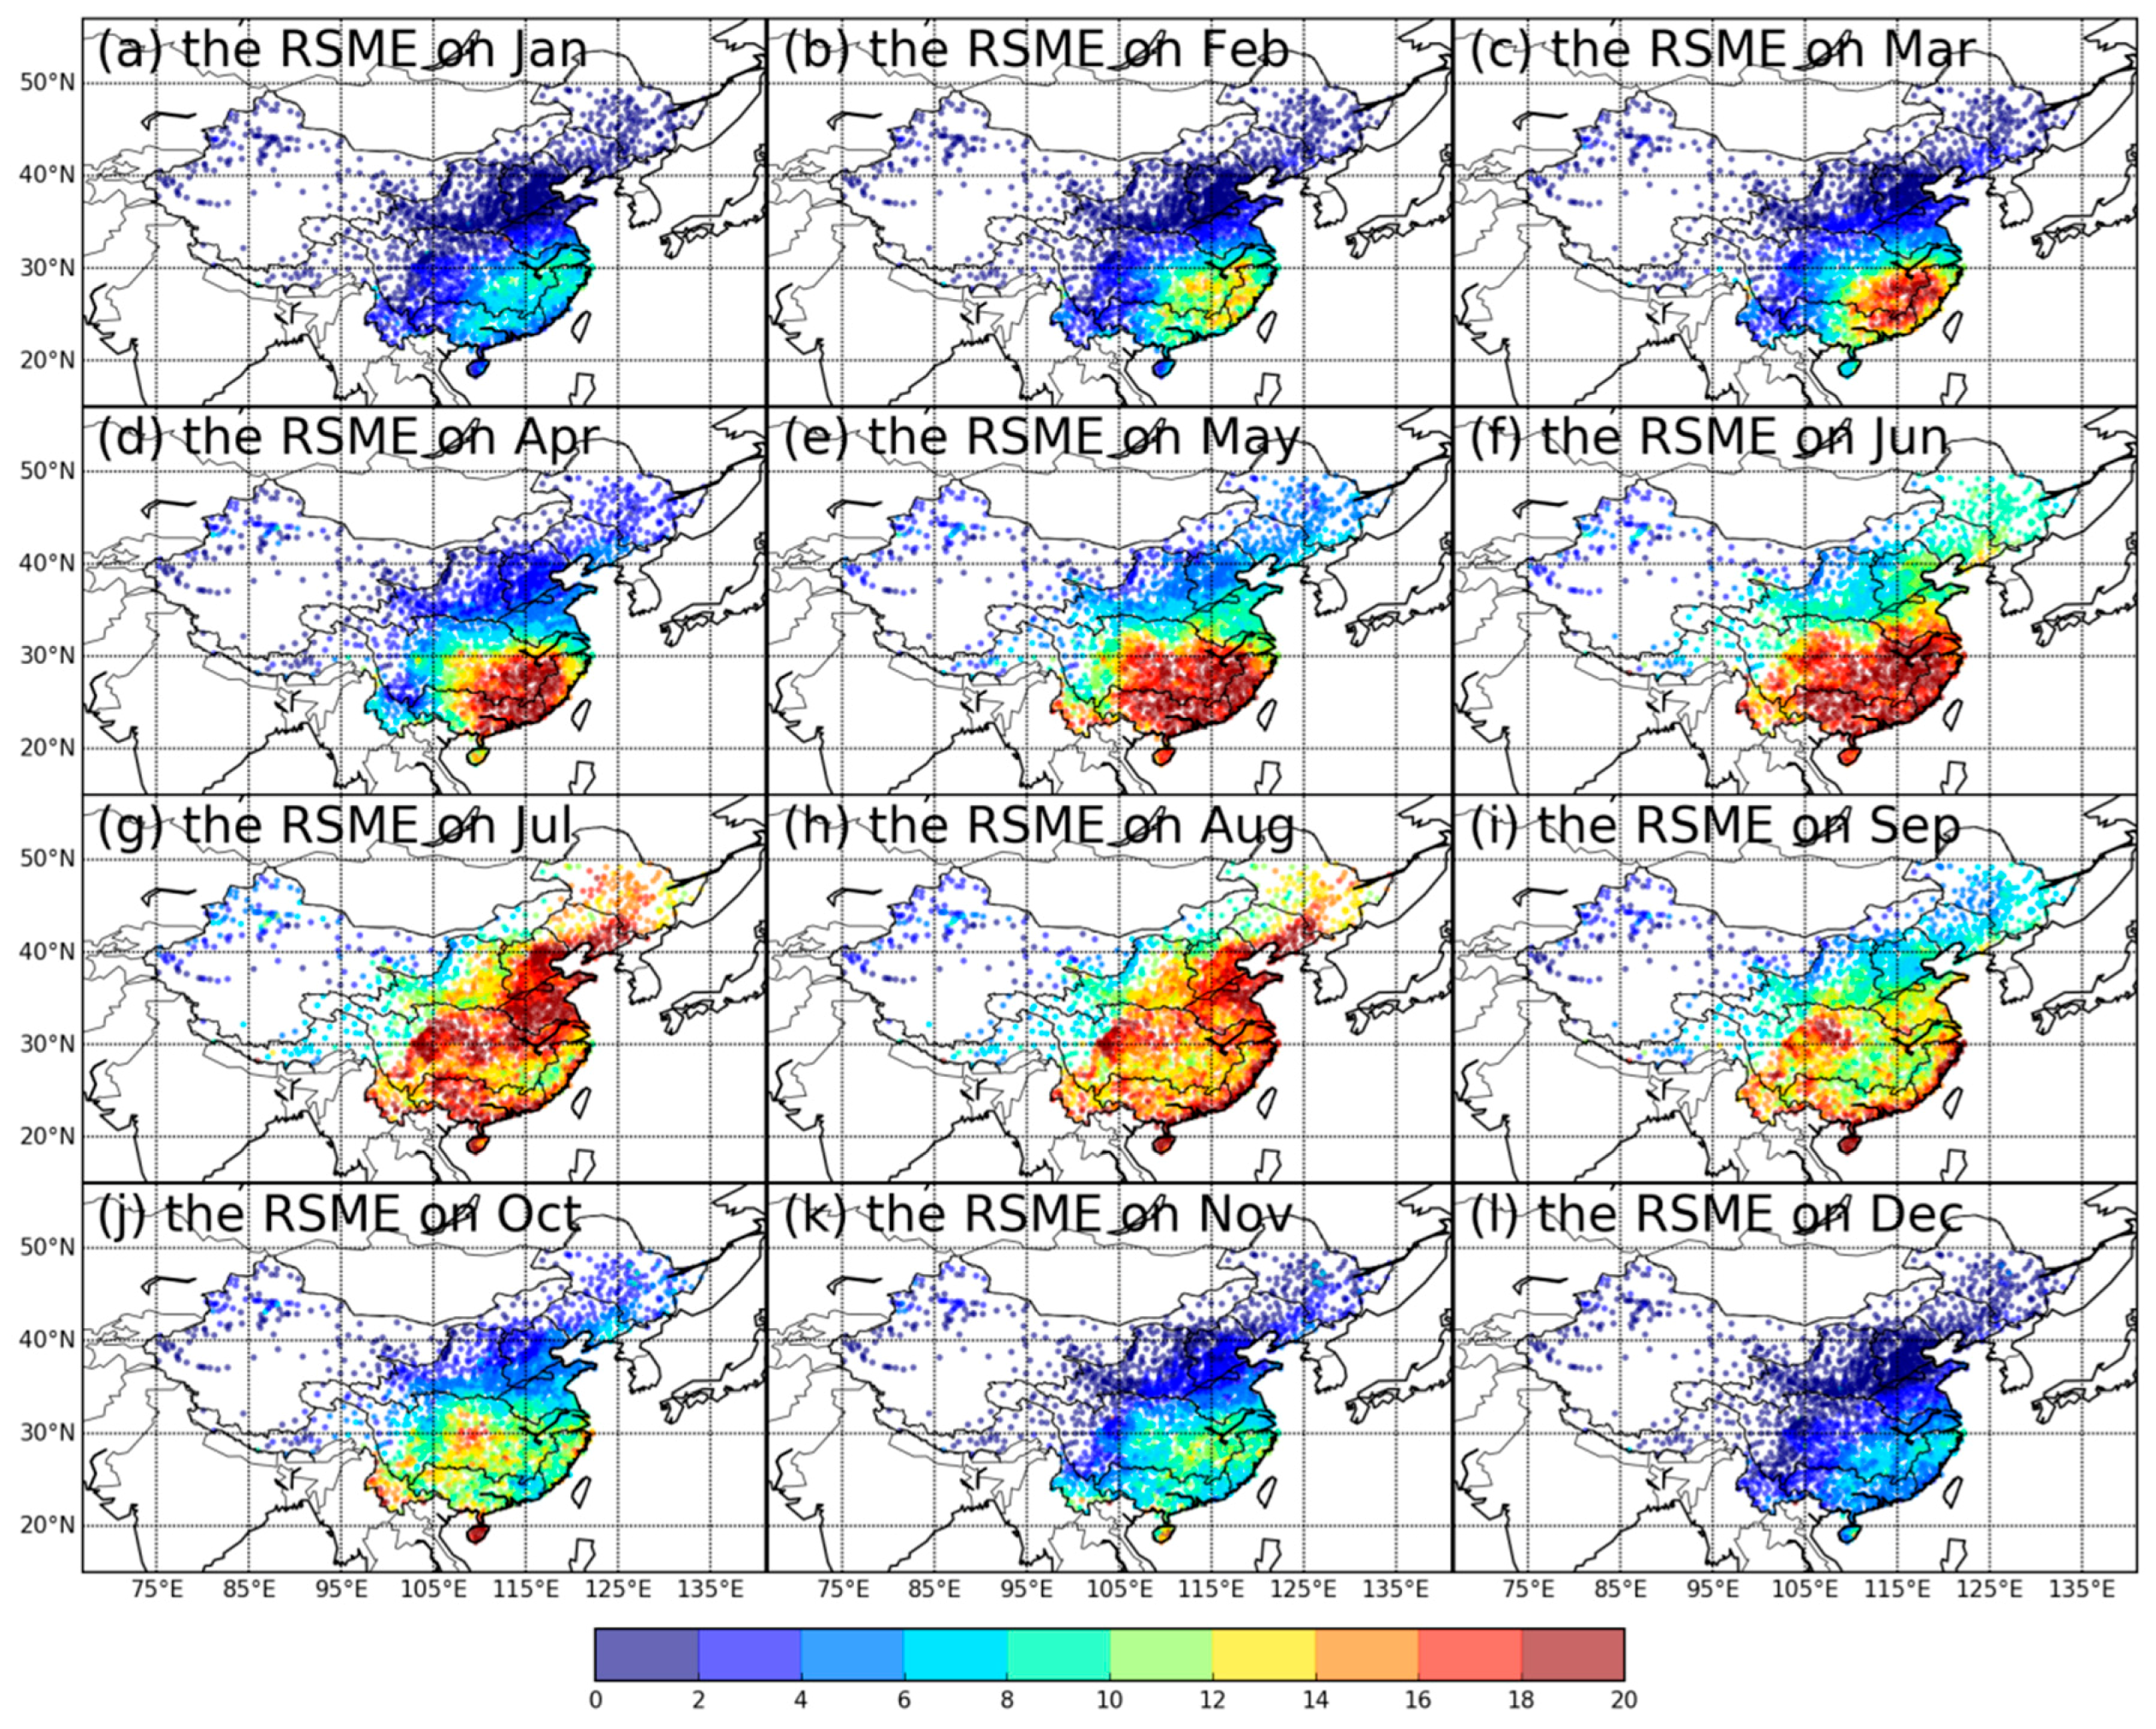
Figure 8.
Spatial patterns of monthly missed bias(MP) in CHIRPS precipitation. Subplots (a–l) denote the MP’s evolution from January and December.
Figure 8.
Spatial patterns of monthly missed bias(MP) in CHIRPS precipitation. Subplots (a–l) denote the MP’s evolution from January and December.
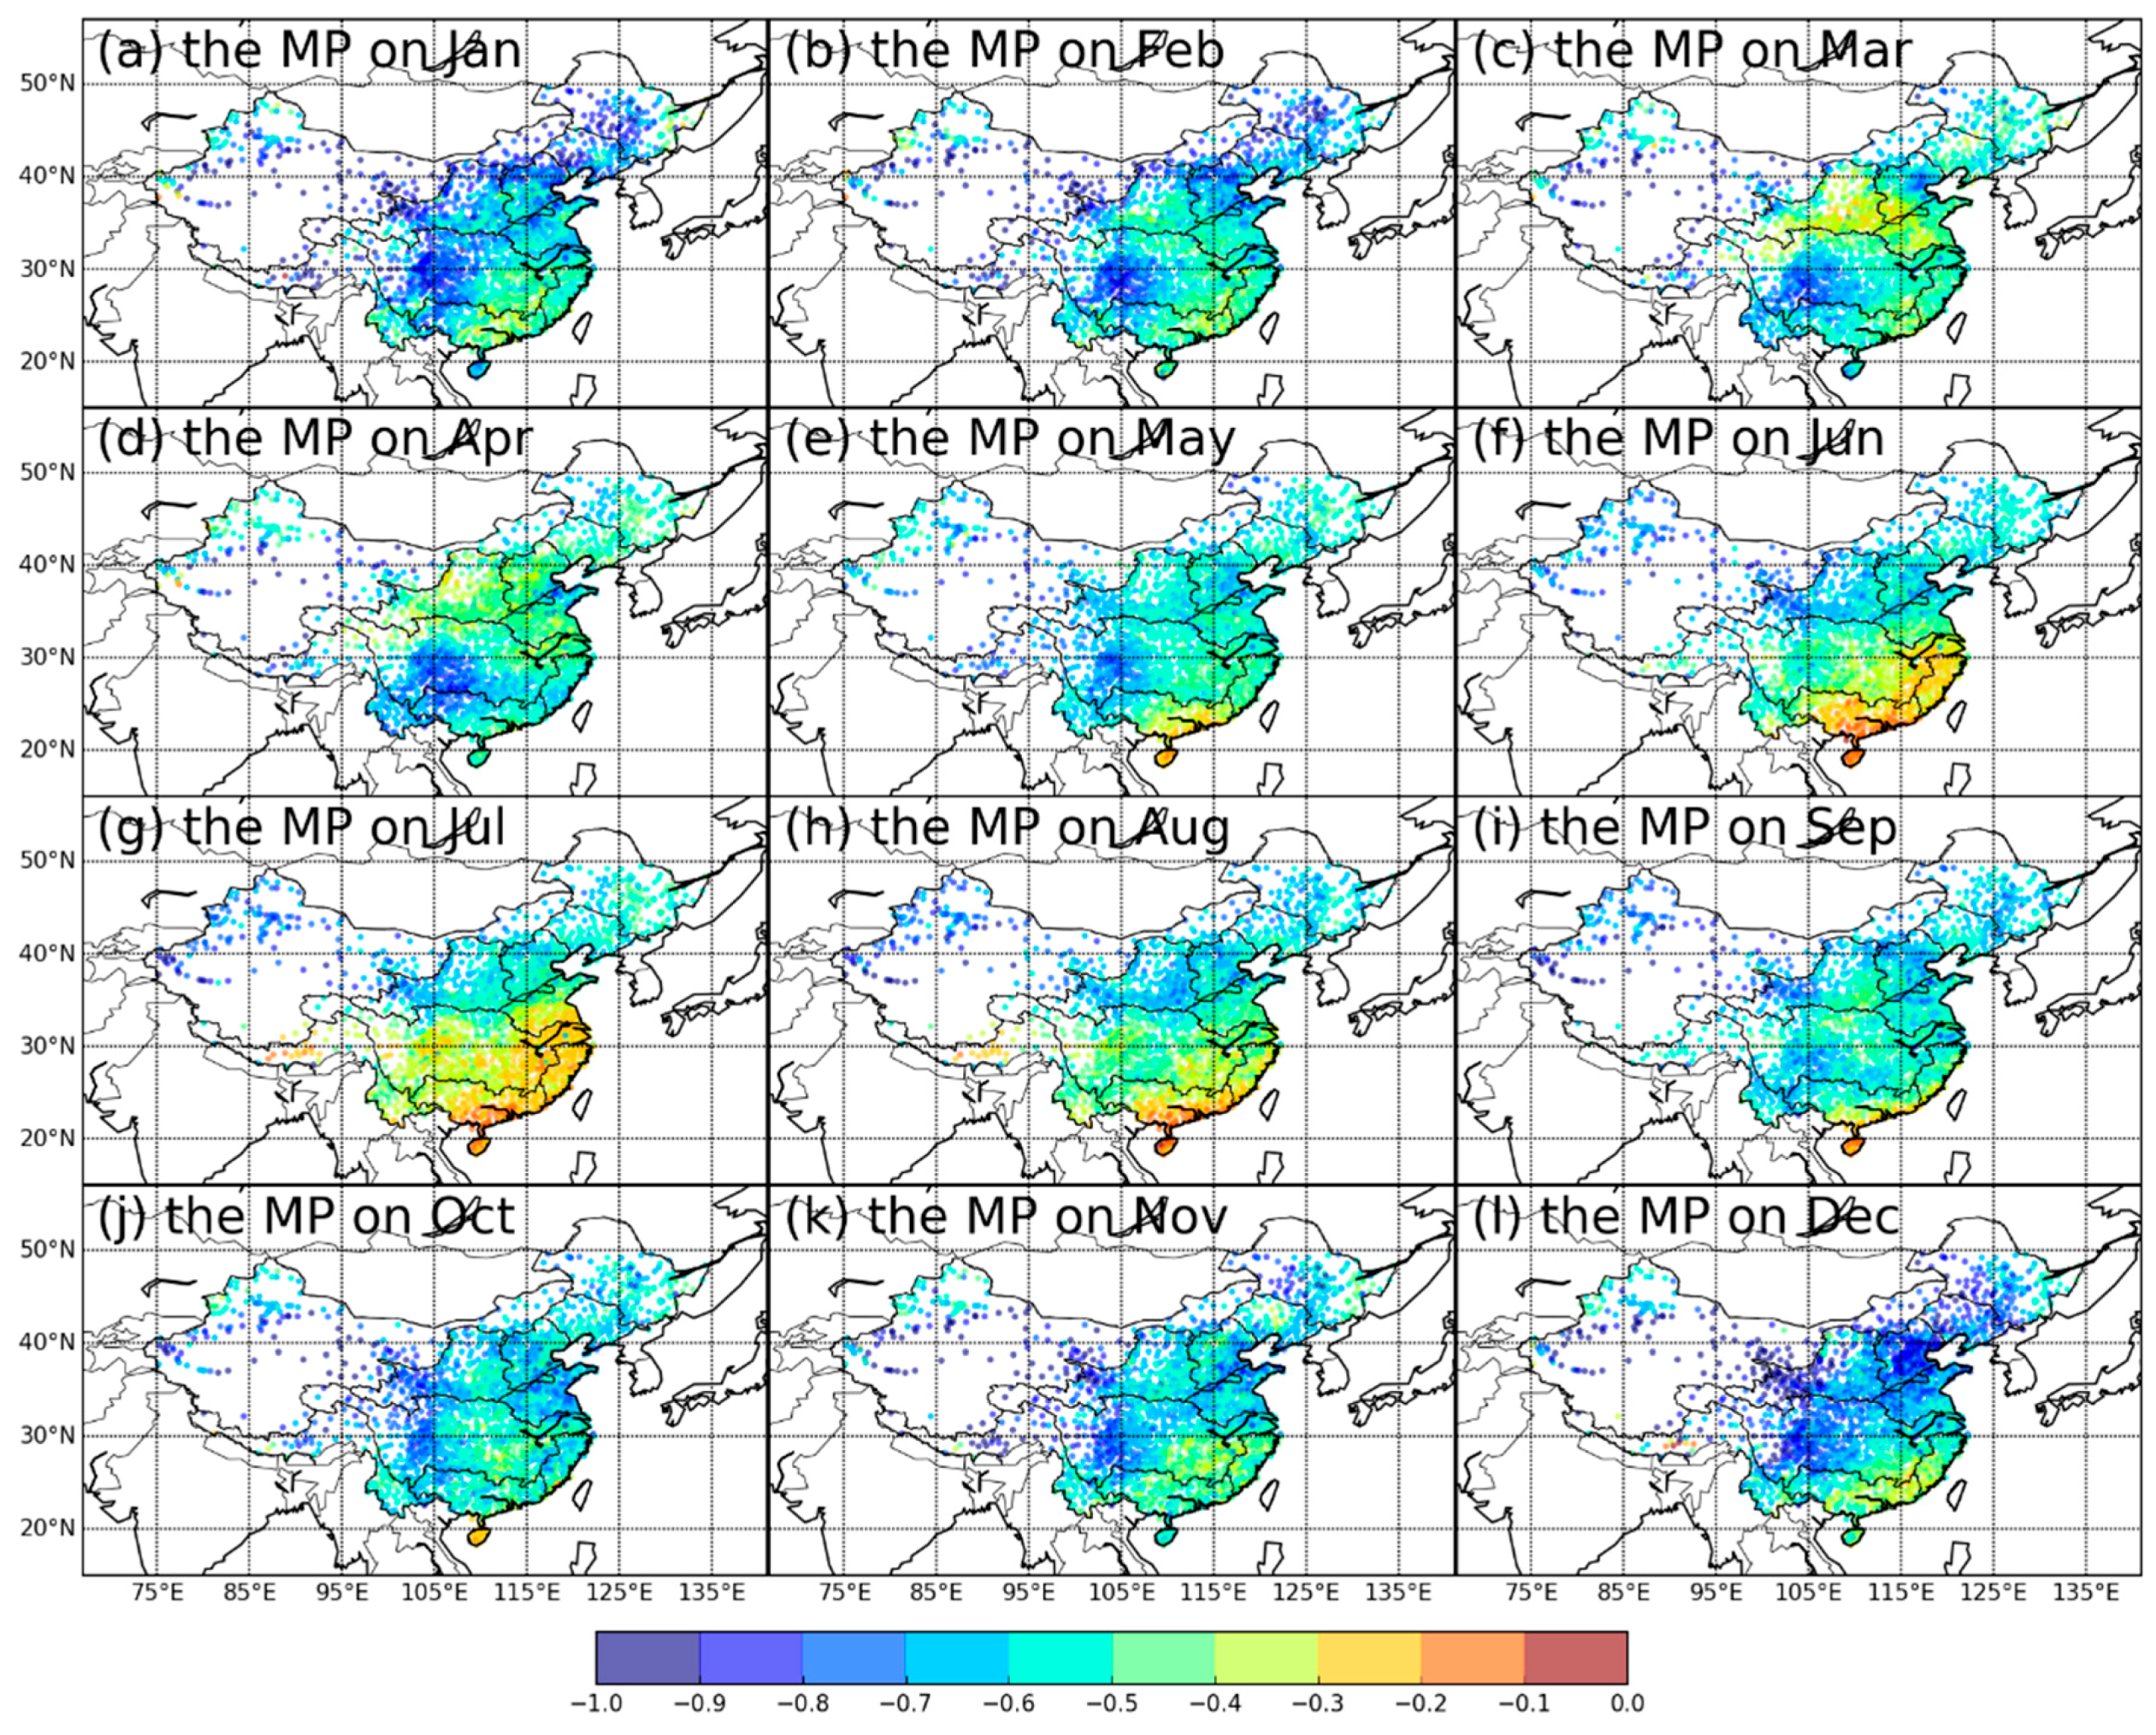
Figure 9.
Spatial patterns of monthly hit bias(HP) in CHIRPS precipitation. Subplots (a–l) denote the HP’s evolution from January and December.
Figure 9.
Spatial patterns of monthly hit bias(HP) in CHIRPS precipitation. Subplots (a–l) denote the HP’s evolution from January and December.

Figure 10.
Spatial patterns of monthly false bias(FP) in CHIRPS precipitation. Subplots (a–l) denote the FP evolution from January and December.
Figure 10.
Spatial patterns of monthly false bias(FP) in CHIRPS precipitation. Subplots (a–l) denote the FP evolution from January and December.

Figure 11.
r (a) and ME (b) ’s variation in CHIRPS, 1981–2012.
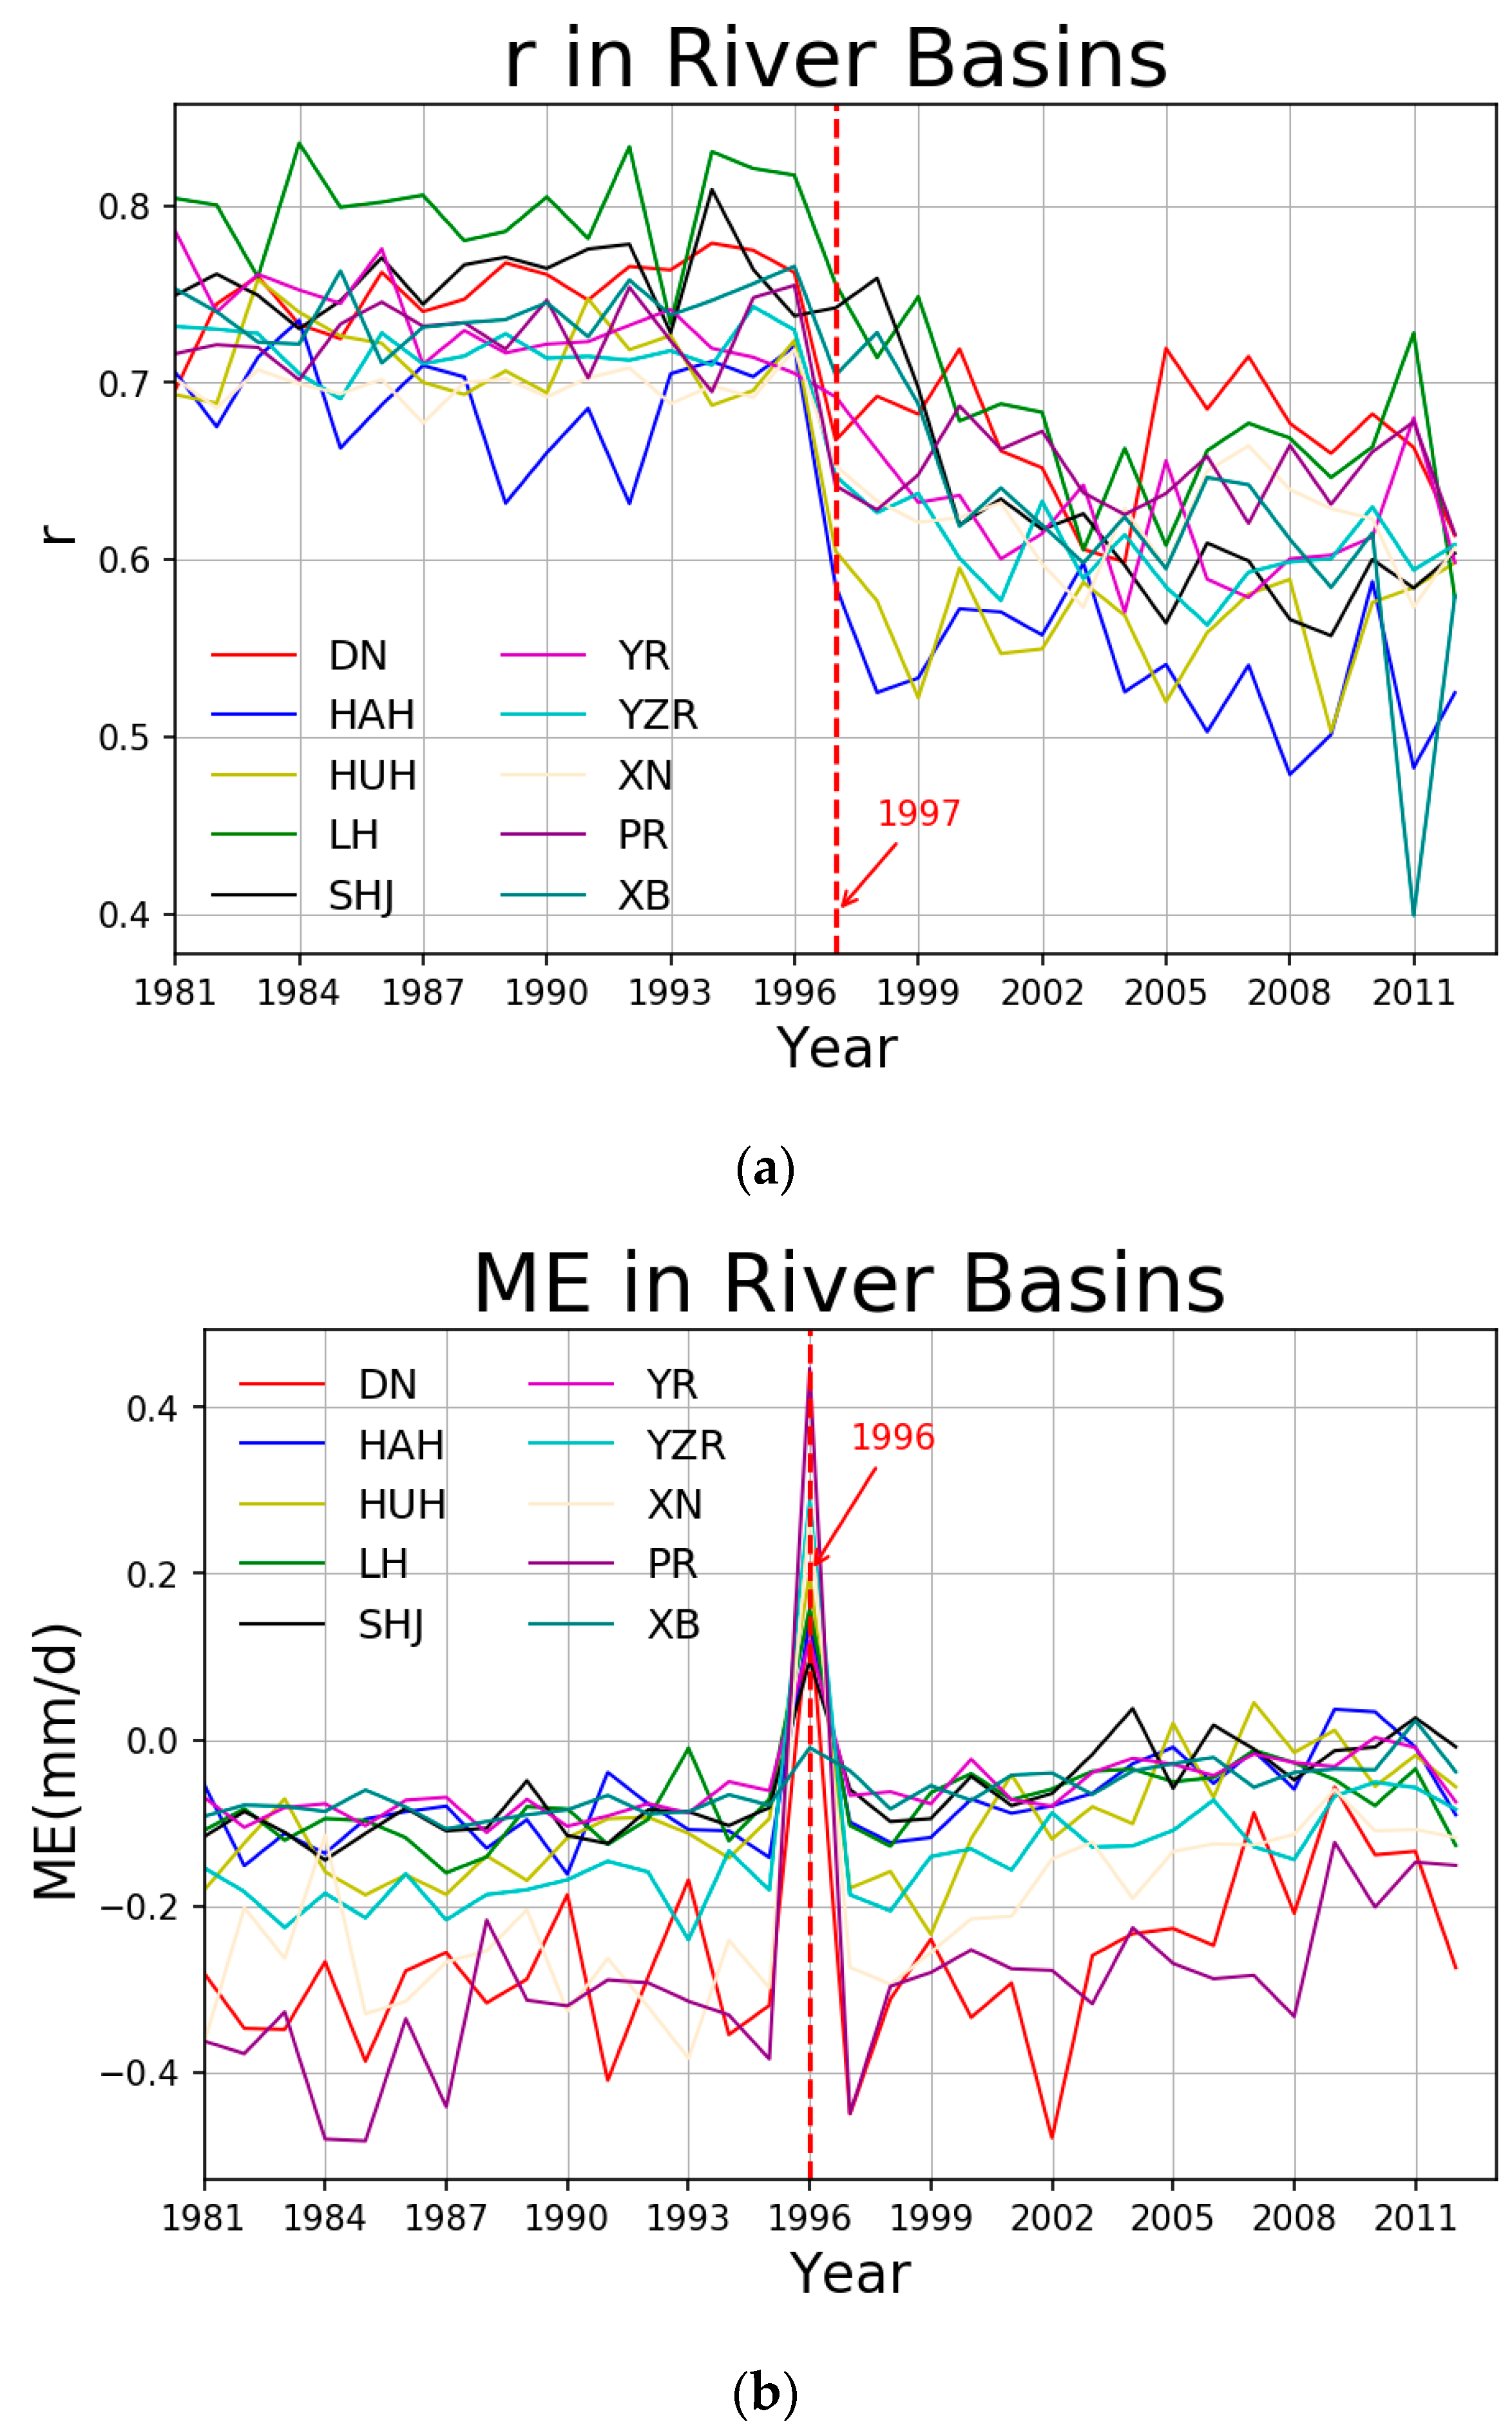
Figure 12.
CHIRPS’s probability-density-function (PDF) distribution in different temporal and spatial scales. The left column (1, 4, 7, 10, 13, 16, 19, 22 ,25, and 28) denotes the ten basin’s PDF in a year. The middle column (2, 5, 8, 11, 14, 17, 20, 23, 26, and 29) denotes the ten basin’s PDF in rainy season. The right column (3, 6, 9, 12, 15, 18, 21, 24, 27, and 30) denotes the ten basin’s PDF in non-rainy season.
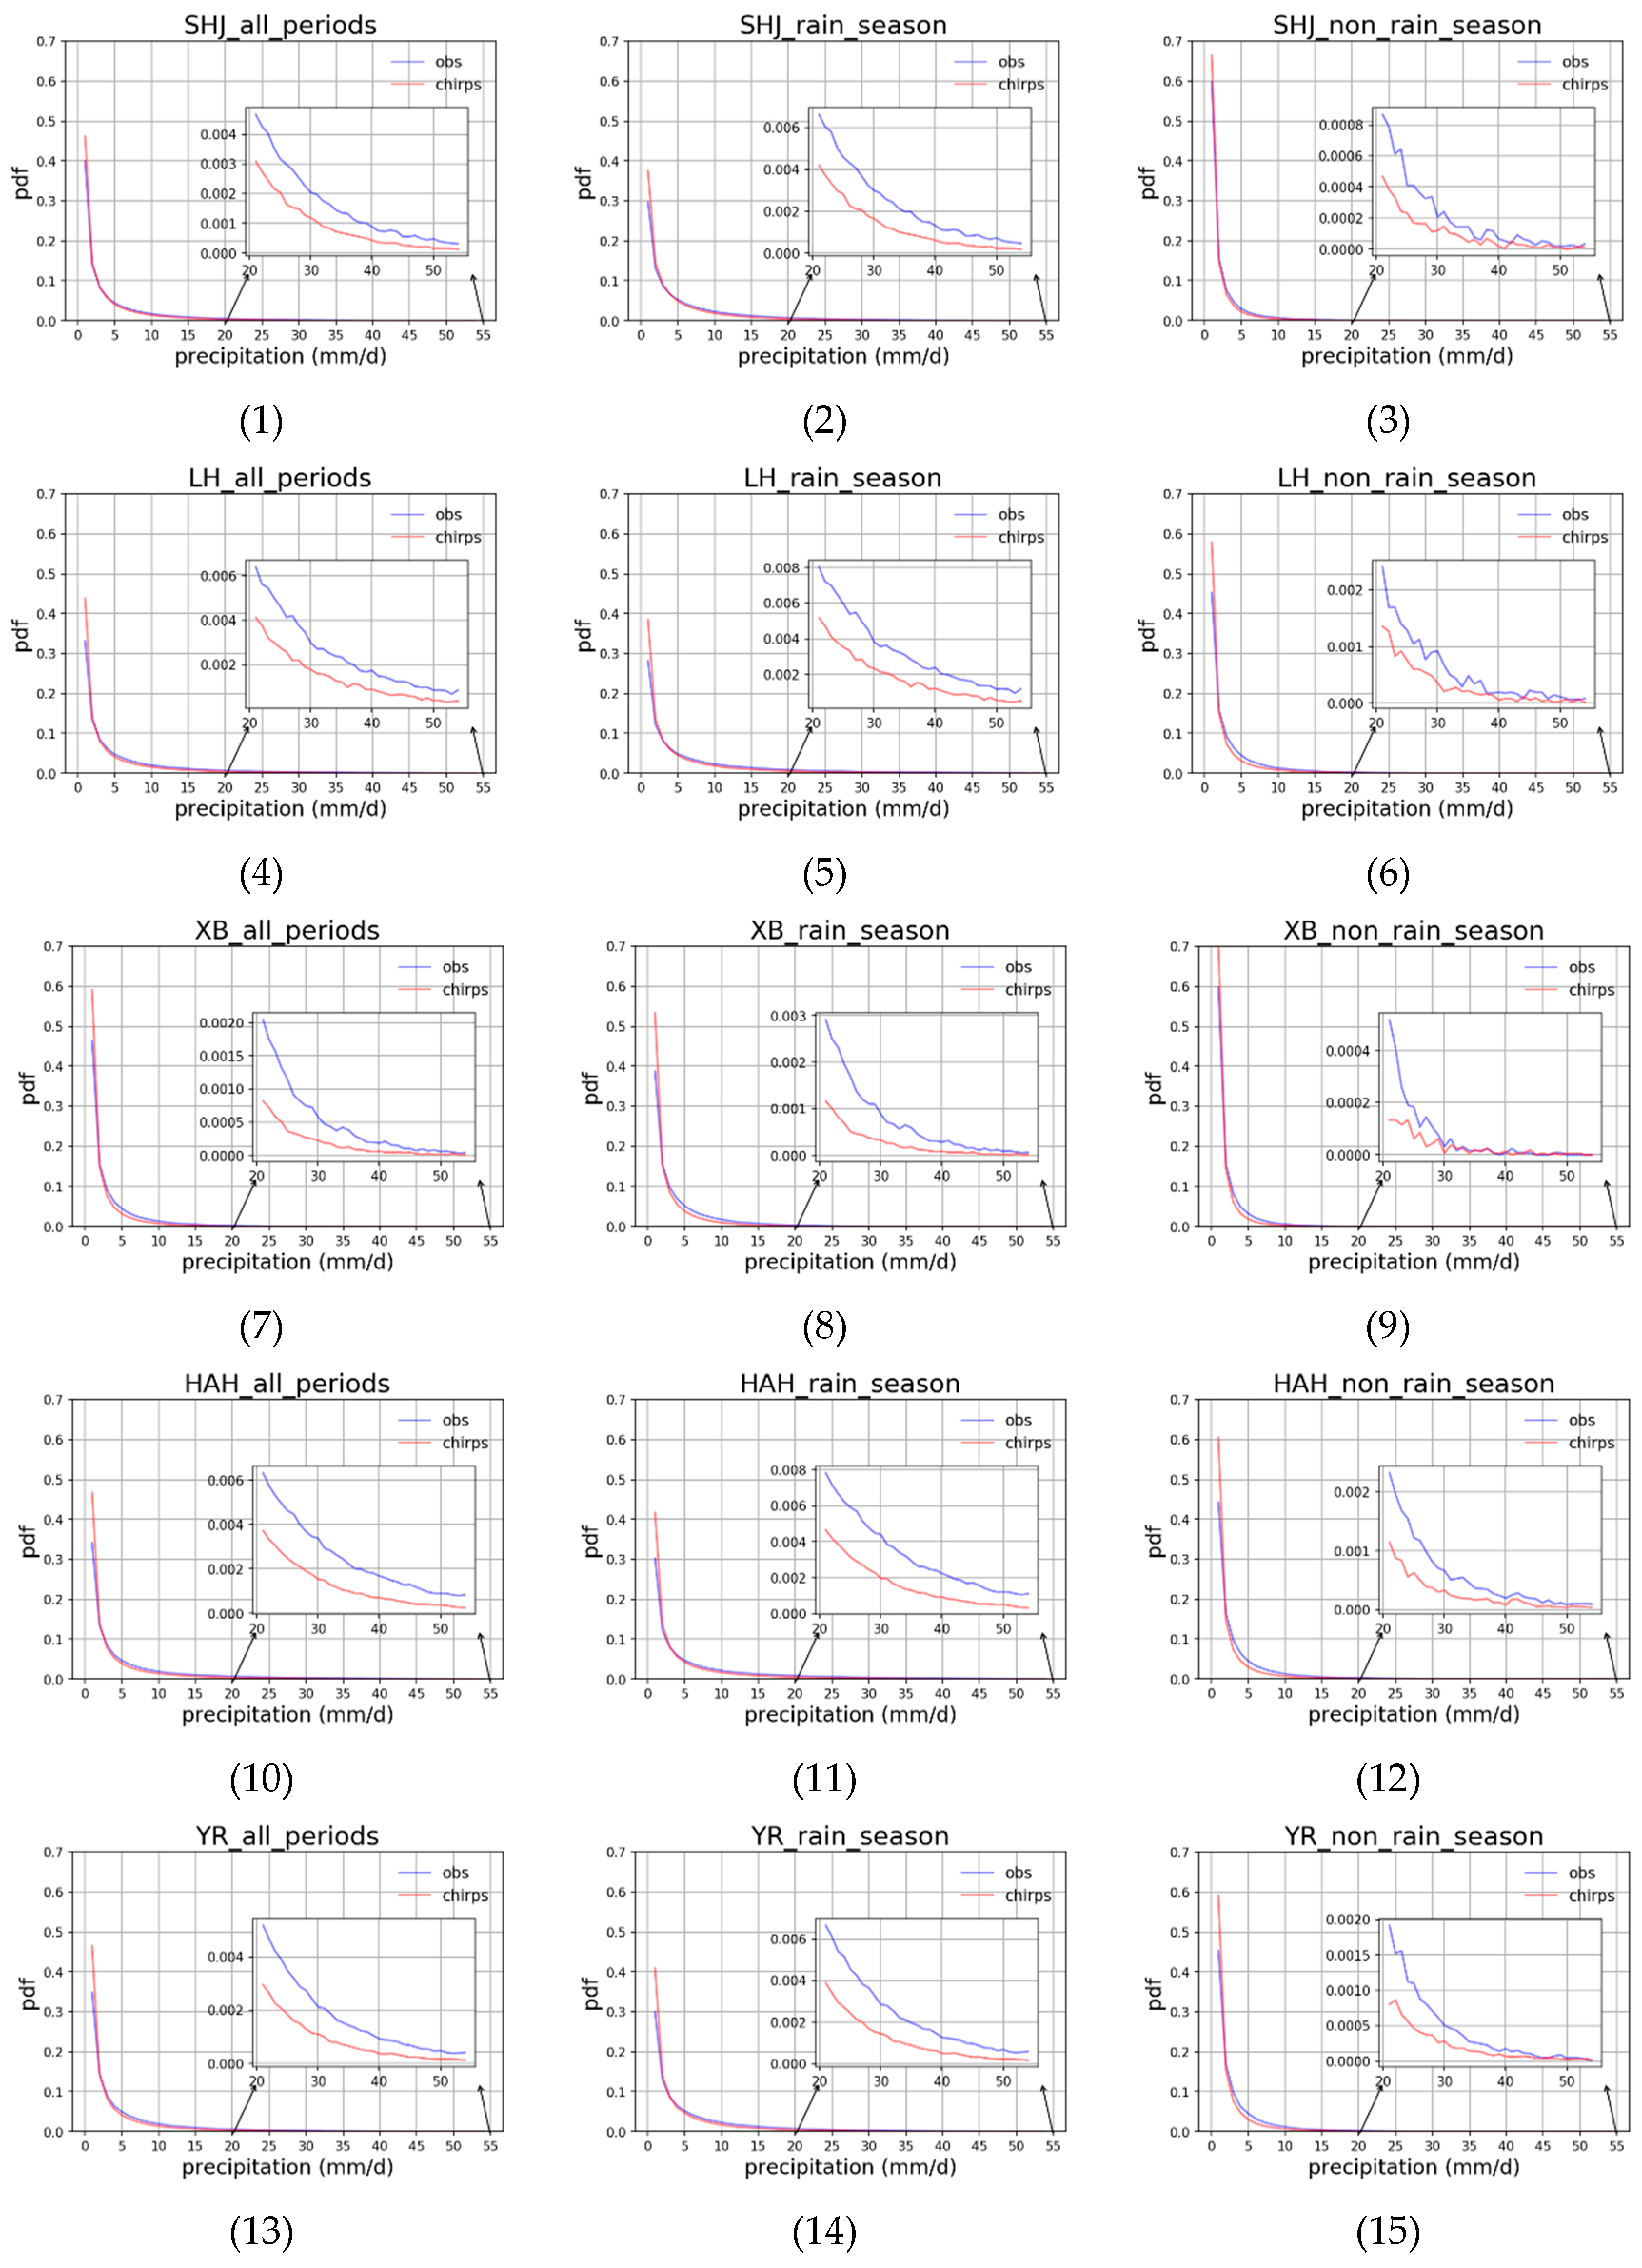
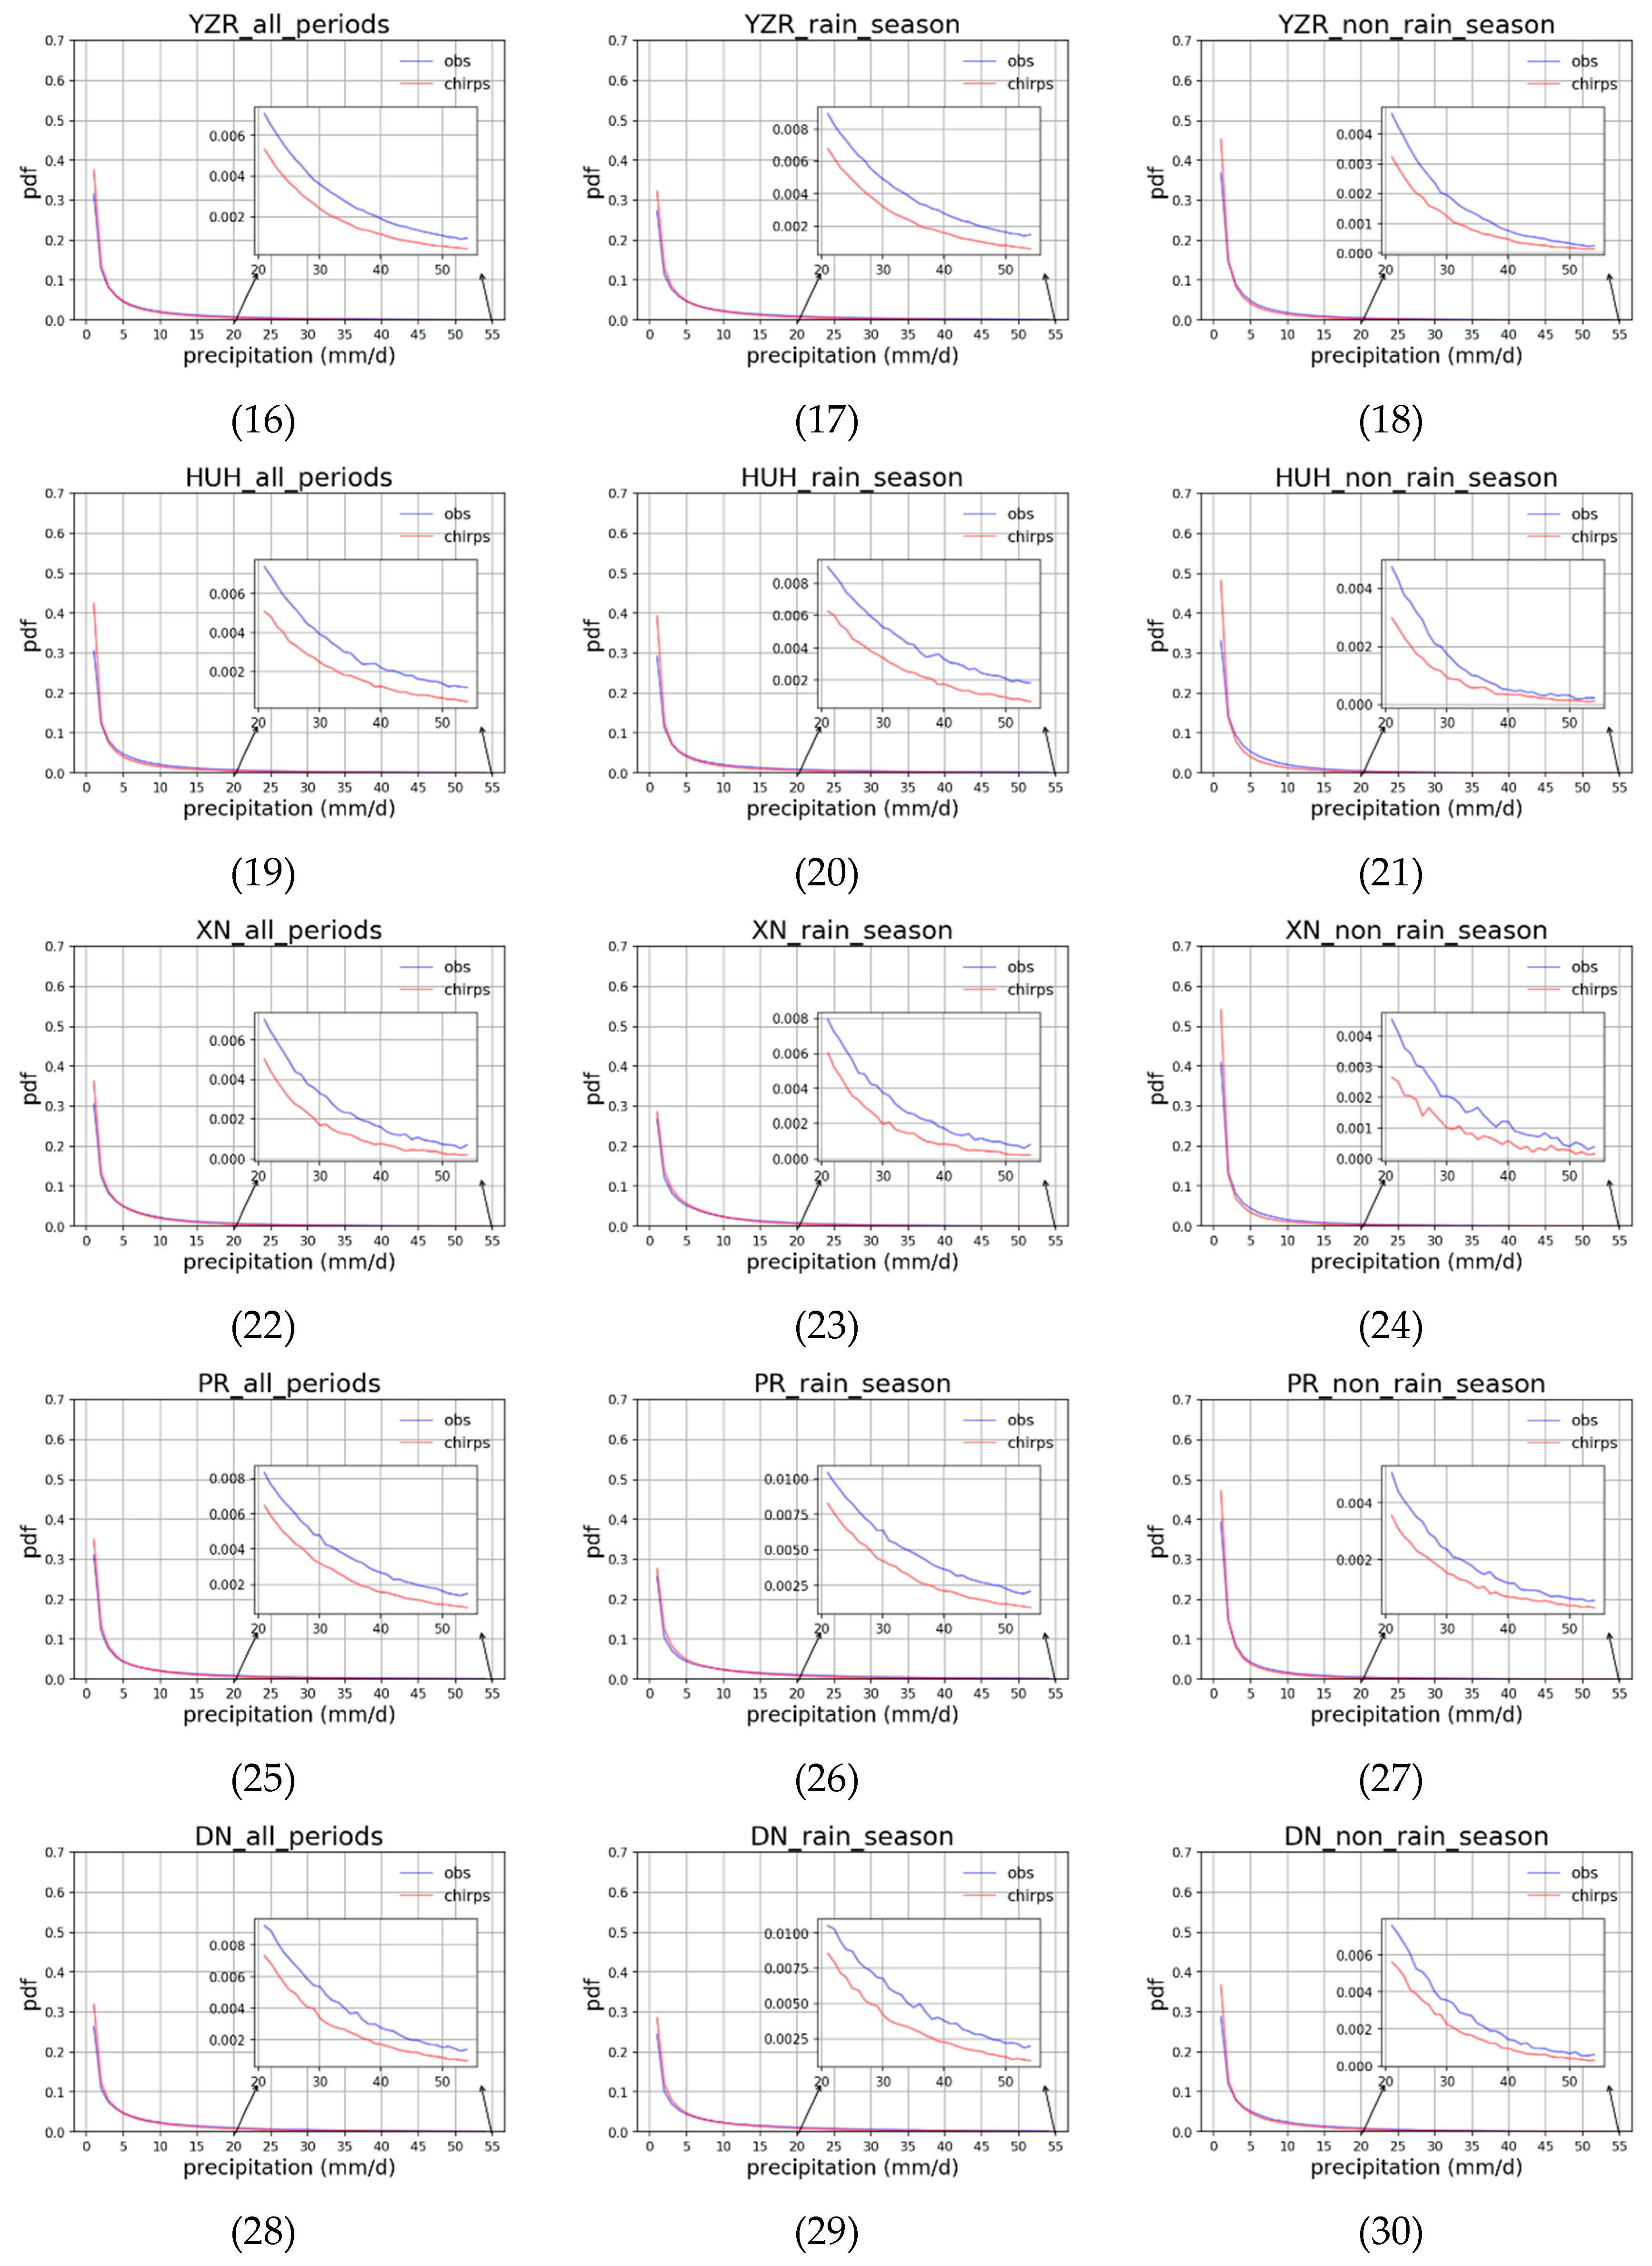
Figure 13.
CHIRPS’s scatter plots in different river basins. Subplots (a–j) denote the scatter plots in sub regions of SHJ, LH, XB, HAH, YR, YZR, HUH, XN, PR, and DN, respectively.
Figure 13.
CHIRPS’s scatter plots in different river basins. Subplots (a–j) denote the scatter plots in sub regions of SHJ, LH, XB, HAH, YR, YZR, HUH, XN, PR, and DN, respectively.
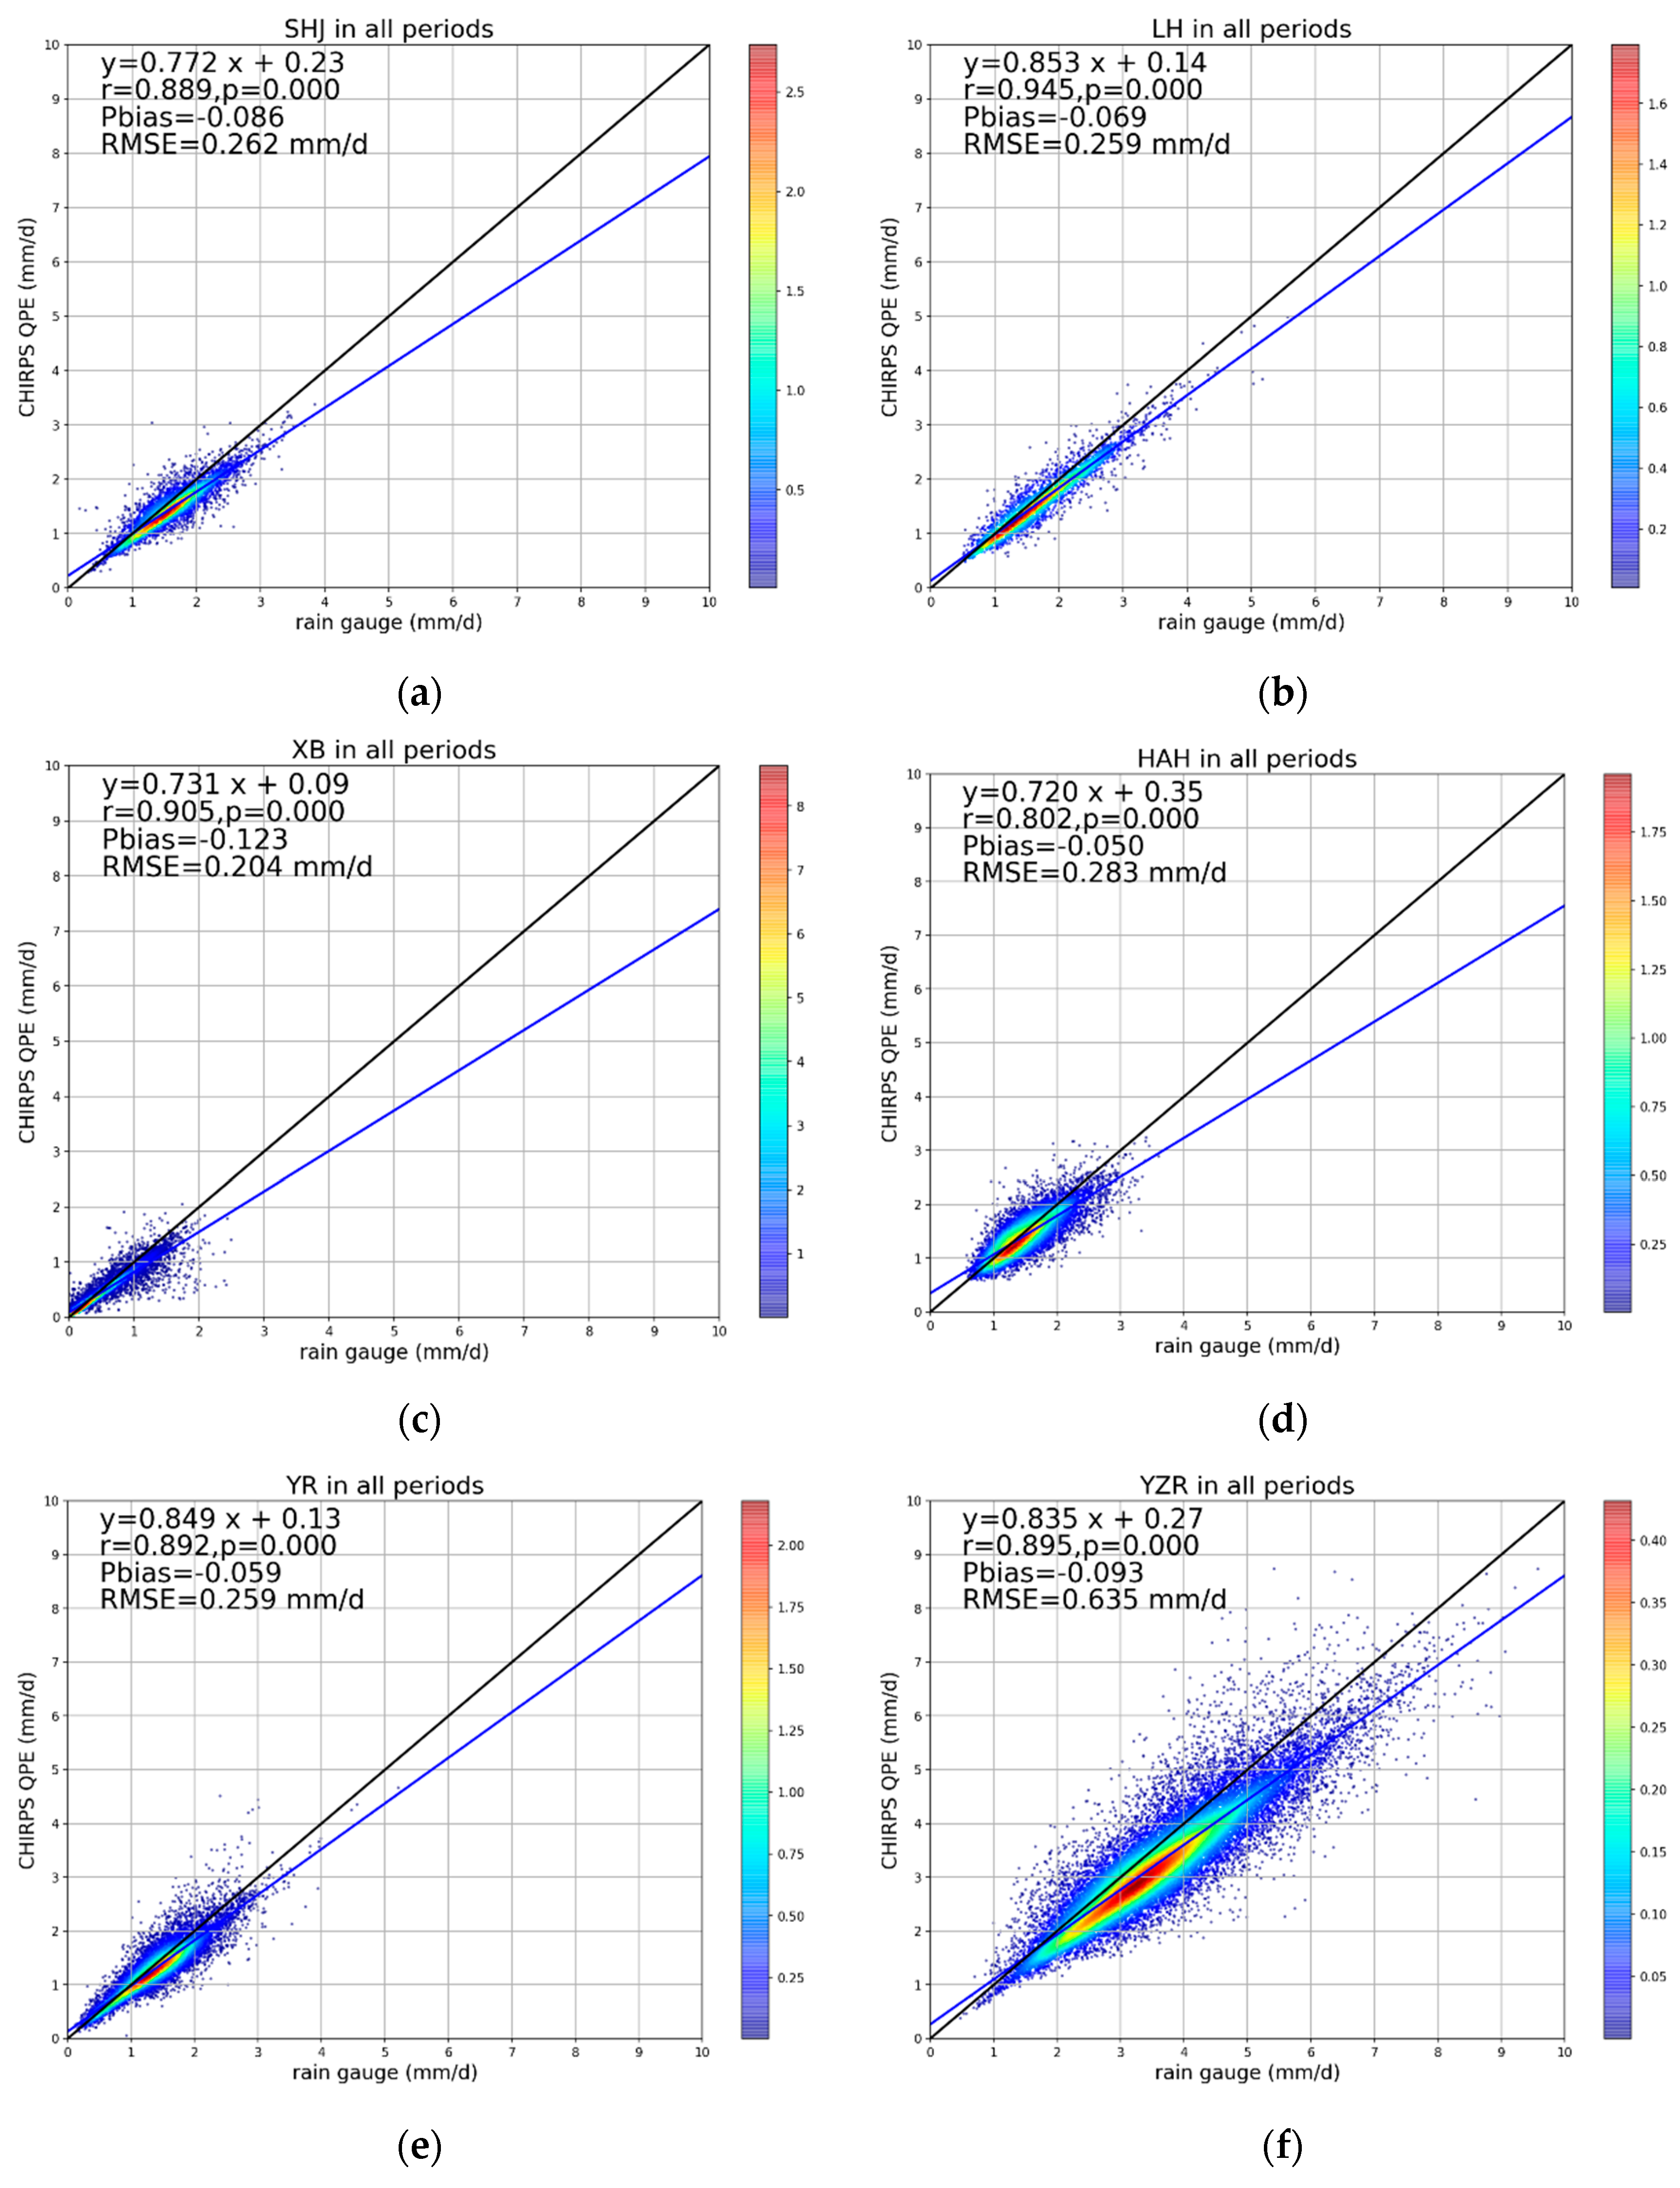

Figure 14.
Spatial comparison of observation and CHIRPS precipitation in the form of snowfall. (a,b) show CHIRPS daily precipitation on 10 and 11 January 2008, respectively. (c) shows the 0.25° gridded precipitation observation on 11 January. (units of mm/day).
Figure 14.
Spatial comparison of observation and CHIRPS precipitation in the form of snowfall. (a,b) show CHIRPS daily precipitation on 10 and 11 January 2008, respectively. (c) shows the 0.25° gridded precipitation observation on 11 January. (units of mm/day).
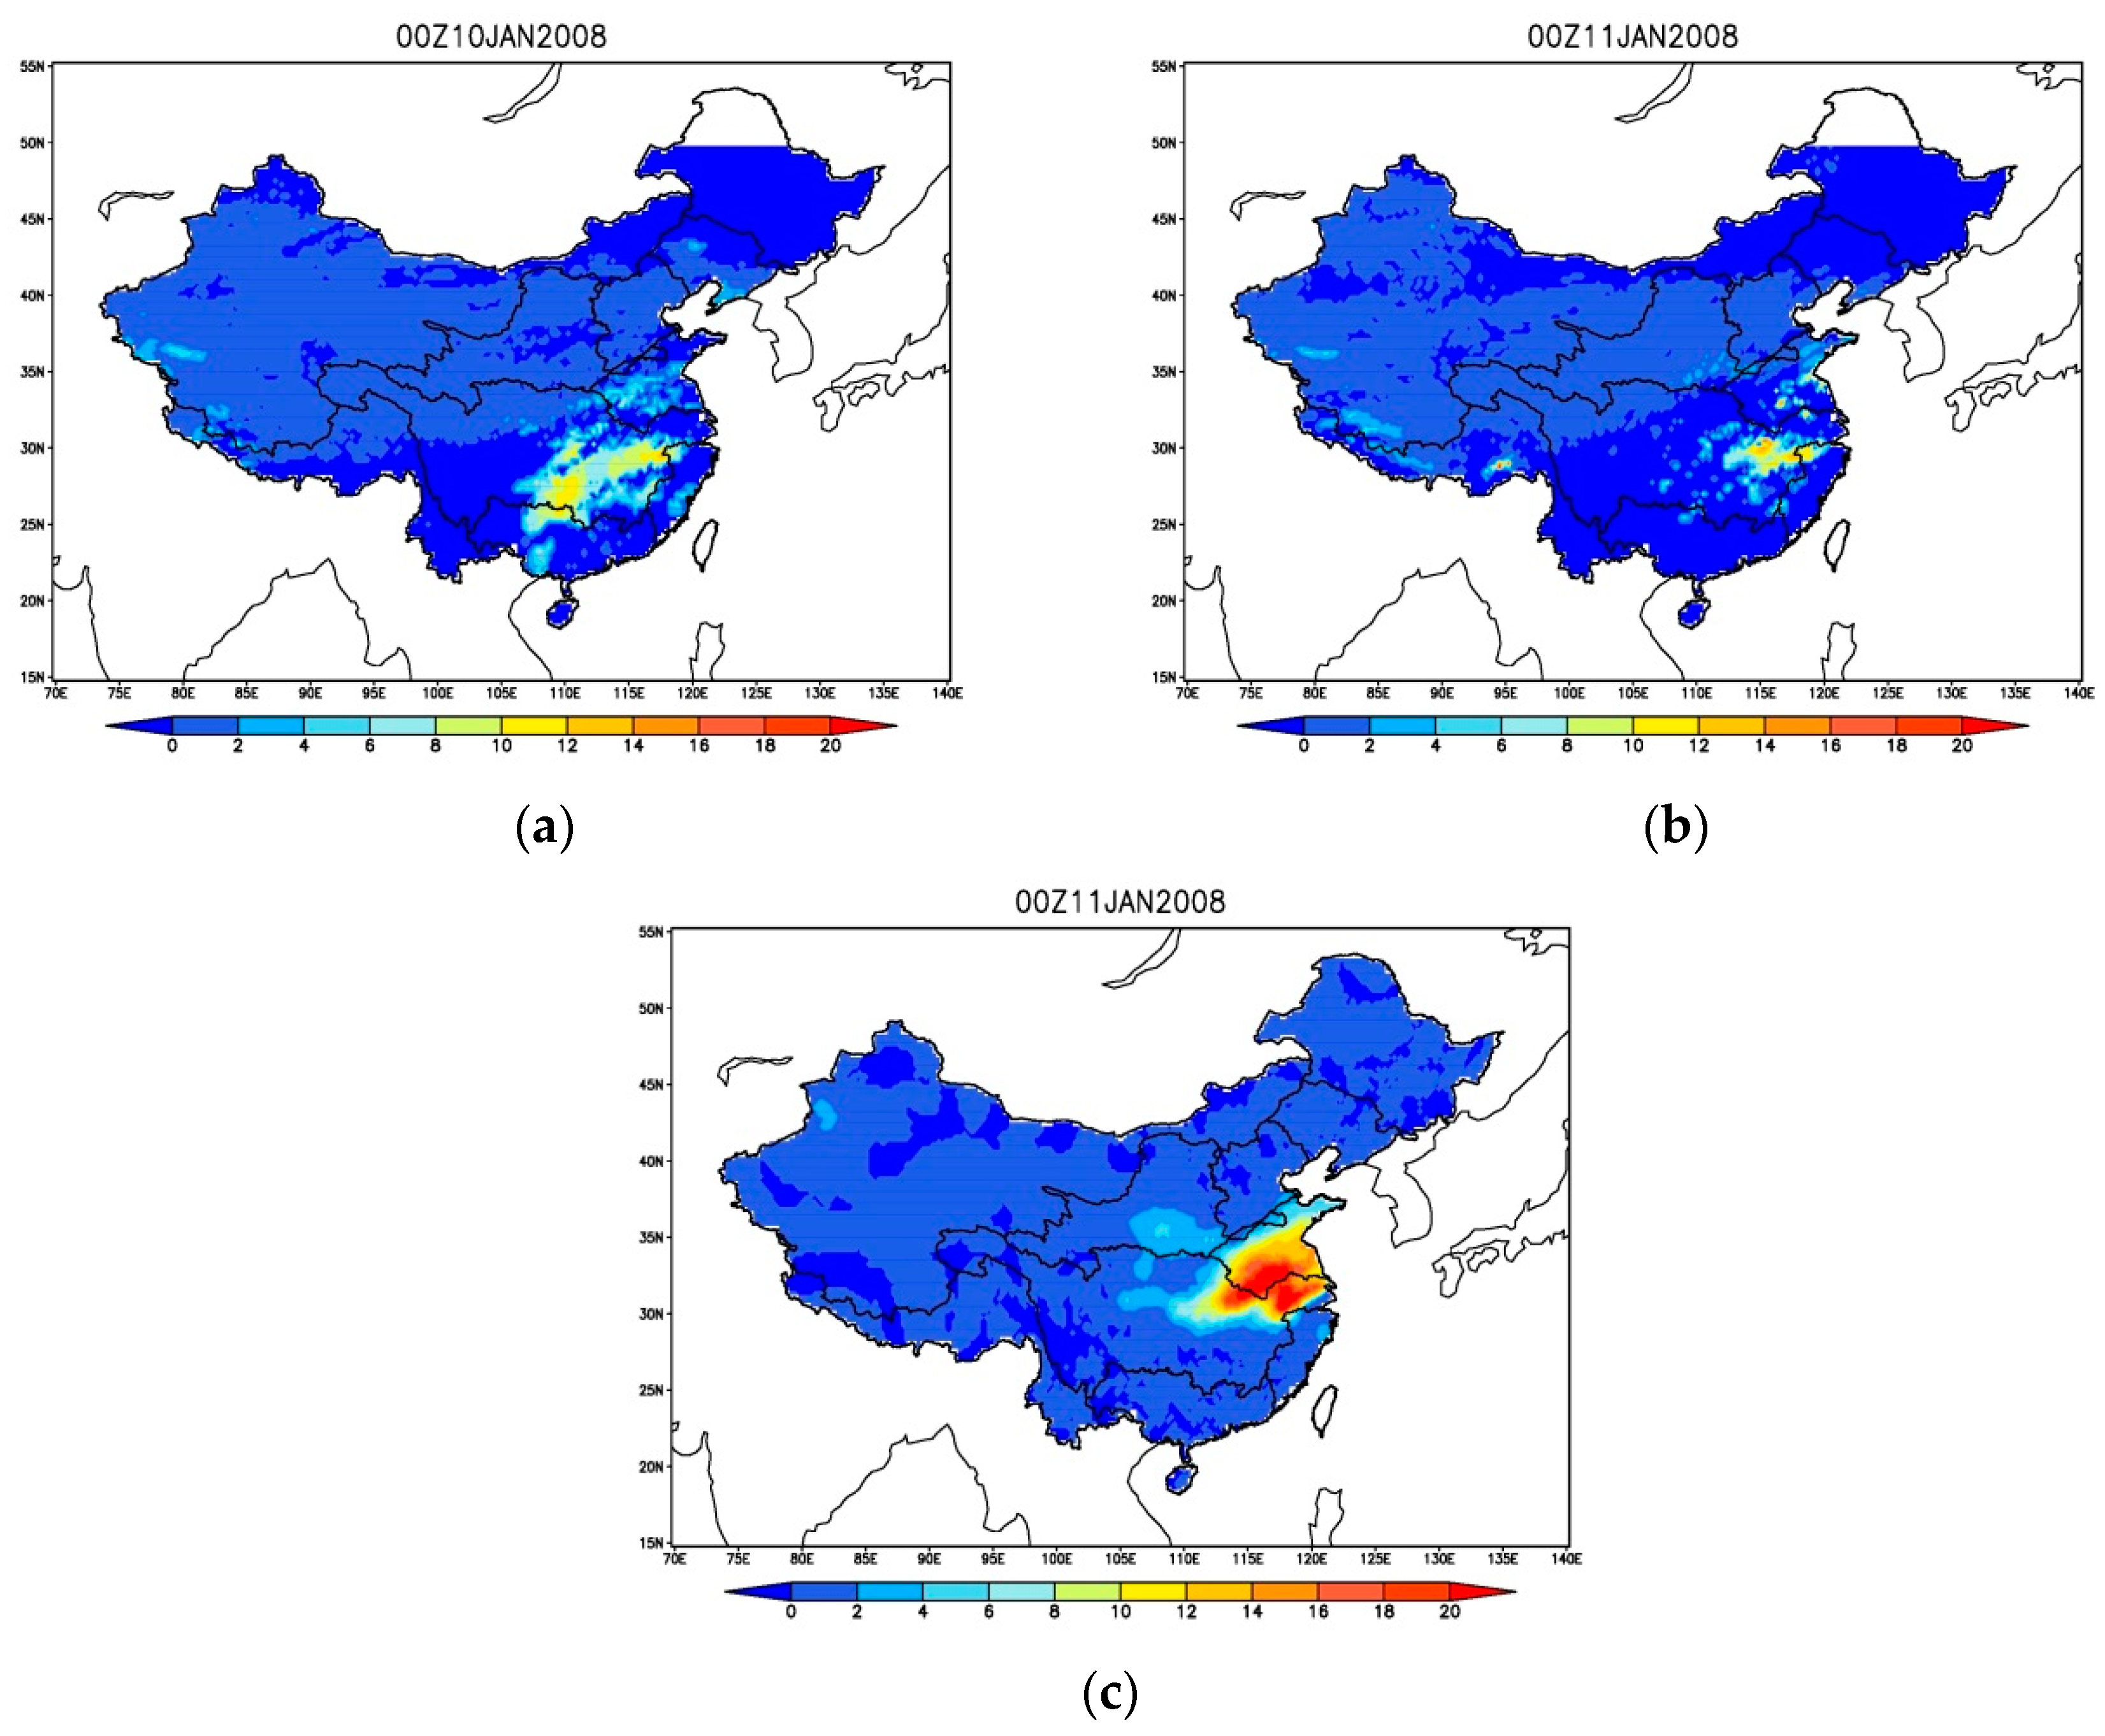
Figure 15.
Spatial patterns of daily precipitation in two typhoon events. (a,c) show CHIRPS precipitation on the first and second days of Typhoon Saomei and (e) is the first day observation for Typhoon Saomei. (b,d) show CHIRPS precipitation on the first and second days of Typhoon Soala and (f) is the first day observation for Typhoon Soala. (unit: mm/day).


Table 1.
Main satellite quantitative precipitation estimates (QPEs).
| QPEs | Temporal Coverage | Temporal and Spatial Resolution | Websites |
|---|---|---|---|
| TRMM 3B42 | 1998-present | 0.25°/3 h | https://pmm.nasa.gov/data-access/downloads/TRMM |
| CMORPH | 1998-present | 0.07°/30 min | ftp://ftp.cpc.ncep.noaa.gov/precip/CMORPH_V1.0/RAW/8km-30min/ |
| PERSIANN-CRT | 1983-present | 0.25°/1 d | ftp://persiann.eng.uci.edu/CHRSdata/PERSIANN-CDR/daily/ |
| GsMaP | 2000-present | 0.10°/30 min | ftp://hokusai.eorc.jaxa.jp/reanalysis/v6/ |
| GPM IMERGE | 2014-present | 0.10°/30 min | https://pmm.nasa.gov/data-access/downloads/gpm |
| CHIRPS | 1981-present | 0.05°/1 d | ftp://ftp.chg.ucsb.edu/pub/org/chg/products/CHIRPS-2.0/global_daily/netcdf/p05/ |
Table 2.
Seasonal change of Pearson correlation coefficient (r) and mean error (ME) in 10 hydrological basins in mainland China.
Table 2.
Seasonal change of Pearson correlation coefficient (r) and mean error (ME) in 10 hydrological basins in mainland China.
| Basin | Spring | Summer | Autumn | Winter | Annual | |||||
|---|---|---|---|---|---|---|---|---|---|---|
| r | ME | r | ME | r | ME | r | ME | r | ME | |
| SHJ | 0.302 | −0.044 | 0.249 | 0.085 | 0.332 | −0.024 | 0.226 | −0.039 | 0.277 | −0.006 |
| LH | 0.320 | −0.048 | 0.288 | 0.324 | 0.354 | 0.024 | 0.158 | 0.051 | 0.280 | 0.088 |
| XB | 0.145 | 0.018 | 0.160 | −0.138 | 0.182 | −0.040 | 0.111 | 0.023 | 0.150 | −0.034 |
| HAH | 0.299 | −0.068 | 0.310 | 0.071 | 0.304 | −0.111 | 0.166 | 0.013 | 0.270 | −0.024 |
| YR | 0.269 | −0.003 | 0.268 | 0.051 | 0.326 | −0.014 | 0.206 | −0.018 | 0.267 | 0.004 |
| YZR | 0.278 | 0.035 | 0.336 | 0.078 | 0.339 | 0.011 | 0.271 | −0.034 | 0.306 | 0.023 |
| HUH | 0.336 | 0.053 | 0.382 | 0.081 | 0.327 | −0.092 | 0.296 | 0.057 | 0.335 | 0.025 |
| DN | 0.352 | 0.460 | 0.512 | 0.802 | 0.415 | 0.204 | 0.362 | 0.013 | 0.410 | 0.370 |
| XN | 0.219 | 0.100 | 0.272 | 0.551 | 0.348 | 0.136 | 0.248 | −0.017 | 0.272 | 0.193 |
| PR | 0.400 | 0.211 | 0.472 | 0.407 | 0.418 | −0.055 | 0.353 | −0.104 | 0.411 | 0.115 |
Table 3.
Comparison of CHIRPS’ r in resolutions of 0.05° and 0.25°.
| Regions | DN | HAH | HUH | LH | SHJ | YR | YZR | XN | PR | XB |
|---|---|---|---|---|---|---|---|---|---|---|
| 0.05° | 0.44 | 0.34 | 0.39 | 0.34 | 0.33 | 0.32 | 0.37 | 0.37 | 0.46 | 0.21 |
| 0.25° | 0.41 | 0.27 | 0.34 | 0.28 | 0.28 | 0.27 | 0.31 | 0.27 | 0.41 | 0.15 |
| Difference | 0.03 | 0.07 | 0.05 | 0.06 | 0.06 | 0.05 | 0.06 | 0.10 | 0.05 | 0.06 |
© 2018 by the authors. Licensee MDPI, Basel, Switzerland. This article is an open access article distributed under the terms and conditions of the Creative Commons Attribution (CC BY) license (http://creativecommons.org/licenses/by/4.0/).
Share and Cite
MDPI and ACS Style
Bai, L.; Shi, C.; Li, L.; Yang, Y.; Wu, J. Accuracy of CHIRPS Satellite-Rainfall Products over Mainland China. Remote Sens. 2018, 10, 362. https://doi.org/10.3390/rs10030362
AMA Style
Bai L, Shi C, Li L, Yang Y, Wu J. Accuracy of CHIRPS Satellite-Rainfall Products over Mainland China. Remote Sensing. 2018; 10(3):362. https://doi.org/10.3390/rs10030362
Chicago/Turabian StyleBai, Lei, Chunxiang Shi, Lanhai Li, Yanfen Yang, and Jing Wu. 2018. "Accuracy of CHIRPS Satellite-Rainfall Products over Mainland China" Remote Sensing 10, no. 3: 362. https://doi.org/10.3390/rs10030362
Note that from the first issue of 2016, this journal uses article numbers instead of page numbers. See further details here.