Burned Area Mapping of an Escaped Fire into Tropical Dry Forest in Western Madagascar Using Multi-Season Landsat OLI Data


Department of Biological Sciences, Marshall University, Huntington, WV 25755, USA
Remote Sens. 2018, 10(3), 371; https://doi.org/10.3390/rs10030371
Submission received: 27 December 2017
/
Revised: 12 February 2018
/
Accepted: 20 February 2018
/
Published: 27 February 2018
(This article belongs to the Special Issue Remote Sensing of Wildfire)
Abstract
:A human-induced fire cleared a large area of tropical dry forest near the Ankoatsifaka Research Station at Kirindy Mitea National Park in western Madagascar over several weeks in 2013. Fire is a major factor in the disturbance and loss of global tropical dry forests, yet remotely sensed mapping studies of fire-impacted tropical dry forests lag behind fire research of other forest types. Methods used to map burns in temperature forests may not perform as well in tropical dry forests where it can be difficult to distinguish between multiple-age burn scars and between bare soil and burns. In this study, the extent of forest lost to stand-replacing fire in Kirindy Mitea National Park was quantified using both spectral and textural information derived from multi-date satellite imagery. The total area of the burn was 18,034 ha. It is estimated that 6% (4761 ha) of the Park’s primary tropical dry forest burned over the period 23 June to 27 September. Half of the forest burned (2333 ha) was lost in the large conflagration adjacent to the Research Station. The best model for burn scar mapping in this highly-seasonal tropical forest and pastoral landscape included the differenced Normalized Burn Ratio (dNBR) and both uni- and multi-temporal measures of greenness. Lessons for burn mapping of tropical dry forest are much the same as for tropical dry forest mapping—highly seasonal vegetation combined with a mixture of background spectral information make for a complicated analysis and may require multi-temporal imagery and site specific techniques.
1. Introduction
Globally, tropical forests account for the majority of the earth’s remaining forest resources [1]. Thirty years ago, tropical dry forests (TDF) outnumbered tropical humid forests nearly two-to-one [2], but today, land occupied by tropical humid forests surpasses that of TDF [1]. TDFs support a higher human population density than do tropical humid forests [3] and they are at high risk of disturbance from a variety of human activities such as agricultural conversion, hunting and gathering, livestock grazing, fuelwood collection, and selective logging [1,2,4,5,6]. Natural disturbances such as fire, drought, insect outbreaks, and cyclones also take a toll on TDF leading to detrimental positive feedback loops between natural and human-induced disturbances. TDF are also often overlooked in forest protection schemes [7].
Remote sensing is a cost effective means to map and monitor changes in forest landscapes, but research in mapping TDF lags behind other forest types [7] due to (1) inconsistency in defining what is TDF [7,8,9]; (2) phenological challenges of this seasonal forest type [8,10]; and (3) TDF’s numerous vegetation types having similar spectral properties (e.g., spiny forest, deciduous forest, broadleaf forest) [7,10,11]. The challenges are compounded in disturbed TDF landscapes where there may be even more vegetation types. In particular, it can be difficult differentiating between recent and past burns scars, as well as between burn scars and agricultural lands.
Despite the “widespread and potential significant threat” of fire to global TDF [4], there is a paucity of remote sensing research concerning fire in TDF, and fire mapping research of TDF lags behind fire mapping of other forest types. Tropical forest fire studies, to date, have focused largely on escaped fires in tropical evergreen rain forests [12,13,14,15].
Madagascar’s dry forests experienced one of the largest decreases of any forest type worldwide between 1980 and 2000 [16]. TDF in Madagascar are undergoing rapid loss and fragmentation [17] largely due to land clearing for agriculture and pasture. During the period 1990–2000, rates of deforestation in dry and spiny forest were nearly as high or higher (7.5% and 8.6% respectively) than that of Malagasy humid forest (7.8%) [18]. Smith [19] estimates that western dry forest extent decreased from 12.5% in 1950 to 2.8% in 1990. In the western region of Central Menabe, annual forest loss is estimated to be 1% between 1999 and 2005 [20]. Annual rates of deforestation in the Kirindy-Ambadira Forest Complex in Central Menabe (an area greater than 100,000 ha) vary by location but have steadily increased, from 0.42% in the period 1973–1992, to 0.8–1.68% between 2000 and 2008, and 2.55% from 2008 to 2010; the most extreme forest losses occurred as incursions from existing agricultural clearings [21].
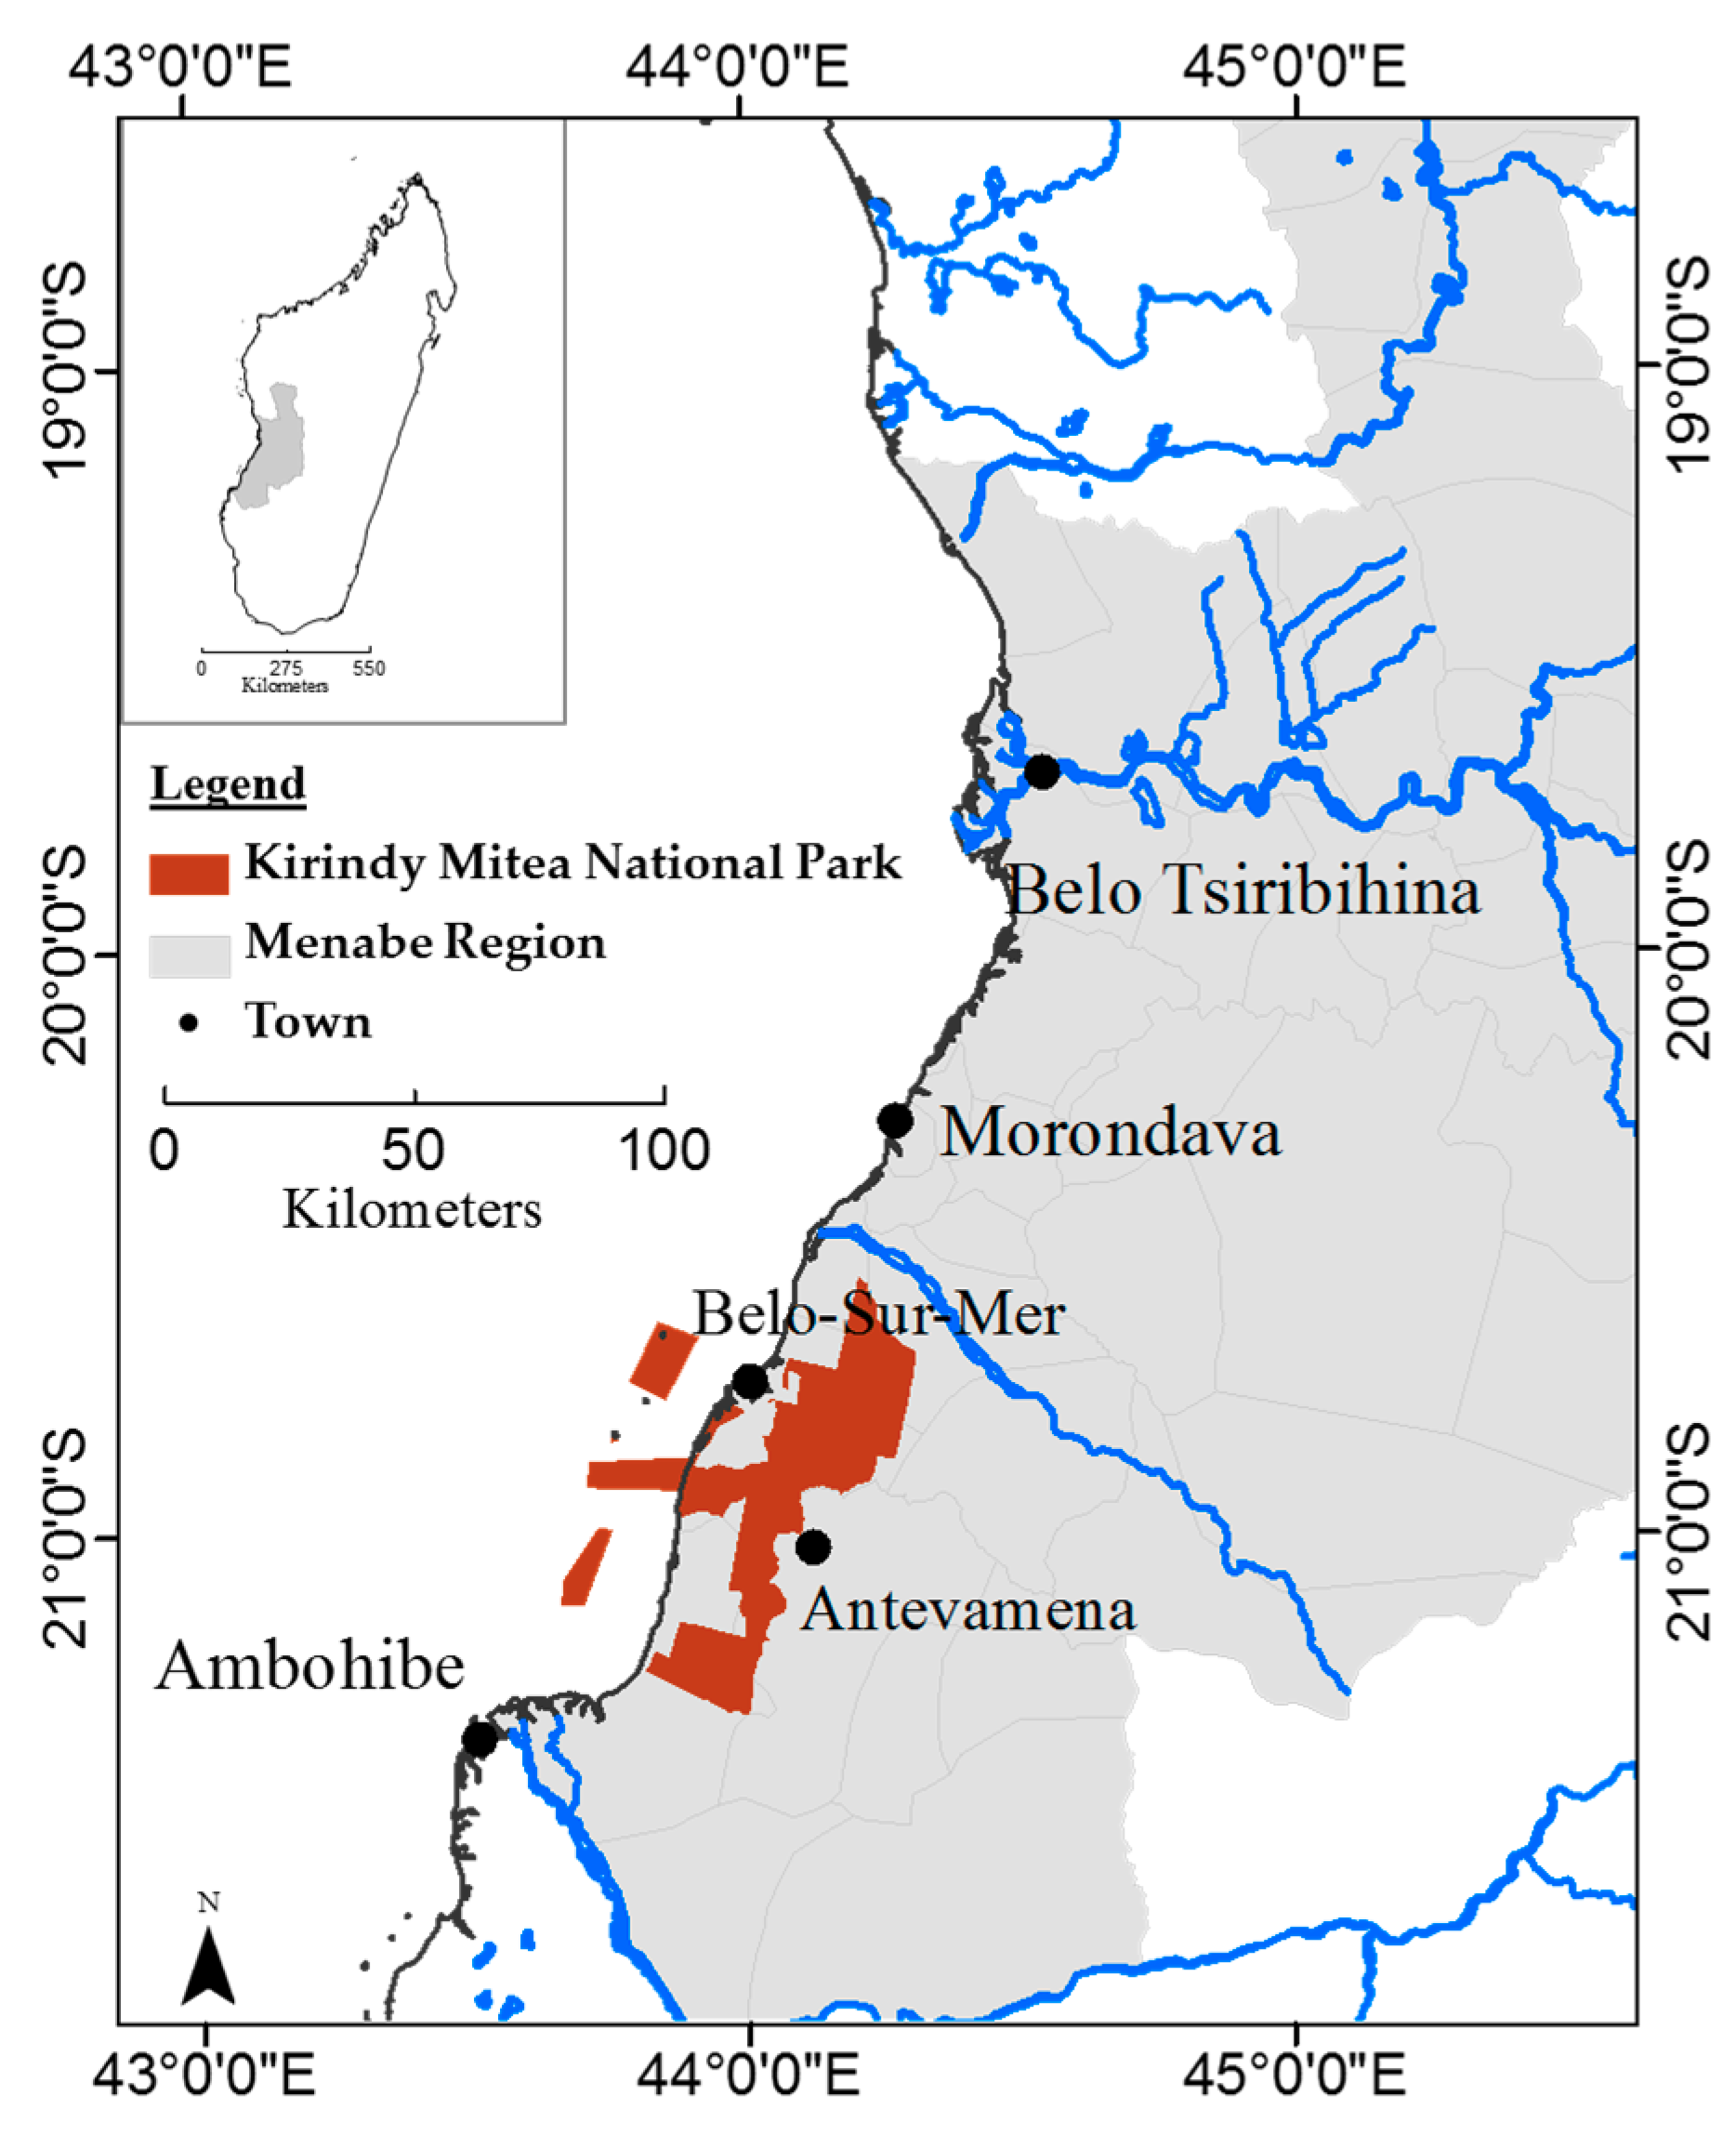
Kirindy Mitea National Park (KMNP) was established to protect animals and plants of dry deciduous forests in the transition zone between the sub-arid and dry ecoregions of western Madagascar in Southern Menabe. The Menabe region of western Madagascar (Figure 1) is comprised of TDF, shrubland, pasture, savanna, and agricultural lands. Forests in Menabe have a long history of human modification through agriculture, logging, and grazing [20,22,23,24]. Fire is commonly used in Menabe to clear lands for agriculture and to elicit fresh growth of pasture grasses for cattle [17]; both savannas and abandoned agricultural clearings are maintained as zebu pasture [25,26].
A pasture-renewal fire escaped into the forest of KMNP and burned for several weeks in August–September 2013 coming to within 600 m of the Ankoatsifaka Research Station, home of Lewis’ long-term study of the endangered Propithecus verreauxi (sifaka) [27]. While the fire did not enter the 1 km2 research trail system, all intact forests in the Park support high levels of plant and animal diversity and any forest loss will have ensuing impacts on the biodiversity of the park [28,29]. The purpose of this study was to map the location of a large stand-clearing fire and calculate the amount of forest lost in the major KMNP fire of 2013.
There are multiple methods of satellite-based wildfire mapping, but most rely on spectral indices calculated from remotely-sensed satellite images. The first commonly adopted spectral index designed especially for fire studies is the Normalized Burn Ratio (NBR) [30] which has been used for burn scar mapping [31,32,33] and fire severity mapping [34,35]. Classification of burn areas using NBR can be challenging when there are multi-aged burn scars in the study area [31,36]. A multi-temporal differenced image of NBR (dNBR), which represents fire occurrence within a time frame defined by two image dates can aid in identification of burned areas from specific fire events. Differenced NBR (dNBR and RdNBR) has been used exclusively in some studies to map burn areas [35,37,38].
Automatic image segmentation of burned areas using NBR/dNBR alone can be especially challenging when there are a variety of non-vegetated land classes such as fallow agriculture fields, bare soil, and multi-aged burned areas of varying degrees of reflectance (black to grey charcoal) [31,36], as was the case in this study site. To reduce the spectral confusion between multi-color soil patches, additional spectral information sensitive to other parameters such as wetness and greenness can be included [36]. Patterson and Yool [39] used components (brightness, greenness, and wetness) from a single date Kauth-Thomas Tasselled Cap Transformation (KT) to map burned areas in Arizona, and Henry [33] used the same to map fire scars in pine and scrub vegetation in Florida. Barret et al. [40] used KT in combination with other information to map burn severity in Alaska.
Healey [41] combined variants of the Tasseled Cap Transform into a suite of indices designed to detect stand-replacing disturbance. Their Disturbance Index (DI) is a combination of the three KT components arranged so as to exploit the observed differences in brightness value compared to greenness and wetness in pixels of cleared forest. Compared to simple vegetation indices such as the Normalized Difference Vegetation Index (NDVI) and the Second Modified Soil Adjusted Vegetation Index (MSAVI2), DI incorporates information from shortwave infrared spectrum (i.e., wetness) which is especially useful for assessing change in forest structure. Also, DI is resilient to variability in vegetation phenology between image dates [42].
The highly seasonal nature of this study site posed an additional challenge to mapping burn scars from the large fire event. Background phenological changes in vegetation and soil moisture are registered along with changes due to fire. Inclusion of multi-temporal spectral bands can aid in the differentiation between phenological changes and land cover changes by capturing a baseline change due only to seasonal phenology. In addition to uni-temporal spectral information described above, land cover change can be captured also by using multi-temporal data in the form of a linear transformation of spectral bands.
This study used both spectral and textural information from multi-date satellite imagery to determine the extent of forest loss during the 2013 fire. Burn mapping methods typically used for temperate forests were incapable of pinpointing burn scars from a single fire event. The best model for burn scar mapping in this highly-seasonal tropical forest and pastoral landscape included dNBR and both uni- and multi-temporal measures of greenness.
2. Materials and Methods
2.1. Study Area
Kirindy Mitea National Park (KMNP) is located in the southern Menabe region of western Madagascar along the Mozambique Channel, about 70 km south of Morondava (Figure 1). Ankoatsifaka Research Station (20°47′11″S, 44°09′53″E) is located approximately 1.5 km south of the 1 ha forest study area which has trails cut at 25 m intervals. Forest distribution in both Central and Southern Menabe is closely tied to soils and geological substrate [43] with dense, dry deciduous forests located largely in the west nearer the coast, and savannas occupying large swaths in the east along the central highlands [43]. Forest likely has never occupied the entire bioclimatic region, as there is evidence here for early grasslands [44]. Large areas of forest have been converted to agriculture and pasture.
KMNP, located approximately 100 km south of the similarly-named, Kirindy Forest/Centre National de Formation, d’Etudes et de Recherches en Environnement et Foresterie (CNFEREF) (also known as the Swiss Forest), was established to protect animals and plants of dry deciduous forests in the transition zone between the sub-arid and dry ecoregions of western Madagascar in Southern Menabe. KMNP is characterized by high biotic diversity and high local endemism [45].
The park encompasses a variety of ecological features including mangroves, coral reefs, beaches, spiny forest, baobab groves, and dry deciduous forest. Mean annual temperature is 25 °C (range: 9–40 °C) [46], and the site is highly seasonal with a long dry season followed by a shorter rainy season. Average rainfall is 700 mm/year, with the majority falling between December and February [47].
The dominant forest vegetation in the park is tropical dry forest (Commiphora sp., Dalbergia sp., Tamarindus indica, Euphorbia sp., Grewia sp.) including bottle-trunked trees (pachypodiums, Delonix adansonoides, Euphoribia antso, and Givotia madagascariensisi) and baobabs (Adansonia fony and Adansonia grandidieri). There are also small bands of gallery forest along rivers, as well as patches of spiny thicket of the endemic family Didieraceae near the coast. The eastern edge of the park is characterized by wooded savanna that grades to grassland.
Forest loss within KMNP is especially prominent at the eastern edge of the park and along roads with incursions due to agriculture and grazing. Forest lost to agricultural activities is also concentrated along riparian areas. A fairly extensive road network within park boundaries, pre-dating park inauguration, also facilitates wood and animal extraction. In 2009, Cyclone Fanele caused substantial damage to the forests of KMNP resulting in the downing of large trees and the creation of forest gaps [46].
2.2. Image Analysis
Image analysis was performed on Landsat 8 OLI 30 m imagery (Path 161, Rows 74–75) using ERDAS Imagine 2014 and ArcGIS 10.1. Landsat 8 Level-1 L1T Product data were delivered radiometrically calibrated and orthorectified [48]. Imagery from the following dates was selected for analysis: 20 April 2013 (pre-fire, late rainy season), 23 June 2013 (pre-fire, dry season), 27 September 2013 (post-fire, dry season).
For each of the scenes, digital numbers (DN) were first converted to top-of-atmosphere reflectance using the reflectance rescaling factors provided in Landsat OLI metadata file [49]. Adjacent north and south scenes were then mosaicked in ERDAS Imagine. Finally, the mosaicked image was atmospherically corrected using dark object subtraction.
2.3. Burn Mapping
Fire maps may represent burn scars, fire perimeters, or fire severity. For this study, burned area was defined as fire that results in significant change in forest biomass and structure that can be detected by space-borne optical instruments. That is, burn scars resulting from a fire so severe that is a stand-clearing event [50]. Burned areas within remaining standing forest where understory was cleared and surviving trees were scorched up to heights of 1–2 m were not identified as burned area for this study, as these areas could not be reliably detected by 30 m remotely sensed imagery. Therefore, the total burn area estimated in this study is an underestimate of the actual area impacted by this fire event. Field data on burn area was first collected on the author’s behalf in April 2014 by KMNP park staff present during the fire event, and then again more extensively by the author in June 2014 with the assistance of the same park staff members.
One difficulty with mapping burns in this study area using NBR alone was discriminating between areas that had burned just prior to June 2013 (and still appeared burned in the post-fire image), and those areas that burned after June 2013 during the large fire of interest. A differenced NBR (dNBR) was used to help distinguish between fires that occurred between 23 June and 27 September 2013 and those that occurred prior to 23 June 2013.
For calculation of multi-temporal indices, both a pre-fire image (23 June 2013) and post-fire image (27 September 2013) from the dry season were selected. The post-fire image was the first image date that pixels in the study area were no longer obscured by smoke given that the fire burned for weeks, and then smoldered even longer.
2.4. Multi-Temporal Kauth-Thomas Transform
Common multi-temporal linear transformation techniques for fire mapping include Principal Components Analysis [53,54] and Multitemporal Kauth-Thomas (MKT) Transform [39,51,55,56]. MKT components represent inter-date change in brightness, greenness, and wetness components. Rogan and Yool [36] combined MKT brightness, greenness, and wetness change components in a supervised classification of fire in semi-arid lands in the American southwest. They achieved higher accuracies using a combination of components than by classifying single components alone. Potere et al. [57] used a combination of a single date KT with MKT components to identify forest clearings along the Appalachian Trail in eastern United States.
Coefficients for the KT Transform were initially developed for Landsat MSS [58] and later updated for Landsat TM by Crist and Cicone [59]. Output bands (brightness, greenness, and wetness) are well-described in Patterson & Yool [39]. To extend the single-date KT Transform to a multi-temporal linear transform approach, bands 2–7 of both dry season Landsat OLI images were layer-stacked into a 12 layer file. A 12 × 12 reflectance factor coefficient matrix was created using published Landsat OLI coefficients [60] and normalized as in Collins and Woodcock [51] (Table 1). The MKT transformation matrix is an extension of Fung’s MKT Gramm-Schmidt orthonormalization technique [55]. The matrix coefficients were used to transform the two images into both stable and change components of brightness, greenness, and wetness.
2.5. Burn Classification
Threshold partitioning (the use of hard threshold values to define categories) is generally used to identify burnt pixels or burn severity with NBR. The U.S. Forest Service adopted a thresholding methodology [30] for their Fire Effects Monitoring and Inventory system (FIREMON) [61]; however, there are limitations to this method. First, defined “universal” threshold values for burn severity are specific to geographic areas [31], and there has been little research using dNBR in tropical dry forests. Second, thresholds derived from statistical regression models require field severity measurements which may be difficult to collect, especially directly after the fire [62]. Additionally, threshold partitioning can result in misclassification of pixels when classifying burn severity in sites having both pre-fire low and high vegetated pixels [63].
An alternative to thresholding is classification. Given the relatively small extent of area sampled on the ground for this project, an unsupervised classification of burn metrics was deemed a superior method to threshold partitioning. In this way, field data could inform the identification of classes provided by the classification.
An initial classification using only dNBR confirmed that additional information would be necessary to reliably identify burned areas. The next step was to identify additional spectral bands or indices that might aid in the discrimination of burn patches when combined with dNBR. This list included: dMSAVI2 (June to September); differenced DI (June to September); post-fire Landsat OLI bands 2–7; Greenness, Brightness, and Wetness bands of Tasseled Cap Transform of post-fire image; change components of Greenness, Brightness, and Wetness of MKT using both dry season images (June and September). A series of unsupervised classifications were run using a combination of spectral indices in an additive process starting with dNBR. Three indices from the original list were selected for the final classification: dNBR (June to September), uni-temporal Tasseled Cap Greenness (September), and MKT change-in-Greenness (June and September). These were layer-stacked and then classified using k-means clustering with 30 classes and an Iterative Self-Organizing Data Analysis Technique (ISODATA) with 15 maximum iterations and a convergence threshold of 96%.
Multiple fire classes were output corresponding to decreasing fire severity; however, in this analysis, only those pixels that resulted in bare surfaces were classified as fire, as this was the most conservative estimate of fire on the landscape, and field data were not extensive enough to reliably classify under-canopy fire. A majority smoothing filter (3 × 3) was passed over the classification and the image was clipped to the land portion of KMNP to exclude the Park’s marine islands. A total of 11 classes represented burned area where fire burned to bare soil. The image was reclassified to a binary burned/not burned image. Total area of burned and non-burned pixels was calculated in ArcGIS 10.1.
The accuracy of the burn classification was evaluated using 244 validation data points from three sources: locations geolocated on the ground in 2014; locations extracted from post-fire Google Earth Very High Resolution Imagery (VHRI) dated October and November 2013; and a random set of points placed in locations not covered by ground data or VHRI extracted from post-fire Landsat OLI raw spectral bands dated 27 September 2013. Google Earth VHRI are widely used for validation of map classifications [64,65,66,67].
Post-fire VHRI was not available across the entire study area, so those areas of KMNP with VHRI imagery dated October and November 2013 were identified in Google Earth. Polygons were then drawn in those regions of VHRI coverage in Google Earth Pro. These polygons were imported into the University of New Hampshire Cooperative Extension KML Tools Project (http://extension.unh.edu/kmltools/) and using the Cruise Tool, a random set of points was created within the polygons.
2.6. Forest Classification
Dry season images provide the best discrimination between vegetation classes having different canopy structure [68,69], and difference images between wet season and dry season TDF imagery can greatly improve classification accuracy [70,71]. To control for vegetation differences due to seasonal changes, two pre-fire Landsat OLI images (Bands 2–7) were utilized in the pre-fire forest classification. The wet season pre-fire image was dated 20 April 2013 and the dry season pre-fire image was dated 23 June 2013. Pre-processing of the images included conversion of digital numbers (DN) to top-of-atmosphere reflectance, mosaicking of the two Landsat scenes, and radiometric normalization by dark object subtraction.
The following spectral indices were selected for the forest classification: Normalized Burn Ratio [30], Modified Soil-Adjusted Vegetation Index (MSAVI2) [52], the KT greenness [51], differenced (April–June) Modified Triangular Vegetation Index (MTVI2) [72].
Texture is a measure of heterogeneity in the tonal values of pixels, and texture measures have been used to distinguish between land cover types having different vegetation structure [73]. Textural measures including mean Euclidian distance and skewness (asymmetry of the distribution around its mean [74]) were also calculated using a 3 × 3 moving window. The two texture measures were calculated on bands 5–6 of Landsat OLI image dated 23 June 2013. Textural mathematical operators implemented in ERDAS Imagine followed those in Irons and Peterson [75].
The spectral indices and textural measures selected were layer-stacked with wet and dry season Landsat 8 OLI spectral bands 2–7 (Table 2) and then classified using k-means clustering with 22 classes and an Iterative Self-Organizing Data Analysis Technique (ISODATA) with 15 maximum iterations and a convergence threshold of 96%. Of the 22 classes, six were identified as forest and 16 as non-forest. The image was reclassified to forest/non-forest raster, a majority smoothing filter (3 × 3) was passed over the classification, and the image was clipped to the land portion of KMNP. Total area of forest and non-forest pixels was calculated in ArcGIS 10.1.
The accuracy of the forest classification was evaluated using 150 validation data points from three sources: locations geolocated on the ground in 2014; locations extracted from post-fire Google Earth Very High Resolution Imagery (VHRI) dated June 2012; and a random set of points placed in locations not covered by ground data or VHRI extracted from post-fire Landsat OLI raw spectral bands dated 20 April 2013.
Areas of KMNP with VHRI imagery dated June 2012 were identified in Google Earth and polygons were then drawn in those regions. These polygons were imported into the University of New Hampshire Cooperative Extension KML Tools Project (http://extension.unh.edu/kmlTools/) and using the Cruise Tool, a random set of points was created within the polygons.
3. Results and Discussion
3.1. Burn Classification Map
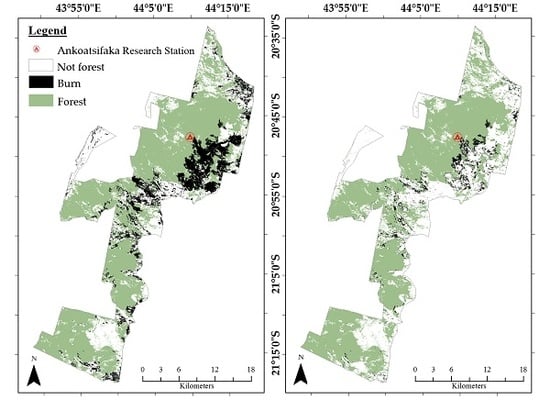
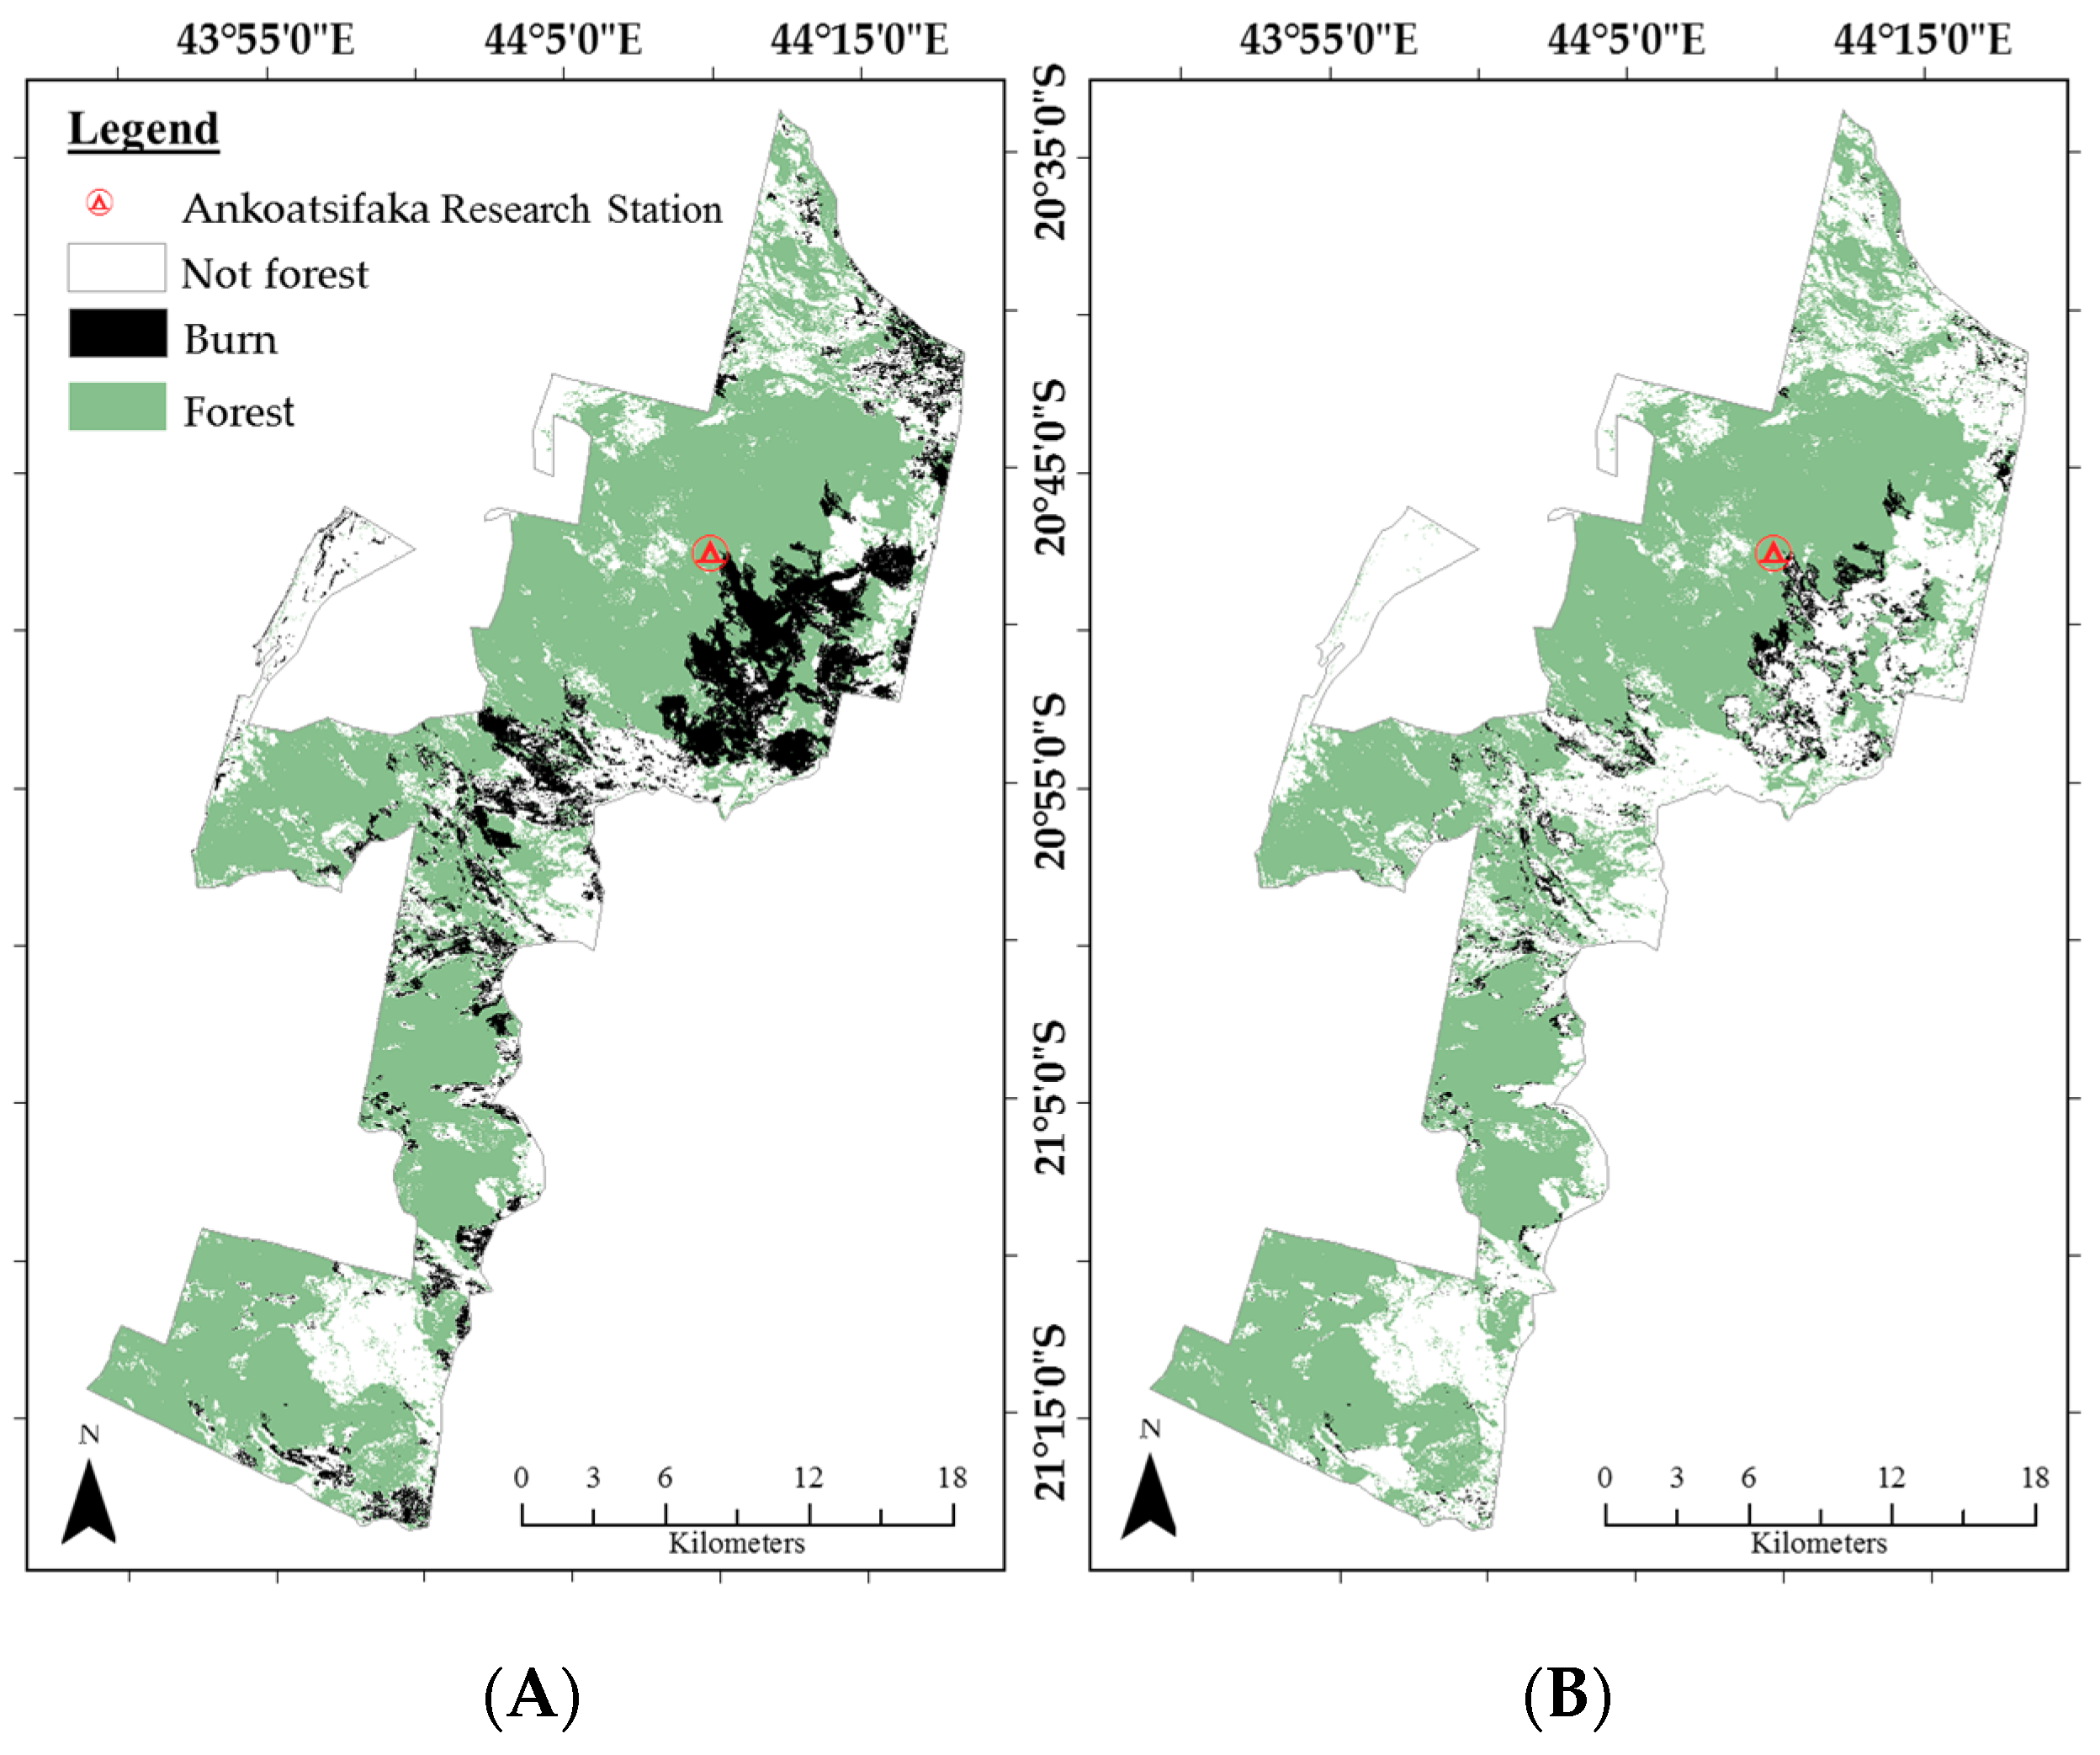
The total area of stand-replacing burn within KMNP during the large August-September fire was 18,034 ha (Figure 2A). Because so much of the forest on the eastern edge had been previously cleared, just 4761 ha (26%) of the 18,034 ha burned area was identified as forest prior to the fire (Figure 2B). In total, it is estimated that 6% of primary TDF burned in KMNP over the period 23 June to 27 September.
A confusion matrix was calculated and both producer’s and user’s accuracy of the burn classification map was well above 80% with an overall Kappa statistic of 0.9031 (Table 2). The Kappa index of agreement has been a staple of remote sensing accuracy assessment for decades [76,77,78,79]; however, it is criticized as being flawed and difficult to interpret [80,81]. Pontius and Millones [80] recommend using quantity disagreement and allocation disagreement, measures that can also be summarized from the cross-tabulation matrix. These measures take into the account both the relative proportions of categories in the accuracy assessment (quantity) and the spatial allocation of the categories (allocation).
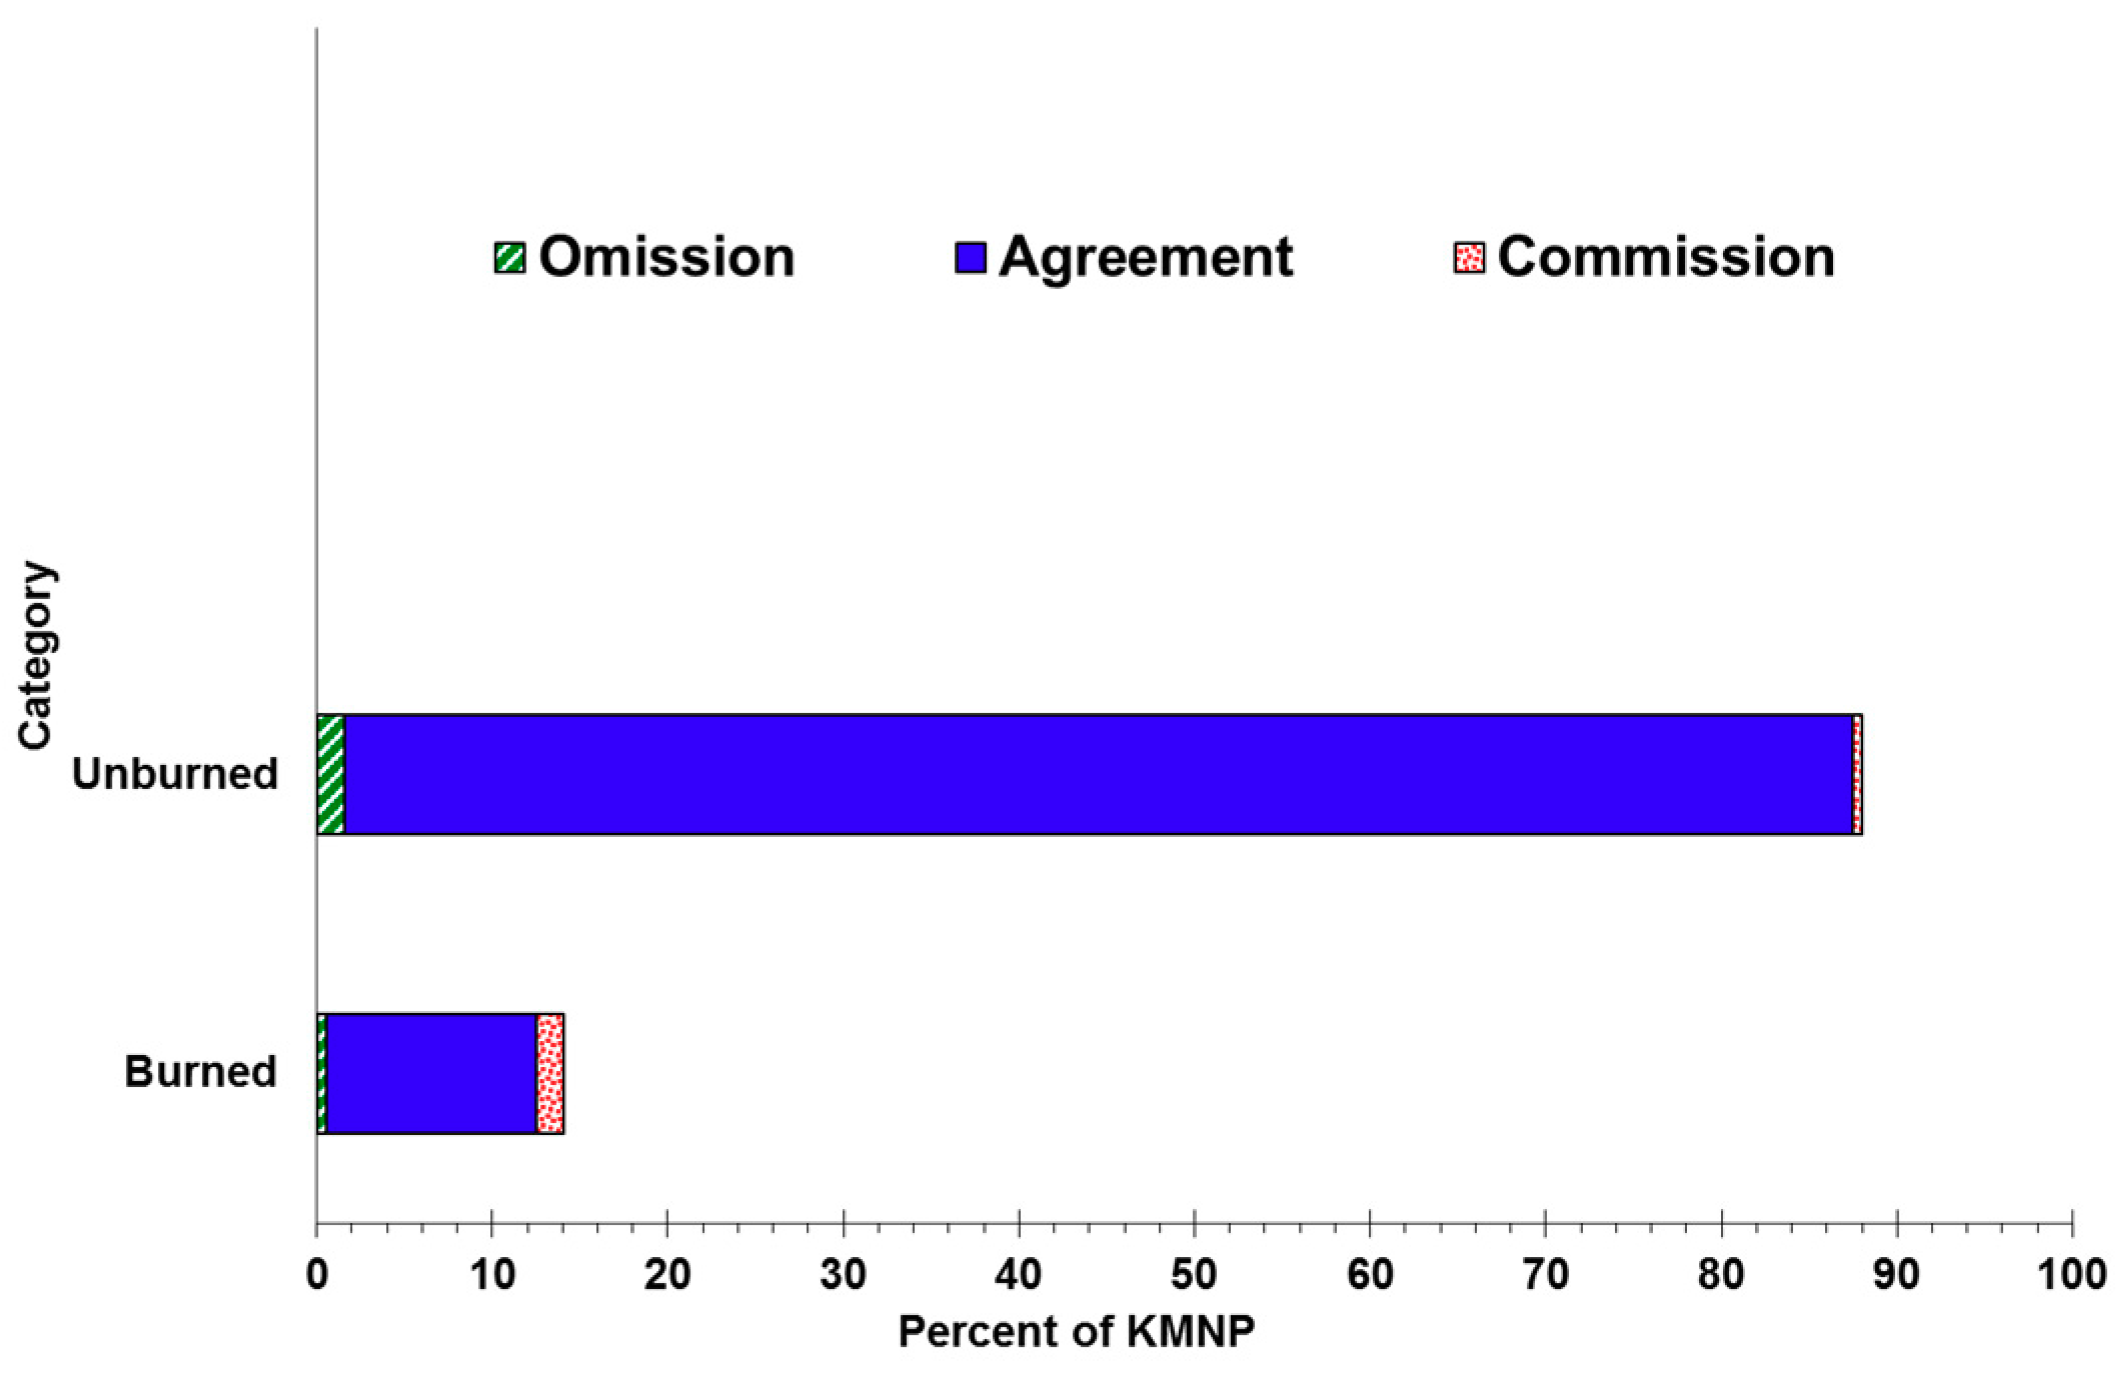
The total disagreement of the burn classification was 2% representing equal amounts of quantity and allocation disagreement at 1% each. Low total disagreement suggests the classification properly allocated cover classes to the correct spatial location and in the correct proportions with respect to reference data. The vast majority of the KMNP pixels were unburned from this fire event (although, many were burned from previous events) (Figure 3). There was strong agreement between the map classification and test data. Burned area commission disagreement is much higher than unburned area suggesting there may be an overestimate of burned lands; however, the overall percent disagreement is low.
The largest burn scar, located in close proximity to Ankoatsifaka Research Station, can definitely be attributed to the escaped fire and accounts for half of the forest lost in KMNP over the period (2333 ha). It is unknown the true extent of the burn attributable to the original escaped fire, although the large conflagration extending from center to the east is known to have originated from that source. Forest burns just to the north and south of the large burn area could be due to the same escaped fire (particularly the one extending from center to western edge); it is difficult to determine just how far that burn extends. Burns along the park boundary in the far north and far south cannot be attributed to the same source but they are included in this estimate as they did burn during the same period of study. Weather conditions during that season suggest that fires set in other locations may have also spread beyond target areas as well.
It is important to note that the extent of fire during this period was greater than reported here, as some areas of forest were burned in the understory and in the canopy without stand removal. Without extensive ground-truthing of these understory burns, it is very difficult to accurately model the full extent of this type of fire. Furthermore, at this time, neither spectral nor thermal remote sensing methods can accurately detect changes in lower forest strata [15,82]. However, changes in the understory are arguably an especially important component of this forest’s ecology.
Cyclones that frequent this region remove large trees and create forest gaps which then “release” suppressed subcanopy vegetation resulting in a dramatic increase in understory growth [83,84]. A forest that has lost understory seedlings and saplings to a fire may not be able to recover from a windstorm that removes overstory trees; rather these gaps will likely be invaded by grasses instead.
Even undisturbed forests are at risk from grass fires originating from pasture or agricultural lands which burn up to and just into forest edges. Forest edges recolonized by grass fuel further grass encroachment by increasing fire susceptibility, fuel loading, and fire intensity in a feedback process that can quickly transform large areas of tropical dry forest into savanna, shrubland, or grassland [14,85].
Windfall gaps colonized by grasses within TDF may represent an even higher fire risk to forests as these gap grasses are susceptible to fire ignition by wind-borne fire embers, and they may be subject to intentional clearing by fire for agricultural activities. Consequently, the interplay of fire and cyclone disturbance may be fueling grass and forest fuel regimes (typical of tropical forest edges) from within large blocks of forest.
While dNBR was instrumental in identifying burned areas, it underestimated the amount of the burn, particularly in areas where old clearings in June had a spectral signature similar to burned areas that occurred after June. The dNBR also falsely identified some unburned areas undergoing phenological change as having burned. A difference image of MSAVI2 of the two dry season images did not significantly differ from dNBR and provided no additional information.
A major challenge was separating fresh burn scars appearing on 23 June with those that appeared after. Given the frequency of fire on the landscape, a classification method was sought that would reliably differentiate between burns created at such close time intervals.
The addition of KT greenness to dNBR helped differentiate between fresh burn patches created just before 23 June and those attributed to the large fire after that date. Areas of forest that burned after 23 June were covered in ash leaving a unique gray spectral signature, while grassy areas that burned left a different signature. Bare patches that burned between April and June 2013 and then burned again in July/August 2013 left yet another spectral signature. The ultimate goal was to quantify the amount of forest burned, so it was not critical to identify re-burnt patches (as they would not be classified as forest in the pre-fire forest classification). Therefore, making this distinction did not alter the calculation of the extent of forest lost; however, if one were interested in modeling the trajectory of the fire or quantify the full extent of burn, regardless of land cover type, the addition of the Greenness band would facilitate such an analysis.
Whereas KT greenness helped resolve differences in the timing of burns in open clearings, MKT ΔG (change in greenness) helped resolve burns that left scars with a spectral signature not significantly different from background color which would have been otherwise overlooked by other indices. So while KT helped to avoid overestimation of burn scars, MKT aided in avoiding underestimating them.
The MKT ΔW (change in wetness) band failed to differentiate between burns just prior to 23 June and those just after, yet it did successfully differentiate between burns after 23 June and those that occurred at least a season prior to that date. The MKT ΔB (change in brightness) easily differentiated between dark burn scars just prior to 23 June and those afterwards, but it falsely labeled some old burn scars (before April 2013) located within recent burned areas as recent burns, and it failed to discriminate between white ash spots from 23 June from white ash spots after 23 June.
Together, dNBR and DI performed well in distinguishing forest burned since 23 June nearly obviating the need to perform a separate classification of pre-fire forest. Although the DI/dNBR combination showed strong promise for rapid classification, DI failed to distinguish between vegetation regrowth in old previously cleared patches (perhaps agriculture or early shrub growth) and tropical dry forest; thus, while DI did appropriately identify this as burn since 23 June, it did not differentiate between burned tropical dry forest and burned secondary vegetation. Furthermore, DI misidentified some clearings burned before 23 June as having been burned after that date. Conversely, both multi-temporal and uni-temporal measures of Greenness easily distinguished regions of regrowth in old cleared patches from tropical dry forest. In study areas without cleared patches in various stages of regrowth, DI may identify forest burned in a stand-replacing fire in a single step (without having to first classify pre-fire forest cover).
3.2. Forest Classification Map
The total land area of KMNP (excluding the small islands off the coast) is 128,666 ha, and the total area of TDF within this area, as of 23 June 2013, was estimated to be 80,339 ha.
A confusion matrix was calculated and both producer’s and user’s accuracy of the forest classification map was well above 80% with an overall Kappa statistic of 0.8541 (Table 3). The total disagreement of the forest classification was 6.8% which was comprised of quantity disagreement (1.6%) and allocation disagreement (5.2%). The difference in agreement measures suggest that while the classification performed very well in detecting the total number of forest pixels (quantity), the classification was not as adept at allocating them all to the correct locations on the map (allocation).
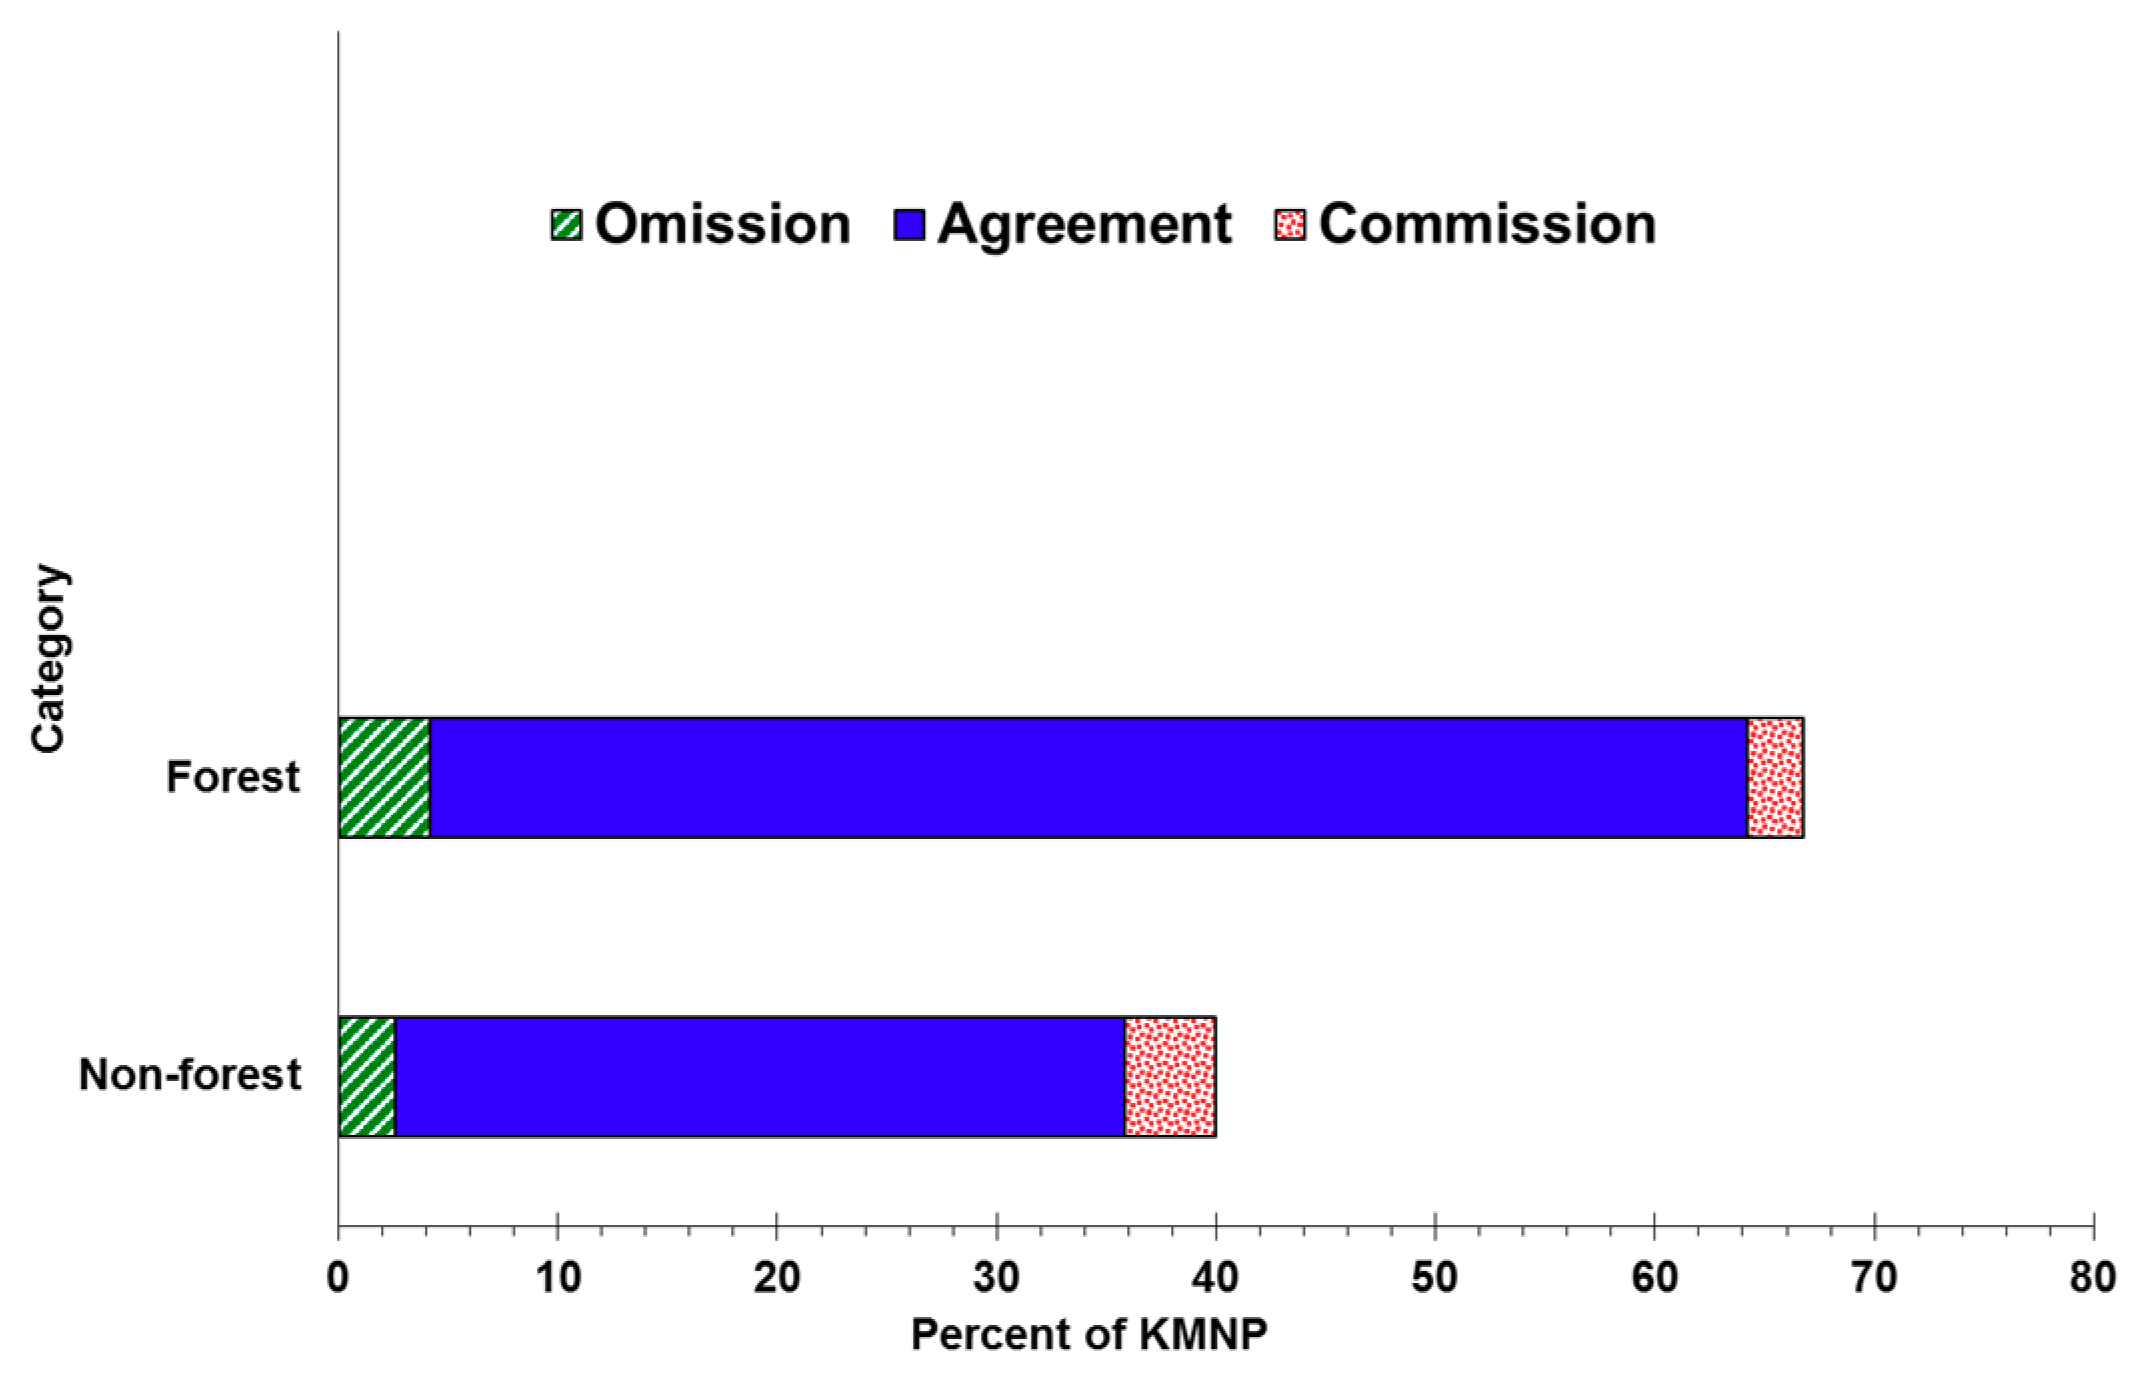
Non-forest commission disagreement is slightly higher than forest suggesting there may be an overestimate of non-forested lands. Likewise, omission disagreement is slightly higher for forest suggesting an underestimate of forested lands (Figure 4).
A major challenge to mapping forest burns in TDF landscapes is the initial classification of the TDF. Mapping of TDF requires considerable attention to both phenological changes and the presence of regenerating secondary vegetation. Classification of tropical dry forest is especially challenging because vegetation undergoes substantial spectral changes over the course of the year [7]. Dry season imagery is deemed more useful for TDF mapping because differences in forest structural properties are more distinctive during at this time. This is especially important when trying to differentiate between evergreen gallery forests and seasonally dry deciduous forest [68,86]. Inclusion of multi-season imagery can further improve classification by helping to distinguish between tropical dry forests having different degrees of deciduousness (e.g., xerophytic vs. seasonally dry deciduous forest, forest vs. pastureland) [87].
The commonly used vegetation index NDVI, has been shown to be significantly related to TDF canopy closure, plant diversity, plant richness and plant species composition [88,89]; however, NDVI saturates at high vegetation densities and researchers have thus developed “enhanced” and “soil-adjusted” options [90,91]. MSAVI2 is a modified version of the original soil-adjusted vegetation index which outperforms NDVI in regions with a large amount of exposed soil [52], and MSAVI2 performed substantially better than NDVI in this landscape. On the other hand, indices representing wetness such as NDWI and TCAP wetness did not improve the classification.
Haboudane et al. [72] modified existing indices to create the Modified Triangular Vegetation Index, an index that is more responsive to variations in green leaf area index (LAI), less resistant to the effects of chlorophyll absorption on green reflectance, and more resistant to the effects of soil properties on vegetation reflectance. In this landscape, MTVI2 was particularly helpful in helping to distinguish between secondary growth in old burn patches and TDF.
Texture measures were included in this classification to combat the difficulties of classifying land cover in the highly heterogeneous semi-arid environment; texture has been shown to improve upon spectral classification alone in these environments [92]. Textural measures have improved land cover classifications of various landscape types [93], as they are especially effective in distinguishing among “spectrally indistinct” cover classes [94]. The addition of texture measures to the forest classification was especially helpful in teasing apart those areas having similar spectral signal but different structures.
Only texture measures of near-infrared and shortwave infrared bands (Landsat OLI Bands 5 and 6) improved the classification. Texture measures have been shown to correlate with stem density [69], aboveground biomass [67], and canopy structure [70,71]. In this case, high mean Euclidian distance corresponded to high vegetation heterogeneity typical of disturbed lands; tropical dry forest was homogeneous compared to other vegetation types and registered very low measures of texture. In a study of textural measures (standard deviation), Nagendra et al. [89] also found a negative relationship between texture and plant diversity (e.g., undisturbed tropical forest) in a human-disturbed landscape.
While there are different types of TDF located within KMNP, the primary goal here was to map primary forest cover of any type, so it was therefore not important to distinguish between spiny thicket, gallery forest, baobab groves, and seasonal dry deciduous forest. Use of multi-season imagery and vegetation indices did improve this forest classification by allowing all forest types (merged into a single class) to be readily distinguished from pasture and other non-forest classes.
4. Conclusions
Despite the fact that the majority of land within the large burn scar adjacent to Ankoatsifaka Research Station (8441 ha) was not identified as forest, it is important to recognize that most of this burned area was recently forested, as evidenced by satellite imagery. Forest clearings materialize patch-by-patch over seasons and years. As such, it is easy to overlook the collective loss of forest.
This research is one of few burn mapping studies of tropical dry forests. Fire is a major factor in the disturbance and loss of global tropical dry forests, yet this avenue of research has received little attention. Remote sensing mapping studies of fire-impacted TDF lag behind studies of other forest types, including boreal forest. Furthermore, as of yet, there are no established standardized techniques for tropical dry forest burn mapping. Active fire map products derived from instruments such as NASA’s MODIS (Moderate Resolution Imaging Spectroradiometer) and VIIRS (Visible Infrared Imaging Radiometer Suite) and ESA’s ATSR and AATSR (no longer operational) identify active fires through detection of thermal anomalies at large spatial resolution (~550–1000 m). These instruments provide some insight into the number, and location of fires, but they do not provide any information on the extent of fire or forest lost.
The research presented here addresses a critical gap in understanding the challenges of analyzing fire through remotely sensed satellite imagery in TDF systems. Spectral information based primarily on change in greenness metrics resulted in highest accuracy suggesting that accounting for phenological changes in TDF (particularly senescence) significantly aids in burn mapping. Standards established to calculate burn severity in other areas do not necessarily hold true in tropical dry forest. With fire representing a major risk to the biome, there is an urgent need for additional studies on tropical dry forest fires. Land stewards, conservation planners, and wildlife managers all require accurate figures of forest lost to fire in order to manage resources sensibly.
While TDF may share common spectral characteristics across the globe, they are frequently embedded in a host of different—and largely anthropogenic—landscapes rendering them each fairly spectrally distinctive at the landscape scale. This further complicates efforts to establish standardized techniques for tropical dry forest burn mapping. Lessons for burn mapping of TDF are much the same as for TDF forest mapping—highly seasonal vegetation combined with a mixture of background spectral information complicate analysis and may require site specific techniques.
Acknowledgments
I am grateful to Rebecca Lewis for facilitating my visit to Kirindy Mitea National Park, arranging my accommodations at Ankoatsifaka Research Station, and for providing vital background information on the Park and its resources. Thanks also to Tanteliniaina Maximain Andriamampiandrisoa for assistance with data collection and for providing detailed information about, and photos of, the fire. I would also like to thank the Government of Madagascar, Madagascar National Parks (MNP formerly ANGAP), and the University of Antananarivo for their permission to conduct research at Kirindy Mitea National Park. I thank four anonymous reviewers for providing suggestions and thoughtful comments that improved this manuscript. This research was supported by Marshall University.
Conflicts of Interest
The author declares no conflict of interest. The funding sponsors had no role in the design of the study; in the collection, analyses, or interpretation of data; in the writing of the manuscript, and in the decision to publish the results.
References
- Hansen, M.C.; Stehman, S.V.; Potapov, P.V. Quantification of global gross forest cover loss. Proc. Natl. Acad. Sci. USA 2010, 107, 8650–8655. [Google Scholar] [CrossRef] [PubMed]
- Murphy, P.G.; Lugo, A.E. Ecology of tropical dry forest. Annu. Rev. Ecol. Syst. 1986, 17, 67–88. [Google Scholar] [CrossRef]
- Gerhardt, K.; Hytteborn, H. Natural dynamics and regeneration methods in tropical dry forests—An introduction. J. Veg. Sci. 1992, 3, 361–364. [Google Scholar] [CrossRef]
- Miles, L.; Newton, A.C.; DeFries, R.S.; Ravilious, C.; May, I.; Blyth, S.; Kapos, V.; Gordon, J.E. A global overview of the conservation status of tropical dry forests. J. Biogeogr. 2006, 33, 491–505. [Google Scholar] [CrossRef]
- Hoekstra, J.M.; Boucher, T.M.; Ricketts, T.H.; Roberts, C. Confronting a biome crisis: Global disparities of habitat loss and protection. Ecol. Lett. 2005, 8, 23–29. [Google Scholar] [CrossRef]
- Lerdau, M.; Whitbeck, J.; Holbrook, N.M. Tropical deciduous forest: Death of a biome. Trends Ecol. Evol. 1991, 6, 201–202. [Google Scholar] [CrossRef]
- Barreda-Bautista, B.; López-Caloca, A.A.; Couturier, S.; Silván-Cárdenas, J.L. Tropical Dry Forests in the Global Picture: The Challenge of Remote Sensing-Based Change Detection in Tropical Dry Environments. In Planet Earth 2011—Global Warming Challenges and Opportunities for Policy and Practice; Carayannis, E., Ed.; InTech: Rijeka, Croatia, 2011; pp. 231–256. [Google Scholar]
- Hesketh, M.; Sánchez-Azofeifa, A. A Review of Remote Sensing of Tropical Dry Forests. In Tropical Dry Forests in the Americas: Ecology, Conservation, and Management; Quesada, M., Ed.; CRC Press: Boca Raton, FL, USA, 2013; pp. 83–100. [Google Scholar]
- Sunderland, T.; Apgaua, D.; Baldauf, C.; Blackie, R.; Colfer, C.; Cunningham, A.B.; Dexter, K.; Djoudi, H.; Gautier, D.; Gumbo, D.; et al. Global dry forests: A prologue. Int. For. Rev. 2015, 17, 1–9. [Google Scholar] [CrossRef]
- Sanchez-Azofeifa, G.A.; Castro, K.L.; Rivard, B.; Kalascka, M.R.; Harriss, R.C. Remote sensing research priorities in tropical dry forest environments. Biotropica 2003, 35, 134–142. [Google Scholar] [CrossRef]
- Martinuzzi, S.; Gould, W.A.; Vierling, L.A.; Hudak, A.T.; Nelson, R.F.; Evans, J.S. Quantifying tropical dry forest type and succession: Substantial improvement with LiDAR. Biotropica 2013, 45, 135–146. [Google Scholar] [CrossRef]
- Cochrane, M.A. In the line of fire: Understanding the impacts of tropical forest fires. Environment 2001, 43, 28–38. [Google Scholar] [CrossRef]
- Cochrane, M.A. Fire science for rainforests. Nature 2003, 421, 913–919. [Google Scholar] [CrossRef] [PubMed]
- Cochrane, M.A. Positive feedbacks in the fire dynamic of closed canopy tropical forests. Science 1999, 284, 1832–1835. [Google Scholar] [CrossRef] [PubMed]
- Alencar, A.; Asner, G.P.; Knapp, D.; Zarin, D. Temporal variability of forest fires in eastern Amazonia. Ecol. Appl. 2014, 21, 2397–2412. [Google Scholar] [CrossRef]
- DeFries, R.; Hansen, A.; Newton, A.C.; Hansen, M.C. Increasing isolation of protected areas in tropical forests over the past twenty years. Ecol. Appl. 2005, 15, 19–26. [Google Scholar] [CrossRef]
- Réau, B. Burning for zebu: The complexity of deforestation issues in western Madagascar. Nor. J. Geogr. 2002, 56, 219–229. [Google Scholar] [CrossRef]
- Gorenflo, L.J.; Corson, C.; Chomitz, K.M.; Harper, G. Exploring the association between people and deforestation in Madagascar. In Human Population: It’s Influences on Biological Diversity; Cincotta, R.P., Gorenflo, L.J., Eds.; Ecological Studies; Springer: Berlin/Heidelberg, Germany, 2011; Volume 214, pp. 197–221. [Google Scholar]
- Smith, A.P. Deforestation, fragmentation and reserve design in western Madagascar. In Tropical Forest Remnants, Ecology, Management and Conservation of Fragmented Communities; Laurence, W.F., Bierregaard, R.O.J., Eds.; The University of Chicago Press: Chicago, IL, USA, 1997. [Google Scholar]
- Scales, I.R. Farming at the forest frontier: Land use and landscape change in western Madagascar, 1896–2005. Environ. Hist. Camb. 2011, 17, 499–524. [Google Scholar] [CrossRef]
- Zinner, D.; Wygoda, C.; Razafimanantsoa, L.; Rasoloarison, R.; Andrianandrasana, H.T.; Ganzhorn, J.U.; Torkler, F. Analysis of deforestation patterns in the central Menabe, Madagascar, between 1973 and 2010. Reg. Environ. Chang. 2014, 14, 157–166. [Google Scholar] [CrossRef]
- Scales, I.R. Lost in translation: Conflicting views of deforestation, land use and identity in western Madagascar. Geogr. J. 2012, 178, 67–79. [Google Scholar] [CrossRef] [PubMed]
- Scales, I.R. The drivers of deforestation and the complexity of land use in Madagascar. In Conservation and Environmental Management in Madagascar; Scales, I.R., Ed.; Routledge: London, UK, 2014; pp. 105–125. [Google Scholar]
- Genini, M. Deforestation. Primate Rep. 1996, 46, 49–55. [Google Scholar]
- Raharimalala, O.; Buttler, A.; Dirac Ramohavelo, C.; Razanaka, S.; Sorg, J.P.; Gobat, J.M. Soil-vegetation patterns in secondary slash and burn successions in Central Menabe, Madagascar. Agric. Ecosyst. Environ. 2010, 139, 150–158. [Google Scholar] [CrossRef]
- Ramohavelo, C.D. Stratégies Villageoises pour la Gestion des Paysages Forestiers du Menabe Central, Madagascar; École Polytechnique Fédérale de Lausanne: Lausanne, Switzerland, 2009. [Google Scholar]
- Leimberger, K.G.; Lewis, R.J. Patterns of male dispersal in Verreaux’s sifaka (Propithecus verreauxi) at Kirindy Mitea National Park. Am. J. Primatol. 2017. [Google Scholar] [CrossRef] [PubMed]
- Rasatatsihoarana, T.F. Reconnaissances Écologiques des Aires Forestières Dans le Menabe sud en vue D’une Délimitation de Nouvelles Aires Protégées; Trans-Mad’Développement: Antananarivo, Madagascar, 2007. [Google Scholar]
- Zinner, D.P.; Ostner, J.; Dill, A.; Razafimanantsoa, L.; Rasoloarison, R.M. Results of a reconnaissance expedition in the western dry forests between Morondava and Morombe. Lemur News 2001, 6, 16–18. [Google Scholar]
- Key, C.H.; Benson, N.C. Landscape assessment: Ground measure of severity, the Composite Burn Index; and remote sensing of severity, the Normalized Burn Ratio. In FIREMON: Fire Effects Monitoring and Inventory System. USDA Forest Service Gen. Tech. Rep. RMRS-GTR-164-CD; Lutes, D.C., Kean, R.E., Caratti, J.F., Key, C.H., Benson, N.C., Sutherland, S., Gangi, L.J., Eds.; U.S. Department of Agriculture, Forest Service, Rocky Mountain Research Station: Fort Collins, CO, USA, 2006; p. LA-1-55. [Google Scholar]
- Kontoes, C.C.; Poilvé, H.; Florsch, G.; Keramitsoglou, I.; Paralikidis, S. A comparative analysis of a fixed thresholding vs. a classification tree approach for operational burn scar detection and mapping. Int. J. Appl. Earth Obs. Geoinf. 2009, 11, 299–316. [Google Scholar] [CrossRef]
- Ressl, R.; Lopez, G.; Cruz, I.; Colditz, R.R.; Schmidt, M.; Ressl, S.; Jiménez, R. Operational active fire mapping and burnt area identification applicable to Mexican Nature Protection Areas using MODIS and NOAA-AVHRR direct readout data. Remote Sens. Environ. 2009, 113, 1113–1126. [Google Scholar] [CrossRef]
- Henry, M.C. Comparison of single- and multi-date Landsat data for mapping wildfire scars in Ocala National Forest, Florida. Photogramm. Eng. Remote Sens. 2008, 74, 881–891. [Google Scholar] [CrossRef]
- Escuin, S.; Navarro, R.; Fernández, P. Fire severity assessment by using NBR (Normalized Burn Ratio) and NDVI (Normalized Difference Vegetation Index) derived from LANDSAT TM/ETM images. Int. J. Remote Sens. 2008, 29, 1053–1073. [Google Scholar] [CrossRef]
- Cocke, A.E.; Fulé, P.Z.; Crouse, J.E. Comparison of burn severity assessments using Differenced Normalized Burn Ratio and ground data. Int. J. Wildl. Fire 2005, 14, 189. [Google Scholar] [CrossRef]
- Rogan, J.; Yool, S.R. Mapping fire-induced vegetation depletion in the Peloncillo Mountains, Arizona and New Mexico. Int. J. Remote Sens. 2001, 22, 3101–3121. [Google Scholar] [CrossRef]
- Holden, Z.A.; Morgan, P.; Hudak, A.T. Burn severity of areas reburned by wildfires on the Gila National Forest, New Mexico, USA. Fire Ecol. 2010, 6, 77–85. [Google Scholar] [CrossRef]
- Kolden, C.A.; Lutz, J.A.; Key, C.H.; Kane, J.T.; van Wagtendonk, J.W. Mapped versus actual burned area within wildfire perimeters: Characterizing the unburned. For. Ecol. Manag. 2012, 286, 38–47. [Google Scholar] [CrossRef]
- Patterson, M.W.; Yool, S.R. Mapping fire-induced vegetation mortality using Landsat Thematic Mapper data: A comparison of linear transformation techniques. Remote Sens. Environ. 1998, 65, 132–142. [Google Scholar] [CrossRef]
- Barrett, K.; McGuire, A.D.; Hoy, E.E.; Kasischke, E.S. Potential shifts in dominant forest cover in interior Alaska driven by variations in fire severity. Ecol. Appl. 2011, 21, 2380–2396. [Google Scholar] [CrossRef] [PubMed]
- Healey, S.; Cohen, W.; Zhiqiang, Y.; Krankina, O. Comparison of Tasseled Cap-based Landsat data structures for use in forest disturbance detection. Remote Sens. Environ. 2005, 97, 301–310. [Google Scholar] [CrossRef]
- Masek, J.G.; Huang, C.; Wolfe, R.; Cohen, W.; Hall, F.; Kutler, J.; Nelson, P. North American forest disturbance mapped from a decadal Landsat record. Remote Sens. Environ. 2008, 112, 2914–2926. [Google Scholar] [CrossRef]
- Koechlin, J.; Guillaumet, J.-L.; Morat, P. Flore et Végétation de Madagascar; Gantner Verlag: Vaduz, Liechtenstein, 1997. [Google Scholar]
- Bond, W.J.; Silander, J.A., Jr.; Ranaivonasy, J.; Ratsirarson, J. The antiquity of Madagascar’s grasslands and the rise of C4 grassy biomes. J. Biogeogr. 2008, 35, 1743–1758. [Google Scholar] [CrossRef]
- Parcs Nationaux Madagascar. Plan de Gestion de la Conservation Parc National Kirindy Mite; Ministère de l’Environnement et des Eaux et Forêts, Direction Inter Régional de l'ANGAP à Toliara: Toliara, Madagascar, 2002.
- Lewis, R.J.; Bannar-Martin, K.H. The impact of Cyclone Fanele on a tropical dry forest in Madagascar. Biotropica 2012, 44, 135–140. [Google Scholar] [CrossRef]
- Lewis, R. Ankoatsifaka Research Station. Available online: https://labs.la.utexas.edu/ankoatsifaka/field-station/ (accessed on 10 October 2017).
- Roy, D.P.; Wulder, M.A.; Loveland, T.R.; Woodcock, C.E.; Allen, R.G.; Anderson, M.C.; Helder, D.; Irons, J.R.; Johnson, D.M.; Kennedy, R.; et al. Landsat-8: Science and product vision for terrestrial global change research. Remote Sens. Environ. 2014, 145, 154–172. [Google Scholar] [CrossRef]
- Roy, D.P.; Kovalskyy, V.; Zhang, H.K.; Vermote, E.F.; Yan, L.; Kumar, S.S.; Egorov, A. Characterization of Landsat-7 to Landsat-8 reflective wavelength and normalized difference vegetation index continuity. Remote Sens. Environ. 2016, 185, 57–70. [Google Scholar] [CrossRef]
- Brown, J.K. Introduction and fire regimes. In Wildland Fire in Ecosystems: Effects of Fire on Flora; Brown, J.K., Kapler, J., Eds.; General Technical Report RMRS-GTR-164-CD; USDA Forest Service, Rocky Mountain Research Station: Fort Collins, CO, USA, 2000; pp. 1–8. [Google Scholar]
- Collins, J.B.; Woodcock, C.E. An assessment of several linear change detection techniques for mapping forest mortality using multitemporal landsat TM data. Remote Sens. Environ. 1996, 56, 66–77. [Google Scholar] [CrossRef]
- Qi, J.; Chehbouni, A.; Huete, A.R.; Herr, Y.H.; Sorooshian, S. A Modified Soil Adjusted Vegetation Index. Remote Sens. 1994, 48, 119–126. [Google Scholar] [CrossRef]
- García-Haro, F.J.; Gilabert, M.A.; Meliá, J. Monitoring fire-affected areas using Thematic Mapper data. Int. J. Remote Sens. 2001, 22, 533–549. [Google Scholar] [CrossRef]
- Richards, J.A. Thematic mapping from multitemporal image data using the principal components transformation. Remote Sens. Environ. 1984, 16, 35–46. [Google Scholar] [CrossRef]
- Fung, T. An assessment of TM imagery for land-cover change detection. IEEE Trans. Geosci. Remote Sens. 1990, 28, 681–684. [Google Scholar] [CrossRef]
- Fisher, R.; Vigilante, T.; Yates, C.; Russell-Smith, J. Patterns of landscape fire and predicted vegetation response in the North Kimberley region of Western Australia. Int. J. Wildl. Fire 2003, 12, 369. [Google Scholar] [CrossRef]
- Potere, D.; Woodcock, C.E.; Schneider, A.; Ozdogan, M.; Baccini, A. Patterns in forest clearing along the Appalachian Trail Corridor. Photogramm. Eng. Remote Sens. 2007, 73, 783–791. [Google Scholar] [CrossRef]
- Kauth, R.J.; Thomas, G.S. The Tasselled Cap—A Graphic Description of the Spectral-Temporal Development of Agricultural Crops as Seen by Landsat; Purdue University: West Lafayette, IN, USA, 1976. [Google Scholar]
- Crist, E.P.; Cicone, R.C. A physically-based transformation of Thematic Mapper data—The TM Tasseled Cap. IEEE Trans. Geosci. Remote Sens. 1984, GE-22, 256–263. [Google Scholar] [CrossRef]
- Baig, M.H.A.; Zhang, L.; Shuai, T.; Tong, Q. Derivation of a tasselled cap transformation based on Landsat 8 at-satellite reflectance. Remote Sens. Lett. 2014, 5, 423–431. [Google Scholar] [CrossRef]
- Lutes, D.C.; Keane, R.E.; Caratti, J.F.; Key, C.H.; Benshon, N.C.; Sutherland, S.; Gangi, L.J. FIREMON: Fire Effects Monitoring and Inventory System; General Technical Report RMRS-GTR-164-CD; USDA Forest Service, Rocky Mountain Research Station: Fort Collins, CO, USA, 2006.
- Fang, L.; Yang, J. Atmospheric effects on the performance and threshold extrapolation of multi-temporal Landsat derived dNBR for burn severity assessment. Int. J. Appl. Earth Obs. Geoinf. 2014, 33, 10–20. [Google Scholar] [CrossRef]
- Miller, J.D.; Thode, A.E. Quantifying burn severity in a heterogeneous landscape with a relative version of the delta Normalized Burn Ratio (dNBR). Remote Sens. Environ. 2007, 109, 66–80. [Google Scholar] [CrossRef]
- Zhang, G.; Xiao, X.; Dong, J.; Kou, W.; Jin, C.; Qin, Y.; Zhou, Y.; Wang, J.; Menarguez, M.A.; Biradar, C. Mapping paddy rice planting areas through time series analysis of MODIS land surface temperature and vegetation index data. ISPRS J. Photogramm. Remote Sens. 2015, 106, 157–171. [Google Scholar] [CrossRef] [PubMed]
- Müller, D.; Suess, S.; Hoffmann, A.A.; Buchholz, G. The Value of satellite-based active fire data for monitoring, reporting and verification of REDD+ in the Lao PDR. Hum. Ecol. 2013, 41, 7–20. [Google Scholar] [CrossRef]
- Gong, P.; Wang, J.; Yu, L.; Zhao, Y.; Zhao, Y.; Liang, L.; Niu, Z.; Huang, X.; Fu, H.; Liu, S.; et al. Finer resolution observation and monitoring of global land cover: First mapping results with Landsat TM and ETM+ data. Int. J. Remote Sens. 2013, 34, 2607–2654. [Google Scholar] [CrossRef]
- Olofsson, P.; Foody, G.M.; Stehman, S.V.; Woodcock, C.E. Making better use of accuracy data in land change studies: Estimating accuracy and area and quantifying uncertainty using stratified estimation. Remote Sens. Environ. 2013, 129, 122–131. [Google Scholar] [CrossRef]
- Kalacska, M.; Sanchez-Azofeifa, G.A.; Rivard, B.; Caelli, T.; White, H.P.; Calvo-Alvarado, J.C. Ecological fingerprinting of ecosystem succession: Estimating secondary tropical dry forest structure and diversity using imaging spectroscopy. Remote Sens. Environ. 2007, 108, 82–96. [Google Scholar] [CrossRef]
- Arroyo-Mora, J.P.; Sanchez-Azofeifa, A.; Kalacska, M.E.R.; Rivard, B. Secondary forest detection in a neotropical dry forest landscape using Landsat 7. Biotropica 2005, 37, 497–507. [Google Scholar] [CrossRef]
- Bohlman, S.A.; Adams, J.B.; Smith, M.O.; Peterson, D.L. Seasonal foliage changes in the Eastern Amazon Basin detected from Landsat Thematic Mapper satellite images. Biotropica 1998, 30, 376–391. [Google Scholar] [CrossRef]
- Tottrup, C. Improving tropical forest mapping using multi-date Landsat TM data and pre-classification image smoothing. Int. J. Remote Sens. 2004, 25, 717–730. [Google Scholar] [CrossRef]
- Haboudane, D.; Miller, J.R.; Pattey, E.; Zarco-Tejada, P.J.; Strachan, I.B. Hyperspectral vegetation indices and novel algorithms for predicting green LAI of crop canopies: Modeling and validation in the context of precision agriculture. Remote Sens. Environ. 2004, 90, 337–352. [Google Scholar] [CrossRef]
- Wood, E.M.; Pidgeon, A.M.; Radeloff, V.C.; Keuler, N.S. Image texture as a remotely sensed measure of vegetation structure. Remote Sens. Environ. 2012, 121, 516–526. [Google Scholar] [CrossRef]
- Anys, H.; He, D.C. Evaluation of Textural and Multipolarization Radar Features for Crop Classification. IEEE Trans. Geosci. Remote Sens. 1995, 33, 1170–1181. [Google Scholar] [CrossRef]
- Irons, J.R.; Petersen, G.W. Texture transforms of remote sensing data. Remote Sens. Environ. 1981, 11, 359–370. [Google Scholar] [CrossRef]
- Congalton, R.G. A review of assessing the accuracy of classifications of remotely sensed data. Remote Sens. Environ. 1991, 37, 35–46. [Google Scholar] [CrossRef]
- Rosenfield, G.H.; Fitzpatrick-Lins, K. A coefficient of agreement as a measure of thematic classification accuracy. Photogramm. Eng. Remote Sens. 1986, 52, 223–227. [Google Scholar]
- Fitzgerald, R.W.; Lees, B.G. Assessing the classification accuracy of multisource remote sensing data. Remote Sens. Environ. 1994, 47, 362–368. [Google Scholar] [CrossRef]
- Congalton, R.G.; Green, K. Assessing the Accuracy of Remotely Sensed Data: Principles and Practices, 2nd ed.; CRC Press: Boca Raton, FL, USA, 2009. [Google Scholar]
- Pontius, R.G.; Millones, M. Death to Kappa: Birth of quantity disagreement and allocation disagreement for accuracy assessment. Int. J. Remote Sens. 2011, 32, 4407–4429. [Google Scholar] [CrossRef]
- Stein, A.; Aryal, J.; Gort, G. Use of the Bradley-Terry model to quantify association in remotely sensed images. IEEE Trans. Geosci. Remote Sens. 2005, 43, 852–856. [Google Scholar] [CrossRef]
- McCarley, T.R.; Kolden, C.A.; Vaillant, N.M.; Hudak, A.T.; Smith, A.M.S.; Wing, B.M.; Kellogg, B.S.; Kreitler, J. Multi-temporal LiDAR and Landsat quantification of fire-induced changes to forest structure. Remote Sens. Environ. 2017, 191, 419–432. [Google Scholar] [CrossRef]
- Everham, E.M., III; Brokaw, N.V.L. Forest damage and recovery from catastrophic wind. Bot. Rev. 2016, 62, 113–185. [Google Scholar] [CrossRef]
- Xi, W. Synergistic effects of tropical cyclones on forest ecosystems: A global synthesis. J. For. Res. 2015, 26, 1–21. [Google Scholar] [CrossRef]
- Myers, R.L. Fire in tropical and subtropical ecosystems. In Wildland Fire and Ecosystems: Effects of Fire on Flora; Brown, J.K., Kapler, J., Eds.; General Technical Report RMRS-GTR-164-CD; USDA Forest Service, Rocky Mountain Research Station: Fort Collins, CO, USA, 2000; Volume 2, pp. 161–174. [Google Scholar]
- Portillo-Quintero, C.A.; Sánchez-Azofeifa, G.A. Extent and conservation of tropical dry forests in the Americas. Biol. Conserv. 2010, 143, 144–155. [Google Scholar] [CrossRef]
- Helmer, E.H.; Ruzycki, T.S.; Benner, J.; Voggesser, S.M.; Scobie, B.P.; Park, C.; Fanning, D.W.; Ramnarine, S. Detailed maps of tropical forest types are within reach: Forest tree communities for Trinidad and Tobago mapped with multiseason Landsat and multiseason fine-resolution imagery. For. Ecol. Manag. 2012, 279, 147–166. [Google Scholar] [CrossRef]
- Feeley, K.J.; Gillespie, T.W.; Terborgh, J.W. The utility of spectral indices from Landsat ETM+ for measuring structure and composition of tropical dry forests. Biotropica 2005, 37, 508–519. [Google Scholar] [CrossRef]
- Nagendra, H.; Rocchini, D.; Ghate, R.; Sharma, B.; Pareeth, S. Assessing plant diversity in a dry tropical forest: Comparing the utility of Landsat and Ikonos satellite images. Remote Sens. 2010, 2, 478–496. [Google Scholar] [CrossRef]
- Gu, Y.; Wylie, B.K.; Howard, D.M.; Phuyal, K.P.; Ji, L. NDVI saturation adjustment: A new approach for improving cropland performance estimates in the Greater Platte River Basin, USA. Ecol. Indic. 2013, 30, 1–6. [Google Scholar] [CrossRef]
- Norman, S.P.; Koch, F.H.; Hargrove, W.W. Detecting and monitoring large-scale drought effects on forests: Toward an integrated approach. In GTR-WO-93b Effects of Drought on Forests and Rangelands in the United States; US Department of Agriculture, Forest Service, Southern Research Station (SRS), Eastern Forest Environmental Threat Assessment Center (EFETAC): Asheville, NC, USA, 2016; pp. 196–229. [Google Scholar]
- Tanser, F.; Palmer, A.R. Vegetation mapping of the Great Fish River basin, South Africa: Integrating spatial and multi-spectral remote sensing techniques. Appl. Veg. Sci. 2000, 3, 197–204. [Google Scholar] [CrossRef]
- Lu, D. Aboveground biomass estimation using Landsat TM data in the Brazilian Amazon. Braz. Amaz. Int. J. Remote Sens. 2005, 26, 2509–2525. [Google Scholar] [CrossRef]
- Kushwaha, S.P.S.; Kuntz, S.; Oesten, G. Applications of image texture in forest classification. Int. J. Remote Sens. 1994, 15, 2273–2284. [Google Scholar] [CrossRef]
Figure 1.
Menabe Region highlighting the location of Kirindy Mitea National Park.

Figure 2.
Areas of Kirindy Mitea National Park that burned between 23 June and 27 September 2013. (A) total area burned; (B) tropical dry forests (TDF) lost to fire.
Figure 2.
Areas of Kirindy Mitea National Park that burned between 23 June and 27 September 2013. (A) total area burned; (B) tropical dry forests (TDF) lost to fire.

Figure 3.
Category level analysis of agreement, omission disagreement and commission disagreement for burn classification. Land cover categories are on the vertical axis while the reference pixels are on the horizontal axis.
Figure 3.
Category level analysis of agreement, omission disagreement and commission disagreement for burn classification. Land cover categories are on the vertical axis while the reference pixels are on the horizontal axis.

Figure 4.
Category level analysis of agreement, omission disagreement and commission disagreement for burn classification. Land cover categories are on the vertical axis while the reference pixels are on the horizontal axis.
Figure 4.
Category level analysis of agreement, omission disagreement and commission disagreement for burn classification. Land cover categories are on the vertical axis while the reference pixels are on the horizontal axis.


Table 1.
Multitemporal Kauth-Thomas transformation matrix for Landsat 8 OLI reflectance data. Components B = brightness, G = greenness, W = wetness.
Table 1.
Multitemporal Kauth-Thomas transformation matrix for Landsat 8 OLI reflectance data. Components B = brightness, G = greenness, W = wetness.
| Stable Components | Change Components | ||||||||||
|---|---|---|---|---|---|---|---|---|---|---|---|
| B | G | W | 4 | 5 | 6 | ΔB | ΔG | ΔW | Δ4 | Δ5 | Δ6 |
| 0.214 | −0.208 | 0.107 | −0.583 | −0.233 | 0.076 | −0.214 | 0.208 | −0.107 | 0.583 | 0.233 | −0.076 |
| 0.197 | −0.172 | 0.140 | 0.060 | 0.039 | −0.638 | −0.197 | 0.172 | −0.140 | −0.060 | −0.039 | 0.638 |
| 0.335 | −0.384 | 0.232 | 0.311 | 0.075 | 0.291 | −0.335 | 0.384 | −0.232 | −0.311 | −0.075 | −0.291 |
| 0.396 | 0.514 | 0.241 | −0.041 | 0.131 | 0.041 | −0.396 | −0.514 | −0.241 | 0.041 | −0.131 | −0.041 |
| 0.359 | 0.050 | −0.503 | 0.142 | −0.308 | −0.018 | −0.359 | −0.050 | 0.503 | −0.142 | 0.308 | 0.018 |
| 0.132 | −0.114 | −0.322 | −0.196 | 0.572 | 0.018 | −0.132 | 0.114 | 0.322 | 0.196 | −0.572 | −0.018 |
Table 2.
Confusion matrix for the burn classification map.
| Reference Data | |||||
|---|---|---|---|---|---|
| Classification | Burned | Unburned | Total | User’s Accuracy | |
| Burned | 69 | 9 | 78 | 88% | |
| Unburned | 1 | 165 | 166 | 99% | |
| Total | 70 | 174 | 244 | ||
| Producer’s Accuracy | 99% | 95% | |||
Overall Kappa: 0.9031.
Table 3.
Confusion matrix for the forest classification map.
| Reference Data | |||||
|---|---|---|---|---|---|
| Classification | Non-Forest | Forest | Total | User’s Accuracy | |
| Non-forest | 48 | 6 | 54 | 89% | |
| Forest | 4 | 92 | 96 | 96% | |
| Total | 52 | 98 | 150 | ||
| Producer’s Accuracy | 92% | 94% | |||
Overall Kappa: 0.8541.
© 2018 by the author. Licensee MDPI, Basel, Switzerland. This article is an open access article distributed under the terms and conditions of the Creative Commons Attribution (CC BY) license (http://creativecommons.org/licenses/by/4.0/).
Share and Cite
MDPI and ACS Style
Axel, A.C. Burned Area Mapping of an Escaped Fire into Tropical Dry Forest in Western Madagascar Using Multi-Season Landsat OLI Data. Remote Sens. 2018, 10, 371. https://doi.org/10.3390/rs10030371
AMA Style
Axel AC. Burned Area Mapping of an Escaped Fire into Tropical Dry Forest in Western Madagascar Using Multi-Season Landsat OLI Data. Remote Sensing. 2018; 10(3):371. https://doi.org/10.3390/rs10030371
Chicago/Turabian StyleAxel, Anne C. 2018. "Burned Area Mapping of an Escaped Fire into Tropical Dry Forest in Western Madagascar Using Multi-Season Landsat OLI Data" Remote Sensing 10, no. 3: 371. https://doi.org/10.3390/rs10030371
Note that from the first issue of 2016, this journal uses article numbers instead of page numbers. See further details here.