Article

An Observation Task Chain Representation Model for Disaster Process-Oriented Remote Sensing Satellite Sensor Planning: A Flood Water Monitoring Application

Faculty of Information Engineering, China University of Geosciences (Wuhan), Wuhan 430074, China
*
Author to whom correspondence should be addressed.
These authors contributed equally to this work.
Remote Sens. 2018, 10(3), 375; https://doi.org/10.3390/rs10030375
Submission received: 8 February 2018 / Revised: 8 February 2018 / Accepted: 26 February 2018 / Published: 1 March 2018

Abstract

:
An accurate and comprehensive representation of an observation task is a prerequisite in disaster monitoring to achieve reliable sensor observation planning. However, the extant disaster event or task information models do not fully satisfy the observation requirements for the accurate and efficient planning of remote-sensing satellite sensors. By considering the modeling requirements for a disaster observation task, we propose an observation task chain (OTChain) representation model that includes four basic OTChain segments and eight-tuple observation task metadata description structures. A prototype system, namely OTChainManager, is implemented to provide functions for modeling, managing, querying, and visualizing observation tasks. In the case of flood water monitoring, we use a flood remote-sensing satellite sensor observation task for the experiment. The results show that the proposed OTChain representation model can be used in modeling process-owned flood disaster observation tasks. By querying and visualizing the flood observation task instances in the Jinsha River Basin, the proposed model can effectively express observation task processes, represent personalized observation constraints, and plan global remote-sensing satellite sensor observations. Compared with typical observation task information models or engines, the proposed OTChain representation model satisfies the information demands of the OTChain and its processes as well as impels the development of a long time-series sensor observation scheme.

Graphical Abstract

1. Introduction

A total of 327 disastrous events were reported around the world in 2016. These disasters collectively resulted in USD 175 billion worth of economic losses and 11,000 human fatalities [1]. Floods are typical examples of such disasters. The 2016 floods in the Yangtze River Basin in China resulted in approximately USD 22 billion worth of economic losses, thereby making these floods the most expensive disaster in the Yangtze River Basin since 1998 [1]. The disaster management paradigm is currently shifting from a static pattern to dynamic process monitoring [2,3]. In this case, disaster monitoring can be assigned to an observation task chain (OTChain) that comprises time-series observation tasks [2,4] with dynamic observation themes, large-scale observation time and space windows, and other personalized observation characteristics. However, process-owned observation tasks must be efficiently and effectively expressed to ensure accurate disaster monitoring management [5].
Earth observation (EO) has been widely applied to various fields in disaster management, including disaster preparation, response, recovery, and mitigation. The Sendai Framework for Disaster Risk Reduction 2015–2030 [6] explicitly defines EO as an essential tool for gathering data on hazard exposure, vulnerability, and risk. The recent advancements in sensor technologies have greatly improved the ability of EO to collect geospatial data. More than 1700 operational remote-sensing satellites equipped with various sensors have been deployed on Earth for observation [7]. Choosing the right remote-sensing satellite sensors to fulfill dynamic and complex disaster observation task requirements is an important task [8] that can promote disaster preparedness and improve the effectiveness of disaster risk management.

1.1. Sensor Planning in Disaster Monitoring

Sensor planning [9] is an important step in disaster monitoring management that can be divided into four stages based on the surrounding sensor objects, including single sensors, multiple sensors on a single platform, sensor networks, and sensor webs. In the single sensor stage, because the number of sensors is small, the mode used to plan those sensors is the “predefined” mode provided by the project requirements instead of the on-demand “planning” mode matched from the sensor clearinghouse [10]. In the multiple sensors stage, the sensor planner can obtain information regarding the observation capability of the available sensors as easily as that in the previous stage given the limited number of sensors on a single platform. To maximize the space coverage or coordinate the observation instructions, the known sensors are easily planned to complete the given observation task [11]. In the sensor network stage, several sensors are deployed in various application domains of sensor networks to obtain environmental information. Planning the distribution of these sensors across different networks is critical because of the relatively complicated observation tasks in this stage [12]. However, this stage only focuses on planning the distribution of sensors among protocol-inclusive sensor networks [13]. In other words, the sensor distribution cannot be uniformly planned. The recent developments in web technology have made the sensor web stage a popular means for managing ubiquitous sensors that are deployed on Earth [14]. Sensor planning has also received considerable attention. Certain web-based search engines, such as Google, Yahoo, the NASA Global Change Master Directory (GCMD) retrieval portal [15], the Committee on Earth Observation Satellites (CEOS) database [16], and the Observing Systems Capability Analysis and Review Tool of the World Meteorological Organization (WMO) [17], can be utilized for planning EO sensors. However, these web-based engines employ fuzzy planning methods depending on the keywords and plain text definitions that reflect the observable properties of sensors instead of the actual comprehensive disaster observation task requirements. In this case, sensor planners can only identify the list of qualified sensors, but cannot obtain a detailed sensor observation planning solution to certain questions, such as “which sensor can be employed with another sensor to measure the required variable in a given observation time and space for a particular application?”
The Sensor Web Enablement (SWE) initiative of the Open Geospatial Consortium defines several standard specifications [18] for planning and discovering relevant sensors on the web [19]. As a flexible carrier for describing sensor information and for discovering and planning sensors, SensorML [20] has been adopted as the bottom information model for sensor observation services (SOS) [21] and sensor planning services (SPS) [22] in many SWE projects [23,24,25]. SOS facilitates the sensor search process by using a sensor identification or a basic combination of spatio-temporal observation criteria [21]. Meanwhile, SPS performs sensor planning based on a simple spatio-temporal observation condition, which cannot well-represent real and complex observation requirements [22]. As mentioned above, several methods and applications are currently being used for planning EO sensors. However, these methods plan EO sensors from the perspective of sensors rather than complex and diverse observation tasks. Given that each disaster has a unique evolution process, the extant sensor planning methods, which perform sensor planning based on a stationary spatiotemporal observation snapshot of a process-owned disaster, cannot satisfy the long sequential process monitoring requirements of a single disaster.

1.2. Disaster Observation Task Modeling

In disaster monitoring, decision-makers must fairly and comprehensively define the observation tasks [26]. Only through an accurate representation of observation tasks can sensor planners be able to achieve reliable sensor planning. A reliable sensor observation planning solution guarantees the acquisition of accurate disaster information, which is a prerequisite for disaster emergency and risk management [27,28].
Chen et al. [29] reviewed general and specific types of disaster information modeling carriers. General information modeling carriers include the Common Alert Protocol (CAP) [30], which is a data interchange protocol used for all types of disaster alert and Internet-based disaster message distributions, the Emergency Data Exchange Language-distribution Element (EDXL-DE) [31], which is a container that supports the dissemination of other EDXL components, and Emergency Data Exchange Language-Resource Messaging (EDXL-RM) [32], which provides a comprehensive set of message formats for resource management across all areas of the emergency sector. Meanwhile, specific information modeling carriers include the Tsunami Warning Markup Language (TWML) [33], Cyclone Warning Markup Language (CWML) [34], and Earthquake Markup Language (EarthquakeML) [35], which use different disaster information encoded in varying formats to interpret various aspects of a disaster, such as the rapid dissemination of information to people in affected areas, the aggregation of warning information, and interoperability with geospatial systems. However, these specifications do not emphasize the importance of disaster observation information.
Scherp et al. [36] introduced the DOLCE + DnS Ultralite foundational ontology-based Event-Model-F (a formal model of events) that partially reflects disaster observation task information and comprehensively supports the representation of time and space, objects, and persons that are involved in a certain disaster observation. A TaskOntology model [26] with five aspects, namely task type, priority, constraints, model, and process, was introduced in 2012. However, this model was mainly designed for observation data processing-oriented applications and primarily aimed to support observation data-oriented geoprocessing instead of observation process-oriented sensor planning management. An SWE information model called Event Pattern Markup Language (EML) [37] describes the patterns and capabilities of disaster events. Although EML provides a general, flexible, and extensible framework for describing disaster events, this information model does not define the specific attributes for event description. By adopting EML as its standard formalization language, the Full Life Cycle Natural Disaster Event Meta-model (FLCNDEM) [28] develops nine aspects of disaster event attributes and supports disaster-phase-based observation information modeling. However, FLCNDEM cannot support fine-grained observation processes modeling, That is, FLCNDEM is a coarse-grained and four-phase-supported disaster information model that cannot be used for on-demand observation task process decomposition. In addition, this model does not consider the interconnections among various observation tasks.

1.3. Our Consideration

To efficiently describe a disaster observation task, the following features are considered in the proposed OTChain representation model:
(1)
Covering the information demands of the OTChain and its processes. Providing observation information for an incomplete observation scene or a segmented observation window is far from sufficient. The full life cycle of a disaster can only be understood with a dynamic-supported observation information description and process-oriented observation task decomposition support, both of which can also facilitate the effective implementation of disaster preparation and response initiatives. Therefore, the fine-grained and dynamic observation demands as well as the observation interconnection among multiple tasks must be considered in the OTChain representation model.
(2)
Supporting sensor observation planning. Finding out which sensors or sensor combinations can be used for disaster monitoring is important. Furthermore, knowledge regarding the observation mode for a certain measurement parameter and when to start the observation tasks is even more important. Therefore, the proposed OTChain representation model must be used as an information model for sensor observation planning.
Table 1 summarizes the above-mentioned disaster observation task models (Section 1.2) to support the features of the proposed OTChain representation model. We believe that those models described in Section 1.2 do not fully satisfy the observation requirements for accurately expressing process-owned observation tasks and for efficiently planning EO sensors.
Di [38] argued that the metadata about the sensors, platforms, observation data, and observation tasks are critical aspects of Sensor Web infrastructures. The author further noted that “…availability of metadata for the Sensor Web can be very useful in discovery of the right sensor at right time and location with the right quality, and to achieve sensor interoperation...” To satisfy such a requirement, our previous research has successively developed meta-models for sensor sharing [39], observation capability representation [40], and heterogeneous sensor web node management [41]. Therefore, this paper supplements a meta-model-based OTChain representation for disaster process-oriented remote-sensing satellite sensor planning. Section 2 explains the OTChain meta-modeling framework, the concrete metadata contents, and their formalization. Section 3 describes the processes and results of an experiment that is conducted by applying the OTChain representation model in a flood remote sensing water monitoring scenario. Section 4 discusses the versatility, extensibility, and advantages of the OTChain representation model. Section 5 concludes the paper and presents directions for future research.

2. OTChain Representation Model

2.1. Basic Representation Requirements

The International Directory Network of CEOS, an international provider of Earth Science data, recommends that five aspects [38], including a standard syntax for sensor description, sensor geolocation for dynamic tasking, the applicability of sensor observations, sensor quality, and accessibility, must be considered when representing sensors to guarantee effective sharing and interoperability. Although this work takes the observation task rather than the sensors as its starting point, the abovementioned recommendation for formulating the sensor metadata enlightens us. In this case, the proposed OTChain representation model considers the following aspects:
  • Constraints: Identifying the constraints of the observation task and the corresponding geo-environments to help sensor planners determine the usefulness of sensors;
  • Interconnections: Defining the correlations among different atom observation tasks to form an observation task group with the associated relations;
  • Formalization: Supporting machine-to-machine interfaces to facilitate standard exchanges in the unified OTChain description framework;
  • Extensibility: Allowing an extension to satisfy the high requirements of individual communities because an appropriate representation is always purpose-dependent.

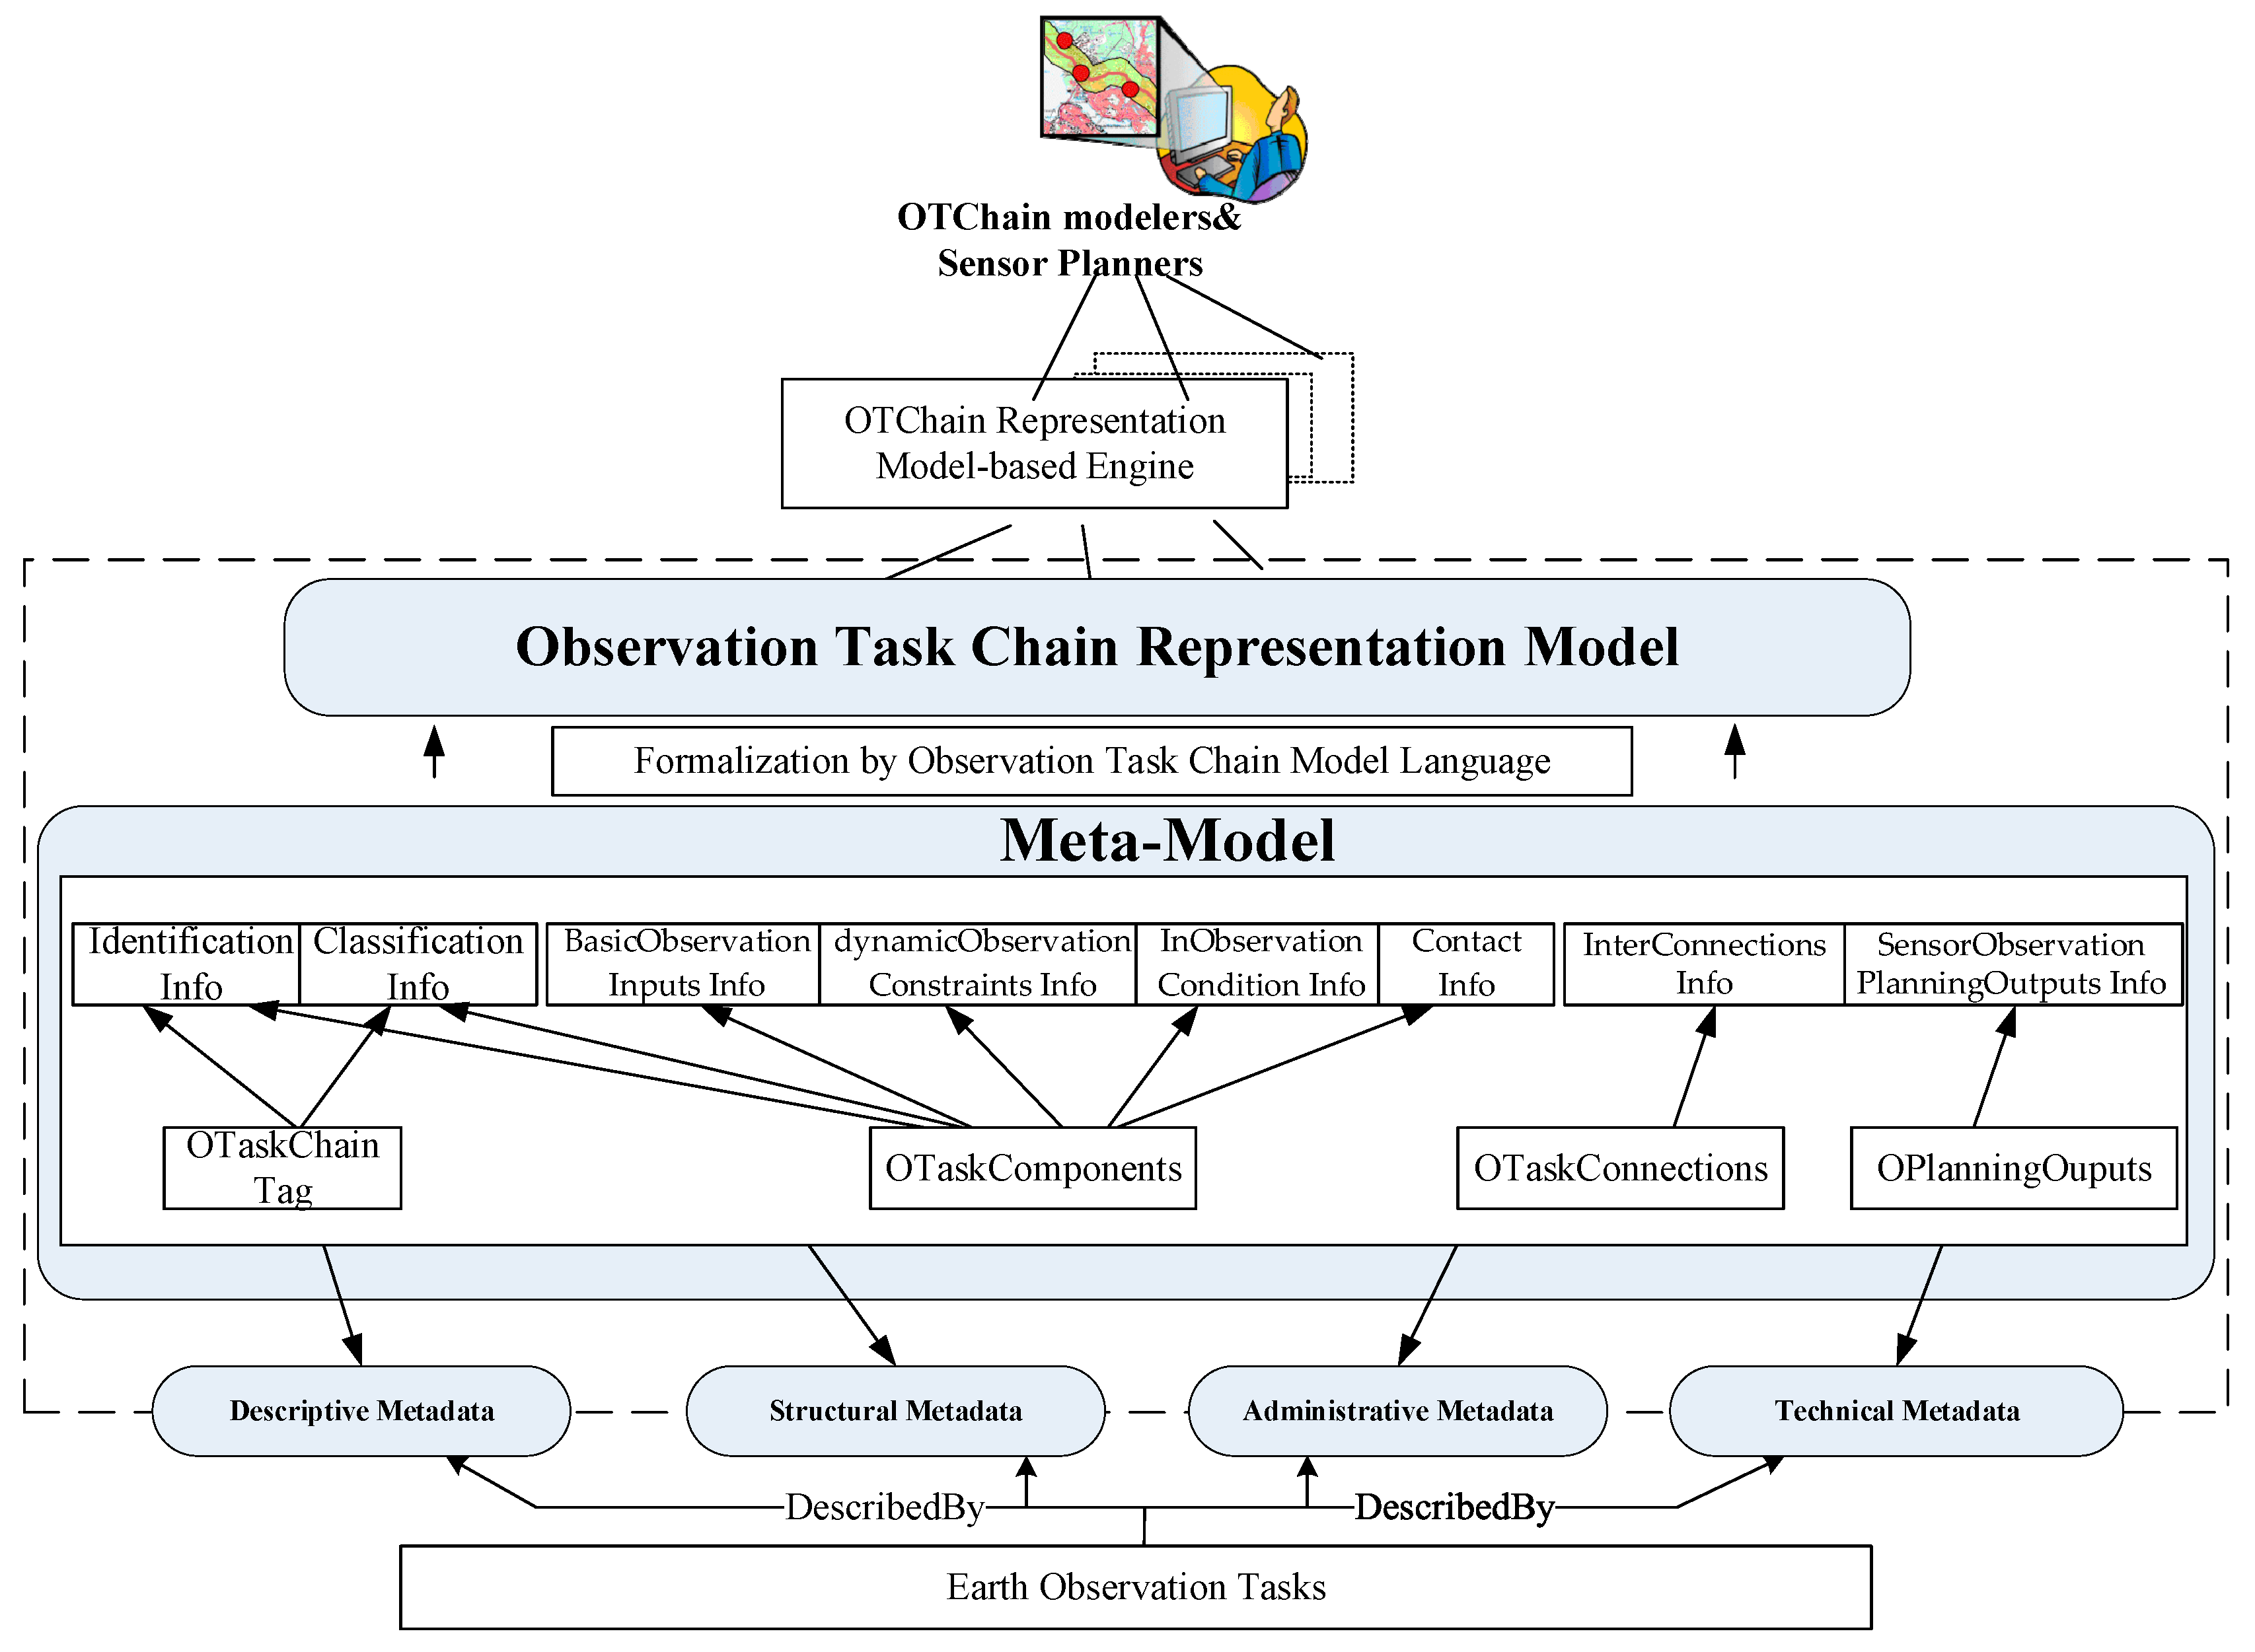
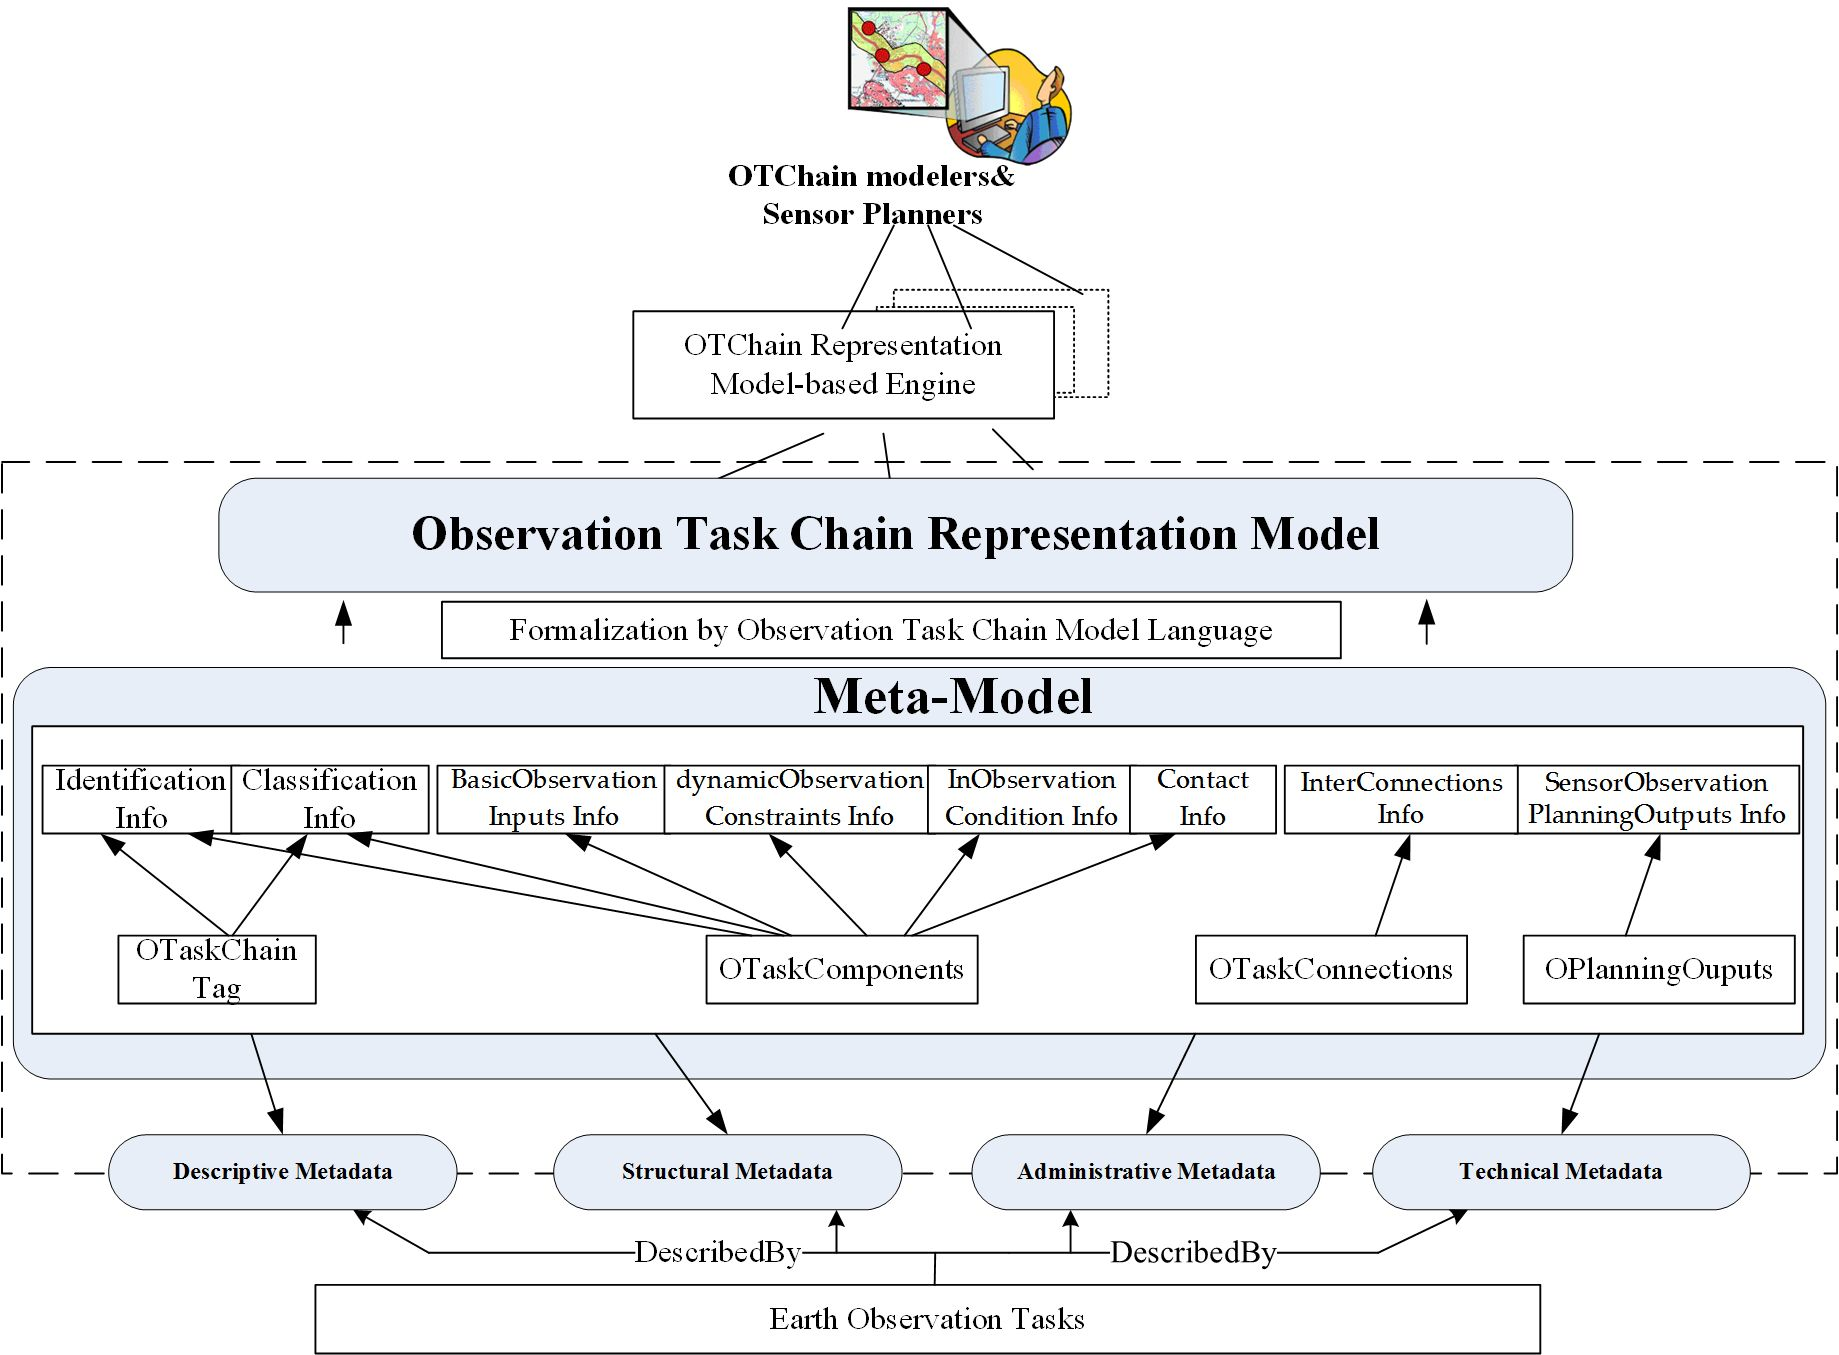
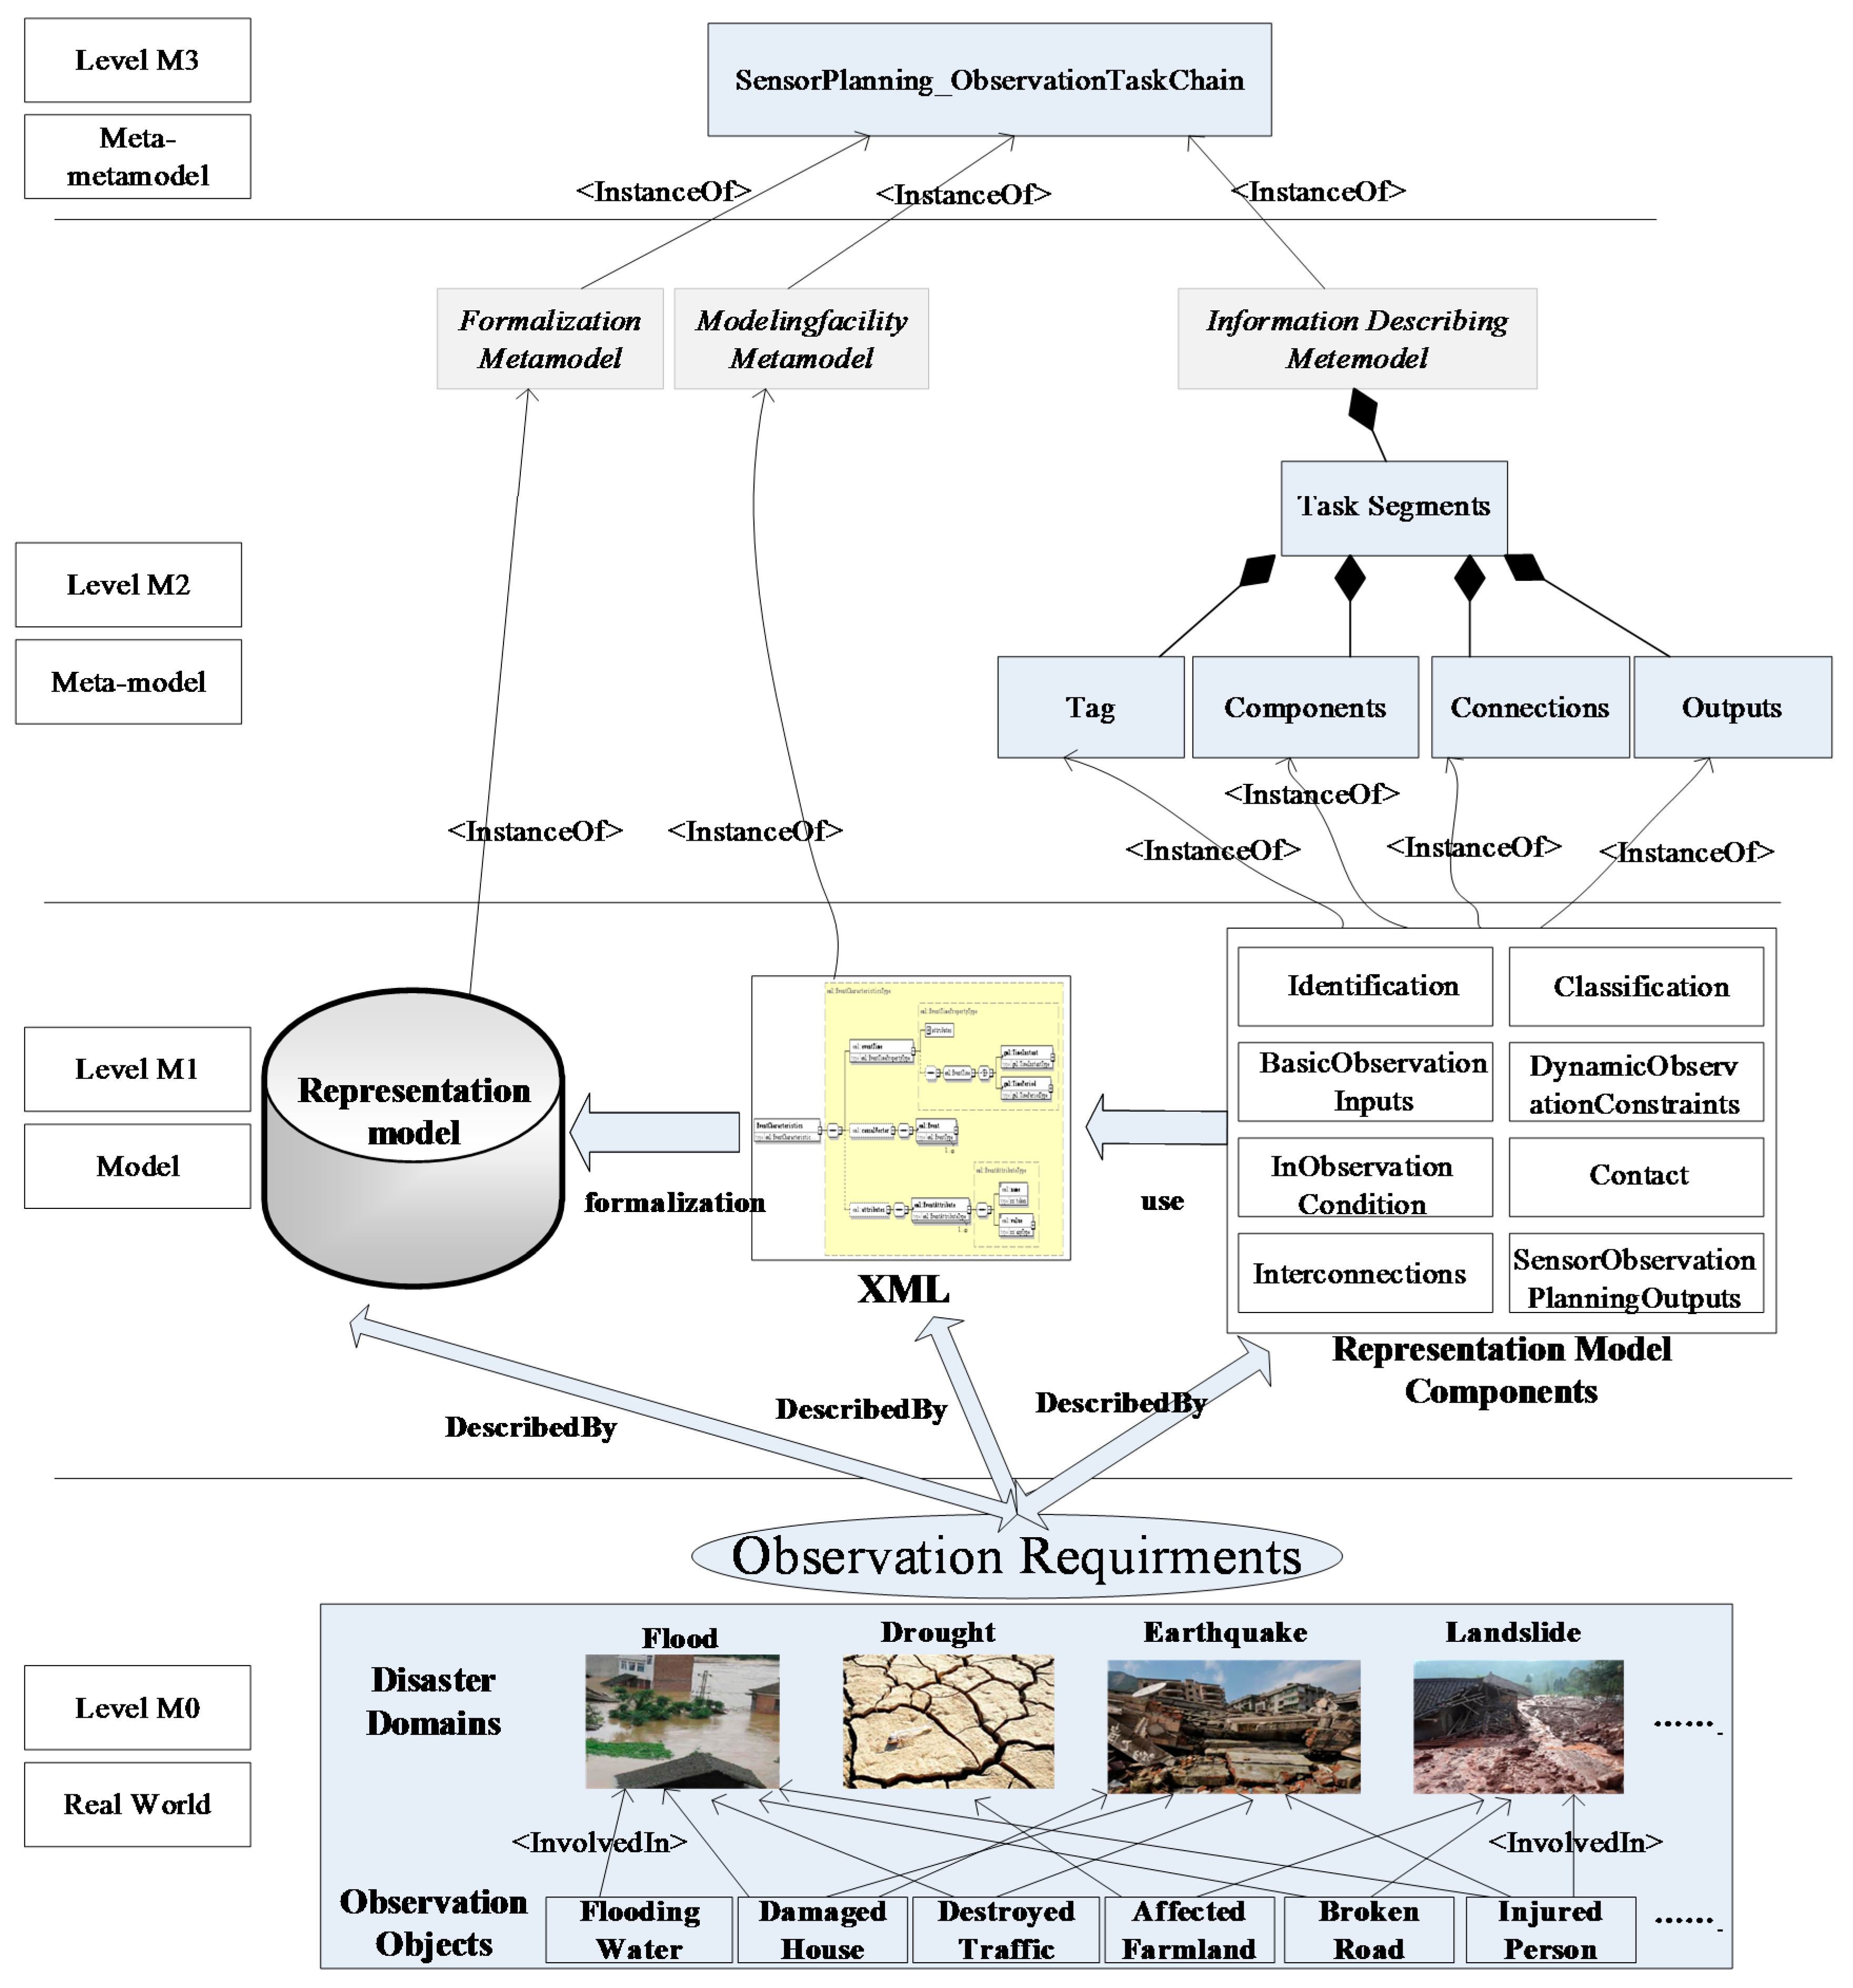
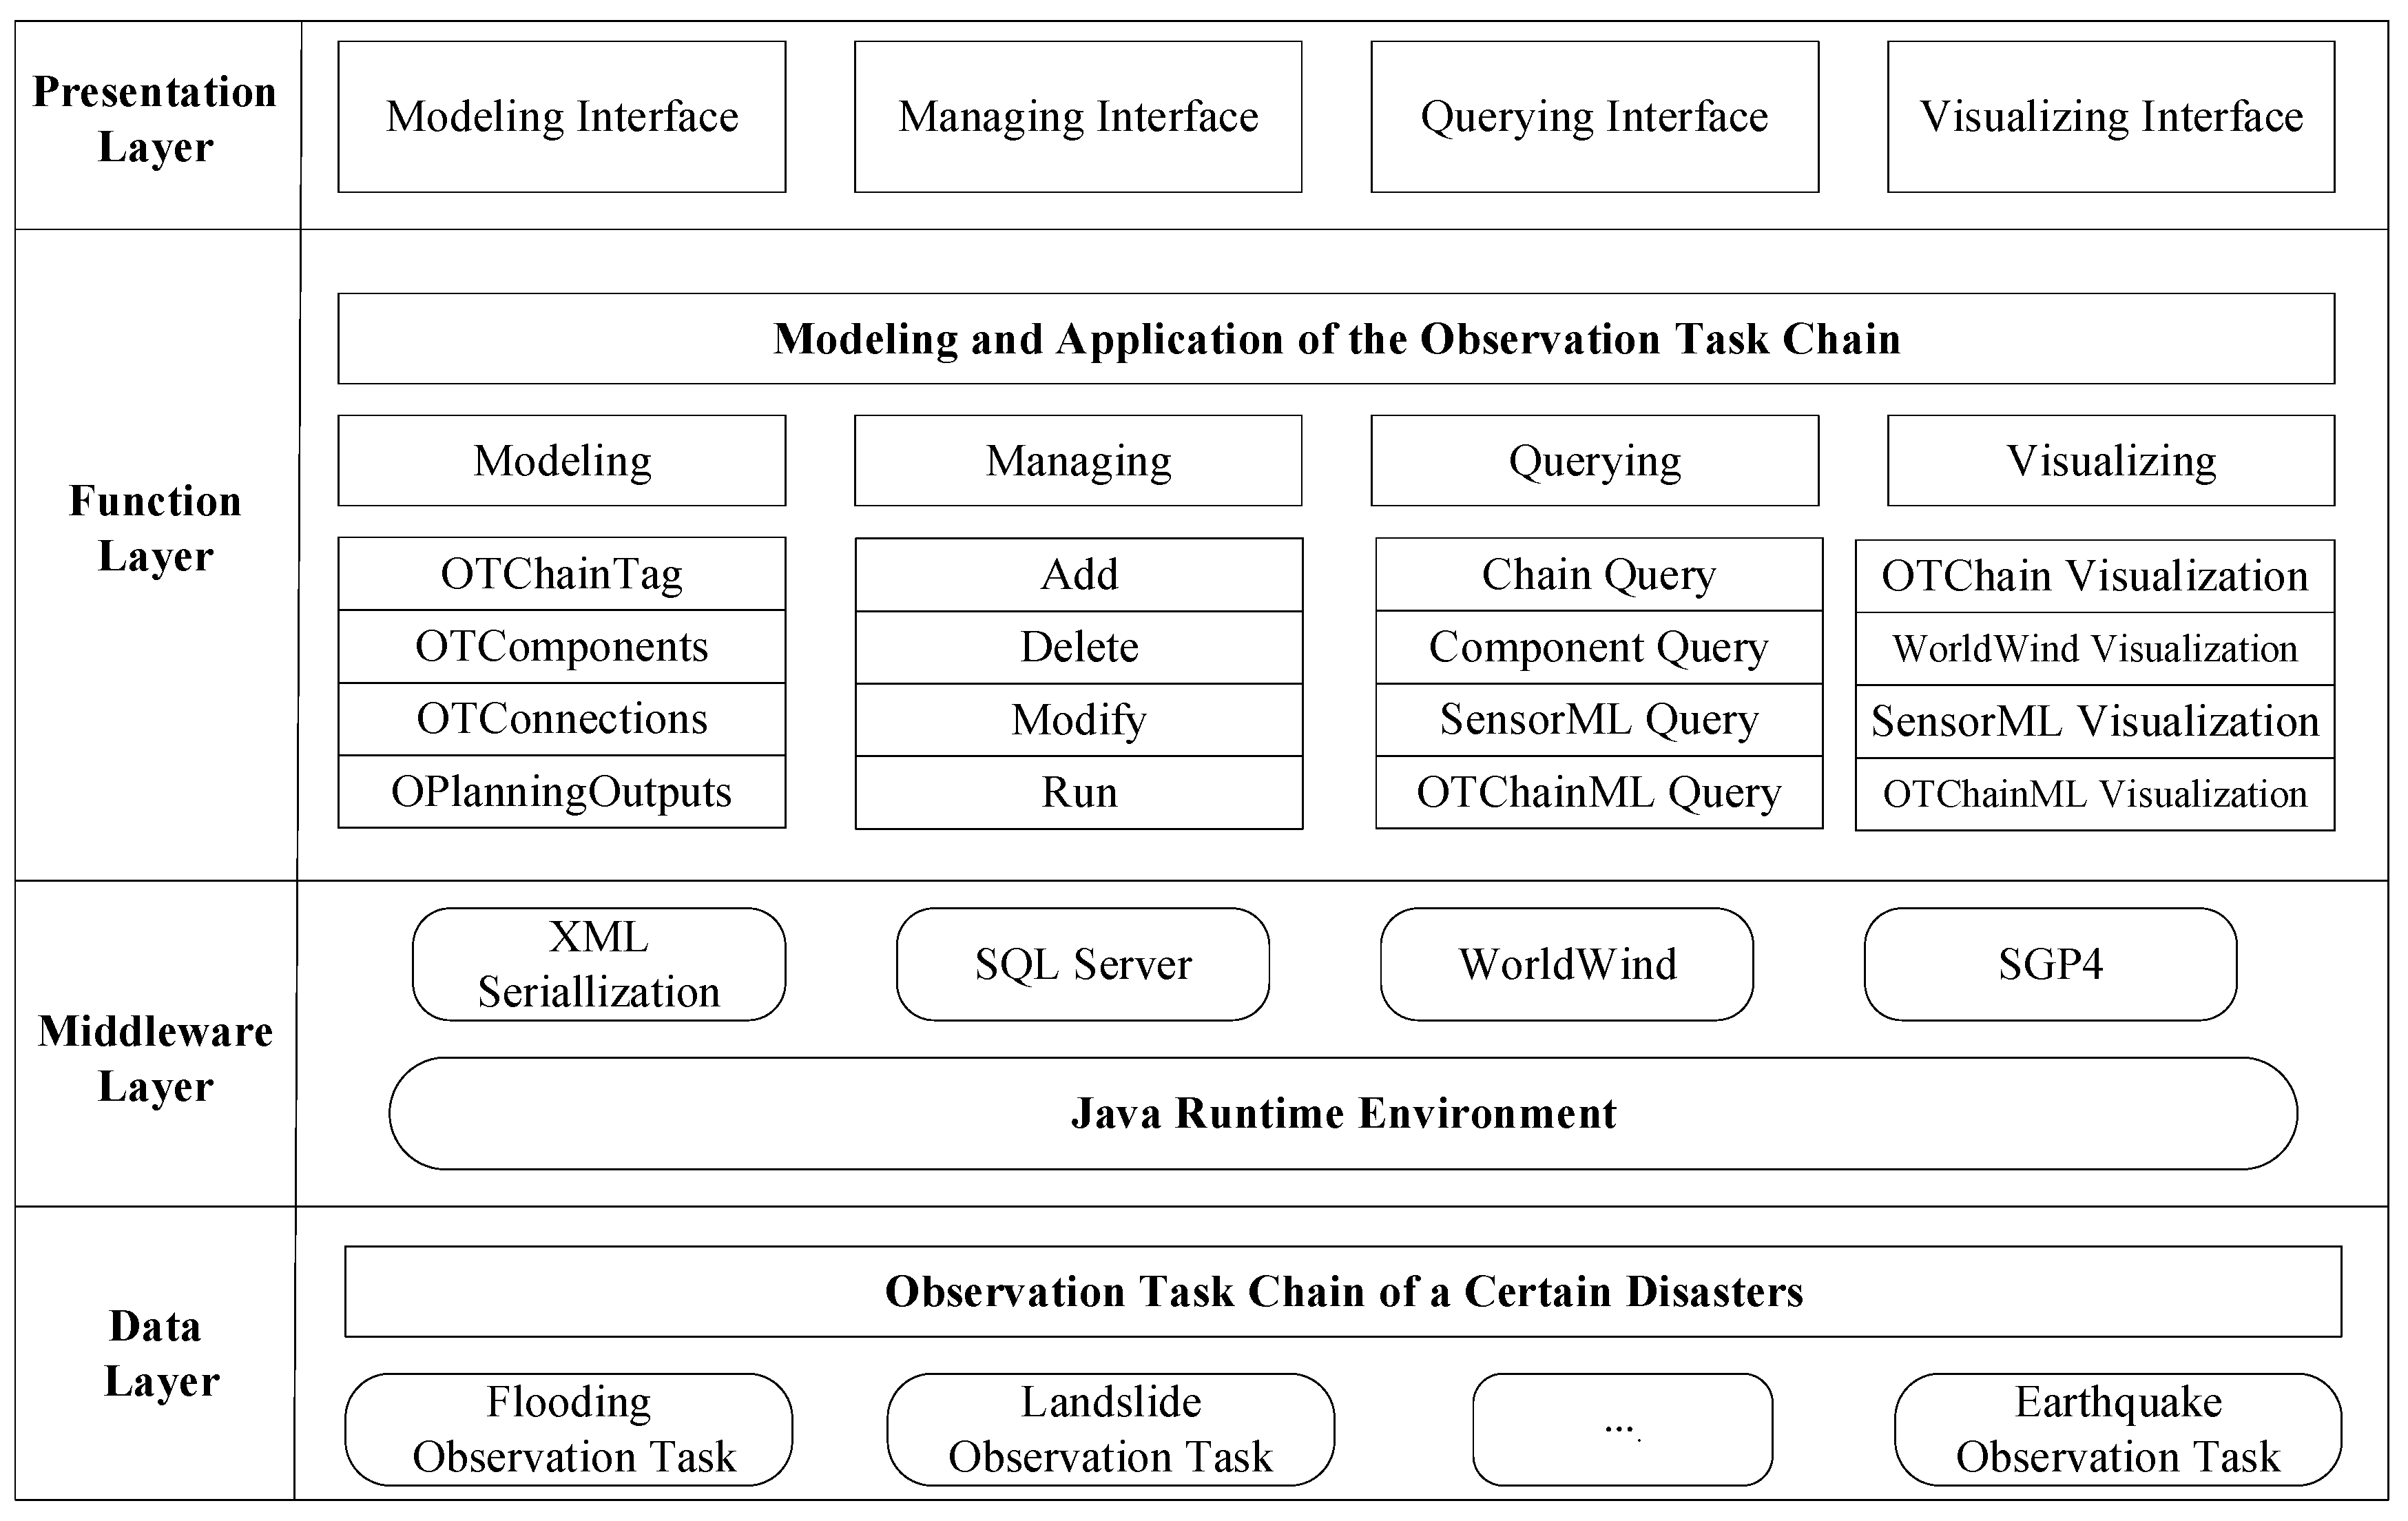
2.2. OTChain Meta-Modeling Framework

A meta-model is a simplified version of the actual model of a sensor, system, or software-like entity [42]. The meta-model framework must cover the analysis, rules, constraints, processes, construction, and development of a model. The meta-object facility (MOF) proposed by the object management group [43] is released as a meta–meta-model for constructing models and meta-models. MOF has a four-level hierarchy [44] that determines the meta-modeling concepts and their relationships, which are required for interpreting any model. This four-level hierarchy can greatly help in the abstraction of model information.
Figure 1 shows the OTChain meta-modeling architecture. Based on the meta-layers of the MOF, this architecture also comprises four levels, with each level serving as an instance of the preceding level. The M0 level includes observation tasks from the real world, such as disaster domains and observation objects. The M1 level is a model layer that includes the observation task information description model, the XML modeling language, and the OTChain representation model. The M2 level is the meta-model layer that includes formalization, a modeling facility, and information description. The topmost M3 level is the meta–meta-model layer that defines the involved OTChain metamodeling elements, such as the related concepts, packages, and relationships.

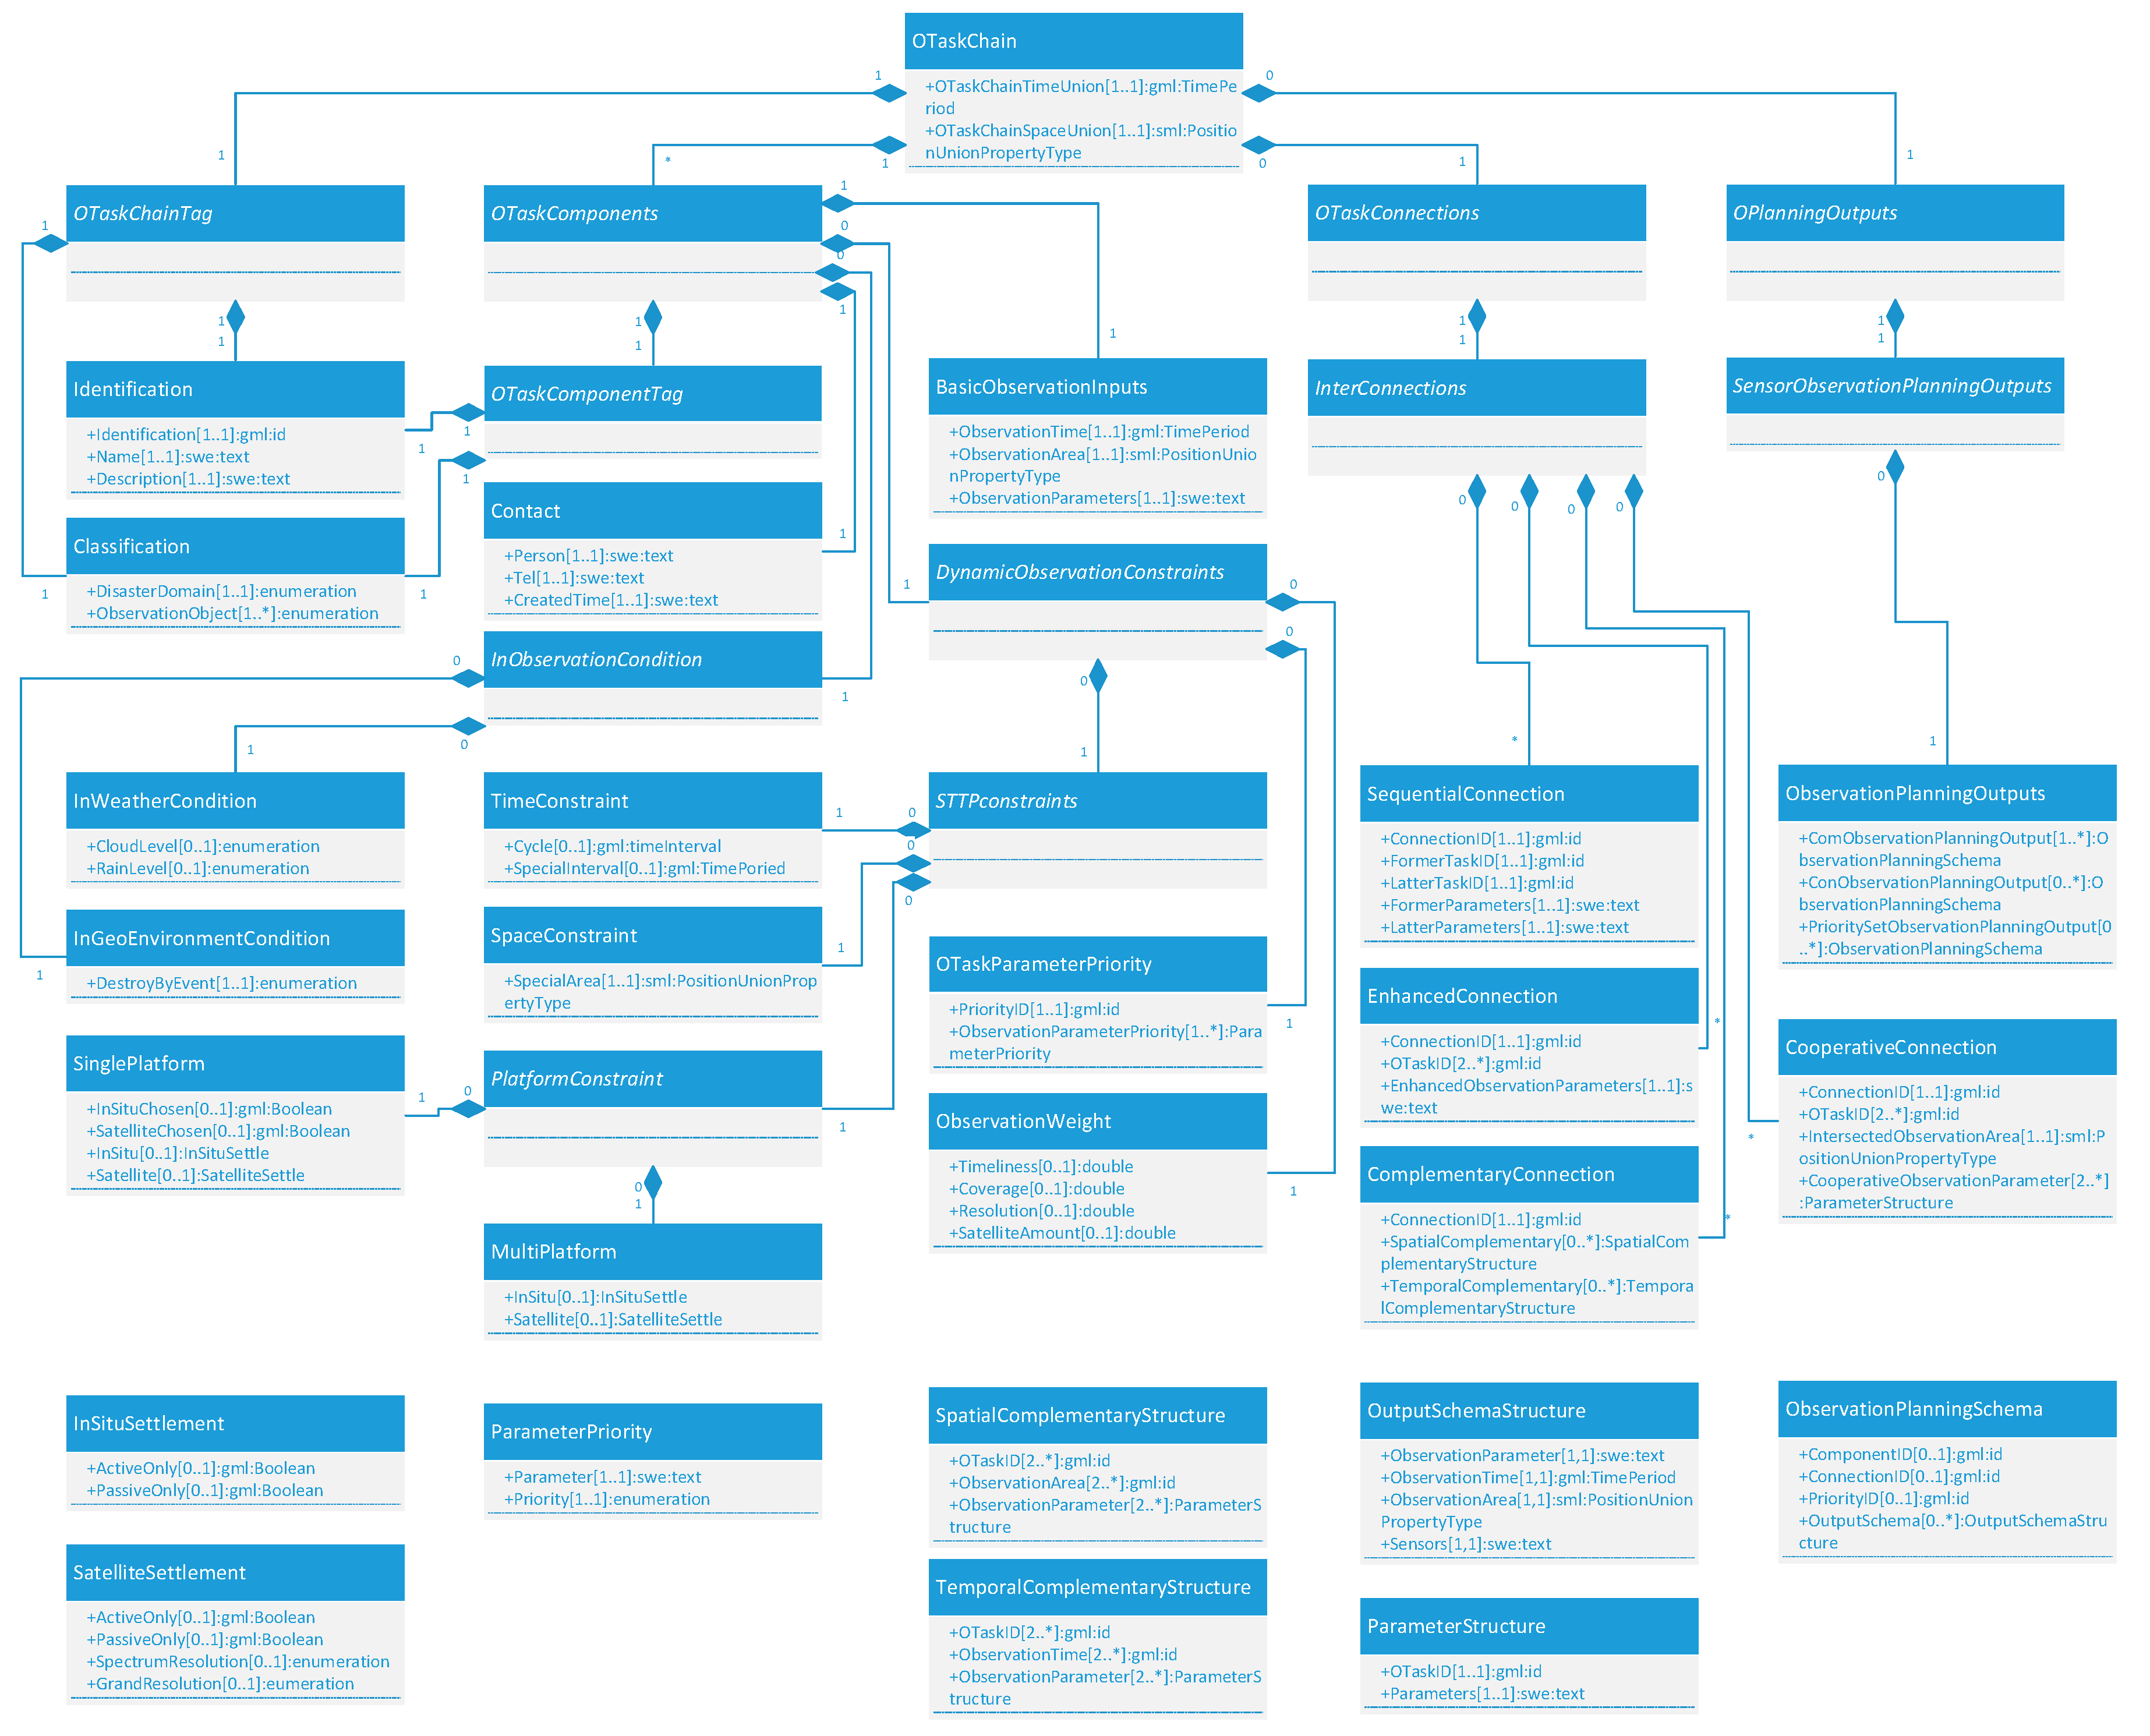
2.3. Contents of the OTChain Representation Model
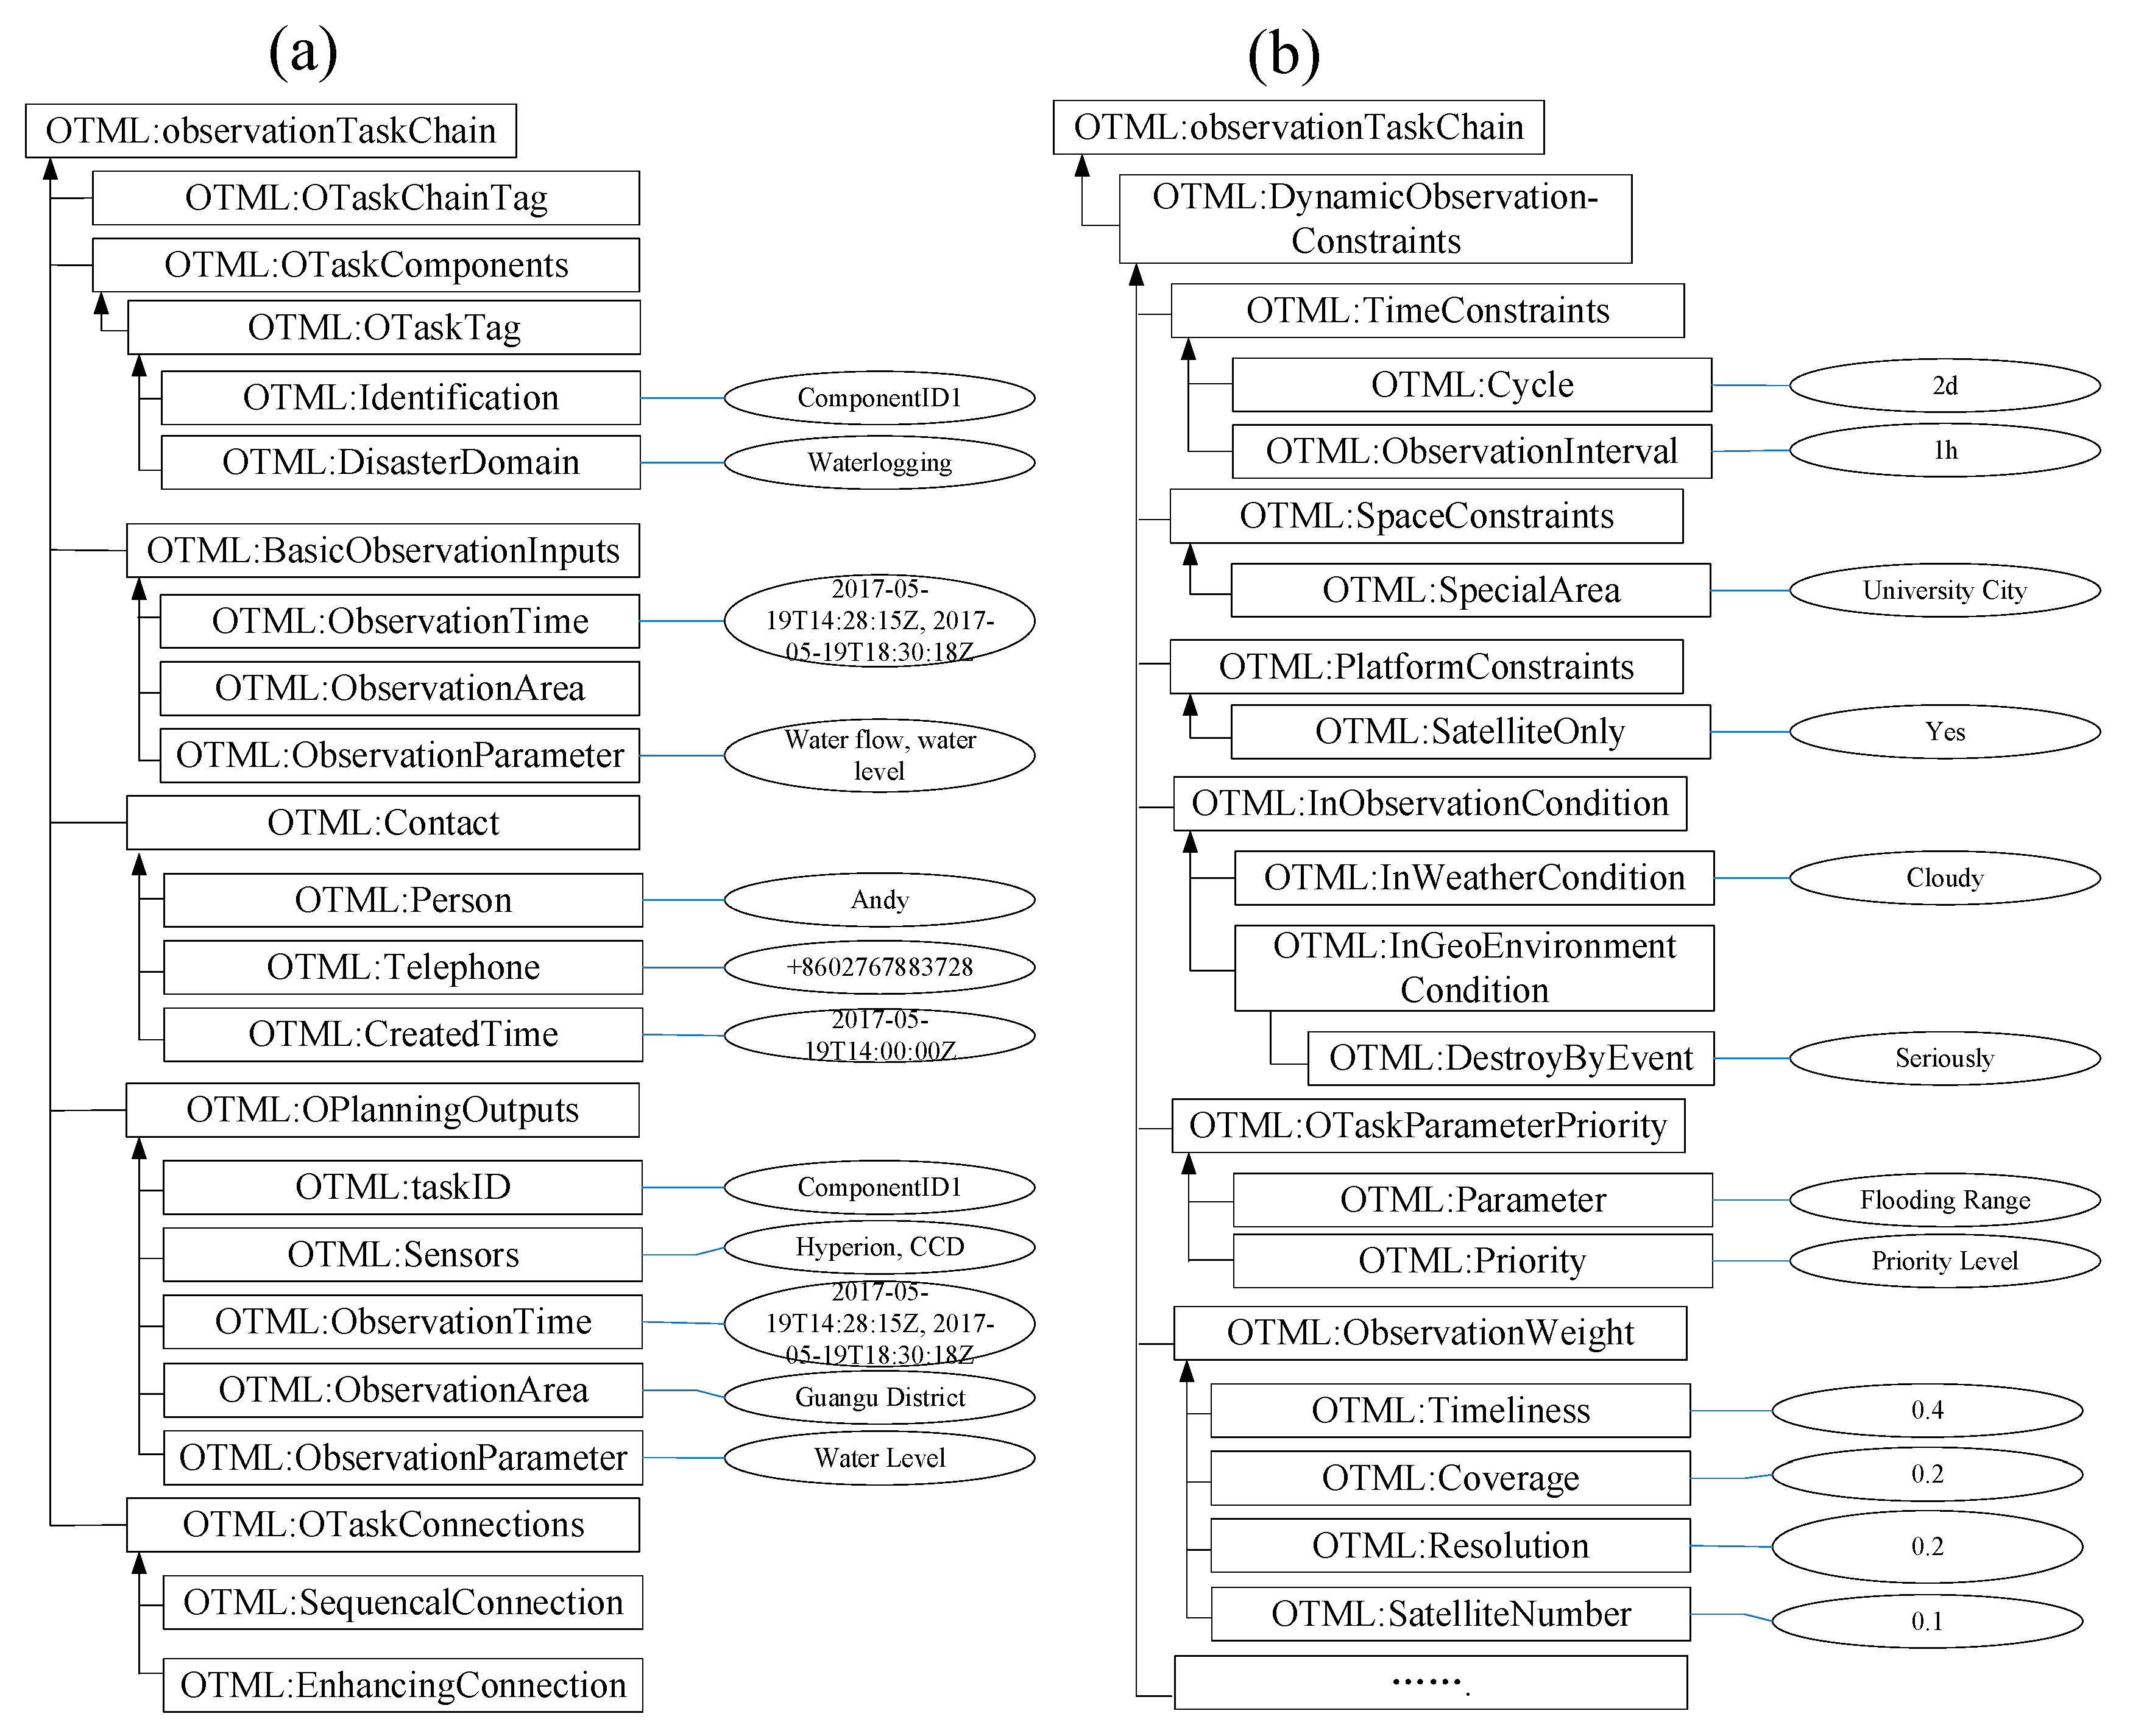
This work aims to provide a functional OTChain representation model that can act as an “intermediary broker” between observation tasks and remote-sensing satellite sensors. Based on the observation requirements of OTChain, the sensor planners can systematically plan the available sensors and observations by using an OTChain-model-based engine.
As shown in Figure 2, OTChain information can be described by descriptive, structural, administrative, or technical metadata [39]. These four basic segments epitomize the common OTChain attributes that constitute an extensive OTChain information model, including OTChainTag, OTaskCompents, OTConnections, and OPlanningOutputs. OTChainTag includes OTChain identification and classification information that serves as the basic information for OTChain representation. OTaskCompents includes a series of sub-observation tasks that have complete and unique observation needs. Certain sub-observation tasks can be interconnected as a sub-observation task group instead of viewed as mutually isolated tasks. OTConnections conveys possible interconnections, while OPlanningOutputs expresses the sensor observation solutions because each observation task must produce a sensor observation planning result.
Each segment contains its own information. In this case, each OTChain segment must be formalized by using eight-tuple metadata components that are expressed as MD = {Identification, Classification, BasicObservationInputs, DynamicObservationConstraints, InObservationCondition, Contact, InterConnections, SensorObservationPlanningOutputs}. The eight-tuple metadata components of OTChain include the following:
(1)
Identification, which includes the observation task name, ID, and description.
(2)
Classification, which includes the disaster domains of the described observation tasks (i.e., typhoons, floods, earthquakes, and droughts) and their involved observation objects (i.e., flooding, damaged house, destroyed traffic, affected farmland, and broken road).
(3)
BasicObservationInputs, which includes the basic observation requirements in the time, space, and theme dimensions that describe the essential observation information of an observation task.
(4)
DynamicObservationConstraints, which includes advanced and personalized observational constraints, such as observation cycle and interval, key observation area, specified platform, observation priority, and observation weight. These constraints are used to further describe the time, space, and theme of the observation task, thus forming a complex observation task with dynamic observation constraints.
(5)
InObservationCondition, which includes the weather condition and the geographical environment damage level at the time when the observation task is dispatched.
(6)
Contact, which includes the name and telephone number of the person who creates the observation task as well as the time of its creation.
(7)
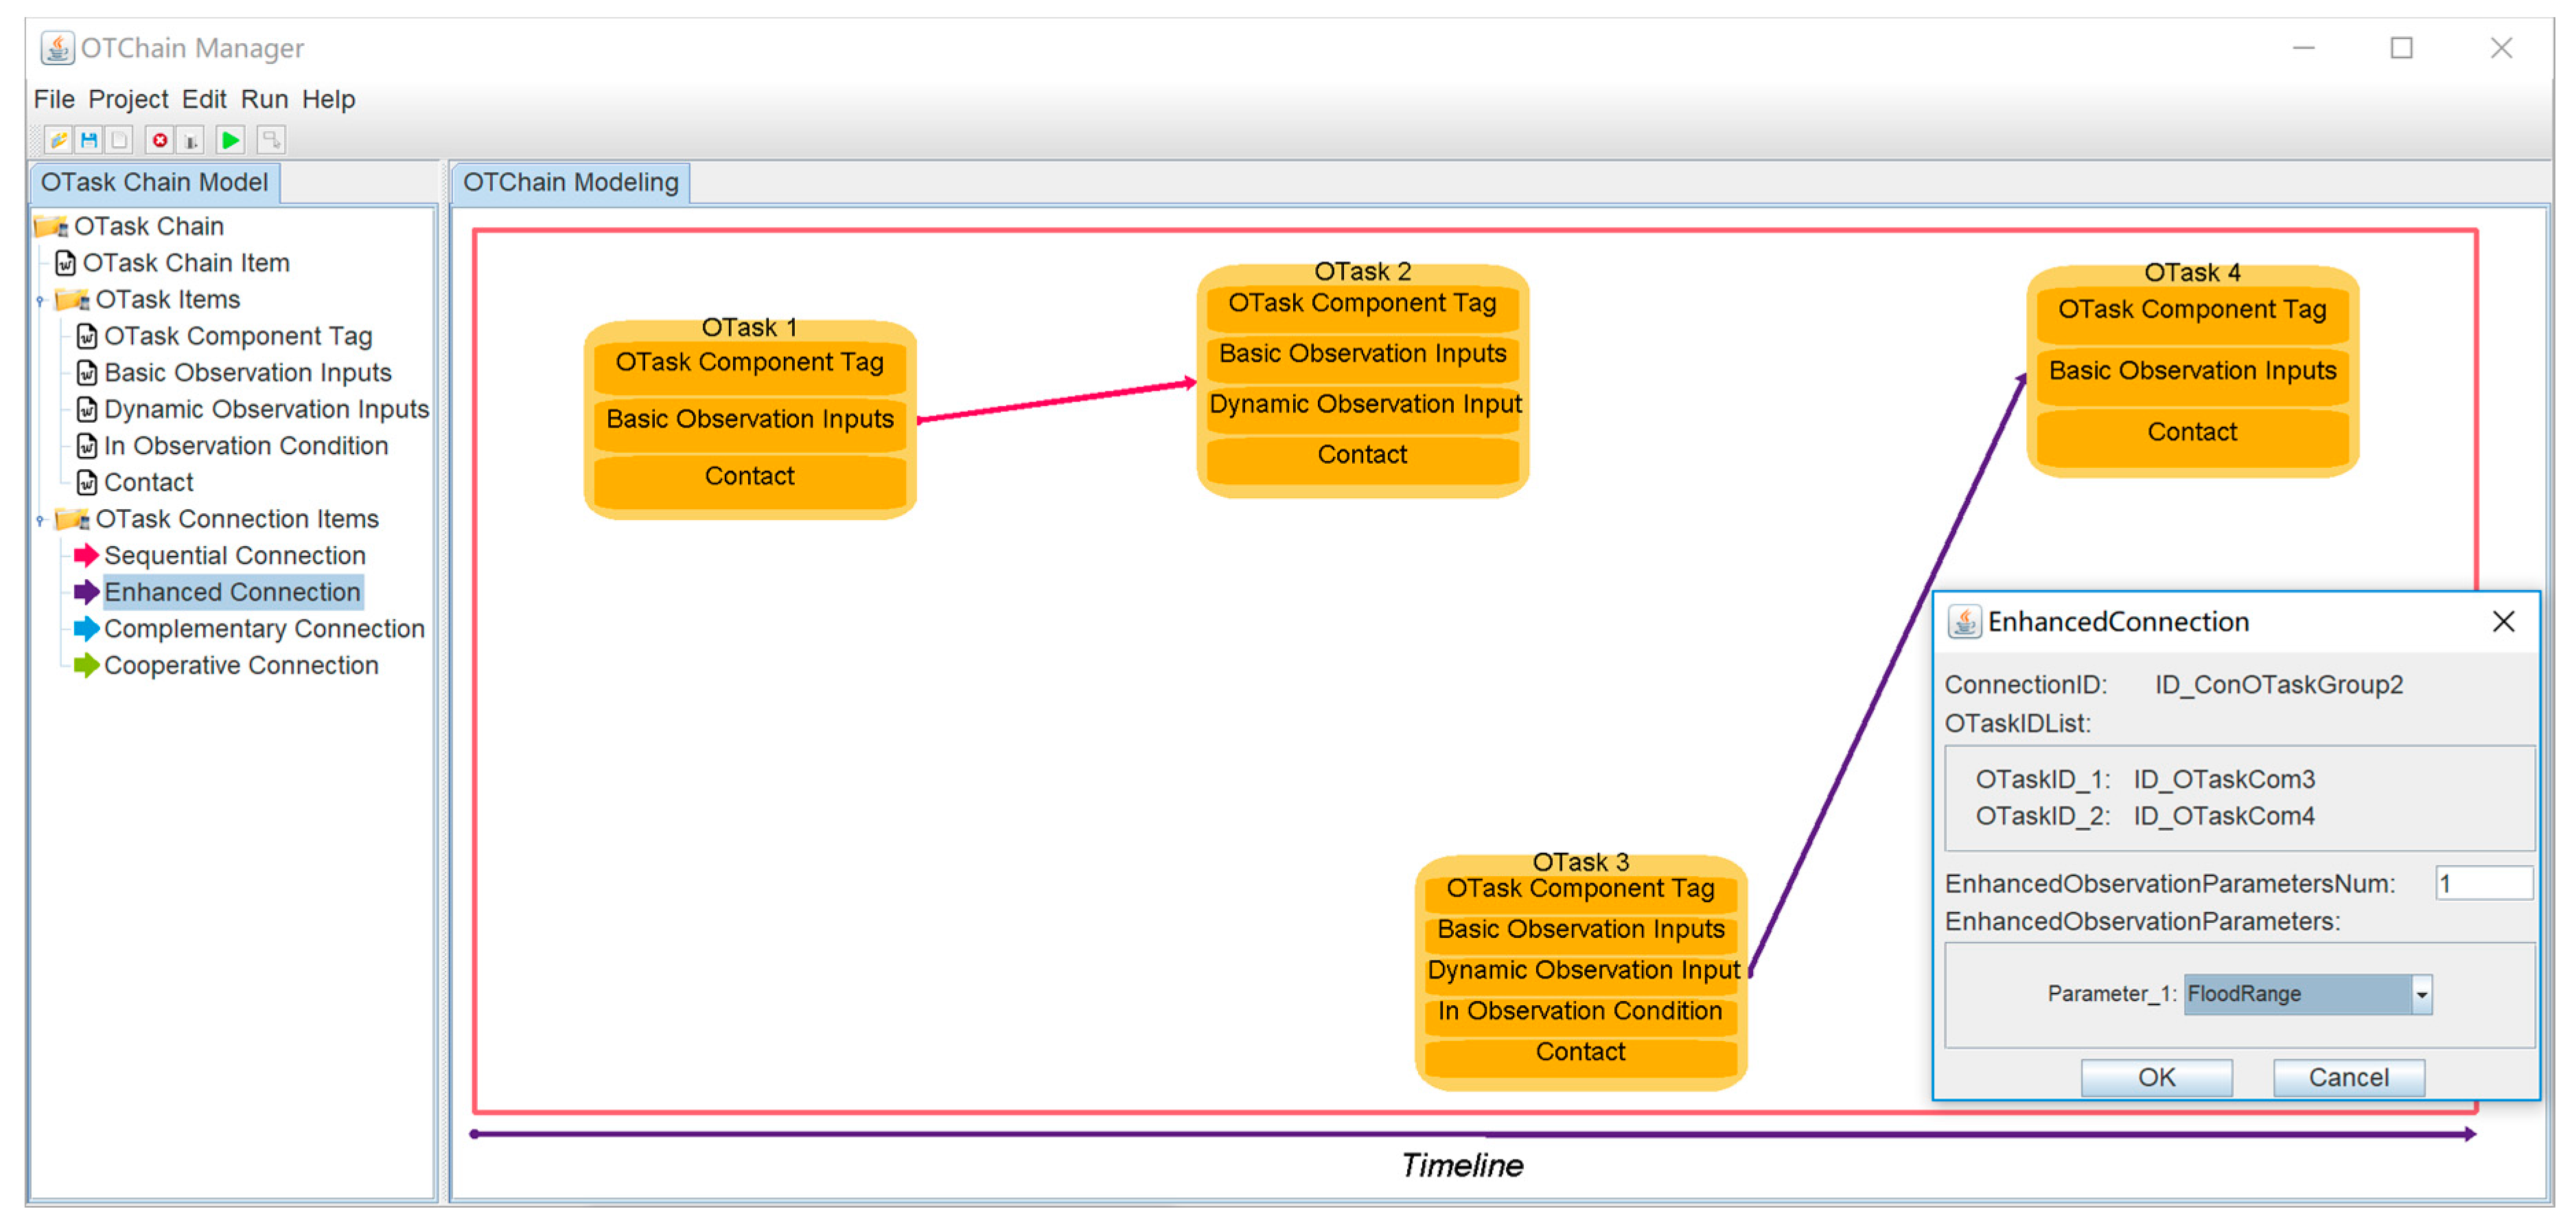
InterConnections, which includes sequential, complementary, enhanced, and cooperative connections. A sequential connection describes the observation parameters of two observation tasks that are observed in a time sequence. A complementary connection describes two or more observation tasks that complement each other in either the time or space dimension to extensively reflect another observation scene. An enhanced connection describes two or more observation tasks in the same observation area that can be grouped together to create an environment parameter with a time-intensive observation. A cooperative connection describes two or more observation tasks in the same observation area and in a similar observation time that can be grouped together to reflect a comprehensive observation topic. These interconnections can express the association among sub-observation tasks.
(8)
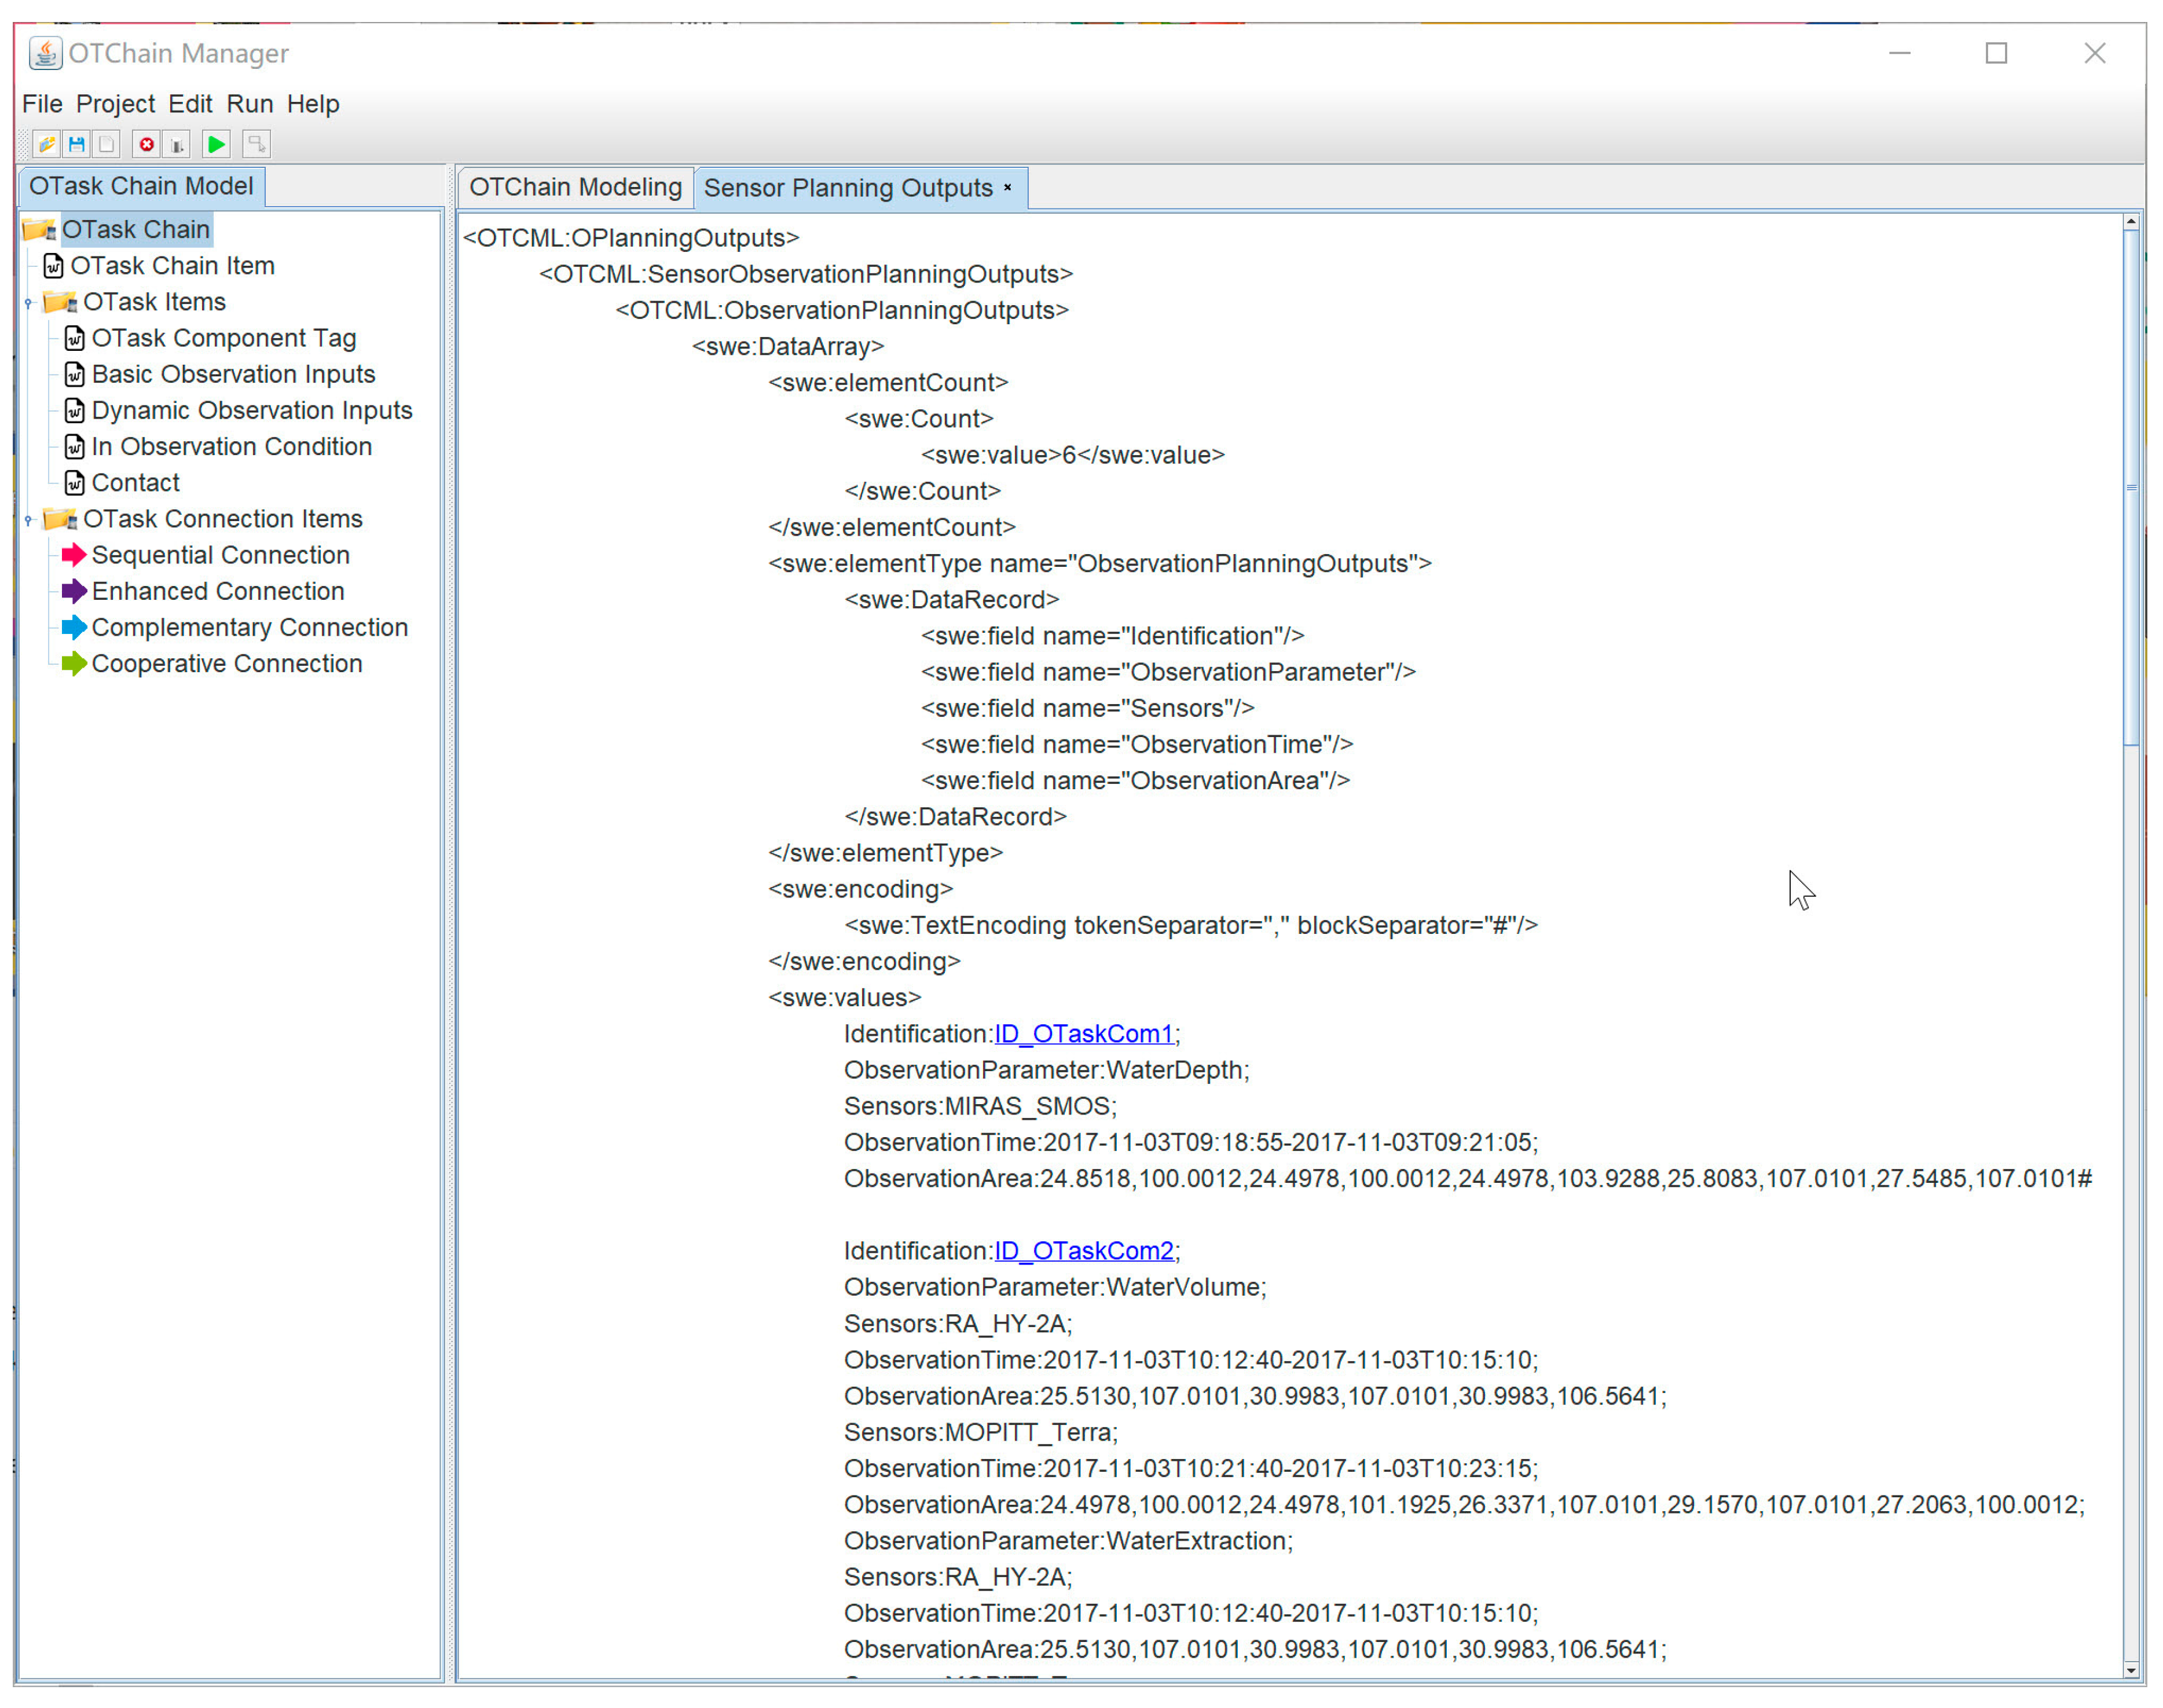
SensorObservationPlanningOutputs, which includes the sensor observation planning solutions for each sub-observation task component, interconnected observation task group, and observation task set with priority. These solutions help sensor planners or OTChain modelers generate sensor selection programs by answering the questions “What group of sensors?” and “Which sensor with what mode is to be combined with other sensors for what measurement parameters, and when do they start?”

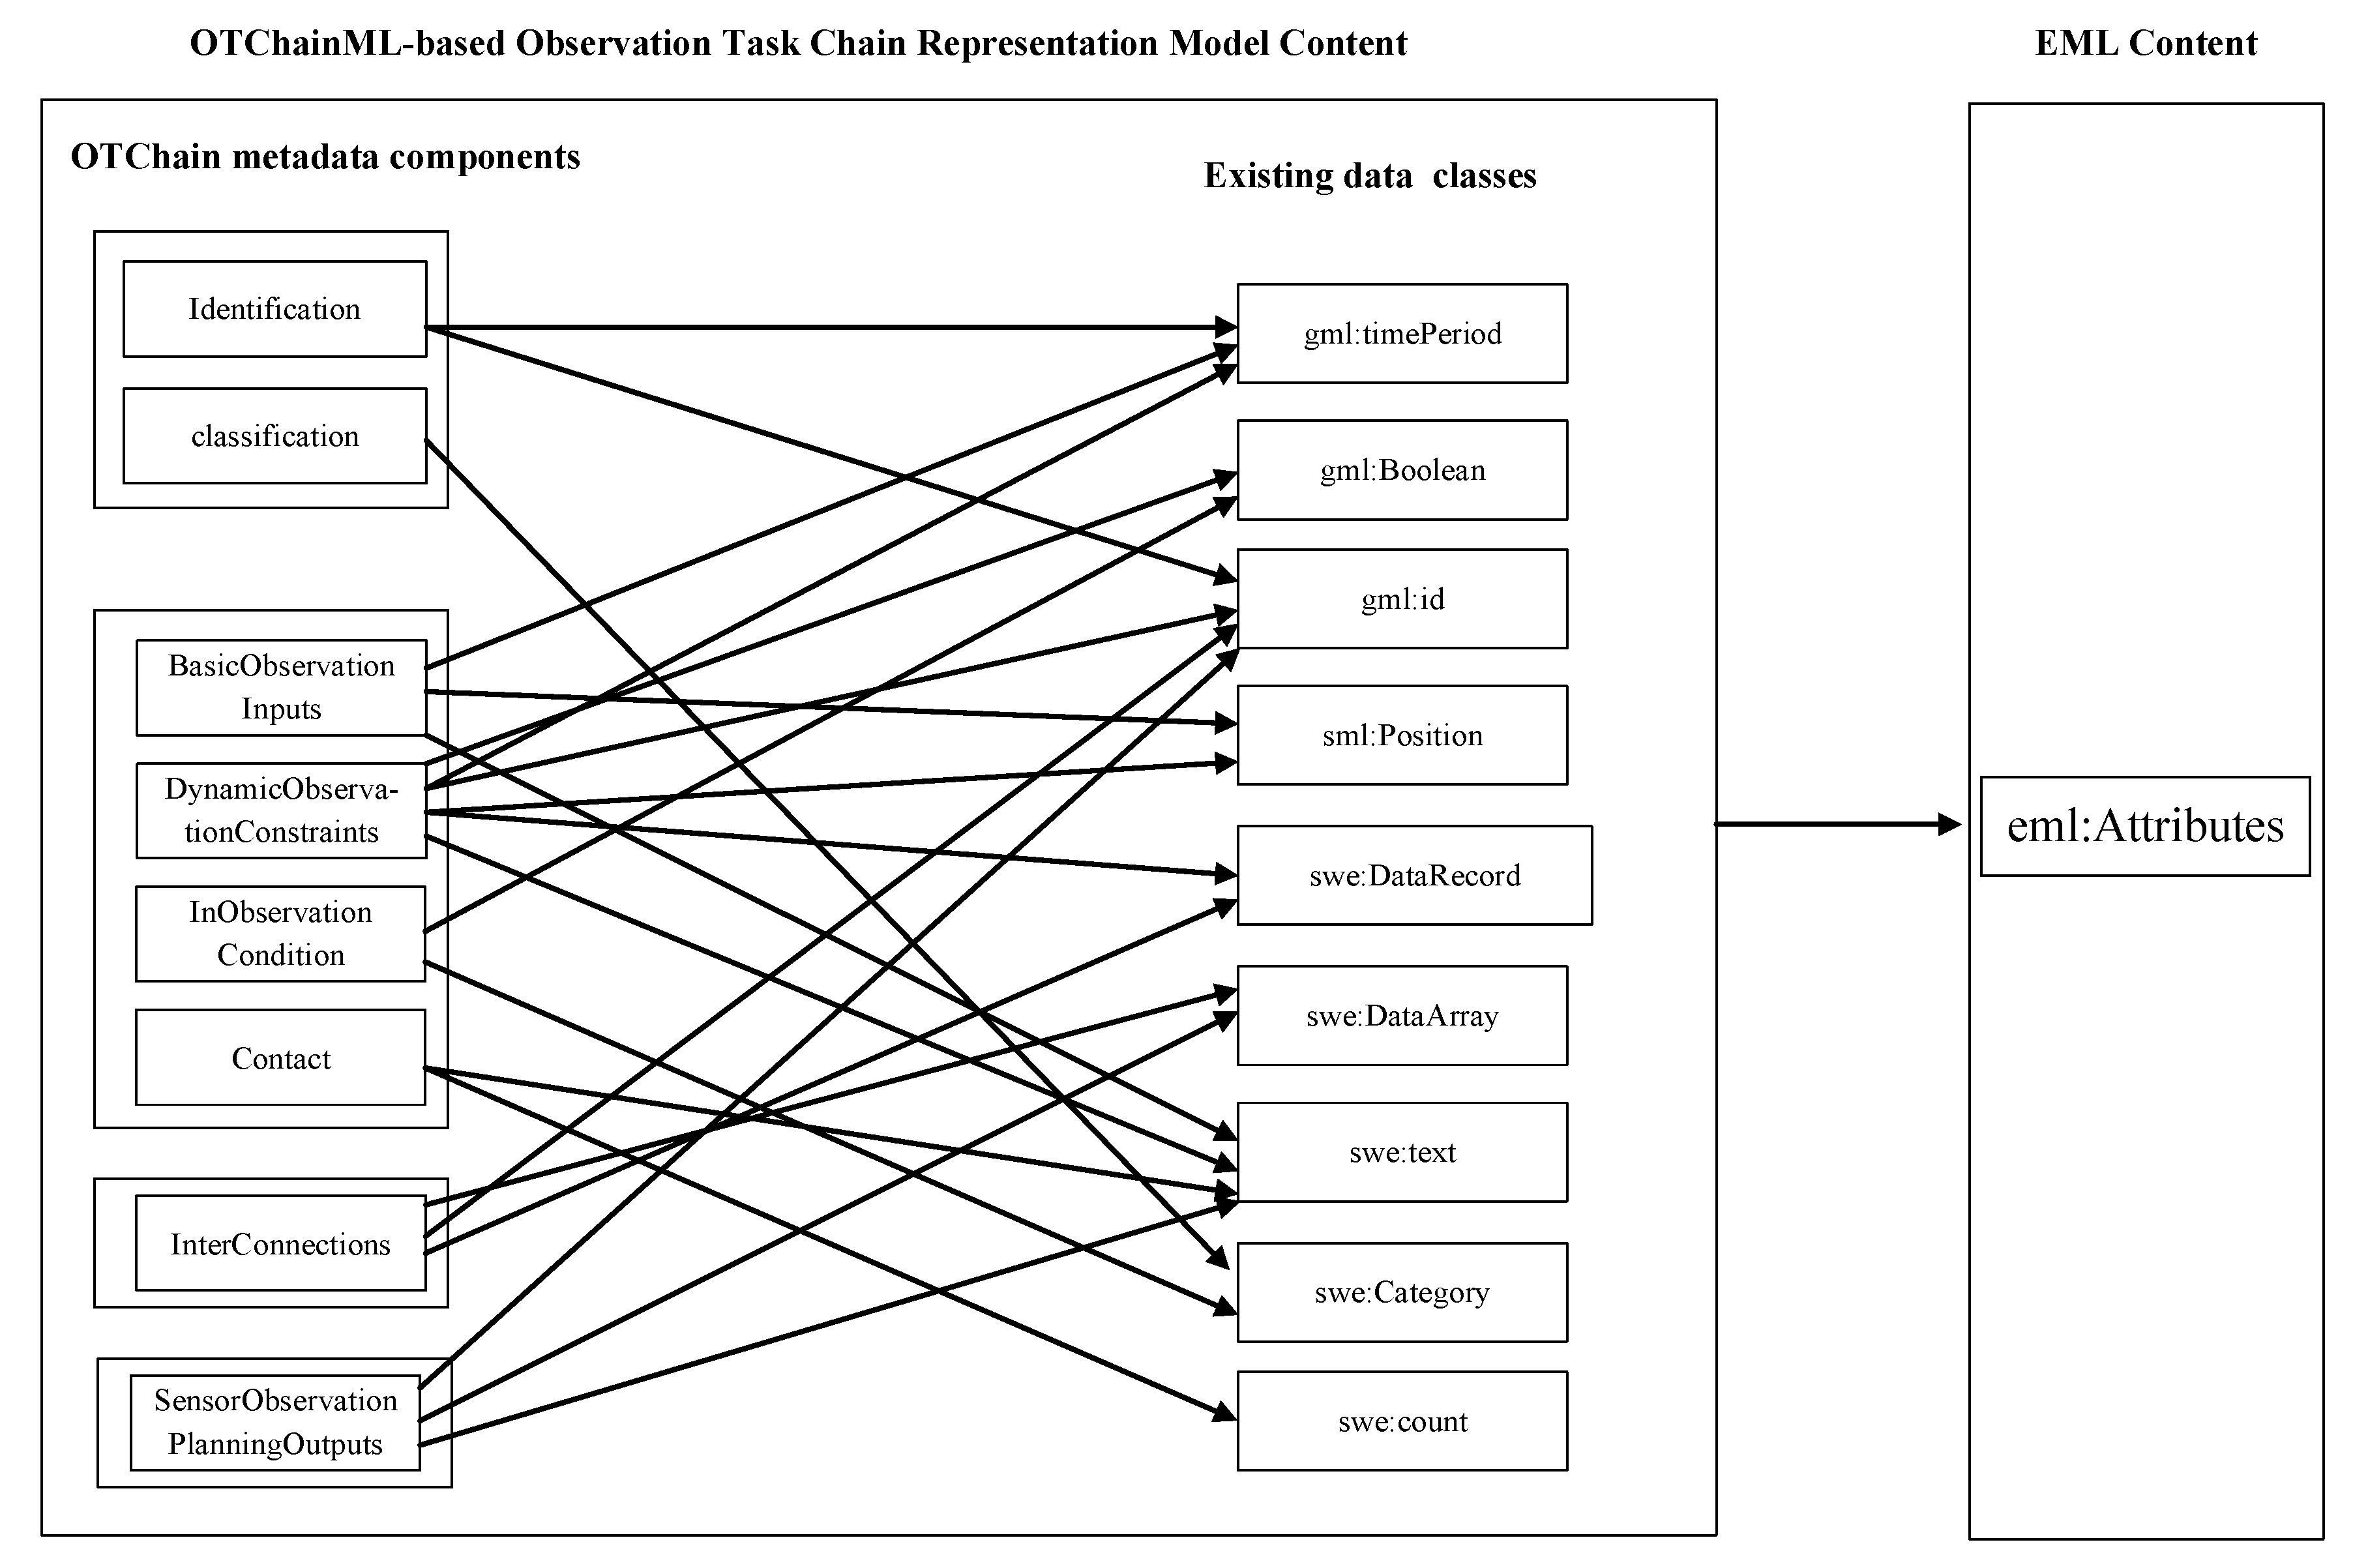
2.4. Formalization of the OTChain Representation Model

This section aims to transform the OTChain meta-model into a formal expression. The solutions offered in this research avoid the recreation of a bottom data class wherever possible. However, some existing standards, such as the Geography Markup Language (GML), the SWE common data model, SensorML, and EML, have been reused. GML [45] is an information exchange and storage format for describing and validating geographic objects. The typical data classes, such as gml:id, gml:timeInstance, and gml:timePeriod, are included in GML. The SWE common data model [46] defines low-level data classes for exchanging sensor and sensor-derived observation data, such as swe:DataRecord, swe:DataArray, swe:Count, and swe:Text. SensorML follows a clear hierarchy in formalizing sensor information. In addition to adopting the SWE common data model as the basic data model, the new SensorML version (SensorML 2.0) [20] designs sml:Position to denote various types of positions, such as the static location point, static location area, and dynamic trajectory. Based on the above analysis, we can use the existing data classes to develop an OTChain model language (OTChainML) that can be used for formalizing the eight-tuple metadata components of the proposed OTChain representation model (Figure 3). The specific attributes for event description have not been defined in EML. Thus, given the extensibility and reusability of the EML specification, the formalized OTChain representation model can be completely embedded in the EML attribute data structure (eml:Attributes) as a concrete description about the observation requirements of a given disaster.
Based on the information description structure of the eight-tuple OTChain, the common metadata features, including their data types and constraint conditions, are defined in the Unified Modeling Language (UML) diagram as shown in Figure 4. The corresponding schema of OTChainML can be found in http://bigdatasensing.cn/OTChain/OTChainML.xsd.

3. Experiment

3.1. Hydrological Analysis of Flood Remote-Sensing Observations in Jingsha River Basin

Located in the upper reaches of the Yangtze River, the Jinsha River Basin (JRB) has an annual precipitation that ranges from 1600 mm to 2000 mm and a drainage area of 473,000 km2, which accounts for approximately 26% of the total drainage area of the Yangtze River Basin [47]. The JRB is divided into upper, middle, and lower sections. The lower section, which covers the new town in Pingshan County to the Min River Estuary in Yibin City, Sichuan Province, has a total length of 782 km, a basin area of 135,473 km2, and a basin drop of approximately 719 m. The upper and lower sections of the JRB have high and low elevations, respectively, thereby creating a ladder-level distribution. The runoff from the JRB is flushed from the upper section to the lower section, and the lower section is highly vulnerable to flooding because of the snow melt in the upper reaches of the JRB, the heavy rainfall in the entire basin, and the branch waters flowing into its mainstream. Therefore, the lower reaches of the JRB are the most flood-prone areas in the entire basin. The JRB also has a variable flow that exhibits a seasonal behavior. Specifically, JRB has a low flow during the winter months that reaches its peak from May to November [41]. From the perspective of hydrological phenomenon remote-sensing monitoring, the observation themes in flood disasters are mainly related to long time-series and wide-range-related water regime monitoring [48], including real-time water flow, water volume, inundated time, and flooding range. In this case, the experiment takes the flooding water from the lower section of the JRB as its observation object, which requires time-series and space continuous monitoring by using multiple remote-sensing satellite sensors.

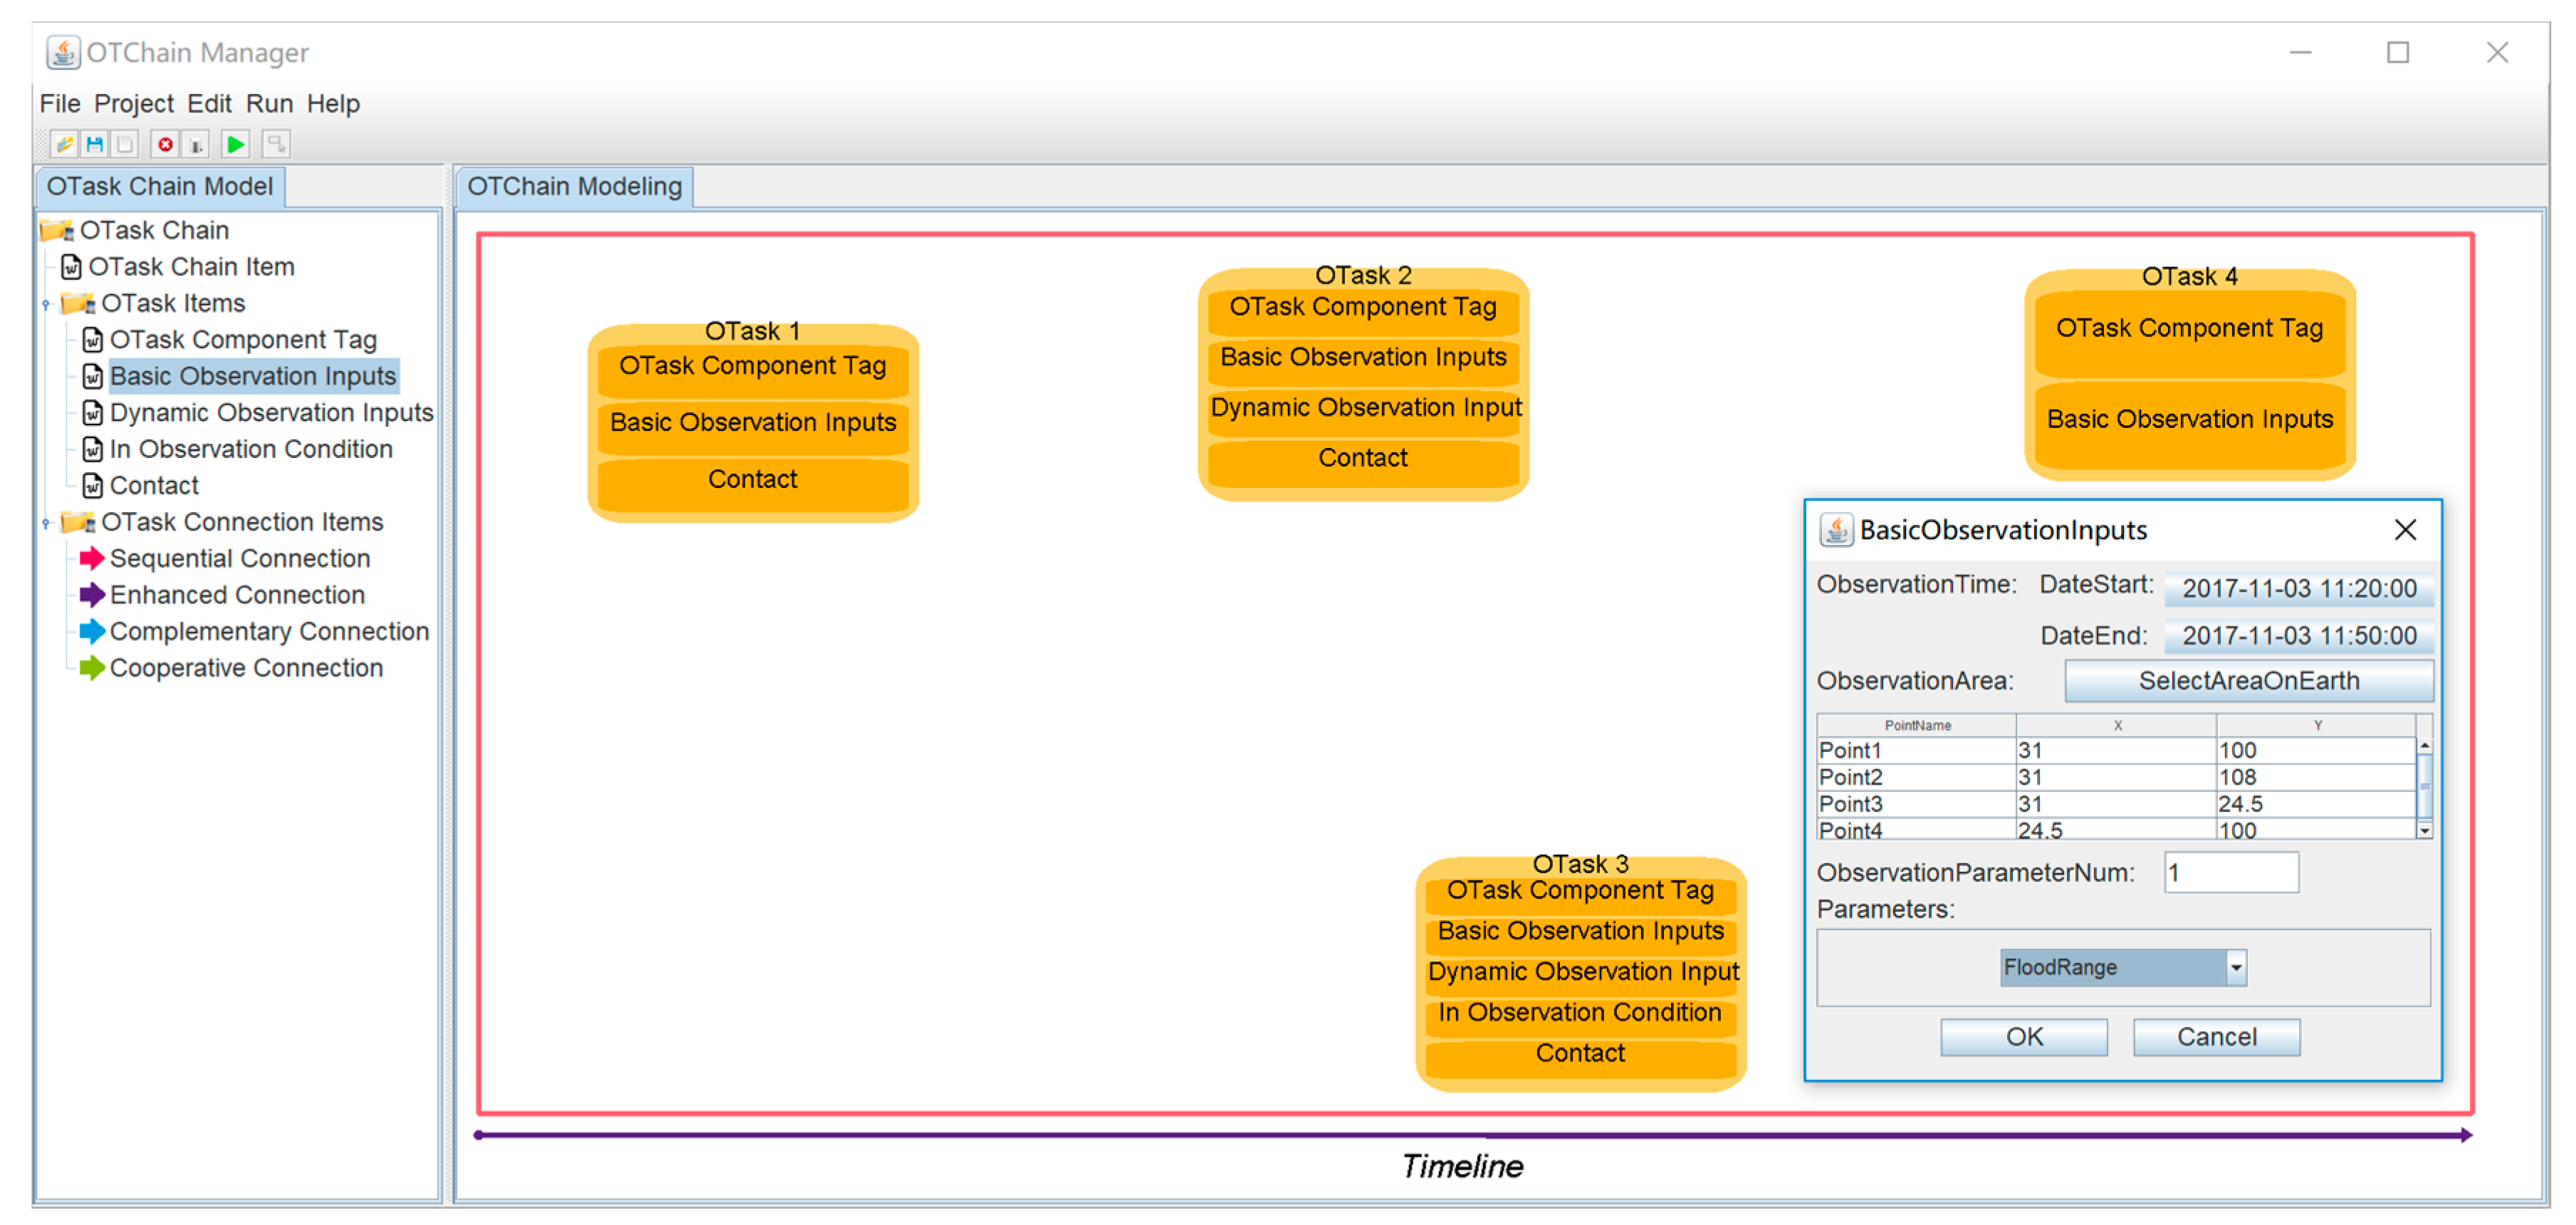
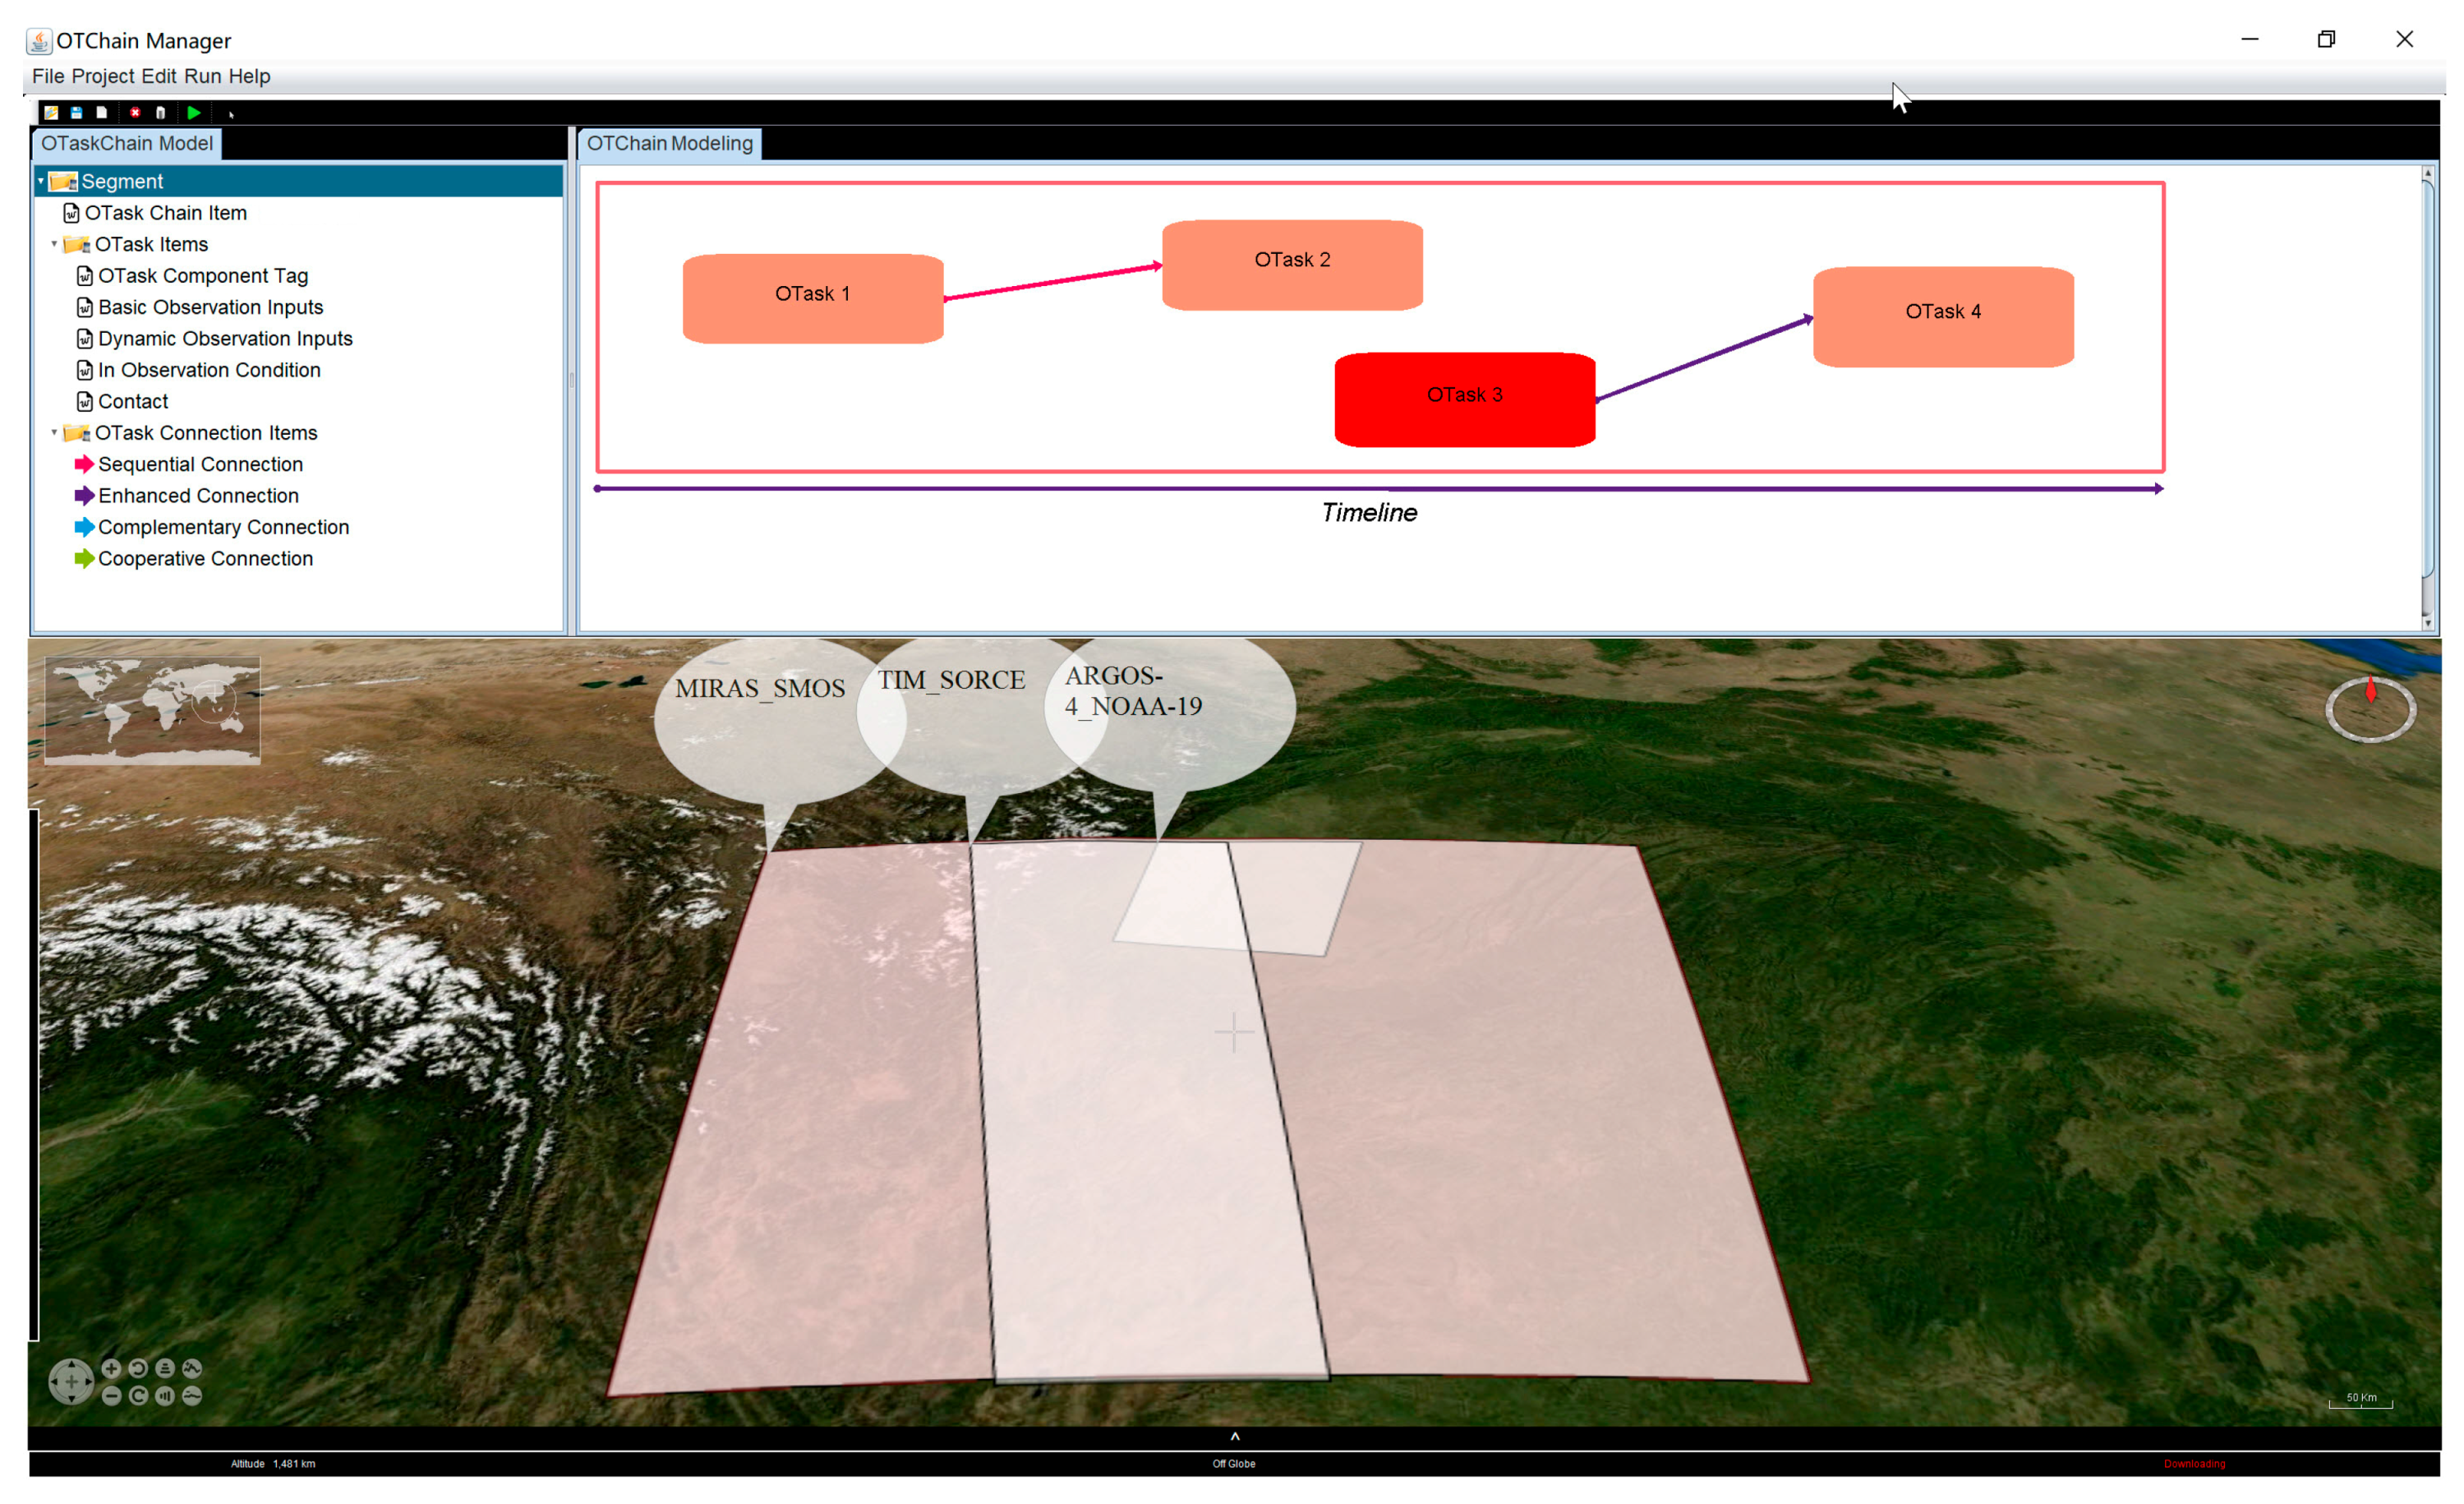
3.2. OTChain Manager for the Experiment

A prototype system called OTChainManager is designed by our research team as a tool for modeling, managing, querying, and visualizing the proposed OTChain representation model and its application.
As shown in Figure 5, OTChainManager comprises four layers, including the data, middleware, business, and presentation layers. The data layer includes all of the observation tasks of disasters, such as flooding, landslide, and earthquake. These tasks are formalized by OTChainML as a data basis for the upper layers. The middleware layer facilitates the serialization, storage, retrieval, and visualization of the proposed OTChain representation model. The business layer is the core of the system that defines a set of functions and operations for modeling, managing, querying, and visualizing OTChain. The presentation layer provides a series of graphical user interfaces through which observation task modelers or sensor planners can communicate with the system and accomplish the tasks that are defined in the function layer.
A flood monitoring task is a complex process that includes a large number of distributed and time-series sub-observation tasks. The flood disaster management cycle involves diagnosis, preparedness, response, and recovery phases, with each phase having different observation requirements [28]. The flood diagnosis phase requires a routine monitoring of precipitation. The preparedness phase forecasts flood-inducing factors within a suitable time interval. The response phase dynamically observes the precipitation, range of disaster area, and water level and flow in real time. The recovery phase focuses on the economic losses and ecological damage resulting from floods. A flood observation system is an important tool for flood risk management that assesses the entire flood monitoring process and understands the flood condition by using the appropriate sensors. Our proposed OTChainManager system can build a life-cycle-supported flood OTChain information model, which helps illustrate the long-term process monitoring requirements for flood, establish interconnections among different observation task components, and impel overall observation planning decision-making.
Remote-sensing satellite sensors with specific spectral bands (e.g., red, near infrared (NIR), and L- and C-bands) and space resolutions (e.g., more than 100 m) can be used to observe various flood water conditions, such as range, water volume, water depth, and inundation time. Nearly 200 flood-observation-supported satellite sensors are counted for the experiment as the source of data for the OTChainManager system. Detailed information on these sensors can be found in http://www.bigdatasensing.cn/data/Flood_Observation-Supported_Satellite_Sensors.html.

3.3. Flood Water Monitoring OTChain Modeling

A flood OTChain on the lower reaches of the JRB is selected as a typical modeling example that involves time-series observation processes.
Figure 6 and Figure 7 show the observation task chain modeling function of the OTChainManager prototype. We create four sub-observation task components and establish two observation task interconnections. Mandatory observation features, such as tag, basic observation input, and contact, are contained in each task component, while optional elements, such as in-observation condition, dynamic observation constraints, and interconnections, can be self-customized in the observation task component. The modeling process is conducted by using a drag-and-drop method, that is, the encapsulated observation task items in the left column of Figure 6 can be dragged to the drawing board in the right column.
By combining real flood observation requirements, we set the duration of the entire flood remote-sensing OTChain from 2017-11-03T09:00:00 to 2017-11-03T12:00:00 in the lower section of the JRB. The observation themes include water depth, water volume, inundation time, and flooding range. Four sub-observation tasks with different observation features were sequentially built within this specified period. Each item of an observation task can be instantiated in a wizard user interface pattern. As shown in Figure 6, when we drag the item “Basic Observation Inputs” to observation task 4, the corresponding labels and descriptions help us fill out the forms in each wizard page. Generally, if certain sub-observation tasks can be interconnected (e.g., a number of disaster themes can be temporally associated, and one disaster parameter can be spatially, complementarily, or time-extensively observed), then the disaster condition can be efficiently monitored. Here, we integrate observation task 1 for water depth monitoring and observation task 2 for water volume monitoring into an interrelated observation task group that follows the sequential connection mode (Figure 7). In other words, these two tasks are interconnected to sequentially observe water depth and volume. An enhanced observation connection is demonstrated between observation tasks 3 and 4 because these tasks aim to time-extensively observe the flood range (Figure 7).
The complete records of the OTChainML-based OTChain representation instance can be found in http://bigdatasensing.cn/OTChain/OTChainInstance.xml.

3.4. Flood Remote-Sensing Sensor Planning and Visualization

To further describe the results of remote-sensing satellite sensor observation planning, the available sensors are presented on a three-dimensional (3D) platform. Figure 8 shows the planned remote-sensing satellite sensors of observation task 3 (highlighted in bright red), including MIRAS_SMOS, TIM_SORCE, and ARGOS-4_NOAA-19 (interpretation tip: equipped sensor_satellite platform). The sensors of the other observation tasks can be visualized in the virtual earth by clicking on the corresponding observation task.
All of the planning results of the OTChain can be recorded in the OTChain model language to help sensor planners compile and track the sensor observation planning schedule. As shown in Figure 9, sensor planners can explicitly view the sensors’ usable observation modes of each observation task. For example, in observation task 2 (denoted as ID_OTaskCom2), RA_HY-2A can observe water volume in the observation area surrounded by three observation points (25.5130 N, 107.0101 E), (30.9983 N, 107.0101 E), and (30.9983 N, 106.5641 E) from observation time 2017-11-03T10:12:40 to 2017-11-03T10:15:10. Meanwhile, MOPITT_Terra can observe water volume in the observation area surrounded by five observation points (24.4978 N, 100.0012 E), (24.4978 N, 101.1925 E), (26.3371 N, 107.0101 E), (29.1570 N, 107.0101 E), and (27.2063 N, 100.0012 E) from observation time 2017-11-03T10:21:40 to 2017-11-03T10:23:15.

4. Discussion

4.1. Versatility and Extensibility of OTChain

By complying with the specific requirements of the disaster observation task, the proposed OTChain meta-model fully considers the aggregated information. Figure 10a shows the mandatory elements of one observation task chain, such as task tag, basic observation task inputs, observation task connections, and observation planning outputs, while Figure 10b presents the dynamic observation task constraints where the highly personalized observation constraints can be optionally supplemented. For instance, an observation task modeler can set a special area, such as University City, with a 1-h observation interval. This observation task occurs in a cloudy weather condition, and the flood has seriously destroyed the local geospatial environment. Although the task has several observation themes, Flooding Range is selected as the prior observation object. The observation weight is also considered to measure the observation applicability of the discovered sensors. As discussed above, the current OTChain meta-model comprehensively covers the required information for observation task representation and sensor planning. Moreover, the data classes used in the proposed OTChainML follow the principle of maximum versatility, which is widely accepted by the OTChain representation model examiner.
Other observation tasks, such as drought, mudslide, and earthquake, are characterized by long-term and process-owned observation requirements. By comprehensively covering the basic and personalized observation task information, the design framework of the proposed OTChain meta-model can be applied for the observation representation of other disaster domains. Nonetheless, given that the current maximum reusable observation task features may be unsuitable or unable to satisfy certain individual requirements, our OTChain meta-model allows for the extension and modification of the fields in our current observation task representation model. In other words, the other new task properties of an observation requirement can be represented as subfields of OTML:DynamicObservationConstraints. However, the proposed OTChain representation model framework is retained.

4.2. Global Sensor Planning Support for Process-Owned Flood Disasters

The extant models for observation task representation are often static models that only portray one segment of the observation task and are unable to depict the process-owned observation task chain for time-series sensor planning. The proposed OTChain allows the observation task modeler to build on-demand observation task components throughout the disaster diagnosis, preparedness, and response-to-recovery stages, with each component having its own observation requirements.
As shown in Figure 9, a global remote-sensing satellite sensor planning solution that avoids small-chunk and isolated sensor observation planning for a single observation task can be identified based on the compiled observation task chain. Figure 8 shows four observation task components and two interconnections among the different observation task components in this OTChain. The OTChain representation model (http://bigdatasensing.cn/OTChain/OTChainInstance.xml) presents six sets of sensor observation planning results. For the observation task component 1 labeled as ID_OTaskCom1, MIRAS_SMOS can be used for the observation parameter—WaterDepth in the observation area surrounded by five observation points (24.8518 N, 100.0012 E), (24.4978 N, 100.0012 E), (24.4978 N, 103.9288 E), (25.8083 N, 107.0101 E), and (27.5485 N, 107.0101 E) from observation periods 2017-11-03T09:18:55 to 2017-11-03T09:21:05. For the interconnectional observation task group 2 labeled as ID_ConOTaskGroup2, MIRAS_SMOS, TIM_SORCE, ARGOS-4_NOAA-19, SOLSTICE_SORCE, and Sounder_GOES-15 can be enhanced to observe the flooding range in the observation area surrounded by three observation points (27.3175 N, 101.9679 E), (29.1253 N, 103.2103 E), and (30.0006 N, 102.0009 E) in the time series (2017-11-03T10:49:55, 2017-11-03T10:51:50), (2017-11-03T10:50:30, 2017-11-03T10:52:15), (2017-11-03T10:54:20, 2017-11-03T10:55:00), (2017-11-03T11:24:15, 2017-11-03T11:25:50), and (2017-11-03T11:44:45, 2017-11-03T11:45:00). Through this setup, the sensor planner can (1) formulate a correlated plan of the sensor that may satisfy different sub-tasks and pre-determine in which task this sensor must be used; and (2) formulate an overall sensor planning schedule that can help decision-makers make a rapid and evidence-based sensor dispatch decision. Our proposed OTChain representation model also supports the establishment of on-demand observation task components. However, disaster managers cannot make an explicit observation plan for the macro monitoring of an entire disaster by using past short-term sensor planning for a segment-based observation task. In other words, presently, sensor inquirers can customize a long-term sensor planning support for evolution process-owned flood disasters to facilitate (1) the compilation of a timely and overall remote-sensing satellite sensor observation list by understanding in advance the time-series observation planning program of an entire flood disaster; (2) the dynamic understanding of a disaster condition and the subsequent evaluation of a disaster risk.

4.3. Comparison with Other Models for Observation Task Information Management

As mentioned in Section 1.2, the existing, typical observation task information models include TWML, CWML, EarthquakeML, EML, FLCNDEM, and TaskOntology. Although these models can be used for observation task information management, they focus on different aspects. For instance, FLCNDEM and TaskOntology partially support process-oriented observation task decomposition, which is not supported by any of the other models. Dynamic observation information needs to be expressed because people have a varied understanding of observation tasks. EML is a blank framework that does not include descriptions for dynamic observation information description, while the other models partially support this aspect. Unlike the OTChain with hierarchical constraint information (e.g., time, space, platform, observation condition, observation priority, and observation weight constraints), none of the aforementioned models comprehensively cover dynamic observation task information. Additionally, the support for observation task and planning provenance is very distinctive. In the past, sensor planners have had difficulties in capturing provenance information in sensor observation planning schedules and even forget which of the selected sensors can match a certain set of observation requirements or concrete observation tasks. The OTChain archives allow a comprehensive tracing of previous observation task instantiation and subsequent sensor observation planning results at any level of detail. In this way, OTChain allows for the sensor observation planning results to be correlated back to the instantiated observation tasks. Overall, compared with other models or engines, our proposed OTChain representation model comprehensively supports the features listed in Table 1 and can act as a driver component for managing observation task information.

5. Conclusions and Future Works

This study introduced an OTChain representation model with four segments and eight-tuple metadata components that are developed based on the observation requirements of disasters. This model was then applied to the remote-sensing satellite sensor observation planning of a long-term process-owned observation task. The results confirm that the proposed model can function as a driver component for observation task process decomposition, personalized observation constraint representation, and global remote-sensing satellite sensor observation planning. The proposed model can also be embedded into EML as a standard description specification for representing the entire observation task of an EO disaster.
This paper mainly focused on the meta-model framework of OTChain. Although our proposed model can be used for remote-sensing satellite sensor planning, its results are purely qualitative, such as results for which sensors or sensor combinations can be used in certain periods and for specific observation themes. Moreover, the proposed model neither conveys to the sensor planners that these sensors or sensor combinations can collaborate in complementary, enhanced, and cooperative modes nor informs them regarding the extent to which these sensors can quantitatively collaborate. Therefore, our future work aims to solve a quantitative sensor synergistic observation planning program based on the proposed OTChain representation model.

Acknowledgments

This work was supported by grants from the National Nature Science Foundation of China (NSFC) program (Nos. 41501439, 41601431, 41471323, 41701453); the Fundamental Research Funds for the Central Universities, China University of Geosciences (Wuhan) (No. 201566); the Natural Science Foundation of Hubei Province (No. 2016CFB279); the Fundamental Research Founds for National University, China University of Geosciences(Wuhan)(No. CUG180401); and the Opening fund of State Key Laboratory of Surveying and mapping Remote Sensing Information Engineering (No. 16I01).

Author Contributions

Chuli Hu and Chao Yang modeled the problem from the real application and formulated the problem; Jin Luo, Jie Li, and Ke Wang conceived and designed the experiments; Chuli Hu and Lu Tian performed the experiments; and Chao Yang, Jin Luo, and Chuli Hu wrote the paper.

Conflicts of Interest

The authors declare no conflict of interest.

References

  1. Global Disaster Events Statistics in 2016. Available online: http://www.swissre.com/media/news_releases/nr20170328_sigma_2_2017.html (accessed on 31 January 2018).
  2. Behling, R.; Roessner, S. Multi-sensor time-series analysis for disaster management—Rapid assessment, monitoring, and long-term process understanding of landslides. In Proceedings of the MultiTemp 2017, Bruges, Belgium, 27–29 June 2017. [Google Scholar]
  3. Li, D.; Wang, M.; Dong, Z.; Shen, X.; Shi, L. Earth observation brain (eob): An intelligent earth observation system. Geo-Spat. Inf. Sci. 2017, 20, 134–140. [Google Scholar] [CrossRef]
  4. Marin-Perez, R.; García-Pintado, J.; Gómez, A.S. A real-time measurement system for long-life flood monitoring and warning applications. Sensors 2012, 12, 4213–4236. [Google Scholar] [CrossRef] [PubMed]
  5. Kussul, N.; Skakun, S.; Shelestov, A.Y.; Kussul, O.; Yailymov, B. Resilience Aspects in the Sensor Web Infrastructure for Natural Disaster Monitoring and Risk Assessment Based on Earth Observation Data. IEEE J. Sel. Top. Appl. Earth Obs. Remote Sens. 2014, 7, 3826–3832. [Google Scholar] [CrossRef]
  6. Aitsi-Selmi, A.; Egawa, S.; Sasaki, H.; Wannous, C.; Murray, V. The sendai framework for disaster risk reduction: Renewing the global commitment to people’s resilience, health, and well-being. Int. J. Disaster Risk Sci. 2015, 6, 164–176. [Google Scholar] [CrossRef]
  7. UCS Satellite Database in 2017. Available online: https://www.ucsusa.org/nuclear-weapons/space-weapons/satellite-database#.WnE-j3mQyYp (accessed on 31 January 2018).
  8. Huang, C.Y.; Liang, S. The Open Geospatial Consortium Sensor Web PivotViewer: An innovative tool for worldwide sensor web resource discovery. Int. J. Digit. Earth 2014, 7, 761–769. [Google Scholar] [CrossRef]
  9. Semantic Sensor Network XG Final Report. Available online: http://www.w3.org/2005/Incubator/ ssn/XGR-ssn-20110628/ (accessed on 10 August 2017).
  10. Hu, C.; Guan, Q.; Li, J.; Wang, K.; Chen, N. Representing Geospatial Environment Observation Capability Information: A Case Study of Managing Flood Monitoring Sensors in the Jinsha River Basin. Sensors 2016, 16, 2144. [Google Scholar] [CrossRef] [PubMed]
  11. Chamam, A.; Pierre, S. On the Planning of Wireless Sensor Networks: Energy-Efficient Clustering under the Joint Routing and Coverage Constraint. IEEE Trans. Mob. Comput. 2009, 8, 1077–1086. [Google Scholar] [CrossRef]
  12. Diallo, O.; Rodrigues, J.J.P.C.; Sene, M.; Lioret, J. Distributed Database Management Techniques for Wireless Sensor Networks. IEEE Trans. Parallel Distrib. Syst. 2015, 26, 604–620. [Google Scholar] [CrossRef]
  13. Le-Phuoc, D.; Hauswirth, M. Linked Open Data in Sensor Data Mashups. In Proceedings of the 2nd International Workshop on Semantic Sensor Networks, Washington, DC, USA, 26 October 2009. [Google Scholar]
  14. Bröring, A.; Echterhoff, J.; Jirka, S.; Simonis, I.; Everding, T.; Stasch, C.; Liang, S.; Lemmens, R. New generation sensor web enablement. Sensors 2011, 11, 2652–2699. [Google Scholar] [CrossRef] [PubMed]
  15. NASA Global Change Master Directory Retrieval Portal. Available online: http://gcmd.nasa.gov/index.html (accessed on 31 January 2018).
  16. Committee on Earth Observation Satellites Database. Available online: http://database.eohandbook.com/database/instrumenttable.aspx (accessed on 31 January 2018).
  17. WMO Observing Systems Capability Analysis and Review Tool. Available online: http://www.wmo-sat.info/oscar/instruments (accessed on 31 January 2018).
  18. Botts, M.; Percivall, G.; Reed, C.; Davidson, J. OGC® Sensor Web Enablement: Overview and High Level Architecture; GeoSensor Networks; Springer: Berlin/Heidelberg, Germany, 2008. [Google Scholar]
  19. OpenGeo Sensor Web Enablement (SWE) Suite. Available online: http://boundlessgeo.com/whitepaper/opengeo-sensor-web-enablement-swe-suite/ (accessed on 10 August 2017).
  20. Botts, M. OGC® SensorML: Model and XML Encoding Standard; Open Geospatial Consortium: Wayland, MA, USA, 2014. [Google Scholar]
  21. Na, A.; Priest, M. OGC® Implementation Specification 06-009r6: OpenGIS Sensor Observation Service (SOS); Open Geospatial Consortium: Wayland, MA, USA, 2007. [Google Scholar]
  22. Simonis, I.; Echterhoff, J. OGC® Sensor Planning Service Implementation Standard (Version: 2.0); Open Geospatial Consortium: Wayland, MA, USA, 2011. [Google Scholar]
  23. Bleier, T.; Bozic, B.; Bumerl-Lexa, R.; Da Costa, A.; Costes, S.; Iosifescu, I.; Martin, O.; Frysinger, S.; Havlik, D.; Hilbring, D. SANY—An Open Service Architecture for Sensor Networks; SANY Consortium: Bath, UK, 2009. [Google Scholar]
  24. Kussul, N.; Dan, M.; Moe, K.; Mund, J.P.; Post, J.; Shelestov, A.; Handy, M. Interoperable infrastructure for flood monitoring: Sensorweb, grid and cloud. IEEE J. Sel. Top. Appl. Earth Obs. Remote Sens. 2012, 6, 1740–1745. [Google Scholar] [CrossRef] [Green Version]
  25. Mandl, D.; Cappelaere, P.; Frye, S.; Sohlberg, R.; Ong, L.; Chien, S.; Tran, D.; Davies, A.; Falke, S.; Kolitz, S.; et al. Sensor Web 2.0: Connecting Earth‘s Sensors via the Internet. In Proceedings of the NASA Earth Science Technology Conference 2008, Adelphi, MD, USA, 25 June 2008. [Google Scholar]
  26. Sun, Z.; Yue, P.; Lu, X.; Zhai, X.; Hu, L. A task ontology driven approach for live geoprocessing in a service-oriented environment. Trans. GIS 2012, 16, 867–884. [Google Scholar] [CrossRef]
  27. Wang, F.; Yuan, H. Challenges of the Sensor Web for disaster management. Int. J. Digit. Earth 2010, 3, 260–279. [Google Scholar] [CrossRef]
  28. Frye, S.; Percivall, G.; Moe, K.; Dan, M.; Handy, M.; Evans, J. Towards a sensor web architecture for Disaster management: Insights from the Namibia flood pilot. In Proceedings of the IEEE International Geoscience and Remote Sensing Symposium 2014, Quebec City, QC, Canada, 13–18 July 2014. [Google Scholar]
  29. Chen, N.; Du, W.; Song, F.; Chen, Z. FLCNDEMF: An Event Metamodel for Flood Process Information Management under the Sensor Web Environment. Remote Sens. 2015, 7, 7231–7256. [Google Scholar] [CrossRef]
  30. Jones, E.; Botterell, A. Common Alerting Protocol (Version 1.1); OASIS: Burlington, MA, USA, 2005. [Google Scholar]
  31. Raymond, M.; Webb, S.; Aymond, P.I. Emergency Data Exchange Language (EDXL) Distribution Element (Version 1.0); OASIS: Burlington, MA, USA, 2006. [Google Scholar]
  32. Aymond, P.; Brooks, R.; Grapes, T.; Ham, G.; Iannella, R.; Robinson, K.; Joerg, W.; Triglia, A. Emergency Data Exchange Language Resource Messaging (EDXL-RM) (Version 1.0); OASIS: Burlington, MA, USA, 2009. [Google Scholar]
  33. Iannella, R.; Robinson, K. Tsunami Warning Markup Language (TWML) (Version 1.0); National ICT Australia: Sydney, Australia, 2006.
  34. Sun, S.; Iannella, R.; Robinson, K. Cyclone Warning Markup Language (CWML) (Version 1.0); National ICT Australia: Sydney, Australia, 2006.
  35. Babaie, H.A.; Babaei, A. Developing the earthquake markup language and database with UML and XML schema. Comput. Geosci. 2005, 31, 1175–1200. [Google Scholar] [CrossRef]
  36. Scherp, A.; Franz, T.; Saathoff, C.; Staab, S.F. A model of events based on the foundational ontology dolce + DnS ultralight. In Proceedings of the Fifth ACM International Conference on Knowledge Capture, New York, NY, USA, 1–4 September 2009. [Google Scholar]
  37. Everding, T.; Echterhoff, J. Event Pattern Markup Language (EML) (Version: 0.3.0) 08-132; Open Geospatial Consortium: Wayland, MA, USA, 2008. [Google Scholar]
  38. Di, L.; Moe, K.; Yu, G. Metadata requirements analysis for the emerging sensor web. Int. J. Digit. Earth 2009, 2, 3–17. [Google Scholar] [CrossRef]
  39. Chen, N.; Hu, C. A sharable and interoperable meta-model for atmospheric satellite sensors and observations. IEEE J. Sel. Top. Appl. Earth Obs. Remote Sens. 2012, 5, 1519–1530. [Google Scholar] [CrossRef]
  40. Hu, C.; Guan, Q.; Chen, N.; Li, J.; Zhong, X.; Han, Y. An Observation Capability Metadata Model for EO Sensor Discovery in Sensor Web Enablement Environments. Remote Sens. 2014, 6, 10546–10570. [Google Scholar] [CrossRef]
  41. Chen, N.; Wang, K.; Xiao, C.; Gong, J. A heterogeneous sensor web node meta-model for the management of a flood monitoring system. Environ. Model. Softw. 2014, 54, 222–237. [Google Scholar] [CrossRef]
  42. Garitselov, O.; Mohanty, S.P.; Kougianos, E. A comparative study of metamodels for fast and accurate simulation of nano-cmos circuits. IEEE Trans. Semicond. Manuf. 2012, 25, 26–36. [Google Scholar] [CrossRef]
  43. OMG’s MetaObject Facility. Available online: http://www.omg.org/mof/ (accessed on 10 August 2017).
  44. Atkinson, C.; Kuhne, T. Model-driven development: A metamodeling foundation. IEEE Softw. 2003, 20, 36–41. [Google Scholar] [CrossRef]
  45. Portele, C. OGC@ Implementation Specification: OpenGIS Geography Markup Language (GML) Encoding Standard (Version: 3.2.1) 07-036; Open Geospatial Consortium: Wayland, MA, USA, 2007. [Google Scholar]
  46. Robin, A. OGC@ Implementation Specification: SWE Common Data Model Encoding Standard (Version 2.0) 08-094r1; Open Geospatial Consortium: Wayland, MA, USA, 2010. [Google Scholar]
  47. Liu, Z.; Sun, W. Trend analysis of precipitation in the jinsha river basin in china. J. Hydrometeorol. 2013, 14, 290–303. [Google Scholar]
  48. Castañeda, C.; Herrero, J. The water regime of the Monegros playa-lakes as established from ground and satellite data. J. Hydrol. 2005, 310, 95–110. [Google Scholar] [CrossRef]
Figure 1. OTChain metamodeling architecture.
Remotesensing 10 00375 g001
Figure 2. OTChain meta-model framework.
Remotesensing 10 00375 g002
Figure 3. Mapping the OTChain contents to the existing data structures.
Remotesensing 10 00375 g003
Figure 4. Unified Modeling Language (UML) diagram for the OTChain metadata contents.
Remotesensing 10 00375 g004
Figure 5. Architecture and components of the OTChainManager system.
Remotesensing 10 00375 g005
Figure 6. Drag-and-drop sub-observation task component modeling.
Remotesensing 10 00375 g006
Figure 7. Drag-and-drop observation task interconnection modeling.
Remotesensing 10 00375 g007
Figure 8. Remote-sensing satellite sensor observation planning results on a three-dimensional (3D) earth.
Remotesensing 10 00375 g008
Figure 9. Remote-sensing satellite sensor observation planning results described in OTChainML.
Remotesensing 10 00375 g009
Figure 10. Segments of the OTChain instance. (a) Mandatory and (b) optional observation task elements.
Remotesensing 10 00375 g010
Table 1. Summary of the abovementioned disaster observation task models for supporting observation task chain (OTChain) features.
ModelsCAPEDXL-DEEDXL-RMTWMLCWMLEarthquakeMLEvent-Model-FTask-OntologyEMLFLCNDEM
OTChain Features
Dynamic observation information description×××××××
Process-oriented observation task decomposition××××××××
Observation interconnection××××××××××
Time-series observation planning×××××××××
Observation planning provenance××××××××
Notes: √ Supported; ○ Partially Supported; × Unsupported.

