1. Introduction
On 15 June 2007, the first national German radar satellite TSX was launched from the Russian Baikonur Cosmodrome in Kazakhstan, which marked the starting point for the highly successful TerraSAR-X remote sensing mission [
1]. This mission has now lasted for more than 10 years and achieved remarkable results. Despite a satellite age well beyond its nominal life time of 5.5 years, no significant technical flaws were encountered. The objective of providing high-quality SAR products in Spotlight, Stripmap, and ScanSAR mode variants with various polarizations [
2] has since been met without any restrictions and the image quality is just as good as it was at the beginning of the mission. The reasons for the outstanding long-term performance are both the excellent manufacturing of the satellite systems [
3] and the design of the ground segment [
4] tuned to it, i.e., which is able to exploit all of the capabilities of the satellite bus and the radar instrument. This could already be seen during the launch and early orbit phase. Only four days after launch, the first SAR images were successfully acquired, downlinked, and processed on ground using nominal ground segment workflows. At the end of 2007, the complete SAR system was characterized and calibrated, the SAR products were verified and the ground segment was operationally qualified [
5].
Over ten years of operations, the TerraSAR-X system underwent to a certain extent an evolutionary process. Although the TerraSAR-X ground segment, as described in [
4], has maintained its basic structure throughout the mission, it has been steadily improved and expanded upon to meet new requirements. The biggest impact had its upgrade to serve a second mission on top, the TerraSAR-X Add-On for Digital Elevation Measurements TanDEM-X, starting in 2010. The primary TanDEM-X mission goal was the generation of a global digital elevation model (DEM) of Earth’s total land mass within two years. A second satellite TDX, which is almost identical to TSX, was launched on 21 June 2010. Both satellites since then fly in a close configuration with a minimum distance of about 250 m and perform together bistatic radar acquisitions of the Earth’s surface, as required for the DEM generation. Both satellites are also used, either TSX or TDX, to acquire the monostatic acquisitions for the on-going TerraSAR-X mission. The necessary modifications, extensions and tests to implement the TanDEM-X functionalities into the ground segment meant a massive intervention comparable with open-heart surgery, since the ongoing operation of the TerraSAR-X mission was not allowed to be interrupted or disturbed. Commissioning of the TDX system was accomplished in October 2010 and the joint TerraSAR-X/TanDEM-X ground segment was successfully released for TerraSAR-X operations that are based on two satellites flying in a close formation.
Driven by science and commercial business cases, new products, services and capabilities were required, leading to a number of operational extensions and improvements.
The SAR imaging mode and thus product portfolio has been extended in 2013 by Staring Spotlight and Wide ScanSAR. The first of these improves the obtainable azimuth resolution to about 24 cm, while the second provides an extended swath width of about 200 km.
The experimental dual-receive antenna configuration provides full polarimetric imagery and along-track interferometry acquisitions.
The overall receiving station capacity and flexibility has been increased.
Near-real time support has been improved by shortening the turn-around times and by introducing new data sets for maritime applications.
Radar science is one of the driving forces that aim to extend existing or to test new radar modes and to put theoretical considerations into practice. The flexible design of the radar instrument provides the conditions for numerous experiments. An important proof of technology was the acquisition and processing of data in TOPSAR mode, which—like the ScanSAR mode—acquires data of several sub-swathes in parallel, but also performs an along-track azimuth steering, and thus overcomes severe ScanSAR limitations, like the scalloping effect. The new bi-directional SAR mode BiDiSAR was developed. It shapes an antenna pattern with a forward and a backward oriented lobe, and thus records two time-shifted images of the same scene on ground into only one receiving channel. In summary, we describe in this paper the TerraSAR-X ground segment extensions and service improvements, as well as the evolution of the SAR product portfolio since the TerraSAR-X mission operations started in 2008. We report on dedicated mission campaigns necessitating specific ground segments adaptations on the one hand, on the other hand opening new research opportunities by providing additional products. Details of selected radar experiments performed within the last decade are given. Specific challenges to be met by the satellite operations are discussed. The orbit control philosophy and the operational experience is described. System performance and mission utilization aspects are addressed.
2. Extension of the TerraSAR-X Ground Segment
2.1. Common TerraSAR-X/TanDEM-X Ground Segment
The TerraSAR-X ground segment underwent major extensions when compared to its starting point, as described in [
4]. One essential upgrade driver has been the TanDEM-X mission, the TerraSAR-X Add-On for Digital Elevation Measurements, which added a second, mostly identical satellite TDX in 2010. Flying TDX in a close helix formation around the TSX satellite (the one being kept in a reference orbital tube) enables a bistatic acquisition of SAR data, as needed for global DEM generation. Both TSX and TDX are used together for such acquisitions where only one satellite is actively transmitting SAR pulses and both satellites are receiving the echoes. To counterbalance this interferometric usage of the TSX satellite for TanDEM-X, the TerraSAR-X monostatic data acquisitions have to be performed by either TSX or TDX since then. Consequently, essential ground segment subsystems had to be upgraded from their “one mission one satellite” behavior into a combined “two missions two satellites” one even to fulfill their TerraSAR-X mission purpose only, foremost the flight dynamics and the mission planning subsystems. Their operational integration and commissioning had been achieved without disturbance of the on-going operational TerraSAR-X mission. In October 2010, the joint TerraSAR-X/TanDEM-X ground segment had been released for the TerraSAR-X operations based on two satellites that are flying in a close formation [
6,
7].
Maintaining not only a reference orbit for TSX, but also the challenging helix formation of TDX relative to TSX in an extremely short distance posed new needs for spacecraft navigation and control, e.g., a common maneuver planning and execution. The reference orbit control, as described in
Section 7, details on the formation flight are given in [
8,
9]. Verification of the upgraded flight dynamic system components and specifically validation of their interaction with the operational TSX system was performed for about one year before launch using the in-orbit TSX satellite and on-ground simulated TDX GPS navigation data [
10].
Conflict-free timelines for both satellites are obtained only if the acquisitions for both missions are jointly planned inside the mission planning system. TerraSAR-X data takes are assigned by mission planning to either one of the satellites, for TanDEM-X data takes the transmitting satellite has to be chosen. The resulting load distribution has to balance the usage between the two missions. Irreparable damages that are caused by a mutual illumination of the instruments have to be prevented. The operational qualification of the new “two missions, two satellites” version of the mission planning system under realistic conditions within the TDX commissioning phase had to be performed, while the former “one mission one satellite” version was still supporting the on-going TerraSAR-X operations. Operational roll-out, i.e., final replacement of the former version, was mastered within a short maintenance period of a few days only, services were continued with the same robustness and reliability as before [
11].
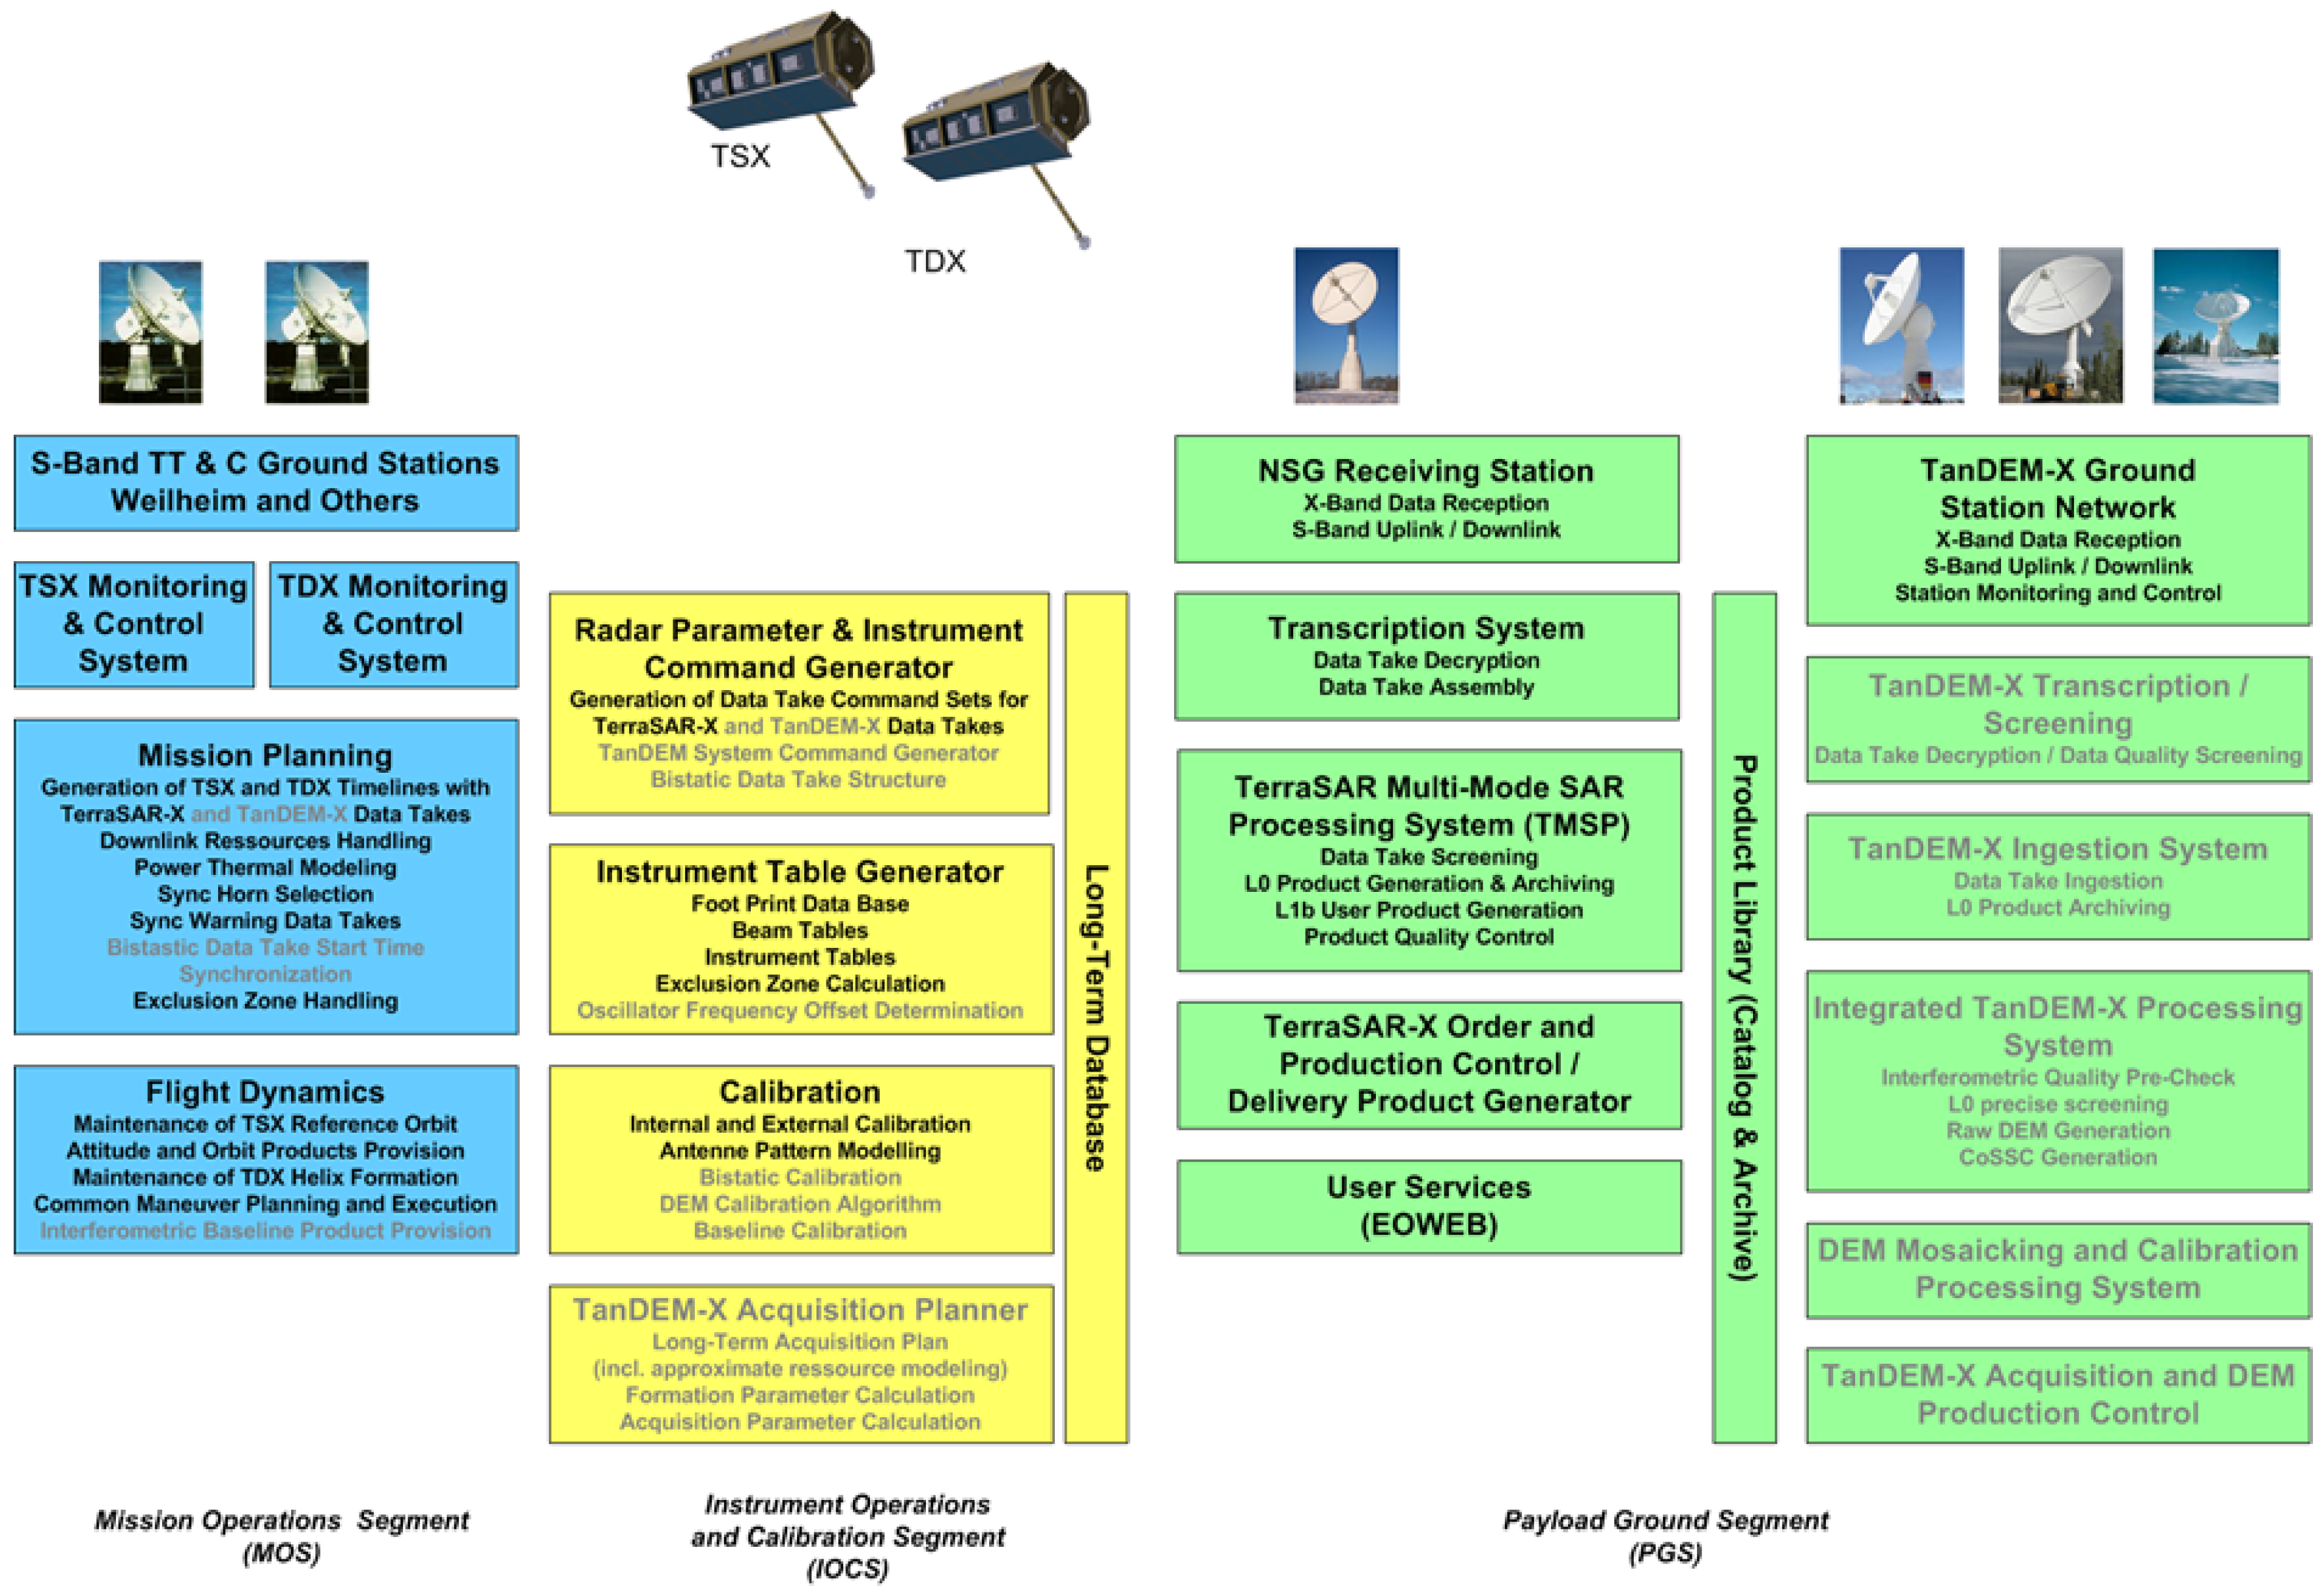
On the payload data handling side, a new production chain for the reception and processing of TanDEM-X data has been established. DLR’s existing German Antarctica Receiving Station (GARS) O’Higgins was complemented in 2010 by a new satellite receiving station, the Inuvik Satellite Station Facility (ISSF) in Canada. Both of the stations form the backbone of the TanDEM-X Ground Station Network, which was further supported in the years 2010–2015 by the partner ground station SSC Esrange in Kiruna, Sweden, to handle the TanDEM-X global DEM data amount. Like the main TerraSAR-X ground station at DLR Neustrelitz (NSG), also these stations not only support X-band data reception, but also S-band up- and downlink for telemetry, tracking, and commanding (TT&C) for both the TSX and TDX satellites and thus can be used for both missions, TerraSAR-X and TanDEM-X. Their association to a given mission is configurable and is mostly a question of downlink capacity needs and requested data transfer times between a given station and the TerraSAR-X processing hosted at DLR. GARS and ISSF are supporting TanDEM-X, GARS had been actually used for the downlink of TerraSAR-X background mission data before TDX launch.
Since the beginning of TSX mission operations the density of the S-Band motoring network was significantly increased. At the beginning, a 12-h rhythm was applied. In later stages the monitoring of the satellites was intensified. The S-Band network benefits from the expansion of the X-Band network by GARS and ISSF. The KSAT ground station SvalSat, Svalbard, supports two passes for TSX and TDX monitoring at midday.
The current ground segment layout is depicted in
Figure 1.
2.2. Receiving Capacities and Flexibilities
Already in 2009, a TerraSAR-X data reception system was integrated at SvalSat, primarily to shorten near-real time (NRT) product latencies by using selected contact opportunities outside of the NSG visibility range. The data that were received at SvalSat are transferred in an encrypted raw data format to NSG, where they are processed in the same way as those that were received at the station itself. In answer to the increasing demand in TerraSAR-X products, the contacts that are used for the S-band support at SvalSat are also used for X-band data reception, thus enlarging the overall downlink capacity.
In 2015, the receiving station pool concept was introduced. Before then, acquisitions had to be explicitly ordered for downlink at a given station. This allowed for using the GARS for background acquisitions, to place test orders for ISSF during station validation and to explicitly order NRT data takes either at SvalSat or NSG, depending on the nearest downlink opportunity. Grouping stations into one receiving pool and leaving the decision regarding which station to use for the downlink of a given data take up to mission planning, results in a better exploitation of limited resources like on-board memory and downlink capacity [
12]. Mission planning uses the next free slot for a downlink. If necessary, pool reconfigurations can be done up to three days before the first downlink to a new station in the pool, in urgent cases, only six hours are needed for the event.
Both the pool concept and the flexibility to use a given station either for TerraSAR-X or TanDEM-X or for both play an important role in exploiting downlink resources and to handle specific constraints that are given by specific mission campaigns.
2.3. Near-Real Time Capabilities
In the beginning, Near-Real Time (NRT) support had not been a strong TerraSAR-X stake holder requirement. Nevertheless, all of the basic products have been offered in a NRT flavor since the beginning of the mission. Sampling and resolution in the NRT products are identical to those of the standard product. The product latency after downlink is typically about 10 min. Processing has to rely upon auxiliary information, which is available at the same time as the raw data. The usage of a predicted orbit results in a reduced geolocation accuracy, the non-availability of instrument house-keeping parameters in a reduced radiometric accuracy. Data takes foreseen for NRT processing are marked as such both in space and on ground, and thus allow for a completely data-driven privileged handling from reception into processing and dissemination.
Within the seven years, the NRT capabilities have been further improved. Receiving stations with online data connection to NSG are grouped into the NRT station pool (currently consisting of NSG and SvalSat). Mission planning uses the next possible contact from the station pool for the downlink of a NRT data take and schedules it as soon as possible within this contact, i.e., at the beginning for already completed acquisitions and—if the remaining contact time allows—within for acquisitions that were taken during the contact.
NRT support for maritime applications has been introduced in 2012 starting with a ship detection service. Wind and wave products that are based on Stripmap multi-look ground range detected products followed in 2016 [
13]. In case of ship detection, Automatic Identification System (AIS) data are processed in real time and the obtained information is merged into the SAR based detection results. Ship detection information is provided in a number of different formats, e.g., as ESRI shape file layer, GML, or Google KMZ files assembled with a geocoded quicklook image. Dissemination options include secure FTP variants and electronic mail. Whereas, the ship detection service is already available for external users, wind and wave products are currently provided for selected science projects only. The wind product provides derived wind field information for the estimated wind speed and direction calculated relative to a standard reference height of 10 m (U10) on a raster of two by two kilometers. The wave product contains sea state information about the significant wave height on a raster of three by three kilometers. The core processor to derive those value added products is the SAR AIS Integrated NRT Toolbox [
14]. The SAINT processor calls the processes for the various maritime products in parallel. Thus, obtained information is made available instantaneously for the other information extraction processes.
For selected NRT applications, e.g., vessel navigation support in polar-regions, quicklook images of the high-resolution TerraSAR-X products, or further derived information of limited data amount are sufficient. Consequently, TerraSAR-X processing systems were installed both at GARS and ISSF in 2015 enabling the identical NRT product generation, as done at the central processing system. Following a nominal NRT production run, a dedicated station NRT quicklook process generates geocoded quicklook products of a size smaller than 5 Mbyte, which are e.g., suitable for e-mail transfer to NRT users on-board vessels or at research stations with Internet access. Handling of station NRT orders is fully integrated into the payload ground segment. Orders may be placed by authorized users, the derived production requests are routed accordingly into the appropriate station [
12].
3. Evolution of SAR Product Portfolio
In its ten years of operation, the TerraSAR-X ground segment extended and improved the SAR product portfolio continuously. The flexibility in commanding the versatile TerraSAR-X and TanDEM-X SAR instruments allowed for numerous radar experiments to test and demonstrate new SAR acquisition modes or mode variants, which are detailed in the following section. The most prominent extension was the operational release of Staring Spotlight (ST) and a six-beam wide ScanSAR mode in April 2013. But, not all evolutionary steps in the product development are related to innovative SAR mode design and instrument commanding, and not all of such experiments lead to new product releases. Since the TerraSAR-X mission is user driven and is not restricted with regards to the future product ordering to specific acquisition conditions, only those modes and product variants that fulfill the high product quality requirements on a global scale were selected, calibrated, and verified as operational products. Some mode variants like the experimental 300 MHz range bandwidth option for the high resolution spotlight were already added to the product portfolio right after the end of the commissioning phase because of their solid performance. Modes, like the experimental aperture switching ATI (ATIS) mode and TOPSAR, however, are limited due to the complexity in their commanding sequences to restricted acquisition scenarios, and hence are not included in the SAR product portfolio. All basic products as well as the operationally provided experimental products are generated by the TerraSAR-X Multi-mode SAR Processor (TMSP). Details are given in [
2,
14]. As of 2018, the portfolio of basic [
2] and experimental products [
15] is characterized in
Table 1.
3.1. Extension of Basic Products
The ST mode specifically pushes the limits of instrument azimuth beam steering and spectral signal processing, as pointed out in
Section 5, but it is also most demanding in terms of reconstructing the “true” geometric range history for focusing each target. With synthetic aperture lengths that correspond to more than 60 km orbit path, the inclusion of higher order terms in the focusing algorithm is required, as well as the intrinsic bistatic tropospheric path delay corrections implemented in the TMSP to keep the reconstructed range history within mm of the geometrical one [
16]. The ST azimuth resolution is specified as 24 cm which includes some cm margin since the actual height on ground of each focused scatterer has to be considered for focusing parameter calculation. The TMSP uses a coarse built-in DEM for this, but deviations from the local focal plane of merely several tens of meters may cause resolution loss in the range of centimeters. In turn, we could demonstrate that measuring this very small defocusing effect with methods that are similar to auto-focusing can be used to actually determine the absolute elevation of all sufficiently bright individual scatterers in a single ST image [
17].
The six-beam wide-ScanSAR mode seems like a straight forward extension of the established four-beam ScanSAR product. It did however introduce completely new approaches in TerraSAR-X mode and product design. Not only the use of newly created wide-swath sub-beams that differ in pattern tapering from the nominal Stripmap beams allowed for achieving a total swath width of up to 266 km, also variable range bandwidths and processing look factors are used to keep an optimal performance over the whole swath. Its chirp bandwidth is selected for each individual sub-swath, such that the projected ground range resolution of the detected product is kept mostly below 35 m—in the same order as the azimuth resolution—with a nearly constant number of radiometric looks. This allows for a consistent performance in applications like ship or oil spill detection over the full multi-beam swath. Since this mode is mainly designed for maritime applications, a special cross-polar (HV or VH) order option is also provided that increases the contrast between man-made targets and ocean surface at the price of lower sensitivity.
Continuous research activities and TMSP upgrades with respect to processing performance, timing, and phase accuracy, as well as geometric precision also improved the SAR product performance and allowed for turning experimental products into operational ones. Additionally, the product characteristics and the level 1 format have been extended to facilitate higher level processing and geo-information retrieval. Some major achievements were:
The introduction of operational image noise correction for all radiometrically enhanced (RE) products in December 2008. It is based on a sophisticated statistical evaluation of the thermal noise distribution in SAR images when considering the processing filter noise gains [
18].
Optimized ScanSAR SSC oversampling approaches resulting from InSAR experiments activated in April 2009, which enabled the re-classification of the ScanSAR SSC product from an experimental one into a basic product.
Also, in April 2009, additional quicklook and image files were added to the level 1 product to support quick evaluation and image interpretation based on the statistical properties of the image (see
Figure 2 for an example).
In preparation of the TanDEM-X mission with a second satellite to provide TerraSAR-X mission products, an antenna phase pattern correction scheme was introduced in March 2010. Similar to the radiometric beam pattern, the individual phase patterns of the numerous beams of the two instruments differ. The individual patterns are projected onto a digital elevation model of the scene and corrected for in order to generate interferometrically exchangeable SAR products from both. The patterns are also annotated in all of the SSC products.
With the extreme Doppler spectral behavior encountered specifically in the raw data of the newly introduced ST modes and its complex mapping into the focused data, additional annotation files describing the Doppler centroid in the focused image have been added to all complex products in September 2013. These files also facilitate the interferometric processing of burst modes (i.e., ScanSAR).
ST mode images are basically illuminated by the beam footprint that is fixed to one location on the ground. Hence, they show a strong radiometric variation and strong increase of the image noise towards their azimuth borders. To ease this effect, the operational noise correction is also applied by default to the highest resolution spatially enhanced (SE) products of the ST mode since May 2014.
The upgrade of May 2014 also added a new azimuth time tag correction method to the processor, which analyses the absolute Radar frequency and drifts of the internal clock w.r.t. GPS time tags and corrects them in the processed data [
19].
Specifically processing enhancements, like the last point, helped to improve the geometric location accuracy and to turn TerraSAR-X into a geodetic measurement instrument [
20]. These developments were supported by the tremendous effort put into phase and signal delay calibration for the TanDEM-X mission, the intrinsic bistatic focusing approach of the TMSP (even applied for mono-static TerraSAR-X data), and the elimination of algorithmic approximations in its focusing kernel. Once atmospheric and ionospheric signal propagation effects are properly considered, pixel location accuracies in the 1–2 cm range are achievable with the precisely determined orbit products [
20].
3.2. Experimental Products
The SAR instrument on both satellites TSX and TDX allows for the simultaneous reception of the transmitted SAR signals with the fore and aft segments of the antenna when using the redundant receiver chain in parallel with the primary one. The signals received by either antenna part are recorded in a dedicated channel and are then exploited accordingly on ground. Thus, data acquisition either in full polarization mode to obtain quad pol images or with separated phase centers to allow for along-track interferometry (ATI) is enabled in this dual-receive antenna (DRA) configuration mode. The way in which DRA data are recorded on-board necessitates complex signal demultiplexing operations on ground before any raw data processing can take place. The needed compensation of the relative instrument electronics phase drifts results in a challenging calibration approach. Due to this complexity, the DRA configuration is offered for Stripmap mode acquisitions only.
In full polarization mode, the transmit polarization is toggled between V and H from pulse to pulse. The fore and aft antenna segments use different polarizations for the parallel receiving of the returned signals. The pulse repetition frequency (PRF) is doubled as for the dual polarization mode in the single-receive antenna configuration (SRA), leading to the same half range swath extent. Full (quad) polarization products are available in the same flavors as the SM basic products, i.e., as SSC and MGD, GEC, EEC SE/RE variants [
14].
In case of ATI acquisitions, the same polarization is used for transmitting and receiving. The separated phase centers of the fore and aft antenna segments generate a baseline in flight direction, which can be exploited e.g., for ground moving target indication (GMTI). Acquisitions may either use a high PRF setting, and thus a reduced swath width as for fully polarized acquisitions or a low PRF setting resulting in a range extent similar to the single polarization acquisitions. The high-PRF variant is more suitable for GMTI applications, such as traffic monitoring due to its wider unambiguous velocity measurement range. Thereby, the signal-to-clutter ratio is increased allowing for an improved tracking of moving objects in stationary clutter. The ATI products are available as SSC only. Besides the two separate images for the fore and aft antenna segments, the data are also processed to a nominal SRA SSC, and the delivered products thus contain three SSC channels, a SRA image, and the two DRA images.
The effective along-track baseline between the two DRA phase centers of this mode is in the order of 1.2 m only. Thus, its unambiguous ATI phase cycle corresponds to up to 200 m/s Doppler velocity, and it is hence most suited for velocity measurements of fast moving objects. Besides being designed for traffic and vessel detection, it is still sensitive enough to also derive large scale ocean surface current velocity fields (see e.g., [
21]). Experimental products from the DRA configuration are offered in DLR’s Earth Observation Data Service EOWEB under the heading
TSX-1 Experimental Products in the collections
TSX-1.SAR.L1b-Stripmap-Quadpol (830 acquisitions) and
TSX-1.SAR.L1b-Stripmap-ATI (128 acquisitions), respectively.
3.3. TerraSAR-X-Like Products
In the pursuit monostatic campaign of the TanDEM-X mission in 2014/2015 (see
Section 4.2), scientific and operational TanDEM-X mission acquisitions were commanded on both satellites to acquire the same swath on ground with a time lag of about 10 s corresponding to their along-track separation in space. Unlike the bistatic acquisitions that were performed in the nominal TanDEM-X close formation that require specific commanding with synchronization pulse exchange and additional calibration sequences, this raw data is very similar to the one of nominal TerraSAR-X mission acquisitions. The TSX/TDX pairs were thus screened and processed by an upgraded TMSP to generate the so-called TerraSAR-X-like products and make them accessible to the TerraSAR-X user community.
The TerraSAR-X-like products are not subject to the basic product specification, since they do slightly differ in terms of product performance. TerraSAR-X-like products are available in all nominal TerraSAR-X mode variants, and in most cases, the deviations in performance parameters are negligible. For Stripmap data, the TanDEM-X elevation beams have been used in some conditions that are optimized for coverage and not for radiometric performance. In TanDEM-X commanding, also the near range beams use a 100 MHz range bandwidth instead of the nominal 150 MHz. In combination with different approaches for radar timing (PRF selection), these products may thus miss the specified radiometric looks and ground range resolution of 3 m for small incidence angles. Despite these small discrepancies, the available data opens new fields of application exploiting the time lag with nominal TerraSAR-X product analysis tools e.g., for ship motion measurements and other change detection methods.
4. Dedicated Mission Campaigns
4.1. DRA Campaigns
The parallel activation of the primary and redundant receiver chain to obtain experimental quad polarization products and complex ATI products is performed within dedicated campaigns. Since the DRA operation imposes specific further constraints w.r.t. the on-board data acquisition, recording, and downlink when compared to the SRA operation, ordering and planning of DRA acquisitions is done centrally inside the ground segment for pre-selected test sites. The resulting data are then made available for user product ordering from the catalog.
The first DRA campaign lasted for three cycles (33 days) from 11 April until 13 May 2010. Since no SRA data can be acquired while downlinking data in DRA mode, the by then newly built-up station ISSF with the DLR antenna and equipment was used for data reception. Thus, the impact on data acquisition (both SRA and DRA) over Europe and the downlink of SRA data to NSG was kept at a minimum. In total, 356 SM quad pol and 163 SM single pol (ATI) acquisitions are available for user catalog ordering from this time period.
The second DRA campaign was conducted as part of the TanDEM-X Science Phase, starting at 18 November 2015 and ending at 11 February 2016.
4.2. Modifications Induced by TanDEM-X Science Phase
After completion of the TanDEM-X global DEM data acquisition phase, the time period from 9 October 2014 until 2 February 2016 was dedicated to the achievement of the secondary TanDEM-X mission goal, the generation of radar products for a number of new science and technology related applications. Specific flight formation configurations, which realized various along-track and across-track baseline conditions, were chosen in response to the needs of given applications. A second DRA campaign was conducted. This had a number of direct impacts onto the TerraSAR-X mission operation and led to further modifications inside the ground segment [
12,
22].
4.2.1. Pursuit Monostatic Phase
From 19 September 2014 until 17 March 2015, TSX and TDX were flying in pursuit formation with an along-track separation of about 76 km (10 s). In such a configuration, the two SAR instruments can transmit radar signals in parallel without mutual interferences. For images that were taken by TDX, appropriate time delays and roll angles are applied during commanding to correct for the Earth rotation effects within the 10 s time lag. The parallel operation of both the instruments opens a number of new opportunities, e.g., imaging the same scene within 10 s or enlarging the imaged area based on neighboring or overlapping (either in along-track or across-track direction) data takes.
Also, the downlink of both satellites may be operated in parallel. By using two receiving antennas, the downlinked data amount could be nearly doubled at NSG. However, for stations that were equipped with one antenna only, data downlink has to be restricted to one satellite, since TSX and TDX are too far apart to be tracked together, but too close to be tracked one after the other. Either the satellites were used in an alternating manner or a given station was fixed to a given satellite.
4.2.2. Large Horizontal Baseline Formation
Following the pursuit monostatic phase, TSX and TDX returned to a close formation for bistatic data taking under large cross-track baseline conditions. A maximum horizontal separation of about 3.6 km was reached in the extreme at the equator. Thus, TerraSAR-X acquisitions that were performed by TDX were possibly taken outside the reference orbit tube leading to slightly different product characteristics. Therefore, the so-called preferred satellite concept was introduced. In case that the nominal perpendicular baseline between TSX and TDX exceeds a given (configurable) threshold and if the available resources like memory and downlink capacity allow for it, a scene is taken by TSX (presuming that the user order allows for both, TSX or TDX for the acquisition). In summary, four different satellite selection options are offered for ordering. Orders can specify the TSX satellite for data taking when the observation of the reference orbit tube is needed. TDX is chosen if one wants to explicitly exploit large baseline situations. No satellite is pre-selected, but preference should be given to TSX. Both TSX and TDX are accepted, if no TSX preference is needed. Hence, the user needs were observed as best as possible, while still allowing for mission planning a good load balancing between TSX and TDX.
5. Radar Experiments with TerraSAR-X
The high flexibility provided by TerraSAR-X allowed for research in and demonstration of new SAR modes. The Staring Spotlight mode and the wide-ScanSAR mode were demonstrated and were further developed to fully operational TerraSAR-X modes. Other examples are TOPSAR, BiDiSAR, and Wrapped Staring Spotlight, which were demonstrated by TerraSAR-X.
5.1. Prerequisite: Flexible Instrument Commanding
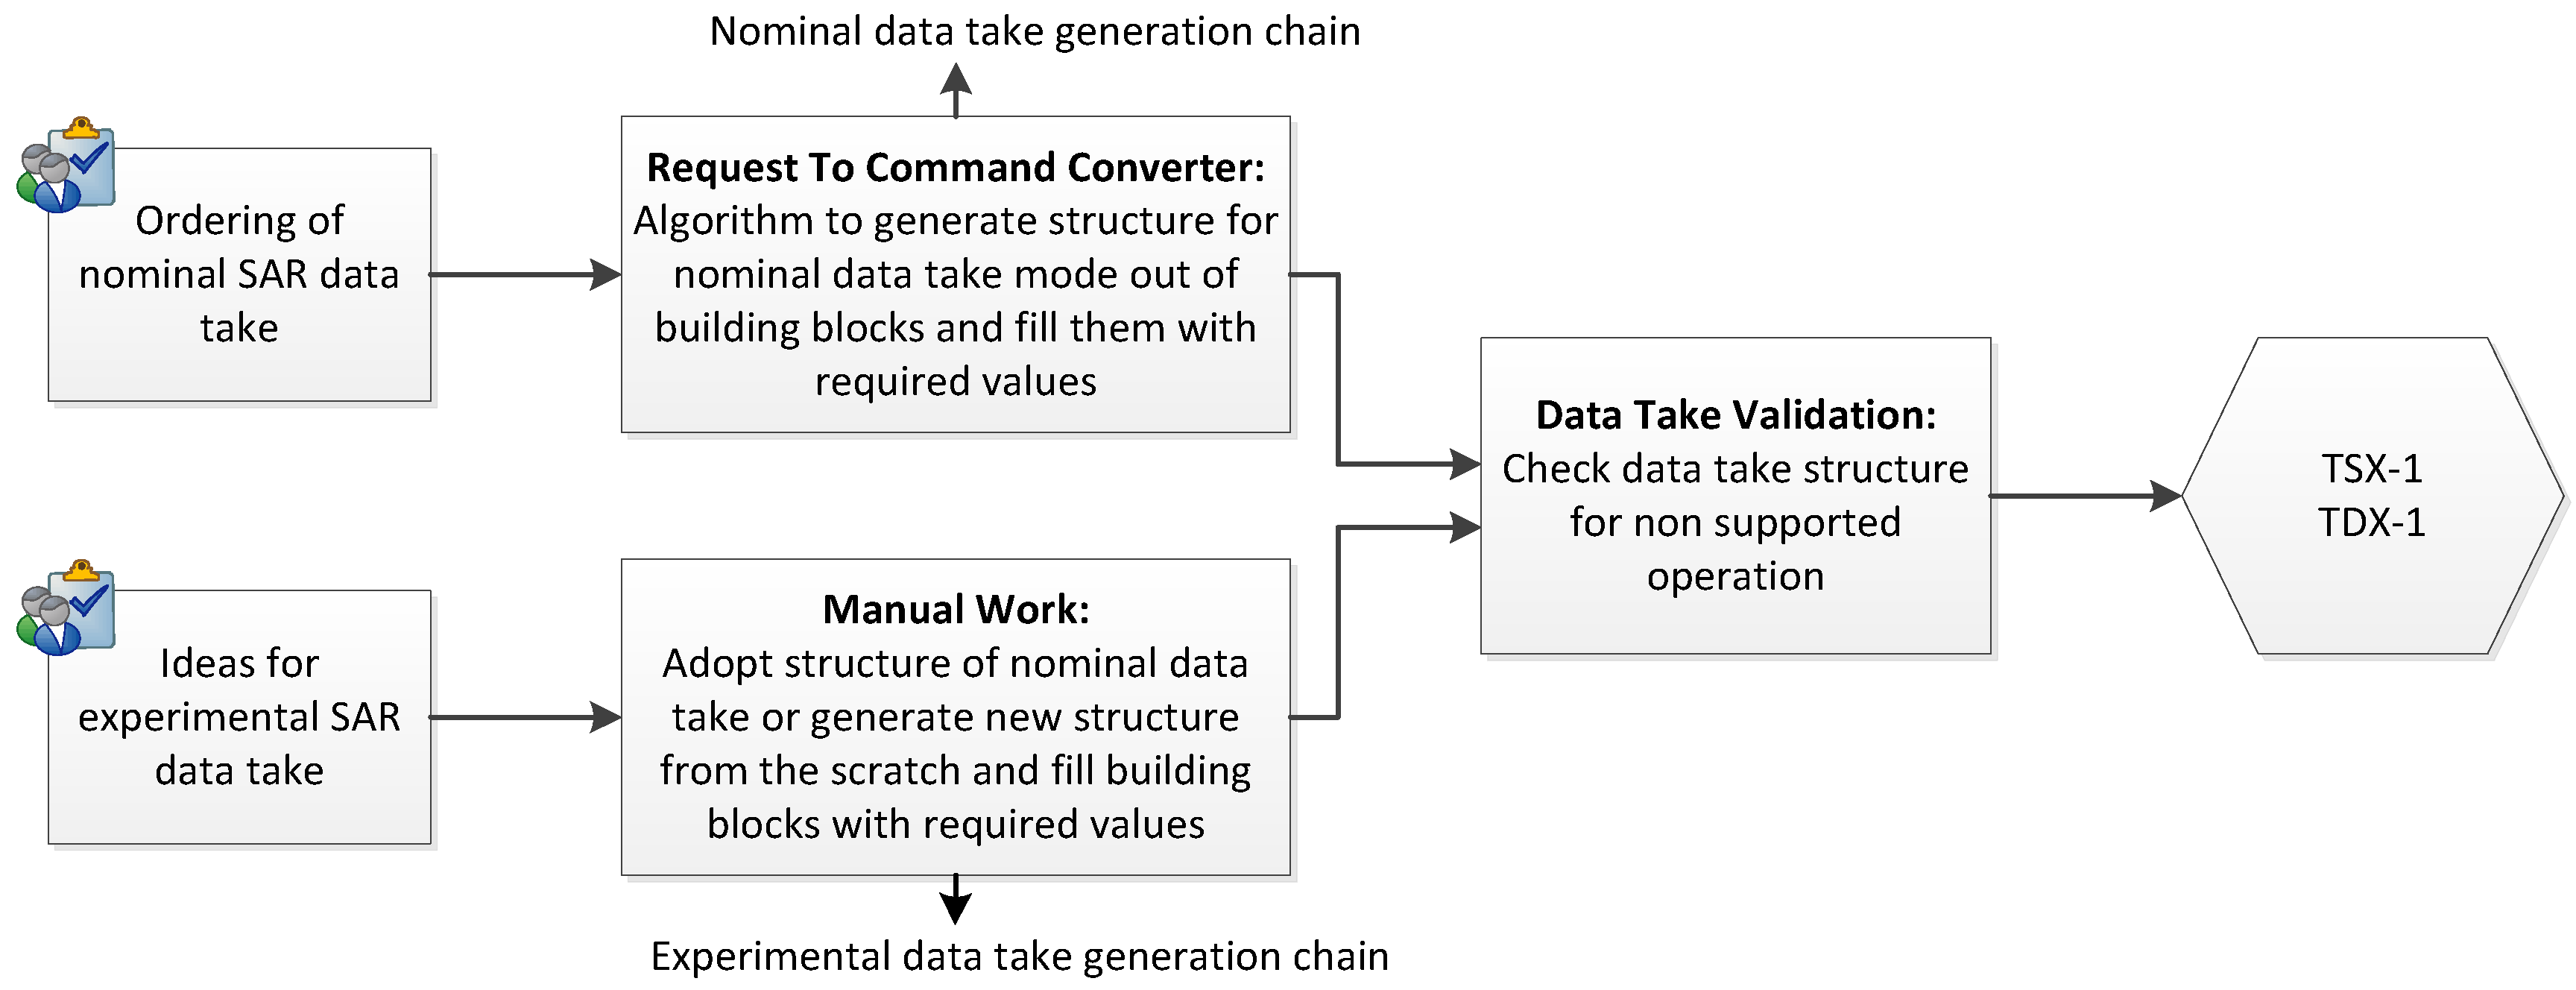
The flexible instrument commanding in combination with a homogenous order chain for standard SAR data takes, as well as for experimental data takes, also called system data takes, enables the mixed operation for both types of data take within the same timeline, see
Figure 3. The configuration of the SAR instrument does not have to be changed, since both, nominal and experimental data takes contain similar building blocks. This approach enables the development, test, and optimization of a new SAR mode with the final operational settings.
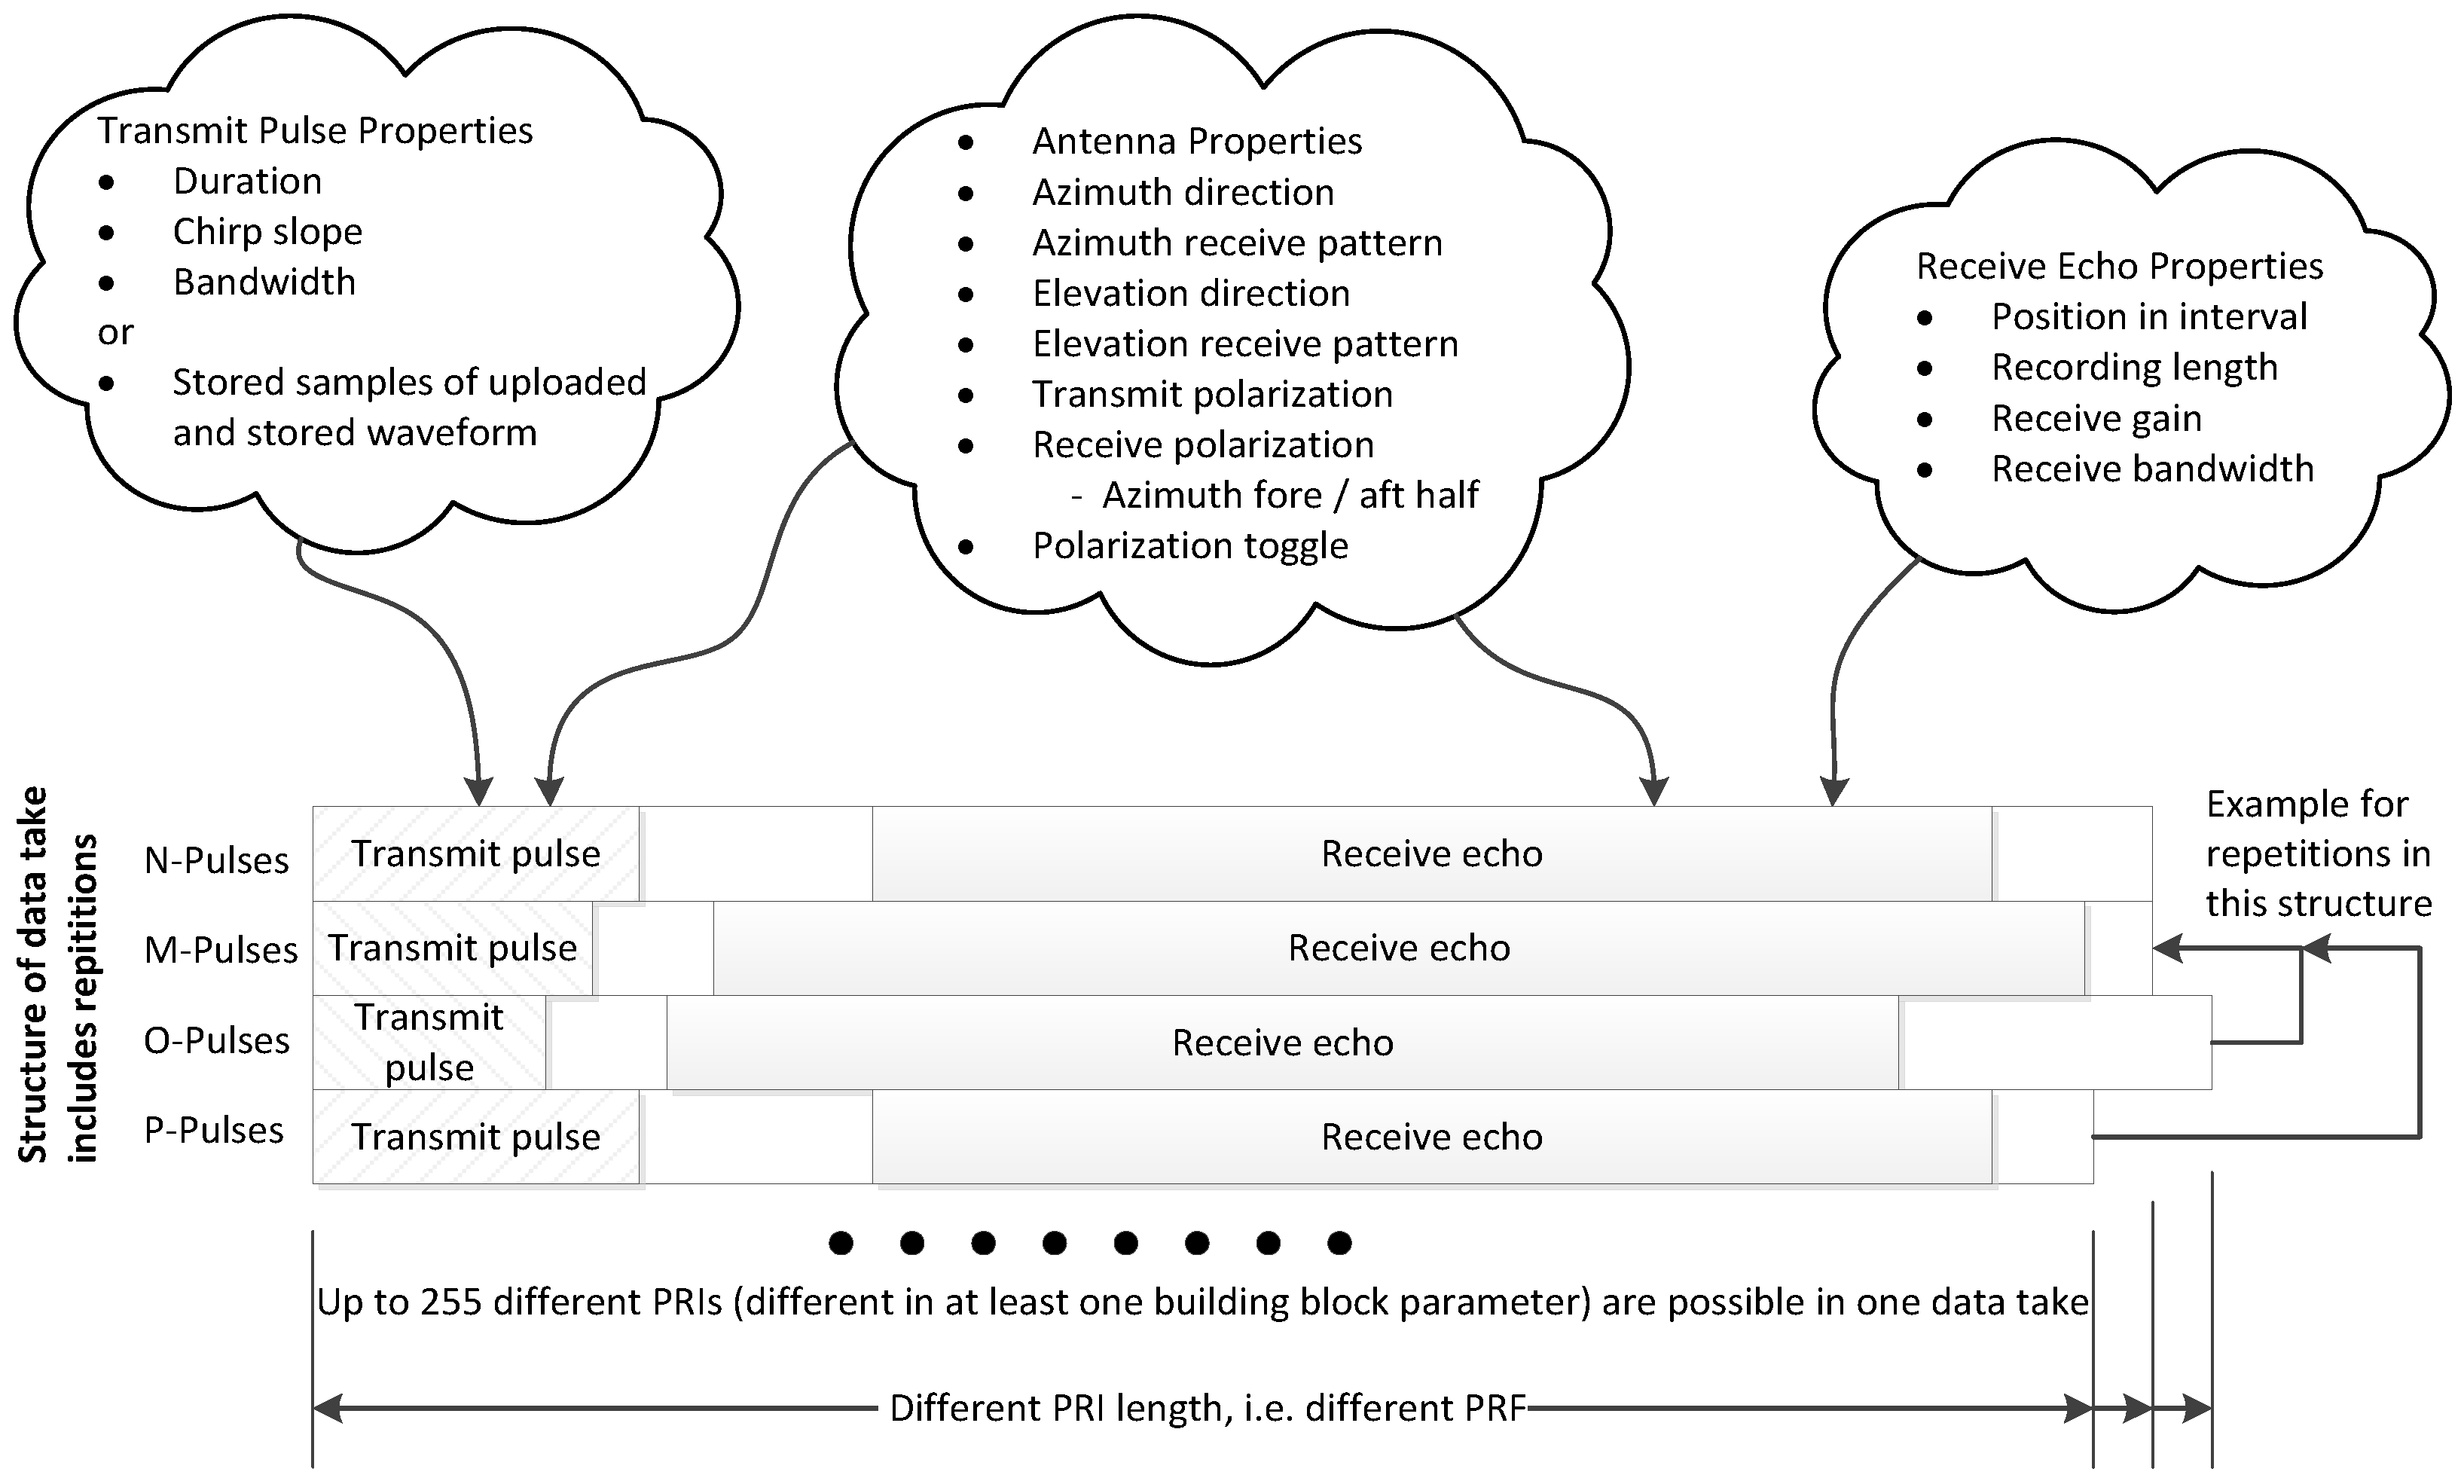
The flexible data take commanding is provided by the combination of four main building blocks. One building block describes the pulse to be transmitted (see
Figure 4 for a set of parameters describing the pulse). Up to eight different pulses can be used within one data take. Another building block controls the echo window w.r.t. position, length, receive gain. Transmit and receive parameters can be changed from pulse to pulse. The third building block controls the antenna beam direction, pattern, and polarization. In general, the shortest change interval between two antenna settings is some milliseconds, but one selected set of antenna parameters can be changed from pulse to pulse. Up to 127 different antenna settings can be applied during one data take. A switching between H and V antenna polarization from pulse to pulse (toggling) is controlled by a parameter within the antenna properties. The controlling flag for polarization toggling can be set for transmit and receive independently. The fourth building block contains the control parameters for the structure of the data take, e.g., the number of pulses for which the radar is operating with the same radar settings. Sequences of radar settings can be repeated several times. Therefore, this repetition feature enables a convenient commanding of sub-swathes in ScanSAR data takes. The following chapters illustrate the wide range of useful applications utilizing the flexible instrument commanding.
To build an along track interferometer with just one receiving chain, the ability of pulse to pulse switching between two antenna settings with different receive azimuth apertures is used. One pulse is received with a dedicated part of the antenna in flight direction (fore part); the next pulse is received with the part that is opposite to the flight direction (aft part). The echoes that were received by both parts are SAR processed separately and result in two SAR images with a baseline in flight direction. This mode is called Along Track Interferometer Switching (ATIS).
The six-beam wide-ScanSAR mode (see
Section 3.1) uses the ability to transmit dedicated pulses for each sub-swath, where the transmit bandwidth is optimized for constant radiometric performance over the full incidence range. With this, only the receiving noise of the transmitted bandwidth contributes to the image noise and the signal to noise ratio is increased.
TOPSAR (see
Section 5.3) data takes demonstrate the flexibility in commanding both, azimuth and elevation antenna steering, and the repetition of this structure. This mode reaches the limit of the current TerraSAR-X instrument design in using the maximum number of antenna settings, since each azimuth and elevation combination counts as one setting for the data take.
5.2. Staring Spotlight
The azimuth steering angles of TerraSAR-X were initially kept below ±0.75°, especially in the sliding spotlight modes. Up to this limit, the impact of the grating lobes is tolerable as their antenna gain keeps 20 dB below the gain into the desired steering direction. The azimuth resolution for TerraSAR-X has been enhanced by commanding staring spotlight with steering angles up to ±2.2°. In this post-launch introduced operational TerraSAR-X mode, the azimuth resolution is about 20 cm and it improved by a factor of 5 when compared to the sliding mode HS of TerraSAR-X. The problem that was connected to the enlargement of the steering angles is the grating lobes increase. As
Figure 5 shows, for a steering angle of 2.2°, the largest grating lobe in red shows equal gain as the steered lobe in green. In order to maintain the SAR performance in the presence of strong grating lobes, two main incidence angle dependent adaptions were introduced, i.e., a PRF optimization in commanding, and a scene size optimization in the SAR processing [
23,
24,
25].
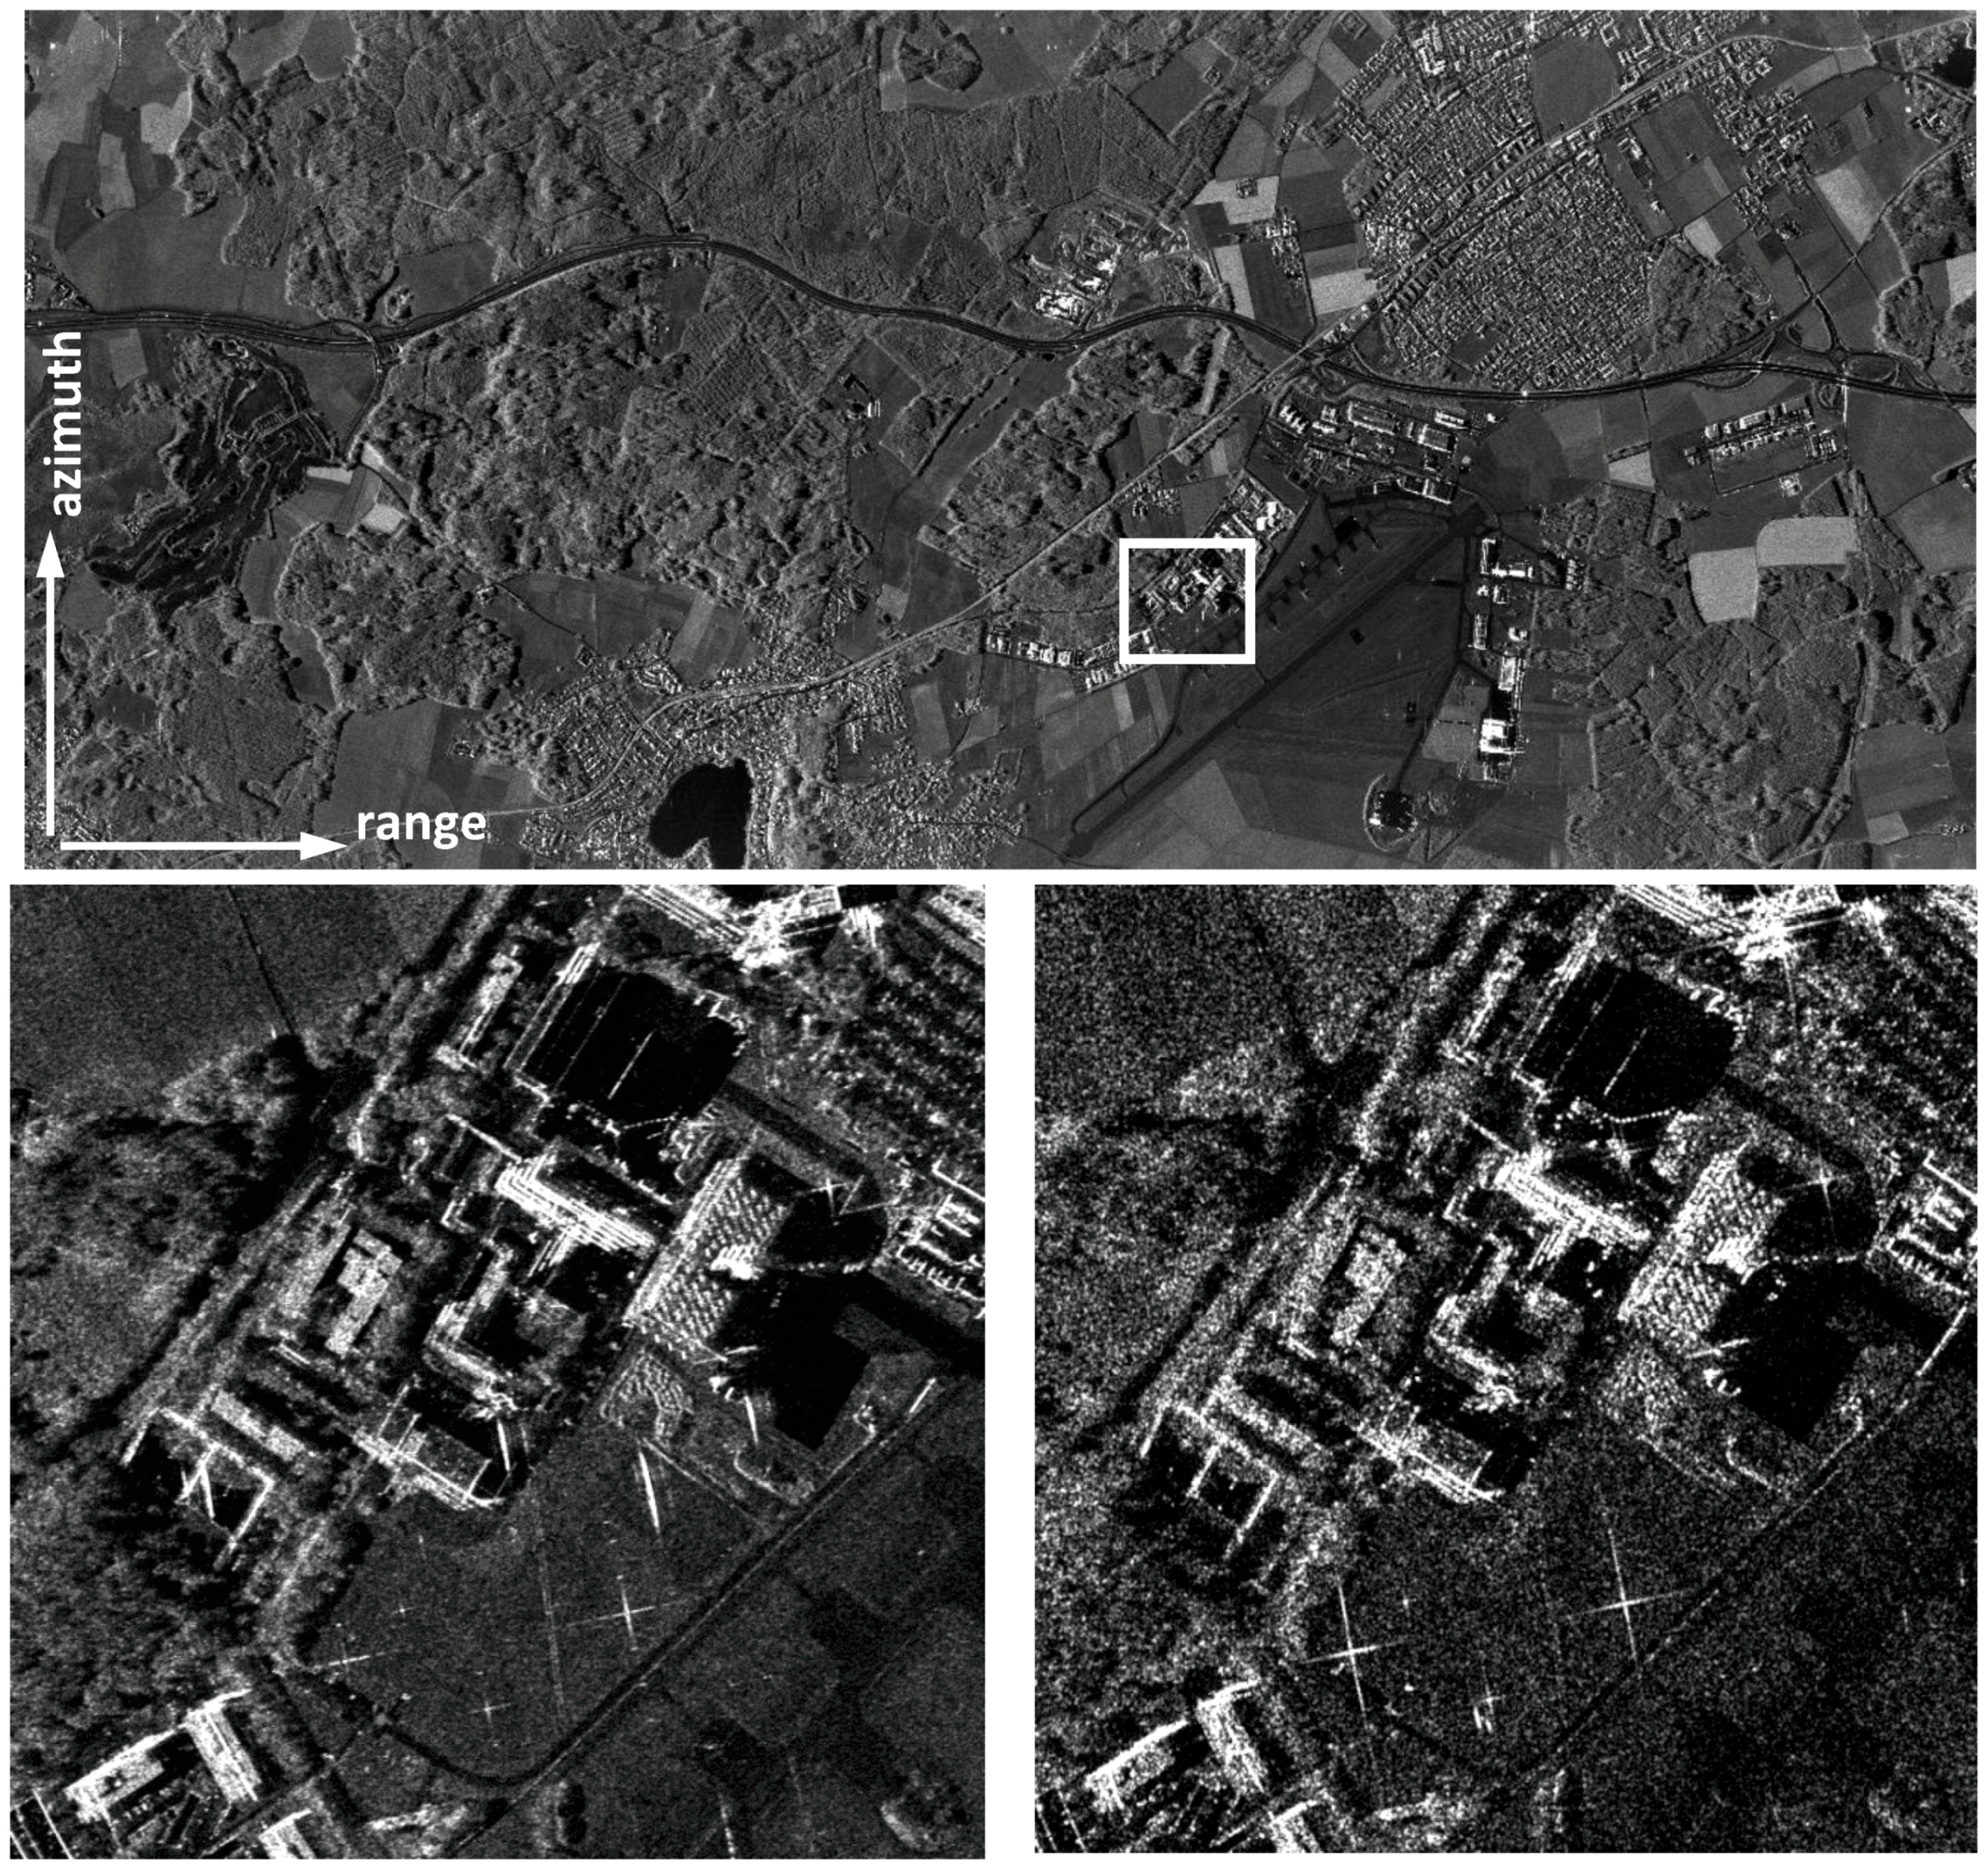
Figure 6 shows an example staring spotlight image that was acquired at the test site at DLR in Oberpfaffenhofen, Germany. The corner reflectors in the scene were used to verify the expected geometric resolution, which was found to be within 2% of the expected values. From the comparison of a zoom into the staring spotlight image with the corresponding zoom into a 300 MHz HS sliding spotlight image, the improvement that was achieved by multilooking five azimuth looks is obvious, and the higher level of detail is apparent.
5.3. TOPSAR
TOPSAR is a burst mode like ScanSAR that allows for the quasi-parallel acquisition of several sub-swathes and by this the acquisition of a much wider total ground swath at the expense of a reduced azimuth resolution. The TOPSAR mode overcomes limitations that are imposed by the ScanSAR—the most prominent is the scalloping effect—by steering the antenna along-track during the acquisition of a burst. In this way, all for the targets are illuminated with the complete azimuth antenna pattern, and thus, scalloping is circumvented and an azimuth dependency of signal to noise ratio (SNR) and distributed target ambiguity ratio (DTAR) is avoided, or at least considerably reduced. TOPSAR was demonstrated with TerraSAR-X in the year 2007 [
26].
Different TerraSAR-X images have been acquired over Toulouse, France, in order to perform a scalloping analysis in the TOPSAR and ScanSAR modes.
Figure 7 presents one sub-swath from the TOPSAR and ScanSAR acquisitions that were processed
without the nominally applied scalloping correction in the processing. The azimuth resolution in the images is 16 m. About five range looks were processed, resulting in 16 m ground range resolution. The sub-swath size is approximately 90 km in azimuth and 25 km in slant range. No weighting has been applied in the burst image overlap area.
The TOPSAR image sub-swath that is shown in
Figure 7a was acquired with nine bursts. The commanded steering angle is in-between ±0.52°. Due to the low variation of the steering angle, the scalloping effect is hardly visible and it was quantified to be approximately 0.3 dB. It is not fully zero as electronic azimuth steering is implemented in TerraSAR-X, i.e., the element pattern is not steered and it causes a residual scalloping. The ScanSAR image was acquired with 33 bursts. The measured scalloping in the ScanSAR intensity profile is around 1.2 dB.
5.4. BiDiSAR
The newly developed bidirectional synthetic aperture radar (BiDi) imaging mode [
27] was demonstrated with TerraSAR-X. Bi-directional means the simultaneous imaging of two directions by one antenna into one receiving channel. The BiDi imaging is based on an azimuth pattern with two steered lobes that are pointing into different directions, an increased PRF, and a separation of the simultaneously received images in the Doppler spectral domain.
Figure 8 shows the BiDi acquisition geometry for simultaneous forward and backward acquisitions in the directions ψ
fore and ψ
aft, respectively. The slant range vector in the forward direction is oriented by 90° − ψ
fore w.r.t. azimuth. In the backward direction, the slant range vector is oriented at 90° + ψ
aft. The same target area is acquired twice as the sensor flies by with an along-track separation in the range of sections in-between the two illuminations.
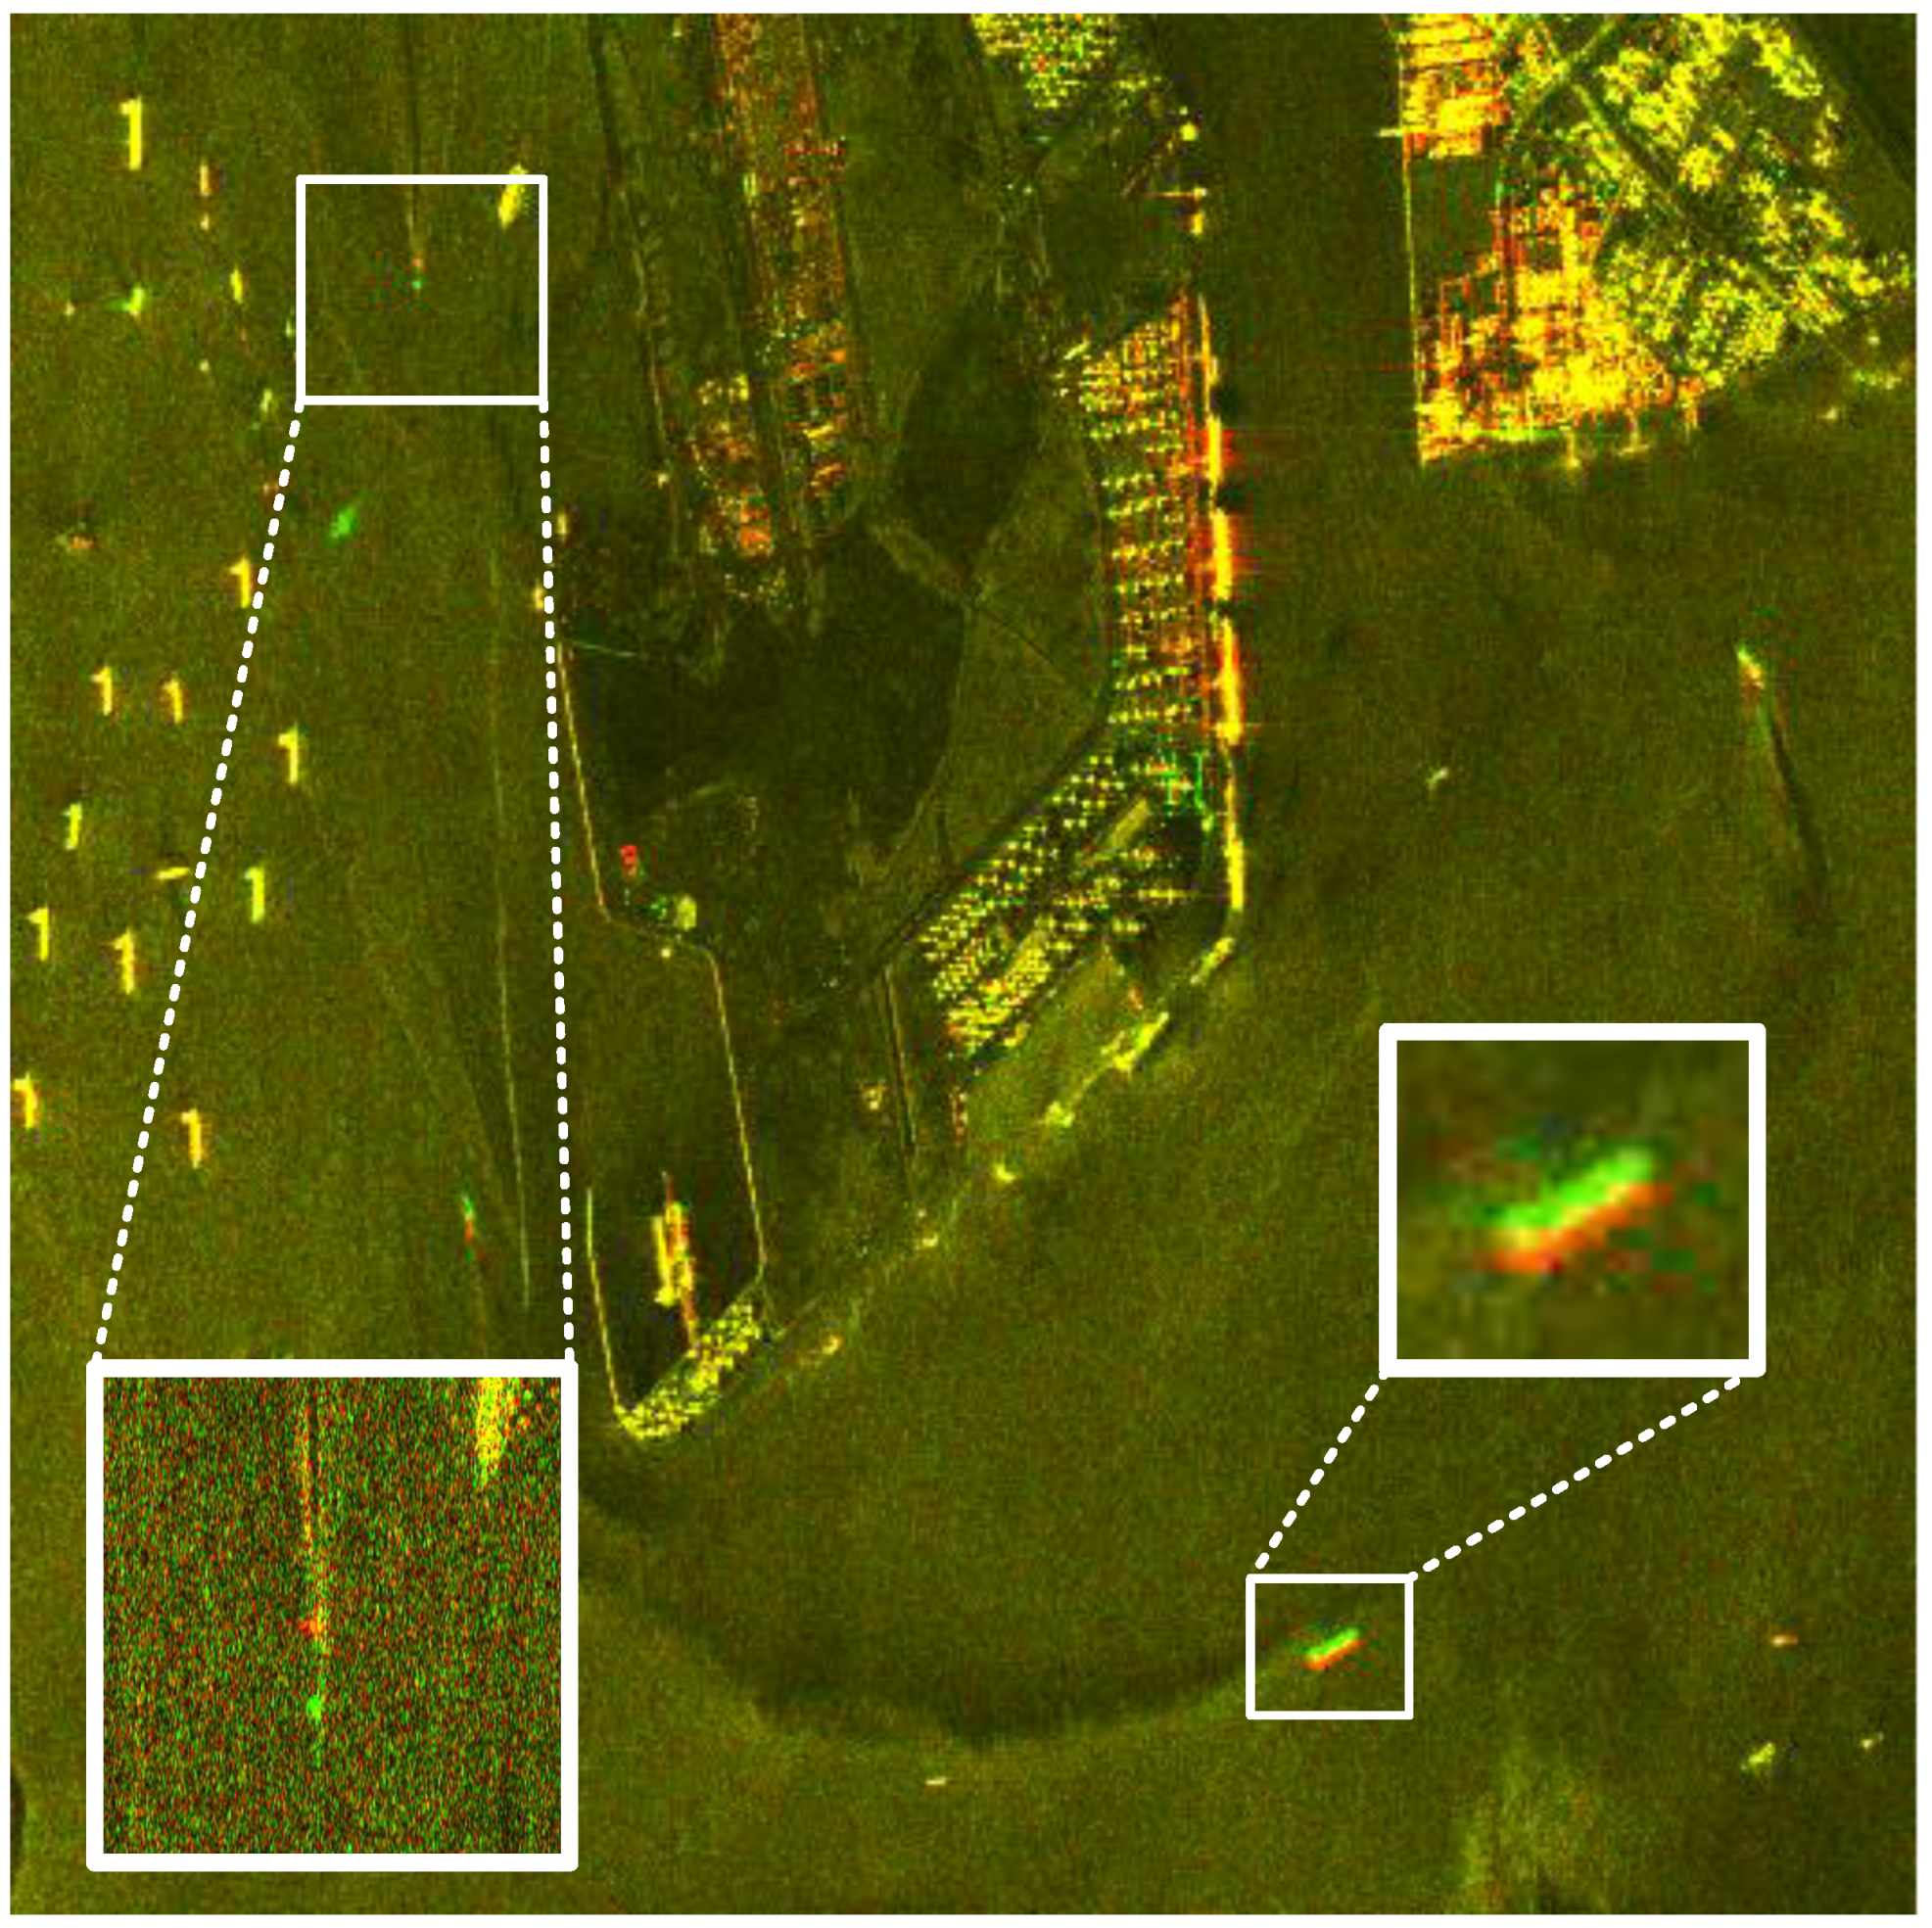
Figure 9 shows an excerpt of a larger BiDi acquisition in the form of a color composite. The fore image is in red and the aft image in green color. At positions where the backscatter is high and is equal in both images, the colors combine to yellow. There are a number of nonmoving manmade targets that already show a considerable difference in the backscatter due to the acquisition azimuth angle difference of 4.4°. The motion of some ships is clearly visible as they appear partially in red and green, as the ship moved between the two illuminations.
5.5. Wrapped Staring Spotlight
Wrapped Staring Spotlight [
28] is a new method to extend the azimuth steering capability of phased array SAR antennas in order to achieve improved azimuth geometric and/or radiometric resolution. It extends the steering to directions with very low signal contribution. Point and extended targets in experimental TerraSAR-X acquisitions were evaluated up to ±4.4° steering, i.e., gains up to 45 dB below the grating lobes. It was found that, for TerraSAR-X, an extension of up to about ±3.9° improves the image quality although the cost-benefit ratio decreases with increasing steering angles.
One innovation developed is the Wrapped Commanding of steering angles.
Figure 10 shows in green the lobes into desired steering direction and in red the undesired grating lobes. Up to ±2.2°, the on-board available angles can directly be used. Beyond, larger steering angles are obtained—without the need of additional on-board stored azimuth patterns—by re-accessing available angles, and later extraction of the desired steering directions in the SAR processing.
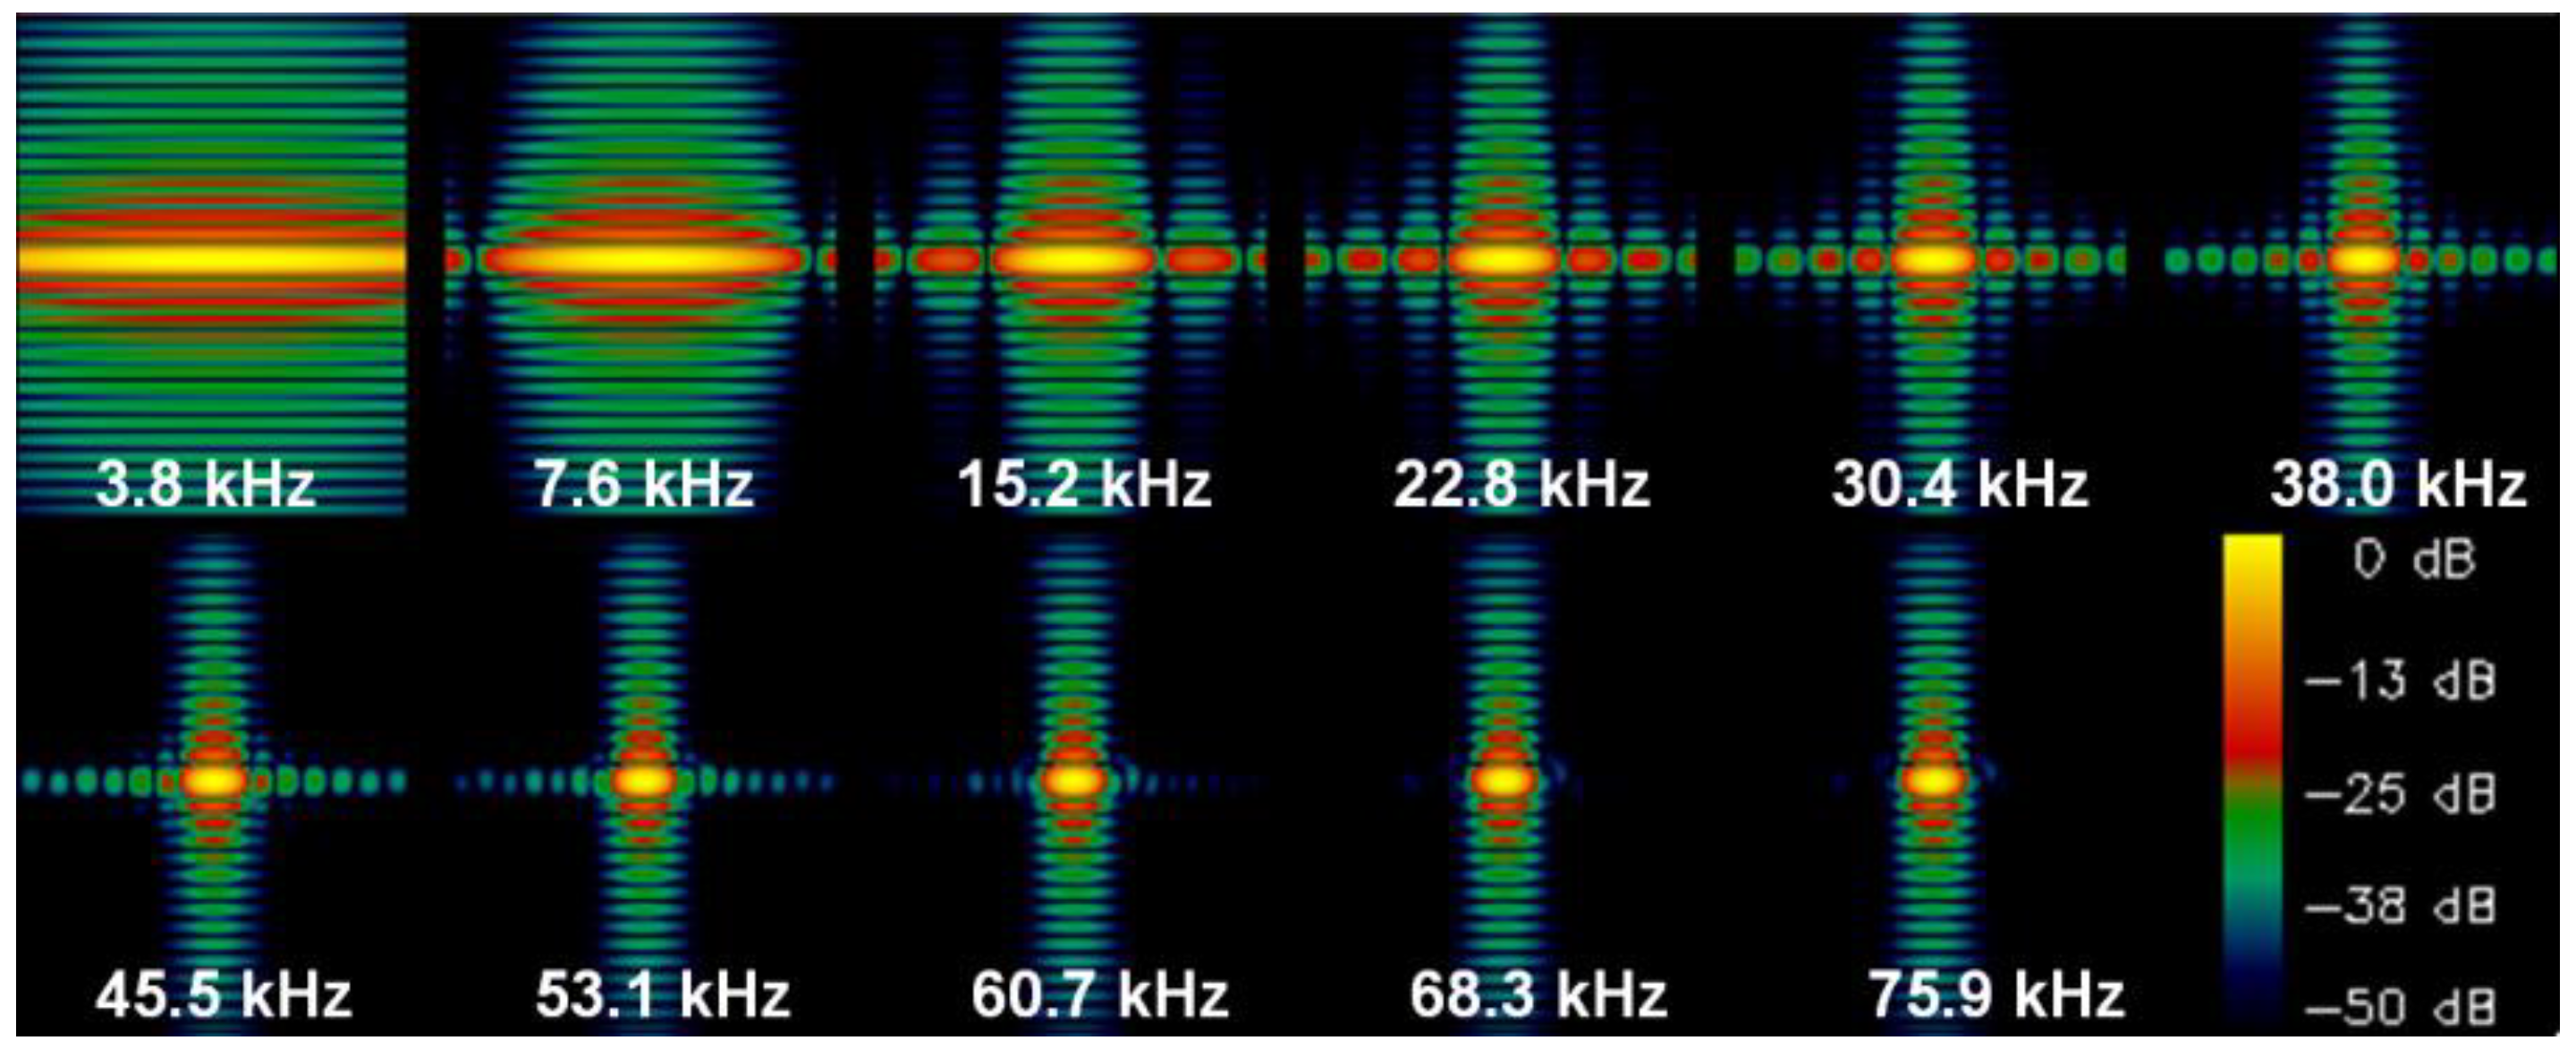
Figure 11 shows wrapped corner reflector measurements. The azimuth resolution is steadily improving with increasing processed bandwidth up to 0.14 m, i.e., 68 kHz or ±3.9° in the case of sidelobe suppression weighting. For comparison, the staring spotlight mode of TerraSAR-X exploits only 38 kHz (±2.2°). Two statistical approaches were developed [
28] that improve the radiometric performance when integrating signal directions with low SNR, i.e., the space invariant Look-Normalized Pattern Compensation (LNPC) and the space variant Ω-weighting. It was demonstrated that in wrapped TerraSAR-X imaging up to ±4.4°, the contrast for manmade targets was improved by 20%, and for extended targets, an improvement in the equivalent number of looks from two to four looks was measured.
6. Satellite Operations
For a period of three years, TSX was operated as a single satellite mission in 514 km altitude. In 2010, a transition to a dual satellite mission needed to be accomplished and even more in October 2010 the two spacecraft entered into a close formation with inter satellite distances in the order of few hundred meters. The close formation flight posed a major challenge for satellite operations. Concepts needed to be developed in order to cope with safety aspects.
One major point of interest was the original safe mode concept of TSX. A satellite safe mode is typically entered by on-board automatic reactions in the case that a malfunction is detected. The original TSX safe mode used thrusters for attitude control in order to profit from the high reactivity of these actuators. Unfortunately, due to the thrusters’ orientation attitude controls came along with the side effect of an unintended orbit change. Investigation showed that a safe mode drop might result in a potential collision risk of the spacecraft in orbit, which was not acceptable. As a consequence a multiple stage safe mode concept has been newly developed. The primary safe mode is now based on magnetorquers, which do not alter the relative orbit of TSX and TDX. In the case of an insufficient reactivity, further stages within the safe mode concept are applied, using thrusters in a more controlled way from the perspective of formation flight. The on-board safe mode has been implemented by the satellite manufacturer; however, this major concept change affected satellite operations in a profound way. Many flight procedures needed to be reworked, major on-board software updates became necessary, and in-orbit tests of the safe mode concepts before entering close formation have been performed.
Another major challenge to be mastered is to ensure that the two satellites do not illuminate each other when transmitting a radar beam, as this could result in an irreparable damage of the partner satellite. A well-thought-out concept was established to comply with this requirement during nominal operation, but in particular, during on-ground or on-board caused contingency situations. For the latter one, the so-called Sync-Warnings were implemented. These are isochronal instrument activities on both satellites with a bidirectional exchange of sync pulses via one of six sync horns. In case one of the satellites gets no feedback from the other (i.e., the state/position of the other satellite is different to the predicated one), its instrument is switched to receive-only mode. In order to reduce the mutual illumination risk to a maximum extent during nominal operations, the so-called transmit exclusion window information is delivered to both mission planning and the mission control and monitoring system. This double layer check on ground prevents firstly planning, and secondly, the commanding of possible hazardous activities in forbidden areas. In addition to these ground based measures, the on-board exclusion zone mechanism was implemented, in order to prevent the execution of possible hazardous activities in such areas. See [
29] for a detailed description of all TanDEM-X formation flight operation related aspects.
Figure 12 illustrates acquisition activities, the on-board memory fill level, together with the downlink activities for the TerraSAR-X mission and the TanDEM-X mission for about one day. The combined mission planning system enables the concurrent support of the two missions by the two spacecrafts. In order to minimize the impact of the two missions on each other a balanced downlink planning strategy was implemented. The fact that the size of the on-board memory of the two spacecraft differs by the factor of two and the necessity to support the TerraSAR-X near real time feature with its prioritized downlink make the downlink planning even more challenging.
The design of the TSX and TDX spacecraft targeted in both cases for an in-orbit lifetime of 5.5 years. These days, TSX has completed ten years and TDX seven years in orbit. Both spacecraft are still fully functional; SAR operations do not suffer any restrictions due to on-board hardware failures. Furthermore, the state of depletion of consumables gives reason to expect many more years of satellite operations. For example, the measured capacity degradation of the batteries is much less than predicted for the age that the spacecraft have now reached.
Figure 13 details the hydrazine consumption of TSX and TDX. In both cases, approximately half of hydrazine budget is still available for future use. So far, the phases directly after launch (2007 for TSX and 2010 for TDX) were expensive in terms of hydrazine usage for attitude control after separation and for orbit control to adjust the target orbit. In 2008, a safe mode drop on TSX caused an unusually high yearly budget. In those days, the safe mode still used thrusters primarily for attitude control, as described above. Generally, TDX uses more hydrazine because of its helix formation flight relative to TSX. The consumption was remarkably high in the years 2014 and 2015 due to the specific formations that were required in the TanDEM-X science phase.
Beside the primary payload, the SAR instrument, TSX carries secondary payloads, namely a laser communication terminal (LCT) by Tesat-Spacecom GmbH & Co. KG (Backnang, Germany) and a two frequency GPS receiver IGOR, as supplied by the Deutsches GeoForschungsZentrum (GFZ). The latter is also mounted on TDX, and is classified in this case, as primary payload due to the strengthened requirements of the TanDEM-X mission on absolute and relative orbit determination. Both additional payloads showed a very good performance in orbit. On 21 February 2008, the LCT on TSX communicated with a counterpart of the NFIRE satellite, the very first inter-satellite communication with laser technology in Low Earth Orbit.
7. Orbit Control
The TerraSAR-X mission design is relying on the reference orbit, which forms the basis for both orbit control and mission planning, including the scheduling of SAR acquisitions. In contrast to traditional design considerations for Sun-synchronous, frozen eccentricity repeat orbits, the TSX reference orbit must be a closed orbit with matching states at the beginning and end of each 11-day repeat cycle. Therefore, the reference orbit design was formulated as an optimization problem [
30]. The implemented TSX reference orbit is expressed in an Earth-fixed frame, and it can be repeated in 11-day intervals throughout the entire mission.
The high requirements on guidance, navigation, and control are mainly driven by SAR interferometry. In order to permit repeat-pass interferometry applications, like subsidence mapping or glacier monitoring, the cross-track distance between radar acquisitions in repeated orbits should be as small as possible. Depending on the availability of digital elevation models, which are used to compensate topographic effects, cross-track distances below 350 m are desirable. Hence, the TSX osculating orbit is controlled within a “tube” that is defined about the Earth-fixed reference orbit. In order to fulfill the requirements, the radius of the “tube” is set to 250 m, which corresponds to the maximum allowed deviation of TSX from the reference orbit in the plane perpendicular to the flight direction. The implemented TSX orbit control concept is described in [
31].
Within ten years of TerraSAR-X operations, more than 1400 orbit control maneuvers have been performed. With increasing solar activity strong variations in solar flux and geomagnetic activity occurred, which significantly affected the air density, and hence the orbit decay.
Figure 14 (top) depicts the F10.7 cm solar flux evolution, which serves as an indicator for the solar activity, over the years 2008 to 2017. The diagrams below summarize all of the in-plane maneuvers that were performed in the same period (middle) and the achieved cross-track deviation from the reference orbit (bottom). Obviously, during low solar activity in 2008 and 2009, the maneuvers were relatively small (≤1 cm/s) and the typical period between two successive maneuvers were 10 to 14 days. In contrast, maneuvers with sizes of up to 5 cm/s and maneuver cycles of two to three days became necessary to precisely control the TSX orbit during periods of high solar activity, e.g., at the end of 2011 and in 2014.
At the end of 2015 a novel orbit control strategy called “distributed formation flying” was tested and it has been operationally implemented since February 2016. Since then, TSX has contributed to the formation maintenance by means of a small but daily orbit raising maneuver in the order of 3 to 6 mm/s, depending on the formation geometry. In this way, the formation flight for TanDEM-X can be fully supported although the cold-gas, which was previously used by TanDEM-X for formation maintenance, has been almost depleted. Furthermore, the TerraSAR-X orbit control accuracy is not negatively influenced, as can be seen in the bottom of
Figure 14. The daily orbit raising partially balances the natural orbit decay. However, additional orbit lowering and eccentricity correction maneuvers are necessary in order to stay within the 250 m control tube. These maneuvers are in anti-flight direction and they can be seen in the middle of
Figure 14 as negative spikes in 2016 and 2017.
Note the negative in-plane maneuvers before 2011 have a different cause. The original satellite safe mode implementation made use of the thrusters for coarse attitude and rate control. Safe mode drops, e.g., because of an on-board computer boot, changed the orbit and the maneuvers for the re-acquisition of the reference orbit became necessary. Fortunately, the on-board software was upgraded at the end of 2010 to feature a force-free safe mode based on magnetorquers, as described in
Section 6.
Besides the drag make-up maneuvers, three to five inclination control maneuvers are performed per year, with maneuver sizes between 10 and 30 cm/s. Furthermore, every year, one to two critical close approaches with man-made objects require active collision avoidance. In summary, the implemented reference orbit and the orbit control concept have proved to work remarkably well, and more than 99% of the time TSX has been staying inside the 250 m control tube.
8. Performance Monitoring
The quality of the delivered data is the most important benchmark of a SAR mission. Strong effort has to be undertaken, in order to ensure a stable quality of the system and resulting data. For this purpose, a verification and monitoring system was implemented in TerraSAR-X and TanDEM-X. With the short term analysis of instrument telemetry data and all data takes executed during the mission, malfunctions in the satellite systems, and especially in the SAR instruments are detected. Short-term analysis is performed in two different ways: instrument monitoring and data take verification. A long-term monitoring aims on detecting trends and evolutions that may lead to a malfunction in future. These analyses are explained in detail and with examples below.
8.1. Instrument Monitoring
Instrument Monitoring collects and visualizes information about the actual state of the radar instruments and performs automatic checks of measurements against a parameter limit matrix. For that purpose, housekeeping data, which is down-linked via S-band, is checked and analyzed both, automatically and manually, in order to examine instrument health. In critical cases, dedicated procedures are immediately initiated according to the instrument handbook. The instrument-specific housekeeping data is replicated and is stored in a central database, where it is one of the main sources of information for long-term monitoring. The instrument onboard timeline is continuously reviewed w.r.t. data take and command execution state, SAR data downlink history, etc.
8.2. Data Take Verification
The Data Take Verification functionality provides an immediate feedback on data take quality and overall performance of the SAR system after commanding, execution, and SAR screening of the raw data of a TerraSAR-X or TanDEM-X acquisition. It combines information from data take ordering, commanding, as well as the data reception and processing chain, and it therefore provides additional value on top of the regular SAR data screening.
Three main tasks are in the scope of Data Take Verification. The first one is the evaluation of the SAR screening results of an acquisition, where the raw data statistics of in-phase and quadrature channels are checked against predefined quality limits. These checks can identify instrument calibration issues like channel bias or imbalances, but also issues in the commanding like non-optimal receiver gain settings, which would result in insufficient raw data saturation or even overflows in the A/D converters. Another prominent quality parameter is the Doppler centroid that is estimated from the raw data, which is a sensitive parameter for the whole SAR system.
Another check is the completeness of scene coverage w.r.t. the user-requested scene, which depends not only on precise instrument switch-on and switch-off, but also on the correct commanding of the radar echo window. As an example,
Figure 15 shows a control plot for an acquisition in Stripmap mode taken over Morocco. The red polygon indicates the scene, as requested by a user, whereas the green polygon shows the boundaries of the recorded and processed scene.
In the third step of the verification of a data take, or data take pair in the case of a TanDEM-X acquisition, the correct on-board execution of each commanded data take is verified, down to the level of single pulses, via the correlation of the data take command parameters, as generated by the Request-to-Command Converter (R2CC), with the range lines actually being recorded and downlinked by the radar instruments. This check has the potential to identify issues in the complex interleaved commanding of imaging pulses with other instrument-specific pulse types, like warm-up sequences, calibration pulses, and interleaved inter-satellite synchronization in the case of TanDEM-X. It does also provide valuable information in the analysis of issues regarding missing or corrupted range lines in the SAR data.
Throughout the mission, data take verification provided valuable routine monitoring. Due to the reliability of the whole SAR system, major issues were detected in rare cases only. Yet, the system was used extensively during the commissioning phases of the satellites, where it allowed for verifying the SAR system performance and to derive and fine-tune initial calibration parameters.
8.3. Long Term System Monitoring
Long-term system monitoring (LTSM) is an important task to ensure the quality of the SAR products and the appropriate operation of the satellite and the instrument. The LTSM visualizes the most significant parameters of the satellite system.
There are a number of parameters that are checked for each data take in order to monitor the quality of a single acquisition as described in the previous section. In contrast, the LTSM shows the long-term evolution of the system parameters in order to identify trends in the data and to be able to take countermeasures before the occurrence of critical situations.
The most important parameters monitored by LTSM are:
Instrument parameters:
- ⚬
Utilization of the satellites
- ⚬
Quality of the Replica amplitude and the Bias of the In-phase and Quadrature Channel
- ⚬
Calibration parameters like geometrical accuracy or the absolute calibration factor, including antenna pattern accuracy
- ⚬
Status of the Transmit/Receive Modules
- ⚬
Drift of the radar frequency
- ⚬
Drift of the Doppler of the SAR signal
- ⚬
Coverage fulfillment of data takes compared to the user requests
Satellite parameters:
- ⚬
Amount of switches of the traveling wave tube amplifier for X-band downlink
- ⚬
Battery performance and utilization
- ⚬
Bit error rates of the Solid State Mass Memory
Mission parameters:
- ⚬
Mission phases (for information)
- ⚬
SAR outages (for information)
- ⚬
Parameters concerning the TanDEM-X Mission like DEM performance
Figure 16 shows, as an example, the evolution of the In-Phase Channel Bias, as visualized by the Long-Term System Monitoring. The In-Phase Channel Bias is a measure for the correct utilization of the dynamic range of the receivers. A drift of 20% over six years was observed with the long-term evaluation. In June 2014, the origin for the In-Phase Channel Bias was readjusted in the system, and the bias is since then again well centered within the dynamic range.
In general, the TerraSAR-X satellite still performs very well. The quality of the data is as good as at the beginning of the mission, both in terms of overall performance and in terms of radiometric accuracy [
32].
9. TerraSAR-X Mission Utilization
Since the beginning of the operational phase, the number of yearly acquired data takes for basic product generations has been continuously increasing, with only one exception in 2011. When compared to the operations that started in 2008, the acquisitions have almost tripled.
Figure 17 visualizes the yearly numbers per imaging mode. Adding the experimental TerraSAR-X-like products we have close to 226,000 acquisitions which are available for user catalog ordering in EOWEB under the headings
TSX-1 Products, TSX-1 Experimental Products,
TanDEM-X Pursuit TSX-1 Like, and
TanDEM-X Pursuit TSX-1 like Experimental.
The TerraSAR-X mission philosophy to let a user decide which acquisitions are performed under what conditions even comprises data takes taken in left-looking mode. Ordering of these acquisitions is consistently integrated into the nominal ordering and the production workflow. In total, over 3000 left-looking data takes covering all imaging modes were acquired. Of particular benefit are those that were taken at latitude south of −80° over Antarctica [
33].
Figure 18 shows the left-looking Stripmap acquisitions over Antarctica, as executed upon user request.
10. Conclusions
A decade of successful TerraSAR-X operation has proven that the basic design of the overall system, consisting of space and ground segment, is both robust and flexible enough to meet changing requirements and to fulfill the desires of the scientific and commercial community during such a long period of time. Also, thanks to the great commitment of the ground segment team, all of the modifications could be made without any particular disruption or interruption of operations. The interaction of these factors has enabled ensuring the successful use of the mission by scientists and commercial users for more than ten years. This will continue to be the case since radar performance and calibration of the individual satellites is still well within specification, and no indication of any degradation is noticeable, a fact that is remarkably reflected in the consistently excellent quality of the SAR products. From today’s point of view, the satellites and the ground segment are operating without restrictions and the irretrievable resources, specifically the propellant and the battery capacity, allow for operating both satellites for another five years.

 ,
, 


