Article

Deformation Response of Seismogenic Faults to the Wenchuan MS 8.0 Earthquake: A Case Study for the Southern Segment of the Longmenshan Fault Zone

1
The First Monitoring and Application Center, China Earthquake Administration, Tianjin 300180, China
2
CEA Key Laboratory of Earthquake Prediction, Institute of Earthquake Forecasting, China Earthquake Administration, Beijing 100036, China
3
Department of Earth, Planetary, and Space Sciences, University of California, Los Angeles, CA 90085, USA
*
Author to whom correspondence should be addressed.
Remote Sens. 2018, 10(6), 894; https://doi.org/10.3390/rs10060894
Submission received: 26 April 2018 / Revised: 4 June 2018 / Accepted: 5 June 2018 / Published: 7 June 2018

Abstract

:
The spatiotemporal deformation response of a seismogenic fault to a large earthquake is of great significance to understanding the nucleation and occurrence of the next strong earthquake. The Longmeshan fault, where the 2008 Wenchuan MS 8.0 earthquake and 2013 Lushan MS 7.0 earthquake occurred, provides an opportunity for us to study this important issue. Based on the GPS observations, we exploit the deformation response of the Southern Segment of the Longmenshan Fault (SSLMF) to the Wenchuan earthquake. The results are as follows: (1) during the co-seismic and post-seismic processes of the Wenchuan earthquake, the deformation is dominated by a continuous pattern in the SSLMF, which is different from the rupture pattern in the middle-northern segment of the Longmenshan Fault (LMF). Quantitatively, the compressive strain present between 2008 and 2013 was equal to the strain accumulation of 69 years during the interseismic period in the SSLMF. If the statistics scope is restricted to the eastern region of the Anxian-Guanxian Fault (AGF), which covers the Lushan source area (Abbr.: Eastern Region), the value is about 25 years; (2) After the Wenchuan earthquake, the strain accumulation pattern changes significantly. First, the deformation adjustment (especially the shear deformation) in the region that crosses the Maoxian-Wenchuan Fault (MWF) and Beichuan-Yingxiu Fault (BYF) (Abbr.: Western Region) is significantly greater than that in the Eastern Region. Furthermore, the crustal shortening is significant in the Eastern Region with minor adjustments in shear deformation. Second, the azimuth angles of the principal compressive strain rate in both regions show significant adjustments, which change fast in the first year of the observation period and then turn into the stable state. In general, the deformation responses of the SSLMF reveal that the Wenchuan earthquake promotes the occurrence of the Lushan earthquake. Their differences in the spatiotemporal domain can be attributed to the influence of afterslip, viscous relaxation of the lithosphere, mechanical parameters and block movement.

1. Introduction

The ongoing collision of the Indian and Asian plates dominates the tectonics of South and East Asia [1] and causes intense seismicity on the margins of the Tibetan Plateau [2]. The MS 8.0 Wenchuan earthquake that occurred on the Longmenshan Fault (LMF) is one of the most devastating intraplate earthquakes in recent years. The LMF zone located at the boundary between the Sichuan Basin and the Baryan Har block, where records a complicated history of intense tectonism [3,4]. The LMF zone is mainly composed of 3 branches, which are the Maoxian-Wenchuan Fault (MWF), the Beichuan-Yingxiu Fault (BYF), and the Anxian-Guanxian Fault (AGF) from northwest to southeast. Well-constrained studies of active faults indicate that the slip rates averaged over tens of millennia are around 2 mm/year or less [5,6], consistent with decadal GPS observations [7,8,9]. Meanwhile, the interseismic strain accumulation and fault slip of the LMF were slow before this event [10,11]. The co-seismic rupture of Wenchuan earthquake is characterized by reverse thrusting along with dextral slip, mainly located in the central and northern section of the BYF [12,13,14,15,16].
In general, large earthquakes can modulate the crustal deformation, stress field, and stress accumulation of the fault zone in the surrounding areas [17,18], which will further promote or delay the occurrence of the next earthquakes. In order to research this question, the analysis of Coulomb stress change is an important method. For the correlation between the Wenchuan earthquake and the Lushan earthquake that occurred in the SSLMF, some groups suggest that Coulomb stress increases by about 5–15 kPa for the SSLMF [19,20,21,22,23,24], while near the epicenter of Lushan earthquake, it increases by about 0.9 kPa. Besides, the geodesy surveying can play an important role in the study of this important issue as it can describe the dynamic deformation process in detail and can provide powerful data sets for constraining models. Furthermore, the geodesy survey covering the seismogenic fault of the next strong earthquake, such as the GPS survey of the SSLMF, is meaningful for understanding the earthquake process by describing the redistribution of strain, identifying the detailed deformation of fault, and revealing the distinct deformation feature in the earthquake source. In this paper, the GPS campaign and continuous data are processed to get the movement results under a unified reference frame firstly, and then the spatiotemporal deformation responses of SSLMF to the Wenchuan earthquake are analyzed.

2. Deformation Response to the Co-Seismic Process

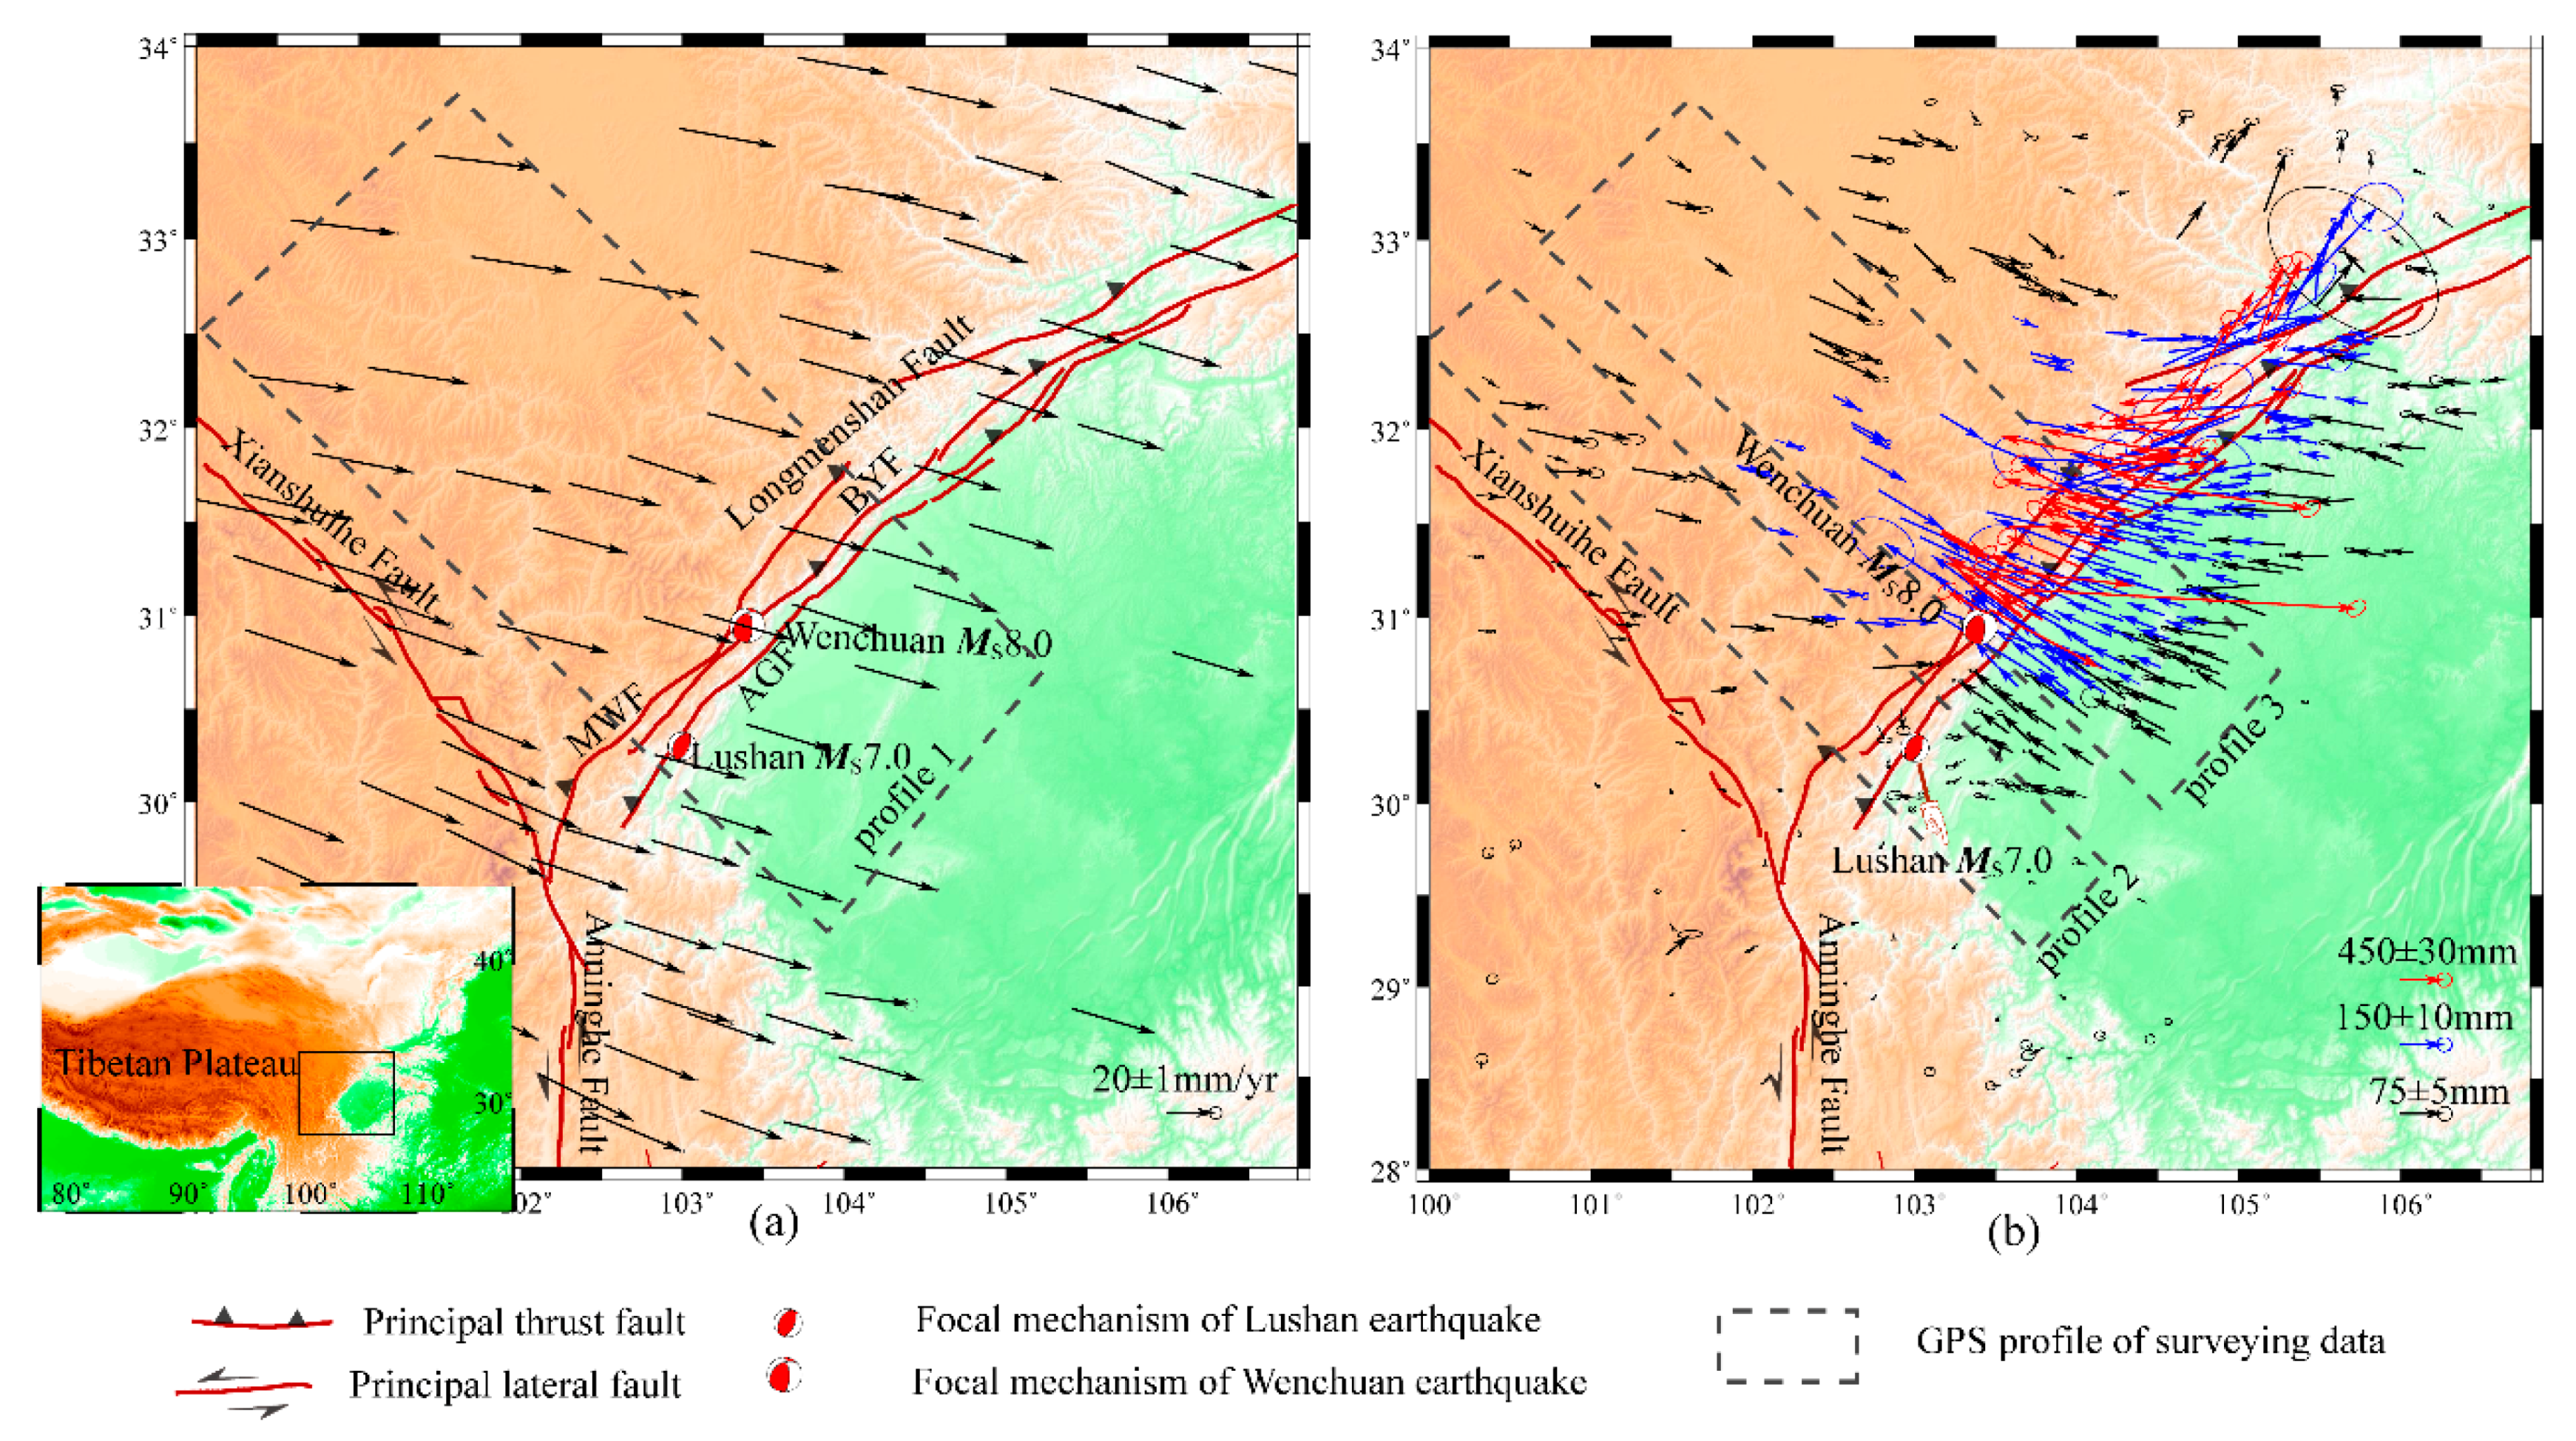
2.1. GPS Campaign Data

In order to get the interseismic crustal movement data of the LMF, we collected observation data from 100 campaign GPS stations that were observed from 1999 to 2007 (in 1999, 2001, 2004, and 2007) from the Crustal Movement Observation Network of China (CMONC), 15 continuous GPS stations from the CMONC, and 77 International GNSS Service (IGS) stations from http://garner.ucsd.edu/pub firstly. Secondly, the observation data for a given day were combined to produce daily solutions for loosely constrained station coordinates and satellite orbits using the release 10.40 of GAMIT software [25]. Lastly, the station coordinates and velocity were estimated using the above daily solutions in the International Terrestrial Reference Frame 2008 (ITRF2008 reference) with the GLOBK software [26,27]; see Wu et al. (2015) [28] for some more detail about the solving strategy. In Figure 1a, the interseismic velocity is presented, and Figure 1b shows the co-seismic displacement of the Wenchuan earthquake [15].

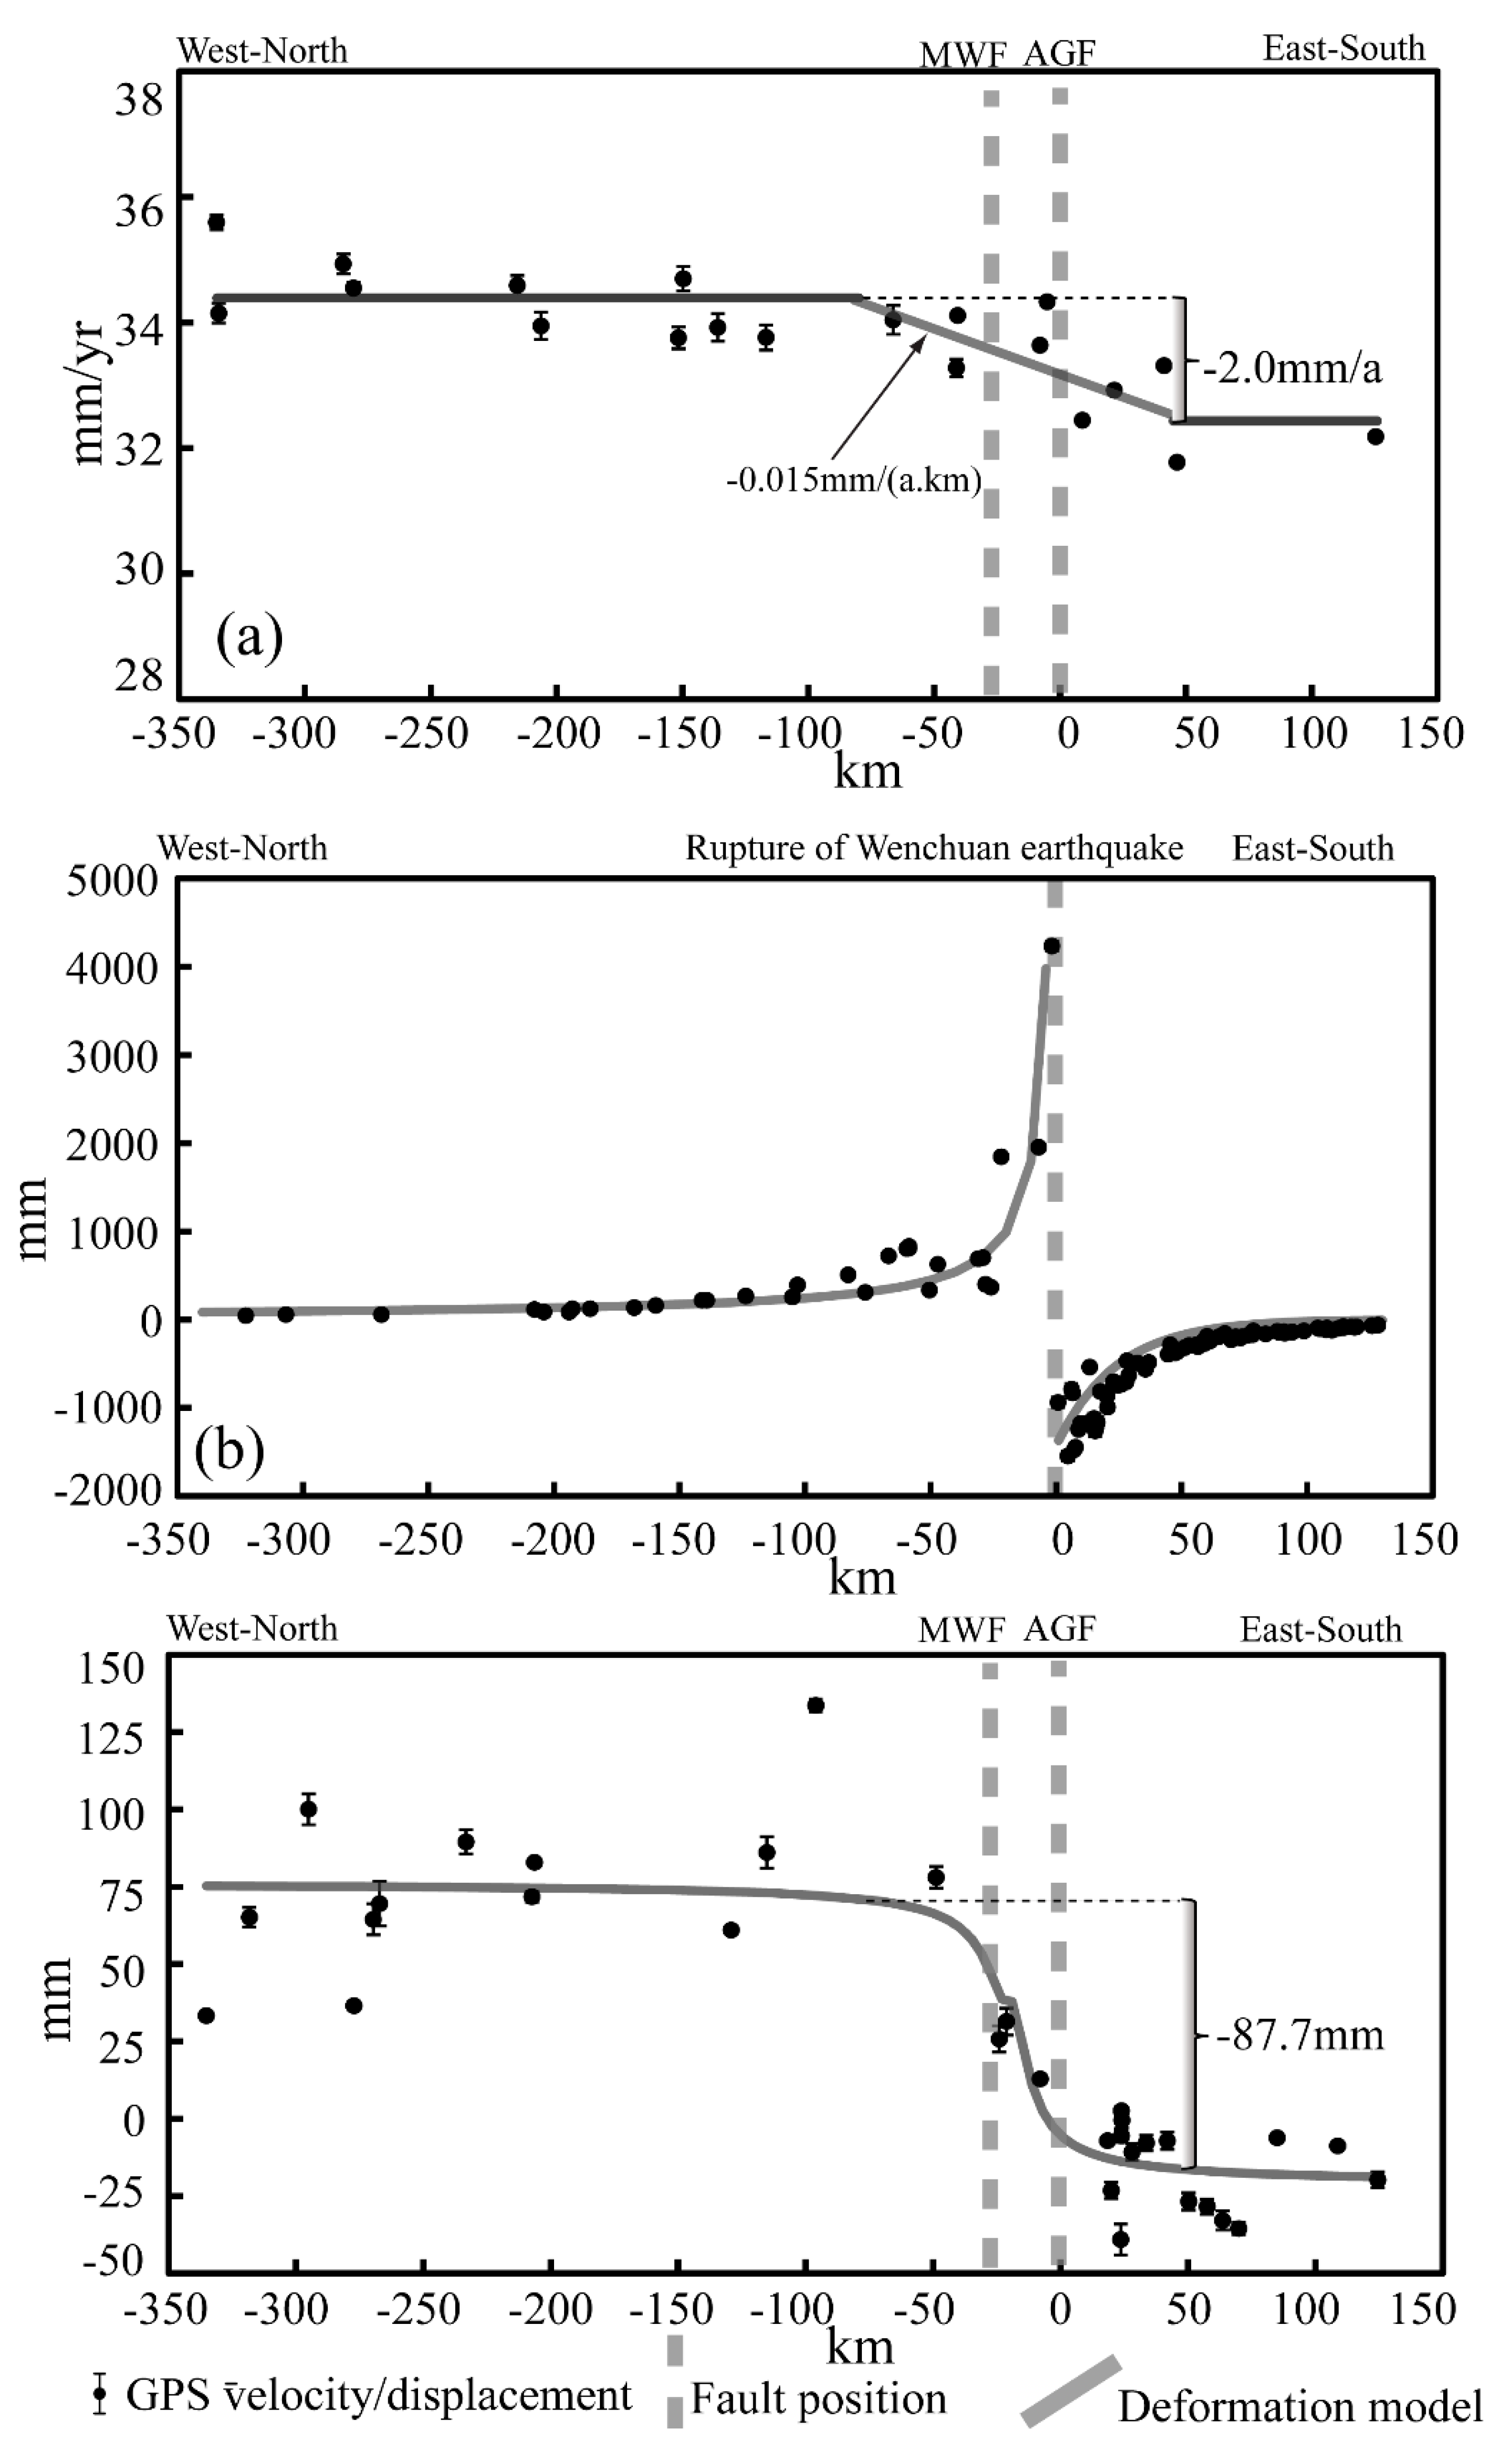
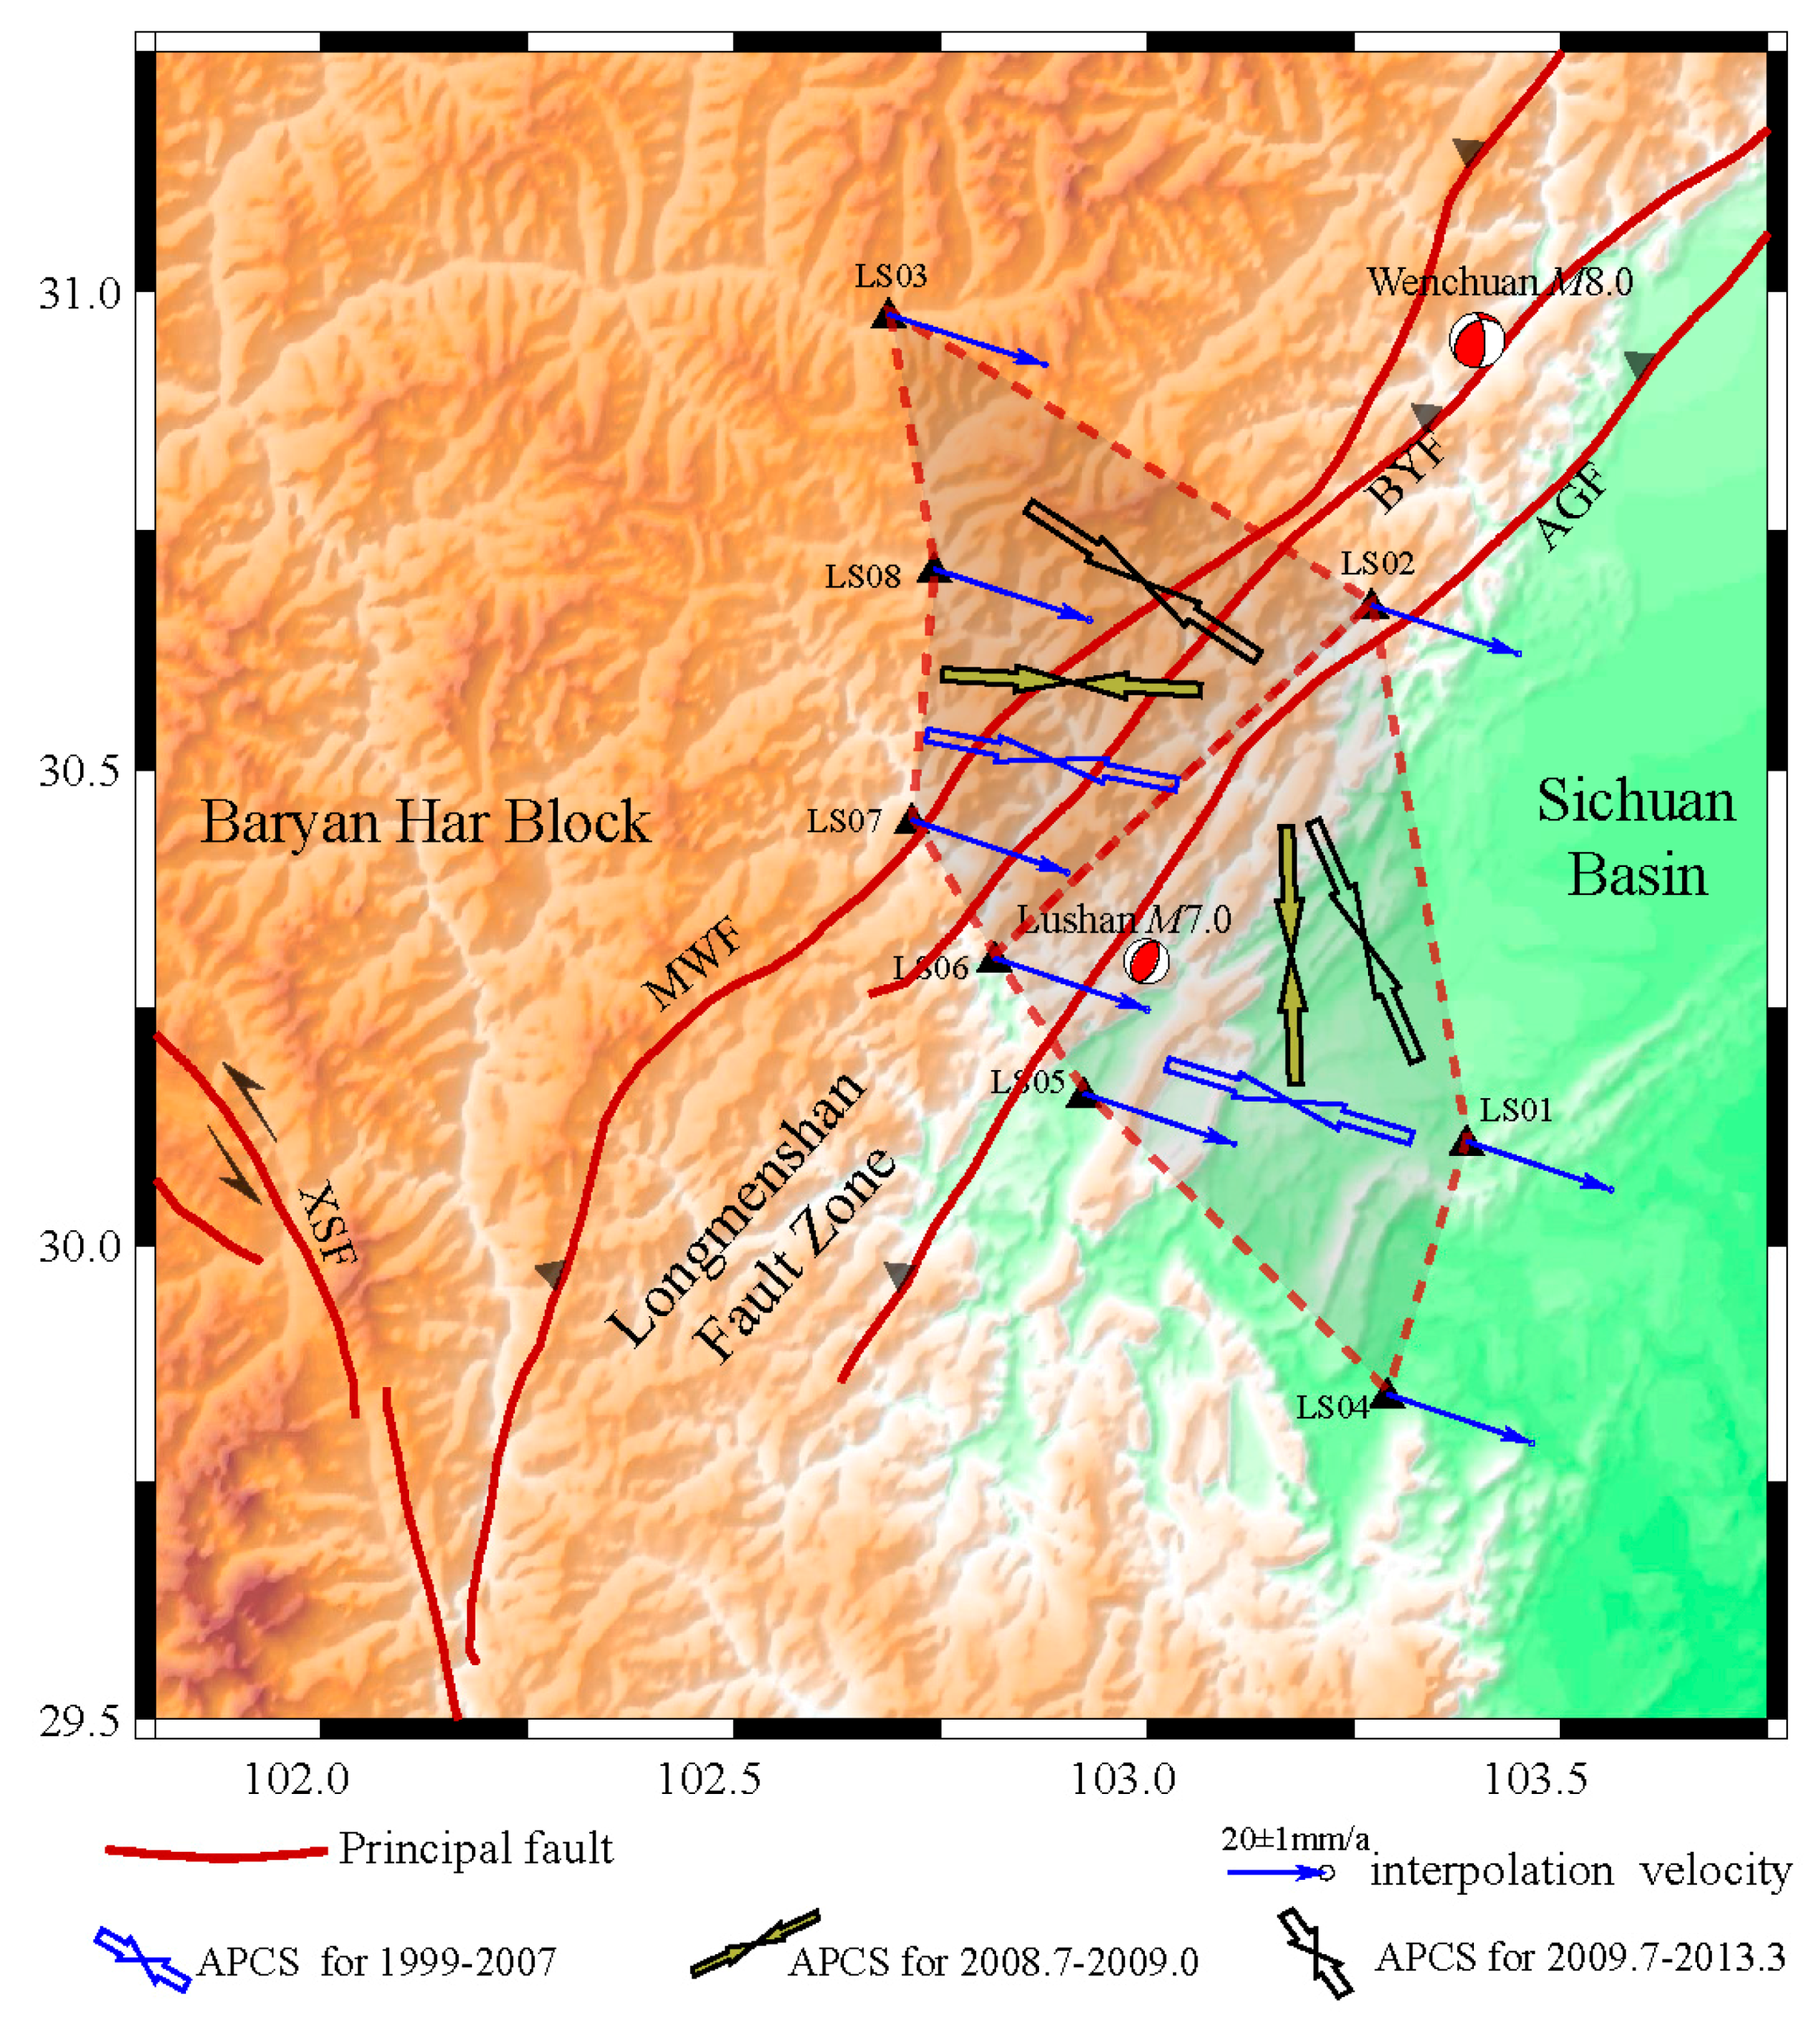
2.2. GPS Profile Analysis

Figure 2 presents the GPS profile results to quantitatively investigate the co-seismic deformation of the LMF. During the period from 1999 to 2007, the spatial resolution of GPS stations is low, and the interseismic deformation of the LMF can be described by a unified pattern, so the spatial extent of profile 1 is larger than the others. In detail, the region of the profle1 extends by about 460 × 190 km, which contains 20 GPS stations. While the regions of profile2 and profile3 extend by about 460 × 70 km and 450 × 100 km, covering 32 and 104 stations, respectively. Figure 2a illustrates that slow compressive strain accumulates in the LMF before the Wenchuan earthquake, the crustal shortening rate is about −2.0 mm/year at a 50 km distance on both sides of MWF-AGF (−80~50 km), which the strain rate is about −1.5 × 10⁻⁸/year and the value is consistent with previous research results [5,30,31,32,33,34,35]. Figure 2b shows that co-seismic rupture occurs in the middle segment of the LMF, with tensile strain releasing in both the hanging and footwall. For Figure 2c, the continuous deformation feature dominates in the SSLMF, which is different from Figure 2b. In detail, about a −87.7 mm crustal shortening is distributed at a 50 km distance from both sides of MWF-AGF (−80 km~50 km), and the fast loading value within −50km~0 km is −71.8 mm, which is about 81.9% of the total deformation. Comparing with the deformation described in Figure 2a, the crustal shortening of −87.7 mm in the co-seismic process is equal to the strain accumulation of 44 years during the interseismic period. On the other hand, related studies reveal that the seismogenic fault of the Lushan earthquake is located at about 10 km southeast of the AGF [36,37,38]. If the statistical scope is restricted to the region of 50 km in the east of the AGF, the ratio is about 15.

3. Dynamic Deformation Response to the Post-Seismic Process

Based on the deformation response to the co-seismic process, Figure 3 presents the deformation pattern in the SSLMF. For this region, our team has set up 8 GPS continuous stations (Figure 3), and the observations started from 2008.7 year. These stations cover three principal faults (that is, MWF, BYF, and AGF) of the SSLMF, and their surveying data are significant to research the deformation response conducted by the Wenchuan earthquake. In particular, the stations (that is, LS04, LS05, LS06, and LS07) are distributed in a linear pattern across the SSLMF, making it possible to identify the fault deformation differences.

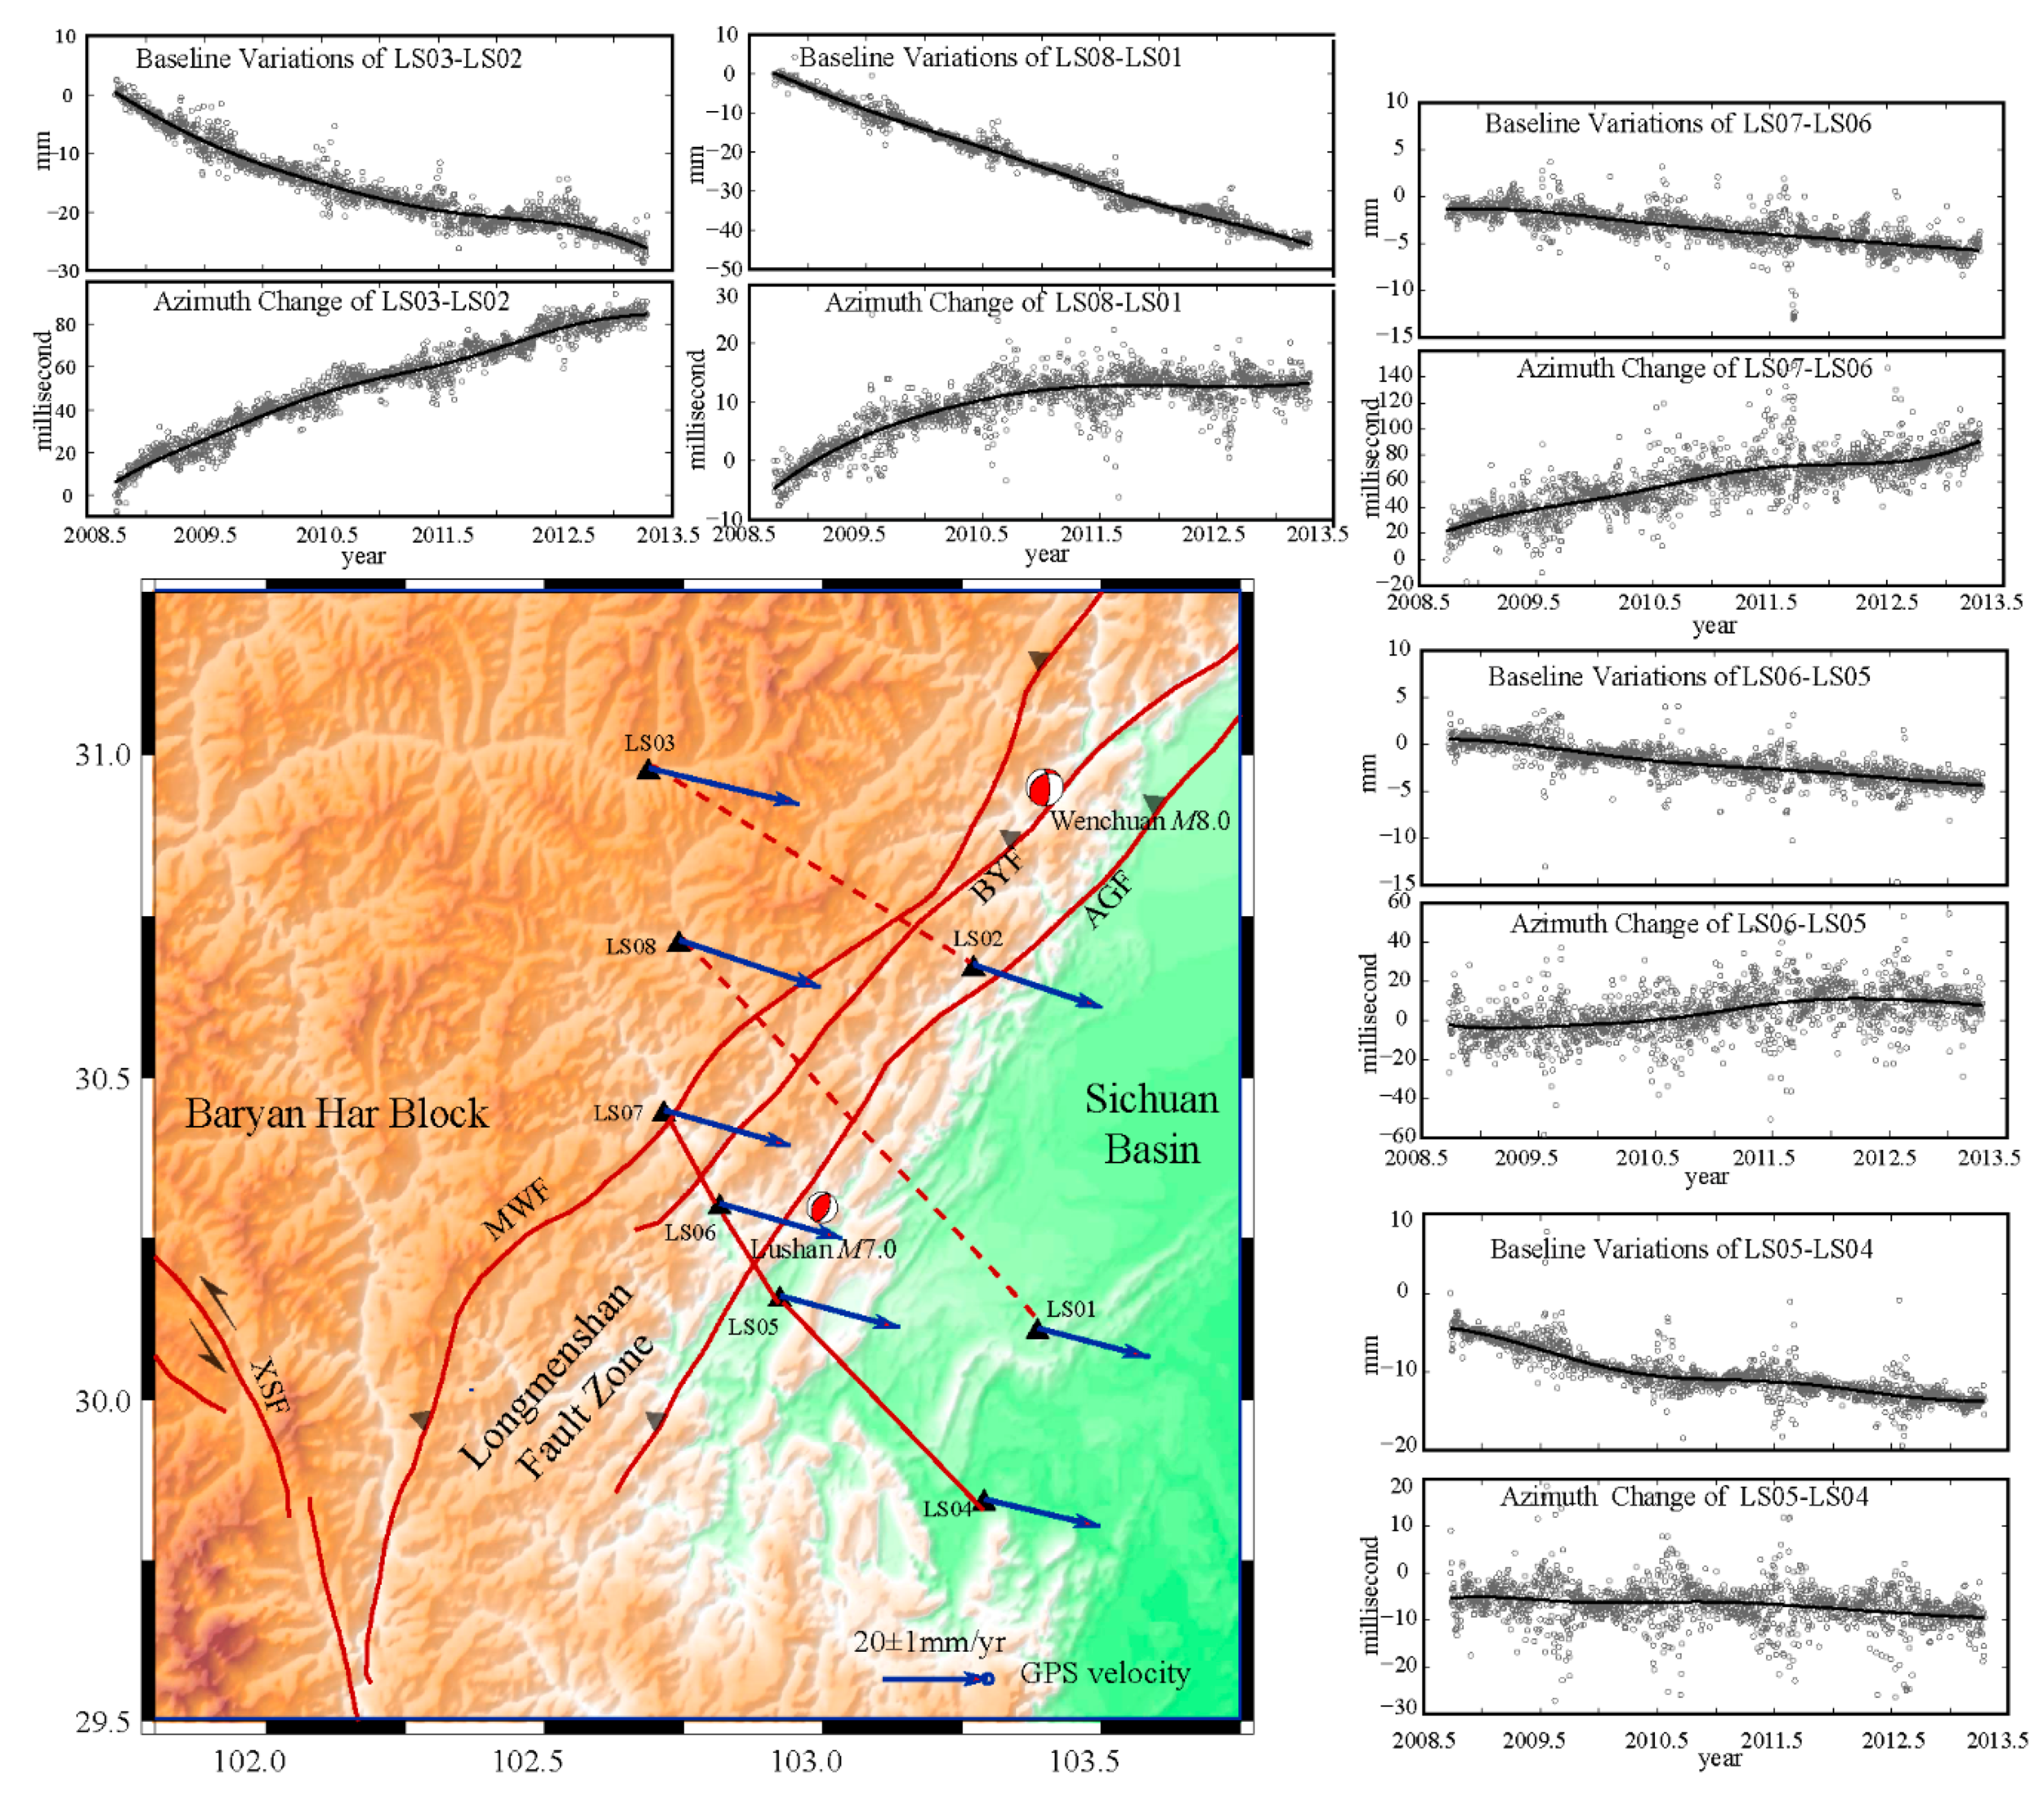
3.1. GPS Time-series

From 2008.7 to 2013.3 year, the GPS surveying data accumulated about 4.5 years’ data. Using the same solving strategy of GPS campaign data presented in Figure 1a, we get the coordinate time-series of these 8 stations. Then, Formula (1) is introduced to exclude the effects of the jump, annual cycle, and semi-annual cycle [39,40]. The figures of these 8 time-series can be found in the Supplement File. The data quality of these 8 stations is very good, in which the efficiency of most stations is greater than 85%, and their multipath effect parameters (that is, MP1 and MP2) are less than 0.5, and their data continuity ratios are higher than 95%. Meanwhile, the time series has less dispersion, and their average error of horizontal components is ±1.8 mm
y ( t i ) = a + b t i + c sin ( 2 π t i ) + d cos ( 2 π t i ) + e sin ( 4 π t i ) + f cos ( 4 π t i ) + j = 1 n j g j H ( t i T g j ) + ε t i
In Equation (1), t i is the surveying date; y ( t i ) is the coordinate time-series; a is the intercept; b is the linear velocity; c , d and e , f are the annual cycle and semi-annual cycle coefficients; g j is the offset, T g j is the epoch of mutation. H is Heaviside step function and ε t i is observation noise [41].

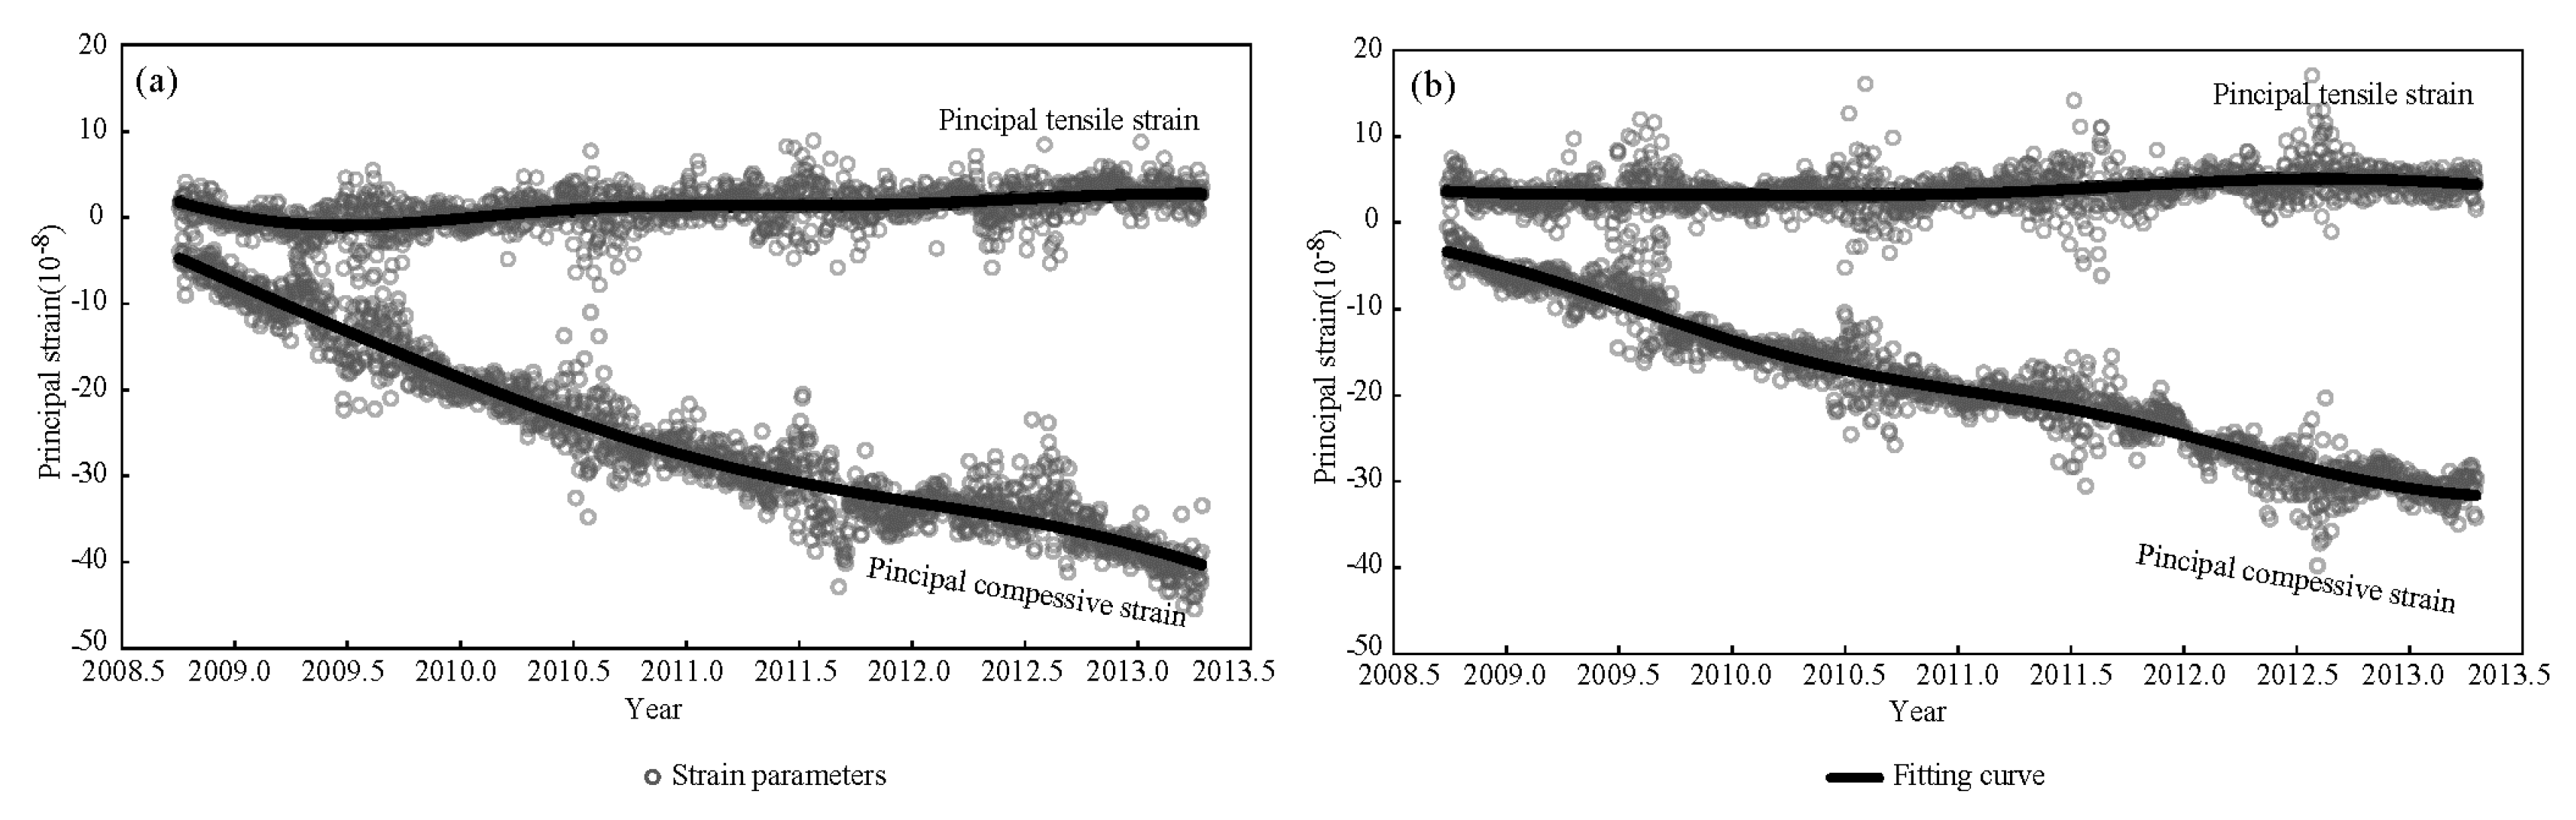
3.2. Dynamic Strain Adjustment of the SSLMF

Considering the fault’s location and deformation pattern of the SSLMF, the SSLMF can be divided into two regions to study the deformation characteristics. The Western Region is located on the hanging wall, which is enclosed by the sites of LS03, LS08, LS02, LS06, and LS07. The Eastern Region locates on the footwall, which is enclosed by sites of LS02, LS06, LS01, LS04, and LS05. In Figure 4, two sets of strain time-series are presented, both showing the obviously compressive feature. However, significant differences exist in the principal compressive strain time-series. Among which, the strain rate in the Eastern Region is −6.2 × 10⁻⁸/year, which is smaller than −7.9 × 10⁻⁸/year in the Western Region.
With the adjustment of the principal strain parameters, the azimuth angle of the principal compressive strain rate (APCS) will change as well. In order to quantitatively compare the values before and after the Wenchuan earthquake, we firstly interpolate the values of the LS01–LS08 stations from the GPS velocity in Figure 1a [42], and then the velocities for these stations are calculated in the multiple time periods after the Wenchuan earthquake. Subsequently, ten groups of the APCS for the two regions are calculated and presented in Table 1 and Figure 5. Prior to the Wenchuan earthquake, the difference in the APCS between two regions is relatively small, indicating that the overall direction of the compressive strain in the SSLMF is SEE. After the Wenchuan earthquake, the direction of the APCS changes from EW to SEE in the Western Region and transforms from NS to SSE in the Eastern Region. In detail, during the first 3 months of the observation period, the difference of the APCS for two regions is about 80°, which decreases to about 30° at the first year of the observation period, and lasts until the occurrence of the Lushan Earthquake. In particular, the APCS in the Western Region has recovered to an interseismic value before the Lushan earthquake, which is more than 45 degrees different from the Eastern Region.

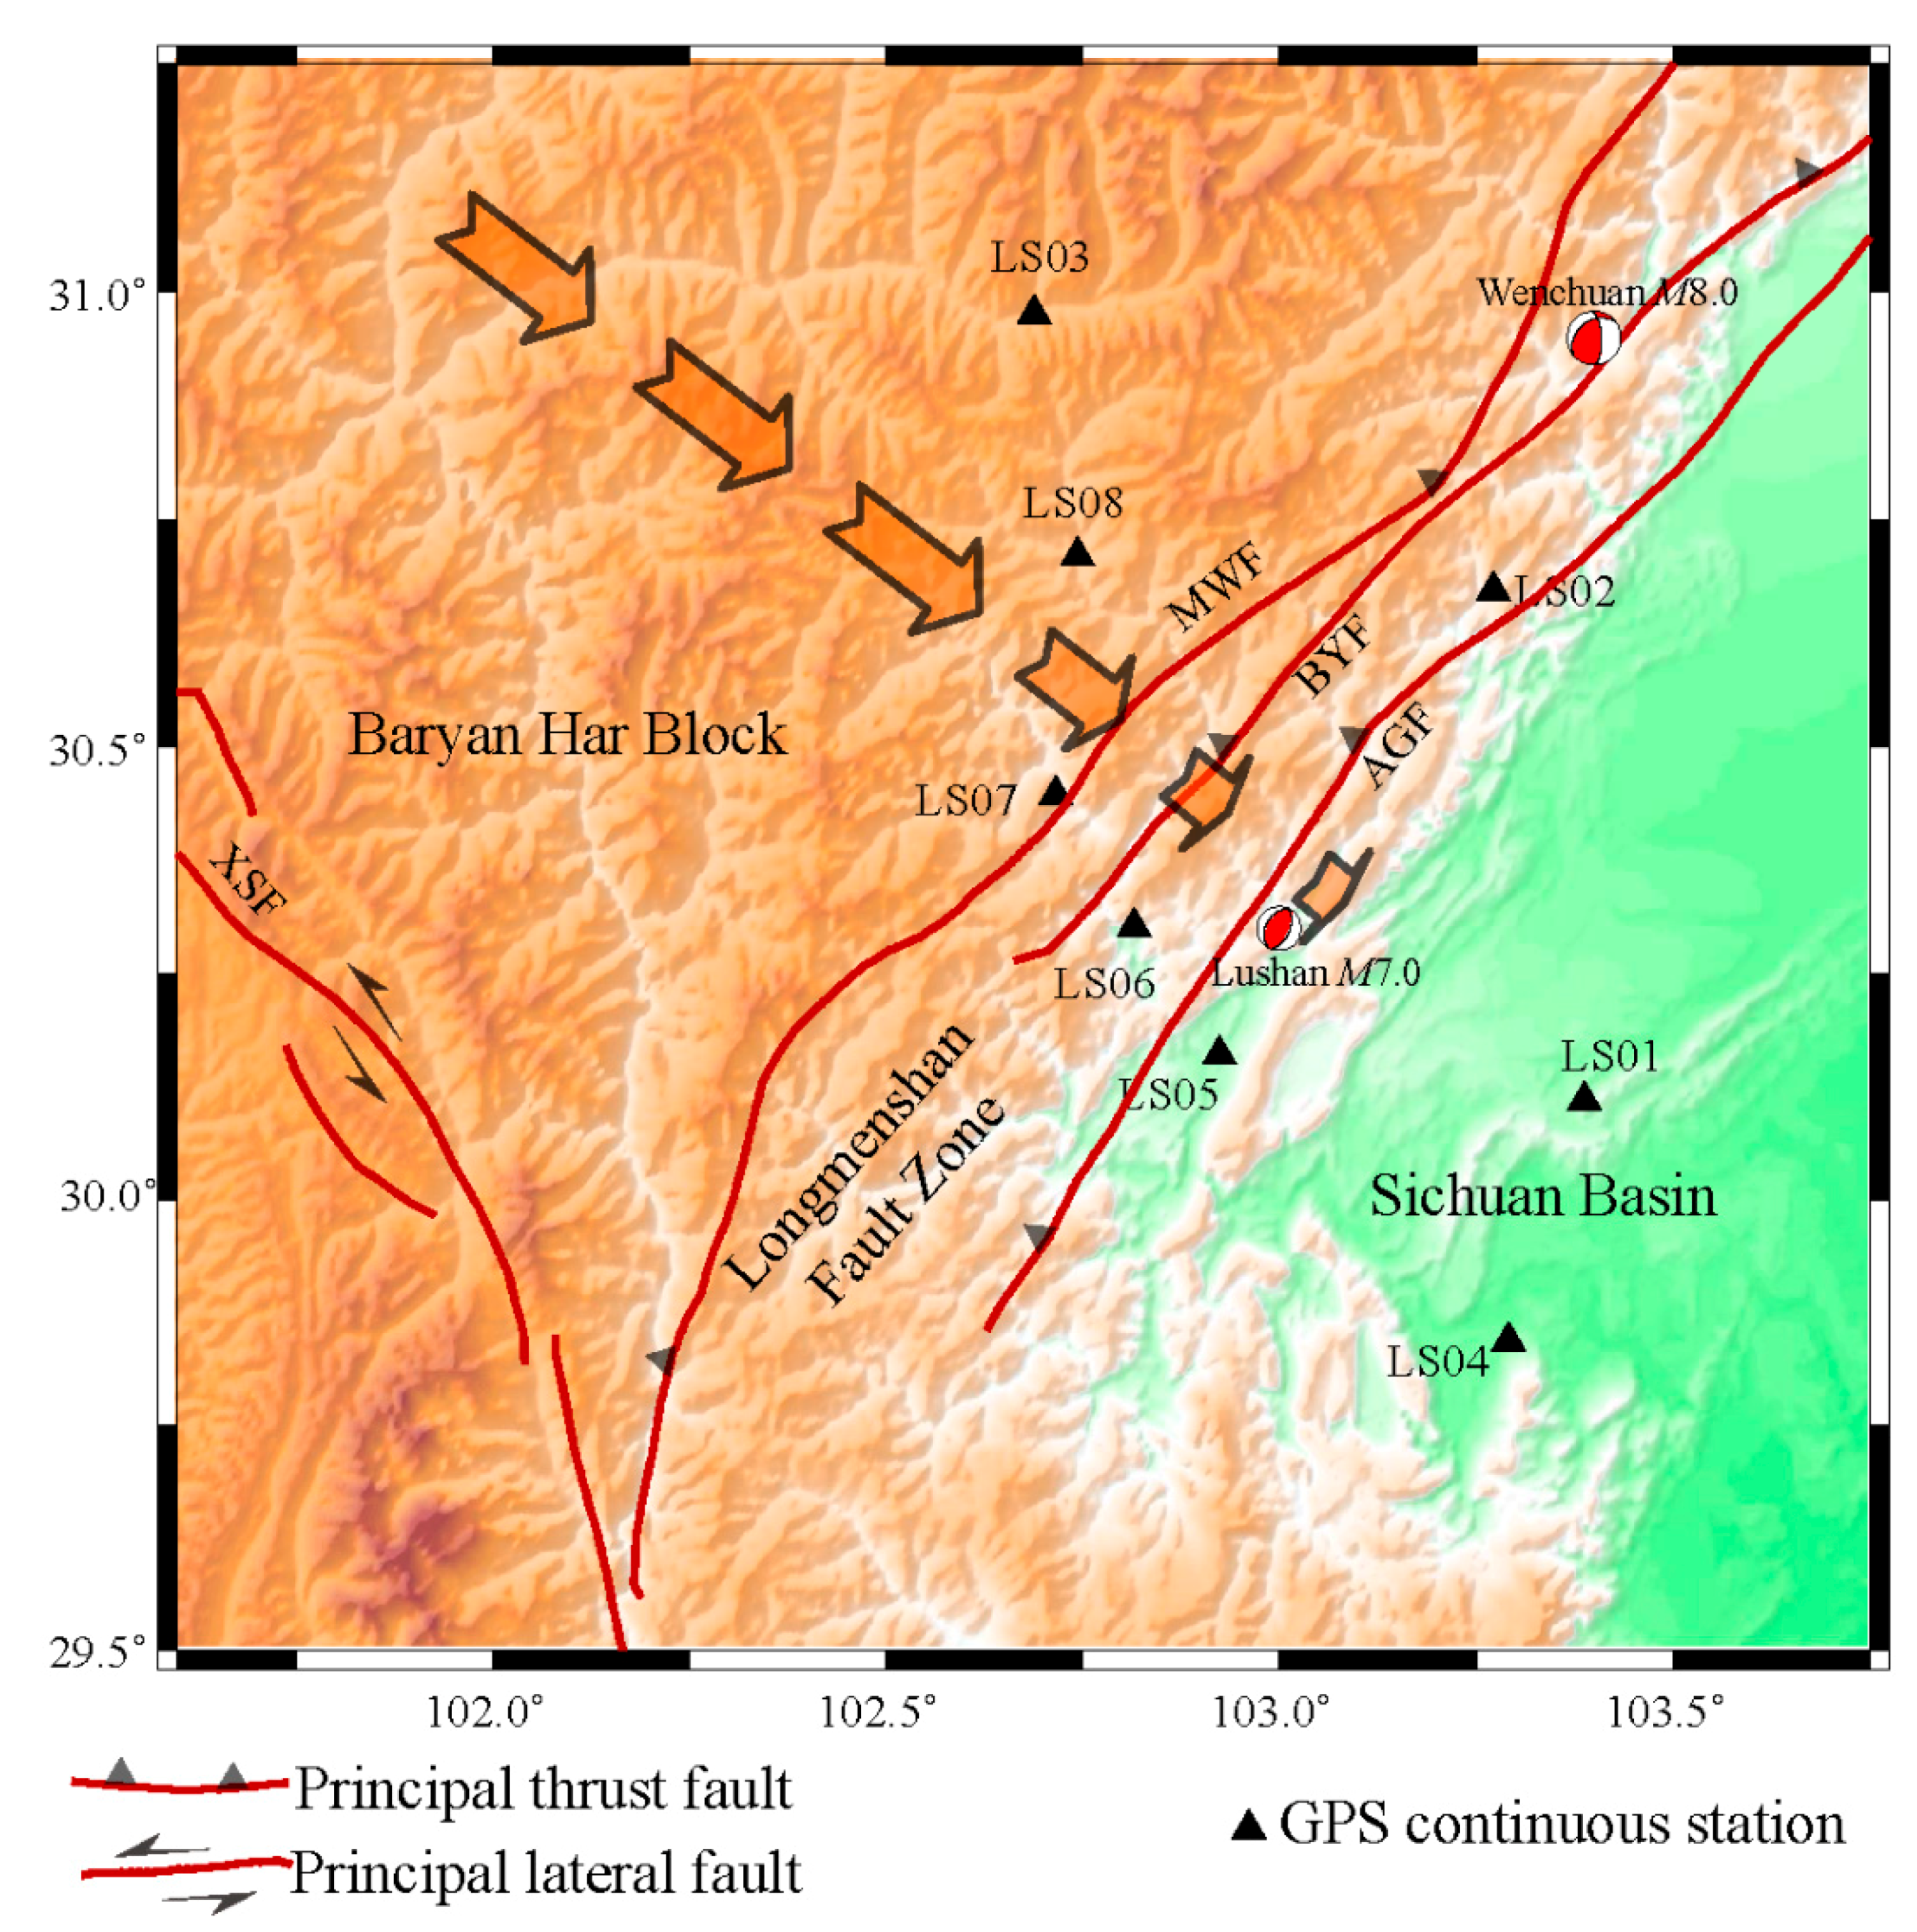
3.3. Dynamic Deformation of Major Faults in the SSLMF

In Figure 6, the GPS baseline time-series is presented. The geodetic and azimuth angle of LS03–LS02 shows obvious nonlinear feature, indicating that the compressive and dextral deformations near the Wenchuan focal are decelerating. The geodetic length of LS08–LS01 is in steadily shortening, and its azimuth angle shows a nonlinear deceleration feature before 2011.5 year. The shortening rate of LS08–LS01 is significantly greater than that of LS03–LS02, suggesting that the crustal shortening adjustment of the AGF fault zone and its eastern area is more pronounced. The stations of LS04–LS07 are across the MWF, BYF, and AGF zones, the baseline LS04–LS05 especially covers the seismogenic fault of the Lushan earthquake. Considering that two sets of baseline (LS04–LS05 and LS05–LS06) cross the faults with an angle of about 70° and their azimuth angles are steady, the compression with the levorotatory deformation feature that dominates in the faults can be deduced. In general, all of the baselines in Figure 6 illustrate crustal shortening features, but the azimuth angle for the LS02–LS03 and LS06–LS07 that crossing the MWF and BYF are three times greater than other baselines.
In order to quantitatively analyze the spatial deformation differences for major faults of the SSLMF, Table 2 presents the parallel and perpendicular components of relative movements between two stations. Comparing with the LS02–LS03, the crustal shortening rate of the LS01–LS08 is its 1.7 times, indicating that obvious crustal shortening occurs in the AGF and the seismogenic fault of the Lushan earthquake. From the baselines of LS06–LS07 and LS05–LS06 that cross NWF, BYF, and AGF, the crustal shortening rate is about −6.0 to −7.1 mm/(100 km× year ). Meanwhile, the value of the LS04–LS05 that covers the seismogenic fault of the Lushan earthquake is −3.9 mm/(100 km × year), which is about 0.56–0.65 times that of the main faults. For parallel components, the dextral deformation dominates in the north region of the SSLMF, but decreases from −9.2 mm/(100 km ×year) for LS02–LS03 to −0.5 mm/(100 km × year) for LS04-LS07. Furthermore, the value is −4.0 mm/(100 km × year) for LS07–LS06, indicating significant dextral deformation adjustment in the MWF and BYF. Meanwhile, the parallel components are 0.4 and 0.6 mm/(100 km × year) for LS06–LS05 and LS05–LS04, respectively, showing the weak levorotatory feature in the AGF and the seismogenic fault of the Lushan earthquake. In general, the average crustal shortening rate of LS01–LS08, LS01–LS07, and LS04–LS07 that cross the whole SSLMF is about −6.9 mm/(100 km × year), and the annual value approximately equals to the strain accumulation of about 5 years in the interseismic period. Specifically, in the eastern region of AGF, the ratio is about 2.0.

4. Discussion

The spatiotemporal deformation response of a seismogenic fault to a large earthquake is complicated and of great significance for understanding the nucleation and occurrence of the next strong earthquake. For the SSLMF, the typical reverse fault zone that is not ruptured during the Wenchuan earthquake, the dynamic deformation processes in the interseismic, co-seismic, and post-seismic periods have been captured via GPS techniques. Among which, some phenomena may related to the preparation of the Lushan earthquake.

4.1. Identification of Effective Deformation

When analyzing the deformation response of the SSLMF, the GPS profiles, strain parameter, and baseline time-series are adopted. In the spatial domain, the resolution, from high to low, are for the co-seismic displacements, GPS velocity, and coordinate time-series. Therefore, the co-seismic deformation differences are distinguished between the SSLMF and the rupture segment of LMF because of the high spatial resolution of the GPS displacements. For the temporal resolutions, the coordinate time-series are much higher than the other two types of data. Thus, the dynamic deformation features that significantly greater than the errors are analyzed using GPS time-series, such as the deformation differences between the western region to the BYF and the eastern region to the AGF. For residual seasonal cycle signals in GPS time-series, the fitting processes can exclude their influence on the low frequency deformation signals.

4.2. Deformation Response of SSLMF and the Lushan Earthquake

GPS campaign data reveal that the strain accumulation rate is slow in LMS zones before the Wenchuan earthquake. During the Wenchuan earthquake, the SSLMF is characterized by continuous compressive strain accumulation that significantly differs from the strain release pattern of the rupture segment of the LMF. From the quantitative analysis, the compressive loading is equal to the total accumulation of 44 years in the interseismic period. Furthermore, the post-seismic loading in 5 years approximately equals to the strain accumulation of 25 years in the interseismic period. These phenomena indicate that the Wenchuan earthquake exerts a significant loading effect on the whole SSLMF zone. Although the Lushan earthquake has occurred in the 2013 year, it cannot be rule out that the redistribution of the strain energy may trigger other new earthquakes, as the strain release of the principal faults of the SSLMF (that is, MWF, BYF and AGF) is not enough during the Lushan event [37,38].
GPS continuous data indicates that the post-seismic deformation adjustments of the MWF-BYF fault in the SSLMF are more pronounced than that of the AGF and its eastern region. For perpendicular components, the crustal shortening ratio between the Western Region and Eastern Region is about 2.0, while the adjustment in the shearing deformation is much larger in the West Region. The seismogenic region of the Lushan earthquake is featured with the weak levorotatory deformation, indicating the slight effect from the shearing slip of the Wenchuan earthquake. Meanwhile, the APCS in the Eastern region that covers the Lushan source shows more than a 45 degrees difference from the value of interseismic period. In general, the above weak deformation response and the large difference of APCS in the Eastern region are mainly attributed to the footwall effect and the rheology property of the lithosphere, while the locking effect of the seismogenic fault of the Lushan earthquake may affect these adjustment processes.

4.3. Deformation Mechanics

Jiang et al. (2017) [24] suggests that the pore resilience caused by the Wenchuan earthquake is small, and the afterslip and viscous relaxation is the primary mechanism of post-seismic deformation. GPS baseline time-series shows that the deformation deceleration features are significant near the Wenchuan source (that is, LS03–LS02, LS08–LS01), and other baselines that far from the Wenchuan epicenter mainly show linear characteristics. These phenomena indicate that multiple mechanisms may affect the deformation process. For the region near the Wenchuan source, the afterslip may be the dominating mechanism, while the viscous relaxation may dominate the deformation of other regions, where the block loading effect cannot be neglected. The temporal adjustment of the APCS of both regions is fast before the 2008.75 year, and then turns to stable status, which can be explained by the alternation of the effects from the dominant afterslip movement in the first 1–2 years after the Wenchuan earthquake to the subsequently pronounced viscous relaxation later.
Though in the unified tectonic system like the SSLMF, the deformation adjustments of the major faults are characterized by a great discrepancy. In order to reveal its mechanism, high precision, near-field, and intensive geodetic observations are essential.

5. Conclusions

In this essay, we focus on exploiting the dynamic deformation of the SSLMF and its major faults relating to the Wenchuan earthquake. In the co-seismic and post-seismic processes, the continuous deformation pattern dominates in the SSLMF. Quantitatively, the crustal shortening is −87.7 mm in the co-seismic period which is equal to the strain accumulation of 44 years during the interseismic period. Considering the deformation loading of the co-seismic and post-seismic effects 5 years after the Wenchuan earthquake, the sum compressive strain on the SSLMF zone is equal to the strain accumulation of 69 years during the interseismic period. For the eastern region of the AGF that covering the Lushan source, the value is about 25 years. After the Wenchuan earthquake, the crustal shortening is significant in the AGF and Lushan source areas, but the deformation adjustments of the MWF-BYF fault are more pronounced. Therefore, the Wenchuan earthquake is significant on the whole SSLMF zone, which accelerated its strain accumulation and promoted the occurrence of the Lushan earthquake. Furthermore, we should pay more attention to the earthquake risk of principal faults of the SSLMF (that is, MWF, BYF, and AGF).

Supplementary Materials

The following are available online at https://www.mdpi.com/2072-4292/10/6/894/s1, Figure S1: Time-series curve of LS01~LS08 in the SSLMF.

Author Contributions

Conceptualization, Z.J.; Methodology, Z.J. and Y.W.; Software, H.L.; Validation, Y.W.; Formal Analysis, Y.P.; Investigation, Y.W.; Resources, Y.P. and C.C.; Data Curation, H.L.; Writing-Original Draft Preparation, S.Z., L.C. and Y.W.; Writing-Review & Editing, Y.P., S.Z. and L.C.; Visualization, J.L.; Supervision, C.C.; Project Administration, Y.W.; Funding Acquisition, Z.J. and Y.W.

Funding

This research was funded by by the National Science Foundation of China [41474002] and the China Scholarship Council.

Acknowledgments

The GPS data in Chinese mainland are from the China Crust Movement Observation Network. Special thanks to Zheng-Kang Shen, Bofeng Guo, Wei Zhan, Xiaoxia Liu and Wenxin Wei for their helpful advice.

Conflicts of Interest

The authors declare no conflict of interest.

References

  1. Tapponnier, P.; Peltzer, G.; Armijo, R. On the Mechanics of the Collision between India and Asia; Special Publications; Geological Society: London, UK, 1986; Volume 19, pp. 113–157. [Google Scholar]
  2. Wen, X.; Yi, G. Re-zoning of statistic units of seismicity in Sichuan-Yunnan region. J. Seismol. Res. 2003, 26, 1–9. [Google Scholar]
  3. Chen, S.F.; Wilson, C.J.L. Emplacement of the Longmen Shan thrust–Nappe Belt along the eastern margin of the Tibetan Plateau. J. Struct. Geol. 1996, 18, 413–430. [Google Scholar] [CrossRef]
  4. Liu, S.G.; Luo, Z.L.; Dai, S.L. The uplift of the Longmenshan thrust belt and subsidence of the west Sichuan Foreland Basin. Acta Geol. Sin. 1996, 9, 16–26. [Google Scholar]
  5. Densmore, A.L.; Ellis, M.A.; Li, Y.; Zhou, R.; Hancock, G.S.; Richardson, N. Active tectonics of the Beichuan and Pengguan faults at the eastern margin of the Tibetan Plateau. Tectonics 2007, 26, TC4005. [Google Scholar] [CrossRef]
  6. Zhang, H.; Zhang, P.; Kirby, E.; Yin, J.; Liu, C.; Yu, G. Along-strike topographic variation of the Longmen Shan and its significance for landscape evolutionalong the eastern Tibetan Plateau. J. Asian Earth Sci. 2011, 40, 855–864. [Google Scholar] [CrossRef]
  7. Chen, Z.; Burchfiel, B.C.; Liu, Y.; King, R.W.; Royden, L.H.; Tang, W.; Wang, E.; Zhao, J.; Zhang, X. Global Positioning System measurements from eastern Tibet and their implications for India/Eurasia intercontinental deformation. J. Geophys. Res. Solid Earth 2000, 105, 16215–16227. [Google Scholar] [CrossRef] [Green Version]
  8. Gan, W.; Zhang, P.; Shen, Z.K.; Niu, Z.; Wang, M.; Wan, Y.; Cheng, J. Present-day crustal motion within the Tibetan Plateau inferred from GPS measurements. J. Geophys. Res. Solid Earth 2007, 112. [Google Scholar] [CrossRef] [Green Version]
  9. Zhang, P.; Shen, Z.; Wang, M.; Gan, W.; Burgmann, R.; Molnar, P. Continuousdeformation of the Tibetan Plateau from global positioning system data. Geology 2004, 32, 809–812. [Google Scholar] [CrossRef]
  10. Burchfiel, B.C.; Royden, L.H.; Robert, V.D.H.; Hager, B.H.; Chen, Z.; King, W.R.; Li, C.Y.; Lu, J.L.; Yao, H.B.; Kriby, E. A geological and geophysical context for the Wenchuan earthquake of 12 May 2008, Sichuan, People’s Republic of China. GSA Today 2008, 18, 4–11. [Google Scholar] [CrossRef]
  11. Zhang, P.Z. Beware of slowly slipping faults. Nat. Geosci. 2013, 6, 323–324. [Google Scholar] [CrossRef]
  12. Shen, Z.; Sun, J.B.; Zhang, P.Z.; Wan, Y.G.; Wang, M.; Burgmann, R.; Zeng, Y.H.; Gan, W.J.; Liao, H.; Wang, Q.L. Slip maxima at fault junctions and rupturing of barriers during the 2008 Wenchuan earthquake. Nat. Geosci. 2009, 2, 718–724. [Google Scholar] [CrossRef]
  13. Xu, C.J.; Liu, Y.; Wen, Y.M.; Wang, R.J. Coseismic Slip Distribution of the 2008 Mw 7.9 Wenchuan Earthquake from Joint Inversion of GPS and InSAR Data. Bull. Seismol. Soc. Am. 2010, 100, 2736–2749. [Google Scholar] [CrossRef]
  14. Bo, W.J.; Yang, G.H.; Zhan, W.; Zhang, F.S.; Wan, W.N.; Zhang, L.C. Preparatory mechanism of MS 8.0 Wenchuan earthquake evidenced by crust-deformation data. Geodesy Geodyn. 2011, 2, 23–28. [Google Scholar]
  15. Wang, Q.; Qiao, X.J.; Lan, Q.G.; Freymueller, J.; Yang, S.M.; Xu, C.J.; Yang, Y.L.; You, X.Z.; Tan, K.; Chen, G. Rupture of deep faults in the 2008 Wenchuan earthquake and uplift of the Longmen Shan. Nat. Geosci. 2011, 4, 634–640. [Google Scholar]
  16. Yin, Z.; Xu, C.; Wen, Y.; Jiang, G.; Fan, Q.; Liu, Y. A new hybrid inversion method for parametric curved faults and its application to the 2008 Wenchuan (China) earthquake. Geophys. J. Int. 2016, 205, 954–970. [Google Scholar] [CrossRef]
  17. King, G.C.; Stein, R.S.; Lin, J. Static stress changes and the triggering of earthquakes. Bull. Seismol. Soc. Am. 1994, 84, 935–953. [Google Scholar]
  18. Stein, R.S. Earthquake conversations. Sci. Am. 2003, 288, 72–79. [Google Scholar] [CrossRef] [PubMed]
  19. Toda, S.; Lin, J.; Meghraoui, M.; Stein, R.S. 12 May 2008 M = 7.9 Wenchuan, China, earthquake calculated to increase failure stress and seismicity rate on three major fault systems. Geophys. Res. Lett. 2008, 35. [Google Scholar] [CrossRef] [Green Version]
  20. Parsons, T.; Ji, C.; Kriby, E. Stress changes from the 2008 Wenchuan earthquake and increased hazard in the Sichuan basin. Nature 2008, 454, 509–510. [Google Scholar] [CrossRef] [PubMed]
  21. Shan, B.; Xiong, X.; Zheng, Y.; Diao, F. Stress changes on major faults caused by M w 7.9 Wenchuan earthquake, May 12, 2008. Sci. China Ser. D Earth Sci. 2009, 52, 593–601. [Google Scholar] [CrossRef]
  22. Xu, C.J.; Wang, J.J.; Li, Z.H.; Drummond, J. Applying the Coulomb failure function with an optimally oriented plane to the 2008 MW 7.9 Wenchuan earthquake triggering. Tectonophysics 2010, 491, 119–126. [Google Scholar] [CrossRef]
  23. Wang, J.J.; Xu, C.J.; Freymueller, J.T.; Li, Z.H.; Shen, W.B. Sensitivity of Coulomb stress change to the parameters of the Coulomb failure model: A case study using the 2008 MW 7.9 Wenchuan earthquake. J. Geophys. Res. Solid Earth 2014, 119, 3371–3392. [Google Scholar] [CrossRef]
  24. Jiang, Z.; Yuan, L.; Huang, D.; Yang, Z.; Chen, W. Postseismic deformation associated with the 2008 Mw 7.9 Wenchuan earthquake, China: Constraining fault geometry and investigating a detailed spatial distribution of afterslip. J. Geodyn. 2017, 112, 12–21. [Google Scholar] [CrossRef]
  25. Herring, T.A.; King, R.W.; McClusky, S.C. GAMIT Reference Manual. GPS Analysis at MIT. Release 10.4; Massachussetts Institute Technology: Cambridge, MA, USA, 2010; Available online: http://www-gpsg.mit.edu/~simon/gtgk/index.htm (accessed on 5 October 2011).
  26. Altamimi, Z.; Collilieux, X.; Métivier, L. ITRF2008: An improved solution of the international terrestrial reference frame. J. Geodesy 2011, 85, 457–473. [Google Scholar] [CrossRef] [Green Version]
  27. Herring, T.A.; King, R.W.; McClusky, S.C. GLOBK Reference Manual. Global Kalman Filter VLBI and GPS Analysis Program. Release 10.4; Massachussetts Institute Technology: Cambridge, MA, USA, 2010; Available online: http://www-gpsg.mit.edu/~simon/gtgk/index.htm (accessed on 5 October 2018).
  28. Wu, Y.; Jiang, Z.; Zhao, J.; Liu, X.; Wei, W.; Liu, Q.; Zhang, L. Crustal deformation before the 2008 Wenchuan M S 8.0 earthquake studied using GPS data. J. Geodyn. 2015, 85, 11–23. [Google Scholar] [CrossRef]
  29. Deng, Q.; Zhang, P.; Ran, Y.; Yang, X.; Min, W.; Chu, Q. Basic characteristics of active tectonics of China. Sci. China Ser. D Earth Sci. 2003, 46, 356–372. [Google Scholar]
  30. Xu, X.W.; Zhang, P.Z.; Wen, X.Z. Characteristics of active tectonics and models of earthquake recurrences in western Sichuan. Seismol. Geol. 2005, 27, 446–461, (In Chinese with English Abstract). [Google Scholar]
  31. Li, Y.; Zhou, R.J.; Densmore, A.; Ellis, M. Geodynamic Process of Eastern Margin of the Tibetan Plateau and Its Geological Responses; Geological Publishing House: Beijing, China, 2006. [Google Scholar]
  32. Zhou, R.; Li, Y.; Alexander, L.; Densmore, A.; Michael, A.E.; He, Y.L.; Li, Y.Z.; Li, X.G. Active tectonics of the Longmenshan region of the eastern margin of the Tibetan plateau. Acta Geol. Sin. 2007, 81, 593–604. [Google Scholar]
  33. Zhang, P.Z.; Xu, X.W.; Wen, X.Z.; Ran, Y.K. Slip rates and recurrence intervals of the LongmenShan active fault zone, and tectonic implications for the mechanism of the May 12 Wenchuan earthquake, 2008, Sichuan, China. Chin. J. Geophys. 2008, 51, 1066–1073, (In Chinese with English Abstract). [Google Scholar]
  34. Wen, X.Z.; Zhang, P.Z.; Du, F.; Long, F. The background of historical and modern seismic activities of the occurrence of the 2008 MS 8.0 Wenchuan, Sichuan, earthquake. Chin. J. Geophys. 2009, 52, 444–454, (In Chinese with English Abstract). [Google Scholar]
  35. Wen, X.Z.; Du, F.; Zhang, P.Z.; Long, F. Correlation of major earthquake sequences on the northern and eastern boundaries of the Bayan Har block, and its relation to the 2008 Wenchuan earthquake. Chin. J. Geophys. 2011, 54, 706–716. (In Chinese) [Google Scholar]
  36. Xu, X.W.; Wen, X.Z.; Han, Z.J.; Chen, G.H.; Li, C.Y.; Zheng, W.J.; Zhang, S.M.; Ren, Z.K.; Xu, C.; Tan, X.B.; et al. Lushan M S 7.0 earthquake: A blind reserve-fault event. Chin. Sci. Bull. 2013, 58, 3437–3443. [Google Scholar] [CrossRef]
  37. Wu, Y.Q.; Jiang, Z.S.; Wang, M.; Che, S.; Liao, H.; Li, Q.; Li, P.; Yang, Y.L.; Xiang, H.P.; Shao, Z.G.; et al. Preliminary results pertaining to coseismic displacement and preseismic strain accumulation of the Lushan MS 7.0 earthquake, as reflected by GPS surveying. Chin. Sci. Bull. 2013, 58, 3460–3466. [Google Scholar] [CrossRef]
  38. Jiang, Z.S.; Wang, M.; Wang, Y.; Wu, Y.Q.; Che, S.; Shen, Z.K.; Burgmann, R.; Sun, J.B.; Yang, Y.L.; Liao, H.; et al. GPS constrained coseismic source and slip distribution of the 2013 Mw6.6 Lushan, China, earthquake and its tectonic implications. Geophys. Res. Lett. 2014, 41, 407–413. [Google Scholar] [CrossRef] [Green Version]
  39. Perfetti, N. Detection of station coordinate discontinuities within the Italian GPS Fiducial Network. J. Geodesy 2006, 80, 381–396. [Google Scholar] [CrossRef]
  40. Zhan, W.; Li, F.; Hao, W.F.; Yan, J.G. Regional characteristics and influencing factors of seasonal vertical crustal motions in Yunnan, China. Geophys. J. Int. 2017, 210, 1295–1304. [Google Scholar] [CrossRef]
  41. Nikolaidis, R. Observation of Geodetic and Seismic Deformation with the Global Positioning System. Ph.D. Thesis, University of California, San Diego, CA, USA, 2002. [Google Scholar]
  42. Wu, Y.; Jiang, Z.; Liu, X.; Wei, W.; Zhu, S.; Zhang, L.; Du, J. A Comprehensive Study of Gridding Methods for GPS Horizontal Velocity Fields. Pure Appl. Geophys. 2017, 174, 1201–1217. [Google Scholar] [CrossRef]
Figure 1. The GPS velocities and co-seismic displacements associating with the Wenchuan earthquake. (a) GPS velocities of 1999–2007, and (b) co-seismic displacements associating with the Wenchuan earthquake (the dataset is taken from Wang et al., 2011) [15]. Active faults based on previous works of Reference [29], MWF: Maoxian-Wenchuan Fault; BYF: Beichuan-Yingxiu Fault; AGF: Anxian-Guanxian Fault. The dark gray rectangles are three GPS profiles, and the box in the index map shows the location of the research region.
Remotesensing 10 00894 g001
Figure 2. The GPS profile perpendicular to the Longmenshan Fault (LMF). (a) velocity profile using GPS velocity data during 1999–2007 covered by profile1 in Figure 1; (b) co-seismic displacement profile for the rupture segment associated with the Wenchuan earthquake, using the GPS velocity data covered by profile3 in Figure 2; (c) co-seismic displacement profile for the Southern Segment of the Longmenshan Fault (SSLMF) associated with Wenchuan earthquake, using the GPS velocity data covered by profile2.
Remotesensing 10 00894 g002
Figure 3. The distribution of the GPS continuous stations in the SSLMF. Active faults based on previous works of Deng et al. (2003) [29]. (MWF: Maoxian-Wenchuan Fault; BYF: Beichuan-Yingxiu Fault; AGF: Anxian-Guanxian Fault). The brown arrows are cartoon schematic, indicating the continuous deformation pattern dominates in the SSLMF. The size of arrows represents the crustal movement, but they are not in a real scale.
Remotesensing 10 00894 g003
Figure 4. The time-series of the strain parameters in the SSLMF. (a) Principal strain component in the Western Region, (b) principal strain components in the Eastern Region.
Remotesensing 10 00894 g004
Figure 5. The dynamic sketch of the azimuth angle of the principal compressive strain rate (APCS).
Remotesensing 10 00894 g005
Figure 6. The baseline variations and azimuth change of the GPS observations.
Remotesensing 10 00894 g006
Table 1. The dynamic adjustment of the azimuth angle of the principal compressive strain rate (APCS) before and after the Wenchuan earthquake.
1999–20072008.7–2009.002008.7–2009.252008.7–2009.52008.7–2009.75
Western Region102.7 ± 2.8°94.4 ± 6.6°112.5 ± 6.3°121.7 ± 9.2°125.5 ± 9.0°
Eastern Region107.7 ± 1.1°176.9 ± 12.8°160.4 ± 16.1°151.3 ± 5.3°153.7 ± 3.7°
2008.7–2010.02008.7–2010.52008.7–2011.02008.7–2012.02008.7–2013.3
Western Region122.3 ± 6.6122.4 ± 7.2°121.9 ± 7.7°123.7 ± 10.7°124.0 ± 12.8°
Eastern Region154.6 ± 0.9°153.9 ± 1.5°153.6 ± 3.3°153.8 ± 5.4°155.4 ± 5.9°
Note: The Western Region is enclosed by the stations of LS02, LS03, LS08, LS07, and LS06, and the East Region is enclosed by the stations of LS01, LS02, LS06, LS05, and LS04.
Table 2. The parallel and perpendicular components of the GPS baselines that cross the Southern Segment of the Longmenshan Fualt (SSLMF).
Distance (km)Relative Movement Perpendicular to the FaultRelative Movement Parallel to the FaultDeformation Pattern of Faults
mm/yearmm/(100 km × year)mm/yearmm/(100 km × year)
LS02–LS0365.2−4.0 ± 0.1−6.2−6.0 ± 0.1−9.2dextral and compression
LS01–LS0890.9−9.4 ± 0.3−10.3−0.5 ± 0.3−0.5compression and dextral
LS01–LS0774.6−4.0 ± 0.3−5.3−0.3 ± 0.3−0.4compression and dextral
LS04–LS0786.9−4.4 ± 0.1−5.1−0.4 ± 0.1−0.5compression and dextral
LS06–LS0718.7−1.3 ± 0.1−7.1−0.8 ± 0.1−4.0compression and dextral
LS05–LS0618.9−1.1 ± 0.1−6.00.1 ± 0.10.4compression and weak levorotatory
LS04–LS0549.9−2.0 ± 0.1−3.90.3 ± 0.10.6compression and weak levorotatory
Note: the values are calculated from the filtering results of Figure 5. A positive value means the tensile for the perpendicular component and the levorotatory for parallel component.

