Estimation of Burned Area in the Northeastern Siberian Boreal Forest from a Long-Term Data Record (LTDR) 1982–2015 Time Series


Abstract
:
1. Introduction
2. Materials and Methods
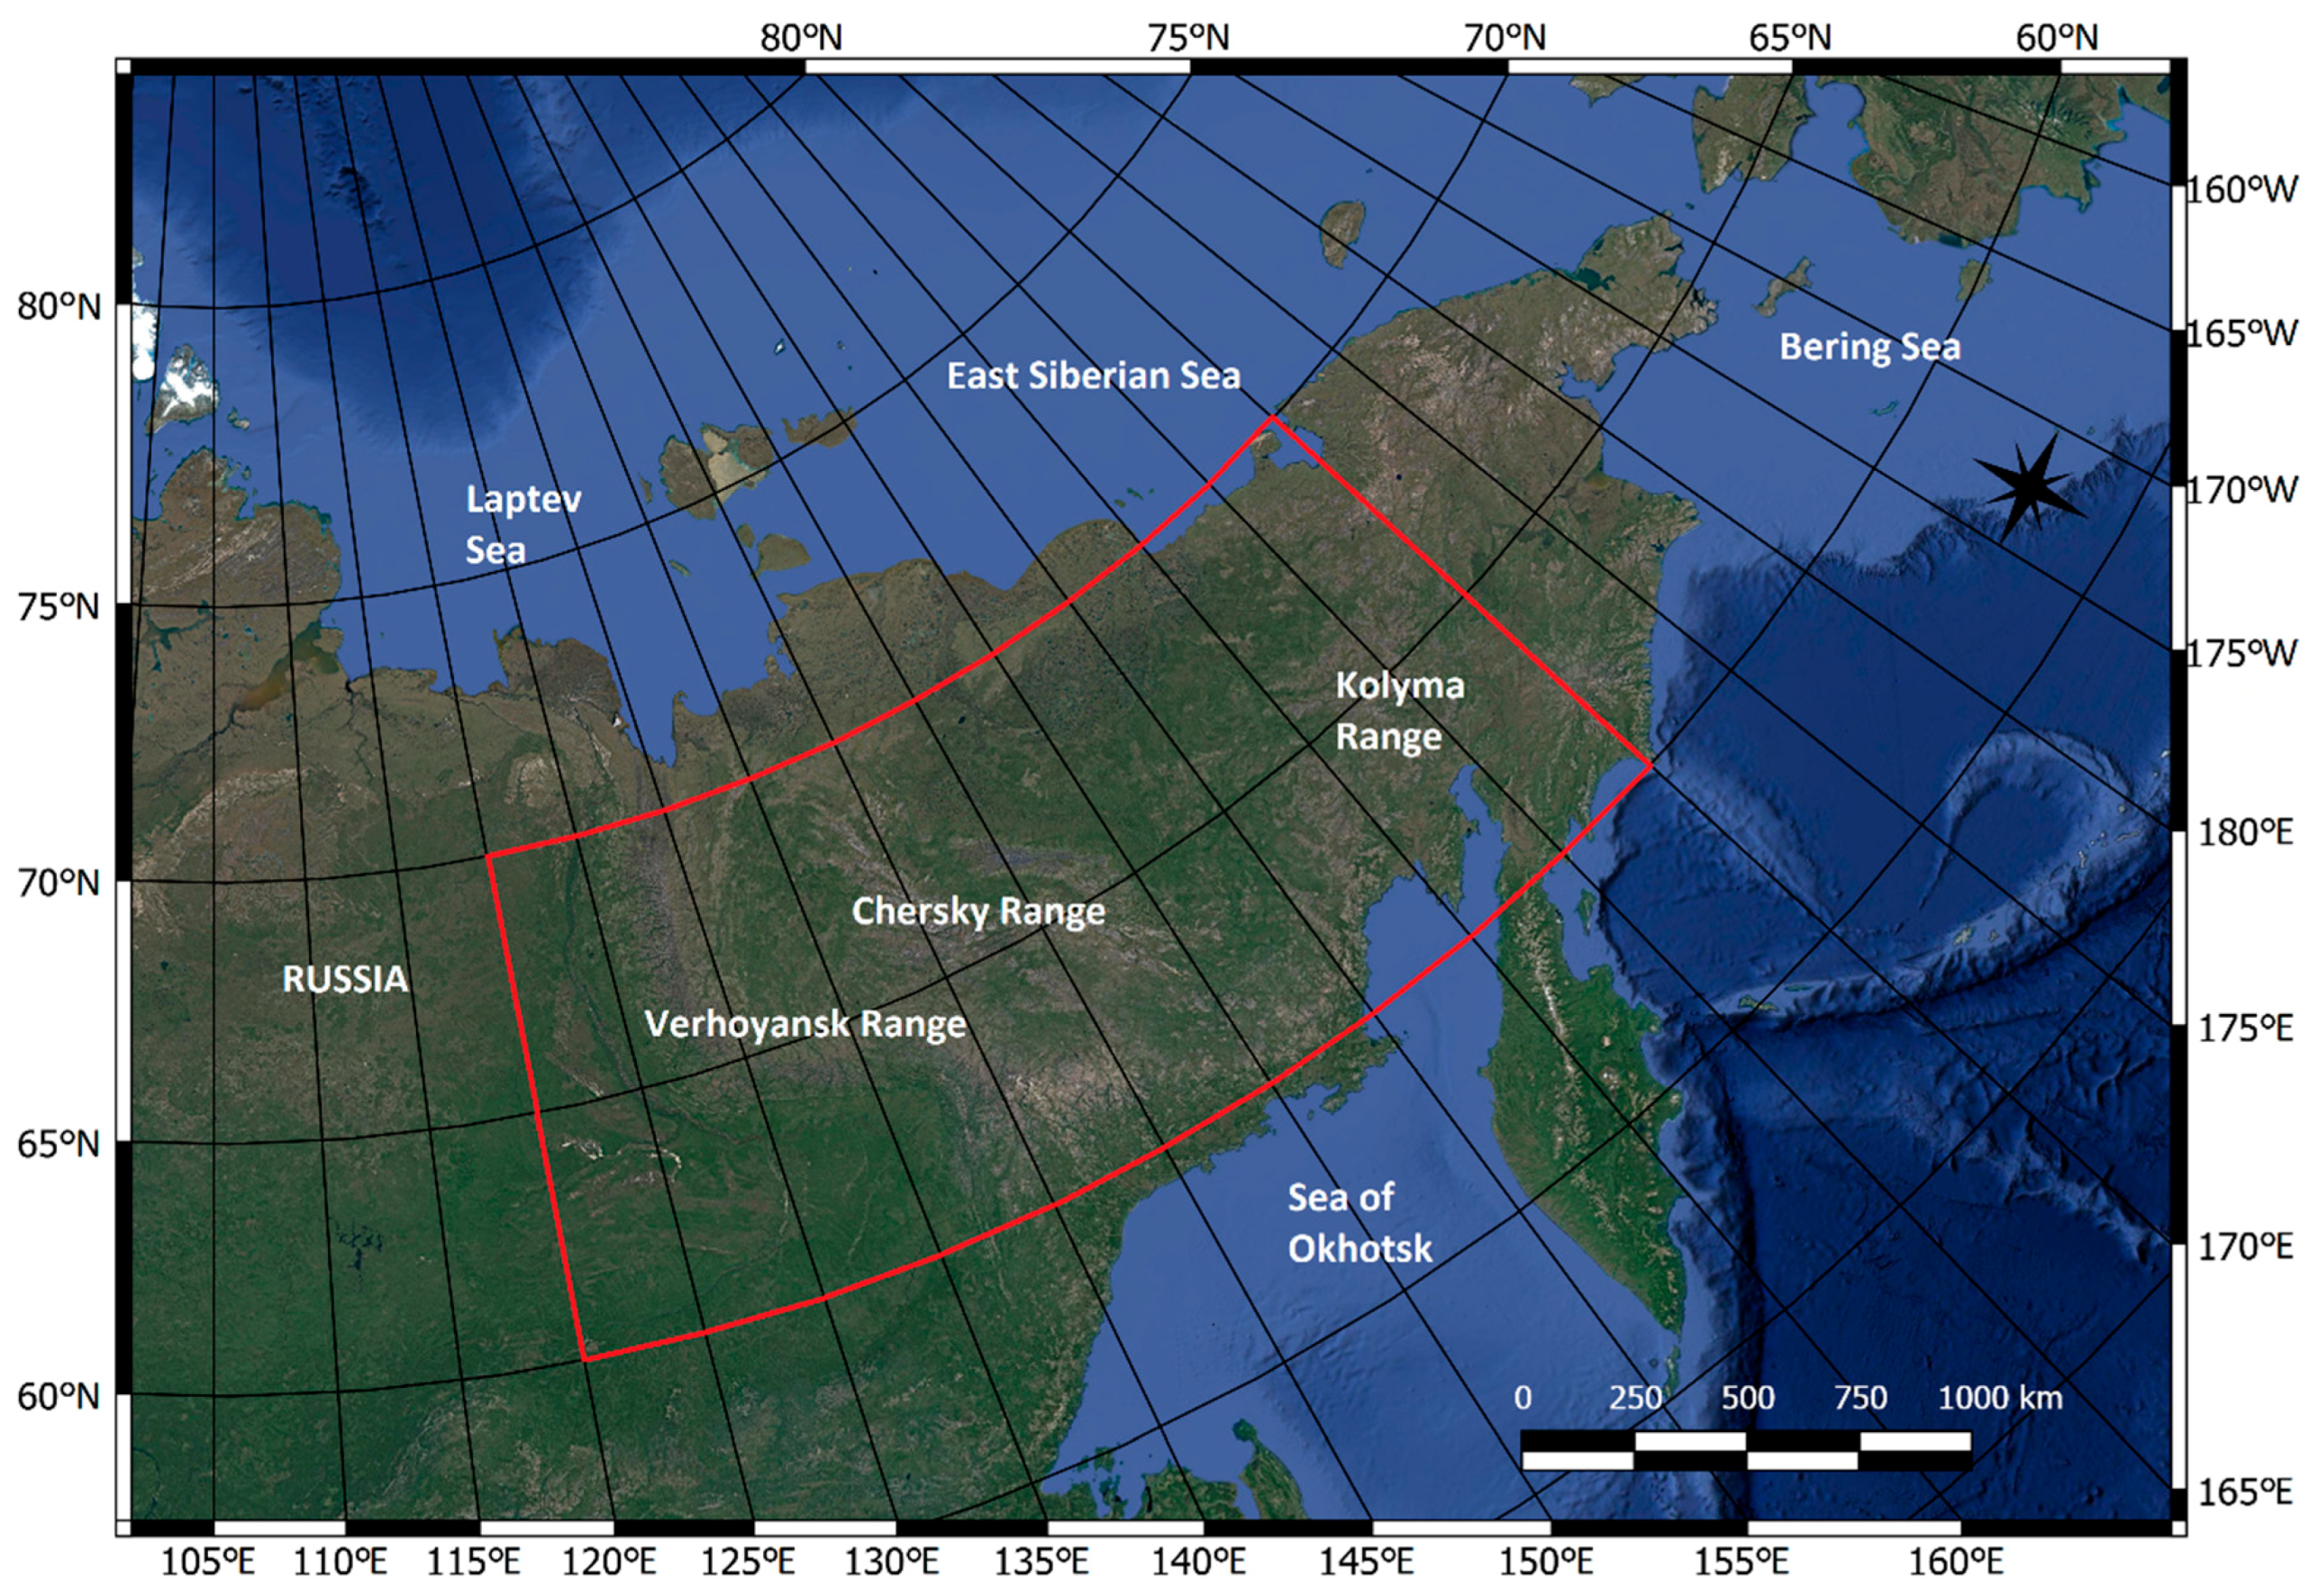
2.1. Study Area
2.2. LTDR Data Preprocessing
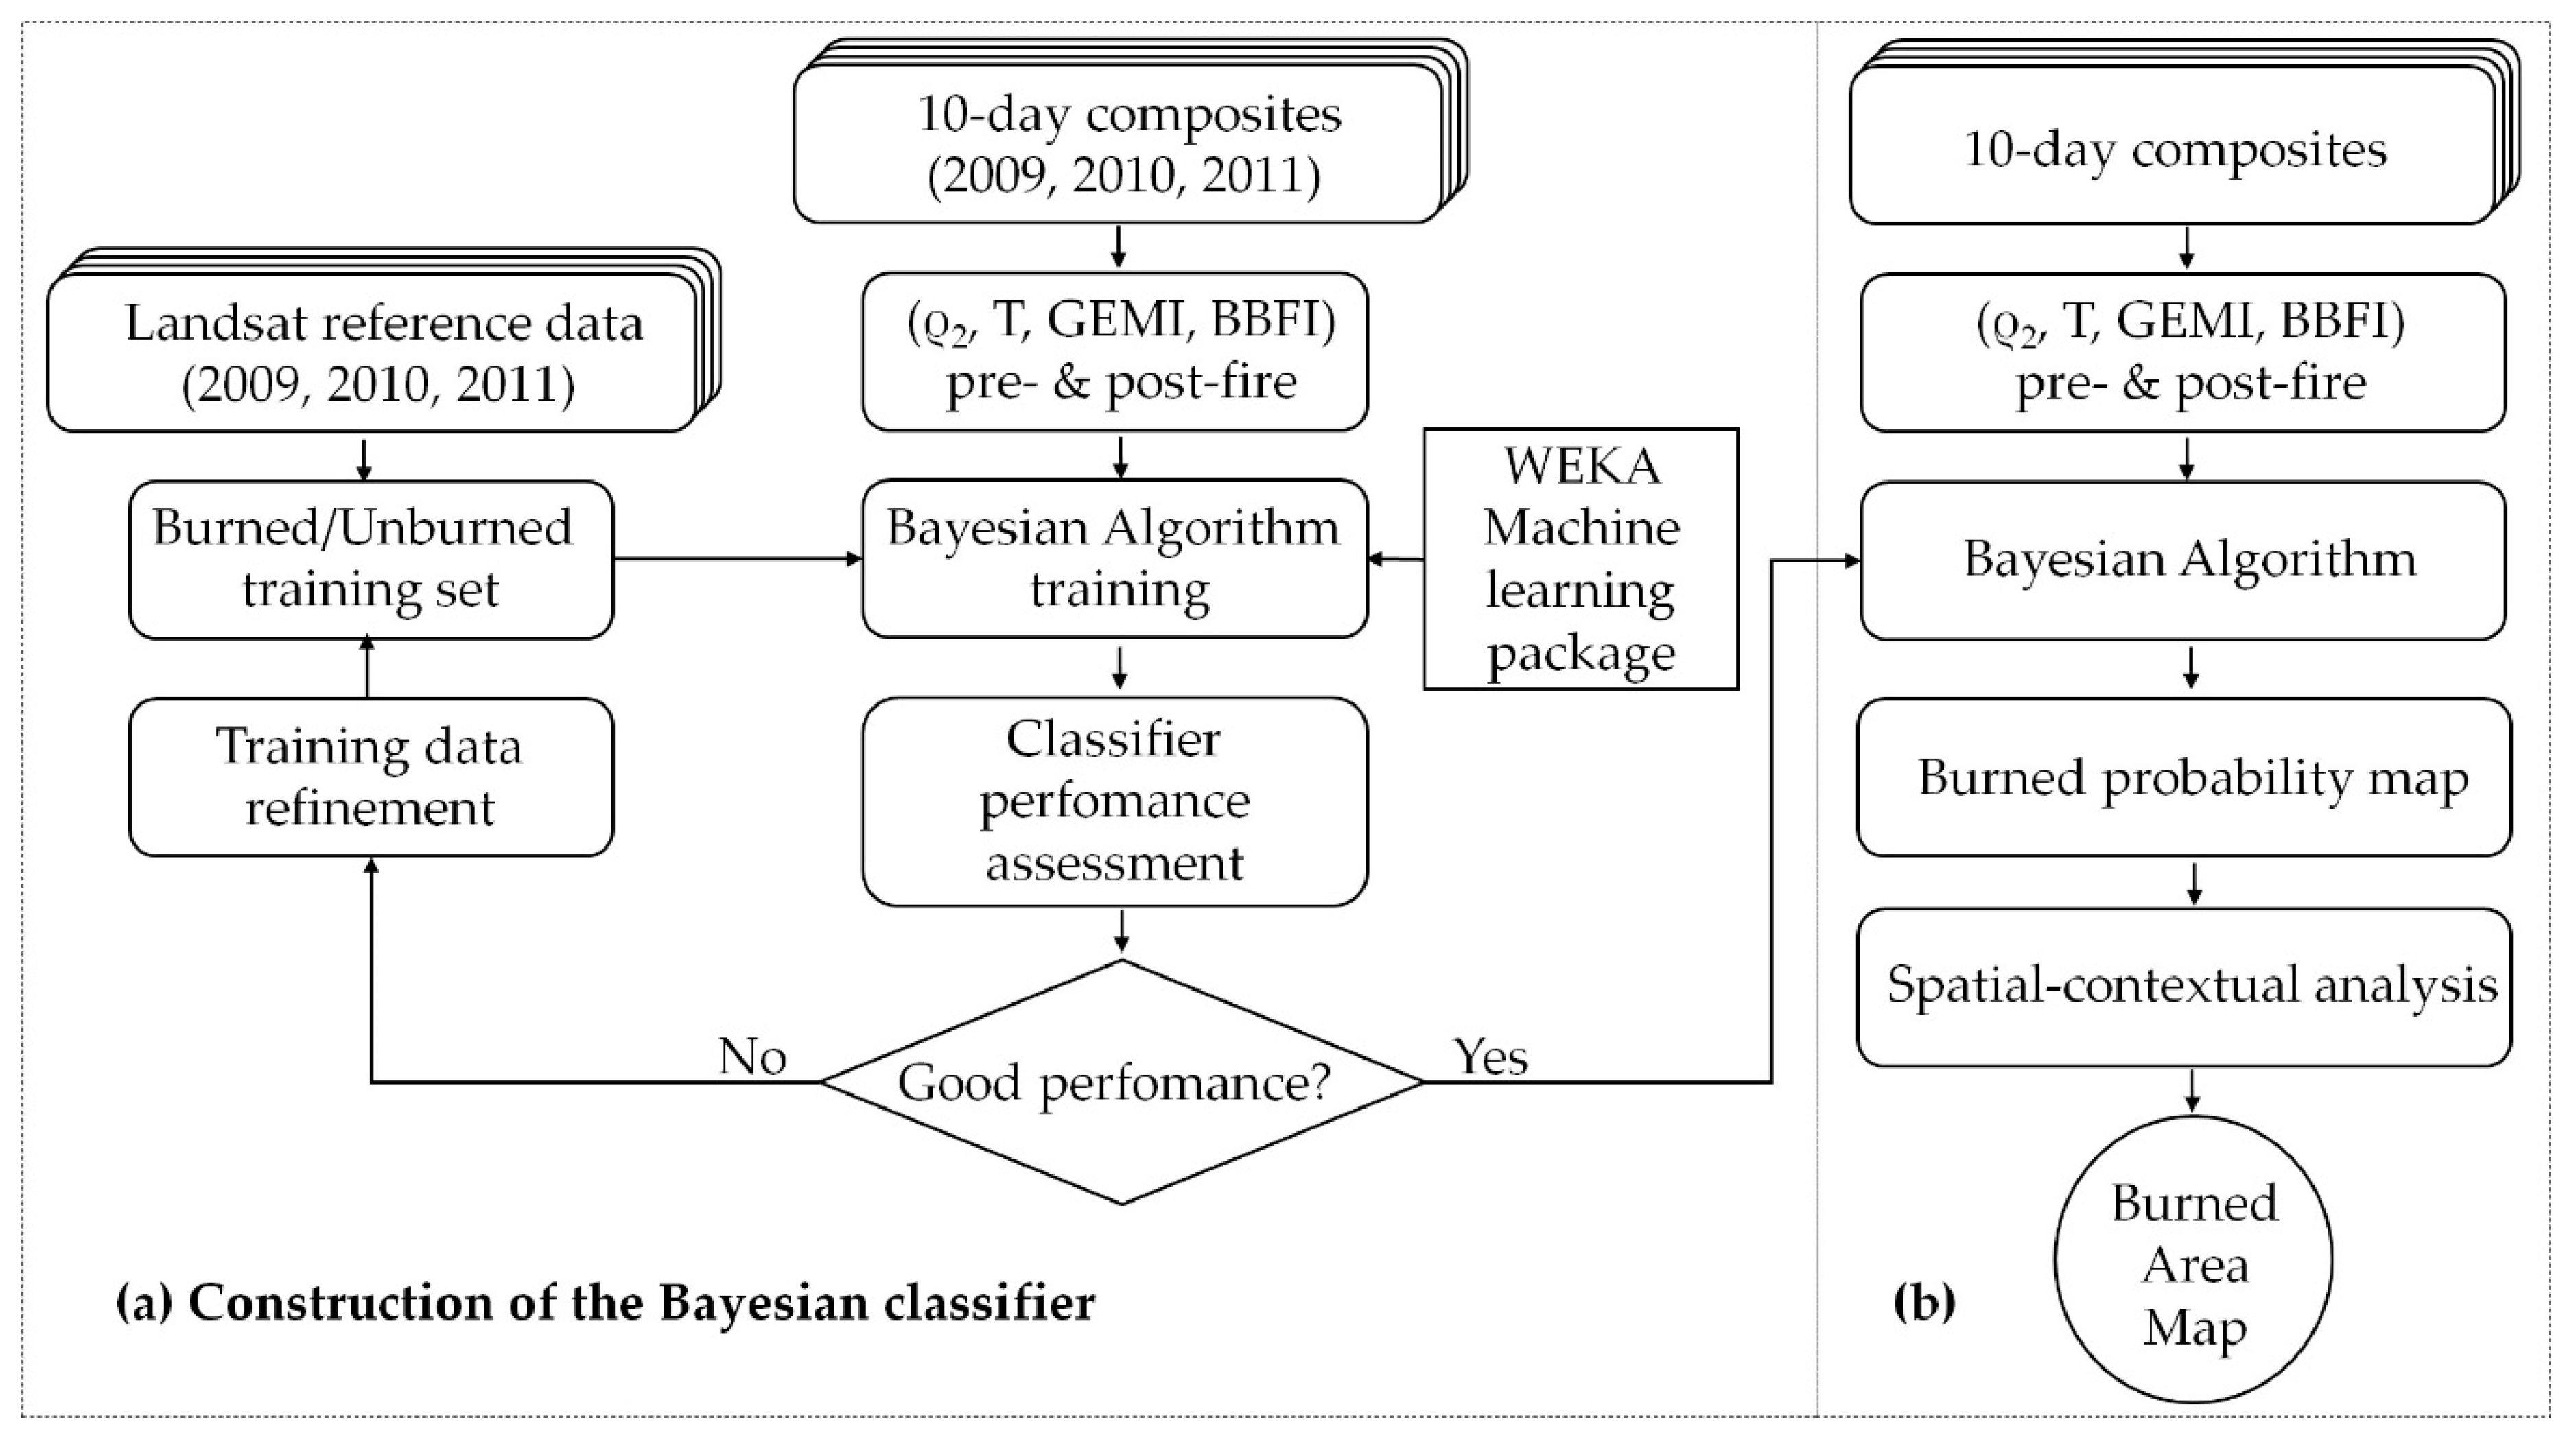
2.3. BA Algorithm
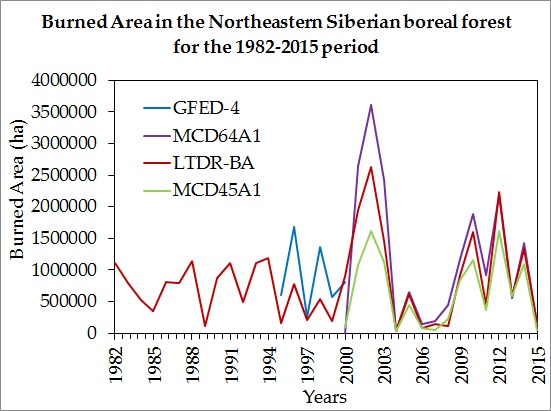
2.4. BA Time Series
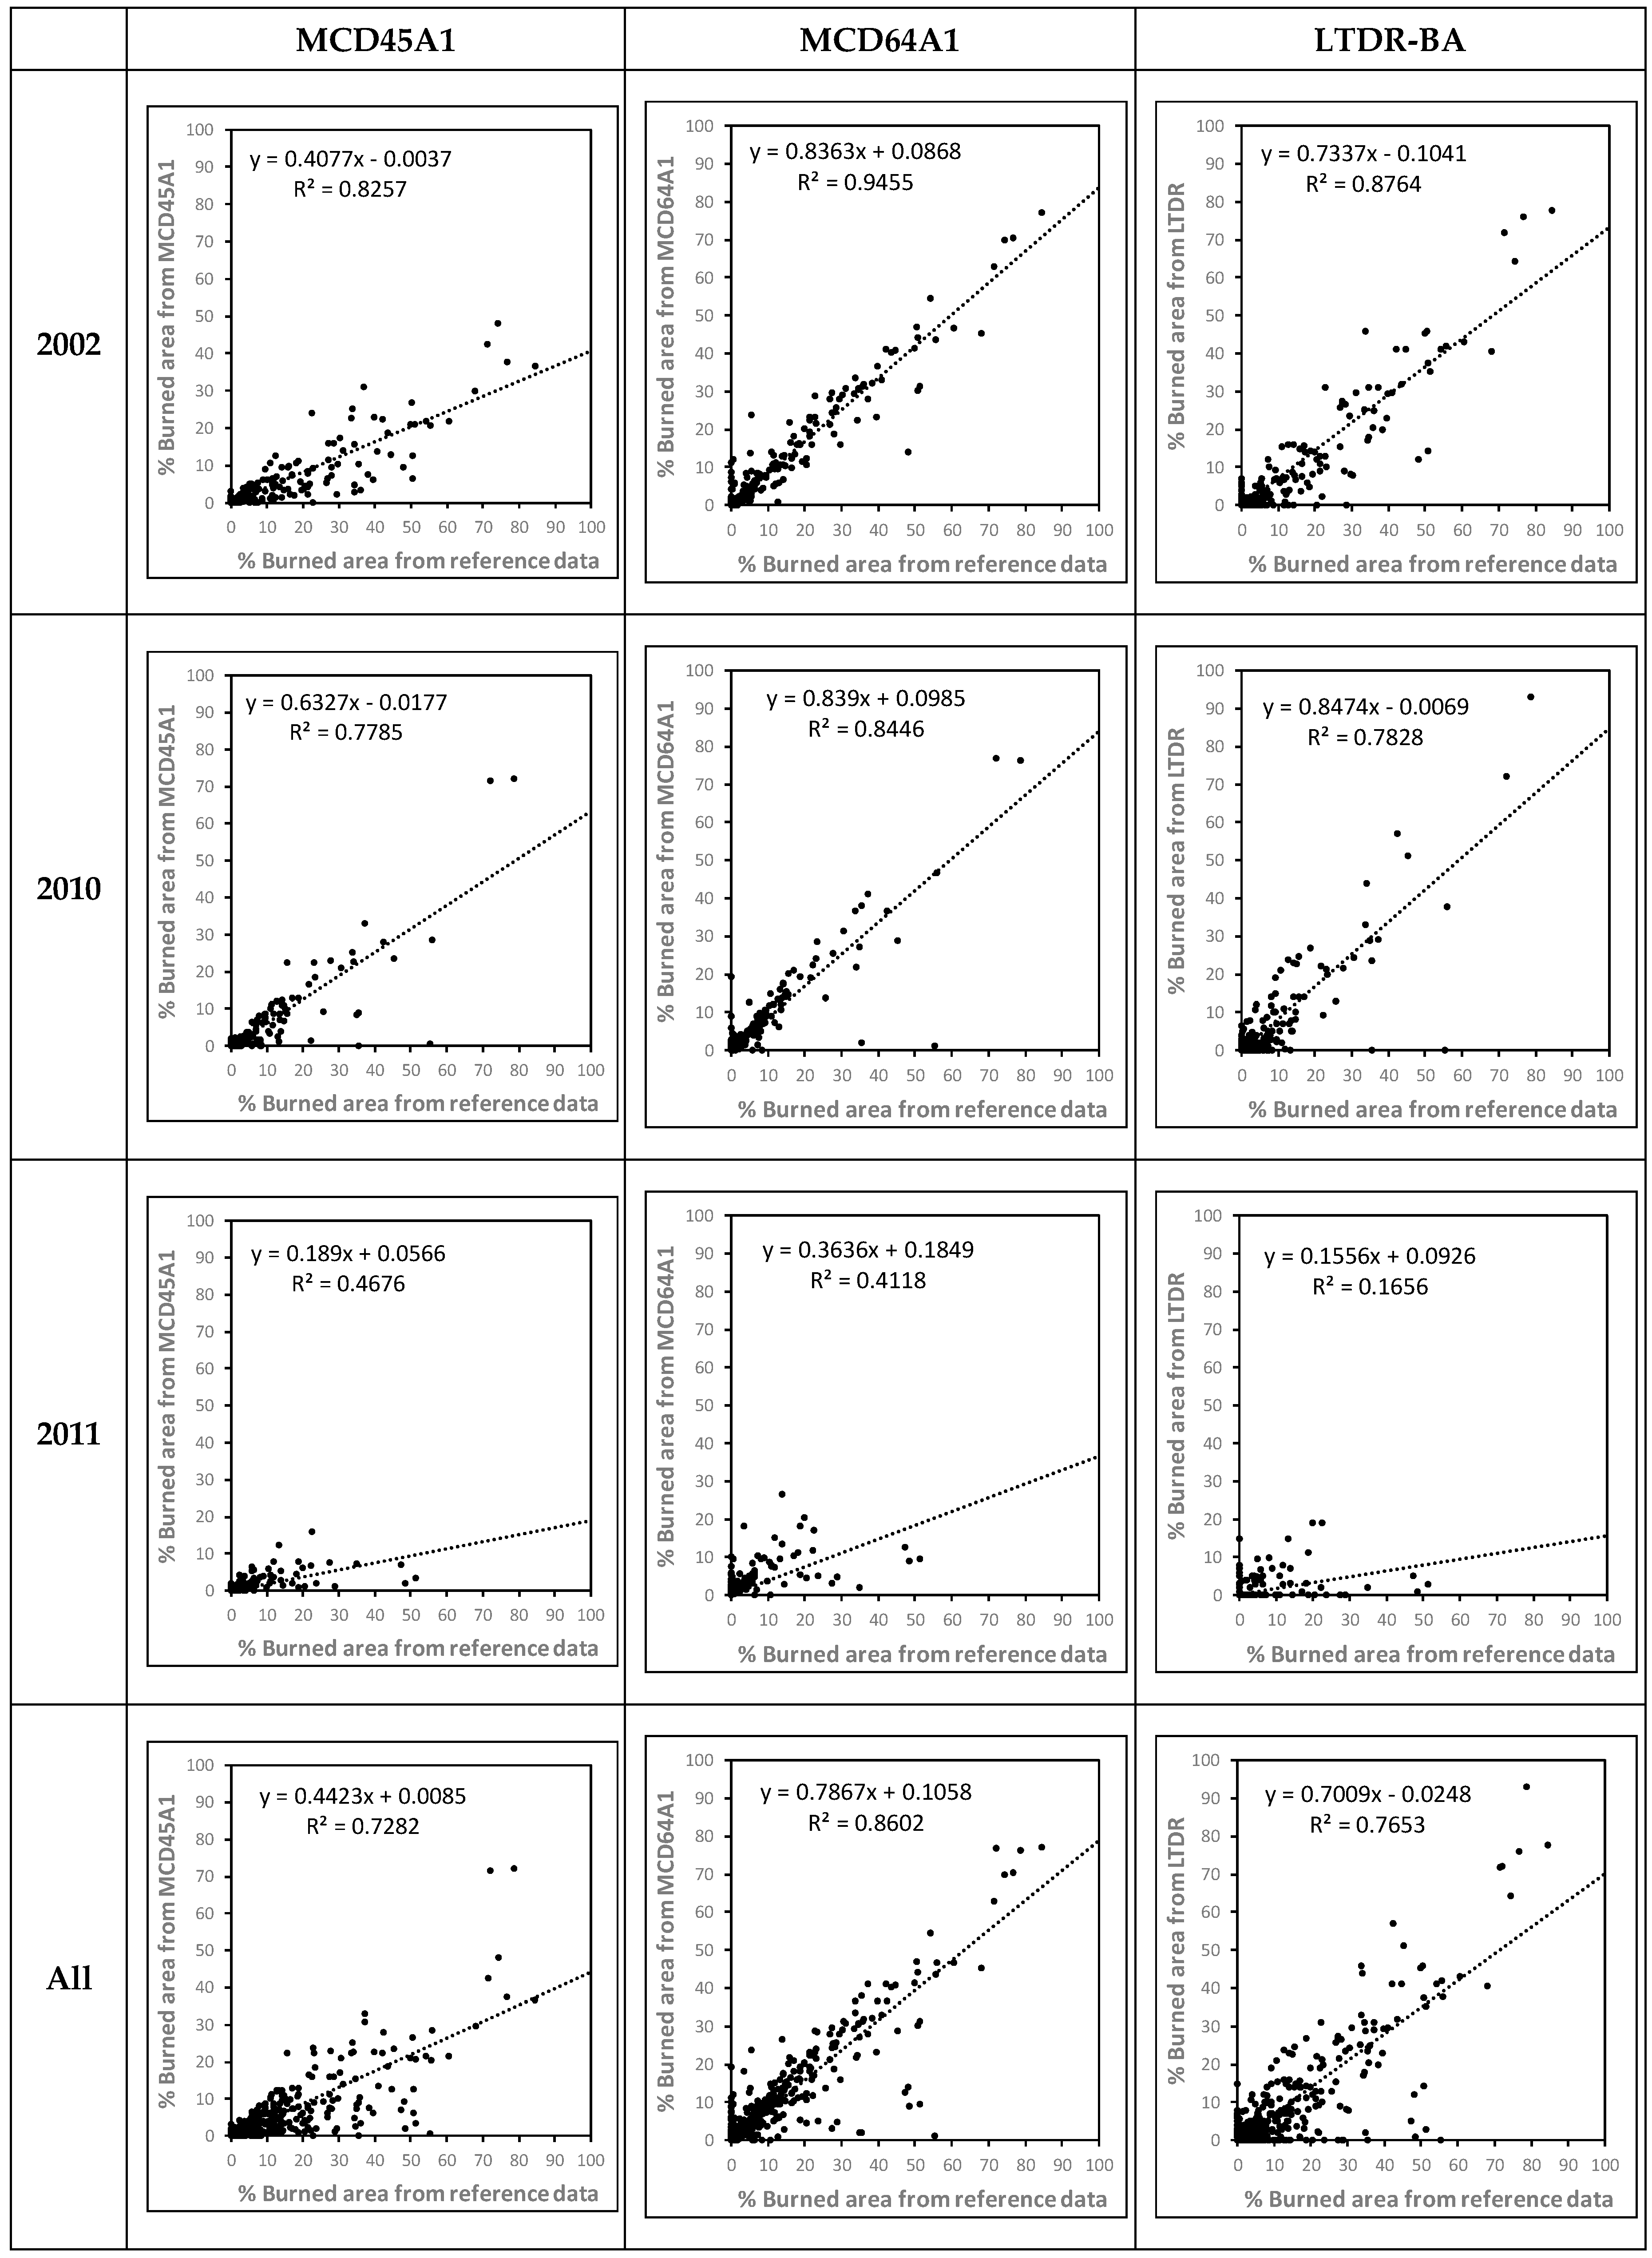
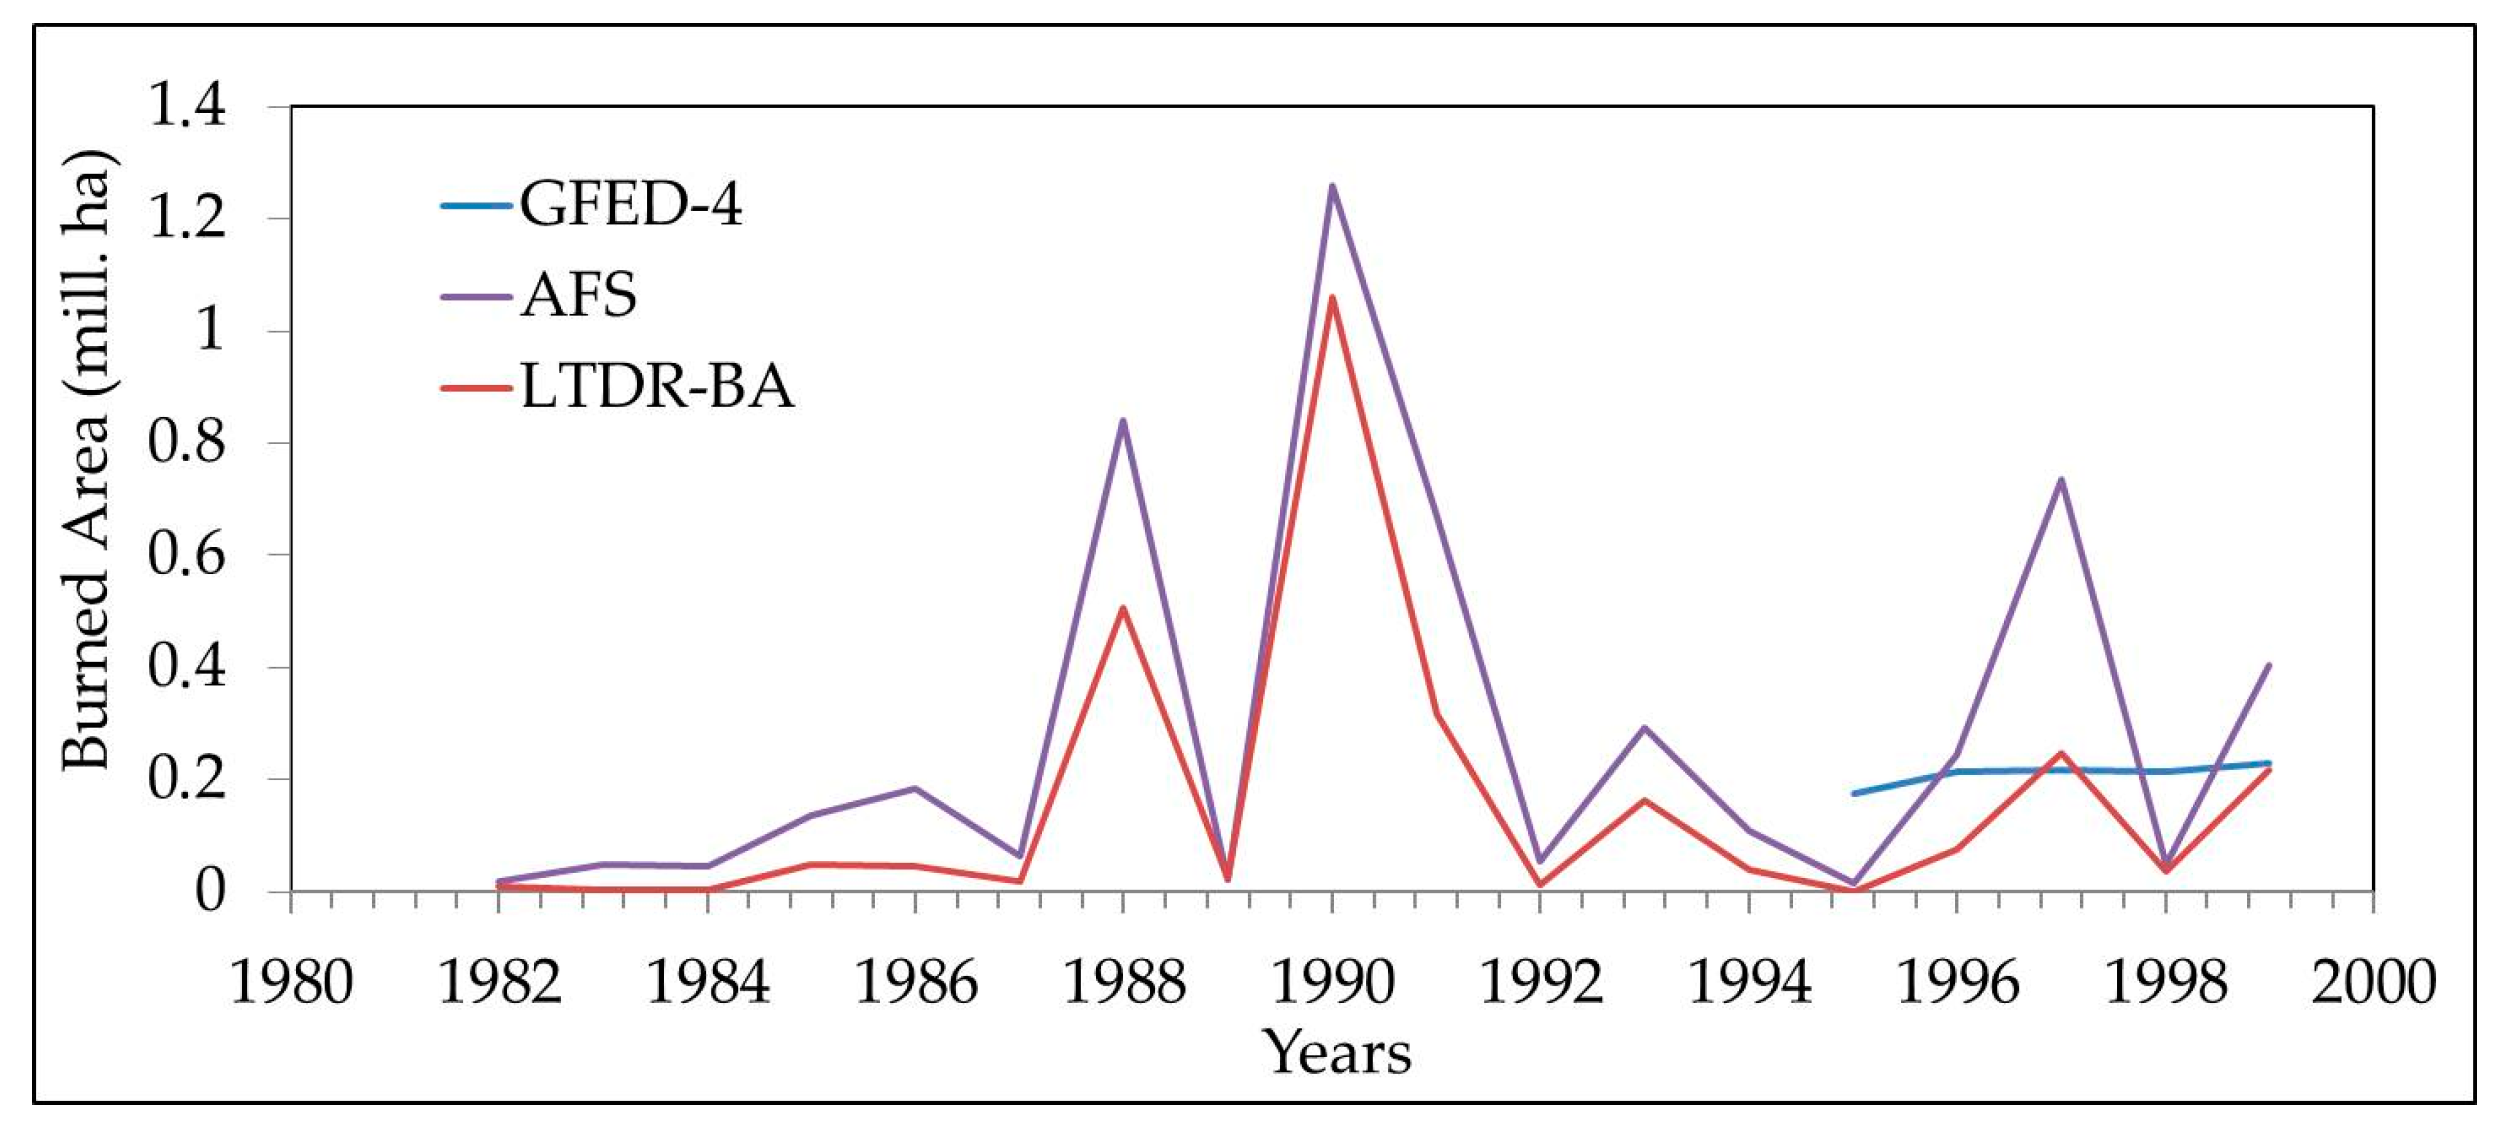
2.5. Accuracy Assessment of LTDR-BA
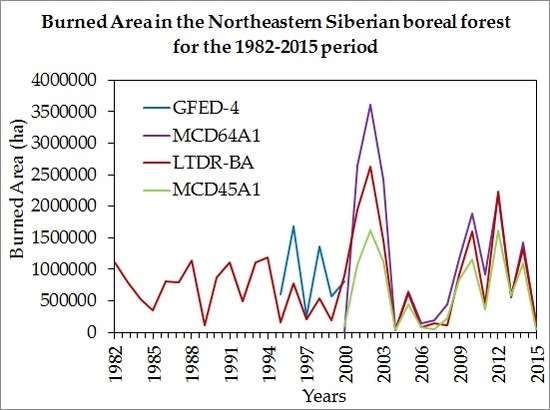
3. Results
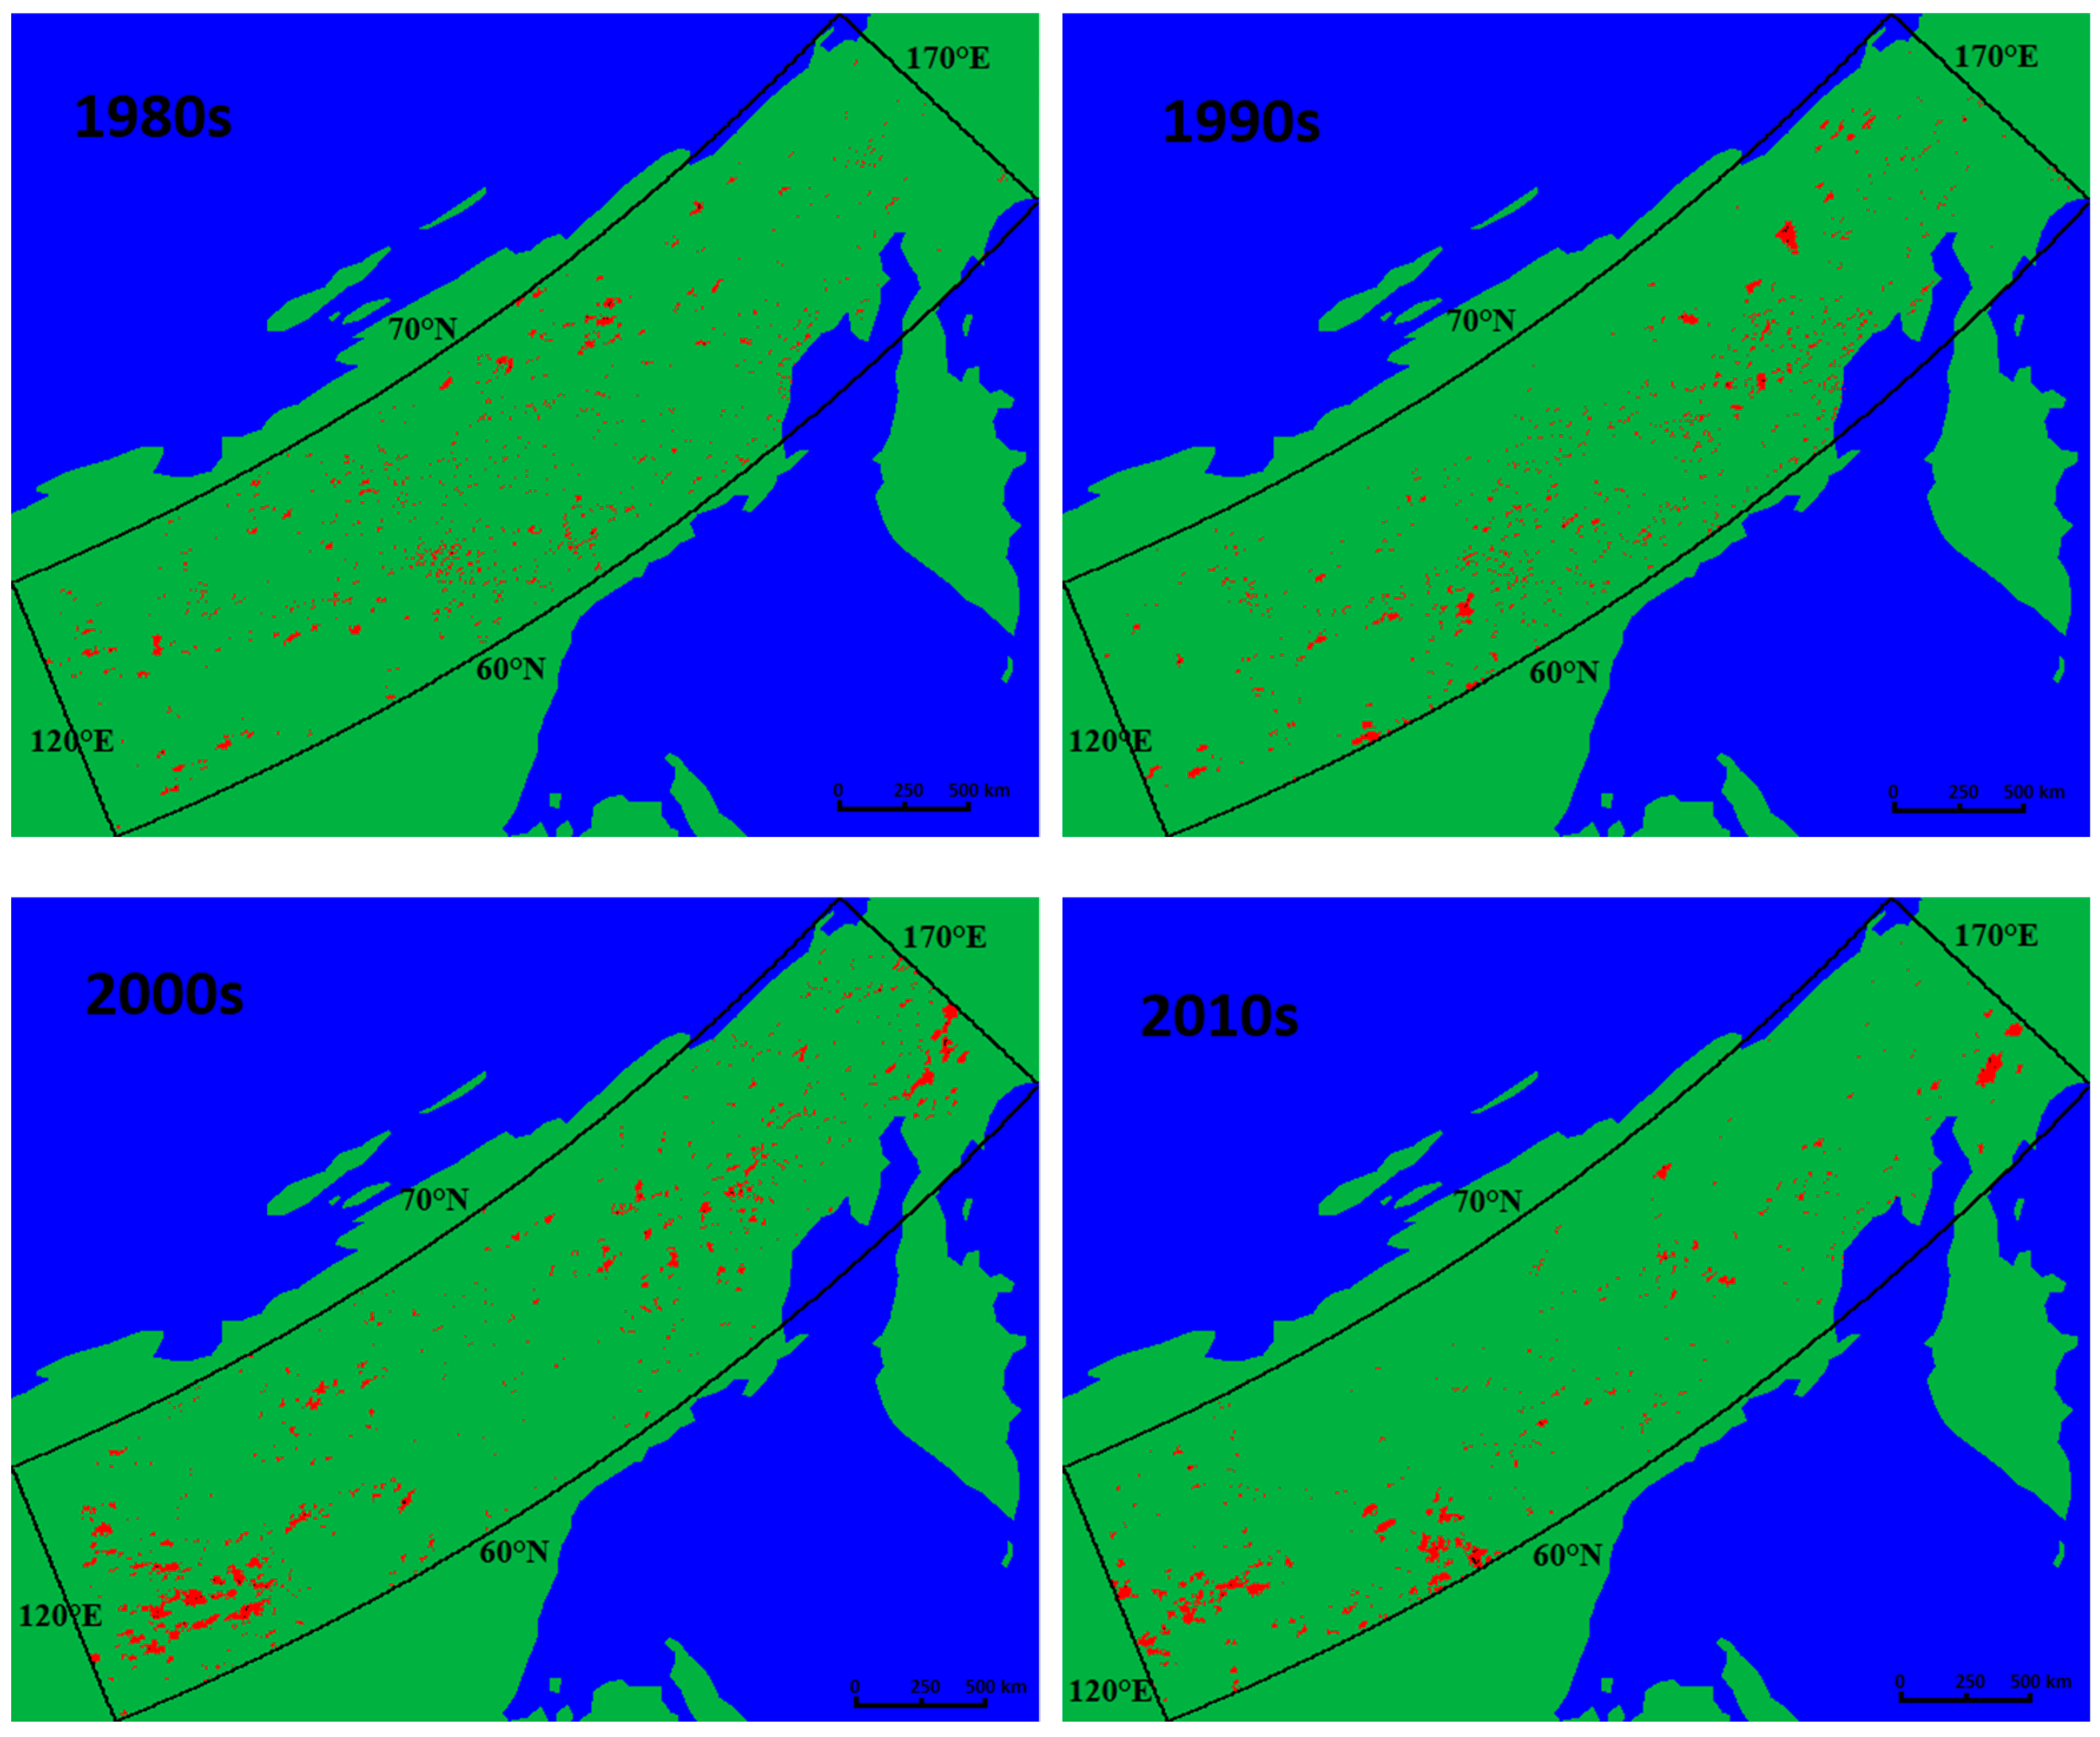
3.1. Annual NE Siberian Boreal Forest LTDR-BA Maps for the Period 1982–2015
3.2. Accuracy Assessment of LTDR-BA
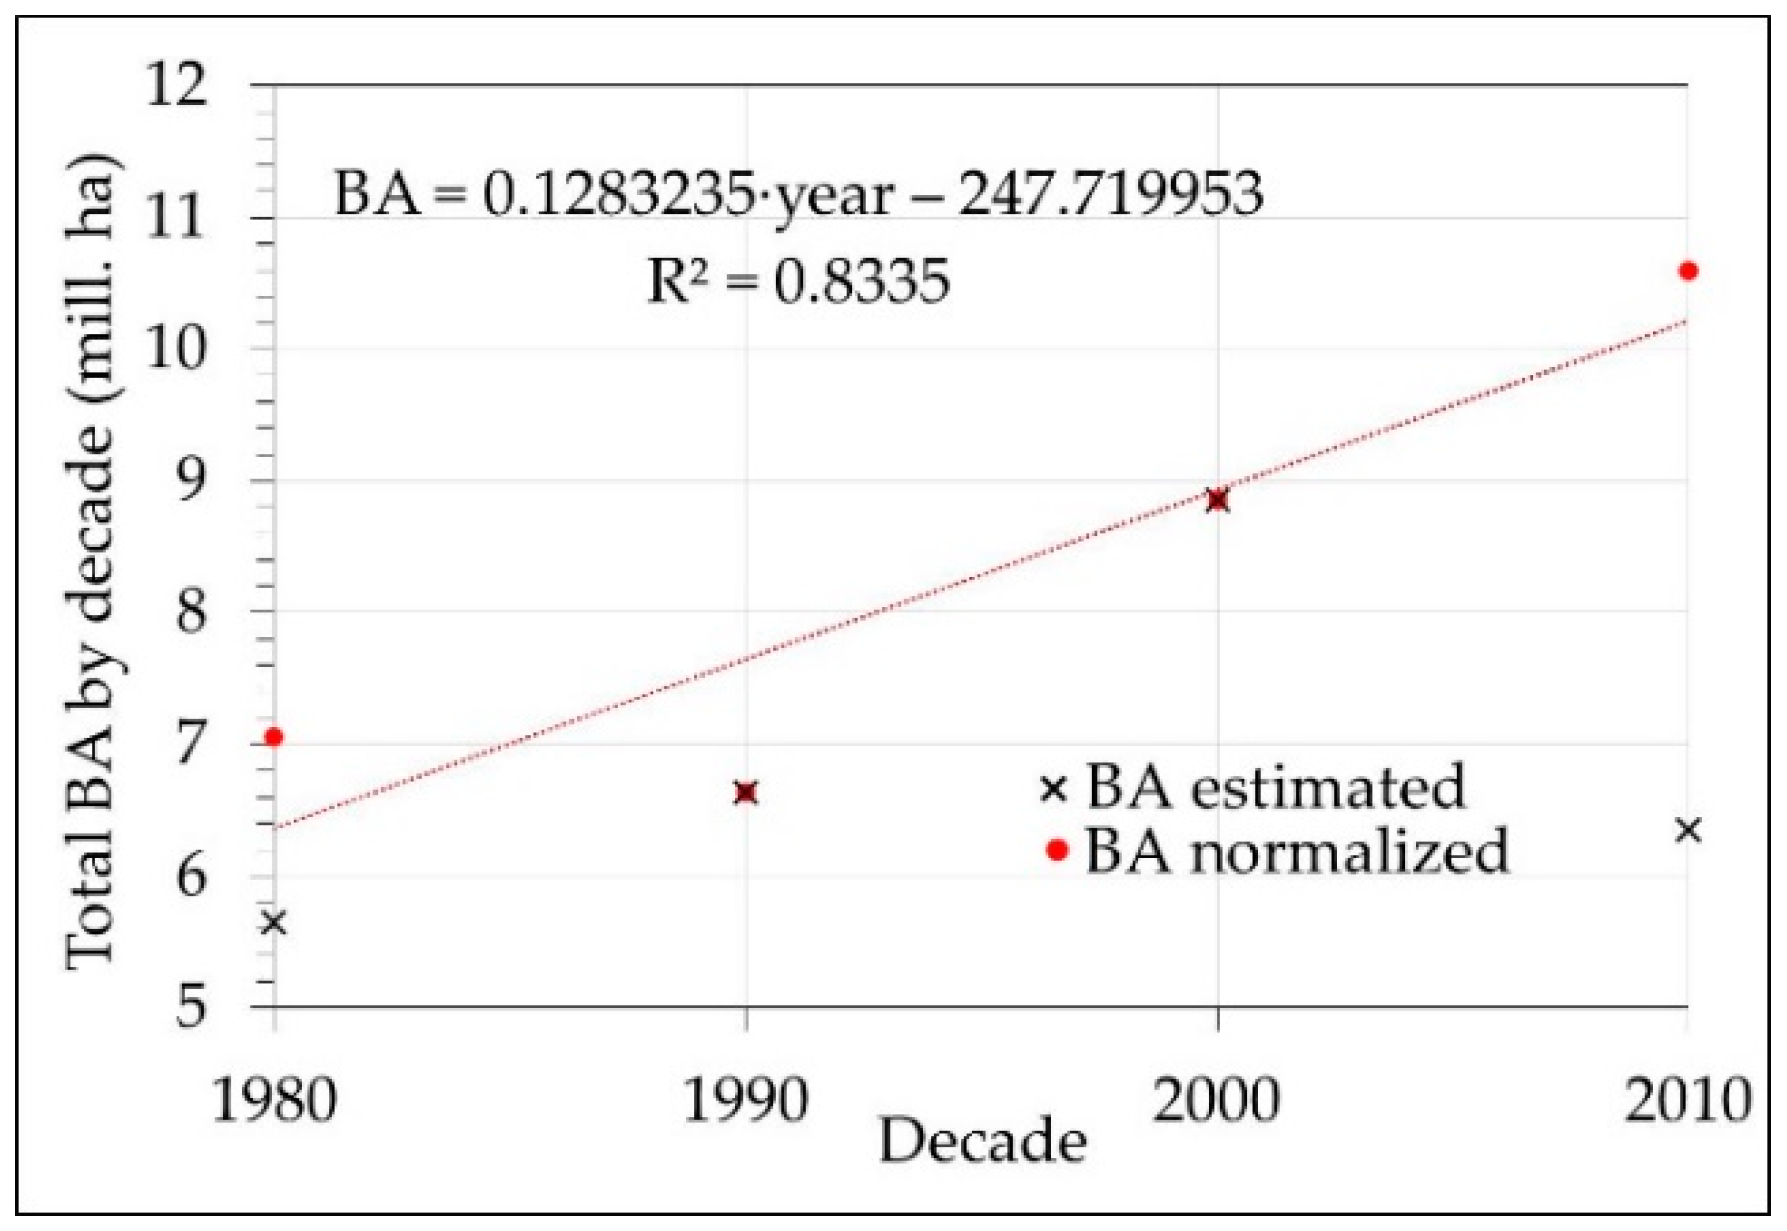
4. Discussion
5. Conclusions
Supplementary Materials
Author Contributions
Funding
Acknowledgments
Conflicts of Interest
References
- Bonan, G.B.; Pollard, D.; Thompson, S.L. Effects of Boreal Forest Vegetation on Global Climate. Nature 1992, 359, 716–718. [Google Scholar] [CrossRef]
- Fuchs, H.; Magdon, P.; Kleinn, C.; Flessa, H. Estimating aboveground carbon in a catchment of the Siberian forest tundra: Combining satellite imagery and field inventory. Remote Sens. Environ. 2009, 113, 518–531. [Google Scholar] [CrossRef]
- Kasischke, E.; Christensen, N.J.; Stocks, B. Fire, global warming, and the carbon balance of boreal forests. Ecol. Appl. 1995, 5, 437–451. [Google Scholar] [CrossRef]
- Shuman, J.K.; Shugart, H.H.; O’Halloran, T.L. Sensitivity of Siberian larch forests to climate change. Glob. Chang. Biol. 2011, 17, 2370–2384. [Google Scholar] [CrossRef]
- Chapin, F.S.; Mcguire, A.D.; Randerson, J.; Pielke, R.; Baldocchi, D.; Hobbie, S.E.; Roulet, N.; Eugster, W.; Kasischke, E.; Rastetter, E.B.; et al. Arctic and boreal ecosystems of western North America as components of the climate system. Glob. Chang. Biol. 2000, 6, 211–223. [Google Scholar] [CrossRef] [Green Version]
- Kasischke, E.S.; Hyer, E.J.; Novelli, P.C.; Bruhwiler, L.P.; French, N.H.F.; Sukhinin, A.I.; Hewson, J.H.; Stocks, B.J. Influences of boreal fire emissions on Northern Hemisphere atmospheric carbon and carbon monoxide. Glob. Biogeochem. Cycles 2005, 19, 1–16. [Google Scholar] [CrossRef]
- Ahlgren, I.F.; Ahlgren, C.E. Ecological effects of forest fires. Bot. Rev. 1960, 26, 483–533. [Google Scholar] [CrossRef]
- Harden, J.W.; Trumbore, S.E.; Stocks, B.J.; Hirsch, A.; Gower, S.T.; O’Neill, K.P.; Kasischke, E.S. The role of fire in the boreal carbon budget. Glob. Chang. Biol. 2000, 6, 174–184. [Google Scholar] [CrossRef] [Green Version]
- Kasischke, E.S.; Stocks, B.J. Fire, Climate Change, and Carbon Cycling in the Boreal Forest; Kasischke, E.S., Stocks, B.J., Eds.; Springer: New York, NY, USA, 2000; ISBN 978-0-387-21629-4. [Google Scholar]
- Hall, J.V.; Loboda, T.V.; Giglio, L.; McCarty, G.W. A MODIS-based burned area assessment for Russian croplands: Mapping requirements and challenges. Remote Sens. Environ. 2016, 184, 506–521. [Google Scholar] [CrossRef]
- Krylov, A.; McCarty, J.L.; Potapov, P.; Loboda, T.; Tyukavina, A.; Turubanova, S.; Hansen, M.C. Remote sensing estimates of stand-replacement fires in Russia, 2002–2011. Environ. Res. Lett. 2014, 9. [Google Scholar] [CrossRef]
- Vinogradova, A.A.; Smirnov, N.S.; Korotkov, V.N.; Romanovskaya, A.A. Forest fires in Siberia and the Far East: Emissions and atmospheric transport of black carbon to the Arctic. Atmos. Ocean. Opt. 2015, 28, 566–574. [Google Scholar] [CrossRef]
- Chen, D.; Loboda, T.V.; Krylov, A.; Potapov, P.V. Mapping stand age dynamics of the Siberian larch forests from recent Landsat observations. Remote Sens. Environ. 2016, 187. [Google Scholar] [CrossRef]
- Chen, W.; Moriya, K.; Sakai, T.; Koyama, L.; Cao, C.X. Mapping a burned forest area from Landsat TM data by multiple methods. Geomat. Nat. Hazards Risk 2014, 5705, 1–19. [Google Scholar] [CrossRef]
- Liu, Z. Mapping recent burned patches in Siberian larch forest using Landsat and MODIS data. Eur. J. Remote Sens. 2016, 49, 861–887. [Google Scholar] [CrossRef] [Green Version]
- Vivchar, A. Wildfires in Russia in 2000–2008: Estimates of burnt areas using the satellite MODIS MCD45 data. Remote Sens. Lett. 2011, 2, 81–90. [Google Scholar] [CrossRef]
- Huang, H.; Roy, D.P.; Boschetti, L.; Zhang, H.K.; Yan, L.; Kumar, S.S.; Gomez-Dans, J.; Li, J. Separability analysis of Sentinel-2A Multi-Spectral Instrument (MSI) data for burned area discrimination. Remote Sens. 2016, 8. [Google Scholar] [CrossRef]
- Loboda, T.; O’Neal, K.J.; Csiszar, I. Regionally adaptable dNBR-based algorithm for burned area mapping from MODIS data. Remote Sens. Environ. 2007, 109, 429–442. [Google Scholar] [CrossRef]
- Kasischke, E.S.; French, N.H.F. Locating and estimating the areal extent of wildfires in alaskan boreal forests using multiple-season AVHRR NDVI composite data. Remote Sens. Environ. 1995, 51, 263–275. [Google Scholar] [CrossRef]
- Zhang, Y.H.; Wooster, M.J.; Tutubalina, O.; Perry, G.L.W. Monthly burned area and forest fire carbon emission estimates for the Russian Federation from SPOT VGT. Remote Sens. Environ. 2003, 87, 1–15. [Google Scholar] [CrossRef]
- Tansey, K.; Grégoire, J.M.; Stroppiana, D.; Sousa, A.; Silva, J.; Pereira, J.M.C.; Boschetti, L.; Maggi, M.; Brivio, P.A.; Fraser, R.; et al. Vegetation burning in the year 2000: Global burned area estimates from SPOT VEGETATION data. J. Geophys. Res. D Atmos. 2004, 109, 1–22. [Google Scholar] [CrossRef]
- Giglio, L.; Loboda, T.; Roy, D.P.; Quayle, B.; Justice, C.O. An active-fire based burned area mapping algorithm for the MODIS sensor. Remote Sens. Environ. 2009, 113, 408–420. [Google Scholar] [CrossRef]
- Bastarrika, A.; Chuvieco, E.; Martín, M.P. Mapping burned areas from landsat TM/ETM+ data with a two-phase algorithm: Balancing omission and commission errors. Remote Sens. Environ. 2011, 115, 1003–1012. [Google Scholar] [CrossRef]
- Kumar, S.S.; Roy, D.P. Global operational land imager Landsat-8 reflectance-based active fire detection algorithm. Int. J. Digit. Earth 2018, 11, 154–178. [Google Scholar] [CrossRef]
- Roy, D.P.; Giglio, L.; Kendall, J.D.; Justice, C.O. Multi-temporal active-fire based burn scar detection algorithm. Int. J. Remote Sens. 1999, 20, 1031–1038. [Google Scholar] [CrossRef]
- Oliva, P.; Schroeder, W. Assessment of VIIRS 375 m active fire detection product for direct burned area mapping. Remote Sens. Environ. 2015, 160, 144–155. [Google Scholar] [CrossRef]
- Giglio, L.; van der Werf, G.R.; Randerson, J.T.; Collatz, G.J.; Kasibhatla, P. Global estimation of burned area using MODIS active fire observations. Atmos. Chem. Phys. 2006, 6, 957–974. [Google Scholar] [CrossRef] [Green Version]
- Biswajeet, P.; Hamid, A. Forest Fire Detection and Monitoring using High Temporal MODIS and NOAA AVHRR Satellite Images in Peninsular Malaysia. Disaster Adv. 2010, 3, 18–23. [Google Scholar]
- Boschetti, L.; Roy, D.P.; Justice, C.O.; Humber, M.L. MODIS-Landsat fusion for large area 30 m burned area mapping. Remote Sens. Environ. 2015, 161, 27–42. [Google Scholar] [CrossRef]
- Fraser, R.H.; Li, Z.; Landry, R. SPOT VEGETATION for characterizing Boreal forest fires. Int. J. Remote Sens. 2000, 21, 3525–3532. [Google Scholar] [CrossRef]
- Fraser, R.H.; Li, Z.; Cihlar, J. Hotspot and NDVI differencing synergy (HANDS): A new technique for burned area mapping over boreal forest. Remote Sens. Environ. 2000, 74, 362–376. [Google Scholar] [CrossRef]
- Mouillot, F.; Schultz, M.G.; Yue, C.; Cadule, P.; Tansey, K.; Ciais, P.; Chuvieco, E. Ten years of global burned area products from spaceborne remote sensing—A review: Analysis of user needs and recommendations for future developments. Int. J. Appl. Earth Obs. Geoinf. 2014, 26, 64–79. [Google Scholar] [CrossRef] [Green Version]
- Justice, C.O.; Giglio, L.; Korontzi, S.; Owens, J.; Morisette, J.T.; Roy, D.; Descloitres, J.; Alleaume, S.; Petitcolin, F.; Kaufman, Y. The MODIS fire products. Remote Sens. Environ. 2002, 83, 244–262. [Google Scholar] [CrossRef]
- Roy, D.P.; Jin, Y.; Lewis, P.E.; Justice, C.O. Prototyping a global algorithm for systematic fire-affected area mapping using MODIS time series data. Remote Sens. Environ. 2005, 97, 137–162. [Google Scholar] [CrossRef]
- Roy, D.P.; Boschetti, L.; Justice, C.O.; Ju, J. The collection 5 MODIS burned area product—Global evaluation by comparison with the MODIS active fire product. Remote Sens. Environ. 2008, 112, 3690–3707. [Google Scholar] [CrossRef]
- Giglio, L.; Randerson, J.T.; Van Der Werf, G.R. Analysis of daily, monthly, and annual burned area using the fourth-generation global fire emissions database (GFED4). J. Geophys. Res. Biogeosci. 2013, 118, 317–328. [Google Scholar] [CrossRef] [Green Version]
- Chuvieco, E.; Lizundia-loiola, J.; Pettinari, M.L.; Ramo, R.; Padilla, M.; Mouillot, F.; Laurent, P.; Storm, T.; Heil, A.; Plummer, S. Generation and analysis of a new global burned area product based on MODIS 250m reflectance bands and thermal anomalies. Earth Syst. Sci. Data Discuss 2018, 512, 1–24. [Google Scholar] [CrossRef]
- Al-Saadi, J.; Soja, A.; Pierce, R.B.; Szykman, J.; Wiedinmyer, C.; Emmons, L.K.; Kondragunta, S.; Zhang, X.; Kittaka, C.; Schaak, T.; et al. Intercomparison of near-real-time biomass burning emissions estimates constrained by satellite fire data. J. Appl. Remote Sens. 2008, 2. [Google Scholar] [CrossRef]
- Chuvieco, E.; Englefield, P.; Trishchenko, A.P.; Luo, Y. Generation of long time series of burn area maps of the boreal forest from NOAA-AVHRR composite data. Remote Sens. Environ. 2008, 112, 2381–2396. [Google Scholar] [CrossRef]
- Kasischke, E.S.; Loboda, T.; Giglio, L.; French, N.H.F.; Hoy, E.E.; De Jong, B.; Riano, D. Quantifying burned area for North American forests: Implications for direct reduction of carbon stocks. J. Geophys. Res. Biogeosci. 2011, 116, 1–17. [Google Scholar] [CrossRef]
- Loboda, T.V.; French, N.H.F.; Hight-Harf, C.; Jenkins, L.; Miller, M.E. Mapping fire extent and burn severity in Alaskan tussock tundra: An analysis of the spectral response of tundra vegetation to wildland fire. Remote Sens. Environ. 2013, 134, 194–209. [Google Scholar] [CrossRef]
- Moreno Ruiz, J.A.; Riaño, D.; Arbelo, M.; French, N.H.F.; Ustin, S.L.; Whiting, M.L. Burned area mapping time series in Canada (1984–1999) from NOAA-AVHRR LTDR: A comparison with other remote sensing products and fire perimeters. Remote Sens. Environ. 2012, 117, 407–414. [Google Scholar] [CrossRef]
- Moreno Ruiz, J.A.; García Lázaro, J.R.; Del Águila Cano, I.; Leal, P.H. Burned area mapping in the North American boreal forest using terra-MODIS LTDR (2001–2011): A comparison with the MCD45A1, MCD64A1 and BA GEOLAND-2 products. Remote Sens. 2013, 6, 815–840. [Google Scholar] [CrossRef]
- Soja, A.J.; Al-Saadi, J.; Giglio, L.; Randall, D.; Kittaka, C.; Pouliot, G.; Kordzi, J.J.; Raffuse, S.; Pace, T.G.; Pierce, T.E.; et al. Assessing satellite-based fire data for use in the National Emissions Inventory. J. Appl. Remote Sens. 2009, 3. [Google Scholar] [CrossRef]
- George, C.; Rowland, C.; Gerard, F.; Balzter, H. Retrospective mapping of burnt areas in Central Siberia using a modification of the normalised difference water index. Remote Sens. Environ. 2006, 104. [Google Scholar] [CrossRef]
- Huang, S.; Siegert, F.; Goldammer, J.G.; Sukhinin, A.I. Satellite-derived 2003 wildfires in southern Siberia and their potential influence on carbon sequestration. Int. J. Remote Sens. 2009, 30, 1479–1492. [Google Scholar] [CrossRef]
- Soja, A.J.; Sukhinin, A.I.; Cahoon, D.R., Jr.; Shugart, H.H.; Stackhouse, P.W., Jr. AVHRR-derived fire frequency, distribution and area burned in Siberia. Int. J. Remote Sens. 2004, 25, 1939–1960. [Google Scholar] [CrossRef]
- Sukhinin, A.I.; French, N.H.F.; Kasischke, E.S.; Hewson, J.H.; Soja, A.J.; Csiszar, I.A.; Hyer, E.J.; Loboda, T.; Conrad, S.G.; Romasko, V.I.; et al. AVHRR-based mapping of fires in Russia: New products for fire management and carbon cycle studies. Remote Sens. Environ. 2004, 93, 546–564. [Google Scholar] [CrossRef]
- Eberle, J.; Urban, M.; Homolka, A.; Hüttich, C.; Schmullius, C. Multi-Source Data Integration and Analysis for Land Monitoring in Siberia. In Novel Methods for Monitoring and Managing Land and Water Resources in Siberia; Mueller, L., Sheudshen, A.K., Eulenstein, F., Eds.; Springer International Publishing: Cham, Switzerland, 2016; pp. 471–487. ISBN 978-3-319-24409-9. [Google Scholar]
- De Groot, W.J.; Cantin, A.S.; Flannigan, M.D.; Soja, A.J.; Gowman, L.M.; Newbery, A. A comparison of Canadian and Russian boreal forest fire regimes. For. Ecol. Manag. 2013, 294, 23–34. [Google Scholar] [CrossRef]
- Ponomarev, E.I.; Kharuk, V.I.; Ranson, K.J. Wildfires dynamics in Siberian larch forests. Forests 2016, 7, 125. [Google Scholar] [CrossRef]
- Kukavskaya, E.A.; Soja, A.J.; Petkov, A.P.; Ponomarev, E.I.; Ivanova, G.A.; Conard, S.G. Fire emissions estimates in Siberia: Evaluation of uncertainties in area burned, land cover, and fuel consumption. Can. J. For. Res. 2012, 43, 493–506. [Google Scholar] [CrossRef]
- Soja, A.J.; Cofer, W.R.; Shugart, H.H.; Sukhinin, A.I.; Stackhouse, P.W.; McRae, D.J.; Conard, S.G. Estimating fire emissions and disparities in boreal Siberia (1998–2002). J. Geophys. Res. D Atmos. 2004, 109. [Google Scholar] [CrossRef] [Green Version]
- Goldammer, J.G.; Stocks, B.J.; Sukhinin, A.I.; Ponomarev, E. Current Fire Regimes, Impacts and the Likely Changes—II: Forest Fires in Russia—Past and Current Trends. In Vegetation Fires and Global Change: Challenges for Concerted International Action; Global Fire Monitoring Center: Freiburg, Germany, 2013; pp. 181–207. ISBN 9783941300781. [Google Scholar]
- Kovacs, K.; Ranson, K.J.; Sun, G.; Kharuk, V.I. MODIS Fire Product and Anthropogenic Features in the Central Siberian Landscape. Earth Interact. 2004, 8, 1–25. [Google Scholar] [CrossRef]
- Vazquez, A.; Moreno, J. Patterns of Lightning-, and People-Caused Fires in Peninsular Spain. Int. J. Wildland Fire 1998, 8, 103. [Google Scholar] [CrossRef]
- Intergovernmental Panel on Climate Change. Climate Change 2014: Impacts, Adaptation, and Vulnerability. Summaries, Frequently Asked Questions, and Cross-Chapter Boxes; IPCC: Geneva, Switzerland, 2014; ISBN 9789291691418. [Google Scholar]
- Pedelty, J.; Devadiga, S.; Masuoka, E.; Brown, M.; Pinzon, J.; Tucker, C.; Vermote, E.; Prince, S.; Nagol, J.; Justice, C.; et al. Generating a long-term land data record from the AVHRR and MODIS instruments. In Proceedings of the Geoscience and Remote Sensing Symposium, Barcelona, Spain, 23–28 July 2007; IEEE: Piscataway, NJ, USA; pp. 1021–1024. [Google Scholar]
- Chuvieco, E. Satellite Observation of Biomass Burning. In Earth Observation of Global Change: The Role of Satellite Remote Sensing in Monitoring the Global Environment; Chuvieco, E., Ed.; Springer: Dordrecht, The Netherlands, 2008; pp. 109–142. ISBN 978-1-4020-6358-9. [Google Scholar]
- Swanson, D.K. A comparison of taiga flora in north-eastern Russia and Alaska/Yukon. J. Biogeogr. 2003, 30, 1109–1121. [Google Scholar] [CrossRef]
- Stowe, L.L.; Davis, P.A.; McClain, E.P. Scientific Basis and Initial Evaluation of the CLAVR-1 Global Clear/Cloud Classifcation Algorithm for the Advanced Very High Resolution Radiometer. J. Atmos. Ocean. Technol. 1999, 16, 656–681. [Google Scholar] [CrossRef]
- Barbosa, P.M.; Pereira, J.M.C.; Grégoire, J.-M. Compositing Criteria for Burned Area Assessment Using Multitemporal Low Resolution Satellite Data. Remote Sens. Environ. 1998, 65, 38–49. [Google Scholar] [CrossRef]
- Chuvieco, E.; Ventura, G.; Martín, M.P. AVHRR multitemporal compositing techniques for burned land mapping. Int. J. Remote Sens. 2005, 26, 1013–1018. [Google Scholar] [CrossRef]
- Moreno-Ruiz, J.A.; Garcia-Lazaro, J.R.; Riano, D.; Kefauver, S.C. The synergy of the 0.05° (~5 km) AVHRR long-term data record (LTDR) and landsat TM archive to map large fires in the North American boreal region from 1984 to 1998. IEEE J. Sel. Top. Appl. Earth Obs. Remote Sens. 2014, 7, 1157–1166. [Google Scholar] [CrossRef]
- Chang, D.; Song, Y. Comparison of L3JRC and MODIS global burned area products from 2000 to 2007. J. Geophys. Res. Atmos. 2009, 114, 1–20. [Google Scholar] [CrossRef]
- Giglio, L.; Randerson, J.T.; van der Werf, G.R.; Kasibhatla, P.S.; Collatz, G.J.; Morton, D.C.; DeFries, R.S. Assessing variability and long-term trends in burned area by merging multiple satellite fire products. Biogeosci. Discuss. 2009, 6, 11577–11622. [Google Scholar] [CrossRef]
- Núñez-Casillas, L.; García Lázaro, J.R.; Moreno-Ruiz, J.A.; Arbelo, M. A comparative analysis of burned area datasets in canadian boreal forest in 2000. Sci. World J. 2013, 2013. [Google Scholar] [CrossRef] [PubMed]
- Conard, S.G.; Sukhinin, A.I.; Stocks, B.J.; Cahoon, D.R.; Davidenko, E.P.; Ivanova, G.A. Determining effects of area burned and fire severity on Carbon Cycling and Emissions in Siberia. Clim. Chang. 2002, 55, 197–211. [Google Scholar] [CrossRef]
- Dozier, J.A. A method for satellite identification of surface temperature fields of subpixel resolution. Remote Sens. Environ. 1981, 11, 221–229. [Google Scholar] [CrossRef]
- Tahnk, W.R.; Coakley, J. Improved calibration coefficients for NOAA-14 AVHRR visible and near-infrared channels. Int. J. Remote Sens. 2001, 22, 1269–1283. [Google Scholar] [CrossRef]
- Flannigan, M.D.; Krawchuk, M.A.; De Groot, W.J.; Wotton, B.M.; Gowman, L.M. Implications of changing climate for global wildland fire. Int. J. Wildland Fire 2009, 18, 483–507. [Google Scholar] [CrossRef]
- Kelly, R.; Chipman, M.L.; Higuera, P.E.; Stefanova, I.; Brubaker, L.B.; Hu, F.S. Recent burning of boreal forests exceeds fire regime limits of the past 10,000 years. Proc. Natl. Acad. Sci. USA 2013, 110, 13055–13060. [Google Scholar] [CrossRef] [PubMed]
- Turetsky, M.R.; Kane, E.S.; Harden, J.W.; Ottmar, R.D.; Manies, K.L.; Hoy, E.; Kasischke, E.S. Recent acceleration of biomass burning and carbon losses in Alaskan forests and peatlands. Nat. Geosci. 2011, 4, 27–31. [Google Scholar] [CrossRef]


| LTDR-BSQ (1981–2016) | LTDR-HDF | ||
|---|---|---|---|
| Band Name | Description | LTDR v4 (1981–1999, 2009–2016) | LTDR v3 (Continuation) (2000–2008) |
| ρ1 | Surface reflectance for red channel (RED) | SREFL_CH1 (0.5–0.7 µm) | Bidirectional Reflectance Distribution Function (BRDF) corrected surface reflectance Band 1 (0.62–0.67 µm) |
| ρ2 | Surface reflectance for near infrared channel (NIR) | SREFL_CH2 (0.7–1.0 µm) | BRDF corrected surface reflectance Band 2 (0.84–0.88 µm) |
| T | Top of Atmosphere (TOA) brightness temperature | BT_CH3 (3.55–3.93 µm) | Brightness temperature Band 31 (10.78–11.28 µm) |
| QA | Quality assessment field | QA | Internal CM |
| BA Product | MCD45A1 | MCD64A1 | GFED-4 | LTDR-BA |
|---|---|---|---|---|
| Coverage | Global | Global | Global | NE Siberia |
| Sensor | MODIS | MODIS | VIRS and ATSR (*) | AVHRR, MODIS |
| Satellite | Terra and Aqua | Terra and Aqua | ERS (*) | NOAA, Terra and Aqua |
| Time span | 2000–2015 | 2000–2015 | 1995–2000 | 1982–2015 |
| Spatial resolution | 500 m | 500 m | 0.25° (~25 km) | 0.05° (~5 km) |
| Temporal resolution | Monthly | Monthly | Monthly | 10 days |
| Algorithm | [34] | [22] | [36] | [64] |
| Year | Number of Fires Identified | Number of Landsat-TM Images Used | Total BA (ha) | BA by Fire (ha) | ||
|---|---|---|---|---|---|---|
| Median | First Quartile | Third Quartile | ||||
| 2002 | 113 | 66 | 4,103,748.09 | 7554.06 | 3996.63 | 24,199.38 |
| 2010 | 88 | 53 | 1,940,381.73 | 8198.37 | 3998.43 | 18,308.70 |
| 2011 | 58 | 33 | 1,176,964.11 | 5909.22 | 3575.07 | 17,997.93 |
| Total | 259 | 152 | 7,221,093.93 | 7562.29 | 3915.22 | 20,290.22 |
| Year | Landsat-TM (ha) | MCD45A1 (%) | MCD64A1 (%) | LTDR (%) |
|---|---|---|---|---|
| 2002 | 4,103,748.09 | 39.37 | 87.82 | 64.03 |
| 2010 | 1,940,381.73 | 59.96 | 97.34 | 82.55 |
| 2011 | 1,176,964.11 | 30.85 | 78.15 | 37.47 |
| Total | 7,221,093.93 | 43.51 | 88.80 | 64.68 |
| MCD45A1 | MCD64A1 | LTDR-BA | ||||
|---|---|---|---|---|---|---|
| Year | CE (%) | OE (%) | CE (%) | OE (%) | CE (%) | OE (%) |
| 2002 | 3 | 61 | 9 | 18 | 6 | 38 |
| 2010 | 4 | 42 | 16 | 18 | 22 | 34 |
| 2011 | 13 | 70 | 39 | 48 | 43 | 77 |
| All | 5 | 57 | 15 | 23 | 15 | 43 |
© 2018 by the authors. Licensee MDPI, Basel, Switzerland. This article is an open access article distributed under the terms and conditions of the Creative Commons Attribution (CC BY) license (http://creativecommons.org/licenses/by/4.0/).
Share and Cite
García-Lázaro, J.R.; Moreno-Ruiz, J.A.; Riaño, D.; Arbelo, M. Estimation of Burned Area in the Northeastern Siberian Boreal Forest from a Long-Term Data Record (LTDR) 1982–2015 Time Series. Remote Sens. 2018, 10, 940. https://doi.org/10.3390/rs10060940
García-Lázaro JR, Moreno-Ruiz JA, Riaño D, Arbelo M. Estimation of Burned Area in the Northeastern Siberian Boreal Forest from a Long-Term Data Record (LTDR) 1982–2015 Time Series. Remote Sensing. 2018; 10(6):940. https://doi.org/10.3390/rs10060940
Chicago/Turabian StyleGarcía-Lázaro, José R., José A. Moreno-Ruiz, David Riaño, and Manuel Arbelo. 2018. "Estimation of Burned Area in the Northeastern Siberian Boreal Forest from a Long-Term Data Record (LTDR) 1982–2015 Time Series" Remote Sensing 10, no. 6: 940. https://doi.org/10.3390/rs10060940