Article

Earthquake/Tsunami Damage Assessment for Urban Areas Using Post-Event PolSAR Data

Center for Environmental Remote Sensing, Chiba University, Chiba 263-8522, Japan
*
Author to whom correspondence should be addressed.
Remote Sens. 2018, 10(7), 1088; https://doi.org/10.3390/rs10071088
Submission received: 14 May 2018 / Revised: 29 June 2018 / Accepted: 6 July 2018 / Published: 8 July 2018

Abstract

:
Analyses of single-post-event polarimetric synthetic aperture radar (PolSAR) data permit fast and convenient post-disaster damage assessment work. By analyzing valid features, damaged and undamaged buildings can be quickly classified. However, the presence of oriented buildings in the disaster area makes the classification work more challenging. Many previous works extract the damage information of the disaster area by considering oriented buildings and undamaged parallel buildings as survived buildings. However, after-effect debris may create structures with random orientation angles. In our study on the Tohoku earthquake/tsunami disaster event, we found that some damaged buildings with large building orientation angles (with respect to the satellite flight path) are grouped as oriented buildings (undamaged buildings). In this paper, we propose a new earthquake/tsunami damage assessment method, particularly for urban areas, that takes this complex situation into consideration. The proposed method solves the problems of both urban-area extraction and damaged-building identification. For urban-area extraction, the proposed combined thresholding and majority voting method can accurately discriminate between urban and foreshortening mountain areas. Meanwhile, for damaged-building identification, the proposed new unsupervised damage assessment method classifies the buildings in a disaster area according to four conditions, and it outperforms the techniques used in existing works. The analysis results and the comparison with the supervised support vector machine (SVM) classification technique show that our proposed method can produce more accurate results for damage assessment using single-post-event PolSAR data.

1. Introduction

As some of the most dangerous natural disasters, earthquakes and tsunamis severely damage the lives and properties of human beings. While earthquake early warning systems help to mitigate some damage through automated systems, much of the built environment remains at risk from strong ground shaking and inundation. Rapid post-event reconnaissance can provide valuable information that is useful for search and rescue operations and can help to accelerate recovery efforts. Ground-survey-based methods after a disaster can provide the most accurate post-disaster damage assessment, but these are highly time-consuming [1]. In this case, remote sensing technology exhibits greater superiority; it can quickly reveal disaster conditions at a large scale and give a near-real-time response.
Synthetic aperture radar (SAR) data is an excellent tool for disaster assessment [2,3,4], particularly polarimetric SAR (PolSAR) data, which is sensitive to orientation, shape, and material constituents of objects [5]. Much previous research has successfully explored the polarimetric features and spatial texture information of PolSAR data to extract damage information. The application of PolSAR data for disaster monitoring was first investigated by Yamaguchi [6] in 2012. He analyzed four types of disasters on the basis of significant color changes (from red (double-bounce scattering) to blue (surface scattering)) of pre- and post-event color-coded images. After [6], many other related works for disaster monitoring using PolSAR data were conducted. In 2013, Park et al. [7] conducted a series of comprehensive and detailed experiments using several polarimetric features to analyze their behavior for damage area extraction. Singh et al. [8] used the power level changes in double-bounce scattering for damage-information extraction and gave a rough damage-level mapping result. The works of Chen et al. [9,10] provide a new direction for damage-level mapping, as they propose a damage-level index based on the double-bounce scattering power.
All of the above research works extract damage information by analyzing the changes in polarimetric characteristics before and after a disaster event. However, pre-event PolSAR data matched to the disaster area is sometimes not available. Additionally, the registration of pre- and post-event PolSAR data costs time and manpower [11]. Therefore, a post-disaster damage assessment method that uses only post-event PolSAR data has attracted many researchers’ attention, and several outstanding research works have been presented for the topic.
Li et al. [12] proposed a new H- α - ρ method to extract the spatial distribution of collapsed buildings. The circular correlation coefficient ρ exhibits a high correlation with manmade targets. Although their work showed that both damaged buildings and oriented buildings have low ρ values, the work did not take the effect of oriented buildings into consideration. Zhao et al. improved Li’s work in 2013 [13] by using the normalized circular correlation coefficient and H- α -Wishart classification method to detect collapsed buildings and oriented buildings. The “homogeneity” (Hom) feature was introduced to correct the inaccuracy caused by the oriented buildings. Zhai et al. [11,14] proposed two supervised damage assessment techniques, both which use a Wishart supervised classifier. The method in [11] classifies an urban area into three classes, which are buildings parallel to the satellite flight path, buildings oblique to the satellite flight path, and damaged buildings. Additionally, the use of double-bounce and volume-scattering-parameter value changes before and after polarization orientation angle (POA) compensation was introduced in their analysis, and a distinctive improvement was observed in the results. The significance of the work done in [14] is the removal of all the areas other than damaged buildings and introduction of the use of the normalized difference of the dihedral component (NDDC) [15] and the HH-HV (HH presents horizontal/horizontal polarization and HV represents horizontal/vertical polarization) correlation coefficient ( ρ HHHV ) in their damage assessment technique. Both the proposed supervised techniques showed high accuracy in building-damage mapping, but they need the true damage condition (ground-truth data) for the classifier’s training, which is not applicable for real-time/quick disaster monitoring. Moreover, complex building structures in a disaster area may consist of damaged buildings with large orientation angles (which will be labeled as oriented buildings), and these may be misclassified as undamaged buildings. Other than these, methods using texture features [16,17] have also been proposed for earthquake/tsunami damage assessment. Shi et al. [16] analyzed 181 types of features from post-event SAR images to discriminate between the intact and damaged buildings. They concluded that the texture feature was very useful in quantifying the extent of building damage. Sun et al. [17] combined five texture descriptors and a random forest classifier in their damage assessment analysis. However, these techniques require very high resolution SAR images.
A preliminary analysis about the disaster event we focus on has already been previously discussed by our group [18]. In this paper, we propose a new unsupervised earthquake/tsunami damage assessment method using relatively low resolution single-post-event PolSAR data that addresses all of the above-mentioned problems. “Unsupervised” here means that the proposed method calculates damage assessment results without prior damage information. First, we extract the urban areas in the disaster area by using an improved classification technique adopting thresholding and region-based majority voting techniques. Using the new classification technique, an improved classification result is obtained, from which the misclassification between foreshortening mountain areas and building areas is significantly reduced. For damaged-building detection, we first categorize the buildings in the urban areas into two categories, parallel buildings and oriented buildings. Then, we detect the damaged buildings for each of the categories. Unlike the other works, rather than assuming that all the oriented buildings are undamaged buildings, we take damaged buildings with large orientation angles into account; this greatly improves the accuracy of damage assessment.

2. Study Area and Experimental Data

Our study was on the Tohoku earthquake/tsunami, which occurred on 11 March 2011. The magnitude of this earthquake was 9.0, and it triggered a devastating tsunami that caused destructive damage along the coastal areas of northeastern Japan.
In this study, we used PolSAR data obtained by the Advanced Land Observing Satellite (ALOS) satellite of the Japan Aerospace Exploration Agency (JAXA) [19,20,21]. Figure 1 shows the epicenter of the earthquake, the location of the satellite footprint, and our study area. Ishinomaki City in the Miyagi prefecture, which suffered serious damage, was chosen as the main study site. In addition, the damage conditions near the river area and town of Onagawa were also analyzed.
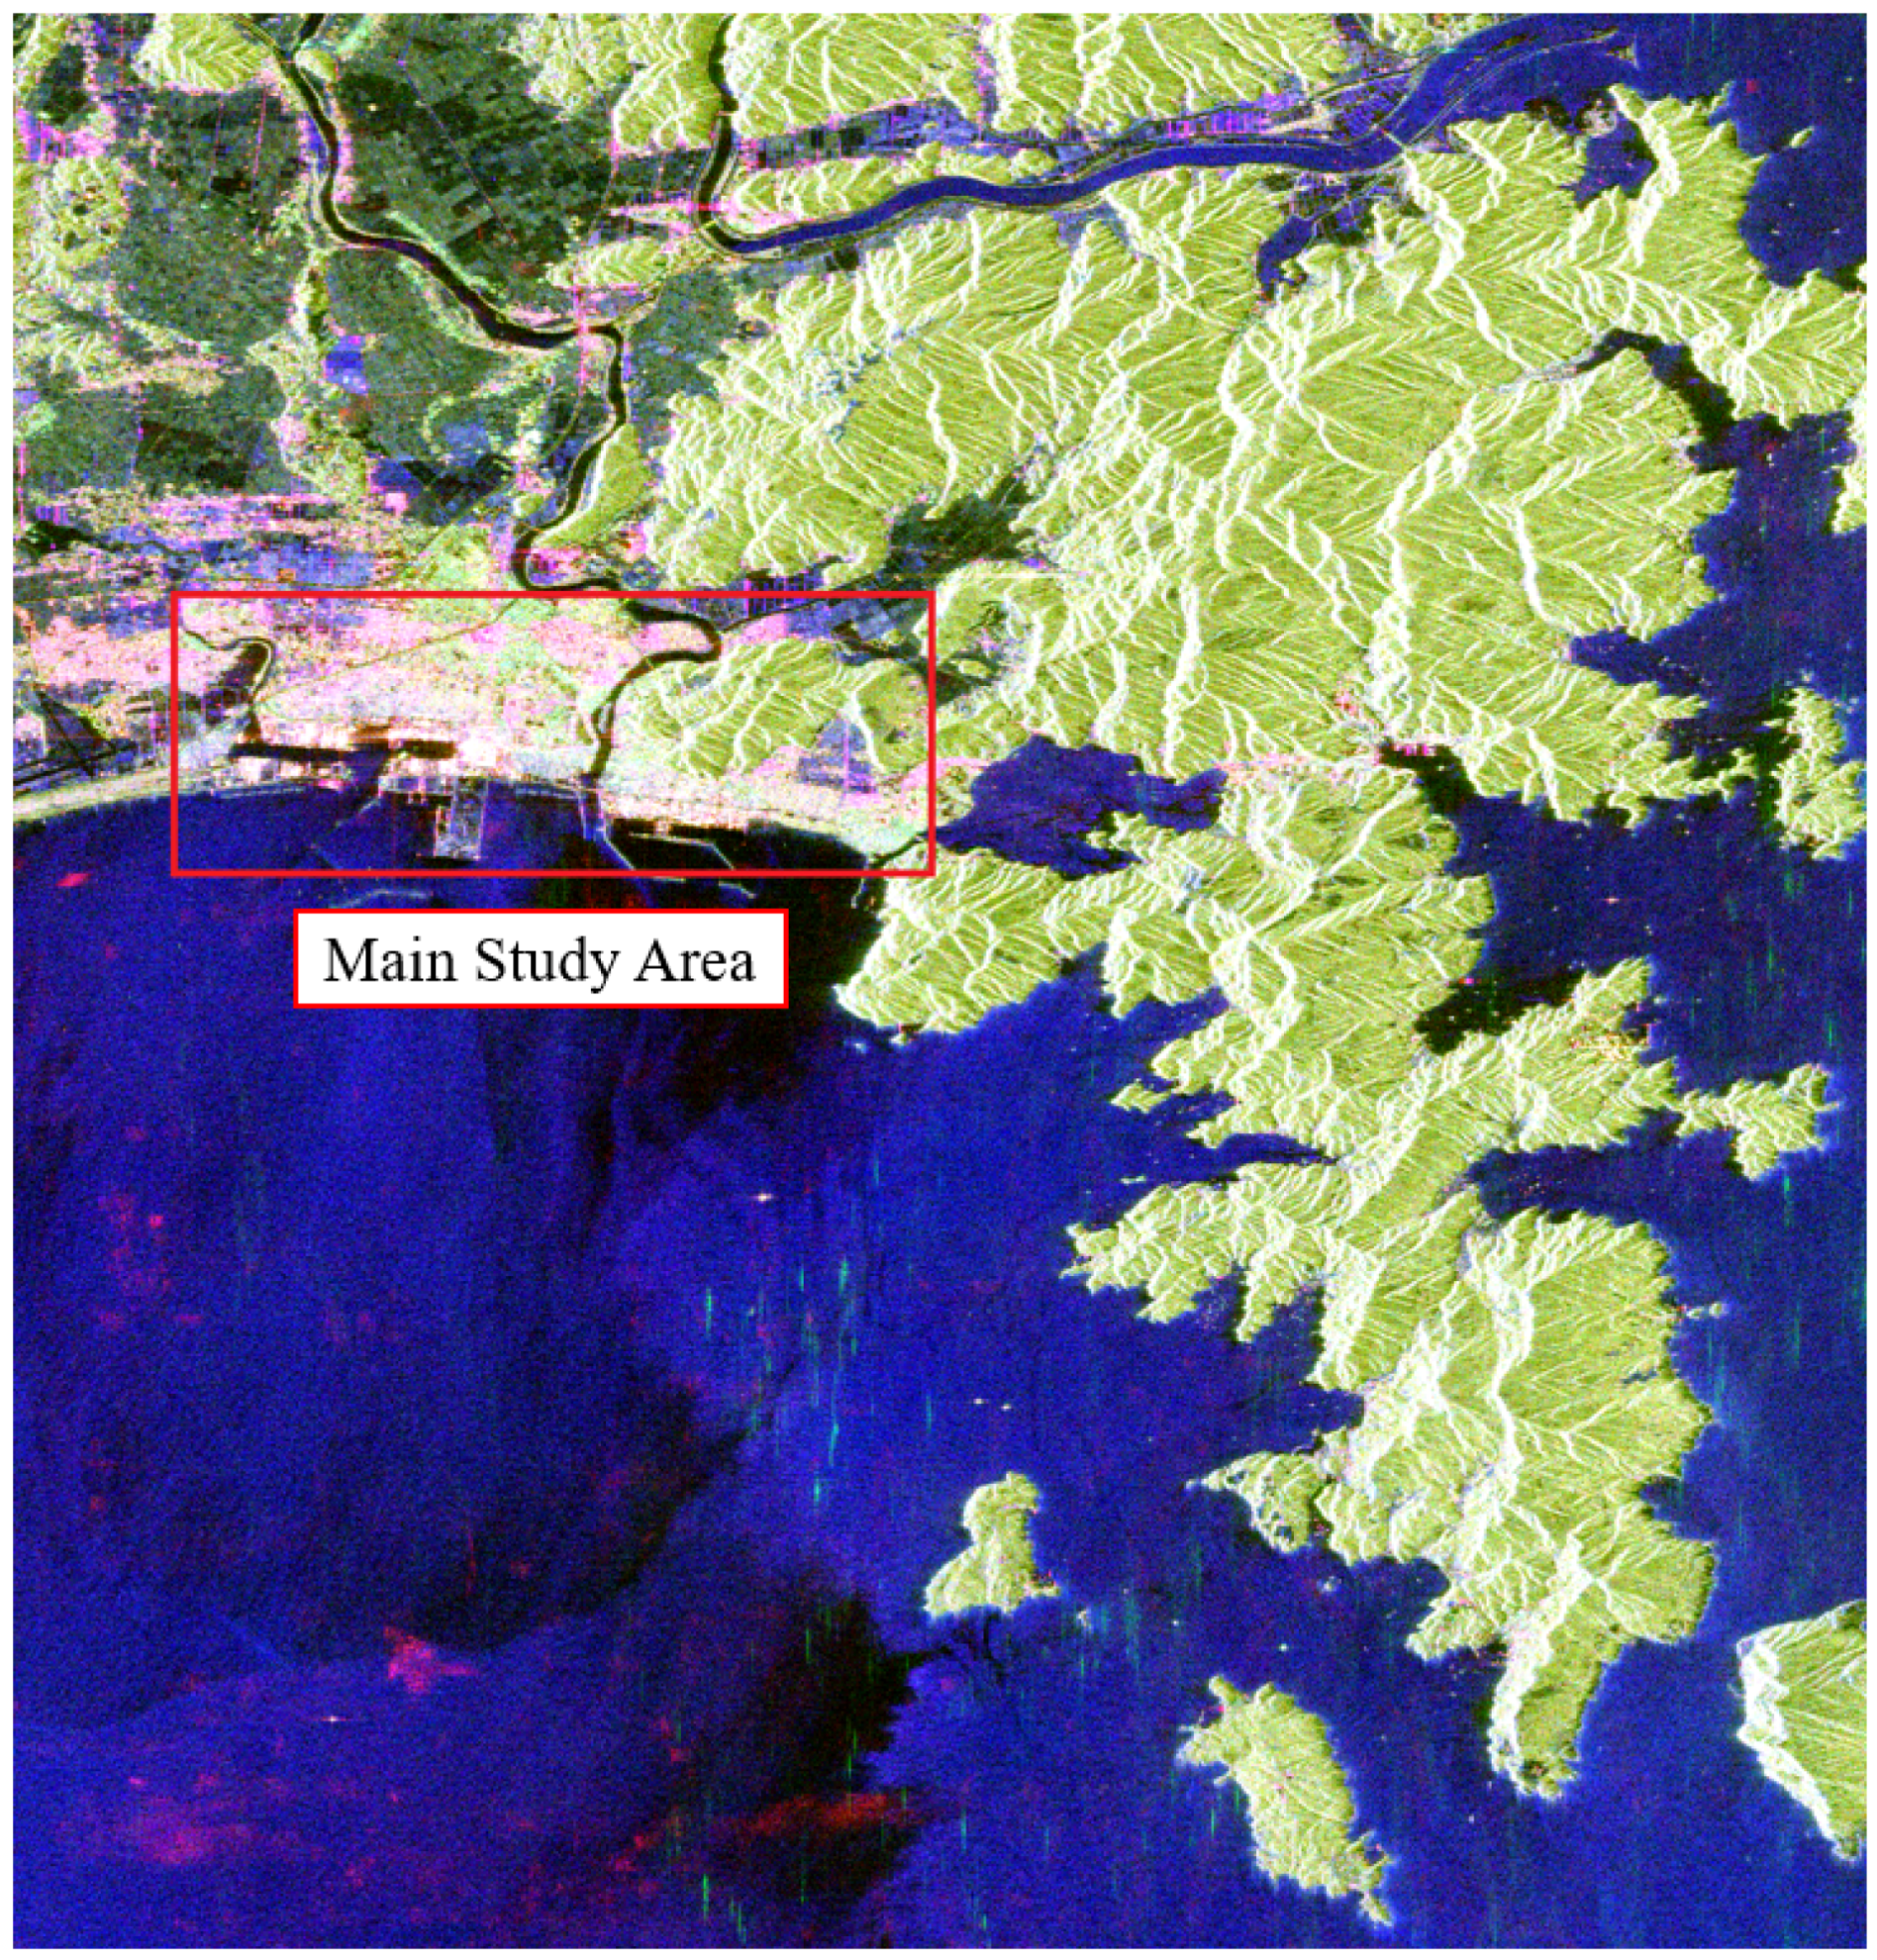
The post-event data was acquired on 8 April 2011, which was one month after the earthquake. The resolution of the PolSAR images was 4.45 m in the azimuth direction and 23.14 m in the ground-range direction. To adjust the azimuth and range pixel size to be comparable, multi-look (eight-look) processing was applied in the azimuth direction. Furthermore, a Lee refined filter was applied to the data to reduce the speckle noise interference. Figure 2 shows the pre-processed post-event image composited by Pauli decomposition parameters (PauliRGB image). The image was obtained by assigning |HH−VV|, |HV|, and |HH+VV| scattering components from the Pauli decomposition into the R, G, and B color channels, respectively.
The main study area in this research was the coastal area around Ishinomaki City in the Miyagi prefecture. The location of this area is indicated by the red rectangular box in Figure 2. The ground-truth building-damage map of this area, mapped by Tohoku University [22], is used as the reference map for comparison purposes in the following sections. The map was created by visually interpreting the aerial photographs recorded after the disaster. Figure 3a shows the ground-truth map of the damaged buildings for the study area around Ishinomaki City. The red color indicates the buildings that were swept away by the tsunami, while the blue color indicates the survived buildings. Additionally, the gray color indicates the flooded area.
Using the ground-truth map in Figure 3a, we created a block-scale reference map that could give a clearer picture for the degree of damage, as shown in Figure 3b. For this map, the original ground-truth map (Figure 3a) was segmented into 80 regions according to the shape of buildings and the distribution of streets. For each segmented block, the ratio of damaged buildings to total buildings in the block was calculated and assigned as the damage level of the region. To make the newly created map more feasibly interpretable, the degree of damage was divided into four levels: serious damage (SED), moderate damage (MOD), slight damage (SLD), and no damage (NOD), with values of ≥70%, 50–70%, 30–50%, and ≤30%, respectively. Figure 3b shows the regional ground-truth damage-degree map we graphed. It was used as the reference map for comparison in the subsequent damage-area and -degree assessment.

3. Methodology

Figure 4 shows the methodology adopted in our proposed disaster damage assessment technique. First, the raw PolSAR data is pre-processed by applying multi-look processing and a polarimetric Lee refined speckle filter. The preliminary classification result with four classes is obtained by using a support vector machine (SVM) classifier, in which the inputs to the classifier are the POA-compensated polarimetric features. Because the damaged buildings and oriented buildings shared similar polarimetric characteristics to the foreshortened mountainous areas, described by conventional model- and eigenvalue–eigenvector-based polarimetric decomposition, the preliminary classification result showed several misclassifications between the urban and mountain areas. To more accurately discriminate between mountain areas and urban areas, we conjunctively used a threshold criterion and segmented-region-based majority voting to compute an improved region-based classification result. The threshold criterion is based upon the polarimetric coherence magnitude | γ ( HH VV ) ( HV ) | max and the sum of eigenvalues λ from Cloude-Pottier decomposition. The segmentation result for majority voting is carried out using a multi-resolution segmentation technique. A detailed discussion of the technique is covered in Section 4.
As mentioned earlier, our study area after the disaster comprised a complex situation in which damaged buildings with large orientation angles existed. Using the conventional method [11,14], these buildings are classified as oriented buildings and are then labeled as undamaged buildings. To solve this problem, we classify the whole urban area into parallel buildings and oriented buildings by setting a threshold based on the circular correlation coefficient. Damaged buildings are identified from each of these two building categories. A detailed discussion of the technique is covered in Section 5.

4. An Improved Classification using Thresholding and Majority Voting

4.1. Preliminary Pixel-Based Classification

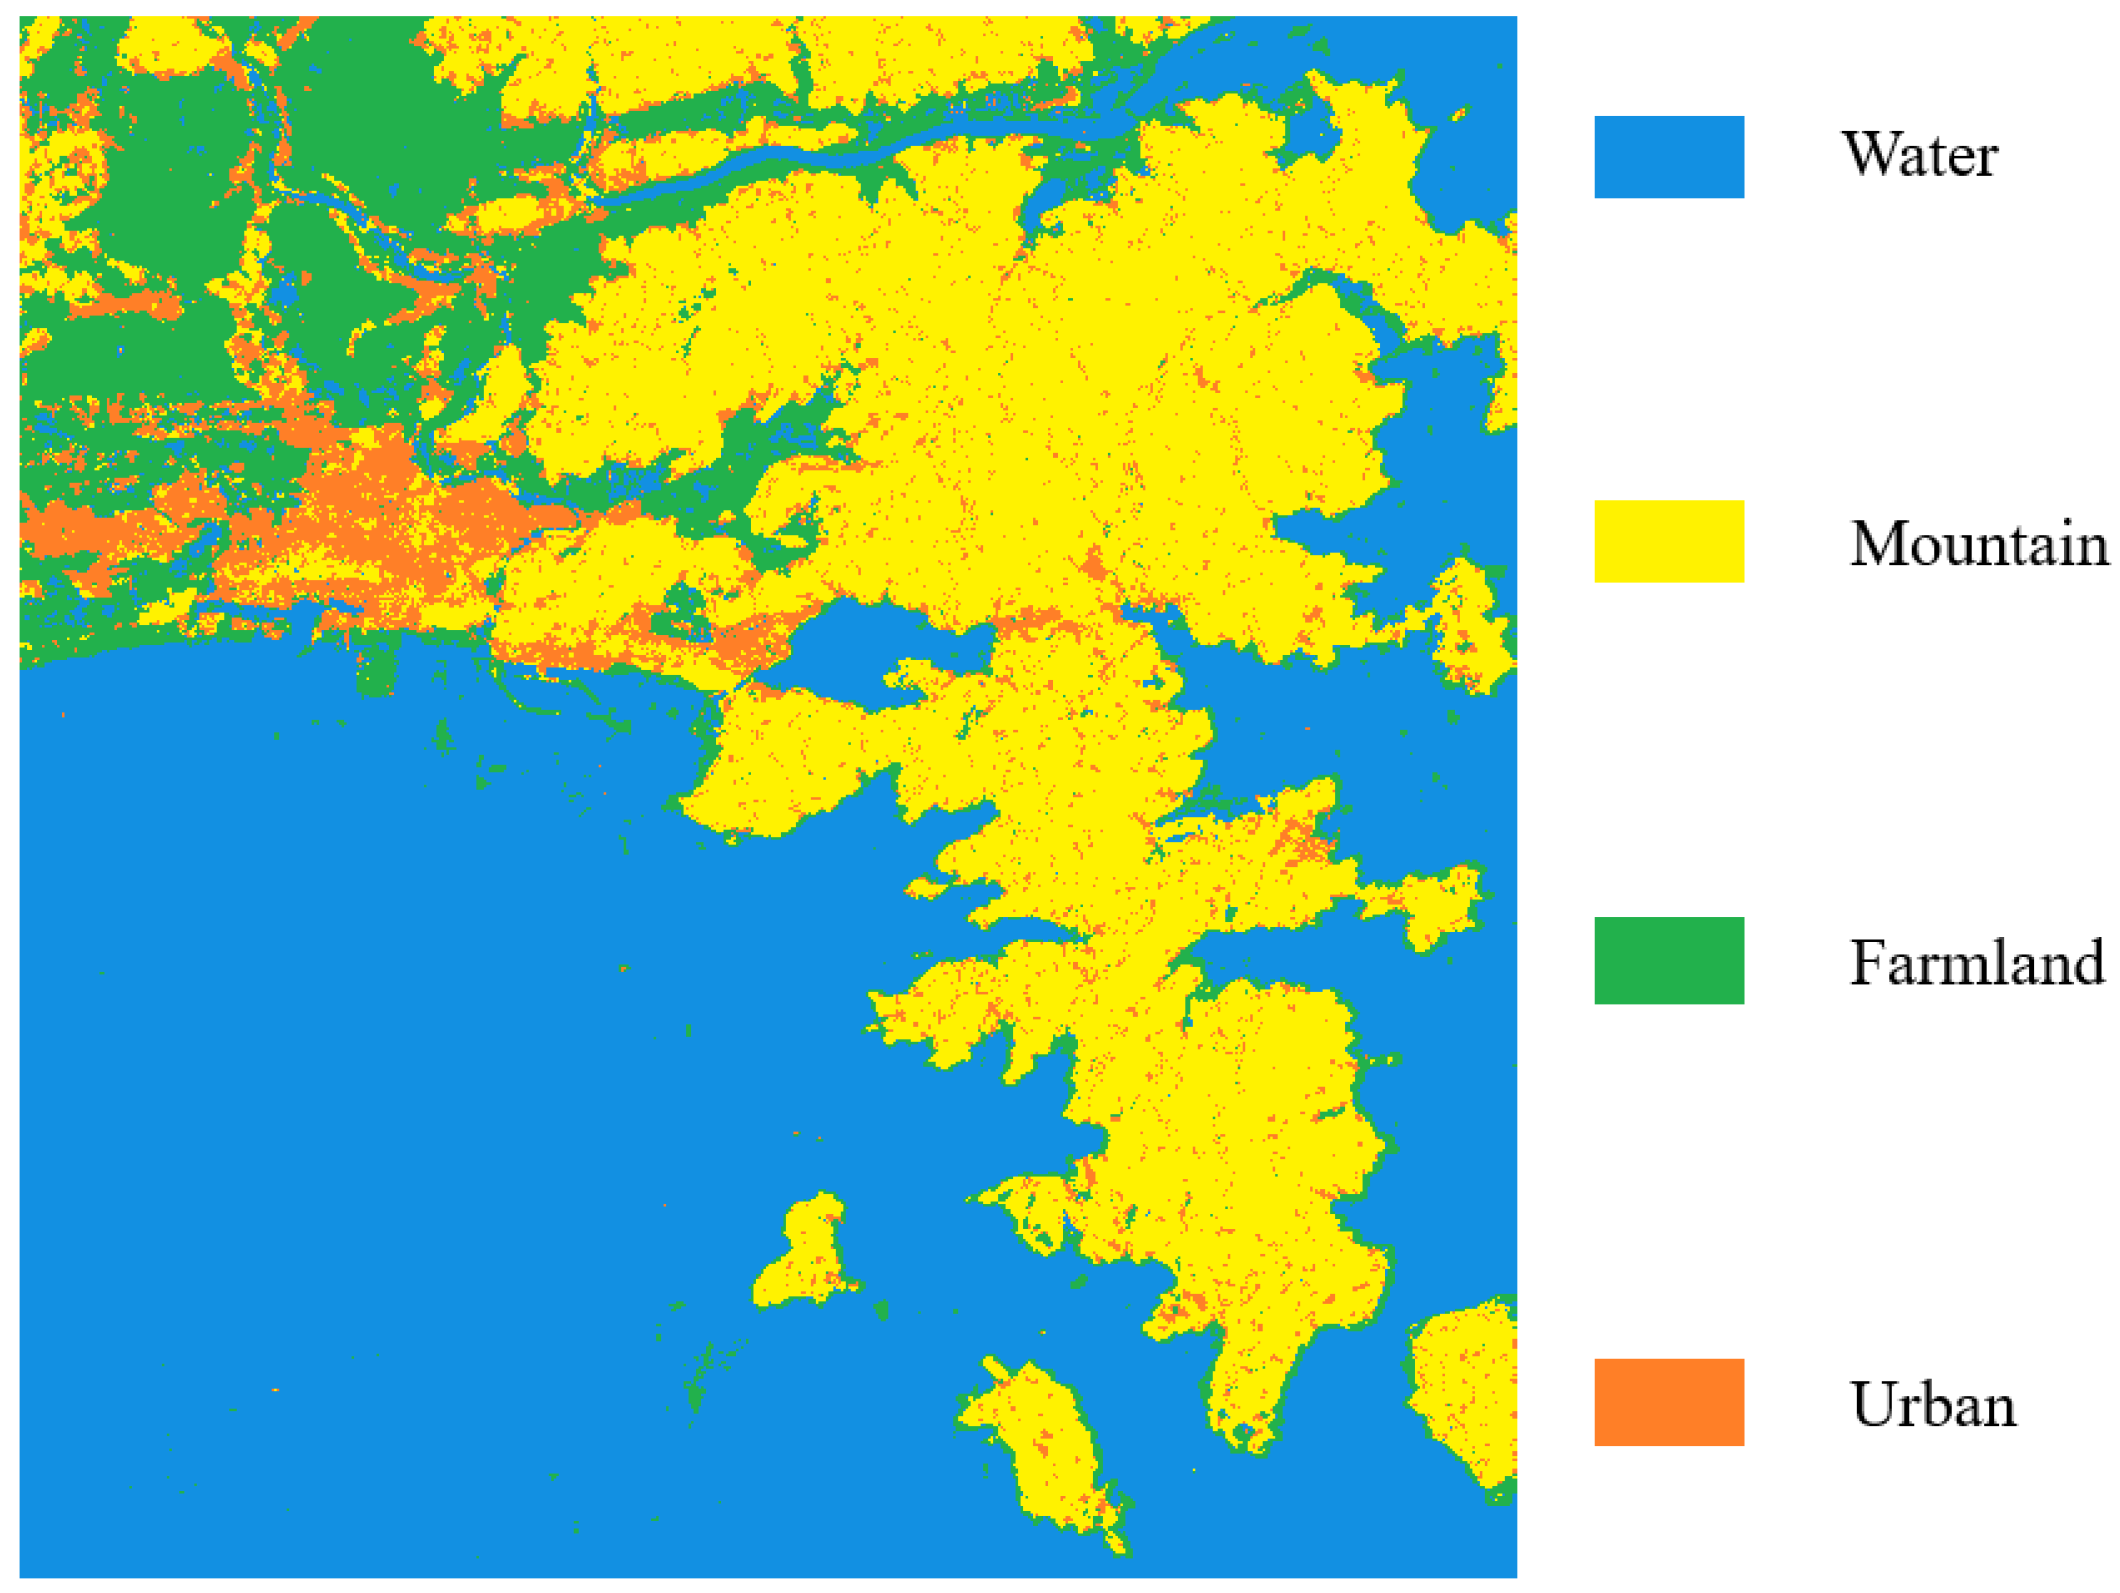
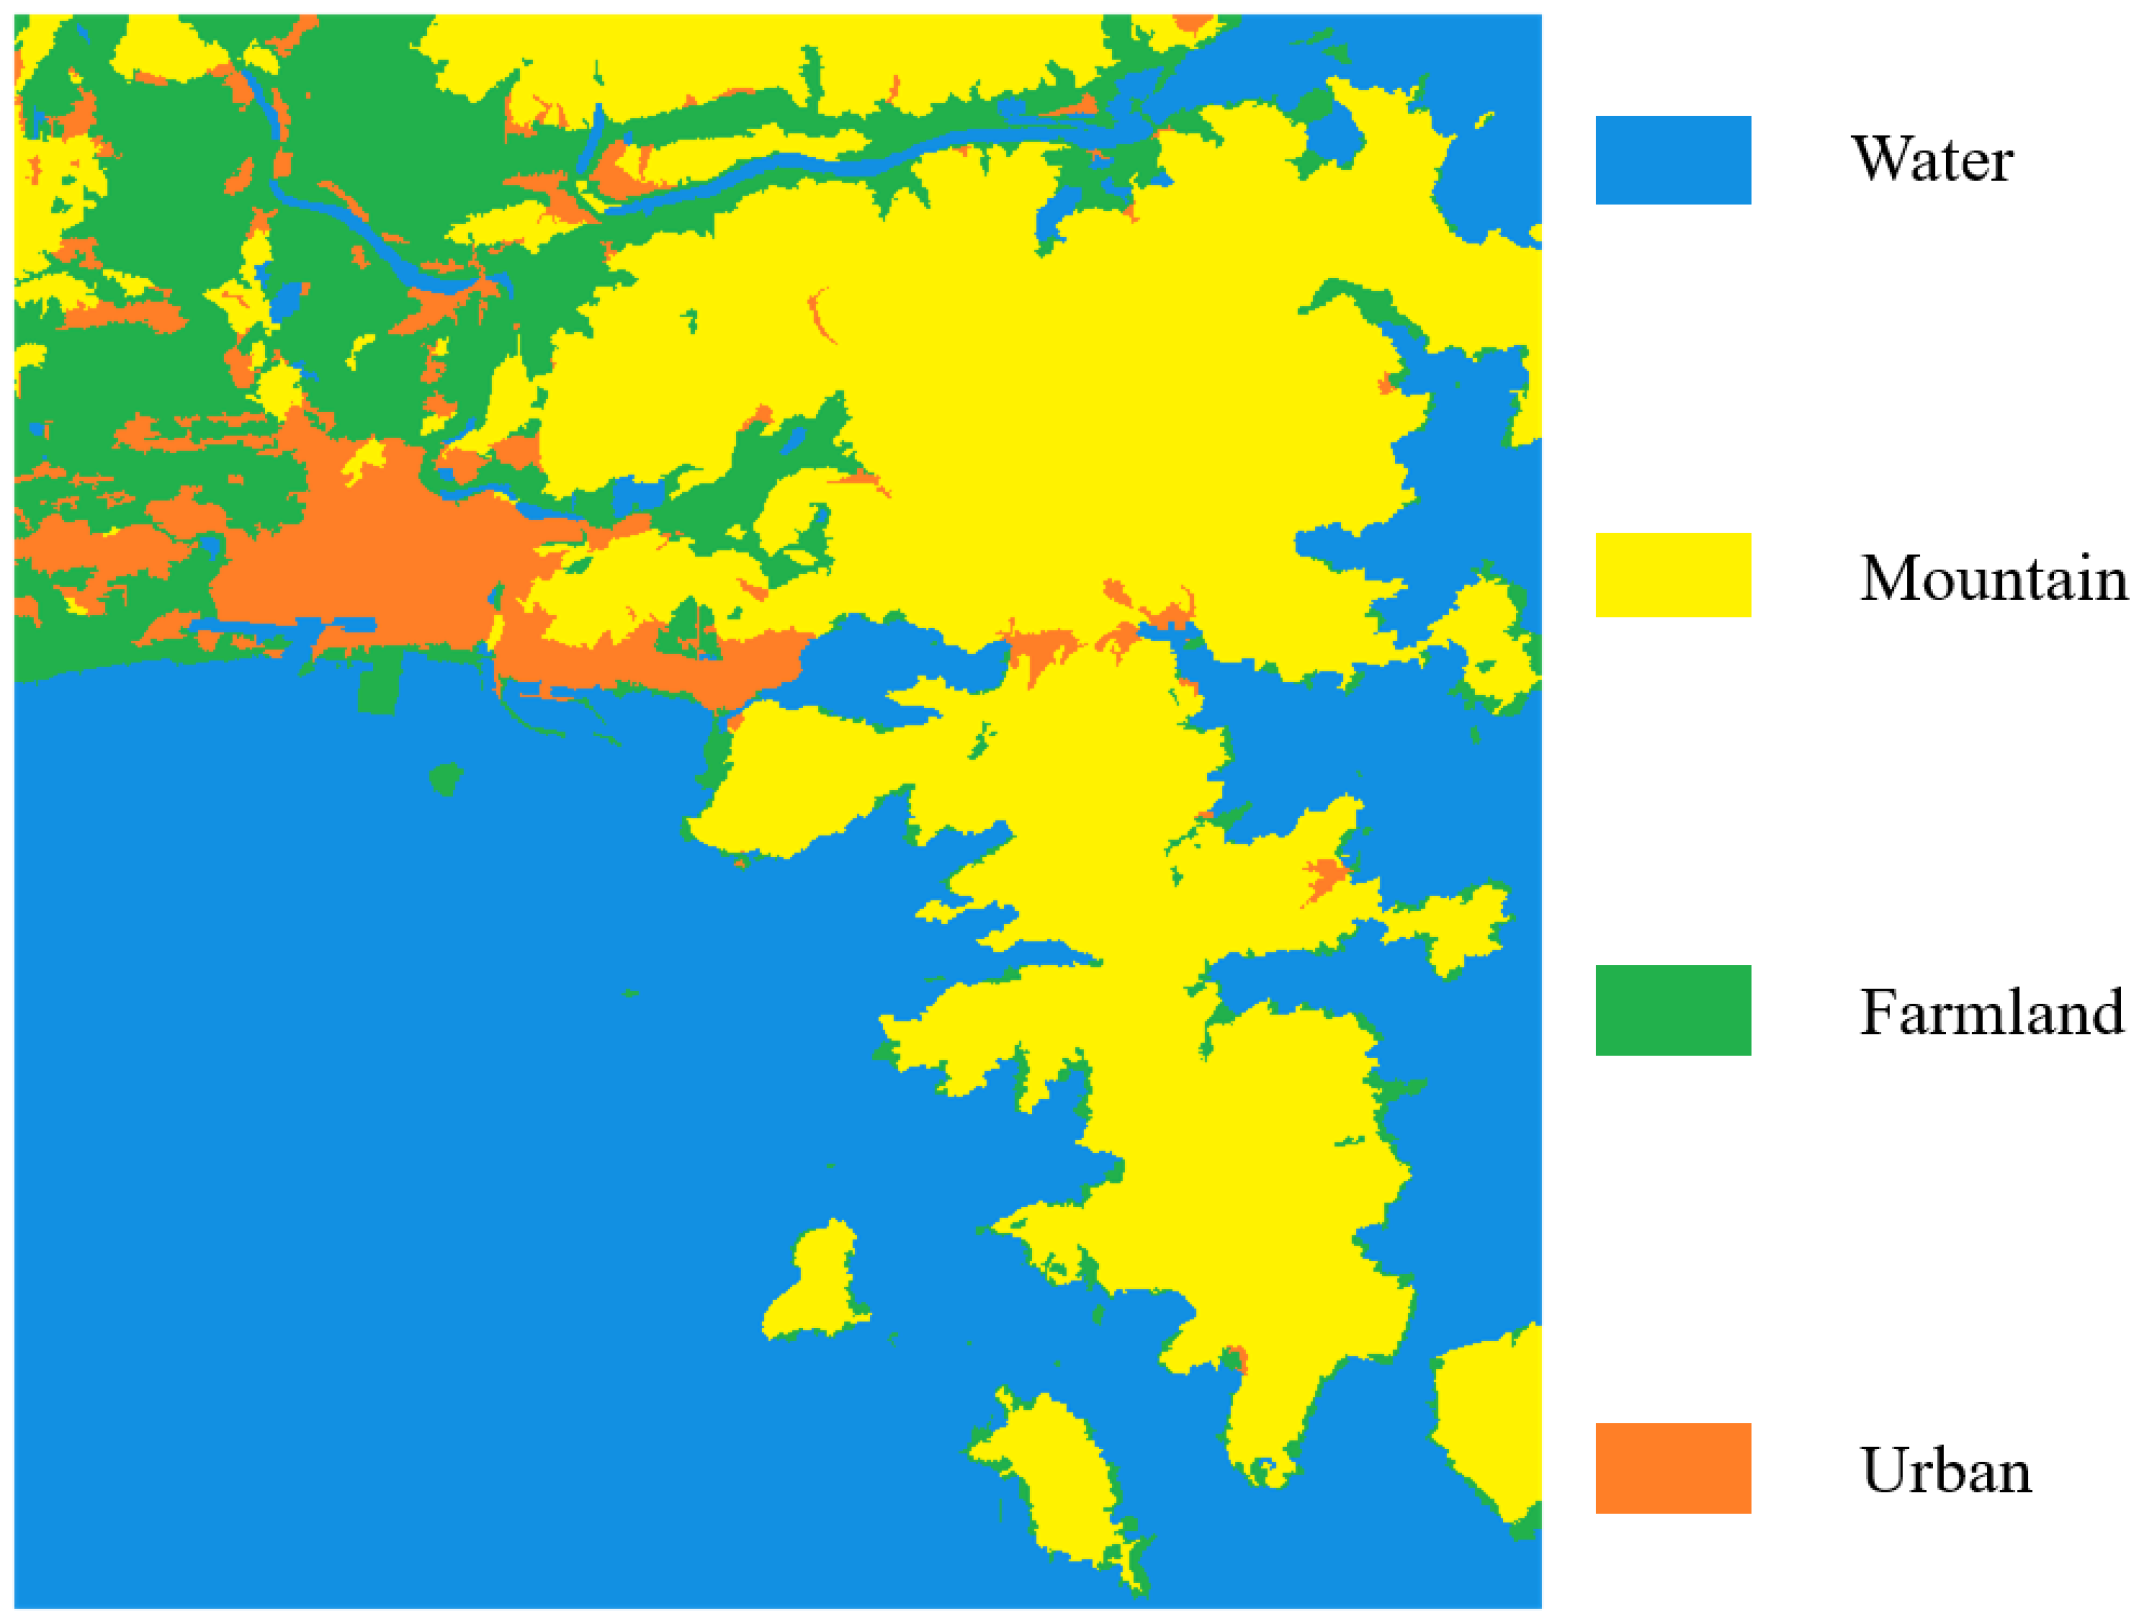
A preliminary classification result is first obtained by using a SVM classifier. The classification procedure can be seen to extract all types of buildings by eliminating the non-building area. Using the POA-compensated pre-processed post-event data, seven polarimetric features are extracted and used as the classification features for the SVM classifier. The training samples for the classifier are selected through a visual interpretation of the PauliRGB image and the corresponding Google Earth map. The classifier uses a radial basis function (RBF) kernel, whereby the penalty parameter C and the width of the kernel function g are optimized by a cross-validation procedure. The entire study area is classified into four classes, water, farmland, mountain, and urban areas. In this classification, urban areas cover all building types, including damaged and undamaged buildings.

4.1.1. Polarization Orientation Angle Compensation

Buildings that are oblique to the satellite flight path (oriented buildings) lack reflection symmetry and thus induce a significant amount of cross-pol backscattering [13]. POA compensation [24] is essential in correcting the pre-processed PolSAR data.
The right–right and left–left circular polarization responses can be defined as
S RR = ( S HH S VV + i 2 S HV ) / 2 , S LL = ( S VV S HH + i 2 S HV ) / 2 .
The orientation angle θ is geometrically related to topographical slopes and the radar look angle. It can be derived from circular polarization responses, which gives
θ = [ A r g ( S RR S LL * ) + π ] / 4 .
when θ > π / 4 , θ is replaced by ( θ π / 2 ) and · is the ensemble average that is usually achieved by speckle filtering.
Then, the compensation of the orientation angle θ on the coherency matrix [ T ] can be calculated as
T ( n e w ) = U T U T ,
whereby the rotation matrix U is
U = 1 0 0 0 cos 2 θ sin 2 θ 0 sin 2 θ cos 2 θ

4.1.2. Classification Features

The seven classification features for the SVM classifier are the four scattering powers from the four-component decomposition and H, A, and α from the Cloude-Pottier decomposition obtained from the POA-compensated PolSAR data.
(a) Four-component decomposition:
Four-component decomposition [25,26,27] defines the total scattering power from the targets being composed by the surface scattering power P s , the double-bounce scattering power P d , the volume scattering power P v , and the helix scattering power P h . The double-bounce scattering power is widely used for the evaluation of damage conditions in urban areas [6,8,11] because of its strong correlation with buildings for which the wall and the ground form a “dihedral reflector”, which induces double-bounce scattering. When the buildings collapse, the dihedral reflector disappears, leaving after-effect debris with a random spatial arrangement and orientation.
The surface scattering power P s , double-bounce scattering power P d , volume scattering power P v , and helix scattering power P h can be expressed as follows:
P s = f s ( 1 + | β | 2 ) , P d = f d ( 1 + | α | 2 ) , P v = f v , and P h = f h
where f s , f d , f v , and f h are the contributions of the surface, double-bounce, volume, and helix scattering models in the polarimetric coherency matrix [ T ] , respectively; α and β relate to the reflection coefficients. In this paper, each scattering component is normalized to the total four-component decomposition scattering power. For example, the normalized surface scattering power is P s T P , where T P = P s + P d + P v + P h .
(b) Cloude-Pottier decomposition:
The Cloude-Pottier decomposition [28] is based on the eigenvalue analysis of the polarimetric coherency matrix [ T ] :
[ T ] = [ U 3 ] λ 1 0 0 0 λ 2 0 0 0 λ 3 [ U 3 ] *
where the eigenvalues should meet the requirement that λ 1 > λ 2 > λ 3 0 , from which the columns of the unitary matrix U 3 are the corresponding eigenvectors. The entropy H, the average of the angle α , and the anisotropy parameter A are the polarimetric properties, whereby,
H = i = 1 3 p i log 3 p i , where p i = λ i n = 1 3 λ n , i = 1 , 2 , 3
α = i = 1 3 p i α i , A = λ 2 λ 3 λ 2 + λ 3
λ = i = 1 3 λ i = λ 1 + λ 2 + λ 3
The extracted angle α has a close relationship to the physical mechanism of the scattering process. Meanwhile, the entropy H expresses the degree of statistical disorder of the scattering phenomenon that ranges from 0 to 1, and the anisotropy parameter A provides the information related to the distribution of the eigenvalues; λ is the sum of the three eigenvalues λ 1 , λ 2 , and λ 3 .

4.1.3. Preliminary Classification Result

Figure 5 shows the preliminary classification result obtained by the SVM classifier. Water and farmland areas were classified accurately, but several misclassifications can be found among some urban and mountain areas. Structures that are oblique to the satellite flight path (oriented buildings) and buildings that are located on sloped terrain (foreshortening mountain areas) will induce a significant amount of cross-pol backscattering and lack reflection symmetry [25]. Although POA compensation was applied, these buildings still exhibited different behaviors to parallel buildings. This problem led to the outcome that (i) most damaged buildings and parts of the oriented buildings were classified as mountains, and (ii) some foreshortening mountain areas were classified as urban areas. Thus, a more accurate classification approach was needed.

4.2. Region-Based Classification Using Thresholding and Majority Voting

4.2.1. Urban and Mountain Area Classification

It was shown that in the conventional model- and eigenvalue–eigenvector-based decomposition methods, oriented buildings and damaged buildings share similar characteristics to the foreshortening mountain areas. To better classify the urban and the mountain areas, the magnitude of polarimetric coherence [10,29] and the sum of the eigenvalues from the Cloude-Pottier decomposition were introduced into the classification process.
Polarimetric coherence is sensitive to the target’s orientation. The polarimetric coherence of oriented buildings can be enhanced in the rotation domain. The complex coherence for two polarization channels s 1 and s 2 is the correlation coefficient from a zero time shift. In the rotation domain, the polarimetric coherence magnitude is as follows:
| γ 1 2 ( θ ) | = | s 1 ( θ ) s 2 * ( θ ) | | s 1 ( θ ) | 2 | s 2 ( θ ) | 2 .
The rotation angle, θ γ max , maximizes the coherence magnitude in the rotation domain, and can be derived as
θ γ max = θ when | γ 1 2 ( θ ) | = 0 and | γ 1 2 ( θ ) | < 0
where | γ 1 2 ( θ ) | and | γ 1 2 ( θ ) | are the first- and second-order derivatives of | γ 1 2 ( θ ) | .
The maximized coherence magnitude can be obtained from the rotation angle θ γ max , from which,
| γ 1 2 ( θ ) | max = | γ 1 2 ( θ γ max ) |
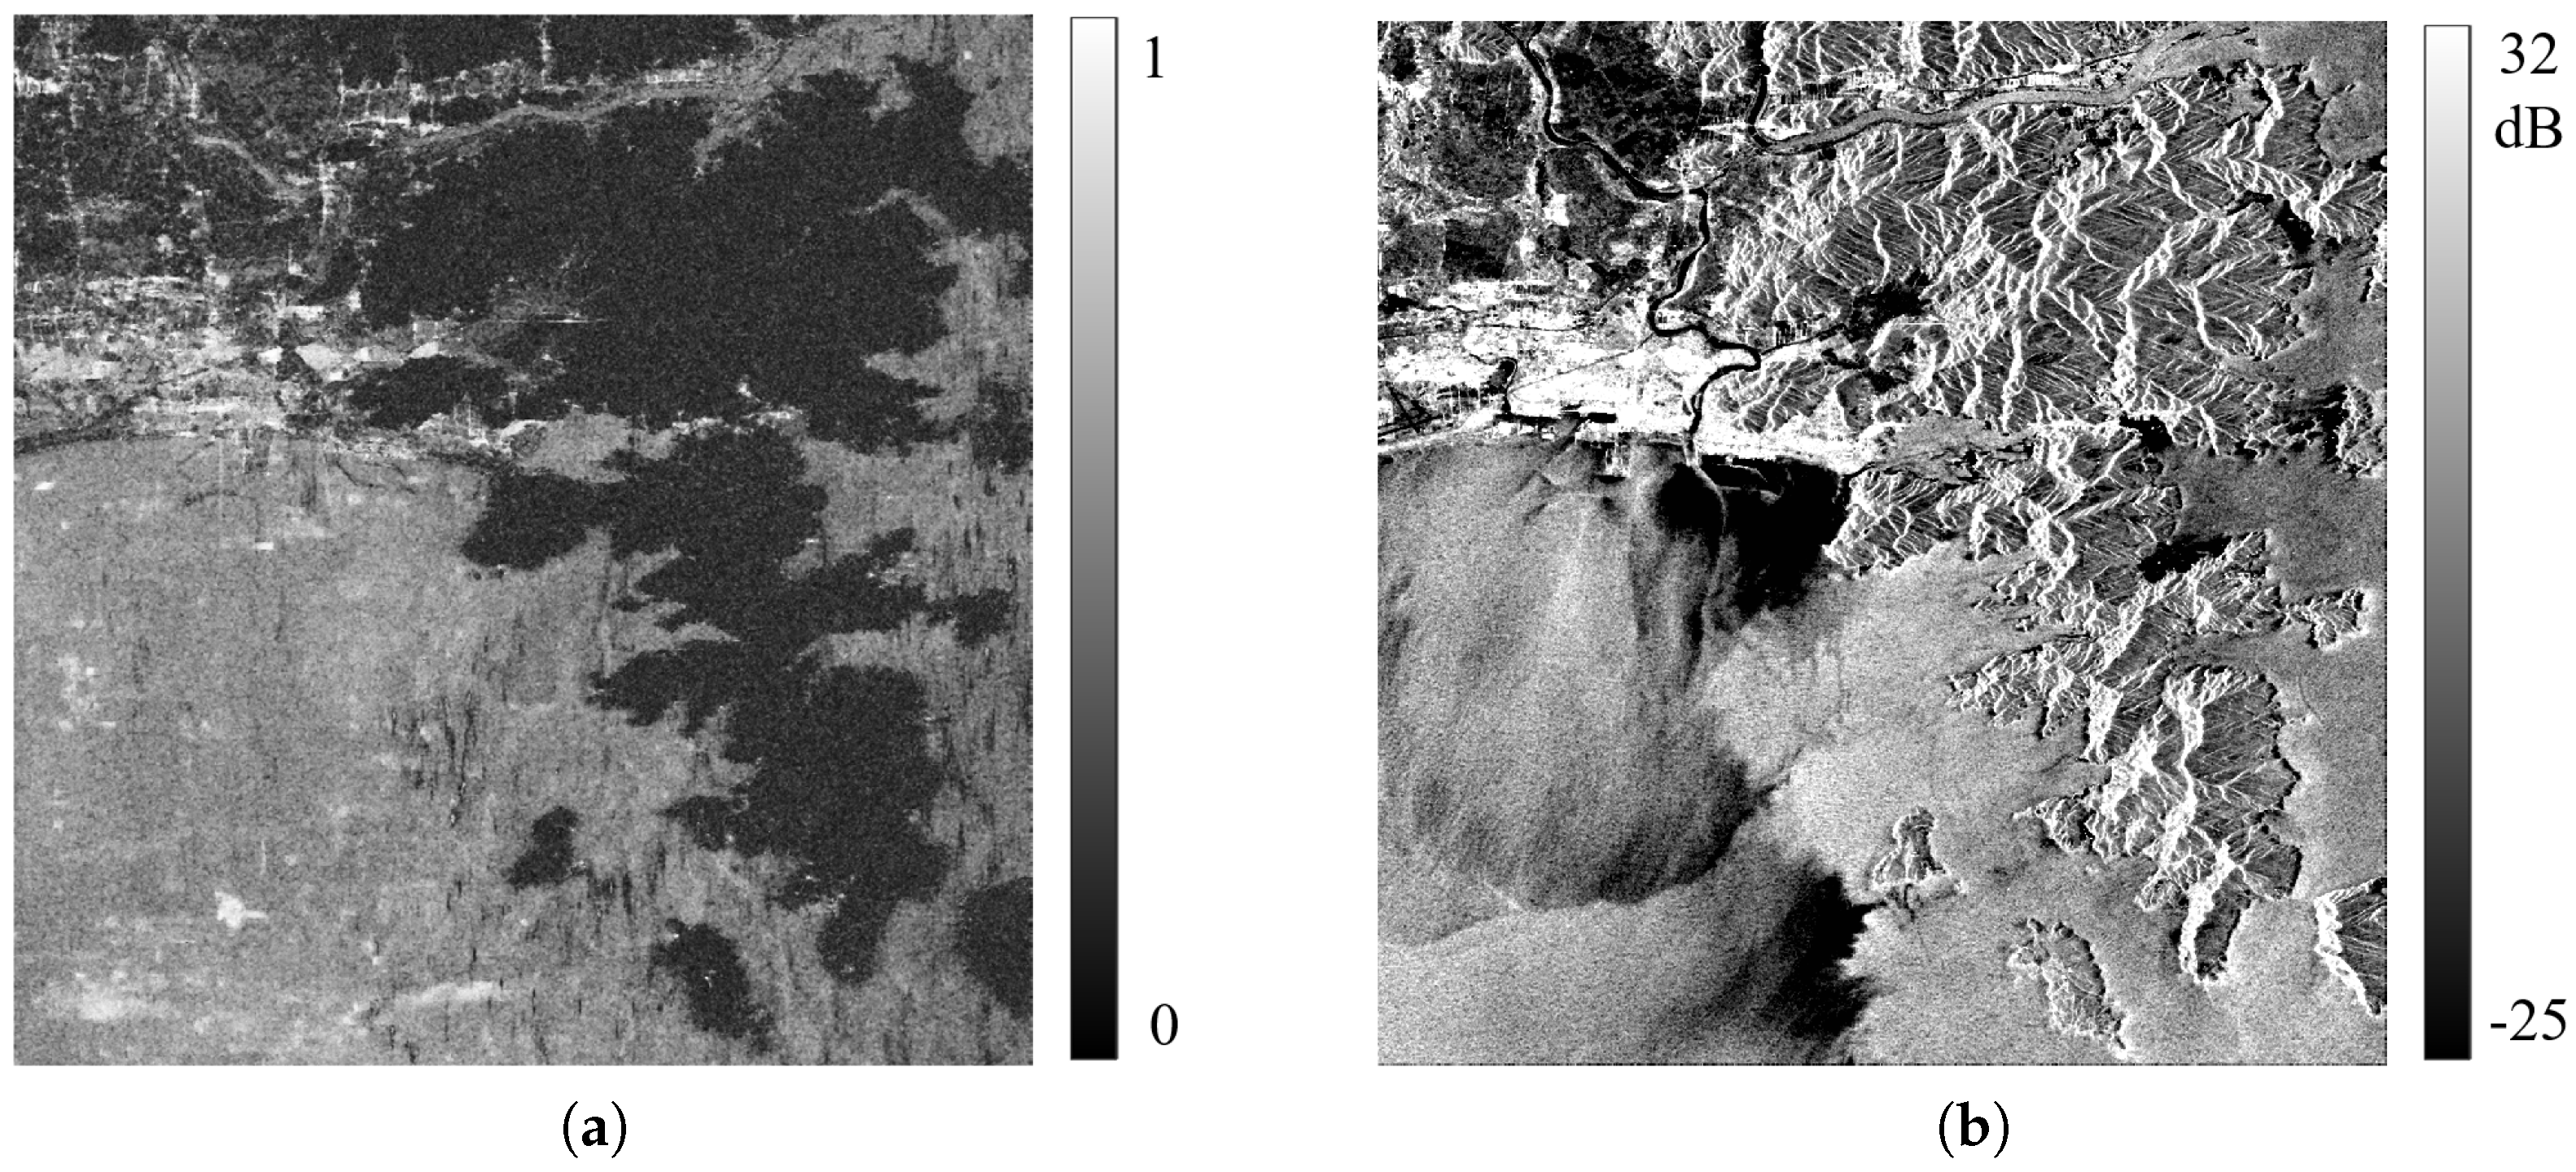
The study in [10,29] indicated that the maximized coherence magnitude | γ ( HH VV ) ( HV ) | max has the best performance in separating urban and mountain areas; in this paper, we use the polarimetric coherence term γ ( HH VV ) ( HV ) ( θ ) as shown in Equation 13. The distribution of the maximized coherence magnitude is as shown in Figure 6a.
γ ( HH VV ) ( HV ) ( θ ) = T 23 ( θ ) T 22 ( θ ) T 33 ( θ )
Figure 6b shows the distribution of the parameter λ from the Cloude-Pottier decomposition; we can see that the λ values for the foreshortening mountain areas and the whole urban areas were larger than for the rest of the mountain areas. Taking only the pixels that were labeled as urban and mountain areas from the preliminary classification result, by setting an appropriate threshold value based on λ , all the urban areas and the foreshortening mountain areas could be identified correctly. After this, the foreshortening mountain areas were eliminated by setting an appropriate threshold value based on the polarimetric coherence magnitude | γ ( HH VV ) ( HV ) | max , and finally, the entire urban area could be properly classified. The judging criterion for a tested pixel x can be summarized by the following equation, whereby the optimal threshold values for ε 1 and ε 2 are determined according to histograms:
x urban , if x mountain and λ ( x ) > ε 1 ; x mountain , if x urban and | γ ( HH VV ) ( HV ) | max ( x ) < ε 2 ;

4.2.2. Majority Voting

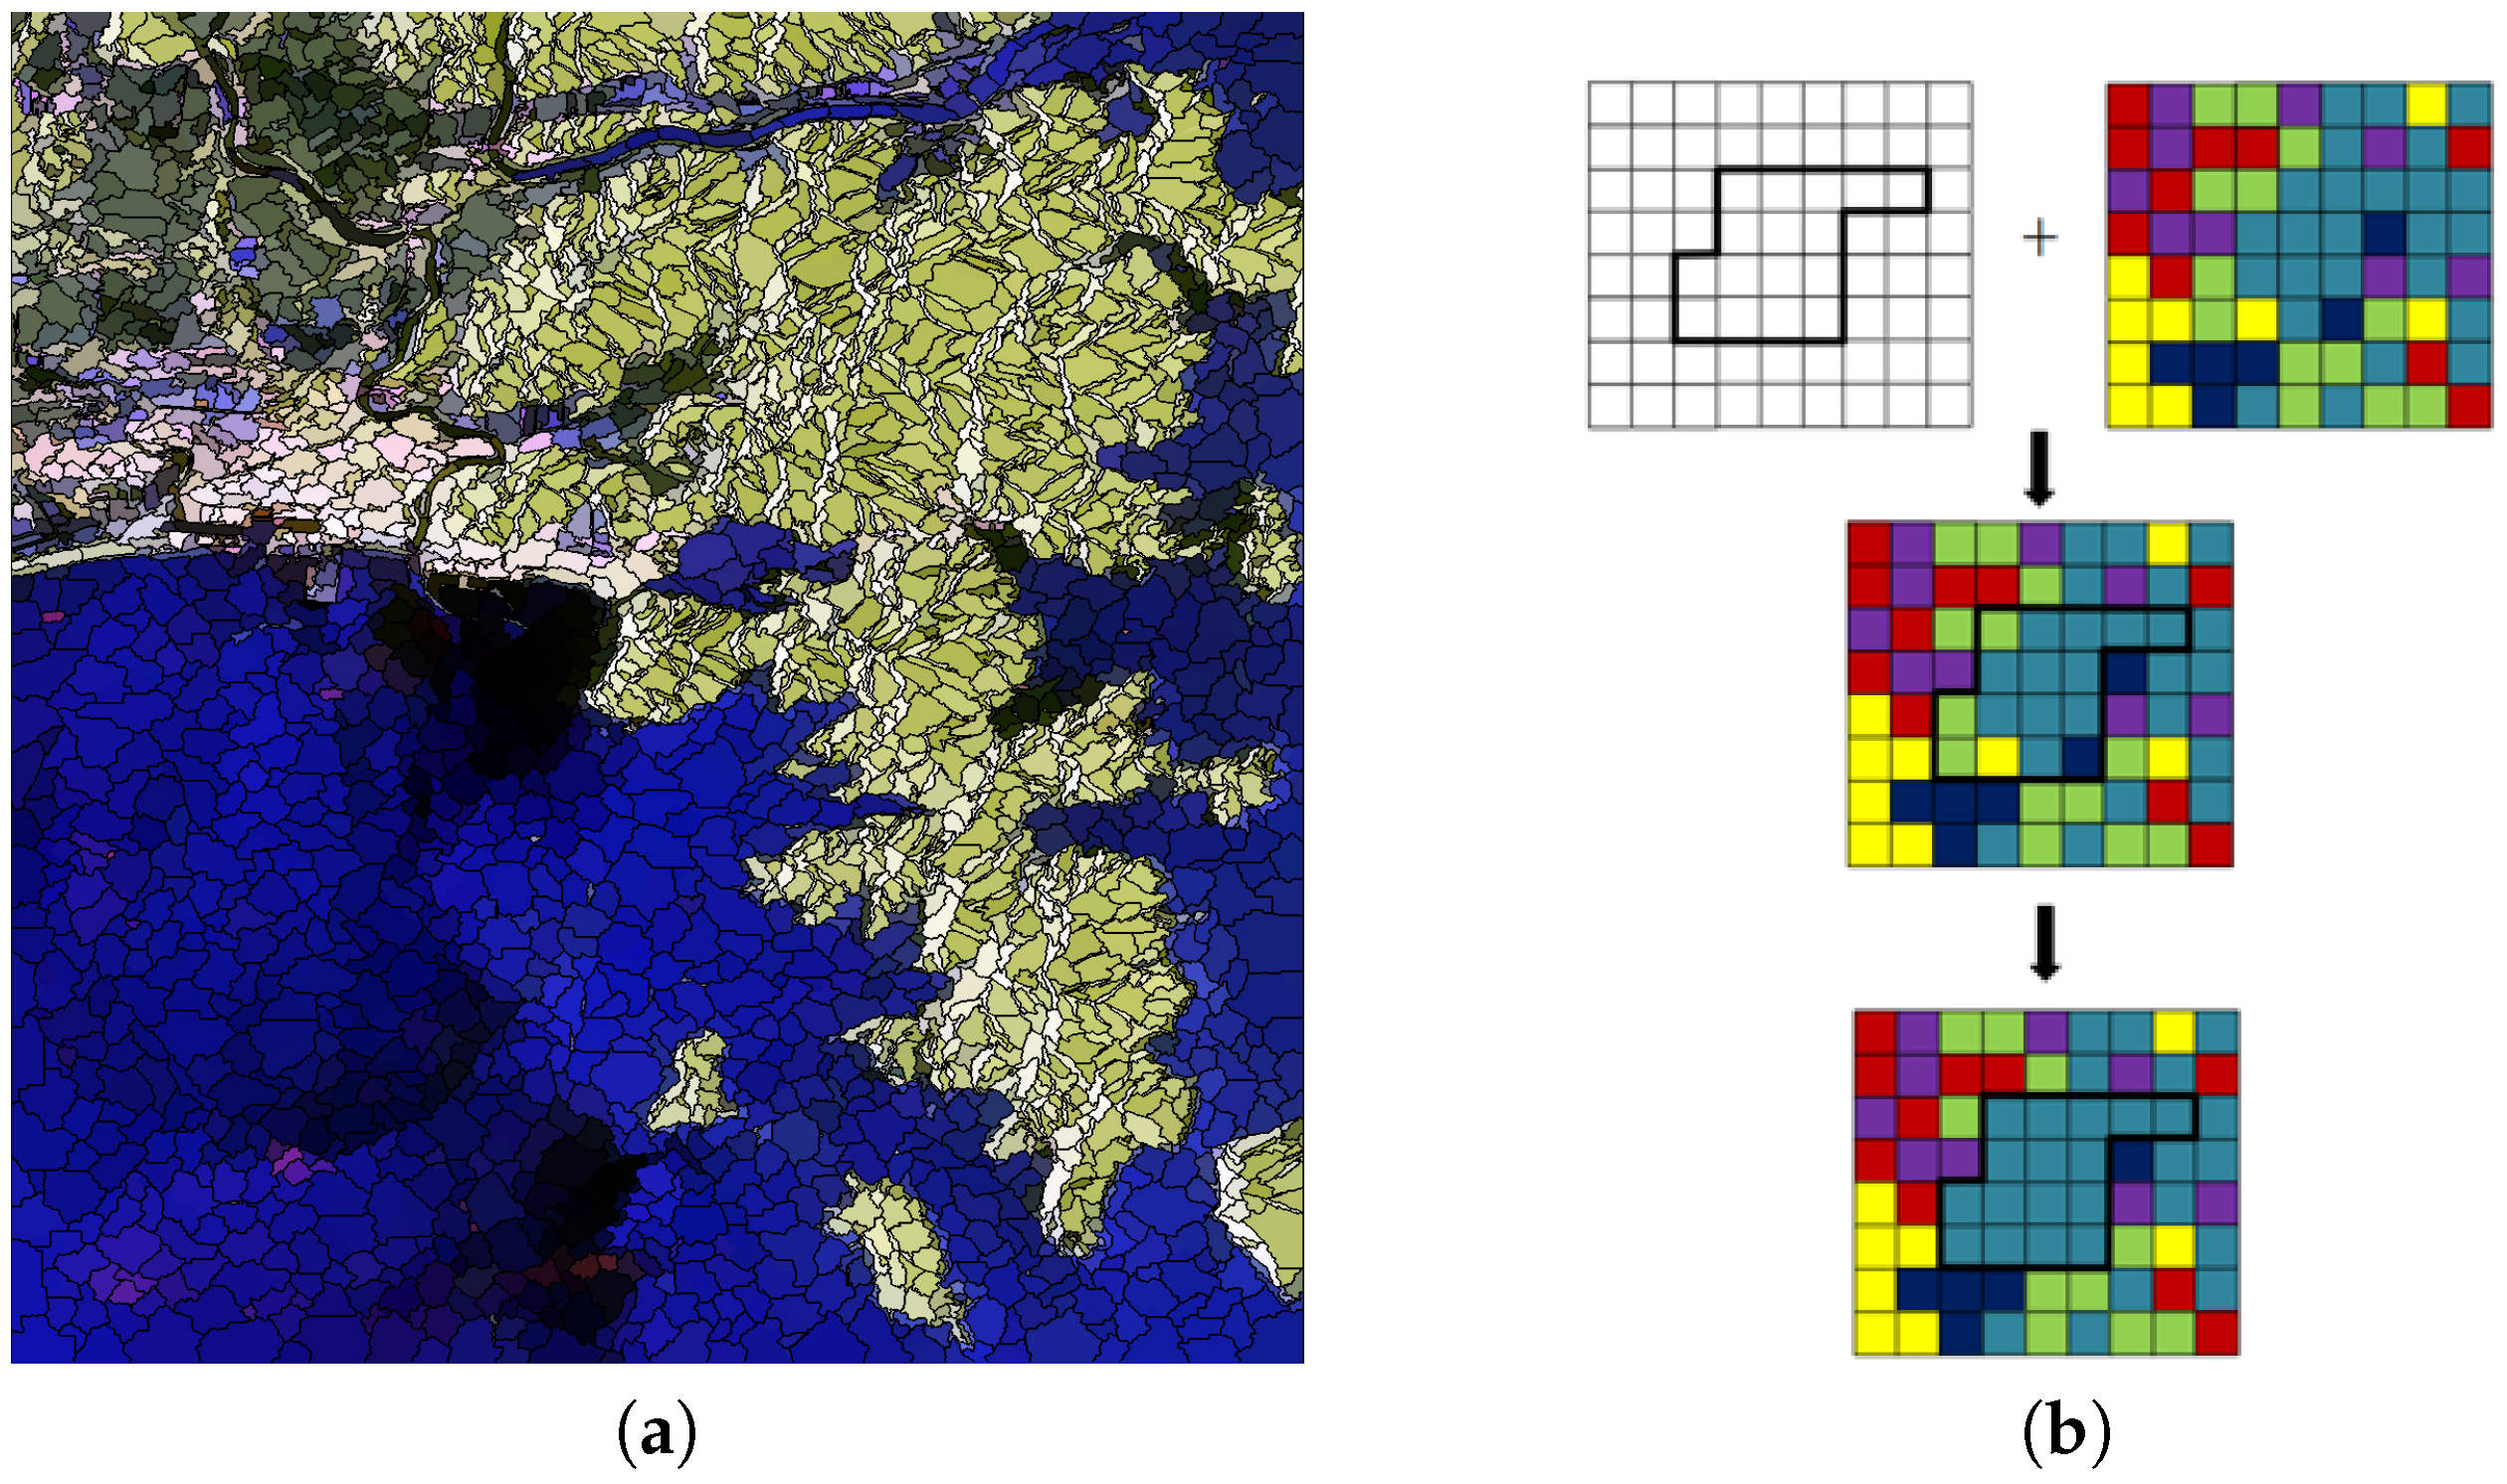
The above work significantly improved the classification result, but a small number of pixels were still not properly classified. In addition, the speckle noise in the SAR data also affected the classification result. Because the SAR data had a relatively low resolution, the pixels in local areas should have belonged to the same class. Thus, we introduced the segmented-region-based majority voting method to obtain a more accurate result. Majority voting [30,31] is a simple and useful technique for improving pixel-based classification results. Using this technique, every superpixel that covers several adjacent pixels is taken as a unit, and all the pixels in it share the same class label. The final class label for the superpixel is defined by selecting the highest-frequency class label among the pixels in it and overwriting the class label of these pixels. The principle of the majority voting method is as illustrated in Figure 7b.
In this study, the superpixels were determined by using a multi-resolution segmentation method [32]. This was a bottom-up method that is excellent in producing highly homogeneous objects on different types of data. The clustering result is obtained by comparing the similarity of two neighboring pixels or targets and ensuring the maximization of heterogeneity between different regions and homogeneity among pixels in the same region. The segmentation result by this method is shown in Figure 7a. Every superpixel is colored by the average color of the segmented region, and its boundaries are marked with a black-colored line. The original PauliRGB image was over-segmented into 4397 superpixels, and the result preserved the homogeneity of the pixels within regions and the heterogeneity between different superpixels.
Figure 8 shows the final classification result. Thresholds ε 1 and ε 2 in Equation (14) were set as 0.29 and 0.23, respectively. Most of the previously misclassified damaged buildings and oriented buildings were labeled correctly to the urban class. All these improvements made the classification result accurate enough for the following research. The urban areas shown in Figure 8 were selected for the subsequent damage assessment.
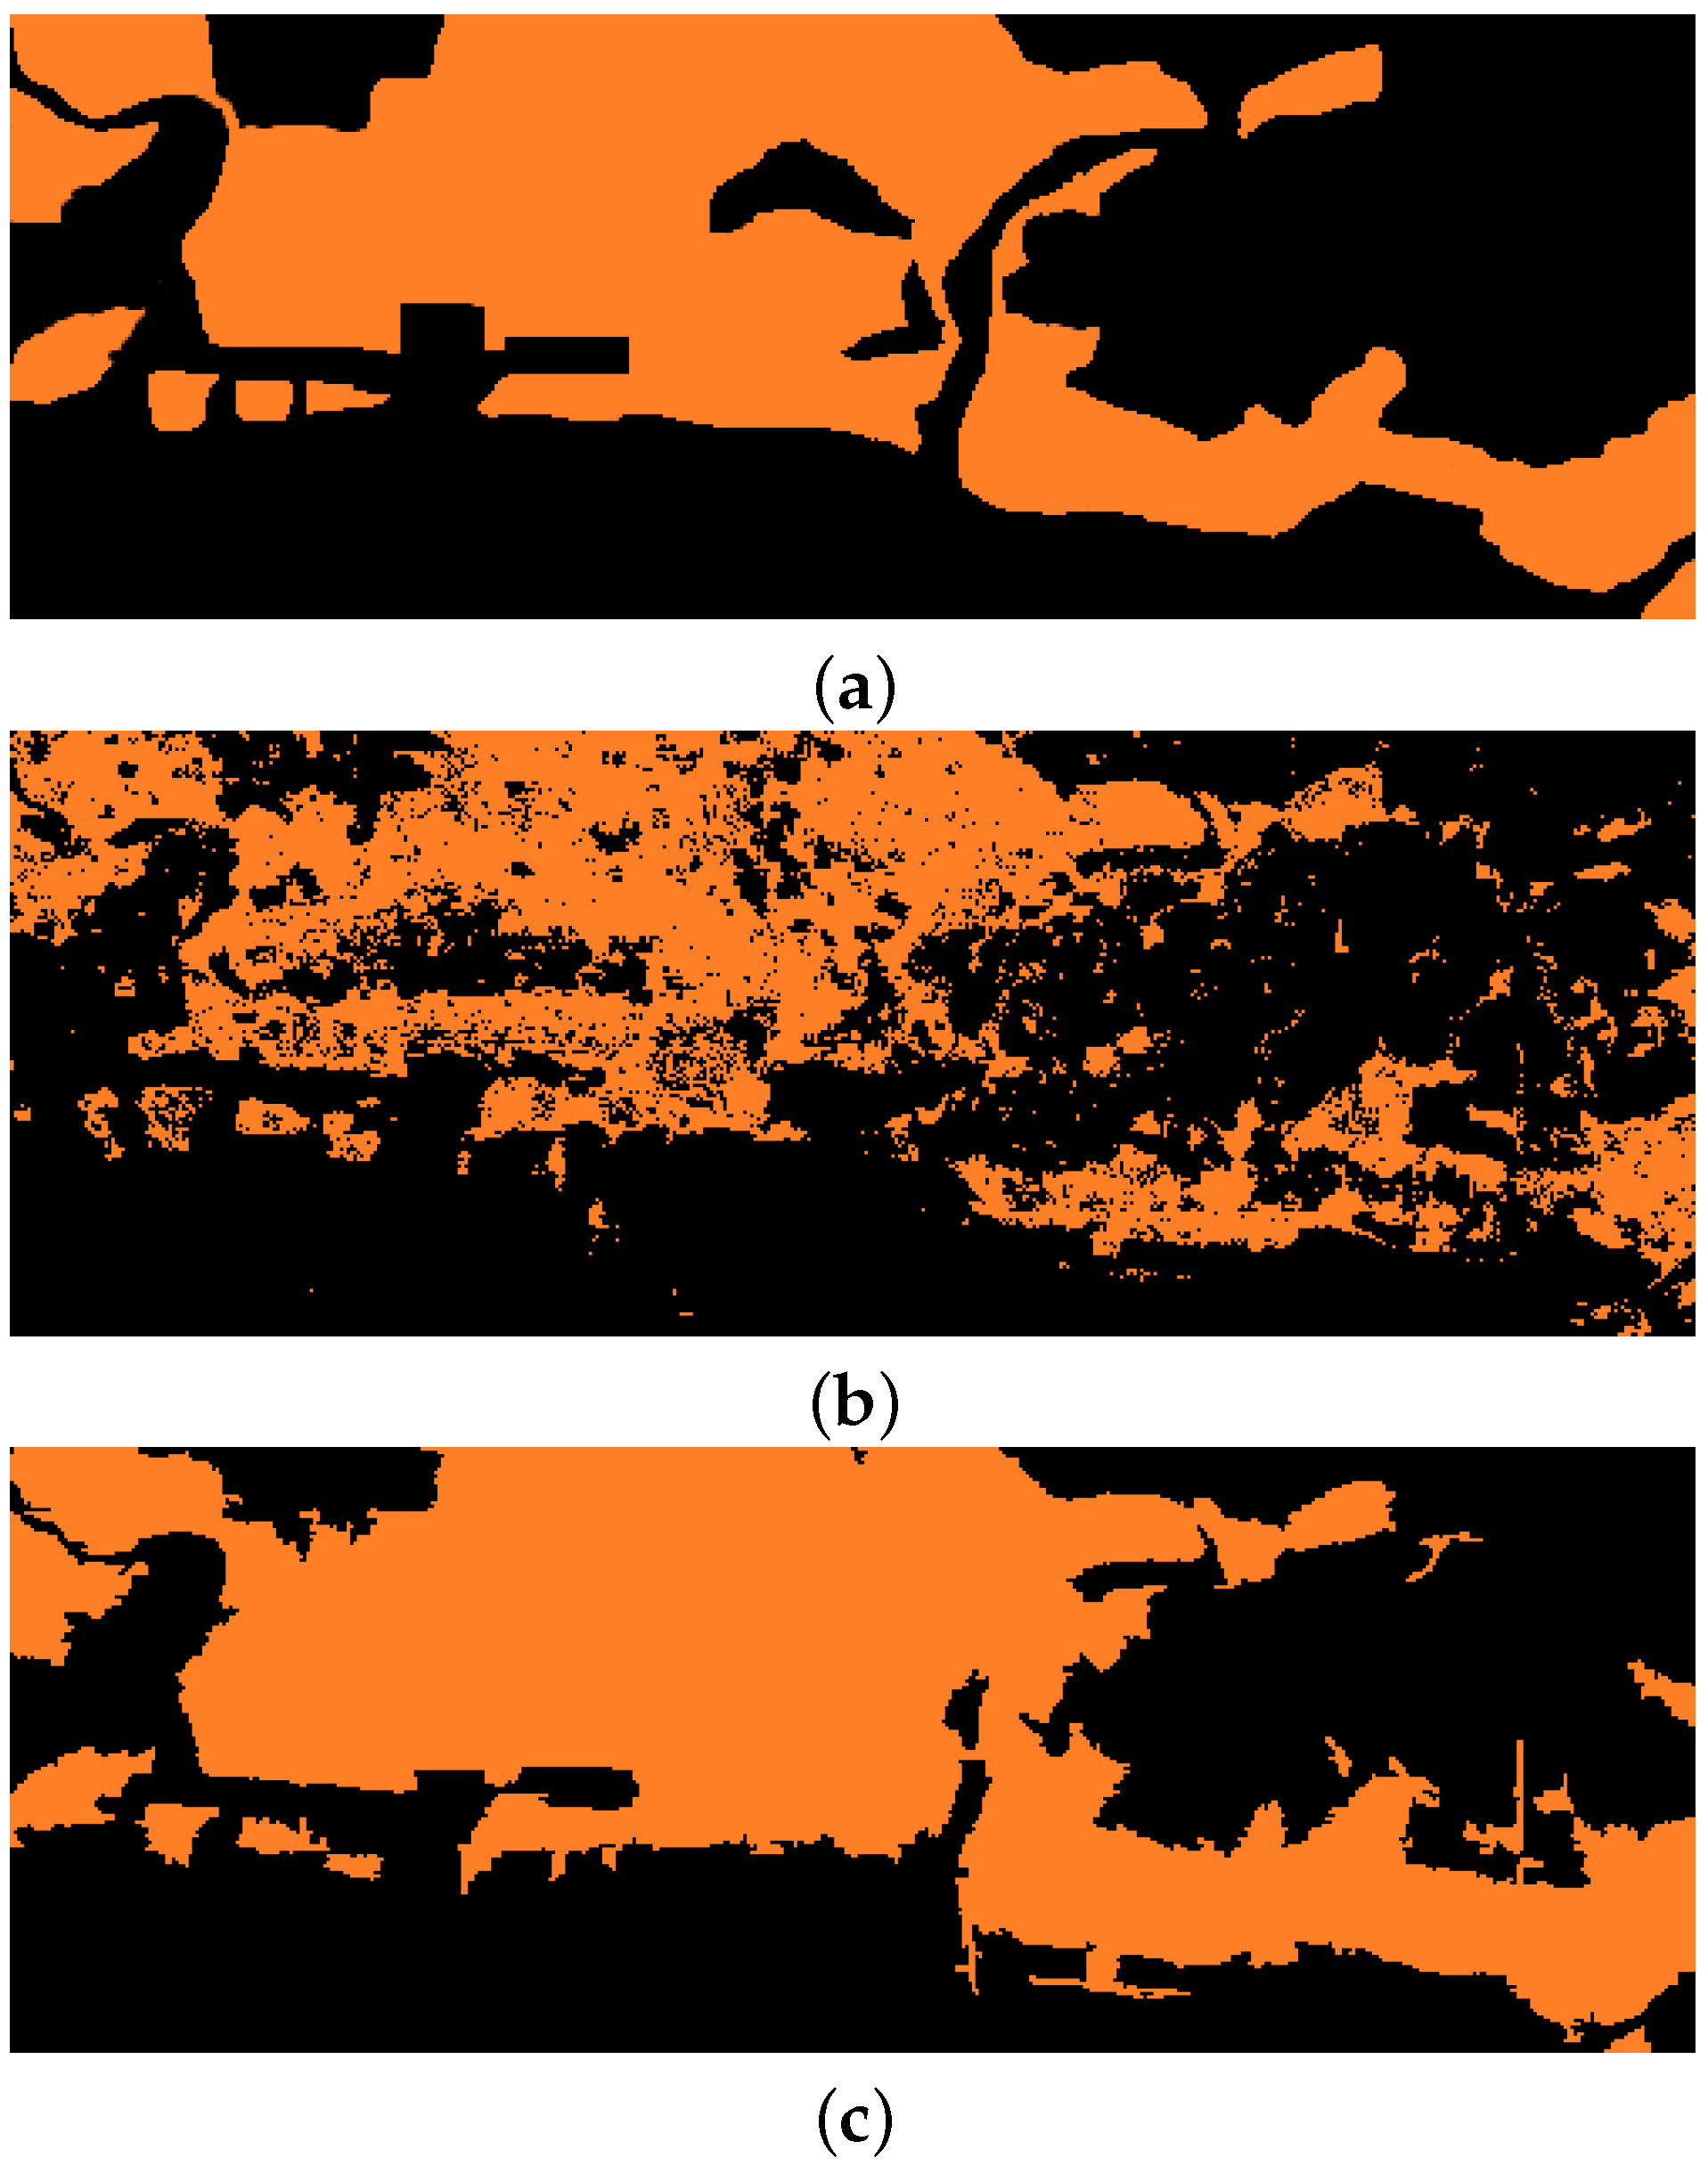
Figure 9a shows the ground truth for urban areas in Ishinomaki City. It was created by visually interpreting the matched Google Earth map and the building-damage map (Figure 3a). Figure 9b shows the urban-area extraction result by the preliminary classification result (Figure 5), while Figure 9c shows the result by the improved classification result (Figure 8). A comparison of these two images indicates that the proposed region-based classification method can obtain a much better urban-area extraction result. It can detect both the damaged buildings and the oriented buildings. By introducing the thresholding and majority voting technique, the urban-area extraction accuracy was increased from 63.06% to 95.81%.

5. Damage Information Extraction

Buildings and other manmade structures can be identified using their strong double-bounce and/or specular polarimetric scattering characteristics. Many previous works [6,7,8,9,12,13] have shown that both the double-bounce scattering power and circular correlation coefficient are sensitive to the building condition because of the fact that collapsed buildings will have lower values in these indexes. Using only post-event data, it is not easy to detect the changes in these indexes, but we can distinguish between damaged and undamaged buildings by their differences in values.

5.1. Circular Correlation Coefficient

The correlation coefficient at the circular polarization basis ρ RRLL [15] is an useful parameter for extracting building information. It exhibits a high correlation with manmade structures that are orthogonal to the illumination [33] source. For damaged buildings, the surface roughness and the helicity increase, hence making the ρ RRLL value much smaller than that of intact buildings. This makes ρ RRLL a suitable index for damaged-building detection; ρ RRLL can be calculated from the calculation formula below:
ρ RRLL = S RR S LL * S RR S RR * S LL S LL *
where R represents the right-hand circular polarization and L represents the left-hand circular polarization. Oriented buildings as well as damaged buildings have low ρ RRLL values; this makes the damaged-building extraction work more challenging. Our proposed method solved this problem; the detailed analysis is covered in the following section.

5.2. Analyses of the Coastal Area of Ishinomaki City

In the disaster areas, after-effect debris from buildings had a random spatial arrangement and orientation and a change in the reflection symmetry in the plane orthogonal to the radar line of sight. Unfortunately, oriented buildings also had similar polarimetric characteristics. These structures induced cross-pol backscattering and lacked reflection symmetry. The works in [11,14] extracted these buildings and defined them as undamaged. However, as mentioned previously, collapsed buildings may create structures with a large orientation angle, meaning they will be identified as undamaged buildings. To cater for this complex situation, a series of detailed analyses on the polarimetric characteristics of the urban areas were conducted. The polarimetric features used in the analyses were the circular correlation coefficient and the double-bounce scattering power, because these are sensitive to manmade structures.
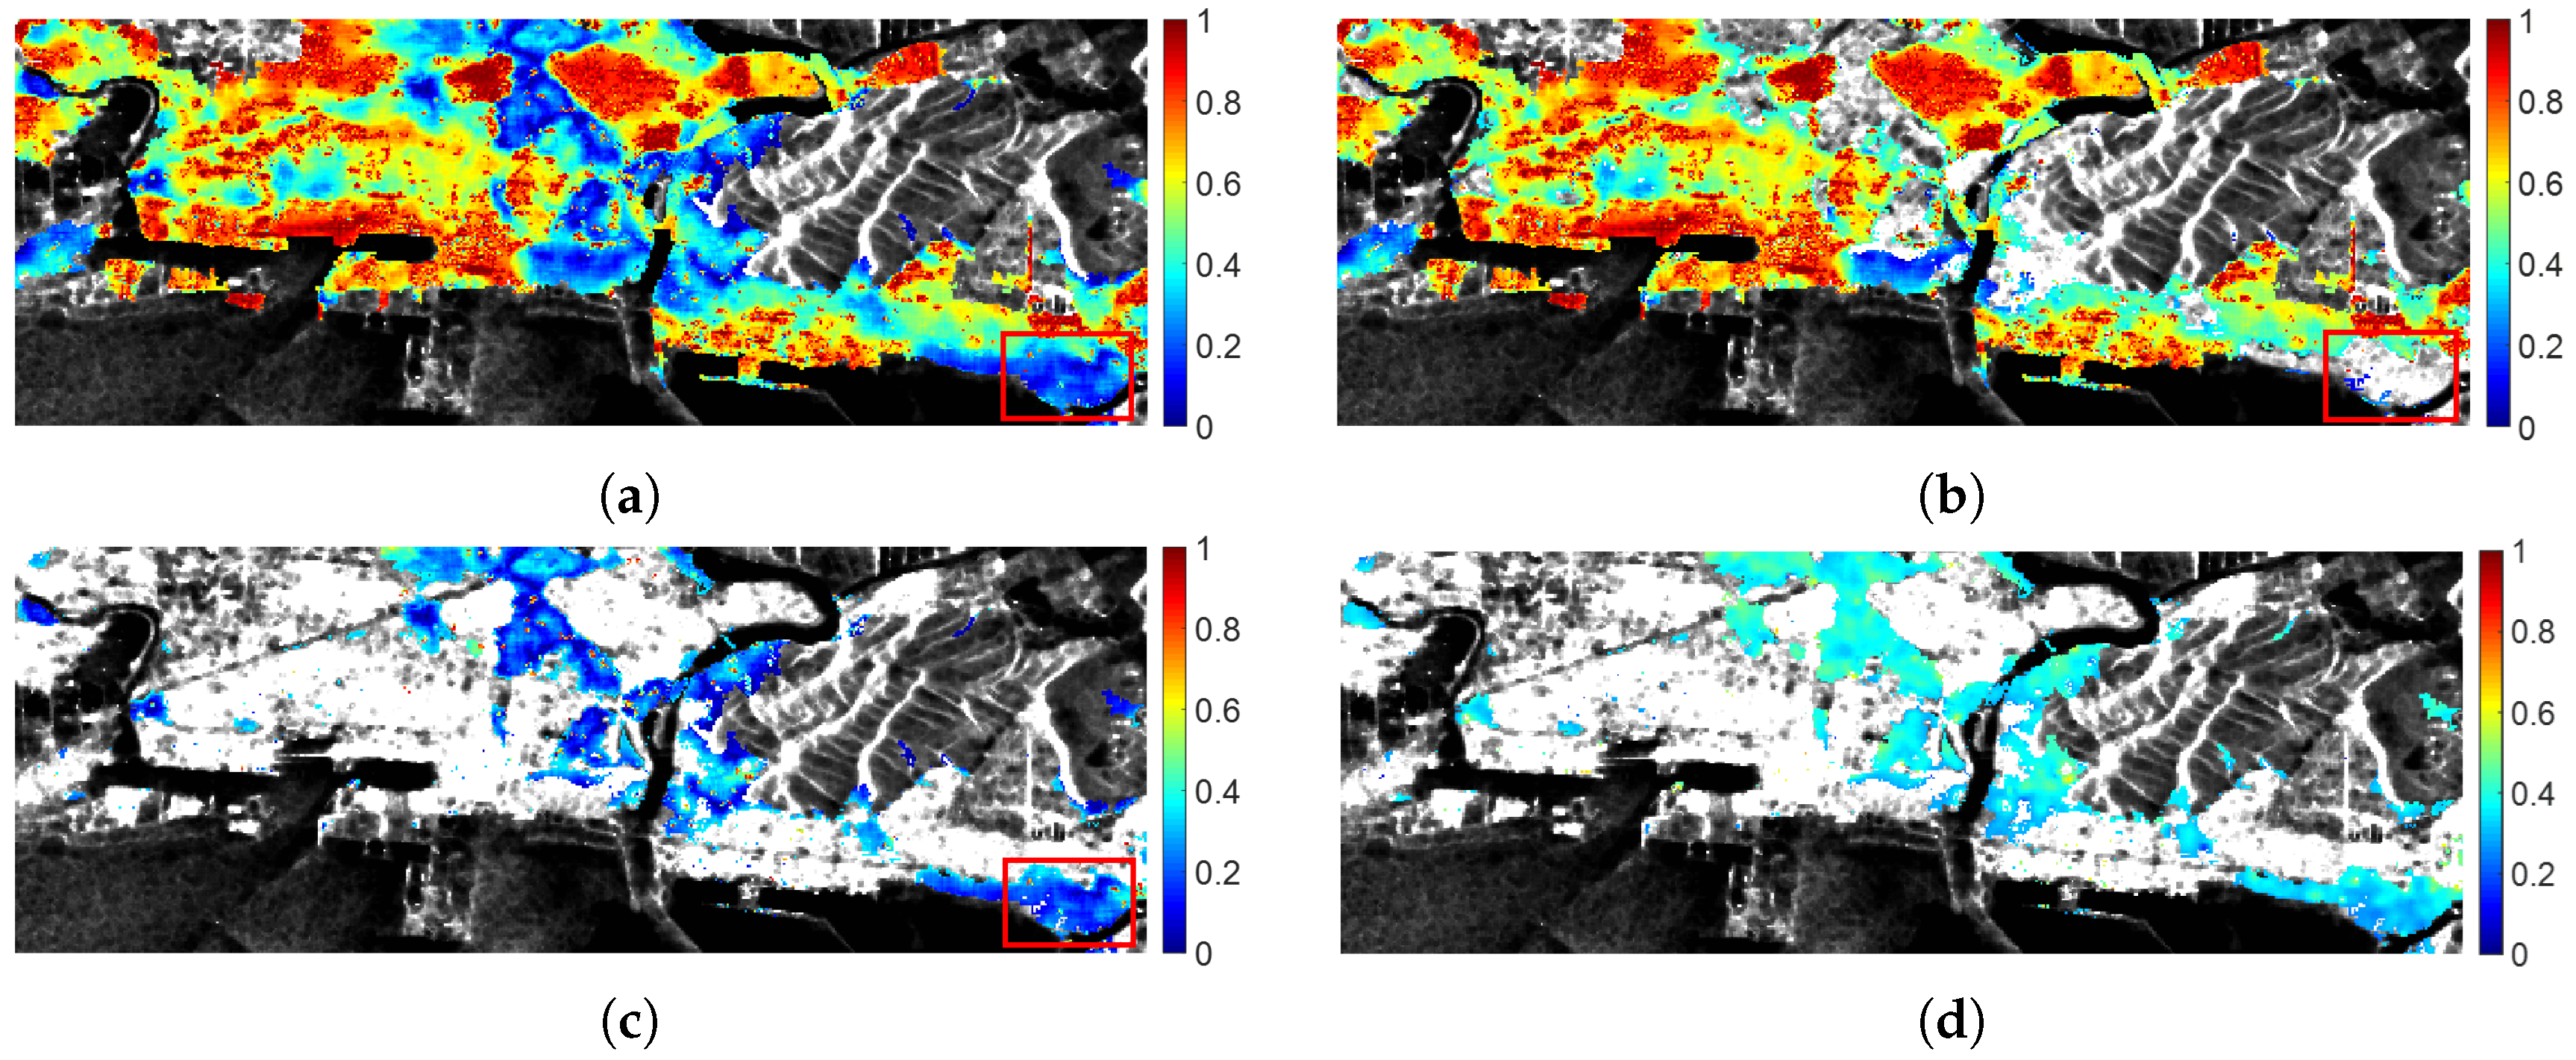
The distribution map of the circular correlation coefficient (Figure 10a) was graphed around the coastal area of Ishinomaki City, which suffered very serious destruction from the earthquake/tsunami. The background image (grayscale image) is the polarimetric span image from which the span value corresponds to the diagonal sum of the elements in the coherency matrix [ T 3 ] . From this distribution map, the urban areas could clearly be classified into two classes, one class being the damaged buildings and oriented buildings with low index values (marked with blue color), and the other being the undamaged parallel buildings with large index values (marked with red color).
The oriented buildings could be identified by analyzing the value changes in the double-bounce scattering power before and after POA compensation. They are the pixels with large value changes. Figure 10b shows the feature values of all the parallel buildings. After the oriented buildings were removed, the damaged buildings could be identified by the difference in ρ RRLL values. However, comparing to the ground-truth map, there should have been some damaged buildings in the red rectangle, but these could not be detected. This was due to the fact that there were many oriented buildings in this area (shown in Figure 10c); thus these buildings were treated as undamaged buildings, which is inappropriate.
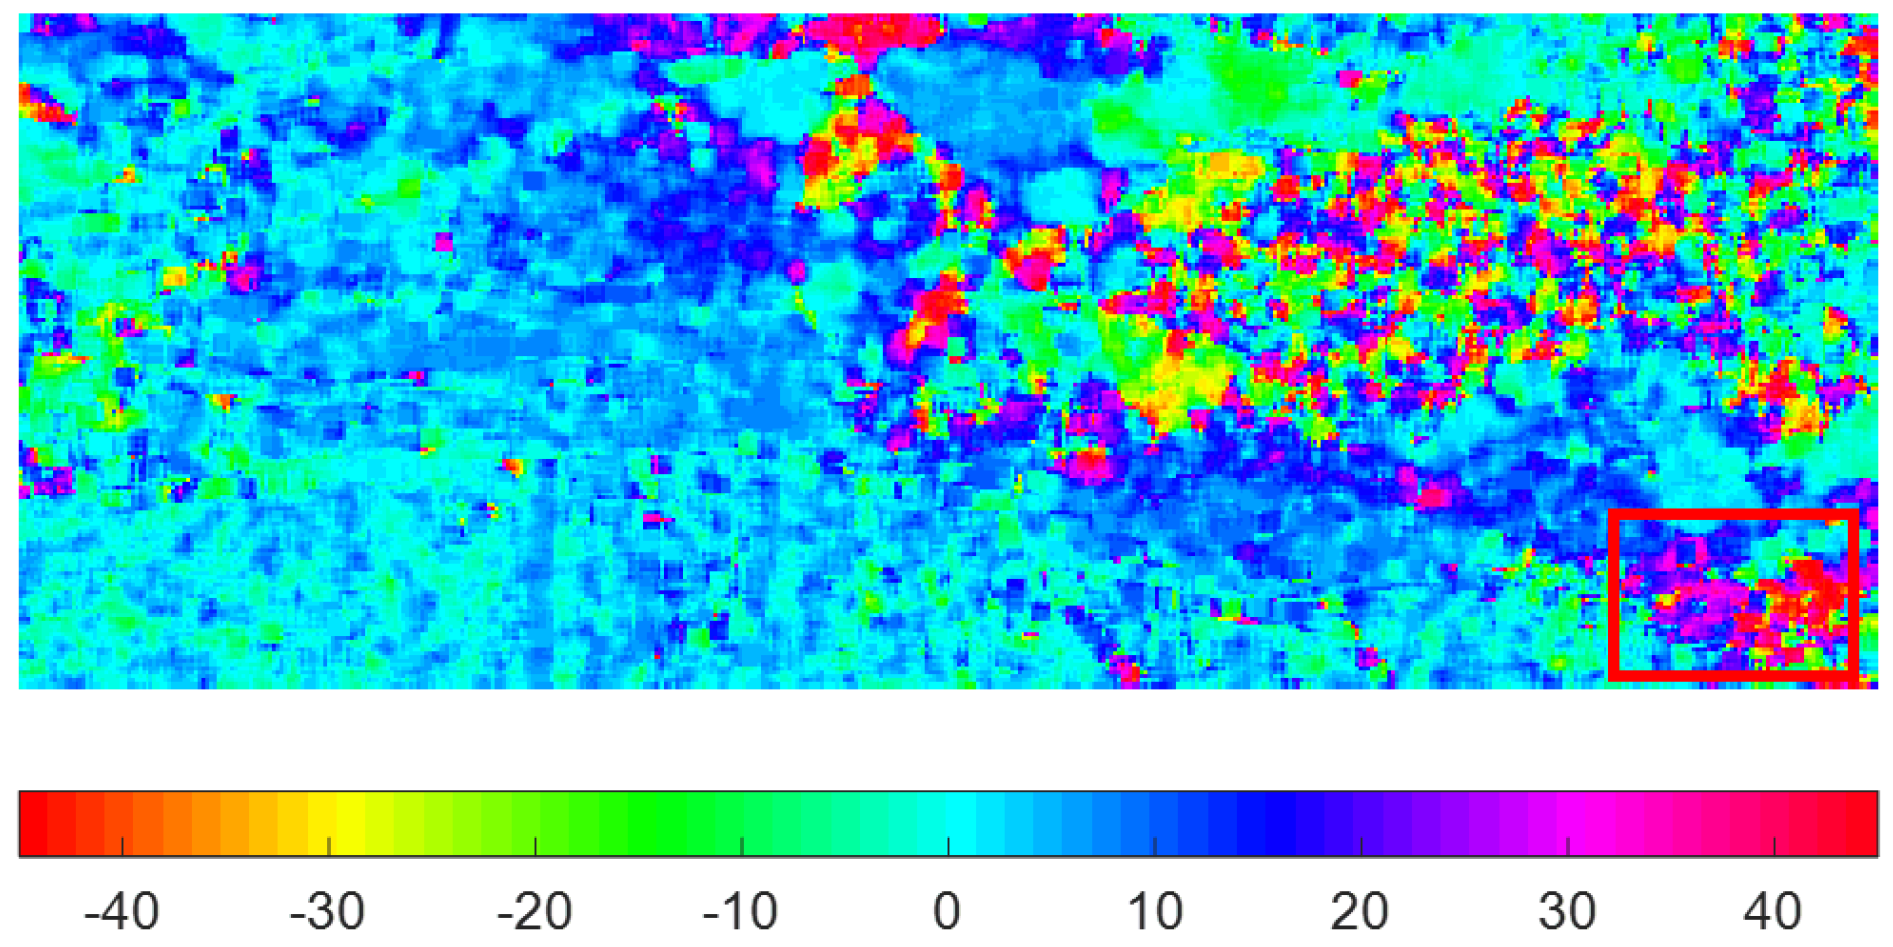
Figure 11 displays the orientation-angle information of the coastal area of Ishinomaki City. The image shows that the orientation angles of the buildings in the red rectangle region were much larger than those of many other damaged buildings. According to Equations (2)–(4), a large orientation angle leads to large changes in the coherency matrix T, and hence, the value changes in the double-bounce scattering power before and after POA compensation will be large. Thus, damaged buildings with a large orientation angle should be taken into consideration while extracting the damaged buildings. Each building depending on its condition was therefore categorized into one of four classes: (i) undamaged building parallel to the satellite flight path (undamaged parallel building), (ii) damaged building parallel to the satellite flight path (damaged parallel building), (iii) undamaged building oblique to the satellite flight path (undamaged oriented building), and (iv) damaged building oblique to the satellite flight path (damaged oriented building).
Samples of every building category were selected for further analysis to explore the differences in their polarimetric characteristics. These pixels were chosen from seven different regions in the coastal area of Ishinomaki City. These regions are marked with rectangular boxes in different colors. Figure 12a shows the location of these regions (labeled as 1–7). The selection of damaged buildings and undamaged buildings was made on the basis of the ground-truth map, while the information regarding building orientation (parallel buildings or oriented buildings) was derived by referring to the power changes in the double-bounce scattering before and after POA compensation [14].
Figure 12b shows the real and imaginary parts of the circular correlation coefficient for the tested samples. The oriented buildings were concentrated on the fourth quadrant of the complex plane, while the parallel buildings were located in the second and third quadrants. From the distribution chart, the real-part value of the circular correlation coefficient could also be used in discriminating between parallel buildings and oriented buildings; this is similar to the technique that uses the changes in the double-bounce scattering power before and after POA compensation. In our proposed method, we use this index to differentiate between oriented buildings and parallel buildings for its low computation complexity. Figure 12c shows the modulus and phase values of the circular correlation coefficient, which gives a clear indication about the differences between damaged and undamaged buildings. The damaged parallel buildings and undamaged parallel buildings showed great differences, while both the damaged and undamaged oriented buildings shared similar values with the damaged parallel buildings. We infer from this that all damaged buildings, particularly the damaged oriented buildings from the entire urban area, could not be accurately detected by simply setting a threshold using the circular correlation coefficient.
For areas with oriented buildings, the double-bounce scattering power is a more suitable index for damaged-building identification. As shown in Figure 12d, the double-bounce scattering power is not appropriate for differentiating between damaged parallel buildings and undamaged parallel buildings. However, it showed significant difference among the damaged and undamaged oriented buildings. Figure 10d shows the double-bounce scattering power distribution map for the oriented area. Differences could be detected between the damaged buildings and undamaged buildings. Thus, a threshold based on the double-bounce scattering power (after POA compensation) is pertinent to the detection of damaged buildings in oriented areas.

5.3. An Unsupervised Damaged-Building Extraction Algorithm

The analyses above show that our proposed four building-condition categories fit well for the disaster event. To identify damaged buildings, we propose to detect them separately from areas with parallel buildings and areas with oriented buildings. For areas with parallel buildings, the damaged buildings can be identified by the magnitude of the circular correlation coefficient. For areas with oriented buildings, the double-bounce scattering power can be introduced to differentiate damaged buildings and undamaged buildings.
Above all, an unsupervised damaged-building extraction algorithm can be proposed. For this unsupervised method, no prior damage information is needed. After urban areas are extracted from the classification result, they will be divided into two categories, which are areas with parallel buildings and areas with oriented buildings. Independent thresholds that are based on different polarimetric features can be calculated by using an automatic threshold method. A criterion is proposed for damaged-building extraction; it is shown as follows:
x damaged building , if x parallel area and ρ RRLL ( x ) < T 1 ; x damaged building , if x oriented area and P d ( x ) < T 2 ;
where x is the tested pixel labeled as urban, ρ RRLL is the magnitude of the corresponding circular correlation coefficient, and P d ( x ) is the double-bounce scattering power value of pixel x. The optimal thresholds T 1 and T 2 can be calculated through a statistical histogram analysis or another automatic threshold determination technique.

6. Result and Analysis

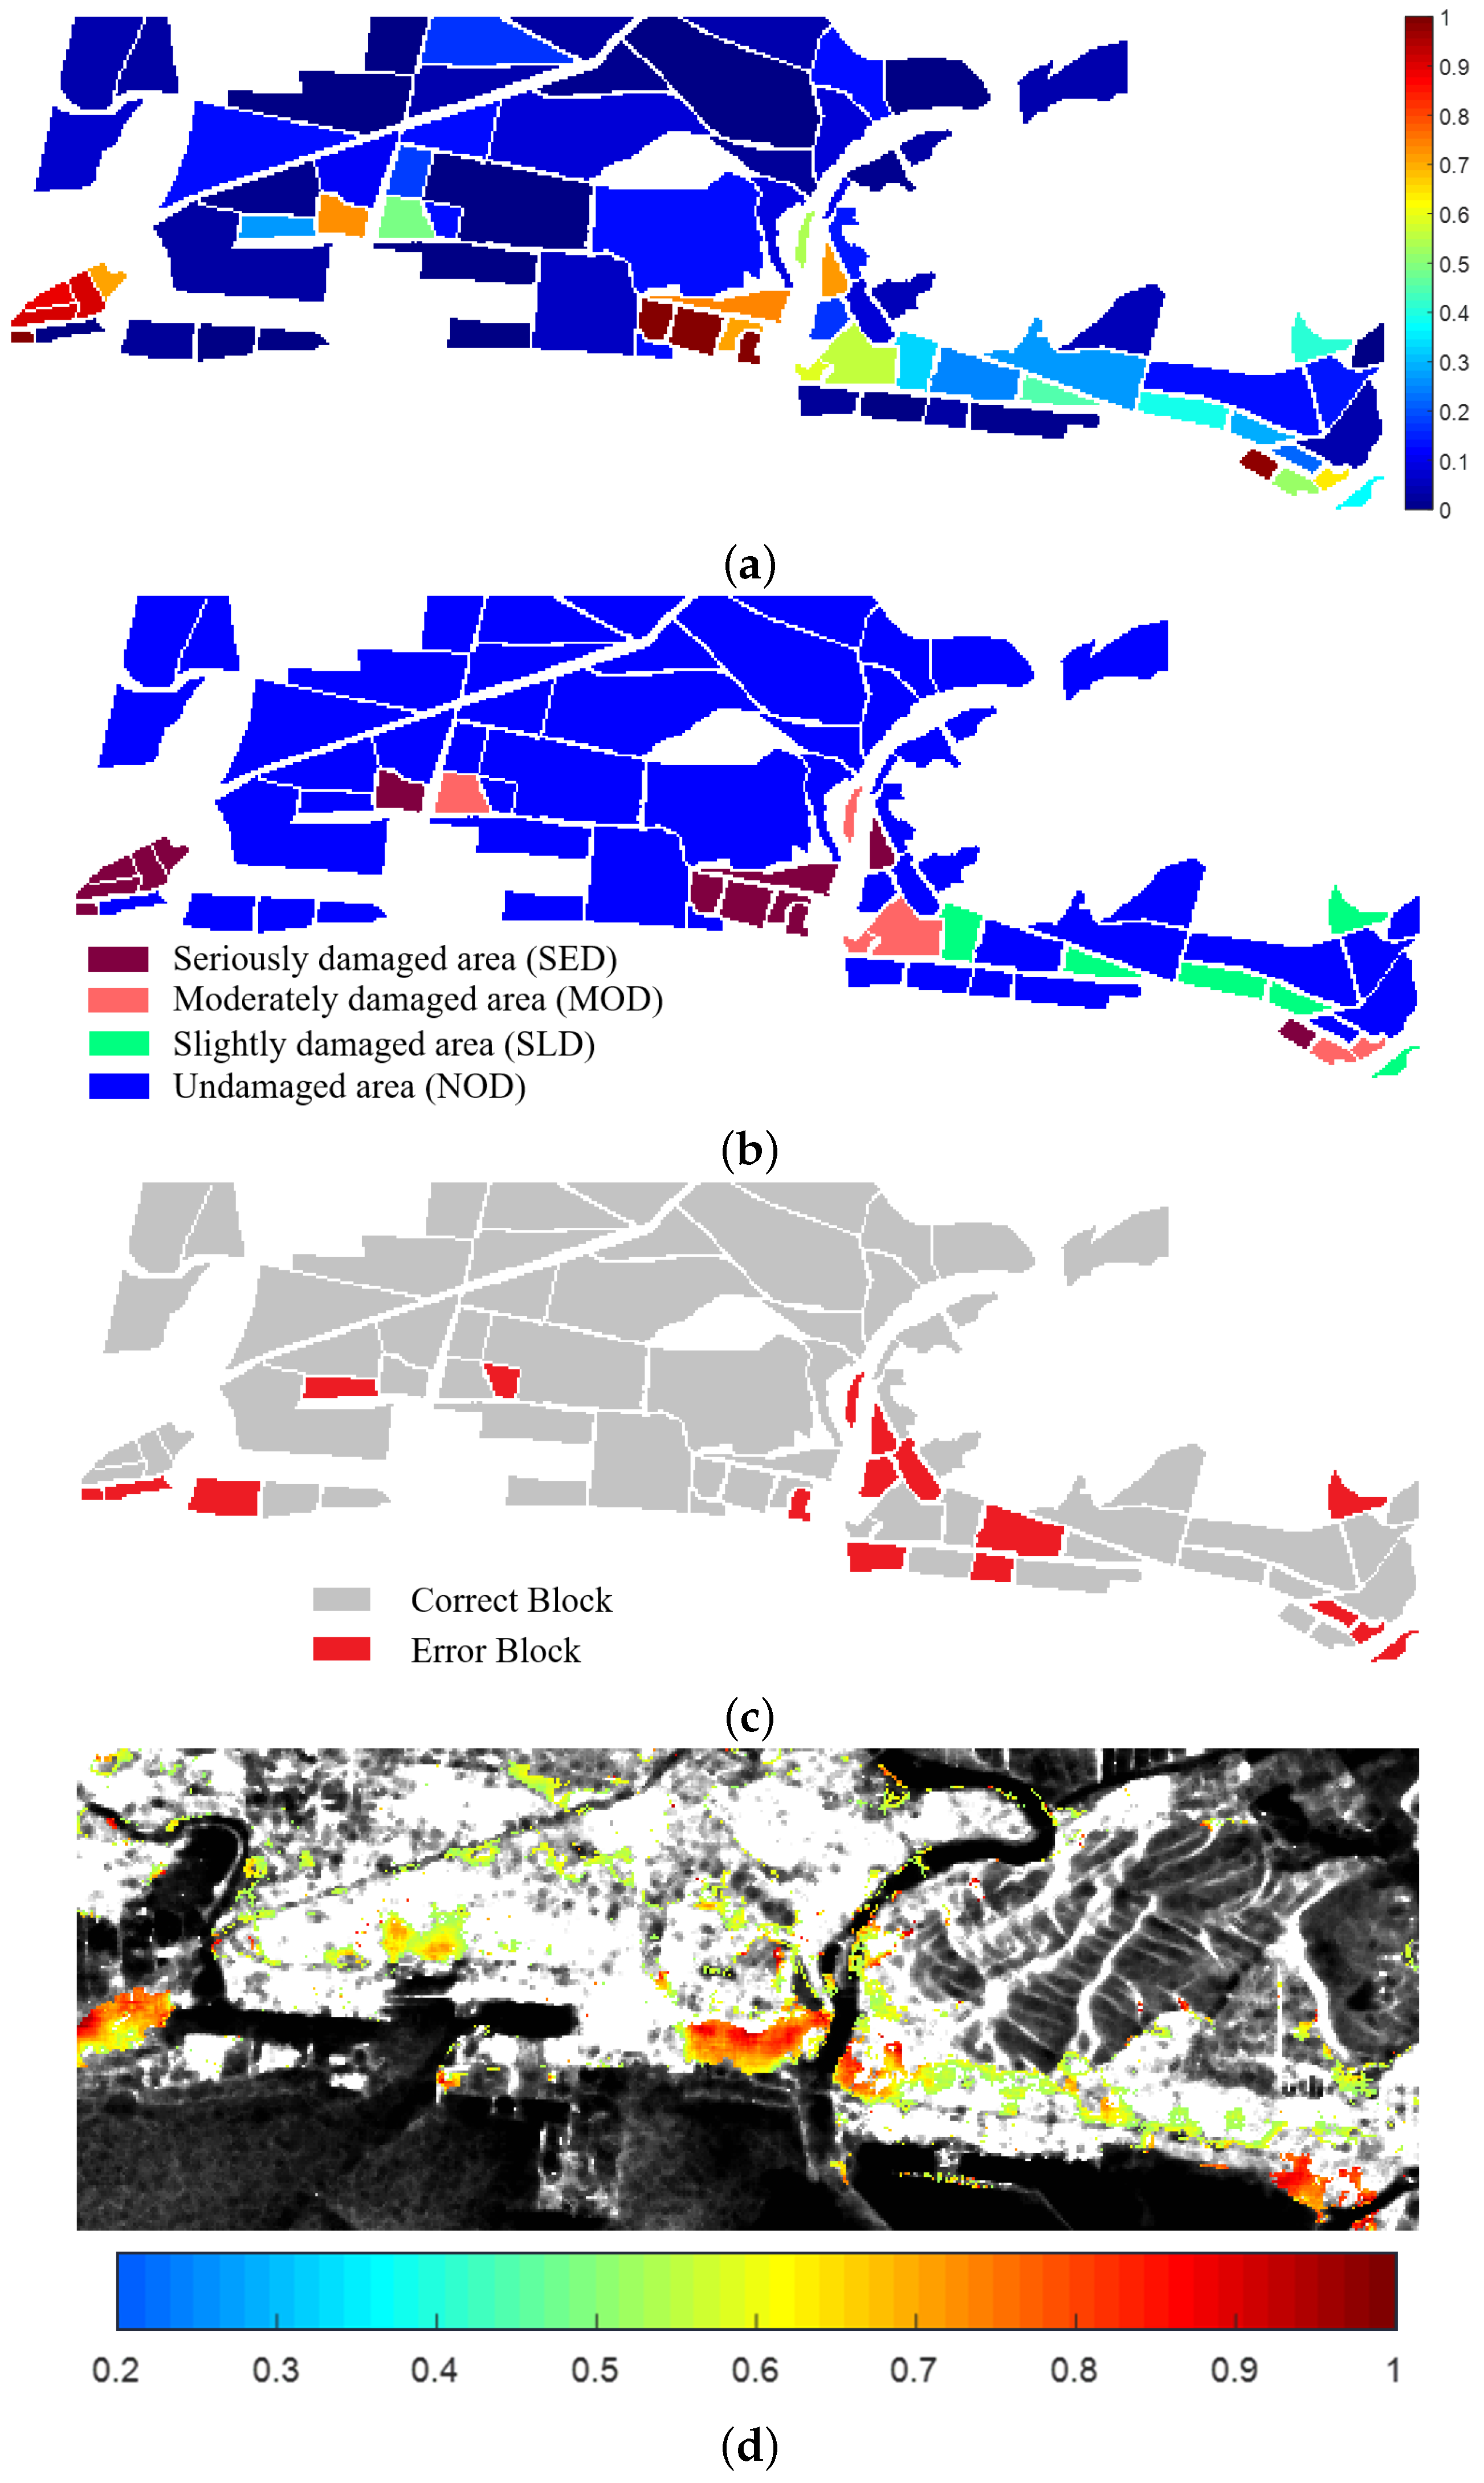
Figure 13 shows the damaged-building assessment results for our entire study data. The thresholds T 1 and T 2 in Equation (16) were set as 0.47 and 0.305, respectively. The damaged buildings extracted using our proposed method are marked in red and are overlayed on the PauliRGB image from Figure 2.

6.1. Coastal Area of Ishinomaki City

To give a similar perspective for the damage situation comparison to the ground-truth data, the obtained results were converted into a block scale for the same regions as in Figure 3b. The damage level for each region was defined as the ratio of the number of pixels of damaged buildings to the total number of pixels in the same block. Figure 14a shows the block-scale damage-level map for the coastal area of Ishinomaki City (area 01 in Figure 13). Figure 14b shows the damage-degree map, which was calculated using the same principle as for the creation of Figure 3b. Comparing this to the ground-truth block-scale damage assessment map, most damaged regions were marked properly, particularly SED regions. Figure 14c shows the error-block distribution map. The blocks that were assigned wrong damage degrees are labeled in red.
As discussed earlier, the circular correlation coefficient ρ RRLL has a high sensitivity to manmade structures and is a suitable index for damage-level assessment. The damage-level index can be formulated as shown in Equation (17), where ρ RRLL is the magnitude of the circular correlation coefficient of the identified damaged building. Figure 14d shows the damage-level map created using the index I ρ RRLL . The map not only gives a detailed description about the location of the damaged buildings, but it also shows the damage severity of the disaster. The pixels with large index values correspond to SED or MOD areas, while those with a small index value correspond to SLD areas. Although the proposed map does not exactly match the true damage level, the map is useful to provide quick information about the damage location and severity.
I ρ RRLL = 1 ρ RRLL

6.2. Analysis for Two Other Areas

Other than the urban area around the coastal area of Ishinomaki City with serious destruction, we also compared the damaged-building extraction results obtained using our new proposed technique with the ground-truth building-damage map for two other areas. The locations of these two regions are shown in Figure 13 (areas 02 and 03).
Figure 15a,b shows the ground-truth building-damage map and the damaged-building extraction results for the town of Onagawa, Miyagi prefecture (area 02). According to Figure 15a, we can see that most buildings located around the sea shore were damaged, and they could be detected by our proposed method.
Figure 15c,d shows the ground-truth building-damage map and the damaged-building extraction results for the river area in Ishinomaki City, Miyagi prefecture (area 03). The damaged area near the bridge could be identified, but there were several undetected damaged areas, particularly those near the estuary (black circles in Figure 15c). For the area near the estuary, all the manmade structures were flooded by the tsunami, and the standing water in these areas led to the result that these areas were classified as water. Without using the pre-event data, the proposed technique failed to detect the damaged buildings in these areas.

6.3. Comparison with Supervised Damage Assessment Technique

Our proposed method can assess the damage incurred by a disaster without the need of prior damage information (ground-truth damage information) for the training process. To benchmark our proposed method against the existing approaches, we compare the outcomes of our method to the outcomes obtained through the supervised damage assessment technique using a SVM classifier. The four-component decomposition features ( P s , P d , P v , and P h ) and Cloude-Pottier decomposition features (H, A, α , and λ ) calculated from POA-compensated data, the circular correlation coefficient ρ RRLL , and the polarimetric coherence magnitude | γ ( HH VV ) ( HV ) | max are the inputs to the classifier. These classification features are exactly the same features used in our proposed method. The training data is selected according to the ground-truth damage-assessment map and the matched Google Earth map. The RBF kernel is selected for the classifier, whereby the penalty parameter C and the width of the kernel function g are optimized by a cross-validation procedure. Figure 16a shows the pixel-based damage assessment result from the supervised damage assessment technique. All the data were classified into six classes: water, mountains, farmland, undamaged parallel buildings, undamaged oriented buildings, and damaged buildings. The supervised damage assessment technique could classify damaged buildings, undamaged parallel buildings, and undamaged oriented buildings well. However, many misclassifications occurred as a result of the speckle noise in the SAR data. Moreover, many foreshortening mountain areas were labeled as damaged buildings and undamaged oriented buildings because they had similar polarimetric characteristics and because the training processing failed to differentiate between them correctly.
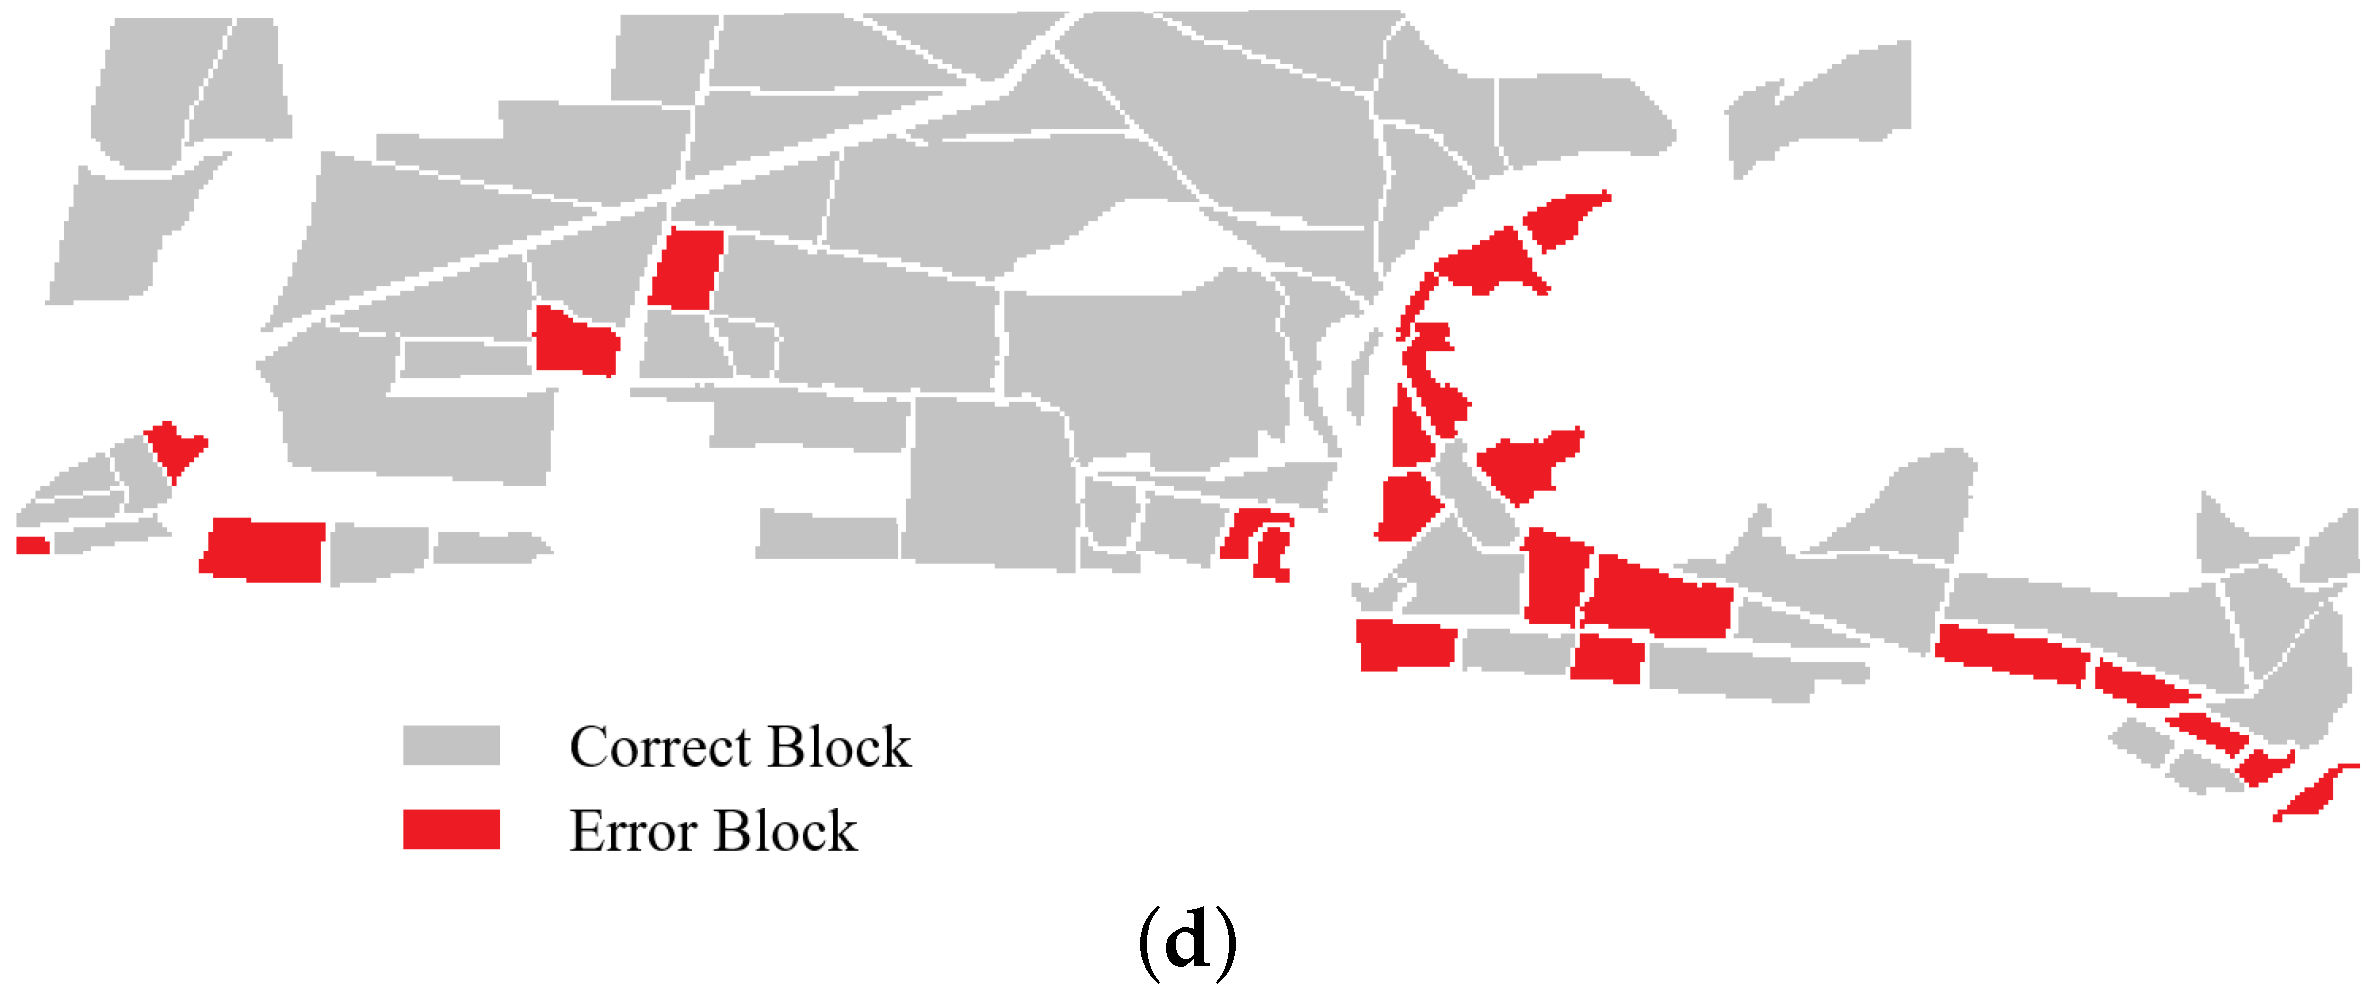
Figure 16b shows the damaged-building distribution map for the coastal area of Ishinomaki City, and Figure 16c shows the block-scale damage-degree map generated using the same approach as is discussed in Section 6.1. For the area around Ishinomaki City, the supervised method could produce a satisfactory result. Most SED and MOD areas could be correctly labeled, but many NOD and SLD regions were labeled with the wrong damage degree. Figure 16d presents the error-block distribution map; it showed more error blocks compared with the result of our proposed method.
Table 1 gives a better comparison between the supervised SVM classifier and our proposed method. C/T in the table represents the proportion of correct blocks to the total blocks for every category. The accuracy for both every category and for the whole data are based on the pixel scale. Our proposed method marked out all SED regions and most MOD and NOD regions. The overall accuracy for the supervised SVM technique was 88.81%, while our proposed method showed an accuracy of 92.28%. This shows that, without using any pre-disaster information or post-disaster ground-truth damage information, the proposed method can produce more accurate building-damage assessment results.

7. Conclusions

An unsupervised damage assessment method is proposed for urban areas with a complex damage situation, and the proposed method shows high superiority for post-disaster damage assessment using only post-event PolSAR data. The method was validated through a study on the Tohoku earthquake/tsunami event, using the low-resolution L-band ALOS/PALSAR dataset.
Our proposed damage assessment method identified most damaged buildings through a detailed analysis on the polarimetric characteristics for different types of targets, and we propose several techniques to overcome the existing problems. The classification of urban and mountain areas is conducted by jointly using the threshold criterion and segmentation-based majority voting method. For damaged-building extraction, the polarimetric characteristics of the circular correlation coefficient and double-bounce scattering power after POA compensation are used for more accurate and precise damage assessment work in urban areas. In the analysis, we classified the buildings in the disaster area into four conditions by distinguishing between the undamaged and damaged buildings in parallel and oriented areas independently. For the damage assessment work, we created four building-damage assessment maps that can give a good illustration of the damage situation. The rough damage-level map using the circular correlation coefficient was also calculated for the first time for research using single-post-event data. Our proposed method shows high superiority over supervised SVM classification.
The method proposed in this paper indicates the great potential of PolSAR data for post-disaster damage assessment, even when using data with a relatively low resolution. The complex damage situation of damaged buildings existing in oriented areas is discussed for the first time, and more related research work can be conducted in the future.

Author Contributions

Y.J. conceived, designed, and performed the experiments and wrote the paper; J.T.S.S. and M.Y.C. suggested the design of the experiments and revised the paper by presenting the technical details. M.M.W. revised the paper.

Funding

This research was funded by the European Space Agency (ESA) Earth Observation Category 1 under Grant 6613; the 4th Japan Aerospace Exploration Agency (JAXA) ALOS Research Announcement under Grant 1024; the 6th JAXA ALOS Research Announcement under Grant 3170; the Japanese Government National Budget-Ministry of Education and Technology (MEXT) FY2015-2017 under Grant 2101.

Acknowledgments

The authors would like to thank JAXA for providing the ALOS/PALSAR datasets and the editors and anonymous reviewers for their constructive suggestions. Yaqi Ji acknowledges the support from China Scholarship Council.

Conflicts of Interest

The authors declare no conflict of interest. The founding sponsors had no role in the design of the study; in the collection, analyses, or interpretation of data; in the writing of the manuscript; or in the decision to publish the results.

References

  1. Brunner, D.; Lemoine, G.; Bruzzone, L. Earthquake Damage Assessment of Buildings Using VHR Optical and SAR Imagery. IEEE Trans. Geosci. Remote Sens. 2010, 48, 2403–2420. [Google Scholar] [CrossRef] [Green Version]
  2. Matsuoka, M.; Yamazaki, F. Use of satellite SAR intensity imagery for detecting building areas damaged due to earthquakes. Earthq. Spectra 2004, 20, 975–994. [Google Scholar] [CrossRef]
  3. Matsuoka, M.; Yamazaki, F. Building damage mapping of the 2003 Bam, Iran, earthquake using Envisat/ASAR intensity imagery. Earthq. Spectra 2005, 21, 285–294. [Google Scholar] [CrossRef]
  4. Matsuoka, M.; Koshimura, S.; Nojima, N. Estimation of building damage ratio due to earthquakes and tsunamis using satellite SAR imagery. In Proceedings of the 2010 IEEE International Geoscience and Remote Sensing Symposium (IGARSS), Honolulu, HI, USA, 25–30 July 2010; pp. 3347–3349. [Google Scholar]
  5. Lee, J.S.; Pottier, E. Polarimetric Radar Imaging: From Basics to Applications; CRC Press: Boca, FL, USA, 2009. [Google Scholar]
  6. Yamaguchi, Y. Disaster monitoring by fully polarimetric SAR data acquired with ALOS-PALSAR. Proc. IEEE 2012, 100, 2851–2860. [Google Scholar] [CrossRef]
  7. Park, S.E.; Yamaguchi, Y.; Kim, D.J. Polarimetric SAR remote sensing of the 2011 Tohoku earthquake using ALOS/PALSAR. Remote Sens. Environ. 2013, 132, 212–220. [Google Scholar] [CrossRef]
  8. Singh, G.; Yamaguchi, Y.; Boerner, W.M.; Park, S.E. Monitoring of the March 11, 2011, off-Tohoku 9.0 earthquake with super-tsunami disaster by implementing fully polarimetric high-resolution POLSAR techniques. Proc. IEEE 2013, 101, 831–846. [Google Scholar] [CrossRef]
  9. Chen, S.W.; Sato, M. Tsunami damage investigation of built-up areas using multitemporal spaceborne full polarimetric SAR images. IEEE Trans. Geosci. Remote Sens. 2013, 51, 1985–1997. [Google Scholar] [CrossRef]
  10. Chen, S.W.; Wang, X.S.; Sato, M. Urban Damage Level Mapping Based on Scattering Mechanism Investigation Using Fully Polarimetric SAR Data for the 3.11 East Japan Earthquake. IEEE Trans. Geosci. Remote Sens. 2016, 54, 6919–6929. [Google Scholar] [CrossRef]
  11. Zhai, W.; Huang, C. Fast building damage mapping using a single post-earthquake PolSAR image: A case study of the 2010 Yushu earthquake. Earth Planets Space 2016, 68, 86. [Google Scholar] [CrossRef]
  12. Li, X.; Guo, H.; Zhang, L.; Chen, X.; Liang, L. A new approach to collapsed building extraction using RADARSAT-2 polarimetric SAR imagery. IEEE Geosci. Remote Sens. Lett. 2012, 9, 677–681. [Google Scholar]
  13. Zhao, L.; Yang, J.; Li, P.; Zhang, L.; Shi, L.; Lang, F. Damage assessment in urban areas using post-earthquake airborne PolSAR imagery. Int. J. Remote Sens. 2013, 34, 8952–8966. [Google Scholar] [CrossRef]
  14. Zhai, W.; Shen, H.; Huang, C.; Pei, W. Building earthquake damage information extraction from a single post-earthquake PolSAR image. Remote Sens. 2016, 8, 171. [Google Scholar] [CrossRef]
  15. Ainsworth, T.; Schuler, D.; Lee, J.S. Polarimetric SAR characterization of man-made structures in urban areas using normalized circular-pol correlation coefficients. Remote Sens. Environ. 2008, 112, 2876–2885. [Google Scholar] [CrossRef]
  16. Shi, L.; Sun, W.; Yang, J.; Li, P.; Lu, L. Building collapse assessment by the use of postearthquake Chinese VHR airborne SAR. IEEE Geosci. Remote Sens. Lett. 2015, 12, 2021–2025. [Google Scholar] [CrossRef]
  17. Sun, W.; Shi, L.; Yang, J.; Li, P. Building collapse assessment in urban areas using texture information from postevent SAR data. IEEE J. Sel. Top. Appl. Earth Obs. Remote Sens. 2016, 9, 3792–3808. [Google Scholar] [CrossRef]
  18. Ji, Y.Q.; Sri Sumantyo, J.T.; Chua, M.Y.; Waqar, M.M. Single Post-event PolSAR Data Based Earthquake/Tsunami Damage Information Extraction in Urban Areas. In Proceedings of the Progress in Electromagnetics Research Symposium (PIERS), Toyama, Japan, 1–4 August 2018. to be published. [Google Scholar]
  19. Japan Aerospace Exploration Agency. Available online: http://global.jaxa.jp/ (accessed on 7 July 2018).
  20. Shimada, M.; Watanabe, M.; Takahashi, M.; Motooka, T.; Ohki, M.; Yamanokuchi, T.; Miyagi, Y.; Kawano, N.; Shiraishi, T.; Thapa, R. Monitoring the Great East Japan Earthquake Using ALOS. IEEE GRSS Newsl. 2011, 12, 19–24. [Google Scholar]
  21. Shimada, M.; Tadono, T.; Rosenqvist, A. Advanced Land Observing Satellite (ALOS) and monitoring global environmental change. Proc. IEEE 2010, 98, 780–799. [Google Scholar] [CrossRef]
  22. Building Damage Map for Tohoku Earthquake/Tsunami. Available online: http://www.tsunami.civil.tohoku.ac.jp/tohoku2011/mapping_damage.html (accessed on 7 July 2018).
  23. Ji, Y.; Sumantyo Sri, J.T.; Chua, M.Y.; Waqar, M.M. Earthquake/Tsunami Damage Level Mapping of Urban Areas Using Full Polarimetric SAR Data. IEEE J. Sel. Top. Appl. Earth Obs. Remote Sens. 2018. [Google Scholar] [CrossRef]
  24. Lee, J.S.; Schuler, D.L.; Ainsworth, T.L. Polarimetric SAR data compensation for terrain azimuth slope variation. IEEE Trans. Geosci. Remote Sens. 2000, 38, 2153–2163. [Google Scholar]
  25. Yamaguchi, Y.; Moriyama, T.; Ishido, M.; Yamada, H. Four-component scattering model for polarimetric SAR image decomposition. IEEE Trans. Geosci. Remote Sens. 2005, 43, 1699–1706. [Google Scholar] [CrossRef]
  26. Yamaguchi, Y.; Sato, A.; Boerner, W.M.; Sato, R.; Yamada, H. Four-component scattering power decomposition with rotation of coherency matrix. IEEE Trans. Geosci. Remote Sens. 2011, 49, 2251–2258. [Google Scholar] [CrossRef]
  27. Singh, G.; Yamaguchi, Y.; Park, S.E. General four-component scattering power decomposition with unitary transformation of coherency matrix. IEEE Trans. Geosci. Remote Sens. 2013, 51, 3014–3022. [Google Scholar] [CrossRef]
  28. Cloude, S.R.; Pottier, E. A review of target decomposition theorems in radar polarimetry. IEEE Trans. Geosci. Remote Sens. 1996, 34, 498–518. [Google Scholar] [CrossRef]
  29. Xiao, S.P.; Chen, S.W.; Chang, Y.L.; Li, Y.Z.; Sato, M. Polarimetric Coherence Optimization and Its Application for Manmade Target Extraction in PolSAR Data. IEICE Trans. Electron. 2014, 97, 566–574. [Google Scholar] [CrossRef]
  30. Feng, J.; Cao, Z.; Pi, Y. Polarimetric contextual classification of PolSAR images using sparse representation and superpixels. Remote Sens. 2014, 6, 7158–7181. [Google Scholar] [CrossRef]
  31. Tarabalka, Y.; Benediktsson, J.A.; Chanussot, J. Spectral–spatial classification of hyperspectral imagery based on partitional clustering techniques. IEEE Trans. Geosci. Remote Sens. 2009, 47, 2973–2987. [Google Scholar] [CrossRef]
  32. Baatz, M. Multiresolution segmentation: An optimization approach for high quality multi-scale image segmentation. In Angewandte Geographische Informations Verarbeitung XII; Wichmann Verlag: Karlsruhe, Germany, 2000; pp. 12–23. [Google Scholar]
  33. Kimura, K.; Yamaguchi, Y.; Moriyama, T.; Yamada, H. Circular polarization correlation coefficient for detection of non-natural targets aligned not parallel to SAR flight path in the X-band POLSAR image analysis. IEICE Trans. Electr. 2004, 87, 3050–3056. [Google Scholar]
Figure 1. Location of Tohoku earthquake. The blue rectangle shows the Advanced Land Observing Satellite (ALOS)/Phased Array type L-band Synthetic Aperture Radar (PALSAR) footprint; area in yellow rectangle is the chosen study area.
Remotesensing 10 01088 g001
Figure 2. Pre-processed post-event PauliRGB image. The area in red rectangle is the seriously damaged region in Ishinomaki City, Miyagi prefecture as a result of the earthquake/tsunami event.
Remotesensing 10 01088 g002
Figure 3. Reference maps for Ishinomaki City. (a) Ground-truth building-damage map [22]; (b) reference map for damage degree derived from (a) [23] ©[2018] IEEE. Reprinted, with permission, from [Ji, Y.; Sumantyo Sri, J.T.; Chua, M.Y.; Waqar, M.M. Earthquake/Tsunami Damage Level Mapping of Urban Areas Using Full Polarimetric SAR Data. IEEE J. Sel. Top. Appl. Earth Obs. Remote Sens. 2018, doi:10.1109/JSTARS.2018.2822825.]
Remotesensing 10 01088 g003aRemotesensing 10 01088 g003b
Figure 4. Flowchart for the proposed damage information extraction method.
Remotesensing 10 01088 g004
Figure 5. Preliminary classification result by support vector machine (SVM) classifier.
Remotesensing 10 01088 g005
Figure 6. Value distributions of polarimetric features. (a) Maximized coherence magnitude | γ ( HH VV ) ( HV ) | max ; (b) λ from Cloude-Pottier decomposition.
Remotesensing 10 01088 g006
Figure 7. (a) Segmentation result by multi-resolution segmentation method; (b) schematic diagram for majority voting method.
Remotesensing 10 01088 g007
Figure 8. Region-based classification result.
Remotesensing 10 01088 g008
Figure 9. (a) Ground truth for urban areas in Ishinomaki City; (b) urban areas extracted from preliminary classification result; (c) urban areas extracted from region-based classification result.
Remotesensing 10 01088 g009
Figure 10. Distribution maps of two damaged-building identification features in different urban areas. (a) Distribution of circular correlation coefficient value for the whole urban area; (b) distribution of circular correlation coefficient value for parallel area; (c) distribution of circular correlation coefficient value for oriented area; (d) distribution of double-bounce scattering power value for oriented area.
Remotesensing 10 01088 g010
Figure 11. Orientation-angle distribution in the studied urban areas.
Remotesensing 10 01088 g011
Figure 12. Polarimetric characteristics analysis for the tested pixels. (a) Location of the selected pixels; (b) distribution of real and imaginary part of circular correlation coefficient; (c) distribution of modulus and phase value of circular correlation coefficient; (d) value distribution of double-bounce scattering power.
Remotesensing 10 01088 g012
Figure 13. Damaged-building extraction results for the entire study area.
Remotesensing 10 01088 g013
Figure 14. Extracted damage information. (a) Block-scale damage-level assessment using the proposed technique; (b) block-scale damage-degree assessment using the proposed technique; (c) error-block distribution map; (d) damage assessment using I ρ RRLL index.
Remotesensing 10 01088 g014
Figure 15. (a) The ground-truth building-damage map for the town of Onagawa; (b) the extracted damaged buildings for the town of Onagawa; (c) the ground-truth building-damage map for the river area in Ishinomaki City; (d) the extracted damaged buildings for the river area in Ishinomaki City.
Remotesensing 10 01088 g015
Figure 16. Damage assessment using supervised support vector machine (SVM) classification method. (a) Classification result; (b) extracted damaged buildings for Ishinomaki City; (c) block-scale damage-degree assessment; (d) error-block distribution map.
Remotesensing 10 01088 g016aRemotesensing 10 01088 g016b
Table 1. Comparison of damage assessment accuracy of our proposed method to that of the supervised support vector machine (SVM) technique.
Supervised SVMProposed Method
SEDMODSLDNODSEDMODSLDNOD
(Number of Blocks Matched to Ground-Truth Damage Degree)
SED730010000
Damage degreeMOD05000401
(ground truth)SLD13482149
NOD1254111245
C/T7/105/54/1641/4910/104/54/1645/49
Accuracy73.72%100%23.05%96.6%100%87.67%27.57%98.74%
Overall accuracy: 88.81%Overall accuracy: 92.28%
C represents the number of correct blocks. T represents the total number of blocks according to ground truth.