Article

Satellite Remote Sensing Analysis of the Qasrawet Archaeological Site in North Sinai

by
Christopher Stewart
1,*,
Eliezer D. Oren
2 and
Eli Cohen-Sasson
2
1
Earth Observation Programmes, Future Systems Department, European Space Agency, 00044 Frascati, Italy
2
Archaeological Division, Ben-Gurion University of the Negev, Beer Sheva 84105, Israel
*
Author to whom correspondence should be addressed.
Remote Sens. 2018, 10(7), 1090; https://doi.org/10.3390/rs10071090
Submission received: 28 May 2018 / Revised: 28 June 2018 / Accepted: 5 July 2018 / Published: 9 July 2018
(This article belongs to the Special Issue Advances in Remote Sensing for Archaeological Heritage)

Abstract

:
North Sinai is of significant historical interest primarily because of its role since late prehistoric times as a land bridge between Egypt and the Levant. Access to this region is challenging due to its harsh geography and security concerns. Remote sensing constitutes a convenient method for archaeological prospection and monitoring over such regions with its low cost (relative to ground based sensing techniques), global coverage, and high temporal and spatial sampling. This paper describes part of a study to revisit a number of sites investigated during the North Sinai Survey (1972–1982) with very high resolution optical and Synthetic Aperture Radar satellite imagery. These were acquired throughout the summer of 2017 in the framework of a European Space Agency research project. The Synthetic Aperture Radar data includes Spotlight and Staring Spotlight modes of the TerraSAR-X mission, while the optical imagery was acquired by the Pleiades mission. The TerraSAR-X data were processed to derive filtered amplitude and consecutive coherence time series. The results of the TerraSAR-X data processing, and the pan-sharpened Pleiades data were compared with the results of the North Sinai Survey to detect possible additional buried structures in the radar data, or newly excavated sites in the optical data. While the analysis is still ongoing, results are reported here of the Qasrawet archaeological site, which was partially investigated by the North Sinai Survey expedition, but assumed to cover a much larger area. Herein, a number of newly excavated structures are apparent in the remote sensing data. The similarity of features in both the TerraSAR-X and Pleiades data suggest that all structures are surface residues, and therefore, that the subsurface mapping capabilities of the TerraSAR-X data in this area are limited. The utility of both data types for archaeological site monitoring are discussed.

Graphical Abstract

1. Introduction

1.1. Background

As an essential artery of communication between Egypt and Asia, the North Sinai Desert has been witness to millennia of human activity [1]. The importance of the region since prehistoric periods is testified by an enormous quantity of source material, such as archaeological evidence, military annals, historical and geographical texts, ancient maps, and others [1,2,3]. Despite the historical significance of the region, archaeological exploration in the area is very challenging. This is due primarily to the treacherous sand-dunned terrain and hazardous mobility, the large extent of the area, the lack of infrastructure, and the frequent security threats [4,5]. As a result, only few and limited archaeological explorations have so far taken place in this region. The North Sinai Survey (NSS) is the first large scale archaeological enterprise combining systematic surface survey and selective excavations. This was carried out under the direction of E. D. Oren on behalf of the Ben-Gurion University of the Negev (BGU) between 1972 and 1982. It covered an area of approximately 2000 km2 along the coastal plain between the Suez Canal and Rafah. Around 1300 settlement sites were recorded during the survey. These range in date from the Middle Palaeolithic to the Mediaeval period [1].
The opportunities for such large scale surveys are few and far between, but regular monitoring is necessary to detect potential threats, such as destruction or looting, to existing and new archaeological sites. This paper presents the results of a satellite remote sensing analysis of a major Nabatean town site, Qasrawet, which was investigated in 1975–76 by the NSS expedition. The impressive site of Qasrawet was only partially excavated, but evidently, it extended over a much larger area [6]. Needless to say, Qasrawet presents an ideal case study of a major archaeological site—at present inaccessible—with massively built public and domestic architecture which has been excavated some 45 years ago and reburied, in part intentionally, as well as by shifting sand dunes. The intention was to use satellite Synthetic Aperture Radar (SAR) to detect possible new structures buried beneath the sand around the existing excavated structures, and to use satellite multispectral imagery to detect any changes to the site, such as further excavation or looting attempts.

1.2. Remote Sensing in Archaeology

The use of remote sensing to obtain a synoptic view, frequently, and at low cost, of often inaccessible areas, has been applied to archaeological prospection and monitoring since the early days of aviation [7,8]. Today, a vast array of active and passive remote sensing techniques are available to archaeologists. These can be operated from low altitude Unmanned Aerial Vehicles (UAVs), from high altitude aerial platforms, or from satellites orbiting the Earth. Since the launch in 1999 of IKONOS, the first civilian spaceborne Very High Resolution (VHR) multispectral sensor, archaeologists have access to relatively low cost VHR optical data over areas where airborne campaigns may be difficult or expensive to organize. Today many similar VHR multispectral spaceborne missions are currently in orbit, such as WorldView-1 to 4, GeoEye-1, and Pleiades-1A and 1B. These greatly increase the frequency of acquisition potential for archaeological site monitoring, to detect any possible environmental degradation, or to identify cases of destruction or looting.
The utility of SAR remote sensing to detect the subsurface in sand covered areas has long been known [9,10]. It received particular interest since the Shuttle Imaging Radar (SIR-A) observations of ancient palaeochannels in the Sahara in November 1981 [11]. The subsurface imaging potential of SAR has been exploited for archaeological prospection in multiple desert environments in Africa [12,13], Asia [14], North and South America [15,16]. The interaction of the microwave signal emitted by SAR systems with the sand medium, including penetration depth, depends on properties of both the SAR sensor and the sand medium itself [17,18,19]. Studies have reported subsurface imaging depths for spaceborne SARs in sand volumes to several meters [11,20,21]. Given that further penetration in a sand medium with low relative permittivity can be achieved with SAR instruments operating at longer microwave wavelengths [17], applications of spaceborne SAR for archaeological prospection under sand have therefore tended to focus on long wavelength (L-band) systems. In particular, the ALOS-1,2 PALSAR-1,2 L-band SAR sensors have been successfully applied for archaeological prospection [12,13,22]. Spatial resolution is another key consideration in the detection of small buried structures. This is especially important due to the phenomena of image speckle, which can make interpretation challenging [23]. Given that there is a greater choice of VHR sensors operating at shorter wavelengths, some attempts have been made to use short wave (X-band) spaceborne SAR for archaeological prospection in desert regions. Chen and his team for example used X-band COSMO-SkyMed data to detect archaeological structures in desert landscapes in Libya [24]. However, prospection was less through surface penetration, but more through exploitation of the SAR sensitivity to subtle surface roughness variations caused by traces of archaeological structures. Link and his team, on the other hand, reported a successful attempt at using X-band TerraSAR-X data for subsurface penetration applied to archaeological prospection of a Roman archaeological site, Qreiye, in Syria [14].

1.3. Purpose of the Study
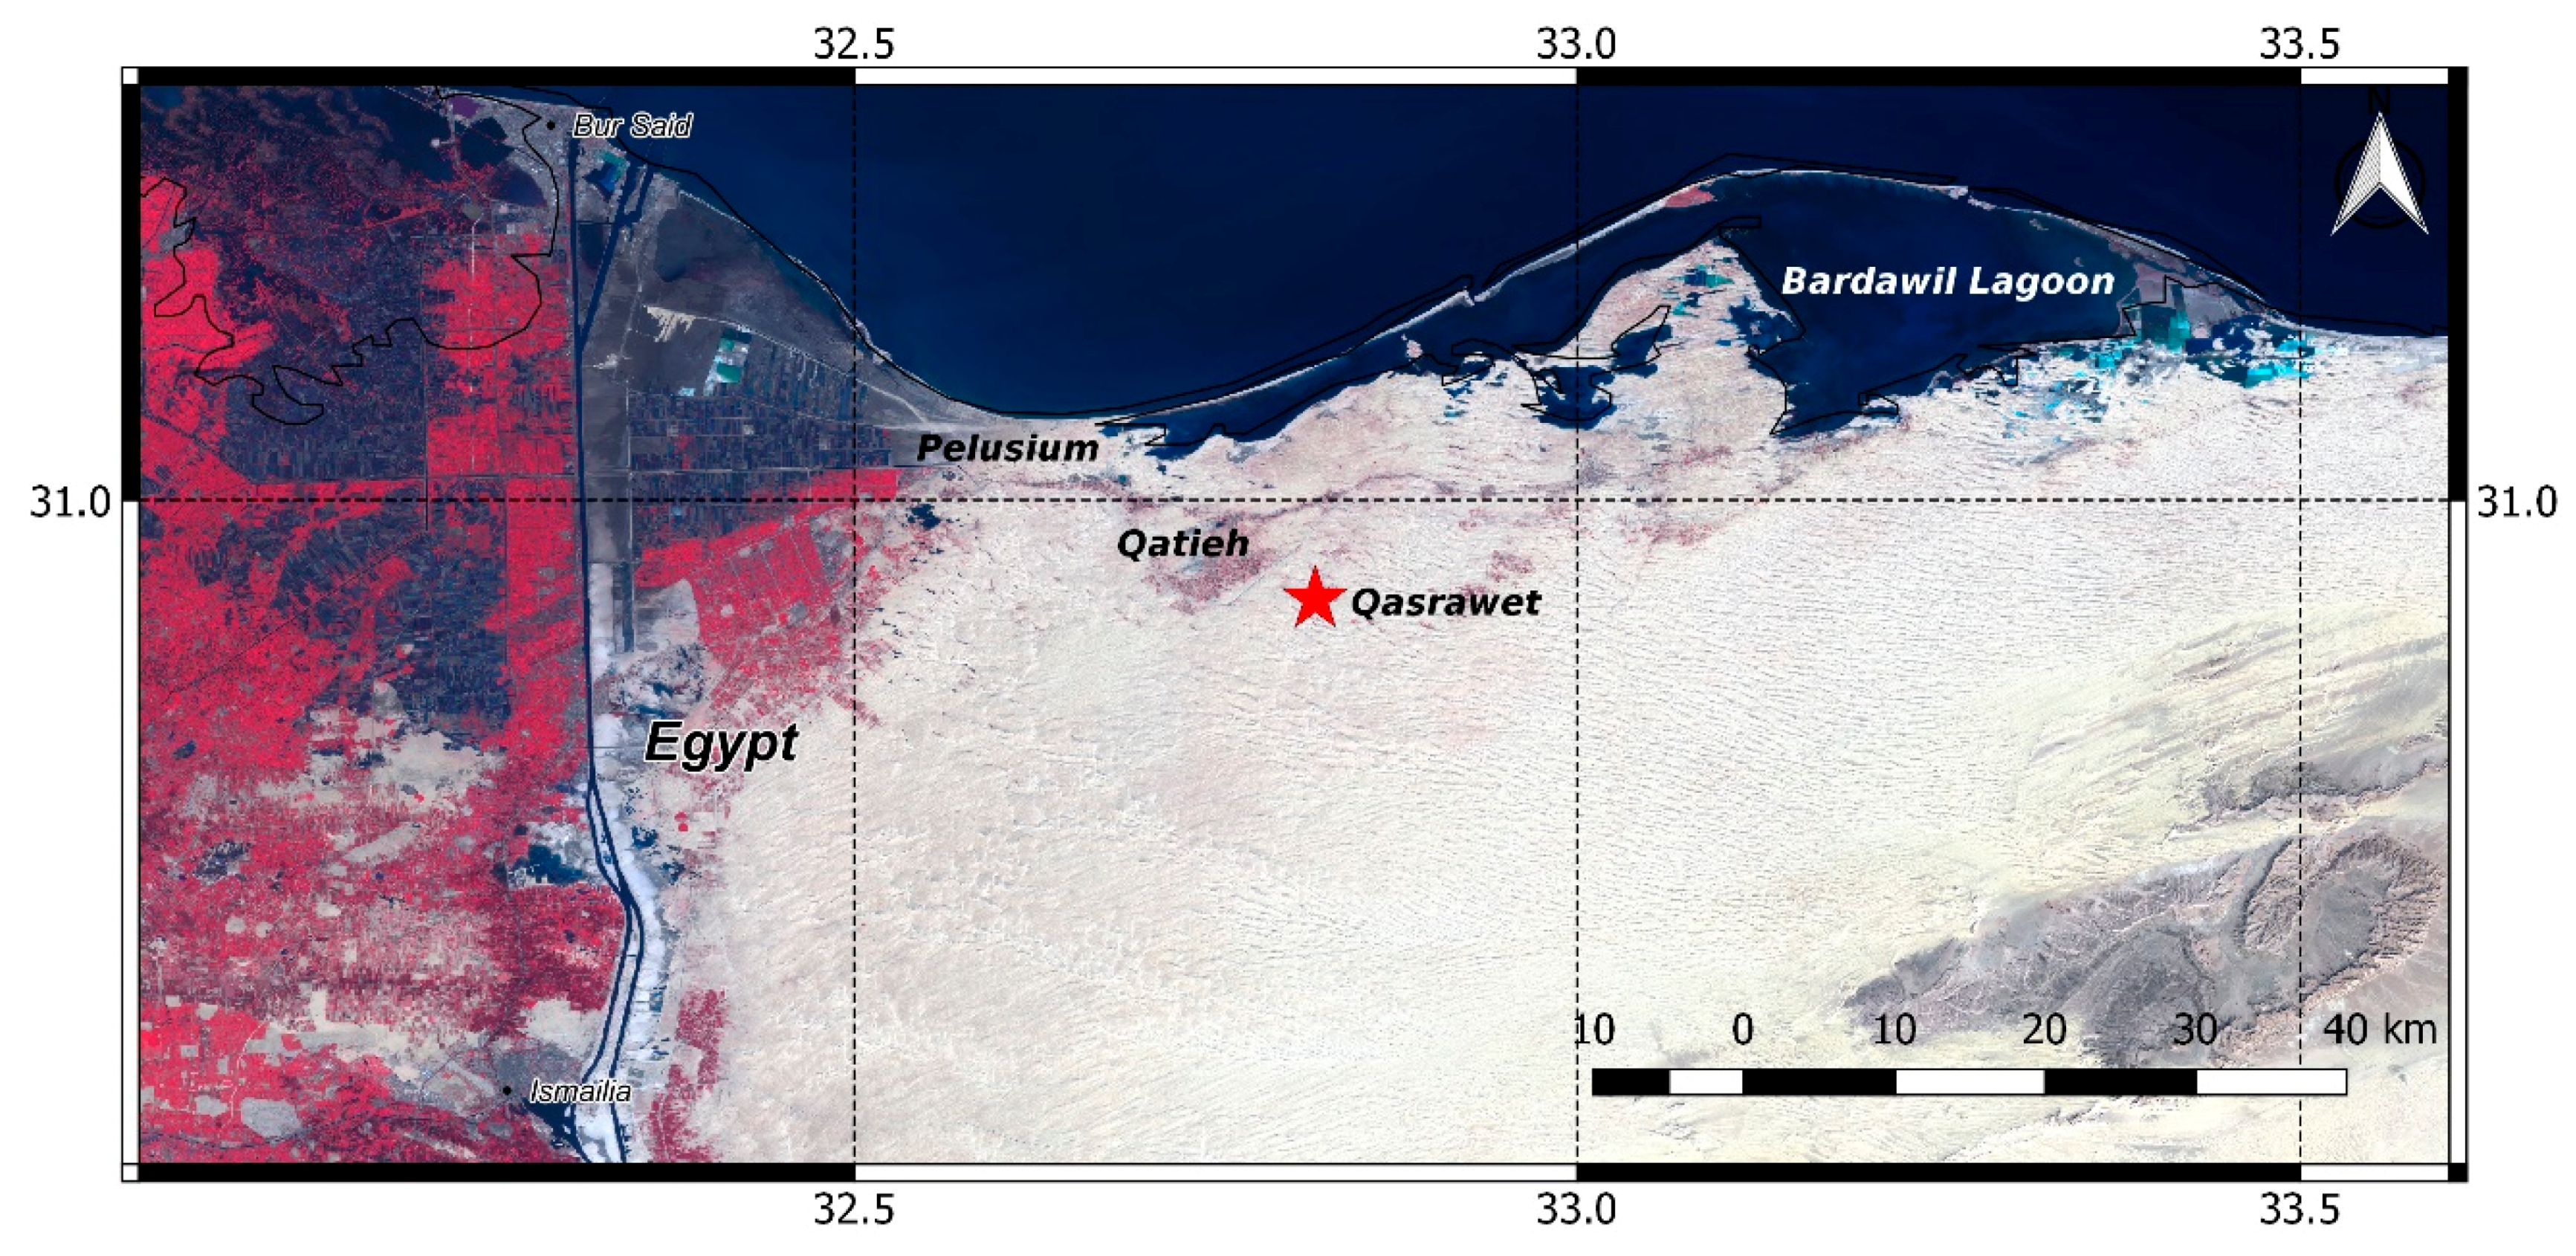
The purpose of the study reported here is to exploit some of the highest available SAR and optical satellite remote sensing data to survey archaeological areas in the currently inaccessible North Sinai Desert. The objective is to use SAR data to detect possible new buried structures within known archaeological sites, and to use optical data to detect any changes to these sites, such as destruction, looting, or further excavation. The SAR data analysis was carried out with TerraSAR-X data (from here on referred to as TSX) acquired in Spotlight and Staring Spotlight modes, while the optical data analysis was carried out with Pleiades data. The data processing has been undertaken by Dr. Chris Stewart, a remote sensing specialist from the Tor Vergata University of Rome. The analysis and interpretation has been performed by Prof. Eliezer D. Oren and Dr. Eli Cohen-Sasson, both from the BenGurion University of the Negev. Prof. Eliezer D. Oren was the director of the NSS expedition. This paper reports only on the results of Qasrawet, over which TSX data were acquired in Spotlight mode. Analysis of another site using TSX data acquired in Staring Spotlight mode is still ongoing.

1.4. Study Area

The town site of Qasrawet is located in north-western Sinai, nearby the large oasis of Qatieh, 18 km south of the Bardawil Lagoon and Mediterranean coast, and about 25 km southeast of the metropolis of Pelusium (see Figure 1). The inhospitable terrain of this region (on the margins of the inner sand-dunned zone of North Sinai) is characterized by high, longitudinal, or Seif mobile sand dunes rising up to 20 m above their surroundings and making mobility very difficult. Like other ancient settlements in North Sinai, Qasrawet is situated in a shallow depression of an inter-dune area, about 19 m above sea level. The ancient remains of Qasrawet were discovered by J. Cledat in 1909 and investigated briefly in 1911 [25]. During the 1975–76 NSS expedition, under the direction of E.D. Oren on behalf of the BGU, the region was explored systematically and the impressive remains of the central site (D50) and six satellite settlements on the east (D51–56) were unearthed [6]. The central Nabatean town is estimated to have extended over an area of ca. 75 acres, including a temenos with exceptionally well preserved and elaborately decorated stone built temples and auxiliary buildings (see Figure 2 and Figure 3). The main temple was fronted by a spacious plaza with two colonnades, which probably carried statues or cult symbols, and the compound was terminated with a pavilion or kiosk with heart-shaped corner columns. To the south of the temenos an extensive cemetery was investigated, with many cist tombs as well as elaborate family tombs. In the late Roman period a large garrison or castrum, surrounded by a massive defensive wall with towers at short intervals, was established directly over what appeared to have been the domestic sector of Nabatean Qasrawet. This fortified settlement was densely occupied with mud-brick constructed houses, which were often preserved up to roof level, and clustered on narrow allies (Figure 4). Excavations by the BGU expedition at site D52 encountered the remains of a sizable Roman era settlement including a few well-constructed domestic buildings (Figure 5), a small Nabatean shrine, and an extensive cemetery. The stratified data from the above settlements coupled with evidence from surface explorations of sites D53–56 indicated that the Qasrawet site complex was established in the second half of the 2nd century BCE and continued until the end of the 4th century AD. Evidently, during the Roman period Qasrawet served as a major commercial and cult center on the Nabatean trade network between Petra and the Mediterranean port of Pelusium and the Egyptian Delta [6].

2. Materials and Methods

2.1. SAR and Optical Data

The TSX and Pleiades data were obtained from the European Space Agency (ESA) through two “Category-1” research projects: one for the TSX new acquisitions (project ID 37046), the other for the Pleiades archive data (project ID 11458).
The new acquisitions of TSX data were requested in May 2017 to be acquired during the summer of 2017, when precipitation is usually at a minimum in North Sinai [26]. Table 1 shows the characteristics of the TSX data. Eight images were acquired over Qasrawet from June to August, each as close as possible in time to the previous acquisition. The time series was needed to reduce the image speckle, while preserving the spatial resolution, by speckle filtering in the temporal domain. The time series also helped to identify and discard temporary features.
The Pleiades image over Qasrawet is an archive acquisition, selected from the Airbus Geostore catalogue. This particular image was selected as it was acquired as close as possible to the date of the TSX acquisitions. Table 2 shows the characteristics of the Pleiades data.

2.2. SAR Data Processing

While the Pleiades data was ordered in a format which required no processing by the authors prior to analysis (see Table 2), the TSX data required a number of processing steps, which were performed using the SARscape software, version 5.4.1. These are described in this section. This processing methodology was chosen given its success in a recent study on the use of SAR for feature extraction in North Sinai, carried out in 2016 by Stewart et al. [13]. In this study, longer wavelength radar was used (ALOS-1,2 PALSAR-1,2), but the area and sensor type are the same.
The eight TSX images were obtained in Single Look Complex (SLC) format in order to enable processing and analysis of both the phase and amplitude of the SAR data. After importing the data into SARscape, the first step in the amplitude processing chain included coregistration of all images. Multilooking was then applied, by a factor of 1 × 1, and detected images created of SAR backscatter amplitude. Following this, multitemporal speckle filtering was used to filter out the image speckle in the temporal domain, thus preserving spatial resolution, and enhancing the ability to distinguish small scale features in the imagery. This was done using the De Grandi filter [27]. The filtered images were then calibrated to σ0, in both linear and logarithmic (decibel) scale. All images were geocoded to the Geographic Latitude/Longitude map system, with the World Geodetic System 1984 (WGS 84) datum, and pixel spacing of 1 m. The selected pixel spacing corresponded closely to the original spatial resolution of the data in slant range, which was around 1.2 m. Finally, time series calculations were performed on the filtered imagery in linear scale to derive the following parameters of the backscatter over time: minimum, maximum, mean, gradient (maximum absolute variation between consecutive acquisition dates), standard deviation, coefficient of variation, and mean over standard deviation ratio.
The phase processing included more precise coregistration, followed by calculation of the coherence between consecutive image acquisitions. The coherence was calculated over a window size of 5 × 5 pixels. These were then geocoded to the same map system and pixel spacing as for the amplitude data. The same time series analysis calculations as carried out for the filtered amplitude images were performed on the resulting 7 geocoded coherence images.
All SAR and optical images were placed into a GIS (QGIS version 2.18) for analysis and comparison with survey data from the NSS.

3. Results

Analysis of the remote sensing imagery, and comparison with the NSS data, shows evidence of certain structures not previously recorded during the NSS. These are very clearly evident in all imagery. Given that they are also in the optical imagery, these are likely to be surface traces of new excavations carried out since the survey took place. While these are more immediately evident in the SAR data, the optical data shows the new structures in better detail (50 cm spatial resolution), enabling clearer interpretation of features.

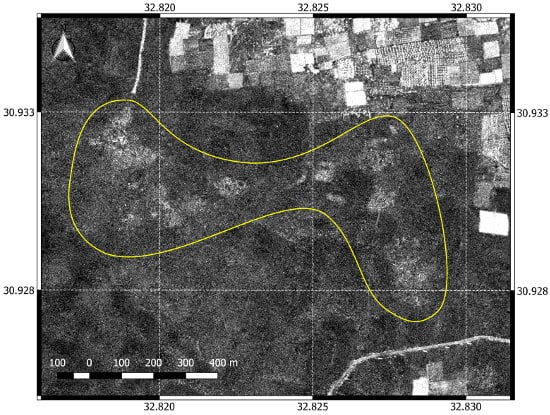
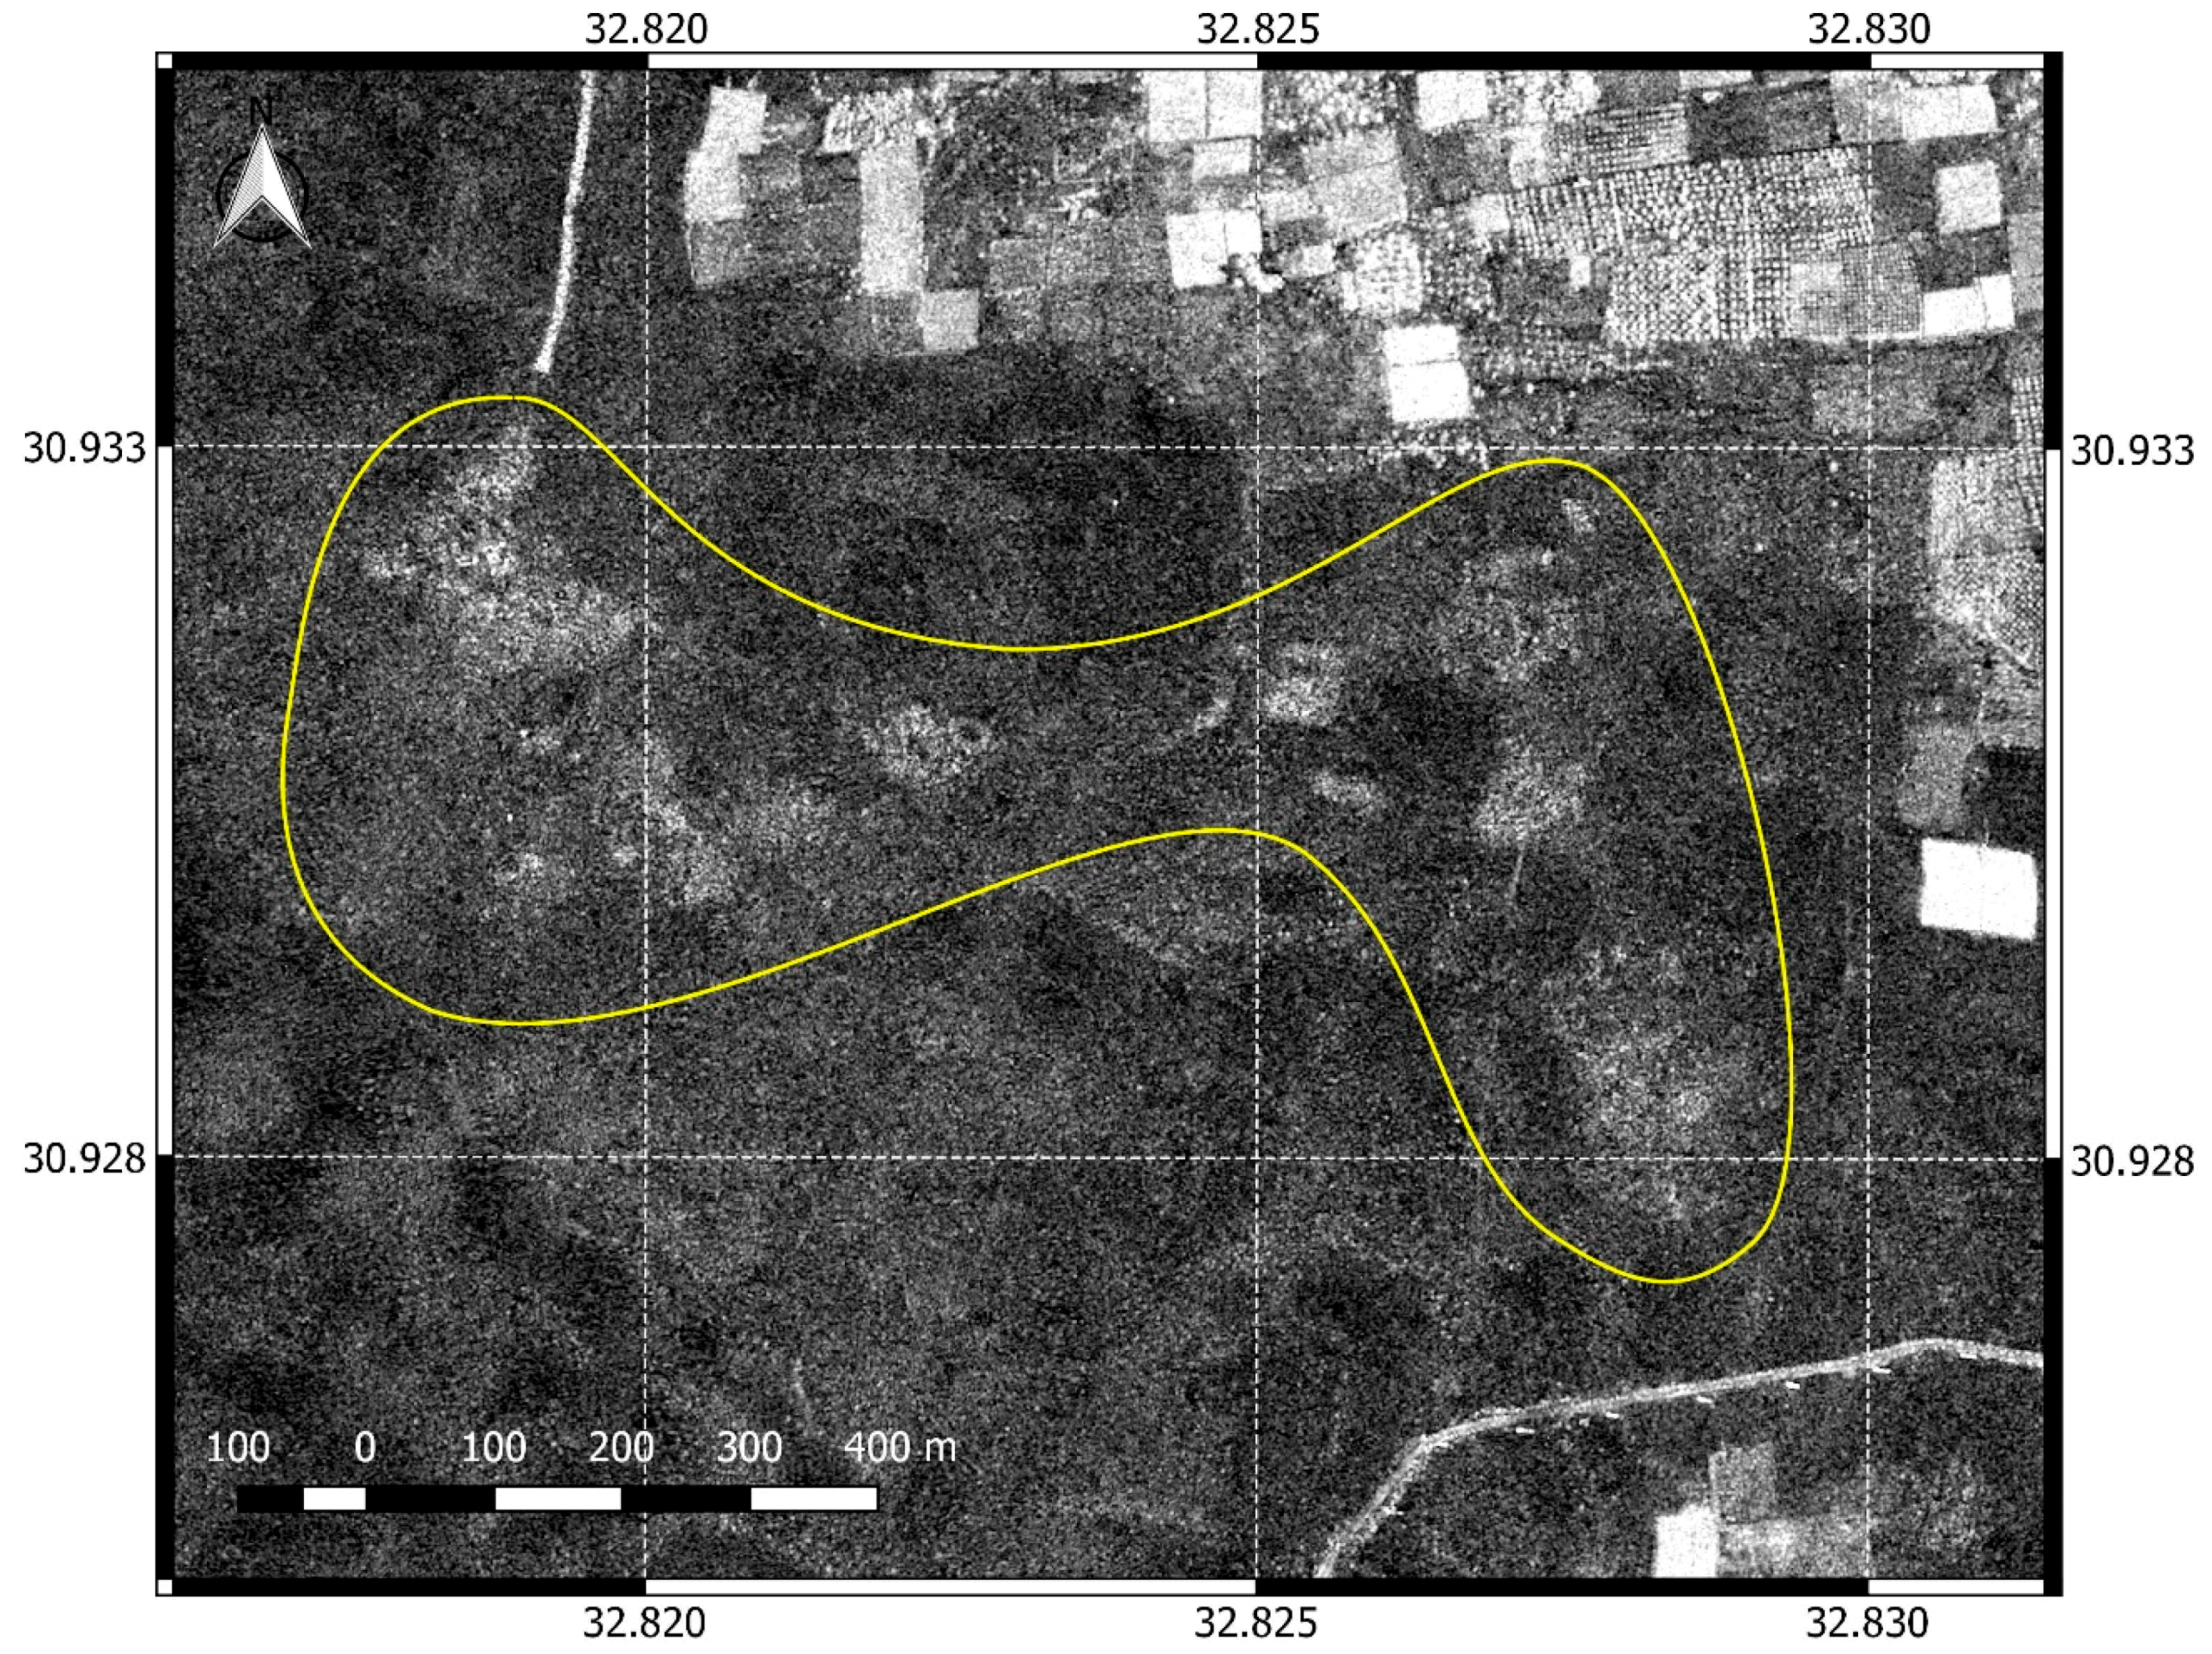
3.1. Results of SAR Data Processing and Interpretation

While the backscatter over the vegetated fields differs in the De Grandi speckle filtered TSX data, the sand covered areas are largely identical in all 8 images of the time series. Figure 6 shows the De Grandi multitemporal speckle filtered TSX image acquired on 9 June 2017. The yellow ellipse encloses a number of anomaly features which appear to be an extension of the Qasrawet archaeological structures, investigated during the NSS. These are revealed as patches of higher backscatter than surrounding areas. Of all the multitemporal techniques applied to the filtered imagery, the mean, standard deviation, and coefficient of variation produced the best results in terms of clarity of features in the sand covered areas. However, they did not produce better results than the individual De Grandi multitemporal filtered imagery.
Figure 7 shows the mean of all coherence images calculated between consecutively acquired TSX images. The same anomaly features identified in the TSX filtered σ0 images can be seen even more clearly in this mean coherence image, albeit without fine details. The anomaly features are evident as patches of higher coherence than surrounding areas. Of all the multitemporal techniques applied to the coherence time series, the mean coherence image produced the clearest results in terms of clarity of features in the sand covered areas.

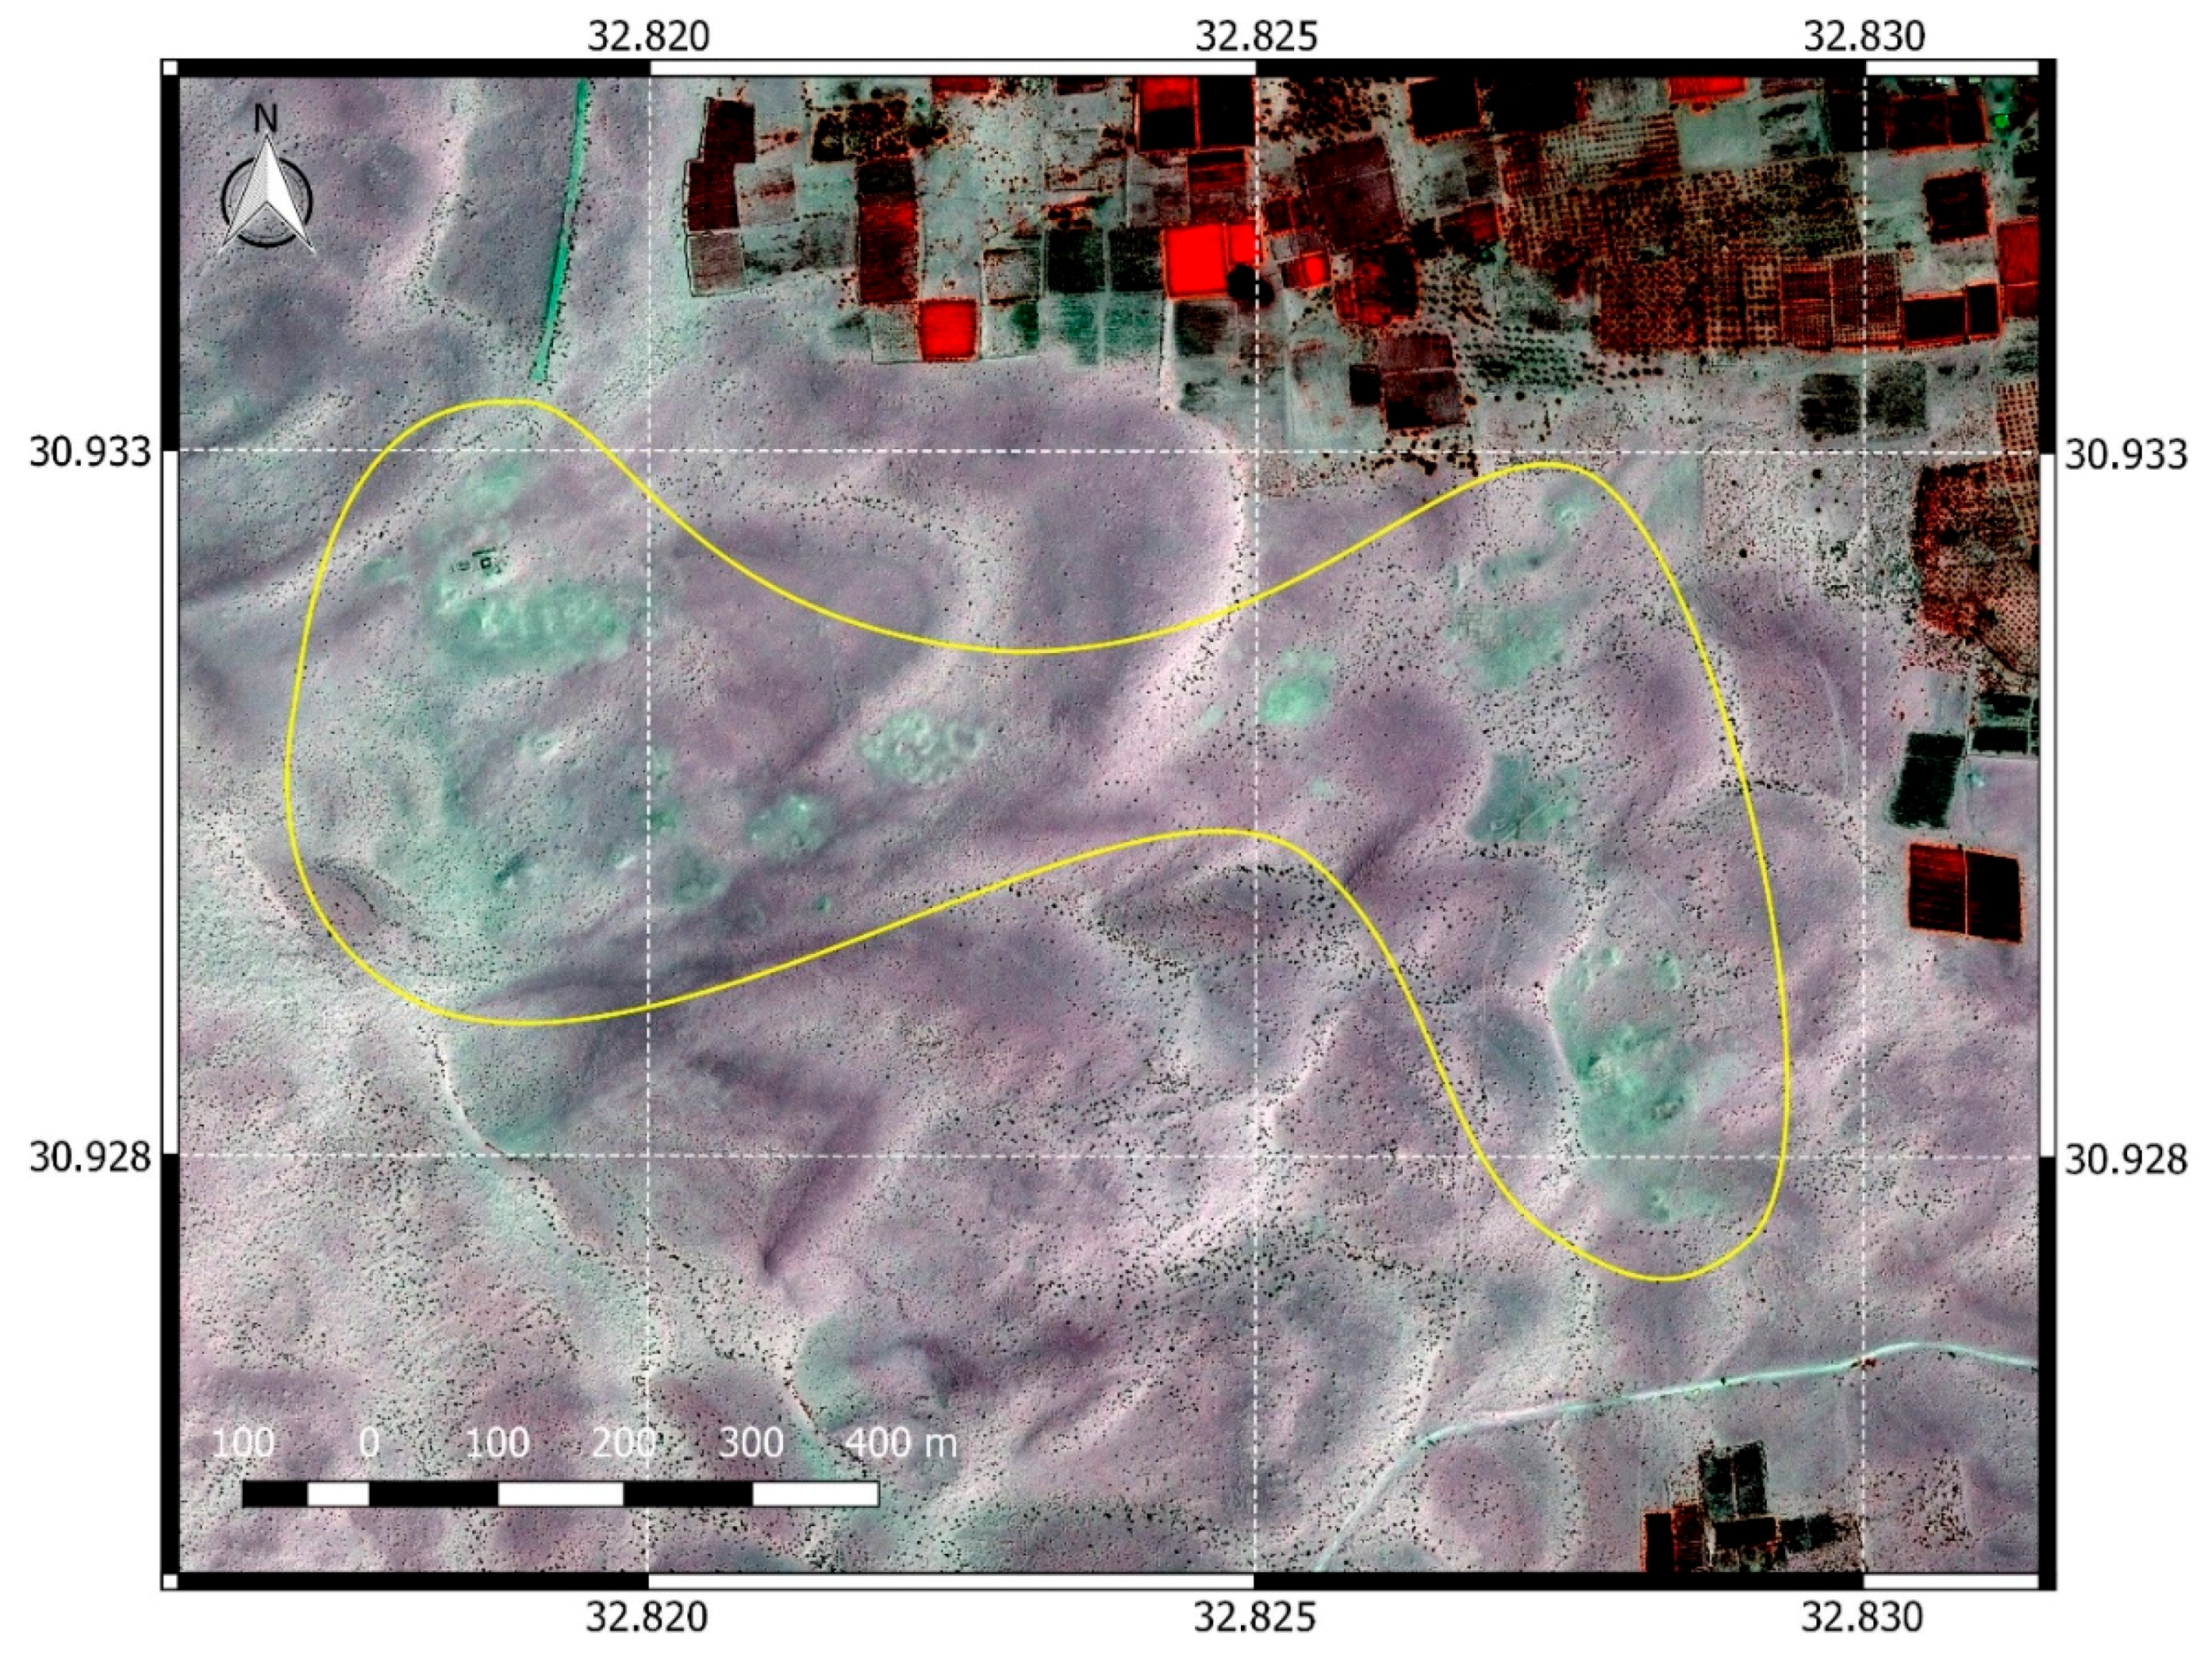
3.2. Results of Optical Image Interpretation

Figure 8 shows an enhanced near-infrared and visible color composite of the Pleiades image over Qasrawet. This band combination revealed the most contrast. In the top part of the image, vegetated fields can be seen in red (strong near-infrared reflectance). Beneath these, in the sand covered areas, the same anomaly features which are revealed in the TSX data are also evident here. These appear in green (higher red reflectance than surrounding areas) in the Pleiades color composite. They are enclosed in the yellow polygon shown in Figure 8.
Some of the features enclosed in the yellow polygon correspond closely with structures unearthed by the NSS expedition. Figure 9 shows the NSS data overlain on the Pleiades image. Only a few of the surveyed structures can be partially identified in the Pleiades image, though others are not visible at all, either as a result of subsequent burial by shifting sand, or they may be too small to be distinguished in the optical image. There are also various anomaly features in the Pleiades data which do not correspond with structures identified during the ground explorations (highlighted in yellow in Figure 9, where clustered anomalies are annotated in numbers 1 to 10).
These anomaly features have a different color to surrounding areas. Given that they correspond with backscatter and coherence anomalies in the SAR data, and given also that they are in the proximity of excavated or reburied archaeological structures, they have been interpreted as anthropological sand disturbances linked to the archaeological structures. They are likely to be areas excavated since the survey was carried out. Similar, fainter anomalies (shown in more transparent patches in Figure 9) can be seen covering larger areas surrounding the more marked anomalies. These similarly have been interpreted as anthropological sand disturbances, but to a lesser extent than in the clearer anomalies.

3.3. Observations: Analysis of Anomalies against Previous Field Research

An analysis is provided here of the anomalies, labeled from 1 to 10 in Figure 9. The anomaly features are all characterized by higher backscatter and higher coherence than surrounding areas in the TSX data, and by a higher red reflectance in the Pleiades image. These have thus been interpreted as areas of compacted sand possibly due to clearing of loose overlying sand. This would explain the higher coherence, where less volume decorrelation would be present in the more compacted sand. The patches of cleared sand are likely to be cleared by anthropogenic activities, given that they are largely in the proximity of exposed structures.
The visibility of each anomaly in the various remote sensing data, and a comparison of these with known structures identified by the NSS, are summarized in Table 3, and described in more detail in this section.
Anomaly 1
In both the Pleiades and the TSX backscatter and coherence images, a large anomaly feature is visible here, of around 3 acres in size. This has been interpreted as disturbed surface, sand dumps, and sand scatters marking the location of extensive excavation activities. The partially exposed walls of two massive structures are the only architectural features clearly discernible in the Pleiades image. Similarly, the general outline of certain excavated buildings nearby could be detected. However, no actual walls, exposed or buried, have been identified.
Excavations by the NSS expedition in 1975–6 unearthed the impressive remains of the temenos of Nabatean Qasrawet which most likely extended over as much as ca. 5–6 acres. This is evident by the discovery of contemporary domestic building remains as well as a Nabatean family tomb directly under the late Roman fortified garrison some 400 m away (see Anomaly 5, below). The temenos complex included two monumental stone-walled temples which were preserved almost entirely under the sand (Figure 2 and Figure 3), a colonnaded plaza, and various auxiliary buildings. By the end of the excavations the buildings were partly refilled with sand, leaving uppermost sections of walls exposed. A more recent (undefined) digging activity is also indicated on the Pleiades image (Figure 9).
Anomaly 2
The anomalies of disturbed sand patches are quite limited in this area and no distinctive archaeological features are visible in the TSX or Pleiades data. Excavations in 1911, and especially by the BGU expedition, explored here an extensive cemetery including a few mausoleum structures and many individual cist tombs which were not identified in the satellite imagery.
Anomaly 3
Undefined recent surface disturbance.
Anomaly 4
Disturbed surface by recent excavations with sections of undefined walls visible.
Anomaly 5
A wide area, ca. 2 acres, of markedly disturbed surface, sand dumps, and piles as well as thick cover of wind-blown sand is detected on the satellite imagery; however no distinctive architectural features whatsoever identified. Excavations by NSS expedition uncovered a fortified settlement of the late Roman period (4th century AD) surrounded by a massive wall and towers which presumably occupied some 5–7 acres. The densely built domestic structures were unusually well preserved up to roof level (Figure 4). Excavated areas were partly refilled with sand by the end of the operation, but the top walls were left exposed. It should be pointed out that in the excavated section of the castrum both top walls of the massive fortification and buildings were actually detected in 1976 directly on the surface or immediately below it. This is also manifested by the widespread occurrence of bush plants taking roots specifically in mud-brick walls. As noted above none of these features, not even the 2.5 m thick defensive wall, which was exposed in 1976 along more than 120 m, are identifiable on the TSX or Pleiades imagery.
Anomaly 6
Disturbed surface with undefined recent excavations.
Anomaly 7
Slightly disturbed surface with one or two sand dumps and subtle sand scattering. Architectural remains of a large building complex organized with spacious courtyards and various rooms are clearly visible in the Pleiades image. Surface explorations (but no excavations) in 1975 at this site (Site D53 on NSS gazetteer maps) by BGU expedition recorded much ceramic and other finds of the Late Hellenistic-Roman period (2nd century BCE–2nd century AD) but no building remains were visible at the time. Evidently, this building should be associated with a more recent excavation activity, hence its clear visibility on the Pleiades image.
Anomaly 8
A possible interpretation of this anomaly feature is that it is an undefined modern (possibly Bedouin) structure, or installation.
Anomaly 9
Disturbed surface and piled-up sand. Nearby, the NSS expedition excavated a large stone built family (mausoleum) tomb but no remains of this are visible on the TSX or Pleiades imagery.
Anomaly 10
A wide area of disturbed surface, sand dumps, and subtle windblown sand scattering represents the location of a sizable settlement. The site (D52) of the Roman period was explored by the BGU expedition. It included a few well preserved houses and tombs. The top walls of some buildings were found above the surface and these were only partially reburied following the excavation season. The mud-brick walls of at least three building units are unmistakably identifiable in the Pleiades image. Note in particular the larger Building B (Figure 5, Figure 9, Figure 10 and Figure 11). This is one of the few instances at Qasrawet whereby architectural features of an “older” excavation (1976) were not reburied by windblown sand and are clearly visible in the Pleiades image. Judging by the subtle windblown sand cover and more compacted state of sand dumps it may be deduced that at this section of Qasrawet site complex dune mobility was not as intense as, for instance, at cluster anomaly #5 (late Roman castrum).

4. Discussion

The anomalies identified in the Pleiades and TSX data have been interpreted here as areas of anthropogenic activity, including new archaeological excavations, which have taken place after the NSS was carried out in the mid 1970’s. Some of the exposed structures which were excavated at the time of the survey are also visible.
Given that the same features in the Pleiades image are visible in the TSX filtered σ0 and average coherence images, it would suggest that the anomalies in the TSX data are surface residues and not structures buried beneath the sand. It is possible that the areas of disturbed sand over the new excavations may be more compacted, with a roughness relative to the X-band (3.1 cm) radar wavelength that reflects more strongly the backscatter, leading to a higher radar return over these anomaly areas, while the loose, surrounding sand absorbs the radar backscatter, leading to a lower radar return in the filtered σ0 data.
In the average coherence image, the higher coherence over the anomaly features suggests that throughout the time of the image acquisitions, from beginning of June to end of August 2017, the areas of new excavations and disturbed sand have changed little. However, it is possible that the surrounding sand may be looser and less compact, causing volume decorrelation, and hence a lower coherence [28,29]. The apparent absorption of the SAR signal, visible in the TSX filtered σ0 data, would agree with this.
Out of the three types of data: Pleiades, TSX multitemporal filtered amplitude, and TSX average coherence, the average coherence reveals most clearly the residues, while the Pleiades data shows the finest details of the anomaly features. However, this is likely to be due to the higher spatial resolution of the Pleiades data (0.5 m pansharpened resolution of Pleiades, as opposed to 1.2 m ground range resolution of TSX).
The apparent lack of evidence of buried structures, despite the fact that these are known to exist in the area, would suggest that spaceborne X-band SAR for subsurface prospection in such areas is of limited use. This is notwithstanding successful attempts in similar desert environments, such as in Syria, over the Roman fortress of Qreiye, also using TSX data [14]. However, in the case of Qreiye, the buried structures were near the surface and the penetration depth was shallow (reported as no more than around 25 cm) [14]. The current depth of burial of the Qasrawet archaeological structures is not known. Moreover, short wavelength (X-band) SAR has much more limited capabilities for dry sand penetration than longer wavelength SAR, such as L-band [17]. Future studies could compare the results presented here with those derived from VHR L-Band SAR systems, such as ALOS-2 PALSAR-2, which has been successfully applied to prospection in desert areas, e.g., [13].
While buried structures may not have been detected in the TSX data, changes in the proximity of the known archaeological structures of Qasrawet have been identified in both the Pleiades and TSX data. In the Pleiades image, newly excavated structures have been detected. In the TSX data on the other hand, individual structures may not be visible, but the surrounding areas encompassing apparent human activity are more easily discriminated than in the Pleiades data. The combined use of VHR optical and SAR data could potentially be applied to great effect for archaeological site monitoring. The complementarity of both datasets could be exploited to better detect and interpret features: SAR amplitude data providing information on surface roughness, composition, and variations in relative permittivity; SAR coherence on spatial changes and differences in composition and compactness (through volume decorrelation); and optical data on spectral reflectance variations.
Archaeological monitoring can, and is, performed with other remote and ground based sensors. Lower altitude platforms, such as aircraft and Unmanned Aerial Vehicles (UAVs), are capable of sensing at very high spatial resolutions. However, in remote and inaccessible areas, such as the North Sinai Desert, airborne campaigns, and low altitude UAV flights are generally more challenging and costly than satellite imaging. Moreover, spaceborne imaging sensors can achieve progressively higher spatial resolutions. The civilian WorldView-3 multispectral sensor for example is capable of imaging at 31 cm spatial resolution [30]. TSX, operating in the Staring Spotlight mode, can acquire imagery at less than 24 cm azimuth resolution [31]. The volume, variety, and velocity of acquisition of data from missions such as these is increasing at an unprecedented rate, and correspondingly, this data is becoming ever more available and accessible to existing and new user communities, including cultural heritage managers.
The processing of satellite data is not trivial, especially SAR data. However, with the Big Data revolution and the trend in Open Science we are seeing increasing automation and open tools that can be exploited by users who may not be remote sensing experts. Platforms to facilitate data processing, such as the Thematic Exploitation Platforms (TEPs) of the European Space Agency [32], are being used by a wide variety of practitioners from various disciplines for operational monitoring with Earth Observation data. While such tools are mature and could be of benefit to the cultural heritage community, there is still a lack of awareness which must be addressed, and capacity building is still needed to introduce remote sensing methodologies into operational cultural heritage practices.

5. Conclusions

VHR spaceborne optical and SAR data, acquired respectively by the Pleiades and TSX missions, have been used to revisit the site, Qasrawet, explored by the NSS expedition during the 1975–6 seasons. The optical data reveals what appear to be newly excavated archaeological structures in the vicinity of building remains excavated during the survey. Based on the 1975–6 excavations it is clear that the extent of Qasrawet is much larger than the area surveyed during the NSS. Yet, no buried architectural features, either hitherto unexcavated or reburied by the BGU expedition or by shifting sand, were detected in the TSX or Pleiades satellite imagery. The objective of the TSX data analysis was to identify any potential buried structures in the proximity of the excavated site. Given that the only anomaly features on the SAR data correspond with those on the Pleiades data, it is assumed that only archaeological surface residues are visible in the SAR data. Nonetheless, in the De Grandi multitemporal speckle filtered σ0 imagery, and particularly in the average coherence imagery, the apparent newly excavated sites show as areas of very high backscatter and coherence.
This study reveals that X-band SAR data has limited capability for prospection of archaeological structures buried in sand covered areas. It also shows the potential of archaeological site monitoring using variously processed EO data from different sensor types. The complementarity of information from multispectral reflectance, microwave backscatter amplitude and interferometric coherence can help with the detection and, more importantly, the interpretation of changes which may affect archaeological sites. This is of particular interest for detecting changes to archaeological sites in remote areas, where other techniques may not be feasible, in order to rapidly detect threats, such as illicit excavations.

Author Contributions

The first author, C.S., initiated the research, procured the remote sensing imagery, and carried out the remote sensing data processing. E.D.O. and E.C.-S. carried out the archaeological interpretation of the processed remote sensing imagery. Most of the paper was written by C.S. Section 1.3 and Section 3.3 were written by E.D.O. and E.C.-S., who both also contributed to Section 3, Section 4 and Section 5. The overlay of the NSS data and delineation of #1–10 clustered anomalies on Figure 9 and Figure 11 were prepared by E.C.-S.

Funding

This research received no external funding.

Acknowledgments

The TerraSAR-X and Pleiades data were provided by the European Space Agency through Category-1 (research) projects with IDs: 37046 (for the TerraSAR-X new acquisitions), and 11458 (for the Pleiades archive data). The NSS data and photographs were provided by the BGU (NSS archive).

Conflicts of Interest

The authors declare no conflicts of interest.

References

  1. Oren, E.D. Northern Sinai. In The New Encyclopedia of Archaeological Excavations in the Holy Land; Stern, E., Ed.; Israel Exploration Society: Jerusalem, Israel, 1993; pp. 1386–1396. [Google Scholar]
  2. Oren, E.D. The ‘Ways of Horus’ in North Sinai. In Egypt, Israel, Sinai: Archaeological and Historical Relationships in the Biblical Period; Rainey, A.F., Ed.; Vandenhoeck & Ruprecht (GmbH & Co. KG): Tel Aviv, Israel, 1987; pp. 69–119. [Google Scholar]
  3. Hoffmeier, J.K.; Moshier, S.O. “A highway out of Egypt”: The main road from Egypt to Canaan. In Desert Road Archaeology in Ancient Egypt and Beyond; Riemer, H., Förster, F., Eds.; Heinrich-Barth-Institut: Köln, Germany, 2013; pp. 485–510. [Google Scholar]
  4. Gold, Z. Security in the Sinai: Present and Future; ICCT Research Paper; The International Centre for Counter-Terrorism (ICCT): The Hague, The Netherlands, 2014. [Google Scholar]
  5. Gold, Z. Salafi Jihadist Violence in Egypt’s North Sinai; ICCT Research Paper; ICCT: The Hague, The Netherlands, 2016. [Google Scholar]
  6. Oren, E.D. Excavations at Qasrawet in North-Western Sinai: Preliminary Report. Isr. Explor. J. 1982, 32, 203–211. [Google Scholar]
  7. Parcak, S.H. Satellite Remote Sensing for Archaeology; Routledge: London, UK, 2009. [Google Scholar]
  8. Wilson, D.R. Air Photo Interpretation for Archaeologists; Tempus Publishing: Stroud, UK, 2000. [Google Scholar]
  9. Elachi, C.; Roth, L.E.; Schaber, G.G. Spaceborne radar subsurface imaging in hyperarid regions. IEEE Trans. Geosci. Remote Sens. 1984, GE-22, 383–388. [Google Scholar] [CrossRef]
  10. Roth, L.E.; Elachi, C. Coherent electromagnetic losses by scattering from volume inhomogeneities. IEEE Trans. Antennas Propag. 1975, 23, 674–675. [Google Scholar] [CrossRef]
  11. McCauley, J.F.; Schaber, G.G.; Breed, C.S.; Grolier, M.J.; Haynes, C.V.; Issawi, B.; Elachi, C.; Blom, R. Subsurface valleys and geoarcheology of the eastern Sahara revealed by shuttle radar. Science 1982, 218, 1004–1020. [Google Scholar] [CrossRef] [PubMed]
  12. Stewart, C.; Lasaponara, R.; Schiavon, G. ALOS PALSAR analysis of the archaeological site of Pelusium. Archaeol. Prospect. 2013, 20, 109–116. [Google Scholar] [CrossRef]
  13. Stewart, C.; Montanaro, R.; Sala, M.; Riccardi, P. Feature Extraction in the North Sinai Desert Using Spaceborne Synthetic Aperture Radar: Potential Archaeological Applications. Remote Sens. 2016, 8, 825. [Google Scholar] [CrossRef]
  14. Linck, R.; Busche, T.; Buckreuss, S.; Fassbinder, J.W.E.; Seren, S. Possibilities of Archaeological Prospection by High-resolution X-band Satellite Radar—A Case Study from Syria. Archaeol. Prospect. 2013, 20, 97–108. [Google Scholar] [CrossRef]
  15. Comer, D.C.; Blom, R.G. Detection and identification of archaeological sites and features using synthetic aperture radar (SAR) data collected from airborne platforms. In Remote Sensing in Archaeology; Springer: Berlin/Heidelberg, Germany, 2006; pp. 103–136. [Google Scholar]
  16. Tapete, D.; Cigna, F.; Masini, N.; Lasaponara, R. Prospection and monitoring of the archaeological heritage of Nasca, Peru, with ENVISAT ASAR. Archaeol. Prospect. 2013, 20, 133–147. [Google Scholar] [CrossRef]
  17. Ulaby, T.; Moore, K.; Fung, K. Microwave Remote Sensing. Volume Ⅱ: Radar Remote Sensing and Surface Scattering and Emission Theory; Addison Wesley: New York, NY, USA, 1982; Volume 2. [Google Scholar]
  18. Schaber, G.G.; McCauley, J.F.; Breed, C.S. The use of multifrequency and polarimetric SIR-C/X-SAR data in geologic studies of Bir Safsaf, Egypt. Remote Sens. Environ. 1997, 59, 337–363. [Google Scholar] [CrossRef]
  19. Paillou, P.; Grandjean, G.; Baghdadi, N.; Heggy, E.; August-Bernex, T.; Achache, J. Subsurface imaging in south-central Egypt using low-frequency radar: Bir Safsaf revisited. IEEE Trans. Geosci. Remote Sens. 2003, 41, 1672–1684. [Google Scholar] [CrossRef]
  20. Blom, R.G.; Crippen, R.E.; Elachi, C. Detection of subsurface features in SEASAT radar images of Means Valley, Mojave Desert, California. Geology 1984, 12, 346–349. [Google Scholar] [CrossRef]
  21. Schaber, G.G.; McCauley, J.F.; Breed, C.S.; Olhoeft, G.R. Shuttle imaging radar: Physical controls on signal penetration and subsurface scattenng in the Eastern Sahara. IEEE Trans. Geosci. Remote Sens. 1986, GE-24, 603–623. [Google Scholar] [CrossRef]
  22. Gaber, A.; Koch, M.; Griesh, M.H.; Sato, M.; El-Baz, F. Near-surface imaging of a buried foundation in the Western Desert, Egypt, using space-borne and ground penetrating radar. J. Archaeol. Sci. 2013, 40, 1946–1955. [Google Scholar] [CrossRef]
  23. Woodhouse, I.H. Introduction to Microwave Remote Sensing; CRC Press: Boca Raton, FL, USA, 2005; 370p. [Google Scholar]
  24. Chen, F.; Masini, N.; Yang, R.; Milillo, P.; Feng, D.; Lasaponara, R. A space view of radar archaeological marks: First applications of COSMO-SkyMed X-band data. Remote Sens. 2015, 7, 24–50. [Google Scholar] [CrossRef]
  25. Cledat, J. Fouilles a’ Qasr Gheit, mai 1911. Ann. Serv. Antiq. l’Egypte 1912, 12, 145–168. [Google Scholar]
  26. North Sinai Governorate. Climate: North Sinai Governorate. 2018. Available online: https://en.climate-data.org/region/1658/ (accessed on 17 February 2018).
  27. De Grandi, G.F.; Leysen, M.; Lee, J.S.; Schuler, D. Radar reflectivity estimation using multiple SAR scenes of the same target: Technique and applications. In Proceedings of the 1997 IEEE International Geoscience and Remote Sensing (IGARSS’97), Remote Sensing—A Scientific Vision for Sustainable Development, Singapore, 3–8 August 1997. [Google Scholar]
  28. Ferretti, A.; Monti-Guarnieri, A.; Prati, C.; Rocca, F. InSAR Principles: Guidelines for SAR Interferometry Processing and Interpretation; Training Manual TM-19; ESA Publications Division, ESTEC: Noordwijk, The Netherlands, 2007. [Google Scholar]
  29. Stewart, C.; Gusmano, S.; Fea, M.; Vittozzi, G.C.; Sala, M.; Montanaro, R. A Review of the Subsurface Mapping Capability of SAR in Desert Regions: Bir Safsaf Revisited with Sentinel-1 and ENVISAT ASAR. Archeol. Aerea Stud. Aerotopogr. Archeol. 2018, in press. [Google Scholar]
  30. Kuester, M.A.; Ochoa, M.; Dayer, A.; Levin, J.; Aaron, D.; Helder, D.L.; Leigh, L.; Czapla-Meyers, J.; Anderson, N.; Bader, B.; et al. Absolute Radiometric Calibration of the DigitalGlobe Fleet and updates on the new WorldView-3 Sensor Suite. In Report of JACIE Civil Commercial Imagery Evaluation Workshop of DigitalGlobe Inc.; DigitalGlobe Inc.: Westminster, CO, USA, 2017. [Google Scholar]
  31. Breit, H.; Fischer, M.; Balss, U.; Fritz, T. TerraSAR-X staring spotlight processing and products. In Proceedings of the 10th European Conference on Synthetic Aperture Radar (EUSAR 2014), Berlin, Germany, 3–5 June 2014; VDE: Frankfurt am Main, Germany, 2014. [Google Scholar]
  32. Pinto, S. Exploitation Platform Open Architecture (Draft); European Space Agency: Frascati, Italy, 2015. [Google Scholar]
Figure 1. Map of study area. Red star shows location of Qasrawet. Optical (Sentinel-2) background image acquired on 19 February 2016 with band 8 (near-infrared) displayed as red, band 4 (red) displayed as green, and band 3 (green) displayed as blue. Contains modified Copernicus Sentinel data 2016.
Remotesensing 10 01090 g001
Figure 2. Qasrawet #0104, Site D50, (Anomaly #1) looking south. Central temple, outer north wall and inner structure behind. On the right a section of the western temple visible. Central temple is buried at least 5 m down to foundations level. Only the exposed walls of the central temple, and top walls of the western temple are visible in the satellite imagery. Other walls of the central temple are buried in sand and remain invisible (Photo E.D. Oren).
Remotesensing 10 01090 g002
Figure 3. Qasrawet #1137, Site D50 (Anomaly #1). South face of the central temple’s inner structure. Engaged columns crowned by square capitals, topped by a heavy wooden beam (entirely decayed) which supported the Egyptian style cornice and above it a gable with dentils inside a broken pediment (Photo E.D. Oren).
Remotesensing 10 01090 g003
Figure 4. Qasrawet #1304, Site D50 (Anomaly #5), fortified garrison, a building unit buried entirely in sand and preserved to roof level. Top mud-brick walls were detected at surface level. Excavated walls are not visible in the Pleiades or TSX data analyzed here. (Photo E.D. Oren).
Remotesensing 10 01090 g004
Figure 5. Qasrawet #096, Site D52, Building B (Anomaly #10) looking south. Notice top mud-brick walls above surface level and visible in Pleiades imagery (see below) (Photo E.D. Oren).
Remotesensing 10 01090 g005
Figure 6. De Grandi multitemporal speckle filtered TSX image acquired on 9 June 2017. The yellow ellipse encloses a number of anomaly features. TSX data provided by the European Space Agency.
Remotesensing 10 01090 g006
Figure 7. Mean of all coherence images calculated between consecutively acquired TSX images. The yellow ellipse encloses a number of anomaly features. TSX data provided by the European Space Agency.
Remotesensing 10 01090 g007
Figure 8. Pleiades image of Qasrawet, acquired on 8 July 2017. Pan-sharpened color composite of near-infrared, red, and green displayed respectively as red, green, and blue. Yellow polygon surrounds apparent archaeological features. Pleiades image provided by the European Space Agency.
Remotesensing 10 01090 g008
Figure 9. Pleiades image of Qasrawet, acquired on 8 July 2017, displayed as true color pan-sharpened composite. The green points on the image are tombs identified during the NSS. The black vectors are other buildings identified in the same ground survey. 10 anomaly features have been identified in the Pleiades image. These are marked in two shades of yellow, the more opaque correspond with clearer anomalies, while the more transparent correspond with fainter anomalies. Pleiades image provided by the European Space Agency. The NSS data overlain on Figure 9, and the delineation of #1–10 clustered anomalies were prepared by Eli Cohen-Sasson.
Remotesensing 10 01090 g009
Figure 10. Qasrawet, Site D52, section of Pleiades image (Figure 9) showing buildings.
Remotesensing 10 01090 g010
Figure 11. Qasrawet, Site D52, ground plans of buildings (labelled A–D) overlain on the Pleiades image (Figure 9). Prepared by Dr. Eli Cohen-Sasson.
Remotesensing 10 01090 g011
Table 1. TSX data of Qasrawet.
Number of Images8
Acquisition Dates09 June 2017,20 June 2017,01 July 2017,12 July 2017,23 July 2017,03 August 2017,14 August 2017,25 August 2017,
Acquisition ModeSpotlight
FrequencyX-band (3.1 cm)
Processing LevelSingle Look Slant Range Complex (SSC)
Pass, Look DirectionDescending, Right Looking
Incidence Angle44.74 degrees
PolarisationHorizontal Transmit and Horizontal Receive (HH)
Spatial ResolutionApproximately 1.2 m (ground range)
Table 2. Pleiades data of Qasrawet.
Number of Images1
Acquisition Date8 July 2017
Product TypePansharpened 4 bands (Blue, Green, Red, Near-infrared)
Wavelengths of Original Spectral BandsPan: 470–830 nmBlue: 430–550 nmGreen: 500–620 nmRed: 590–710 nmNear-infrared: 740–940 nm
Radiometric Processing LevelBasic (no radiometric processing)
Geometric Processing LevelOrtho (Georeferenced image in Earth geometry, corrected from off-nadir acquisition and terrain effects)
Spatial Resolution50 cm (Spatial resolution of multispectral bands prior to pansharpening: 2 m)
Table 3. Visibility of anomalies 1 to 10 in the remote sensing data, and comparison with NSS. V corresponds to presence of feature in data.
Anomaly NumberVisible as Disturbed Area in Optical DataVisible Architecture Features in Optical DataVisible as Disturbed Area in SAR DataVisible Architecture Features in SAR DataNSS Data
1VVVVV
2V V V
3V V
4V V
5VVVVV
6V V
7VVV V
8VVV
9V V
10VVV V

