Article

Examining Spatial Patterns of Urban Distribution and Impacts of Physical Conditions on Urbanization in Coastal and Inland Metropoles

1
Fujian Provincial Key Laboratory for Subtropical Resources and Environment, Fujian Normal University, Fuzhou 350007, China
2
School of Geographical Sciences, Fujian Normal University, Fuzhou 350007, China
3
Center for Global Change and Earth Observations, Michigan State University, East Lansing, MI 48823, USA
4
School of Environmental & Resource Sciences, Zhejiang Agriculture and Forestry University, Hangzhou 311300, China
*
Author to whom correspondence should be addressed.
Remote Sens. 2018, 10(7), 1101; https://doi.org/10.3390/rs10071101
Submission received: 15 June 2018 / Revised: 2 July 2018 / Accepted: 8 July 2018 / Published: 11 July 2018

Abstract

:
Urban expansion has long been a research hotspot and is often based on individual cities, but rarely has research conducted a comprehensive comparison between coastal and inland metropoles for understanding different spatial patterns of urban expansions and driving forces. We selected coastal metropoles (Shanghai and Shenzhen in China, and Ho Chi Minh City in Vietnam) and inland metropoles (Ulaanbaatar in Mongolia, Lanzhou in China, and Vientiane in Laos) with various developing stages and physical conditions for examining the spatiotemporal patterns of urban expansions in the past 25 years (1990–2015). Multitemporal Landsat images with 30 m spatial resolution were used to develop urban impervious surface area (ISA) distributions and examine their dynamic changes. The impacts of elevation, slope, and rivers on spatial patterns of urban expansion were examined. This research indicates that ISA is an important variable for examining urban expansion. Coastal metropoles had much faster urbanization rates than inland metropoles. The spatial patterns of urban ISA distribution and expansion are greatly influenced by physical conditions; that is, ISA is mainly distributed in the areas with slopes of less than 10 degrees. Rivers are important geographical factors constraining urban expansion, especially in developing stages, while bridges across the rivers promote urban expansion patterns and rates. The relationships of spatial patterns of urban ISA distribution and dynamics with physical conditions provide scientific data for urban planning, management, and sustainability.

Graphical Abstract

1. Introduction

The migration of populations from rural to urban regions and improved economic conditions in developing countries have resulted in rapid urban expansion [1,2], requiring timely updates of urban spatial distribution and expansion datasets. Urban distribution and dynamic change products are often obtained from remotely sensed data using classification-based approaches, such as maximum likelihood, decision tree classifier, support vector machine, and object-oriented classifier [3,4,5]. However, directly extracting urban features from remotely sensed data is often difficult due to the complex composition of urban land covers and their spectral confusions, such as among buildings, roads, and bare soils, and between building-cast shadows and water [6]. Impervious surface area (ISA) is regarded as an important feature for examining urban distribution or expansion [7]. Impervious surface is often defined as the man-made surfaces, such as buildings, roads, and parking lots that water cannot penetrate [8]. Because ISA is an important parameter for urban environmental modeling, hydrological modeling, socioeconomic analysis, and urban climate [9,10,11,12,13], many studies have been conducted to explore approaches to accurately extract urban ISA using different sensor data, such as Quickbird, IKONOS, Landsat, Advanced Spaceborne Thermal Emission and Reflection Radiometer (ASTER), and nighttime light data [6].
Many previous studies examining urban spatial patterns were based on individual cities [3,7,8,14,15], but differences in geolocations, climate, development stages, population, and economic conditions among multiple cities make it difficult to understand the many mechanisms of urban expansion and require comparative analyses [4,16,17,18]. For example, Kuang et al. [4] conducted a comparative analysis of 30-year urban expansion patterns and rates among three metropoles in China (Beijing, Shanghai, and Guangzhou) and three in the USA (New York, Los Angeles, and Chicago) and found that the Chinese megacities expanded in concentric-ring structures, whereas the American megacities increased ISA mainly within the inner cities with patch-filling patterns. Population and economic conditions were found to significantly influence urban expansion patterns and rates in Chinese megacities, but not in American megacities. Began et al. [16] found that the increased rates of built-up land varied among cities and the fastest-growing cities were in Asia, while the slower-growing cities were in Western Europe and North America. Schneider and Mertes [18] compared urban expansion in 142 Chinese cities between 1978 and 2010 based on Landsat images and demographic data and found that the city sizes tripled while populations doubled in all cities investigated. Coastal cities targeted with earlier reforms expanded earlier than western cities. Urban expansion was attributed to several factors including population shift, state-led industrialization and growth policies, and fiscal pressures for governments at both provincial and county levels.
The forces driving urban expansion varied depending on physical conditions, such as topography and climate, population size, and economic condition [17,19,20]. Fan et al. [17] compared urban expansion of nine cities covering coastal and inland megacities in East Asia based on urban built-up area data developed from remotely sensed images at different time periods. Four urban growth indicators were used to measure the driving forces of urban land use, economics, and population dynamics. They found that all nine cities experienced extensive urbanization from 1990 to 2010, and built-up areas increased at higher rates than the population. However, cities in different regions have shown distinctive spatial patterns. In another study, Fan et al. [19] compared the urbanization processes and environmental changes of two cities—Hohhot, China, and Ulaanbaatar, Mongolia—and analyzed the underlying driving forces. They found that both cities experienced rapid urbanization in terms of population growth and city expansion from 1990 to 2010, with a much faster speed after 2000 than before. Economic development played an important role in urban expansion, and geophysical conditions restricted the urban expansion directions. Chen et al. [20] examined urbanization of six cities on the Mongolian Plateau, of which three are located in Inner Mongolia and another three are located in Mongolia, by examining their spatial urban built-up expansion over time and analyzing the driving forces including economy, social goods, and environmental variables. All cities were experiencing rapid urban expansion; however, the major driving forces for the six cities were different, due to the divergent governmental roles in urbanization and different economic structures between the two regions.
Coastal cities have been the focus of urban expansion in recent decades, with the growth of urban populations in coastal cities outpacing that of inland cities [4,17,18]. Although many previous studies have conducted comparative analyses among different cities on spatial patterns of urban expansion and impacts of population and economic conditions on urban expansion [4,18], the difference in spatial patterns in coastal and inland metropoles, and the impacts of physical conditions on the spatial patterns have not been fully examined, especially in East Asia and Southeast Asia. We would like to answer two broad questions: What are the differences in spatial patterns and rates of urbanization in coastal and inland metropoles under different developing stages? How do different topographic conditions (e.g., elevation, slope, and rivers) affect the spatial patterns of urban expansion? Specifically, the objectives of this research are to map ISA spatial distribution of six metropoles in East Asia and Southeast Asia from 1990 to 2015, analyze urbanization rates, examine different spatiotemporal patterns between coastal and inland metropoles, and to conduct comparative analysis of different impacts of physical conditions, such as elevation, slope, and rivers, on coastal and inland urban expansions. Therefore, we selected six metropoles—three coastal (Shanghai and Shenzhen in China, and Ho Chi Minh City [HCMC] in Vietnam) and three inland (Ulaanbaatar in Mongolia, Lanzhou in China, and Vientiane in Laos)—with different developing stages and physical conditions. Multitemporal Landsat imagery and digital elevation model (DEM) data were used to examine the impacts of physical conditions on urbanizations.

2. Study Areas

Based on research objectives and data availability, we selected the three coastal and three inland metropoles in Asia (Figure 1). They have great differences in geographic location, climate, population size, economic condition, and social development stage, as summarized in Table 1, and they are ideal examples for conducting the comparative analysis of urbanization rates and driving forces. Shanghai, HCMC, Ulaanbaatar, and Vientiane were selected because they are the most important economic centers of their respective countries, with Shanghai and HCMC as coastal cities and Vientiane and Ulaanbaatar as inland cities. We chose Shenzhen as one of the cases because it is the most dynamic coastal city in China that has experienced an exponential speed of urbanization. Lanzhou was selected because it represents China’s inland cities in terms of geophysical constraints and their socioeconomic development paths in the past three decades.
Shanghai, located on the coast of East China Sea and at the estuary of Yangtze River, has been experiencing rapid urbanization since the 1980s. Its population grew from less than 6 million in 1980 to approximately 24 million in 2016 (https://www.statista.com/statistics/466938/china-population-of-shanghai/), making it one of the largest metropoles in the world. Since 1984, Shanghai has expanded in all direction from the city core on the west bank of Huangpu River, resulting in conversion of a huge amount of farmland to new housing, factories, shopping centers, parking lots, and roads [21]. The Pudong New Area’s development starting in the early 1990s, further accelerated Shanghai’s urbanization [22].
Shenzhen, located on the eastern bank of Pearl River, was the first special economic zone in China, established in 1980 from a small fishing village of just over 30,000 people. In the past 30+ years, Shenzhen has grown into a modern metropolis that housed about 11.4 million residents in 2016 (http://www.chinadaily.com.cn/regional/2016-11/28/content_27505194.htm). The high-tech, financial services, modern logistics, and cultural industries are mainstays of the city, resulting in rapid urbanization in the past four decades [23,24,25].
Ho Chi Minh City is located in the southeastern region of Vietnam, 1760 km south of the national capital Hanoi. Since the implementation of Vietnam’s Doi Moi economic reform policy in 1986, this city has experienced rapid urbanization with a great influx of immigrants from rural areas [26,27,28,29].
Ulaanbaatar, the capital and the largest city in Mongolia, is located in north-central Mongolia on Tuul River, a valley at the foot of Bogd Khan Mountain. More than 40% of the country’s population resides in this city. However, about 60% of Ulaanbaatar’s population lives in the area called Ger District, located on the periphery of the city. The sprawling and unplanned communities within the district have poor living conditions and minimal access to public transportation, health services, and education, producing great challenges to improving Ulaanbaatar’s residents’ livelihoods [19,30,31,32].
Lanzhou, the capital and the largest city of Gansu Province in northwestern China, is seated on the banks of Yellow River, and surrounded by mountains to the north and south. Due to its geography, the city extends about 50 km along Yellow River from east to west. Historically, it was a major stop on the ancient Silk Road and was called “Golden City.” Currently, Lanzhou is an important industry base and key transportation hub. With its geographic location and transportation network, Lanzhou has been experiencing rapid development, especially since the initiative of China’s “Go West” beginning in 2000. As part of the campaign, Lanzhou New Area, which was declared the fifth “state-level new area”, is becoming the center of high-tech industry, the communication and logistics linkage in western China [33,34,35].
Vientiane, the capital and the largest city in Laos, is located in the center of the country on the left bank of Mekong River. Known as the “City of the Moon,” it has a long history and has been ruled by different groups and experienced various periods of growth and decline [36]. Since the “New Economic Mechanism” reform (conversion to a market economy) in 1986, the city of Vientiane has attracted a large immigration from rural areas [37,38,39].

3. Materials and Methods

The framework of mapping ISA change using multitemporal Landsat images and conducting the comparative analysis among the coastal and inland metropoles is illustrated in Figure 2. The major steps include (i) developing ISA spatial distribution for each metropolis for the years 1990–2015 at five-year intervals and examining urban expansion; (ii) examining the spatial patterns of ISA expansion for each metropolis; and (iii) examining the impacts of physical conditions on urban expansion.

3.1. Data Collection and Organization

Multitemporal Landsat imagery from 1990 to 2015 at five-year intervals for each metropolis (Table 2) was downloaded from United States Geological Survey (USGS) Earth Explorer (https://earthexplorer.usgs.gov/). All these images have good geometric accuracy and good quality, with cloud cover of less than 1%. Since these images were used for mapping ISA distribution independently, no atmospheric calibration was needed. The ASTER GDEM (Global Digital Elevation Model) data with 30 m spatial resolution were used to extract elevation and compute slope for examining the impacts of physical conditions on urban expansion. Meanwhile, rivers in each metropolis were extracted from Landsat imagery to explore their impacts on spatial patterns of urbanization, which previous research did not fully examine. The administrative boundary for each metropolis in shape format and the central point of each metropolis were also collected.

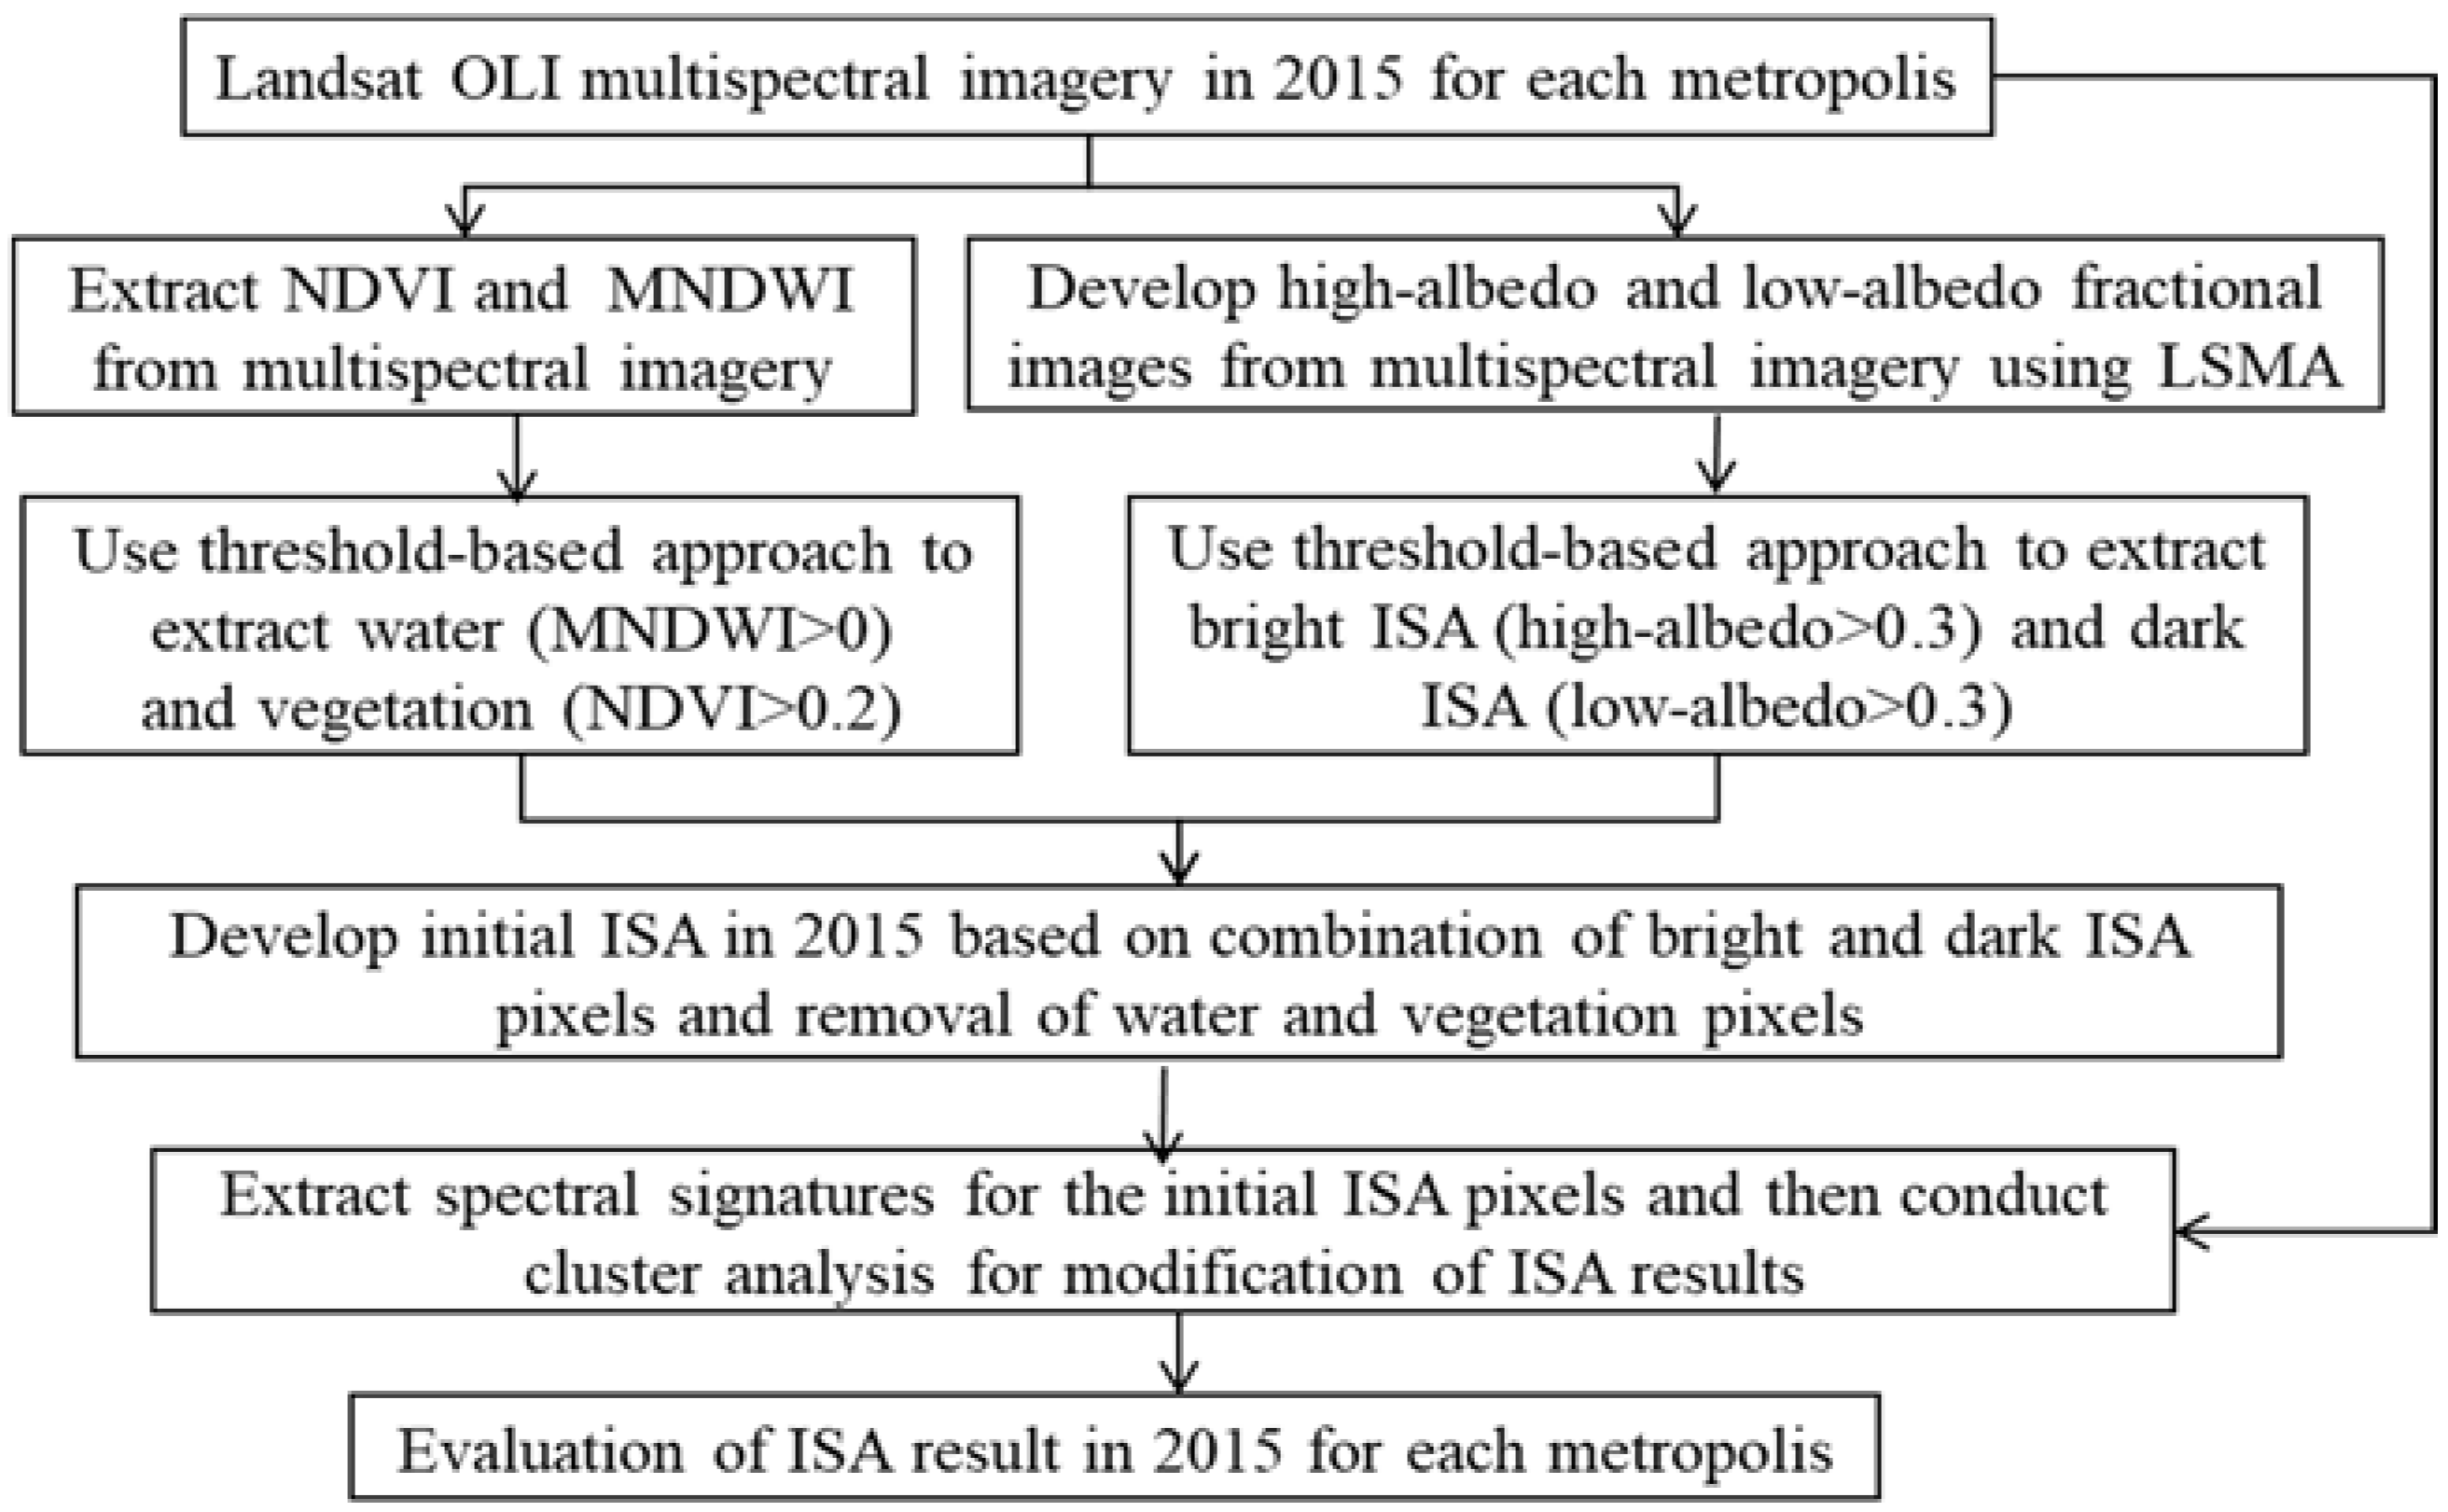
3.2. Development of Urban Impervious Surface Data from Landsat Imagery

Although different approaches, such as classification and thresholding, have been used for mapping ISA distribution, linear spectral mixture analysis (LSMA) has been regarded as one of the most accurate for mapping fractional ISA distribution from multispectral bands [6]. In this research, a hybrid approach consisting of LSMA, vegetation indices, and cluster analysis was proposed (See Figure 3). Linear spectral mixture analysis was used to unmix Landsat multispectral imagery into three fraction images, from which three endmembers—high-albedo object, low-albedo object, and vegetation—were extracted using the image-based endmember selection approach [8]. The ISA was then extracted from the combination of high-albedo and low-albedo fraction images by removing the non-ISA pixels (e.g., green vegetation, water, bare soils) [8] using the thresholding-based approach on the Normalized Difference Vegetation Index (NDVI) and Modified Normalized Difference Water Index (MNDWI). Because there is still some confusion between ISA with shallow water and bare soils, spectral signatures of the initial ISA were further extracted from Landsat multispectral imagery. A cluster analysis was used to classify the spectral signatures into 30 clusters. The analyst further refined the ISA results by removing non-ISA clusters [7]. This approach was used to extract ISA from the 2015 Landsat imagery for each metropolis.
The extracted ISA images from 2015 were used to extract the spectral signatures from the 2010 image for each metropolis. Cluster analysis was then used to classify the extracted spectral signatures into 50 clusters considering more non-ISA pixels in the 2010 image than in the 2015 image. As shown in Figure 2, the same approach was then used to extract ISA images for other years.
Accuracy assessment for the 2015 ISA results for each metropolis was conducted. A total of 300 validation samples, including 100 samples for ISA and 200 samples for others, were randomly selected for each city. High spatial resolution images from Google Earth were used to determine whether or not the validation sample was ISA. The error matrix was used to calculate producer’s accuracy, user’s accuracy, and overall accuracy [40,41].

3.3. Examining Spatiotemporal Patterns of Urban Distribution and Expansion

Based on the developed ISA distribution for each metropolis from 1990 to 2015, the total ISA (AISA) and total area (Atotal) were calculated based on administrative boundaries. The ISA density (DISA) was defined as the ratio between total ISA and total area: DISA = AISA/Atotal. The changed ISA area (CISA) was the difference of the total ISA in each metropolis between two dates: CISA = AISA(t2) − AISA(t1), where AISA(t1) and AISA(t2) were the total ISA area in years 1 and 2. The comparative analysis of spatial patterns and urban expansion was conducted among the coastal metropoles, among the inland metropoles, and between the coastal and inland metropoles.
The buffer zone–based approach was used to analyze spatial patterns of ISA distribution. The ISA amounts within the buffer zones were calculated. Because the buffer zones increased in size as the distances from the urban center increased, it was necessary to remove the impacts of their different sizes on the ISA amounts. The ISA density in a buffer zone (DISA i) was defined as the ISA within the buffer zone (AISA i) divided by the total area of the corresponding buffer zone (Atotal i) [42], that is, DISA i = AISA i/Atotal i and A totali = π r i 2 π r i 1 2 , where DISA i is the ISA density at the ith buffer zone, and r is the radius of each buffer circle, from 2, 4, 6, …, to 50 km.

3.4. Examining Impacts of Physical Conditions on Urban Expansion

The DEM data was used to calculate elevation and slope for examining the impacts of topography on urban expansion. Depending on different elevation ranges among the coastal metropoles, the elevation ranges were grouped into four categories: <10, 10–20, 20–30, and >30 m for Shanghai and HCMC; and <20, 20–40, 40–60, and >60 m for Shenzhen because of its slightly higher elevations. Considering different elevation ranges among the three inland cities, we had to use different elevation ranges: <1300, 1300–1400, 1400–1500, and >1500 m for Ulaanbaatar; <1600, 1600–1700, 1700–1800, and >1800 m for Lanzhou; and <160, 160–180, 180–200, and >200 m for Vientiane. Slope ranges were grouped into four categories for all cities: <5°, 5°–10°, 10°–15°, and >15°. The statistical results for different elevation and slope ranges were summarized for examining the impacts of topographic factors on urban expansion. Meanwhile, the 3D images using the elevation by overlaying ISA data were examined to understand the different roles of topographic factors on urban expansion.
In order to conduct a comparative analysis of urban expansion rates in different topographic conditions among coastal and inland metropoles, a regression-based approach was used; that is, y = a + bx, where x is the predictor variable (year), and y is the response variable ISA (km2), a is the intercept, and b is the regression slope. The value of b can be positive or negative or 0, indicating that ISA increases or decreases or has no change over time. The higher b values imply more annual increase of ISA. Therefore, the value of b can be used as an indicator to evaluate urban expansion. In this research, we developed the regression models according to the elevation or slope range.
Water is a prerequisite for life; thus, urban areas are often established beside rivers. The location of a river is an important factor influencing spatial patterns of urban distribution and expansion, constraining expansion to one side if no way to cross the river (e.g., bridges) is available. We selected Shanghai and HCMC (coastal metropoles) and Ulaanbaatar and Lanzhou (inland metropoles) to examine the roles of river locations in urban expansion. The buffer-zone approach at 1 km intervals along the rivers in the urban landscapes was used to calculate ISA amount and density.

4. Results

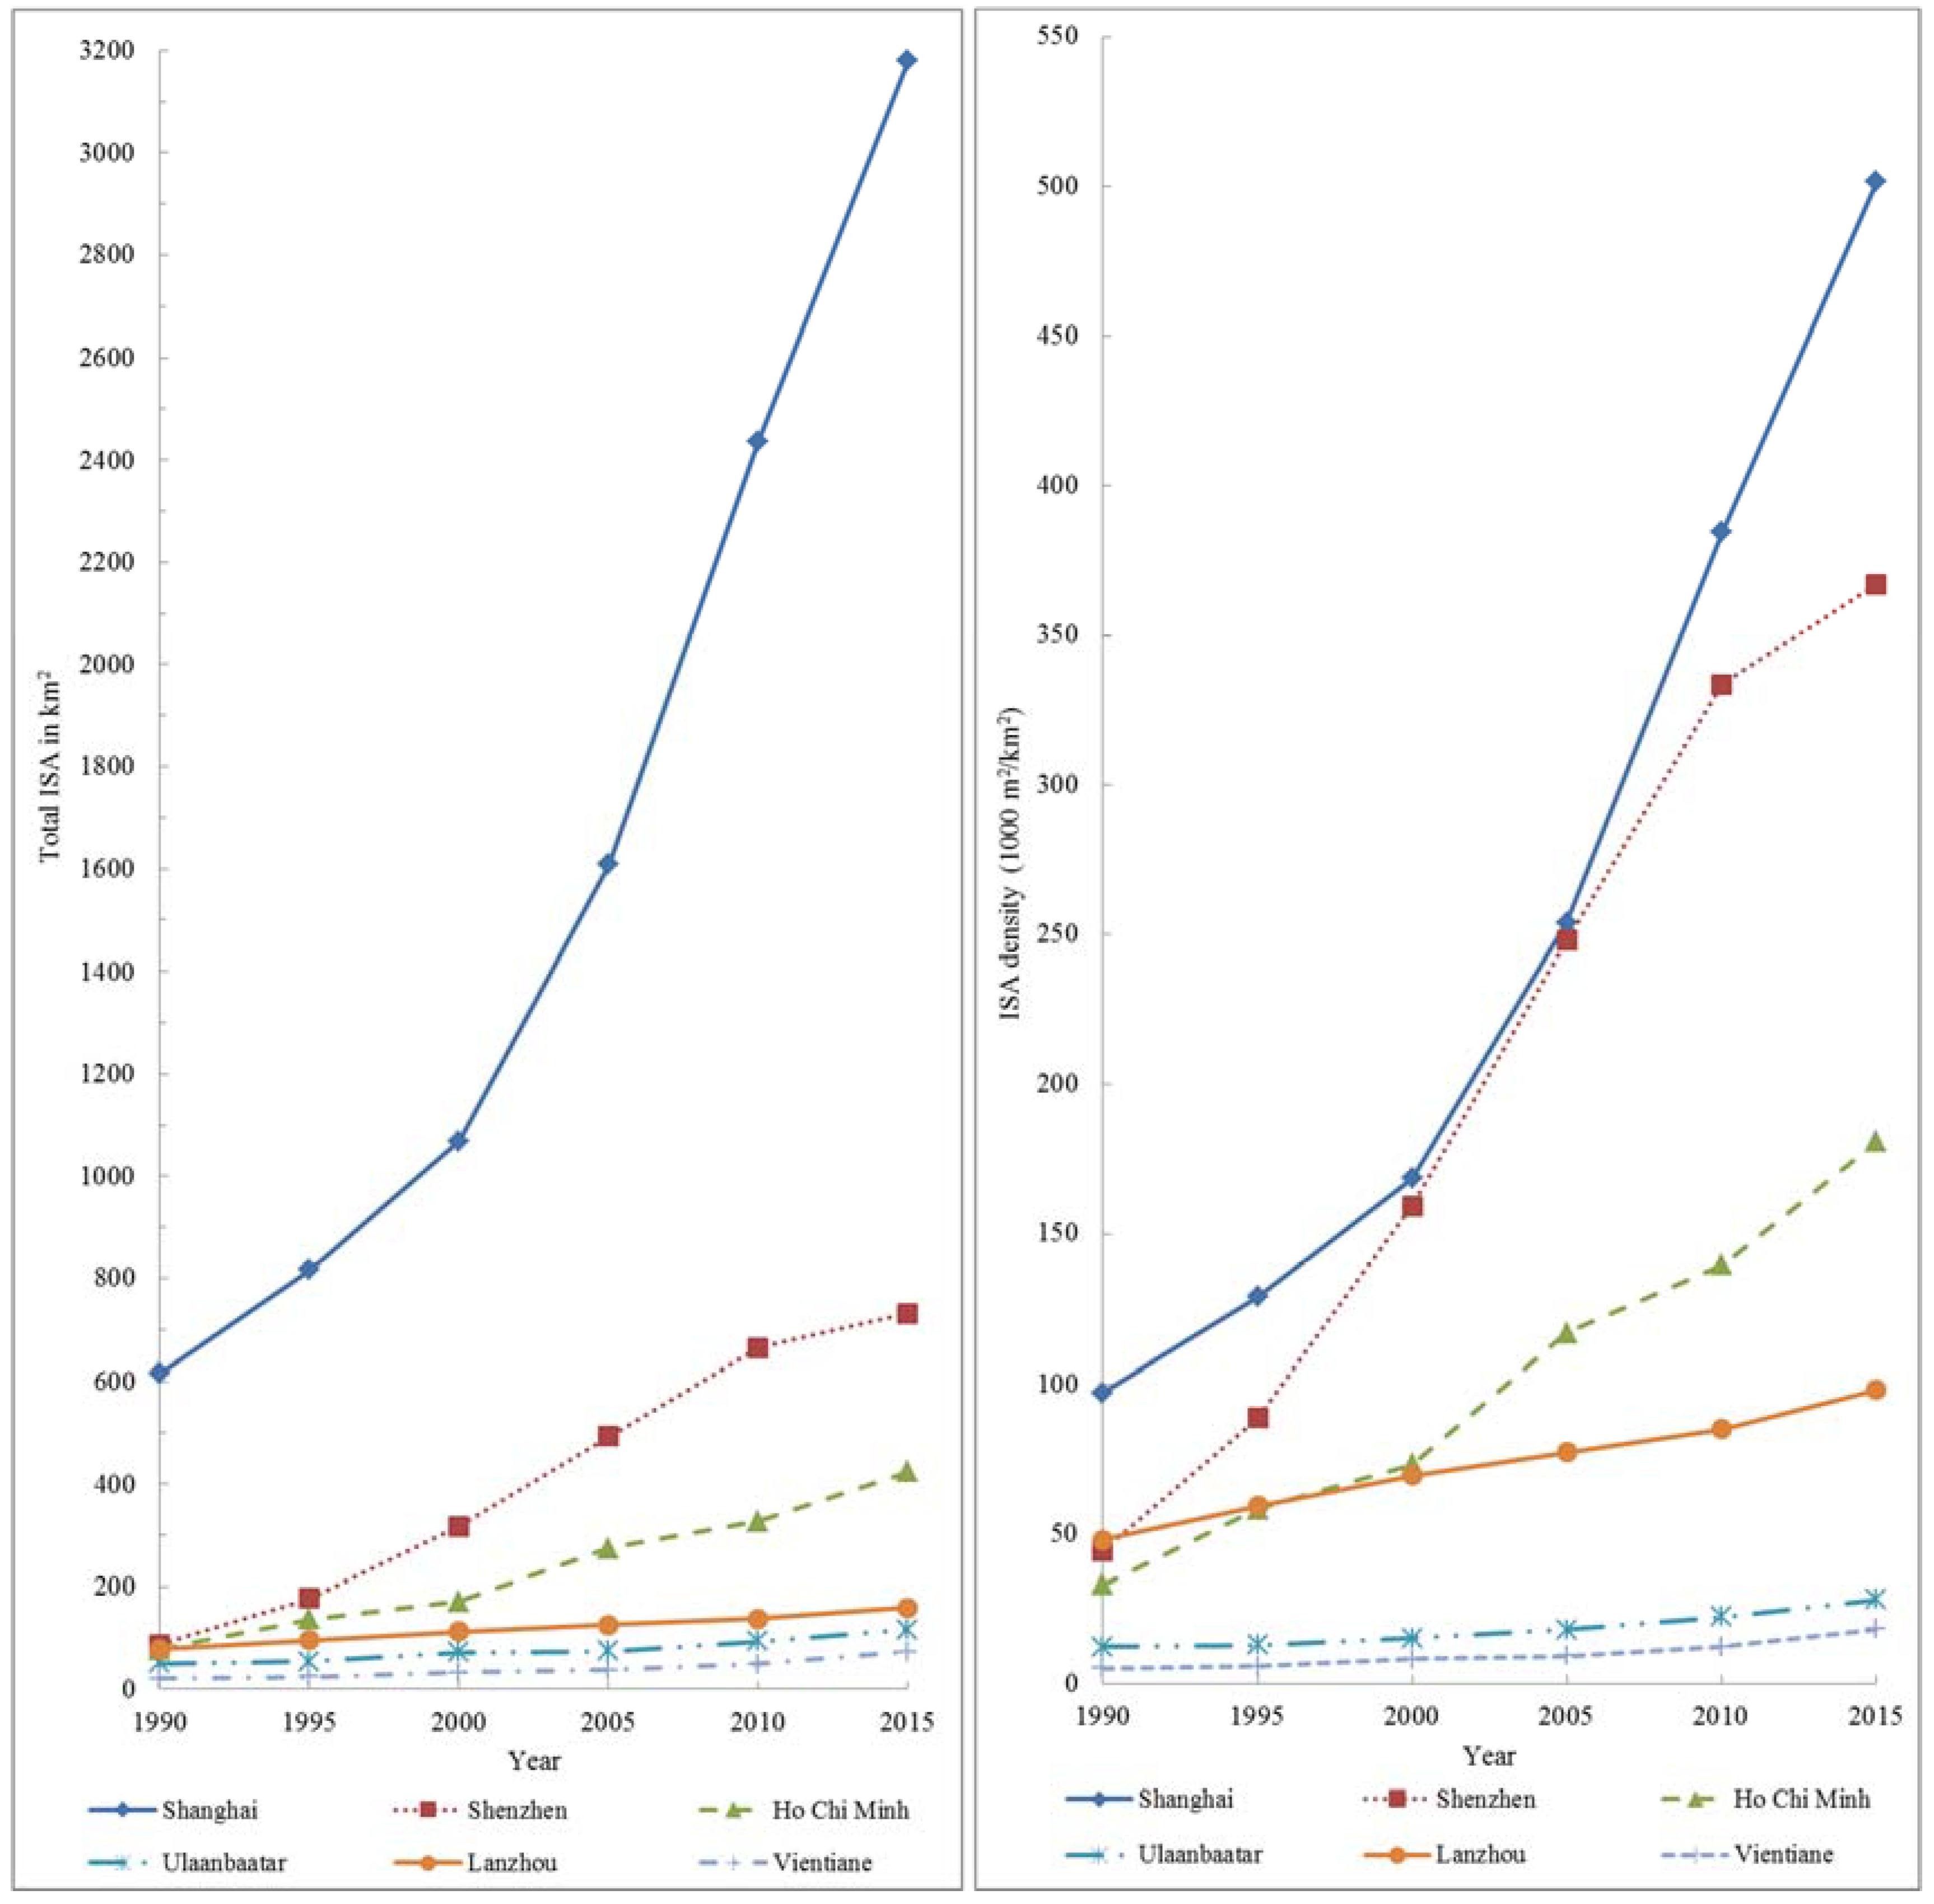
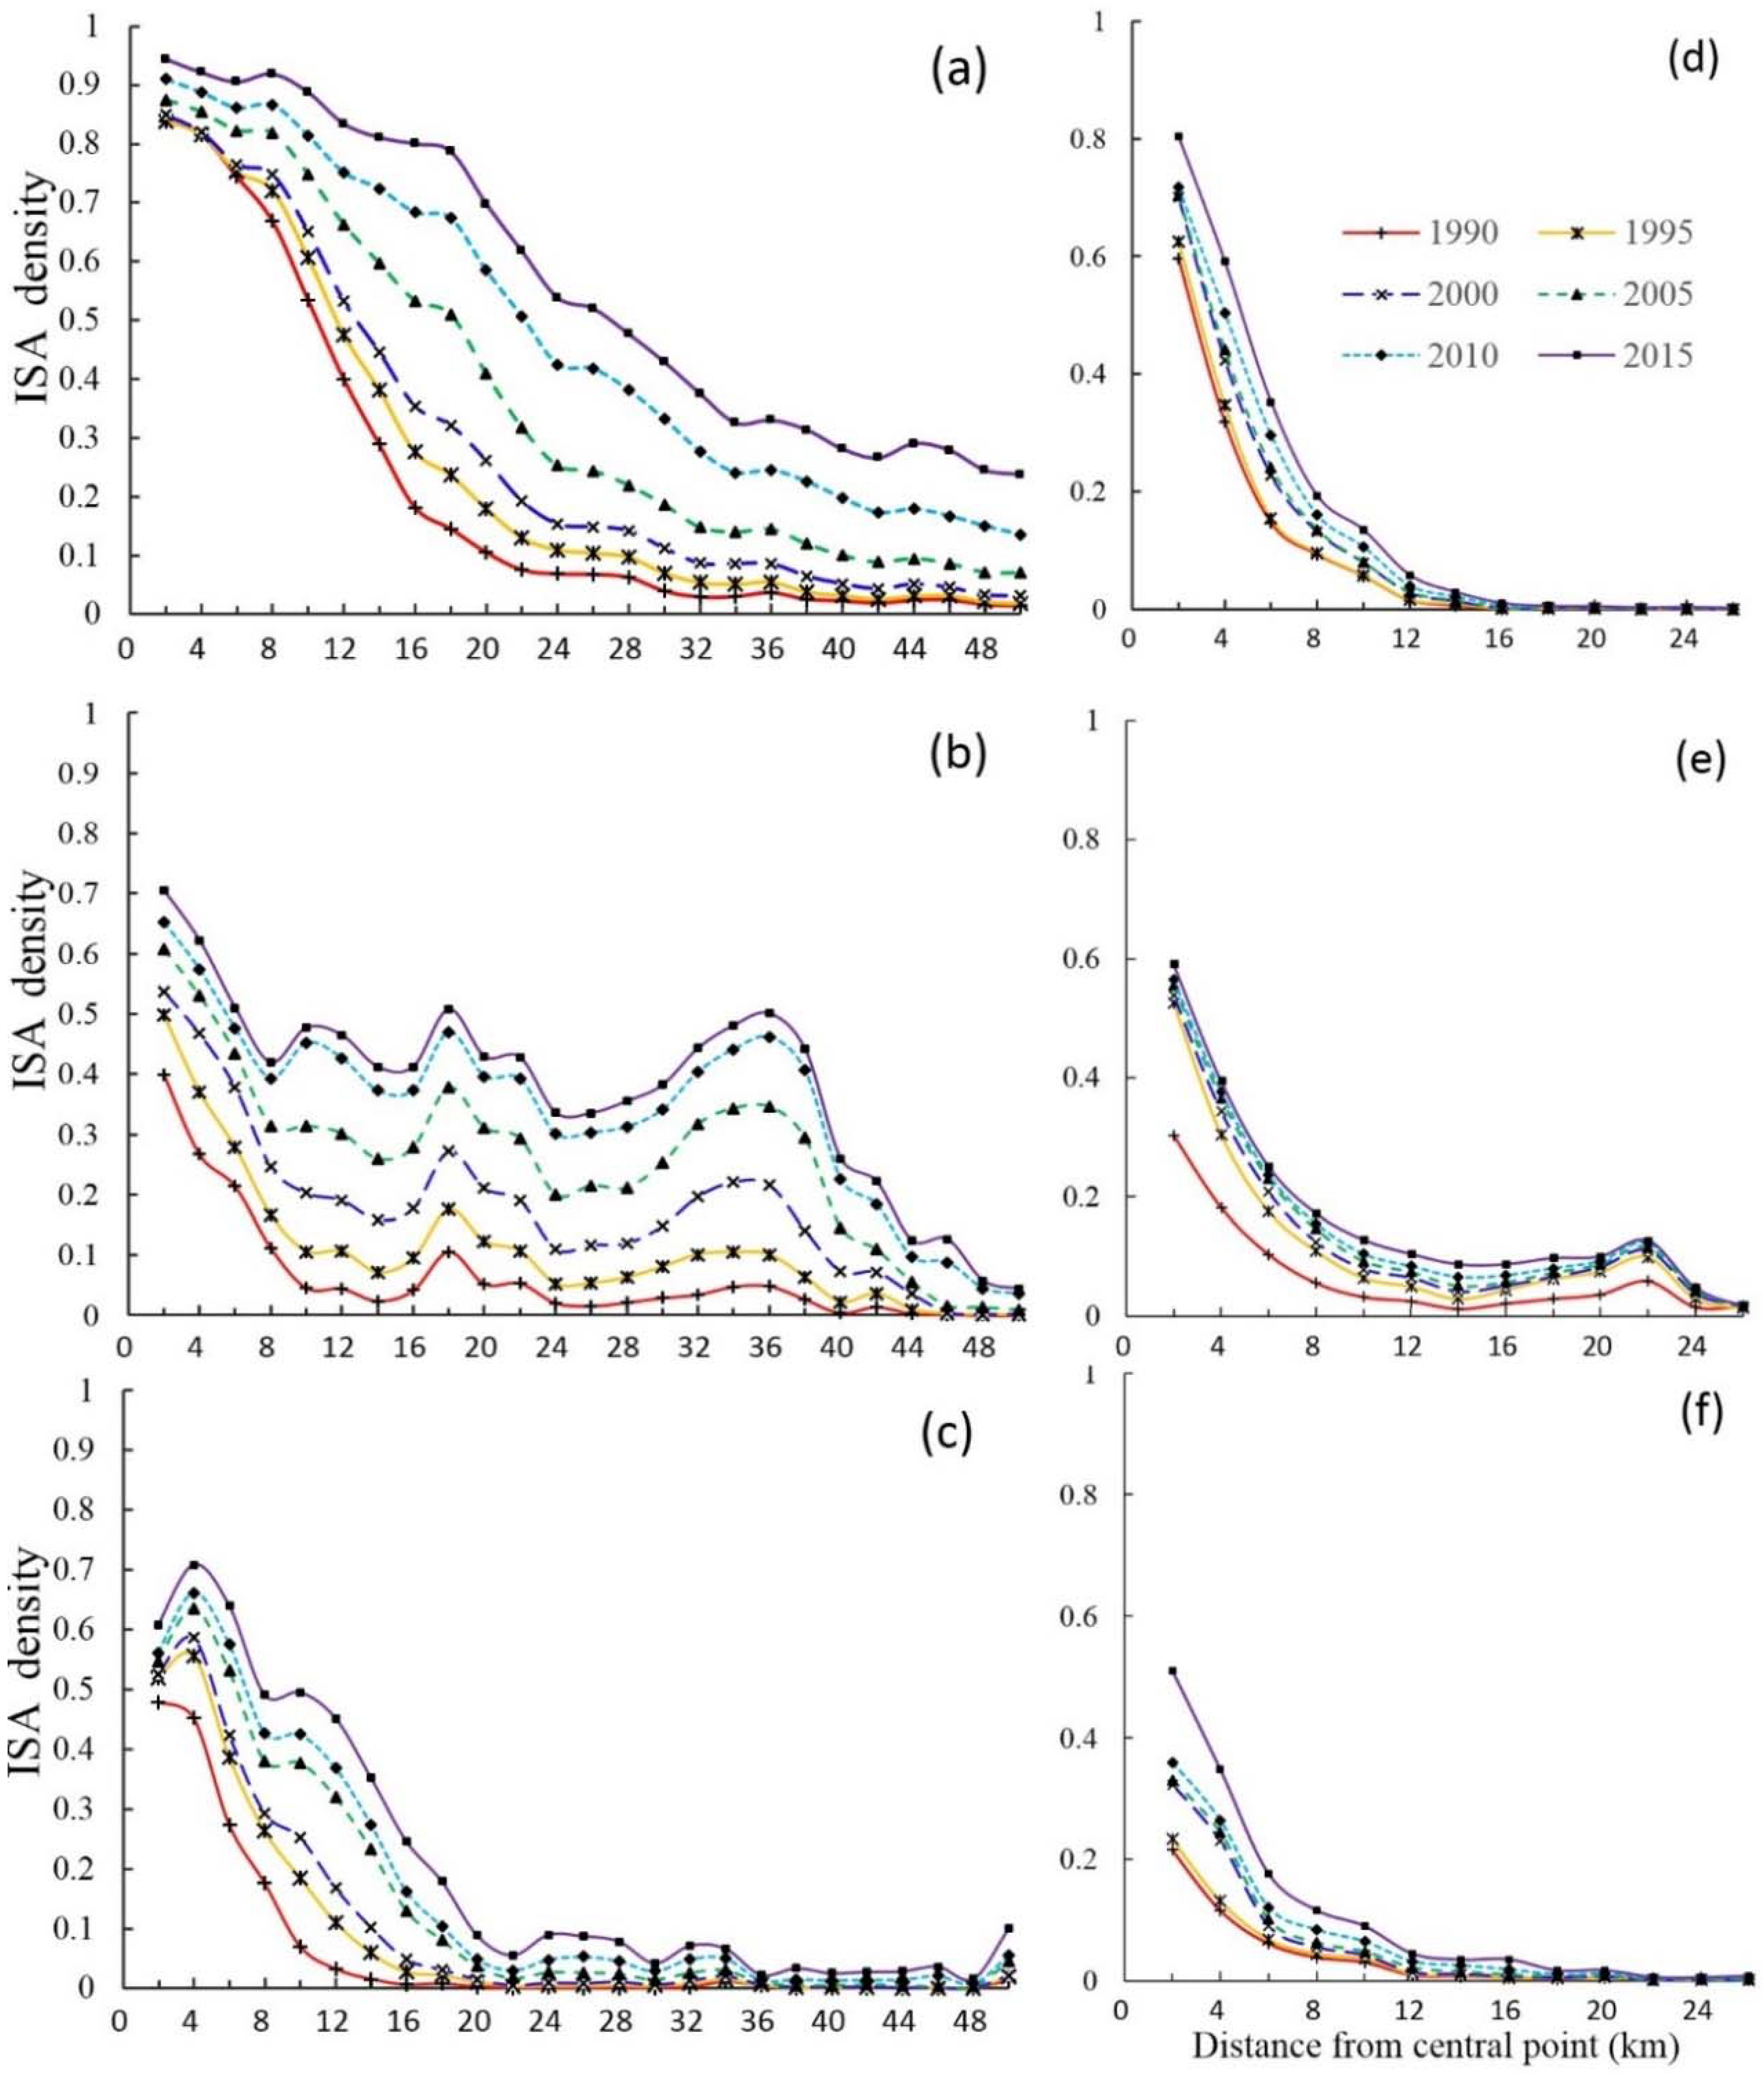
4.1. Imprevious Surface Area Spatial Distribution and Its Dynamic Change

The accuracy assessment results for ISA (Table 3) indicate that overall accuracy of 94–95% for all the metropoles in 2015 was obtained, and producer’s accuracy of 87–93% and user’s accuracy of 89–95% were achieved. Although no accuracy assessments for other years’ ISA mapping results were conducted, previous research [43] had proved that this approach for ISA mapping is robust and reliable, and we are confident that the ISA mapping in this research is also reliable. All the ISA results were used for analysis of urban dynamics. Figure 4 illustrates the spatial distribution of the six metropoles, showing their very different spatial patterns of urban distribution and expansion in the recent 25-year period.
The statistical data of the ISA mapping results for each metropolis from 1990 to 2015 (Figure 5) indicated that Shanghai and Vientiane had the highest and lowest ISA amounts and densities, respectively. Considering ISA amount, Shanghai had over 600 km2 in 1990, and other cities had ISA amounts of only 20–88 km2. After 1995, the ISA in Shanghai increased rapidly to 3180 km2 in 2015, followed by Shenzhen with 731 km2 and HCMC with 424 km2, while the ISA amounts in the inland cities increased much more slowly. Considering ISA density, Shanghai had the largest increase from about 100 thousand m2/km2 in 1990 to about 500 thousand m2/km2 in 2015, followed by Shenzhen from only 44 thousand m2/km2 in 1990 to 367 thousand m2/km2 in 2015. Lanzhou had slightly higher ISA density than Shenzhen in 1990, but increased more slowly than Shenzhen (only 98 thousand m2/km2 in 2015). HCMC had lower ISA density than Lanzhou in 1990 but was similar in 1995 and increased much faster after 1995, reaching 181 thousand m2/km2 in 2015. Ulaanbaatar and Vientiane had much lower ISA densities and only 28.2 and 18.5 thousand m2/km2, respectively, in 2015. A comparative analysis of ISA amounts and densities of these metropoles (Figure 5) indicated that (i) coastal metropoles overall had much faster ISA expansion rates than inland metropoles, (ii) Shanghai had a much higher ISA amount than the other two coastal cities and much higher ISA density than Shenzhen, except for similar densities in 2000 and 2005, and (iii) the inland metropoles had similar growth trends, with Lanzhou at the highest rate and Vientiane at the lowest.
The ISA spatial distribution from the urban central point to a distance of 50 km in coastal metropoles and to 26 km in inland metropoles, considering the sizes of each metropolis (Figure 6), indicated that the ISA density increased over time but reached different distances depending on the original sizes of specific metropoles. For example, Shanghai had an ISA density of over 0.8 in the central area within a distance of 4 km in 1990, but reached 18 km in 2015; no other metropolis in this study had an ISA density so high, even in a central urban area. The ISA density decreased sharply from 0.8 at 4 km to only 0.1 at 22 km in 1990, but ISA was over 0.2 even at a distance of 50 km after 2010. Shanghai experienced a rapid increase of ISA density in the region within the distance of 12–30 km in 2000–2005, and in the region from 12 km to even 50 km after 2005. This implies the overall rapid expansion in different regions around the central area. For Shenzhen, some small peaks of ISA density existed at different distances, such as in the central part and 10, 18, and 36 km from the center. The ISA density quickly decreased from the central area to the distance of 8 km in 1990–2015. The ISA density in 2000–2010 increased much faster than during other periods in the region between 8 km and 40 km. The ISA density in HCMC had relatively high values in the region from the central part to 20 km, with the highest peak at 4 km. In 2000–2005, the ISA density between 8 km and 16 km increased more than in any other time periods in the region. Of the three coastal metropoles, Shenzhen had much different spatial patterns of ISA distribution compared with Shanghai and HCMC. The probable reason is due to the impacts of topography as shown in Figure 4. Comparing with coastal metropoles (Figure 6a–c) that had wide ISA distributions away from their urban cores, the inland metropoles (Figure 6d–f) had narrow ISA spatial distributions. For example, the ISA density decreased sharply from the central part to 16 km in Ulaanbaatar and Vientiane, but Ulaanbaatar had higher ISA density from its central part to 8 km. Although Lanzhou had a sharp decrease from the central part to 8 km, higher ISA density occurred in the region from 8 to 26 km than the other two inland metropoles.
The changed areas in Table 4 indicate that coastal metropoles had much higher increased ISA (346.5–2564.3 km2) than inland metropoles (52.3–81.5 km2) between 1990 and 2015, and the urbanization rates (416–728% and 104–252%, respectively) were similar in being higher and lower. In particular, Shanghai had the highest increased area with 2,564 km2, and Vientiane had the lowest with only 52 km2. Considering the urbanization rate, Shenzhen had the highest rate of 728%, followed by HCMC and Shanghai with 445% and 416%, respectively, while Lanzhou had the lowest rate of only 104%, with Ulaanbaatar also low at only 128%. According to the increased ISAs and urbanization rates, coastal metropoles had much higher values than inland metropoles. The ISA and urbanization rates for the same city varied during interval periods. For example, Shanghai had the highest increased area of over 200 km2 in all detection periods, reaching 829 km2 in 2005–2010, whereas Shenzhen and HCMC had the highest increased areas in 2000–2005. In contrast, Ulaanbaatar and Vientiane had the lowest increased areas with less than 5.1 km2 in the periods of 1990–1995 and 2000–2005, and Lanzhou had the lowest increased areas of only 12.6 km2 in 2000–2010. In urbanization rates, Shenzhen had the highest rate of about 100% in 1990–1995 but decreased continuously to only 10.1% in 2010–2015. For the inland metropoles, the urbanization rates had trends similar to the ISA change trends, and Vientiane had higher urbanization rates than Ulaanbaatar and Lanzhou after 1995.
The urban ISA expansions at five-year intervals from 1990 to 2015 among the six metropoles (Figure 7) indicate that they occurred mainly around the urban central regions at the early stage, and urban centers then expanded with obviously different spatial patterns and rates in different metropoles due to different developing stages. The coastal metropoles had much faster urbanization rates, due to the advantages of geolocations and favorable policies, than the inland metropoles, due to the constraints of topography and transportation. For example, Shanghai’s urban area in 1990 was mainly located on the west side of Huangpu River, while urban expansion in 1995–2000 occurred mainly in the Pudong new development region, on the east side of the river. After 2000, urbanization was mainly located in the suburban regions. The urbanization in Shenzhen was mainly driven by the national policies of special economic zones. The urban area in 1990 was located mainly in the south part of the city and rapidly expanded along the flat terrain in 1995–2010. After 2010, urban expansion was much slower due to the constraints of topography. The urban center in HCMC was mainly located on the west side of Saigon River. Compared with Shanghai and Shenzhen, urbanization was much slower in HCMC. In 1990–2000, urban expansion was mainly in the suburban regions, and after 2000, it occurred much faster than before and grew to the west and northeast of HCMC. The urbanization in inland metropoles was much slower than in the coastal metropoles. The urban expansions in Ulaanbaatar and Lanzhou were constrained by mountains, so they extended along flat areas in the valleys, as shown in Figure 4. The urban center in Vientiane was mainly located along the northeast part of the Mekong River. Due to the city’s relatively small population, urban expansion was much slower.

4.2. Impacts of Physical Conditions

Previous analysis (e.g., Table 4, Figure 5) showed different urbanization rates among these metropoles but did not tell how physical conditions, such as topography, influenced urban expansion amounts and spatial patterns. The 3D images in Figure 4 clearly show that urban ISA distribution and expansion patterns in Ulaanbaatar and Lanzhou were mainly distributed along valleys in an east–west direction due to the mountains to the north and south. The topography in Shenzhen also affected the spatial pattern of urban distribution and expansion. This implies topography is an important factor restricting urban ISA distribution and spatial expansion patterns. Figure 8 illustrates the ISA distribution along elevation over time. Overall, urban expansion mainly occurred in the first two elevation ranges according to the slope b values in the linear regression models. In particular, coastal metropoles had much higher b values in the first two elevation ranges than inland metropoles, implying that coastal metropoles had much higher urban expansion rates than inland metropoles. Among coastal metropoles, Shanghai and HCMC had similar ISA expansion trends but Shanghai had much higher b values than HCMC, implying higher urban expansion rate. The b values in each elevation range in Shenzhen were 5.5–8.7, implying that urban expansion occurred in all elevation ranges. In the inland metropoles, b values indicated that the urban expansion in Ulaanbaatar occurred mainly in the first two elevation ranges and in Lanzhou and Vientiane mainly in the first range, but Lanzhou had a slightly higher urban expansion rate than Ulaanbaatar and Vientiane in the first range.
The relationship between ISA and slope over time (Figure 9) indicates that overall, the majority of increased ISAs were located in the regions with slope of less than 10° (the first two slope ranges) based on b values. In particular, coastal metropoles had much higher b values than inland metropoles. Shanghai and HCMC had almost the same trends with the majority of urban expansions within the slope of less than 5°, but Shanghai had much higher b values, implying it had a much higher urban expansion rate than HCMC. In Shenzhen, many urban expansions occurred on slopes between 5° and 10°. In contrast, inland metropoles had high proportions of ISA expansion in regions with slopes of less than 10°, especially in Ulaanbaatar and Lanzhou, which are located in valleys between mountains with high elevations. Overall, Lanzhou had the highest b value and Vientiane had the lowest, implying that Lanzhou had a higher ISA expansion rate than the other two.
Another important factor that restricted urban ISA expansion was rivers. For example, Huangpu River in Shanghai stopped ISA expansion to the east side before 1990 (Figure 4a1), Saigon River limited HCMC to its west (Figure 4c1), and Mekong River made Vientiane expand to the northeast (Figure 4f1). Figure 10 indicates urban centers were located mainly in one side of the rivers in the early stage but expanded to the other side over time. For example, the ISA in Shanghai in 1990 was mainly distributed in Puxi (west side of Huangpu River), and very limited ISA was in Pudong. Since initiation of the development policy for Pudong’s new economic zone, urban construction shifted to the east side and extended to the creation of Pudong International Airport. The World Exposition event and construction of Shanghai Disney Resort in recent years resulted in rapid ISA expansion in the Pudong region. With the urban development from 1990 to 2015, ISA density in Pudong was even higher than in Puxi (Figure 10a). Similar to Shanghai, the ISA in HCMC was mainly distributed on the west side of Saigon River but almost no ISA was on the east side before 2000. However, since 2000, ISA on the east side rapidly expanded, resulting in similar ISAs within the 5 km buffer zone (Figure 10b). The big difference was that the ISA in HCMC expanded mainly in the 2–3 km buffer zone, while there were still paddy rice fields within the 1 km buffer zone.
The ISA in Ulaanbaatar was mainly distributed in the north side within the 2–5 km buffer zone away from the river. There were many non-ISAs (bare soils, sand/rocks, and grass) within the 1 km zone from the river, and the ISA density there was less than 0.2. The main ISA expansion was to the north, while the ISA expansion to the south was very slow, mainly near the airport with ISA density of less than 0.2 (Figure 10c). In Lanzhou, the urban area was mainly distributed in the southern region within 1–5 km from Yellow River in 1990. Since then, urban expansion has occurred in an eastern direction, south of the river, and western direction on both sides of the river (Figure 10d). In recent years, more ISA expansion has occurred on the north side of the westerner part of the city. Figure 11 indicates that rivers were constraining factors that limited ISA expansion from one side to the other. However, bridges diminished the constraints and promoted urban expansion over time to both sides of the rivers. For example, in the 1990s, Huangpu River in Shanghai caused ISA distribution on the west and east sides to be considerably different (Figure 11a1 vs. Figure 11a2). A similar situation in HCMC with Saigon River made ISA density much higher on the west side than east side (Figure 11b1 vs. Figure 11b2). However, the construction of bridges on these rivers between 1990 and 2015 rapidly promoted ISA expansion on both sides, especially on the east sides of both metropoles. In the inland metropoles, Tuul River in Ulaanbaatar restrained ISA expansion to the south side (Figure 11c2), and Yellow River in Lanzhou restrained ISA expansion to the north side (Figure 11d1). The improvement of economic conditions, population increase, and urban planning and policies may have played important roles in ISA expansion along the rivers. This is especially true considering the coastal and inland metropoles in our study; that is, the good economic conditions in Shanghai and HCMC in the past decade created much faster ISA expansion on both sides of the rivers than in Ulaanbaatar and Lanzhou, which have very poor economic conditions.

5. Discussion

5.1. Analysis of Spatial Patterns and Expansion Rates

Examining spatial patterns of urban land-cover distribution and dynamic change was often based on the urban land-cover classification results using pixel-based classification [4,43]. Because of the complexity of urban land-cover composition and limitation of remotely sensed data in spectral and spatial resolution, pixel-based classification approaches may produce poor classification results [15]. Subpixel-based approaches, such as spectral mixture analysis, have been proven more accurate in area statistics than pixel-based approach [7]. However, different seasons of multispectral imagery can produce different fractional results [44], resulting in the difficulty in detection of urban land cover change. Therefore, change detection based on fractional results has not been commonly used in reality due to different biases caused by seasonal variation [45,46]. In order to avoid this difficulty, this research used a hybrid approach consisting of spectral mixture analysis, vegetation indices, and cluster analysis to extract ISA data for examining spatial patterns and rates of urban expansion in the Asian metropoles. This approach produced accurate ISA mapping results, providing the fundamental data source for further analysis of urbanization. However, current research on urban spatial patterns and expansion takes only the horizontal features into account without including vertical features, like tall commercial and residential buildings. Future research should integrate both horizontal and vertical ISA features to better understand urbanization patterns. Since lidar data are extensively used for extraction of building heights, the use of multisource data such as Landsat and lidar will be valuable for examining urbanization in 3D features.

5.2. Examining Forces Driving Urban Expansion

Human-induced factors, such as migration of population from rural to urban and associated economic conditions, have long been regarded as important factors affecting urban expansion [47,48,49,50,51,52,53]. However, population and economic data for some years might not be available, especially for cities in developing countries, such as Vientiane in Laos and HCMC in Vietnam. In reality, physical conditions such as topography and rivers may have long-term effects that directly restrain the spatial patterns of urban expansion, especially in the development stages when economic conditions are not good enough and technologies are not advanced enough to reduce these barriers. This research has showed that slopes and rivers are critical factors influencing urban expansion, as the majority of urban areas are located in regions with slopes less than 10°. Rivers can directly restrict the urban expansion on one side, as illustrated in Figure 11, if no bridges are available. This research has also shown that bridges play an important role in the spatial patterns and extent of urban expansion. However, the construction of bridges is often related to other factors, such as urban planning and economic conditions. More research is needed to examine how bridges in different construction stages affect urbanization patterns and rates, and further affect urban planning and management.
Policies and important events (e.g., World Exposition in Shanghai) may considerably influence the spatial patterns and rates of urban expansion, but they are difficult to examine quantitatively. Some important urban planning policies and important events in a metropolis, such as the examples summarized in Table 5, may play critical roles in the spatial patterns of urban expansion. While it is hard to quantify their effects on urbanization, we may qualitatively observe the effects by comparing conditions before and after events or enactments of policies. For example, the launch of Pudong New Economic Zone policy led to faster urbanization in Shanghai’s Pudong. After the “two prominent projects” (Table 5), the urban expansion rate of HCMC obviously increased. The construction of large transportation stations, such as high-speed railway stations, airports, and new college towns, may considerably influence urban expansion in specific regions; examples here include the construction of Pudong International Airport in Shanghai and Shenzhen Bao’an International Airport, which have extended ISA to surrounding areas, and the construction of new bridges, such as Nanpu and Yangpu that facilitated new development in Pudong. Meanwhile, the market force and the grassroots desire for development contributed to the rapid expansion of non-agricultural land. Typically, these forces are often intermingled with one another [54].

5.3. Comparative Analysis between Coastal and Inland Metropoles

The coastal and inland metropoles share common features but also show differences regarding the spatial patterns of urban expansions and their driving/restricting forces. Both the coastal and inland metropoles expanded a significant amount of ISA over the recent 25-year study period, but in general coastal metropoles were larger and have expanded much faster than inland metropoles. This is consistent with other comparative studies [4,18], mainly because coastal cities own geographic advantages (e.g., port resources, transportation services, and flat terrain) and political priorities (Table 5). Topography and rivers can be restrictive factors for all cities, but the effects of topography on inland cities is more observable because coastal cities generally have flatter terrain and smaller elevation ranges (Figure 4, Figure 8, and Figure 9). More comprehensively comparative analyses of the physical and human dimensions in coastal and inland cities will be needed in the future to better understand how different developing stages affect the spatial patterns and rates of urban expansion and further affect urban sustainability.

6. Conclusions

Examining spatial patterns of urban expansion and urbanization rate, as well as exploring the forces driving urbanization, have long been important research topics for understanding the planning and sustainability of urban landscapes. Urbanization was often examined under land-cover classification using multitemporal remotely sensed images. This research examined the spatial patterns and rates of urban expansion among six Asian metropoles using multitemporal Landsat images through extraction of ISA data using a hybrid approach, and confirmed that ISA data can be accurately mapped with overall accuracy of 94–95%. The accurate results provided the fundamental data source for examining urbanization over time. The results showed that coastal metropoles had much higher urbanization rates than inland metropoles, and the spatial patterns and rates of urban expansion varied, depending on different developing stages, which were related to economic conditions, in addition to the constraints from the physical conditions, such as topography and rivers.
Population and economic conditions are often regarded as important forces driving urban expansion. In reality, physical conditions, such as topography and rivers, are also important factors directly restraining urban expansion. This research indicated that urban distribution and expansion mainly occurred in the regions with slopes of less than 10 degrees. Rivers can directly restrain urban expansion to one side or the other, while bridges enable urban expansion on both sides of a river, and can alter its spatial patterns. The relationship of topography and rivers with urban expansion provides new insights for urban planning and sustainability. More research is needed to examine how different physical conditions at different development stages affect the spatial patterns and rates of urban expansion.

Author Contributions

Conceptualization, D.L., P.F. and E.M.; Methodology, D.L., L.L. and G.L.; Software, L.L. and G.L.; Validation, L.L. and G.L.; Formal Analysis, L.L., G.L., D.L. and Z.O.; Investigation, L.L. and G.L.; Resources, L.L., G.L. and Z.O.; Data Curation, L.L.; Writing-Original Draft Preparation, D.L., L.L. and G.L.; Writing-Review & Editing, D.L., P.F., Z.O. and E.M.; Visualization, D.L.; Supervision, D.L.; Project Administration, P.F.; Funding Acquisition, P.F. and D.L.

Funding

This research was funded by Zhejiang Agriculture & Forestry University’s Research and Development Fund grant number [2013FR052].

Acknowledgments

The authors would like to thank Zhuli Xie and Yuyun Chen for their support in remote sensing data processing, and thank Joanna Broderick for her English grammar editing.

Conflicts of Interest

The authors declare no conflict of interest.

References

  1. Kuang, W.; Liu, J.; Zhang, Z.; Lu, D.; Xiang, B. Spatiotemporal dynamics of impervious surface areas across China during the early 21st century. Sci. Bull. 2013, 58, 1691–1701. [Google Scholar] [CrossRef]
  2. Schneider, A.; Chang, C.; Paulsen, K. The changing spatial form of cities in western China. Landsc. Urban Plan. 2015, 135, 40–61. [Google Scholar] [CrossRef]
  3. Feng, Y.; Lu, D.; Moran, E.; Dutra, L.; Calvi, M.F.; De Oliveira, M.A.F. Examining spatial distribution and dynamic change of urban land covers in the Brazilian Amazon using multitemporal multisensor high spatial resolution satellite imagery. Remote Sens. 2017, 9, 381. [Google Scholar] [CrossRef]
  4. Kuang, W.; Chi, W.; Lu, D.; Dou, Y. A comparative analysis of megacity expansions in China and the U.S.: Patterns, rates and driving forces. Landsc. Urban Plan. 2014, 132, 121–135. [Google Scholar] [CrossRef]
  5. Lu, D.; Weng, Q. Urban classification using full spectral information of Landsat ETM+ imagery in Marion County, Indiana. Photogramm. Eng. Remote Sens. 2005, 71, 1275–1284. [Google Scholar] [CrossRef]
  6. Lu, D.; Li, G.; Kuang, W.; Moran, E. Methods to extract impervious surface areas from satellite images. Int. J. Dig. Earth 2014, 7, 93–112. [Google Scholar] [CrossRef]
  7. Lu, D.; Moran, E.; Hetrick, S. Detection of impervious surface change with multitemporal Landsat images in an urban-rural frontier. ISPRS J. Photogramm. Remote Sens. 2011, 66, 298–306. [Google Scholar] [CrossRef] [PubMed]
  8. Lu, D.; Weng, Q. Use of impervious surface in urban land-use classification. Remote Sens. Environ. 2006, 102, 146–160. [Google Scholar] [CrossRef]
  9. Arnold, C.L.; Gibbons, C.J. Impervious surface: The emergence of a key urban environmental indicator. J. Am. Plan. Assoc. 1996, 62, 243–258. [Google Scholar] [CrossRef]
  10. Carlson, T.N.; Arthur, S.T. The impact of land use—Land cover changes due to urbanization on surface microclimate and hydrology: A satellite perspective. Glob. Planetary Chang. 2000, 25, 49–65. [Google Scholar] [CrossRef]
  11. Brabec, E.; Schulte, S.; Richards, P.L. Impervious surfaces and water quality: A review of current literature and its implications for watershed planning. J. Plan. Lit. 2002, 16, 499–514. [Google Scholar] [CrossRef]
  12. Jennings, D.B.; Jarnagin, S.T. Changes in anthropogenic impervious surfaces, precipitation and daily streamflow discharge: A historical perspective in a mid-atlantic subwatershed. Landsc. Ecol. 2002, 17, 471–489. [Google Scholar] [CrossRef]
  13. Kaufmann, R.K.; Seto, K.C.; Schneider, A.; Liu, Z.; Zhou, L.; Wang, W. Climate response to rapid urban growth: Evidence of a human-induced precipitation deficit. J. Clim. 2007, 20, 2299–2306. [Google Scholar] [CrossRef]
  14. Wu, C.; Murray, A.T. Estimating impervious surface distribution by spectral mixture analysis. Remote Sens. Environ. 2003, 84, 493–505. [Google Scholar] [CrossRef]
  15. Lu, D.; Weng, Q. A survey of image classification methods and techniques for improving classification performance. Int. J. Remote Sens. 2007, 28, 823–870. [Google Scholar] [CrossRef] [Green Version]
  16. Bagan, H.; Yamagata, Y. Land-cover change analysis in 50 global cities by using a combination of Landsat data and analysis of grid cells. Environ. Res. Lett. 2014, 9, 064015. [Google Scholar] [CrossRef] [Green Version]
  17. Fan, P.; Yue, W.; Messina, J.; Huang, H.; Li, X.; Verburg, P.; Qi, J. Urban Expansion in Asia: Evaluation, Spatial Determinants, and Future Scenarios; Asian Development Bank Project “Urbanization in Asia”; Asian Development Bank: Manila, Philippines, 2012. [Google Scholar]
  18. Schneider, A.; Mertes, C.M. Expansion and growth in Chinese cities, 1978–2010. Environ. Res. Lett. 2014, 9, 024008. [Google Scholar] [CrossRef] [Green Version]
  19. Fan, P.; Chen, J.; John, R. Urbanization and environmental change during the economic transition on the Mongolian Plateau: Hohhot and Ulaanbaatar. Environ. Res. 2016, 144, 96–112. [Google Scholar] [CrossRef] [PubMed] [Green Version]
  20. Park, H.; Fan, P.; John, R.; Chen, J. Urbanization on the Mongolian Plateau after economic reform: Changes and causes. Appl. Geogr. 2017, 86, 118–127. [Google Scholar] [CrossRef]
  21. Zhao, M.; Cai, H.; Qiao, Z.; Xu, X. Influence of urban expansion on the urban heat island effect in Shanghai. Int. J. Geogr. Inf. Syst. 2016, 30, 2421–2441. [Google Scholar] [CrossRef]
  22. Sha, Y.; Wu, J.; Ji, Y.; Chan, S.L.T.; Wei, Q.L. Shanghai Urbanism at the Medium Scale; Springer: Berlin/Heidelberg, Germany, 2014. [Google Scholar]
  23. Dou, P.; Chen, Y. Dynamic monitoring of land-use/land-cover change and urban expansion in Shenzhen using landsat imagery from 1988 to 2015. Int. J. Remote Sens. 2017, 38, 5388–5407. [Google Scholar] [CrossRef]
  24. Qian, J.; Peng, Y.; Luo, C.; Wu, C.; Du, Q. Urban land expansion and sustainable land use policy in Shenzhen: A case study of China’s rapid urbanization. Sustainability 2015, 8, 16. [Google Scholar] [CrossRef]
  25. Yang, Y.; Shi, P.; Liu, Y.; Xie, F. A study on the pattern of land cover during rapid urbanization: Shenzhen city as a case study. Acta Ecol. Sin. 2003, 23, 1832–1840. [Google Scholar]
  26. Doan, Q.V.; Kusaka, H.; Ho, Q.B. Impact of future urbanization on temperature and thermal comfort index in a developing tropical city: Ho Chi Minh City. Urban Clim. 2016, 17, 20–31. [Google Scholar] [CrossRef]
  27. Kontgis, C.; Schneider, A.; Fox, J.; Saksena, S.; Spencer, J.H.; Castrence, M. Monitoring peri-urbanization in the greater Ho Chi Minh city metropolitan area. Appl. Geogr. 2014, 53, 377–388. [Google Scholar] [CrossRef]
  28. Son, N.T.; Chen, C.F.; Chen, C.R.; Thanh, B.X.; Vuong, T.H. Assessment of urbanization and urban heat islands in Ho Chi Minh city, Vietnam using Landsat data. Sustain. Cities Soc. 2017, 30, 150–156. [Google Scholar] [CrossRef]
  29. Seo, D.; Kwon, Y. In-migration and housing choice in Ho Hhi Minh city: Toward sustainable housing development in Vietnam. Sustainability 2017, 9, 1738. [Google Scholar] [CrossRef]
  30. Byambadorj, T.; Amati, M.; Ruming, K.J. Twenty-first century nomadic city: Ger districts and barriers to the implementation of the Ulaanbaatar City master plan. Asia Pac. Viewpoint 2011, 52, 165–177. [Google Scholar] [CrossRef]
  31. Long, P. Mongolia’s Capital Copes with Rapid Urbanization; The Asia Foundation: San Francisco, CA, USA, 2017; Available online: https://asiafoundation.org/2017/05/31/mongolias-capital-copes-rapid-urbanization/ (accessed on 20 May 2018).
  32. USIP2. Community Dialogue Tool Kit for Ger Areas, Mongolia: Resource Materials for Community Dialogue; World Bank Working Paper; World Bank: Ulaanbaatar, Mongolia, 2006. [Google Scholar]
  33. Denyer, S. Along the New Silk Road, a City Built on Sand Is a Monument to China’s Problems. Available online: https://www.washingtonpost.com/world/asia_pacific/along-the-new-silk-road-a-city-built-on-sand-is-a-monument-to-chinas-problems/2016/05/29/982424c0-1d09-11e6-82c2-a7dcb313287d_story.html?utm_term=.db5d2cb63ad1 (accessed on 20 May 2018).
  34. Yang, Y.; Meng, Q.; Mccarn, C.; Cooke, W.H.; Rodgers, J.; Shi, K. Effects of path dependencies and lock-ins on urban spatial restructuring in China: A historical perspective on government’s role in Lanzhou since 1978. Cities 2016, 56, 24–34. [Google Scholar] [CrossRef]
  35. Szczudliktatar, J. China’s new Silk Road diplomacy. PISM Policy Pap. 2013, 34, 1–8. [Google Scholar]
  36. Askew, M.; Logan, W.S.; Long, C. Vientiane: Transformations of a Lao landscape; Routledge: New York, NY, USA, 2006. [Google Scholar]
  37. Okamoto, K.; Sharifi, A.; Chiba, Y. The Impact of Urbanization on Land Use and the Changing Role of Forests in Vientiane; Springer: Tokyo, Japan, 2014; pp. 29–38. [Google Scholar]
  38. Rafiqui, P.S.; Gentile, M. Vientiane. Cities 2009, 26, 38–48. [Google Scholar] [CrossRef]
  39. Sharifi, A.; Chiba, Y.; Okamoto, K.; Yokoyama, S.; Murayama, A. Can master planning control and regulate urban growth in Vientiane, Laos? Landsc. Urban Plan. 2014, 131, 1–13. [Google Scholar] [CrossRef]
  40. Foody, G.M. Classification accuracy comparison: Hypothesis tests and the use of confidence intervals in evaluations of difference, equivalence and non-inferiority. Remote Sens. Environ. 2009, 113, 1658–1663. [Google Scholar] [CrossRef] [Green Version]
  41. Congalton, R.G.; Green, K. Assessing the Accuracy of Remotely Sensed Data: Principles and Practices, 2nd ed.; CRC Press: Boca Raton, FL, USA, 2008. [Google Scholar]
  42. Li, L.; Lu, D.; Kuang, W. Examining urban impervious surface distribution and its dynamic change in Hangzhou metropolis. Remote Sens. 2016, 8, 265–285. [Google Scholar] [CrossRef]
  43. Lu, D.; Li, G.; Moran, E.; Hetrick, S. Spatiotemporal analysis of land-use and land-cover change in the Brazilian Amazon. Int. J. Remote Sens. 2013, 34, 5953–5978. [Google Scholar] [CrossRef] [PubMed] [Green Version]
  44. Wu, C.; Yuan, F. Seasonal sensitivity analysis of impervious surface estimation with satellite imagery. Photogramm. Eng. Remote Sens. 2007, 73, 1393–1401. [Google Scholar] [CrossRef]
  45. Sexton, J.O.; Song, X.P.; Huang, C.; Channan, S.; Baker, M.E.; Townshend, J.R. Urban growth of the Washington, D.C.–Baltimore, md metropolitan region from 1984 to 2010 by annual, Landsat-based estimates of impervious cover. Remote Sens. Environ. 2013, 129, 42–53. [Google Scholar] [CrossRef]
  46. Wang, P.; Huang, C.; Eric, B.D.C. Mapping 2000–2010 impervious surface change in India using global land survey Landsat data. Remote Sens. 2017, 9, 366. [Google Scholar] [CrossRef]
  47. Chen, M.; Zhang, H.; Liu, W.; Zhang, W. The global pattern of urbanization and economic growth: Evidence from the last three decades. PLoS ONE 2014, 9, e103799. [Google Scholar] [CrossRef] [PubMed]
  48. Gibson, J.; Li, C.; Boegibson, G. Economic growth and expansion of China’s urban land area: Evidence from administrative data and night lights, 1993–2012. Sustainability 2014, 6, 7850–7865. [Google Scholar] [CrossRef]
  49. Henderson, V. The urbanization process and economic growth: The so-what question. J. Econ. Growth 2003, 8, 47–71. [Google Scholar] [CrossRef]
  50. Ma, Y.; Xu, R. Remote sensing monitoring and driving force analysis of urban expansion in Guangzhou city, China. Habitat Int. 2010, 34, 228–235. [Google Scholar] [CrossRef]
  51. Xiao, J.; Shen, Y.; Ge, J.; Tateishi, R.; Tang, C.; Liang, Y.; Huang, Z. Evaluating urban expansion and land use change in Shijiazhuang, China, by using GIS and remote sensing. Landsc. Urban Plan. 2006, 75, 69–80. [Google Scholar] [CrossRef]
  52. Yue, W.; Liu, Y.; Fan, P. Measuring urban sprawl and its drivers in large Chinese cities: The case of Hangzhou. Land Use Policy 2013, 31, 358–370. [Google Scholar] [CrossRef]
  53. Yue, W.; Zhang, L.; Liu, Y. Measuring sprawl in large Chinese cities along the Yangtze River via combined single and multidimensional metrics. Habitat Int. 2016, 57, 43–52. [Google Scholar] [CrossRef]
  54. Tian, L.; Ge, B.; Li, Y. Impacts of state-led and bottom-up urbanization on land use change in the peri-urban areas of shanghai: Planned growth or uncontrolled sprawl? Cities 2017, 60, 479–486. [Google Scholar] [CrossRef]
Figure 1. Locations of the six metropoles selected for study, three coastal (Shanghai and Shenzhen in China, and Ho Chi Minh City in Vietnam) and three inland (Ulaanbaatar in Mongolia, Lanzhou in China, and Vientiane in Laos).
Remotesensing 10 01101 g001
Figure 2. Framework for mapping impervious surface area (ISA) distribution, examining spatial patterns of urban expansion, and analyzing the impacts of physical conditions on urban expansion among the six metropoles selected for study.
Remotesensing 10 01101 g002
Figure 3. Flowchart for mapping impervious surface using the hybrid approach (note: NDVI and MNDWI represent Normalized Difference Vegetation Index and Modified Normalized Difference Water Index and LSMA represents linear spectral mixture analysis).
Remotesensing 10 01101 g003
Figure 4. Spatial distribution of impervious surface expansions showing the important roles of topography and rivers on urban expansion patterns and rates; (a,a1) Shanghai, (b,b1) Shenzhen, (c,c1) Ho Chi Minh City, (d,d1) Ulaanbaatar, (e,e1) Lanzhou, and (f,f1) Vientiane.
Remotesensing 10 01101 g004
Figure 5. Comparison of total ISA and ISA density among six Asian metropoles.
Remotesensing 10 01101 g005
Figure 6. Comparative analysis of the ISA density distributions along the buffer zones among six Asian metropoles; (a) Shanghai, (b) Shenzhen, (c) Ho Chi Minh City, (d) Ulaanbaatar, (e) Lanzhou, and (f) Vientiane.
Remotesensing 10 01101 g006
Figure 7. Spatial distribution of urban ISA expansion from 1990 to 2015 at five-year intervals for six Asian metropoles; (a) Shanghai, (b) Shenzhen, (c) Ho Chi Minh City, (d) Ulaanbaatar, (e) Lanzhou, and (f) Vientiane.
Remotesensing 10 01101 g007
Figure 8. The change in ISA over time based on four elevation ranges; (a) Shanghai, (b) Shenzhen, (c) Ho Chi Minh City, (d) Ulaanbaatar, (e) Lanzhou, and (f) Vientiane; 1, 2, 3, 4 represent four elevation ranges based on elevations of the metropoles (<10, 10–20, 20–30, and >30 m for Shanghai and Ho Chi Minh City; <20, 20–40, 40–60, and >60 m for Shenzhen because of its relatively higher elevations; considerably different elevation ranges among the three inland cities require different ranges in the analysis: <1300, 1300–1400, 1400–1500, and >1500 m for Ulaanbaatar; <1600, 1600–1700, 1700–1800, and >1800 m for Lanzhou; and <160, 160–180, 180–200, and >200 m for Vientiane).
Remotesensing 10 01101 g008
Figure 9. The change in ISA over time based on four slope categories; (a) Shanghai, (b) Shenzhen, (c) Ho Chi Minh City, (d) Ulaanbaatar, (e) Lanzhou, and (f) Vientiane.
Remotesensing 10 01101 g009
Figure 10. Comparison of the impact of rivers on urbanization spatial patterns between coastal and inland metropoles; examples are (a) Shanghai, (b) Ho Chi Minh City, (c) Ulaanbaatar, and (d) Lanzhou.
Remotesensing 10 01101 g010
Figure 11. The ISA density expansions in the buffer zones away from the rivers; (a1,a2) represent the west and east sides, respectively, of Huangpu River, Shanghai; (b1,b2) represent the west and east sides, respectively, of Saigon River, Ho Chi Minh City; (c1,c2) represent the north and south sides, respectively, of Tuul River, Ulaanbaatar; and (d1,d2) represent the north and south sides, respectively, of Yellow River, Lanzhou.
Remotesensing 10 01101 g011
Table 1. Summary of major characteristics of the six selected metropoles.
MetropolisGeographic LocationClimate ConditionPopulation and Economic Conditions
Shanghai, ChinaLocated in Yangtze delta, East China, a flat region with average elevation of 4 m; total area of 6341 km2Subtropical humid monsoon climate with four distinct seasons (average annual temperature of 17.6 °C and precipitation of 1173 mm)Population of 24.15 million; GDP per capita of 16,000 USD in 2015
Shenzhen, ChinaLocated on the eastern bank of Pearl River, southern China; total area of 1992 km2Subtropical maritime climate (average annual temperature of 22.4 °C and precipitation of 1933 mm)Population of 11.38 million; GDP per capita of 23,664 USD in 2015
Ho Chi Minh City, VietnamLocated in southeastern Vietnam, a flat region with average elevation of 19 m; total area of 2348 km2Tropical maritime monsoon climate with dry season in December–April and rainy season in May–November (average annual temperature of 27.5 °C and precipitation of 2000 mm)Population of 8.24 million; GDP per capita of 5426 USD in 2015
Ulaanbaatar, MongoliaLocated in north-central Mongolia at elevation 1351 m in a valley on the Tuul River; total area of 4134 km2Typical inland climate with annual mean temperature of −2.9 °C and precipitation around 200–220 mmPopulation of 1.37 million; GDP per capita of 3923 USD in 2015
Lanzhou, ChinaLocated in central Gansu Province, western China; total area of 1625 km2Temperate continental climate with annual mean temperature of 10.3 °C and mean precipitation of 300 mmPopulation of 2.66 million; GDP per capita of 8765 USD in 2015
Vientiane, LaosLocated on the banks of Mekong River near the border with Thailand; total area of 3938 km2Tropical savanna climate with distinct wet (April–November) and dry seasons (November–March); annual precipitation was around 1660 mm; hottest month (May) has an average temperature of 29 °C and the coldest month (January) of 22 °CPopulation of 0.82 million; GDP per capita of 4784 USD in 2016
GDP represents Gross Domestic Product.
Table 2. Landsat TM/ETM+/OLI data used in this research.
MetropolisPath/RowAcquisition Date
Shanghai118/383 August 2015, 27 December 2010, 27 November 2005, 6 June 2000, 20 December 1996, 22 February 1991
118/393 August 2015, 17 July 2009, 27 November 2005, 6 June 2000, 12 August 1995, 14 August 1990
Shenzhen122/4418 October 2015, 2 November 2009, 23 November 2005, 14 September 2000, 24 October 1994, 13 December 1989
121/448 August 2015, 29 October 2010, 5 May 2005, 05 September 2000, 26 March 1995, 19 October 1991
Ho Chi Minh City125/5224 January 2015, 11 February 2010, 11 December 2005, 21 June 2000, 2 February 1995, 3 January 1990
124/5317 January 2015, 4 February 2010, 26 March 2005, 15 March 2001, 27 February 1995, 17 March 1990
Ulaanbaatar131/2714 August 2015, 3 October 2010, 14 May 2005, 13 September 2000, 7 August 1995, 10 September 1990
Lanzhou131/352 January 2015, 28 July 2010, 30 May 2005, 14 July 2000, 19 July 1995, 25 June 1990
Vientiane128/4828 October 2015, 21 April 2010, 7 April 2005, 16 September 2000, 23 February 1995, 29 March 1990
Table 3. Accuracy assessment results of impervious surface area (ISA) mapping of the six selected metropoles in 2015.
MetropolisTypeReference DataProducer’s AccuracyUser’s AccuracyOverall Accuracy
ISANon-ISA
ShanghaiISA919909194
Non-ISA101909595
ShenzhenISA955879594
Non-ISA141869793
Ho Chi Minh cityISA928919294
Non-ISA91919696
UlaanbaatarISA937919395
Non-ISA91919696
LanzhouISA955909595
Non-ISA101909795
VientianeISA8911938994
Non-ISA71939597
Table 4. Comparison of impervious surface change area and urbanization rates among six metropoles.
MetropolisChanged Area (km2)Urbanization Rate (%)
1990–19951995–20002000–20052005–20102010–20151990–20151990–19951995–20002000–20052005–20102010–20151990–2015
Shanghai200.9252.3539.5829.0742.62564.332.630.950.551.530.5416.5
Shenzhen88.6140.5176.4170.566.9642.9100.379.455.634.510.1728.1
Ho Chi Minh City58.735.5102.253.097.1346.575.426.059.419.329.7445.4
Ulaanbaatar2.818.32.918.623.065.55.534.04.024.824.6128.2
Lanzhou18.316.612.612.521.581.523.417.211.110.015.6104.4
Vientiane3.08.85.111.623.852.314.537.015.730.948.4252.7
Table 5. Summary of major policies and important events among the six selected metropoles.
MetropolisImportant Events and Policies
Shanghai1990–1993: initiated policies to establish Pudong New Economic Zone
1990–2000: redeveloped old urban regions (moved industries out; reduced population density in central business district (CBD); redeveloped former industry region, old business streets, old residential area) and constructed Pudong’s new area
1991: Nanpu and Yanpu bridges
1997: Xupu bridge
2006–2010: Shanghai Hongqiao Comprehensive Transport Hub
2010: World Exposition in Shanghai
2010: Regional Planning of Yangtze River Delta was approved
Shenzhen1980: First Master Plan of Shenzhen Special Economic Zone (SEZ)
1986: Second Master Plan of Shenzhen SEZ (1985–2000) proposed a multicenter–cluster–belt urban structure, composed of Nantou, Luohu-Shangbu, and Shatoujiao Clusters
1996: Shenzhen Bao’an International Airport
2000: Third Master Plan of Shenzhen approved by State Council
2010: Master Plan of Shenzhen (2010–2020) was approved for economic zone–national economic city–global metropolis
Ho Chi Minh City1986: created market-oriented economy
2003: two prominent projects—Thu Thiem City Centre as a key development zone for a new CBD and Phu My Hung Urban Area as part of the Saigon South project
Ulaanbaatar1990: Mongolia began its transition to a market-based economy, nomads relocated to Ulaanbaatar due to the harsh Mongolian climate of droughts and dzuds (bitterly cold winters); the dzuds of 1991–2002 killed about 8.4 million livestock; a survey found that 14% of the nomad population (about 14,000 households and 70,000 people) moved to Ulaabaatar because they had lost their livelihoods; the 2010 dzuds killed about 7.8 million livestock (17% of the national total), and around 20,000 people moved to Ulaanbaatar
Lanzhou1999: China Western Development was proposed by the Chinese government; this economic zone covers several administrative areas of Gansu Province
2010: Gansu Province launched Lanzhou-Baiyin Economic Zone to stimulate its regional economic development by integrating cities and industrial bases
2015: One Belt, One Road initiative was implemented; Lanzhou is an important hub connecting northwestern China and other countries along the Silk Road
Vientiane1986: a market economy was introduced in Laos, and migration from rural areas to Vientiane soared; the population of Vientiane, which topped half a million in the 1990s, reached one million in the 2010

