Towards Reconstructing 3D Buildings from ALS Data Based on Gestalt Laws
by
 , ,
, ,
Pingbo Hu
1 ,
,
Bisheng Yang
1,*,
Zhen Dong
1,
Pengfei Yuan
1,
Ronggang Huang
2,
Hongchao Fan
3 and
Xuan Sun
4 1
State Key Laboratory of Information Engineering in Surveying, Mapping and Remote Sensing, Wuhan University, Wuhan 430079, China
2
State Key Laboratory of Geodesy and Earth’s Dynamics, Institute of Geodesy and Geophysics of CAS, Wuhan 430077, China
3
School of Remote Sensing and Information Engineering, Wuhan University, Wuhan 430079, China
4
Zhou Enlai School of Government, Nankai University, Tianjin 300071, China
*
Author to whom correspondence should be addressed.
Remote Sens. 2018, 10(7), 1127; https://doi.org/10.3390/rs10071127
Submission received: 19 June 2018
/
Revised: 9 July 2018
/
Accepted: 13 July 2018
/
Published: 17 July 2018
(This article belongs to the Special Issue 3D Modelling from Point Clouds: Algorithms and Methods)
Abstract
:3D building models are an essential data infrastructure for various applications in a smart city system, since they facilitate spatial queries, spatial analysis, and interactive visualization. Due to the highly complex nature of building structures, automatically reconstructing 3D buildings from point clouds remains a challenging task. In this paper, a Roof Attribute Graph (RAG) method is proposed to describe the decomposition and topological relations within a complicated roof structure. Furthermore, top-down decomposition and bottom-up refinement processes are proposed to reconstruct roof parts according to the Gestalt laws, generating a complete structural model with a hierarchical topological tree. Two LiDAR datasets from Guangdong (China) and Vaihingen (Germany) with different point densities were used in our study. Experimental results, including the assessment on Vaihingen standardized by the International Society for Photogrammetry and Remote Sensing (ISPRS), show that the proposed method can be used to model 3D building roofs with high quality results as demonstrated by the completeness and correctness metrics presented in this paper.
1. Introduction
Reconstruction of 3D building models has received intensive attention due to the demand for 3D building models in many applications related to urban planning and smart cities. Many of the methods and algorithms have been proposed and implemented to reconstruct 3D models using laser scanning point clouds and images with automated or interactive operators [1,2] in the field of photogrammetry and computer graphics [2,3,4,5,6,7], producing 3D building models at a city scale [8,9,10] and building scale [11,12]. Although progress has been achieved in the 3D reconstruction of buildings, robust reconstructing of detailed 3D building models still face challenging issues due to input data quality issues, Level of Detail (LoD) requirements, the complexity of reconstructing structures, and the limited development of existing algorithms [6,13]. Reconstructing of 3D buildings must meet the demanding requirements in both photo-realistic visualization and spatial computing. Hence, the structures of buildings must be explicitly maintained in the reconstructed 3D models. Existing 3D building reconstruction methods, however, struggle to meet the present requirements on visualization and spatial computing, and are still in the phase of development [14].
Among the huge array of reconstruction methods proposed in the literature, the methods for reconstructing 3D buildings from point clouds can be classified into three types, including data-driven methods, model-driven methods, and hybrid-driven methods. The data-driven 3D reconstruction methods assume that a building is a polyhedral model, thus, each individual element can be reconstructed directly based on the geometric information. This method involves the extraction of planar patches using region growing [15,16], model fitting [17,18,19], feature clustering [20,21], or global energy optimization [22,23,24], and then reconstructs 3D building models with the extracted patches through intersection and step edge generation. In addition, regularization rules are usually applied to enhance these reconstructed models [25,26]. A variety of approaches [27,28,29,30,31] using a Digital Surface Model (DSM), aerial images, LiDAR data, and various combinations of these approaches are proposed for building reconstruction and have yielded good results, especially for complex buildings. However, these methods require accurate building outlines or ground planes (DSM or Digital Elevation Model-DEM), which are not always available and are often outdated. The main advantage of the data-driven approach is that it can reconstruct polyhedral buildings with complex shapes, while the drawback is its sensitivity to the incompleteness in point clouds arising from occlusion, shadows, and missing information.
The model-driven methods search and fit the building point clouds to the most appropriate models from a predefined Constructive Solid Geometry (CSG)-based model library [32,33,34], but only relatively simple blocks are deployed in the early stages of reconstruction. These models can be combined with simple CSG primitives by Boolean set operators, such as intersection, subtraction, and union operations, to construct a more complex building. The Reversible Jump Markov Chain Monte Carlo (RJMCMC) method was used to assemble and fit the 3D parametric blocks to the input data [35]. This method using predefined 3D building models performs effectively, but is time-consuming. Haala and Kada [36] decompose complicated buildings into multiple objects based on the elevations, and then combines them into a whole model, which performs well in automatic reconstruction over a relatively large scale. In addition, the automatic decomposition and reconstruction of complex buildings is difficult, thus, external information, such as ground plans or building footprints, are usually adopted [9,27,31,37,38]. The model-driven methods are robust when reconstructing buildings as prior knowledge, such as parallel and symmetry, can be easily combined to create a watertight geometric model of buildings. However, roof shapes in the physical world are diverse, and these methods fail when a to-be-processed roof cannot be described by using any of the pre-defined primitives.
Hybrid-driven methods [2,6,9,13] are gradually attracting attention due to the shortcomings in both of the approaches discussed and the growing need for accurate 3D building models. Hybrid methods combine data-driven and model-driven methods to reconstruct 3D buildings using Roof Topology Graphs (RTG). The RTG is a graph that describes the primitives of a roof together with their associated topologies. A vertex in an RTG represents a roof plane, and an edge stands for the mutual relationship between the two planes. Once an RTG is constructed, a search and fitting process is performed in the predefined library to recognize appropriate building primitive models. Verma et al. [39] were the first to introduce such an idea by using the normal vector as an attribute mark in RTG, but the model type was limited to a few simple primitives, which significantly reduces its application. Oude Elbrerink and Vosselman [40] expanded the library of the parametric primitives and added more attributes (e.g., convexity or concavity) to reconstruct objects through sub-graph matching, but this approach was prone to errors stemming from sub-graph mismatches. An RTG can be used to interpret building structures and distinguish roof features [41,42,43]. Moreover, circle graph analysis using minimal-close and outer-most circles derived from an RTG are turned to be more adaptive than the former (traditional RTG) [6,13,44]. Other research has explored means to track improvements in the reliability and availability of RTGs, enhacing them to handle complicated buildings [41,44]. Recently, Xu et al. [45] proposed a hierarchical roof topology tree (HRTT), instead of the traditional RTG, to represent the topological relationships among different roof elements. HRTT can improve the quality of the topology and produce more accurate results, but does not permit meaningful interpretation of roof structures. Rychard et al. [6] proposed an automated method to avoid multiple matching of the same roof elements, and to interpret the semantic knowledge inherent in roof elements based on the RTG database. Nevertheless, the hybrid-driven methods based on the RTG are error-prone (e.g., incomplete roof plane extraction or mismatches of sub-graphs). The primitives stored in the RTG library are rather limited and cannot describe all building types in the physical world. Moreover, they cannot meaningfully interpret the roof structures of buildings or maintain valid topologies.
The main purpose of this paper is to introduce a new way to recognize and interpret 3D building models from a raw point cloud that combines meaningful structures, as expressed by a hierarchical topology tree. Special emphasis is put on the refinement of the reconstruction process that can cope with incomplete data. The main contributions of the proposed method are listed as follows:
- (1)
- A Roof Attribute Graph (RAG) is proposed to describe the roof planar topology, laying a good foundation for 3D building reconstruction without a predefined library; and
- (2)
- top-down progressive grouping and a bottom-up refinement are introduced to generate a hierarchical structural model, which can cope with incomplete data and can be directly and intuitively used in photo-realistic visualization and spatial computing.
Following the introduction, the proposed method is elaborated in Section 2. Datasets and experimental results are presented in Section 3, and a discussion, including the quality assessment analysis by the International Society for Photogrammetry and Remote Sensing (ISPRS) [14], are provided in Section 4, followed by the conclusions and directions for future research.
2. Methodology
2.1. Overview of the Proposed Method
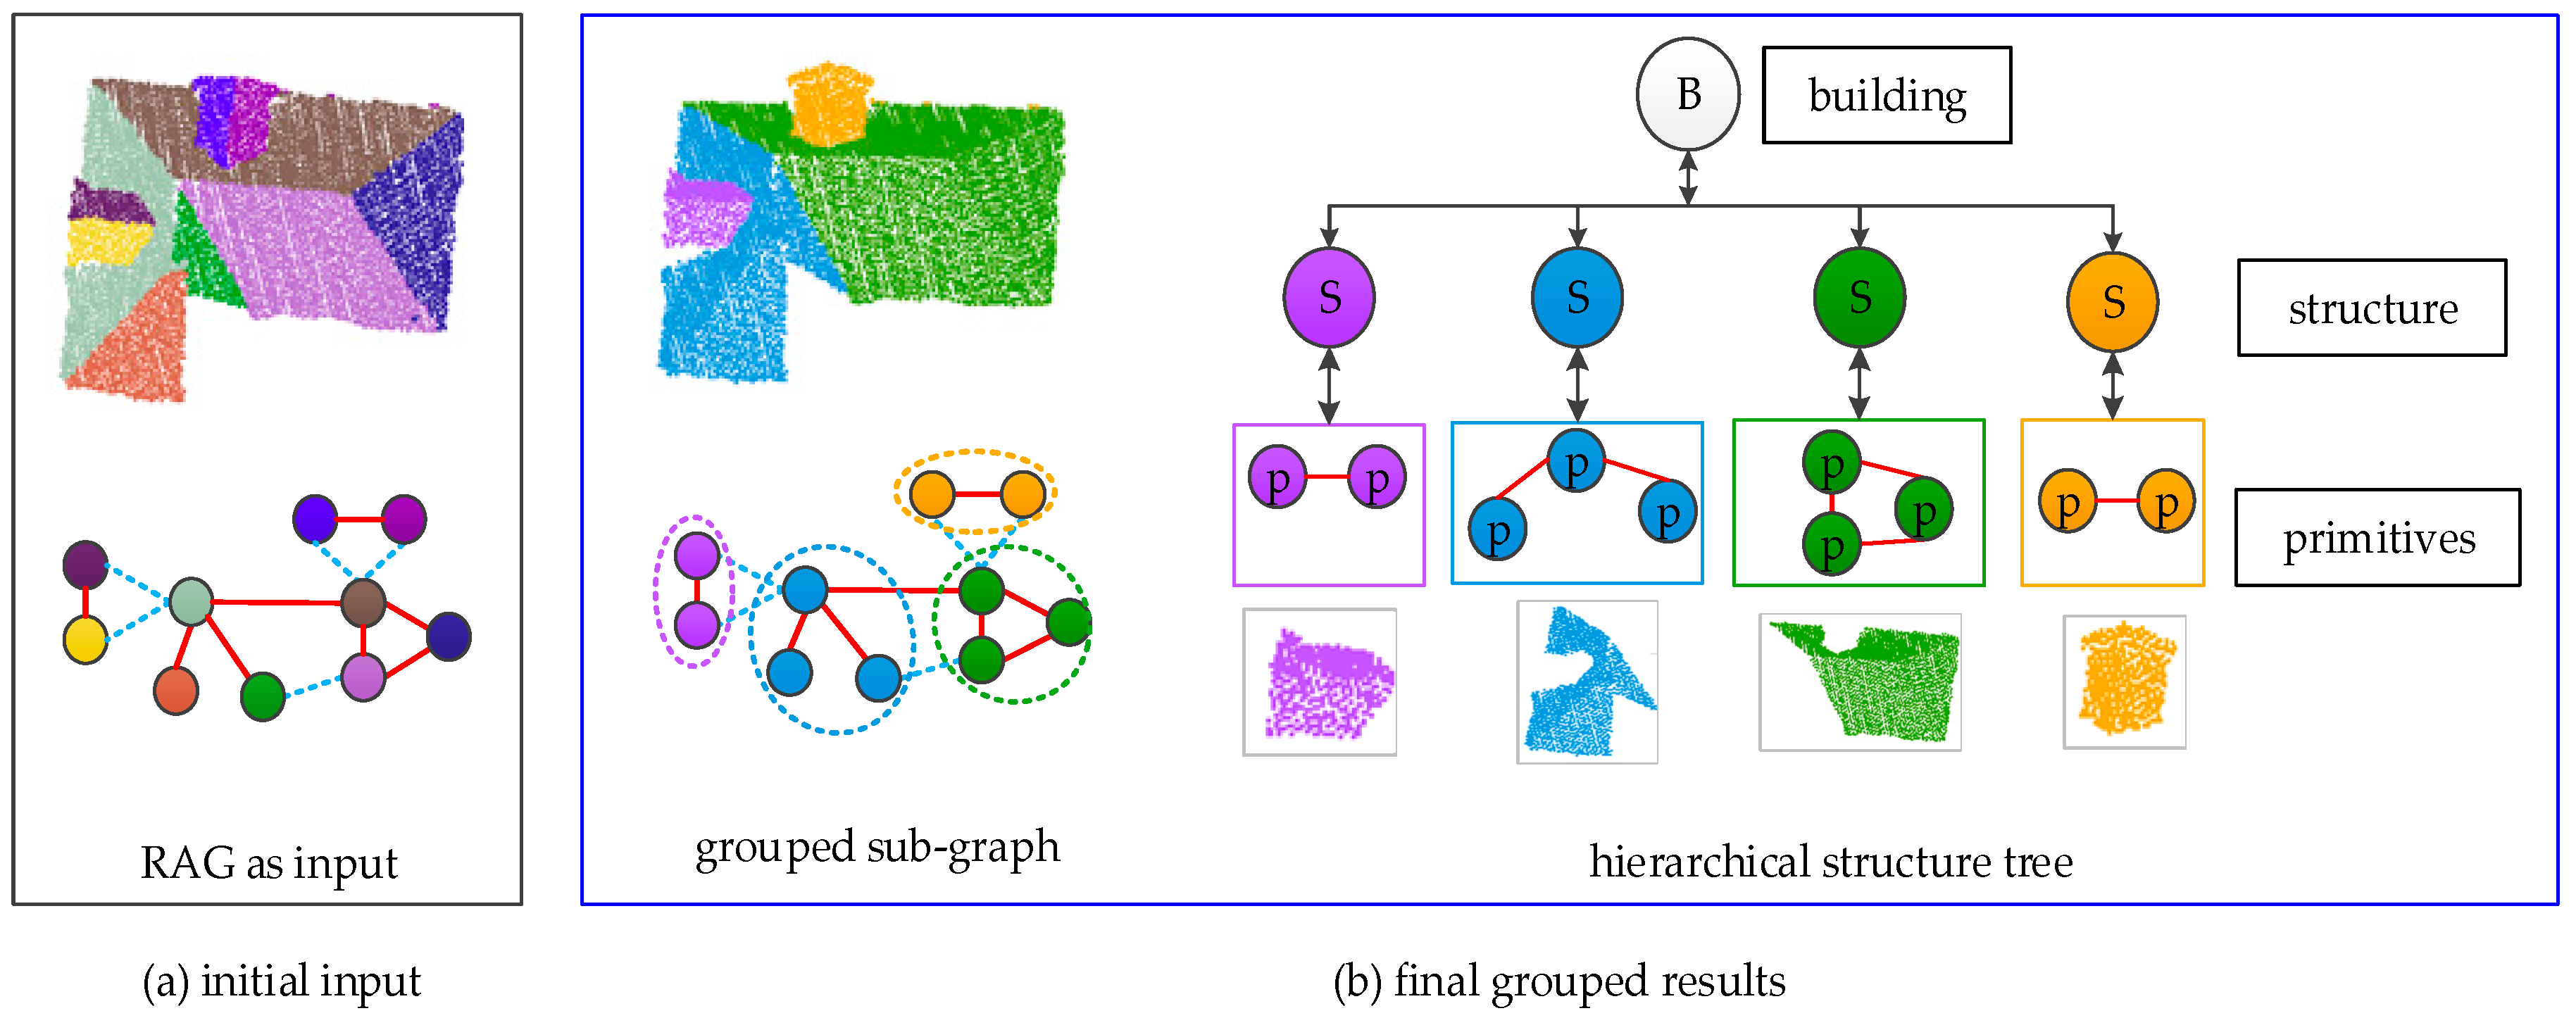
A flowchart of the proposed building reconstruction scheme is illustrated in Figure 1. Taking the building point cloud as the input, a preprocessing step, including roof extraction and segmentation, was adopted for the roof point clouds (a). A Roof Attribute Graph (RAG) was generated between the roof planes (b), and planar segments were grouped into a meaningful structure based on the RAG and an unambiguous top-down decomposition (c). To enhance the grouped structures and construct a set of visually completed 3D models, bottom-up refinement was adopted. The final output contains hierarchical roof structures with their associated topology (d). The Gestalt laws for the reconstruction were proximity, similarity, continuity, and closure. Detailed information about the preprocessing steps on the roof extraction and segmentation can be found in [46].
In this pipeline, the grouping and enhancement were performed in an iterative manner. In the grouping stage, plane primitives were grouped step-by-step from the RAG according to the Gestalt laws, resulting in an initial roof structure. In the refinement stage, each group structure was enhanced based on the Gestalt laws, obtaining a visual-pleased 3D model and hierarchical structure tree. The RAG (Figure 1b) was used for the top-down grouping (structure extraction), while the grouped sub-graph (Figure 1c) was processed in the bottom-up refinement. The RAG and sub-graph were defined as follows.
The RAG is a logical model of building structures, as shown in Figure 1b, which is represented by an undirected weighted graph, C. A vertex in C represents a segmented planar primitive, while an edge between two vertices indicates that these two primitives were spatially connected. In addition, the Euclidian distance between the two planar primitives was calculated as the weight, and the convex or concave attributes between the linked edges were marked as associated topological attributes.
A sub-graph, named a structure, was derived from the RAG, as illustrated in Figure 1c. The structure is an unambiguous meaningful convex box, which consists of parametric primitives and satisfies the principles of Gestalt, like proximity, regularity, and closure.
2.2. Construction of RAG for Roof Hierarchical Structures
In this section, the representation of building roofs using an RAG is introduced in Section 2.2.1, and the generation of an RAG and hierarchical structure grouping based on the Gestalt principles are described in Section 2.2.2.
2.2.1. Roof Representation and the Gestalt Laws
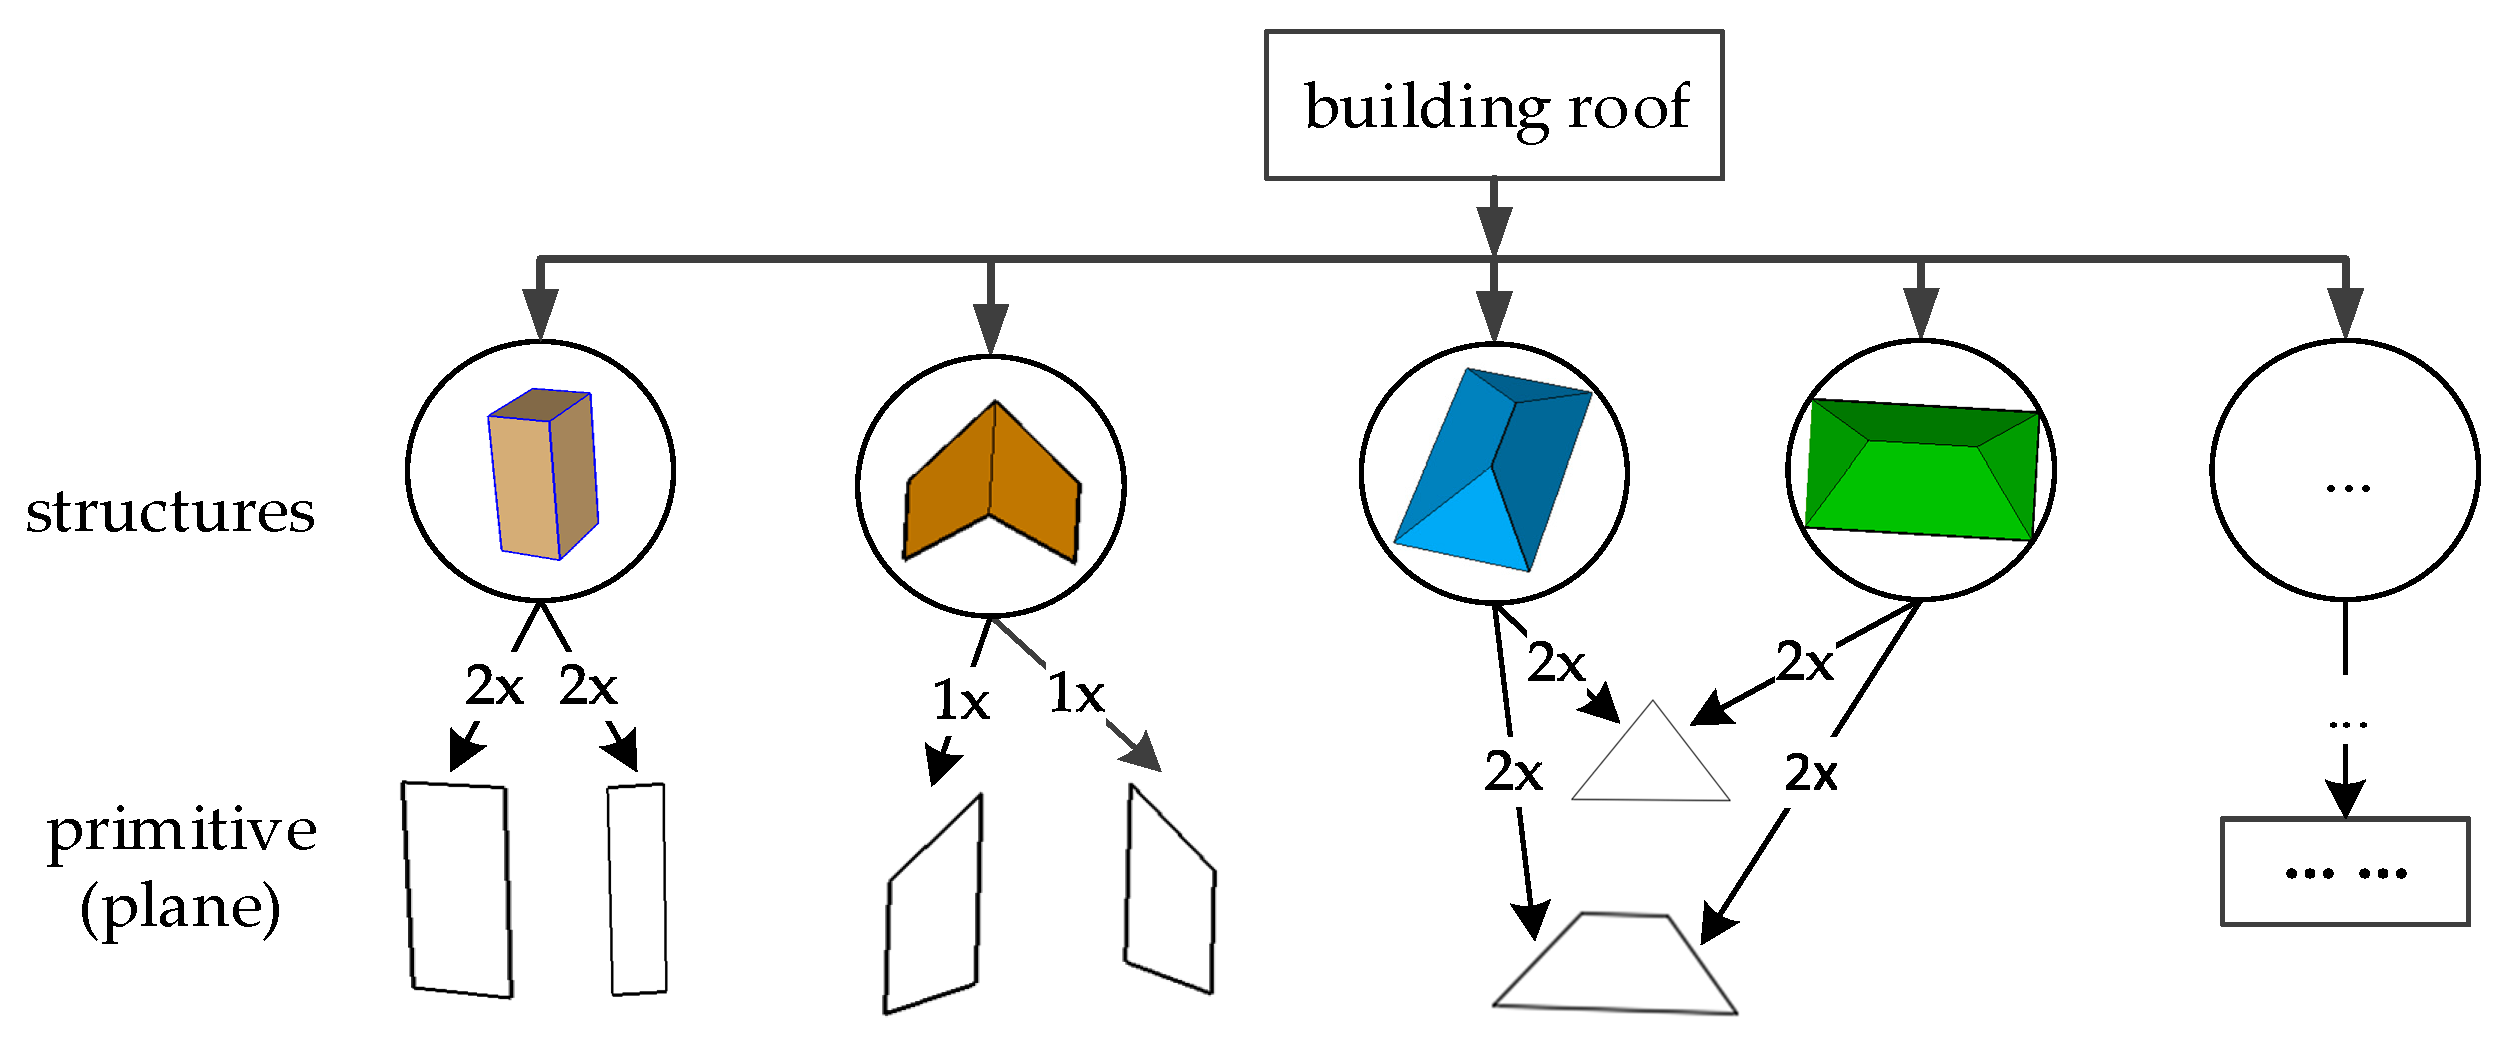
Every complicated building can be reconstructed from a set of simple and meaningful structural models, which consists of various parameterized primitives based on an RAG. As presented in Figure 2, these grouped sub-graphs can be combined into a hierarchical structure tree for the building roof. The tree root stands for the whole model, while the structures and extracted roof primitives can be taken as child nodes or leaves. A structure can be a combination of two or more parametric planar primitives, or even a continuous surface. In this paper, we examine the structured scenes, where planes are the main objects, and are organized as a vertex of the RAG.
To group the sub-graph (roof structures) and construct a more detailed and meaningful RAG, the Gestalt laws [47,48,49] were introduced, which summarize how humans perceive the form, model, and semantics of each part of a roof. The rules are described as follows:
Law-1: Proximity (Fd)—primitives that are closer together can be regarded as one group. We defined two planes as adjacent when the associated boundaries intersect as a line.
Law-2: Similarity (Fcon)—primitives that share visual characteristics, such as shape, convexity, or concavity, form a perceptive group. The Fcon is calculated by:
where the normal and centroids of two planes are and , . The convex and concave attributes are illustrated in Figure 3.
Law-3: Continuity (Fcc)—preference for continuous convexity/concavity, and shapes are aligned as one group. Figure 4 demonstrates how plane A and B are only labeled as one group if they satisfy one of two conditions. Plane A and B are linked with a convex edge in an RAG (a), and if a shared plane, S, exists between current planes or a neighboring group of planes (b). The connection attribute, Fcon, between the two pairs must be the same.
Law-4: Closure (Fo)—if a shape is indicated, the whole group is obtained by filling in the missing data, thus, closing simple figures, and closure produces a meaningful and pleasant-visualization of a structural model.
Following application of these Gestalt laws, the segmented primitives from the preprocessing stage [46] were used to construct the RAG, which itself had no structural information. Thus, a hierarchical grouping strategy for roof structures was proposed based on the RAG.
2.2.2. Hierarchical Structure Grouping Using RAG
To find the meaningful structures from the RAG and generate a hierarchical tree of a building, a progressive iterative grouping algorithm was proposed, as illustrated in Figure 5, where the sub-graphs for building structures are represented by different colors.
The hierarchical tree was obtained in an iterative manner. The principles were organized as in Table 1. In each iteration, we decomposed the RAG using the progressive grouping method and updated the hierarchical tree with grouped structures, eventually reaching a stable state.
To find a plausible decomposition of roof structures from the RAG, a progressive grouping was used, which was aimed at searching and finding the best set of planar primitives that potentially belonged to the same group (a structure). One iteration of the grouping process to find a roof structure is illustrated in Figure 6.
It can be seen from Figure 6 that grouped structures were achieved in an iterative manner. The details for one iteration of the grouping are as follows:
- (1)
- A planar primitive, , that had the maximum geometric area was started from, and the plane group, , was initialized;
- (2)
- a candidate plane set, , was created where all planar primitives were connected (an edge linked in RAG) to the last added plane, , from the plane group, . If the candidate set was empty or all primitives in such a set were already grouped, then the current grouping loop was terminated;
- (3)
- the candidate primitives from that did not satisfy the convexity/concavity constraint, (Law-2), and consistency constraint, (Law-3) were removed;
- (4)
- the remaining candidate primitives based on the Euclidian distance () between the candidate plane and plane, , were sorted, and the candidate with the minimum connecting distance into was grouped. If there were no remaining primitives, we exited; and
- (5)
- progressed to step (2) and continued to find a roof structure.
After a group of primitives was found, we updated the tree nodes and removed the vertexes in the RAG. Thus, we then proceeded to the next iteration with a new grouping process until all primitives in the RAG were grouped.
2.3. Model Enhancement and Refinement
LiDAR data are usually incomplete due to the limitations of acquisition devices and occlusions. Therefore, the initial structures generated by the progressive decomposition and grouping process were usually ambiguous and could not be interpreted or correctly identified as a meaningful structure, as shown in Figure 7.
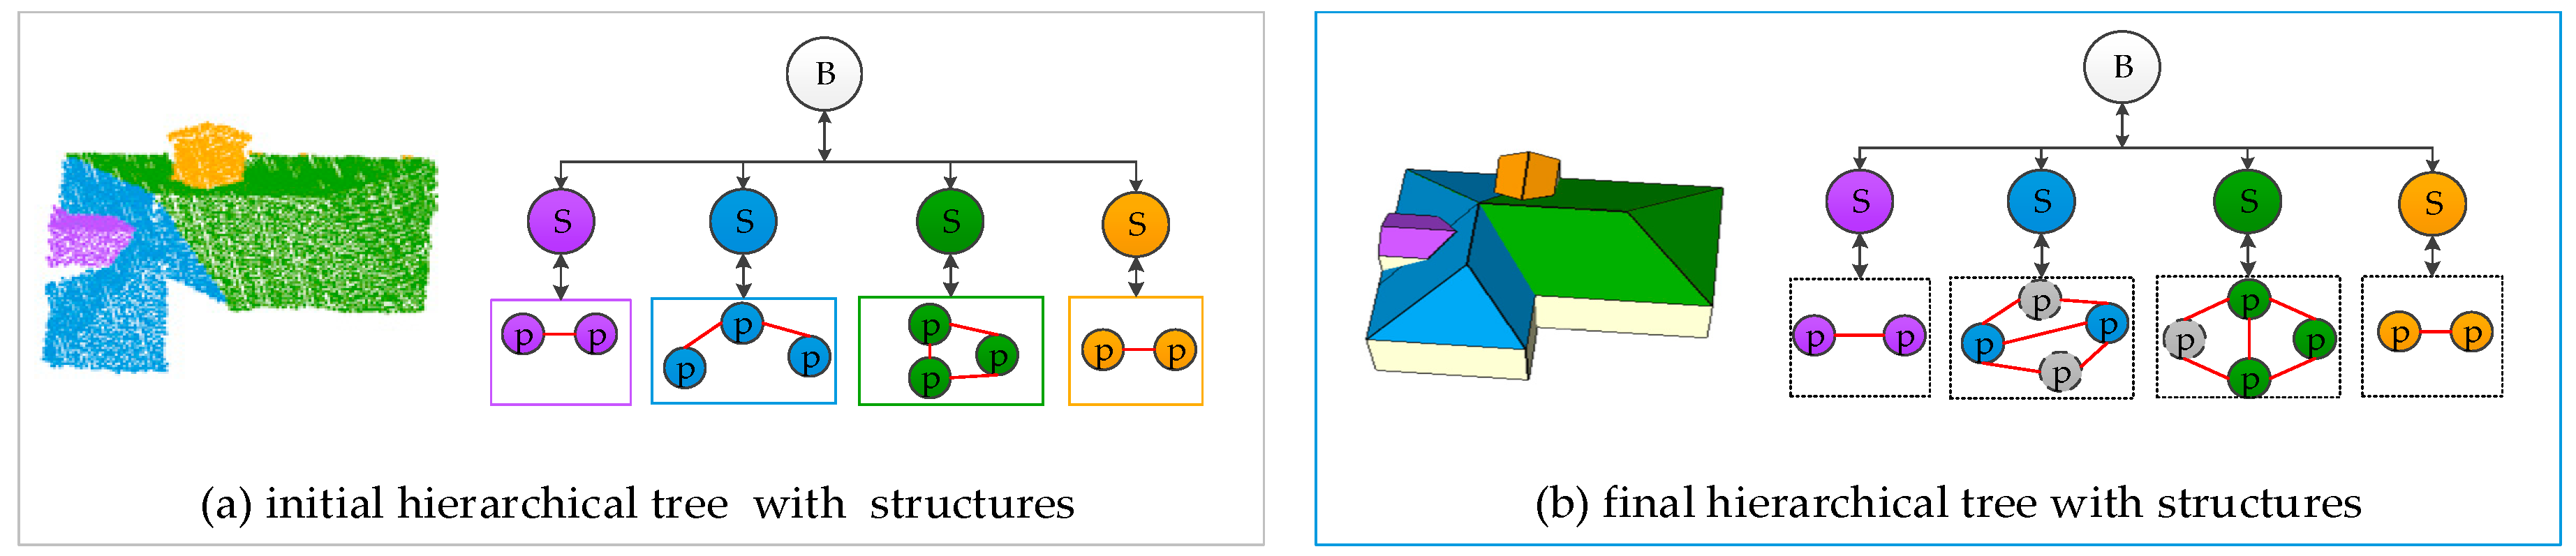
The final step of building roof reconstruction was to refine and enhance the reconstructed model, as illustrated in Figure 8. Initial grouped structures are shown in Figure 8a, while the refined structures and the associated graph nodes from the initial hierarchical tree were synchronously upgraded, as shown in Figure 8b.
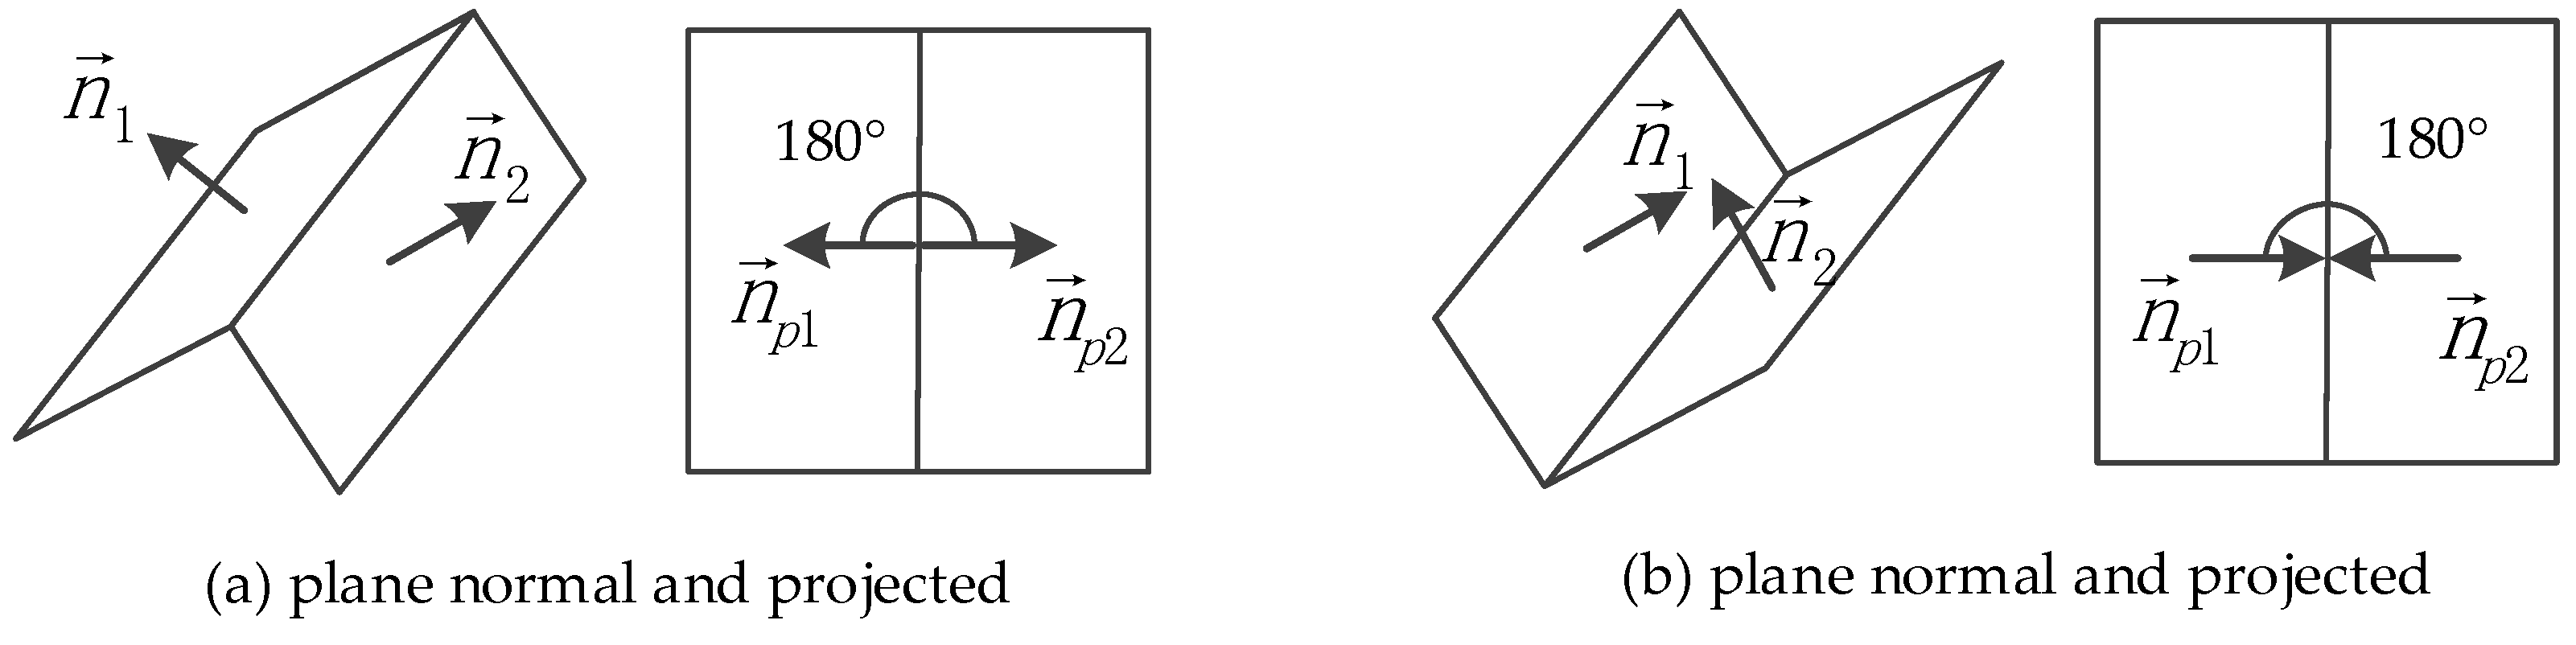
To accomplish these enhancements, we projected the normal vectors of adjacent primitives onto the ground plane, as illustrated in Figure 9, where the and are the normal vectors.
An analysis was performed on whether the projected normal vectors were mutually parallel with respect to their intersection. Hence, the symmetry/non-symmetry was calculated by:
Moreover, the indicator of full-symmetry was defined and calculated by:
where the overlapped area threshold, , was empirically specified, depending on the data quality. According to the preceding assumption and structure knowledge, the process of model enhancement was achieved in an iterative manner. The key steps of the refinement operator, as presented in Figure 10a–d, are elaborated as follows:
- (1)
- A grouped structure from the colored node in Figure 10a was searched, and its corresponding sub-node (a child part) and inlier leaf nodes (planar primitives) were extracted;
- (2)
- the symmetry indicators of the neighboring structures were calculated, and symmetry evaluation processing was performed;
- (3)
- closed hull loops were detected, and the projected primitives were stitched together in sequence, based on the closure perception laws (Law-4). In addition, an add and union primitive operation was carried out; and
- (4)
- a similar regular process as in [46] was applied to the refined structure, and the parameters for the corresponding nodes and primitives in the hierarchical tree were automatically updated.
The iterative processing of structure enhancement was terminated until no structures could be reconstructed from the initial tree. A final hierarchical structure tree and 3D model are illustrated in Figure 11.
3. Experimental Results
We implemented the proposed algorithms and mainly tested on two Airborne Laser Scanning (ALS) datasets that differ in point density and urban characteristics. Various internal consistency metrics were used to evaluate the reconstructed 3D building models. The results were compared with other state-of-the-art studies to ascertain the effectiveness of the proposed method.
3.1. Description of the Datasets
3.2. Results of Model Reconstruction
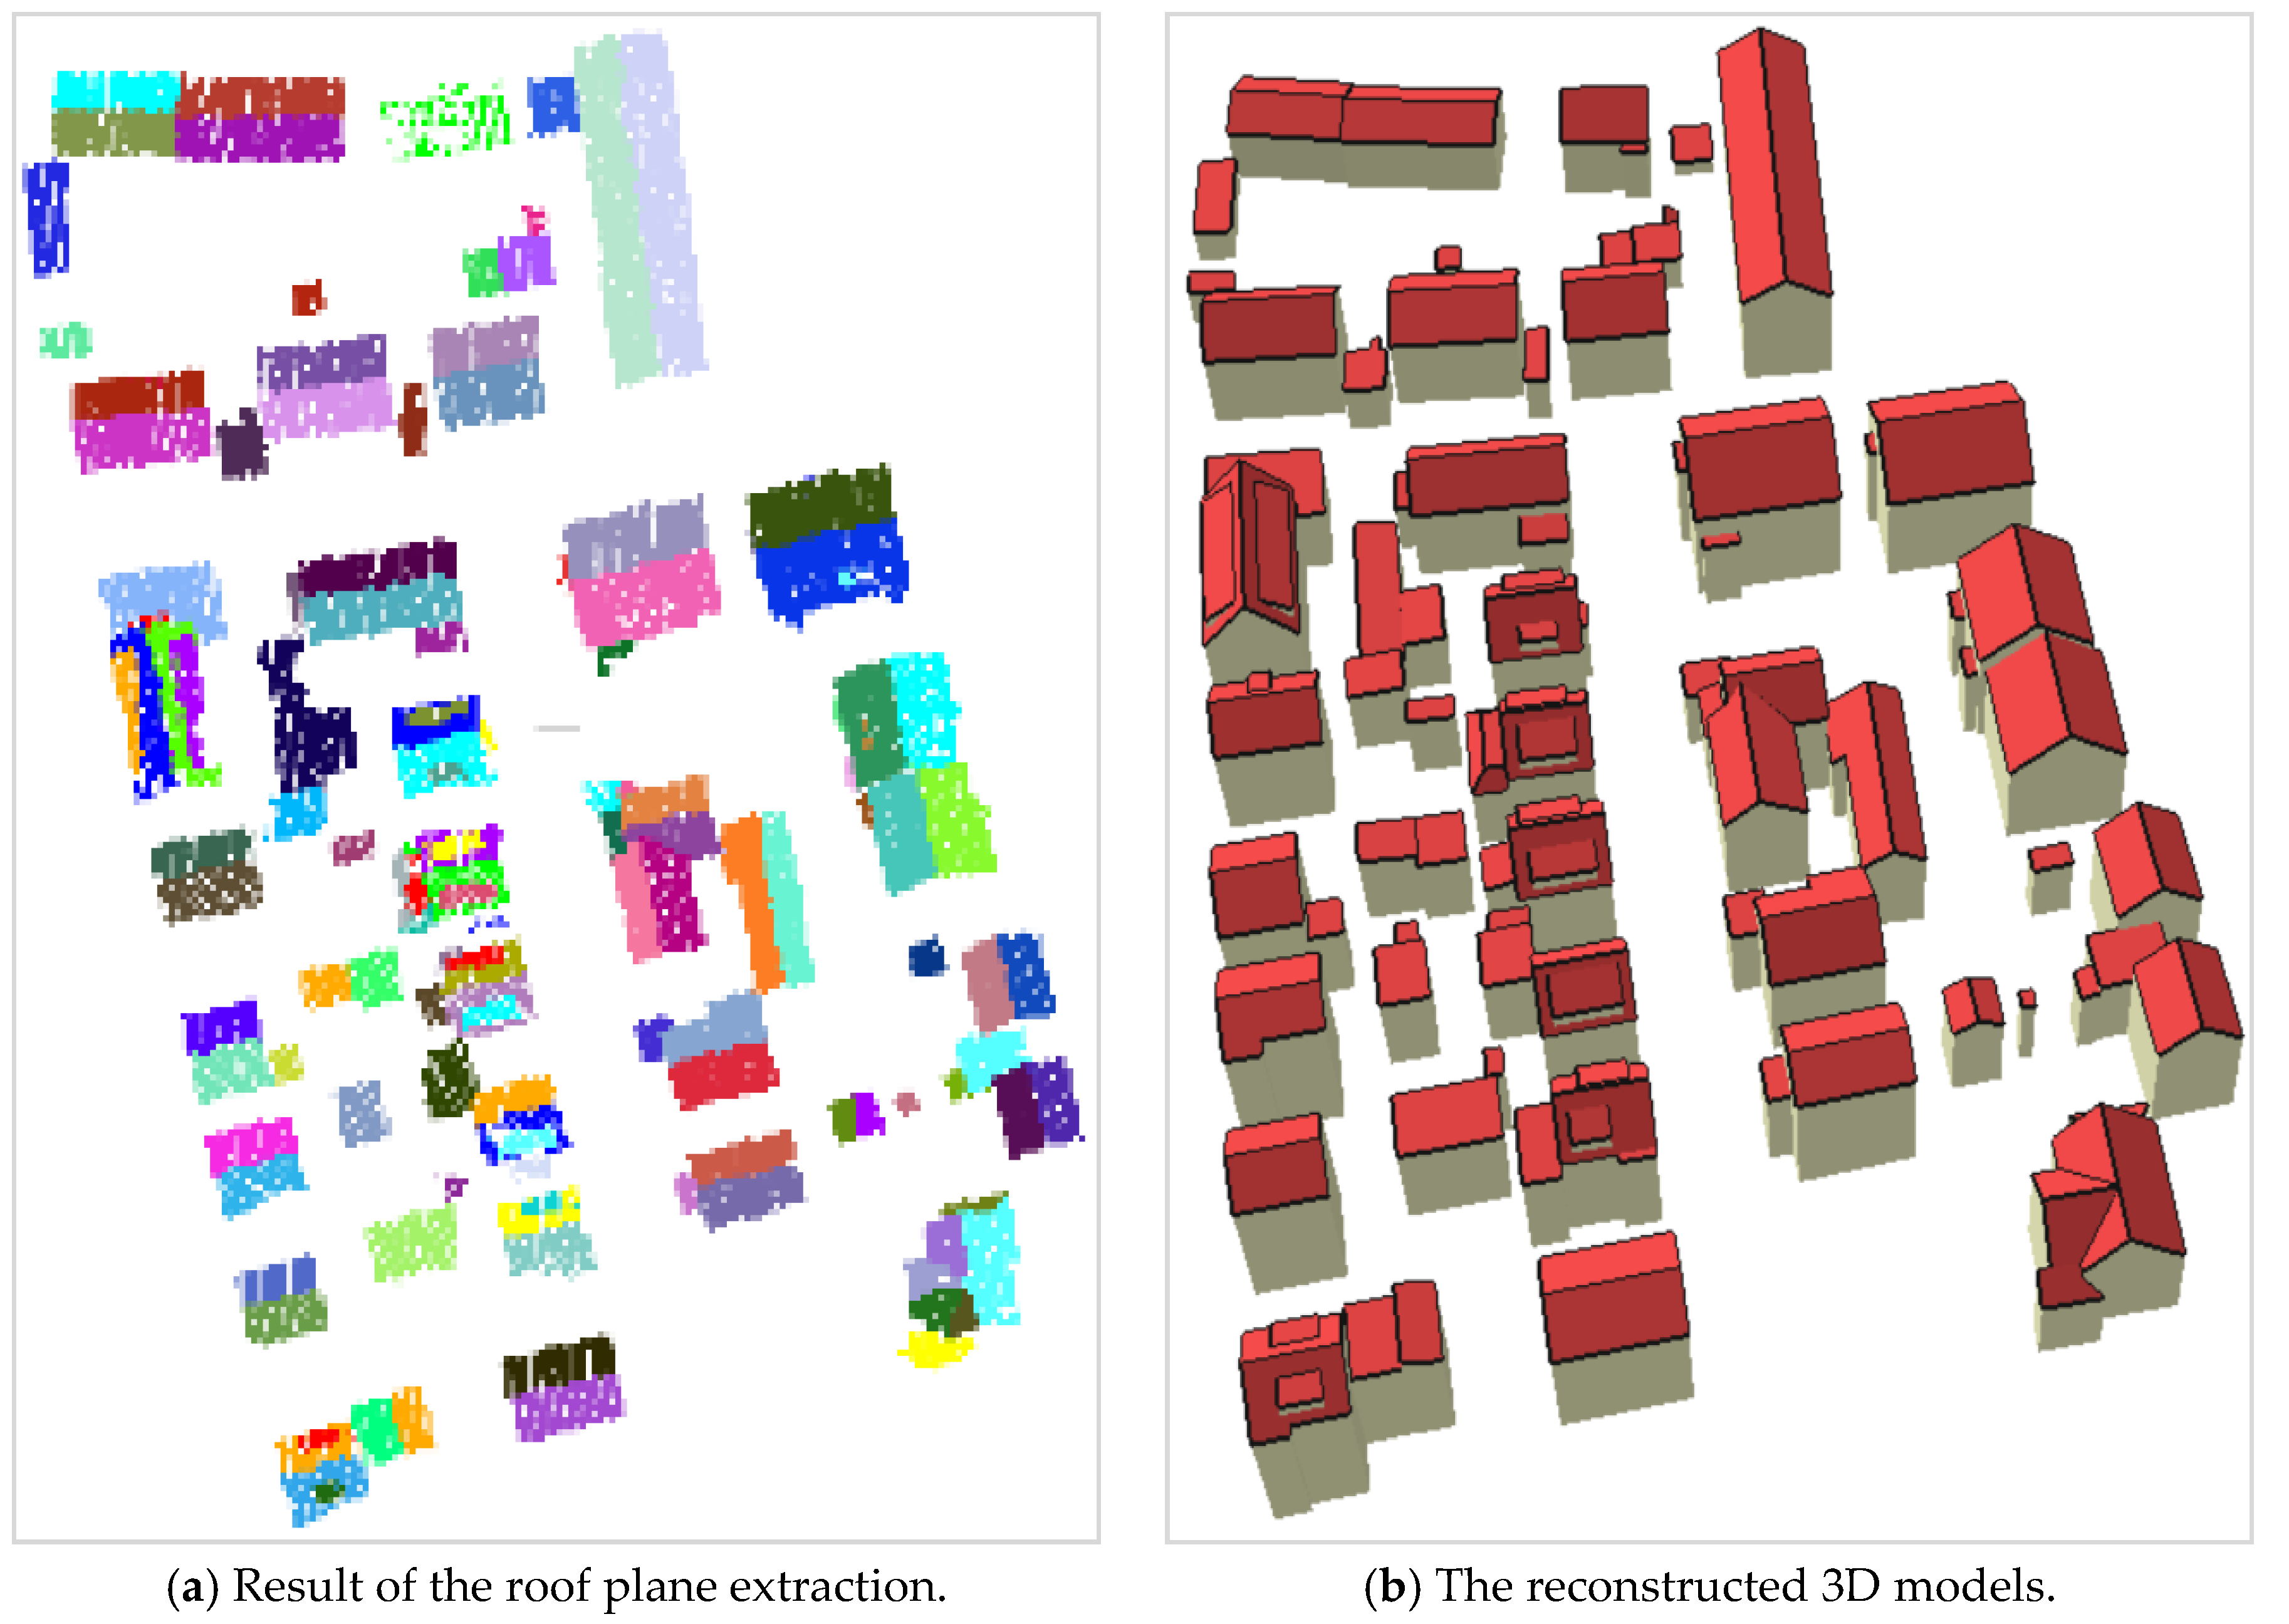
Roof plane segmentation was achieved by the method referred to in [46]. In addition, the overlapped area threshold for symmetry processing was set to 0.7 for the Guangdong dataset and to 0.95 for the Vaihingen dataset. The results from the GuangDong and Vaihingen dataset are illustrated in Figure 12 and Figure 13. Each color in these figures represents an individual plane.
A detailed visual inspection for the reconstructed model, especially for the colored roof structures, is illustrated in Figure 14. A building model can be combined to produce a variety of meaningful structures, marked with different colors.
4. Discussion
4.1. Comparison Analysis of the Proposed Method
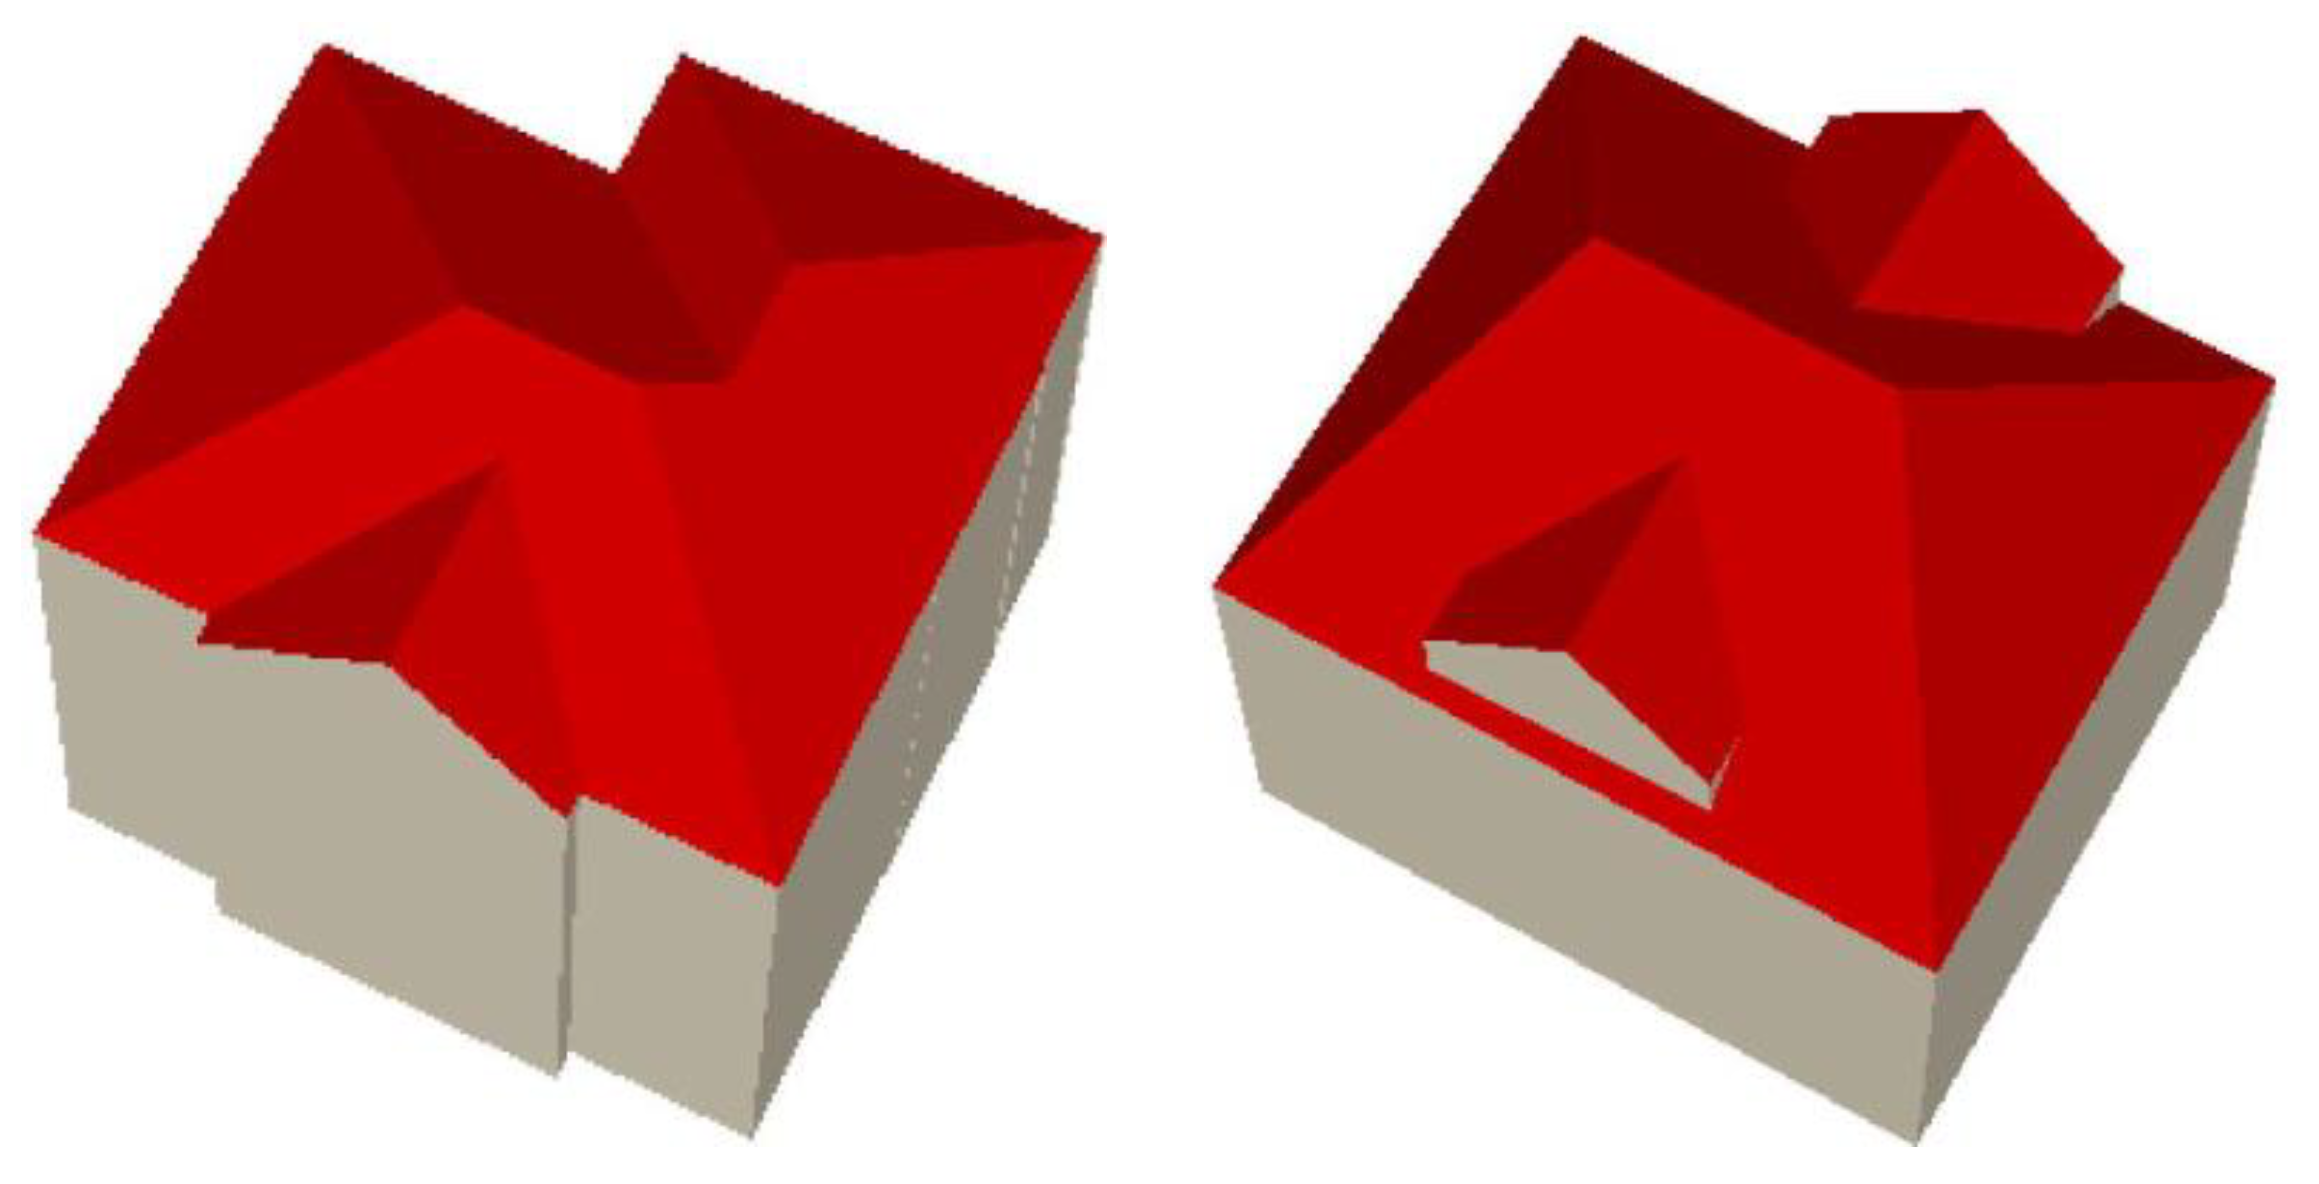
The proposed approach can more effectively identify the unambiguous roof parts using only simple grouping rules as compared to the methods based on the commonly used or improved RTGs [2,37,44,45]. Results from three common decomposition methods (black wireframes) and their reconstructed 3D building models (red models) are illustrated in Figure 15.
It can be seen from Figure 15 that different reconstructed models of the same building were used to illustrate the effectiveness of the proposed method, which produces more unambiguous and meaningful roof parts. The generated model by the method proposed by Verma et al. [39] was based on a fixed model library combining simple roof primitives, which reduces the flexibility of the reconstruction process as it requires an exhaustive search to extract previous complex building elements. The RTG-based approach [2,13,44] is the most popular means to search and match the roof target graph, which results in redundancy as the roof planes and the associated intersecting lines may match multiple targets, as in Figure 15b. In addition, the improved RTG approach developed by Xiong et al. [2,44] adopts corners as the basic unit for building reconstruction, which is flexible, but the topologies between corners and linked lines are difficult to interpret. Recent improvements by Rychard et al. [6] on this method can generate a topological unit without independent overlapping planes, but it is still hindered by the limited model library and also might identify the same RTG as different objects. Our proposed method, however, can avoid this ambiguous matching issue during reconstruction processing, as shown in Figure 16.
Moreover, the proposed method can be used to generate a complete polyhedral model with roof parts using a hierarchical topological tree. However, the limitation of the proposed method is that these reconstructed hierarchical structures can be only further divided as roof and attachments, and cannot be linked with detailed semantics, like dormers, Gabled roofs, Half-hip roofs, or Hip roofs. Semantic knowledge as in [50] can be further developed to infer these detailed semantics. In addition, there are also other errors caused by irregularly curved surfaces that cannot be reconstructed according to their true status.
4.2. Analysis of the Guangdong Dataset
These reconstructed 3D models from Guangdong dataset were manually evaluated. Table 3 lists the evaluation results in terms of the correct reconstructed roofs and buildings, and the quality measure and average distance of a point to a reconstructed plane.
It can be seen from Table 3 that there were 83 buildings in the dataset, with 257 roof planes, and, in total, 92.7% of the buildings were fully reconstructed. The mean absolute value between the reconstructed planes and corresponding points was approximately 3.3 cm. There were, altogether, six buildings identified, but not well reconstructed, as illustrated in Figure 17, including three failed examples for the missing neighboring segment, two ambiguous structures, and one non-planar object. The main reason for the failed examples of the 3D reconstruction was not only the uncompleted roof plane segmentation, but also the complexity of the structural definition.
The most common reason for the false construction was a lack of an adjacent plane, which is always caused by insufficient points, resulting from the segmentation preprocess. In addition, model enhancement can be easily hindered by insufficient points or cannot be executed even for sparse partial symmetry. A gable roof plane in Figure 17a was missed due to a sparsity of points, while a chimney in Figure 17b was lost because of the rare and low-quality points for these small planes. A complete and correct model is based on the correct extraction and unambiguous enhancement of the building structure. However, enhancement is greatly affected by data quality. Figure 17c shows an effective reconstruction based on the data, but it did not fit the ground truth because of the incompleteness of the roof points and ambiguous structures. This situation can only be avoided by shape constraints known in advance of the reconstruction. In addition, objects with non-planar structures, as in Figure 17d, can easily lead to a model failure as it is difficult to describe these non-planes with regular planar parameters, but a correct grouped structural point set can be obtained by the proposed approach in the two figures (d) on the right side of Figure 17. The points set colored with red and blue are separated by a gap with no points. These failed reconstructions do not conform to the ground truth, as shown in the top three figures, except for the non-regularized objects appearing as irregular curved surfaces or multilayer surfaces.
4.3. Vaihingen Dataset Evaluation Experiment
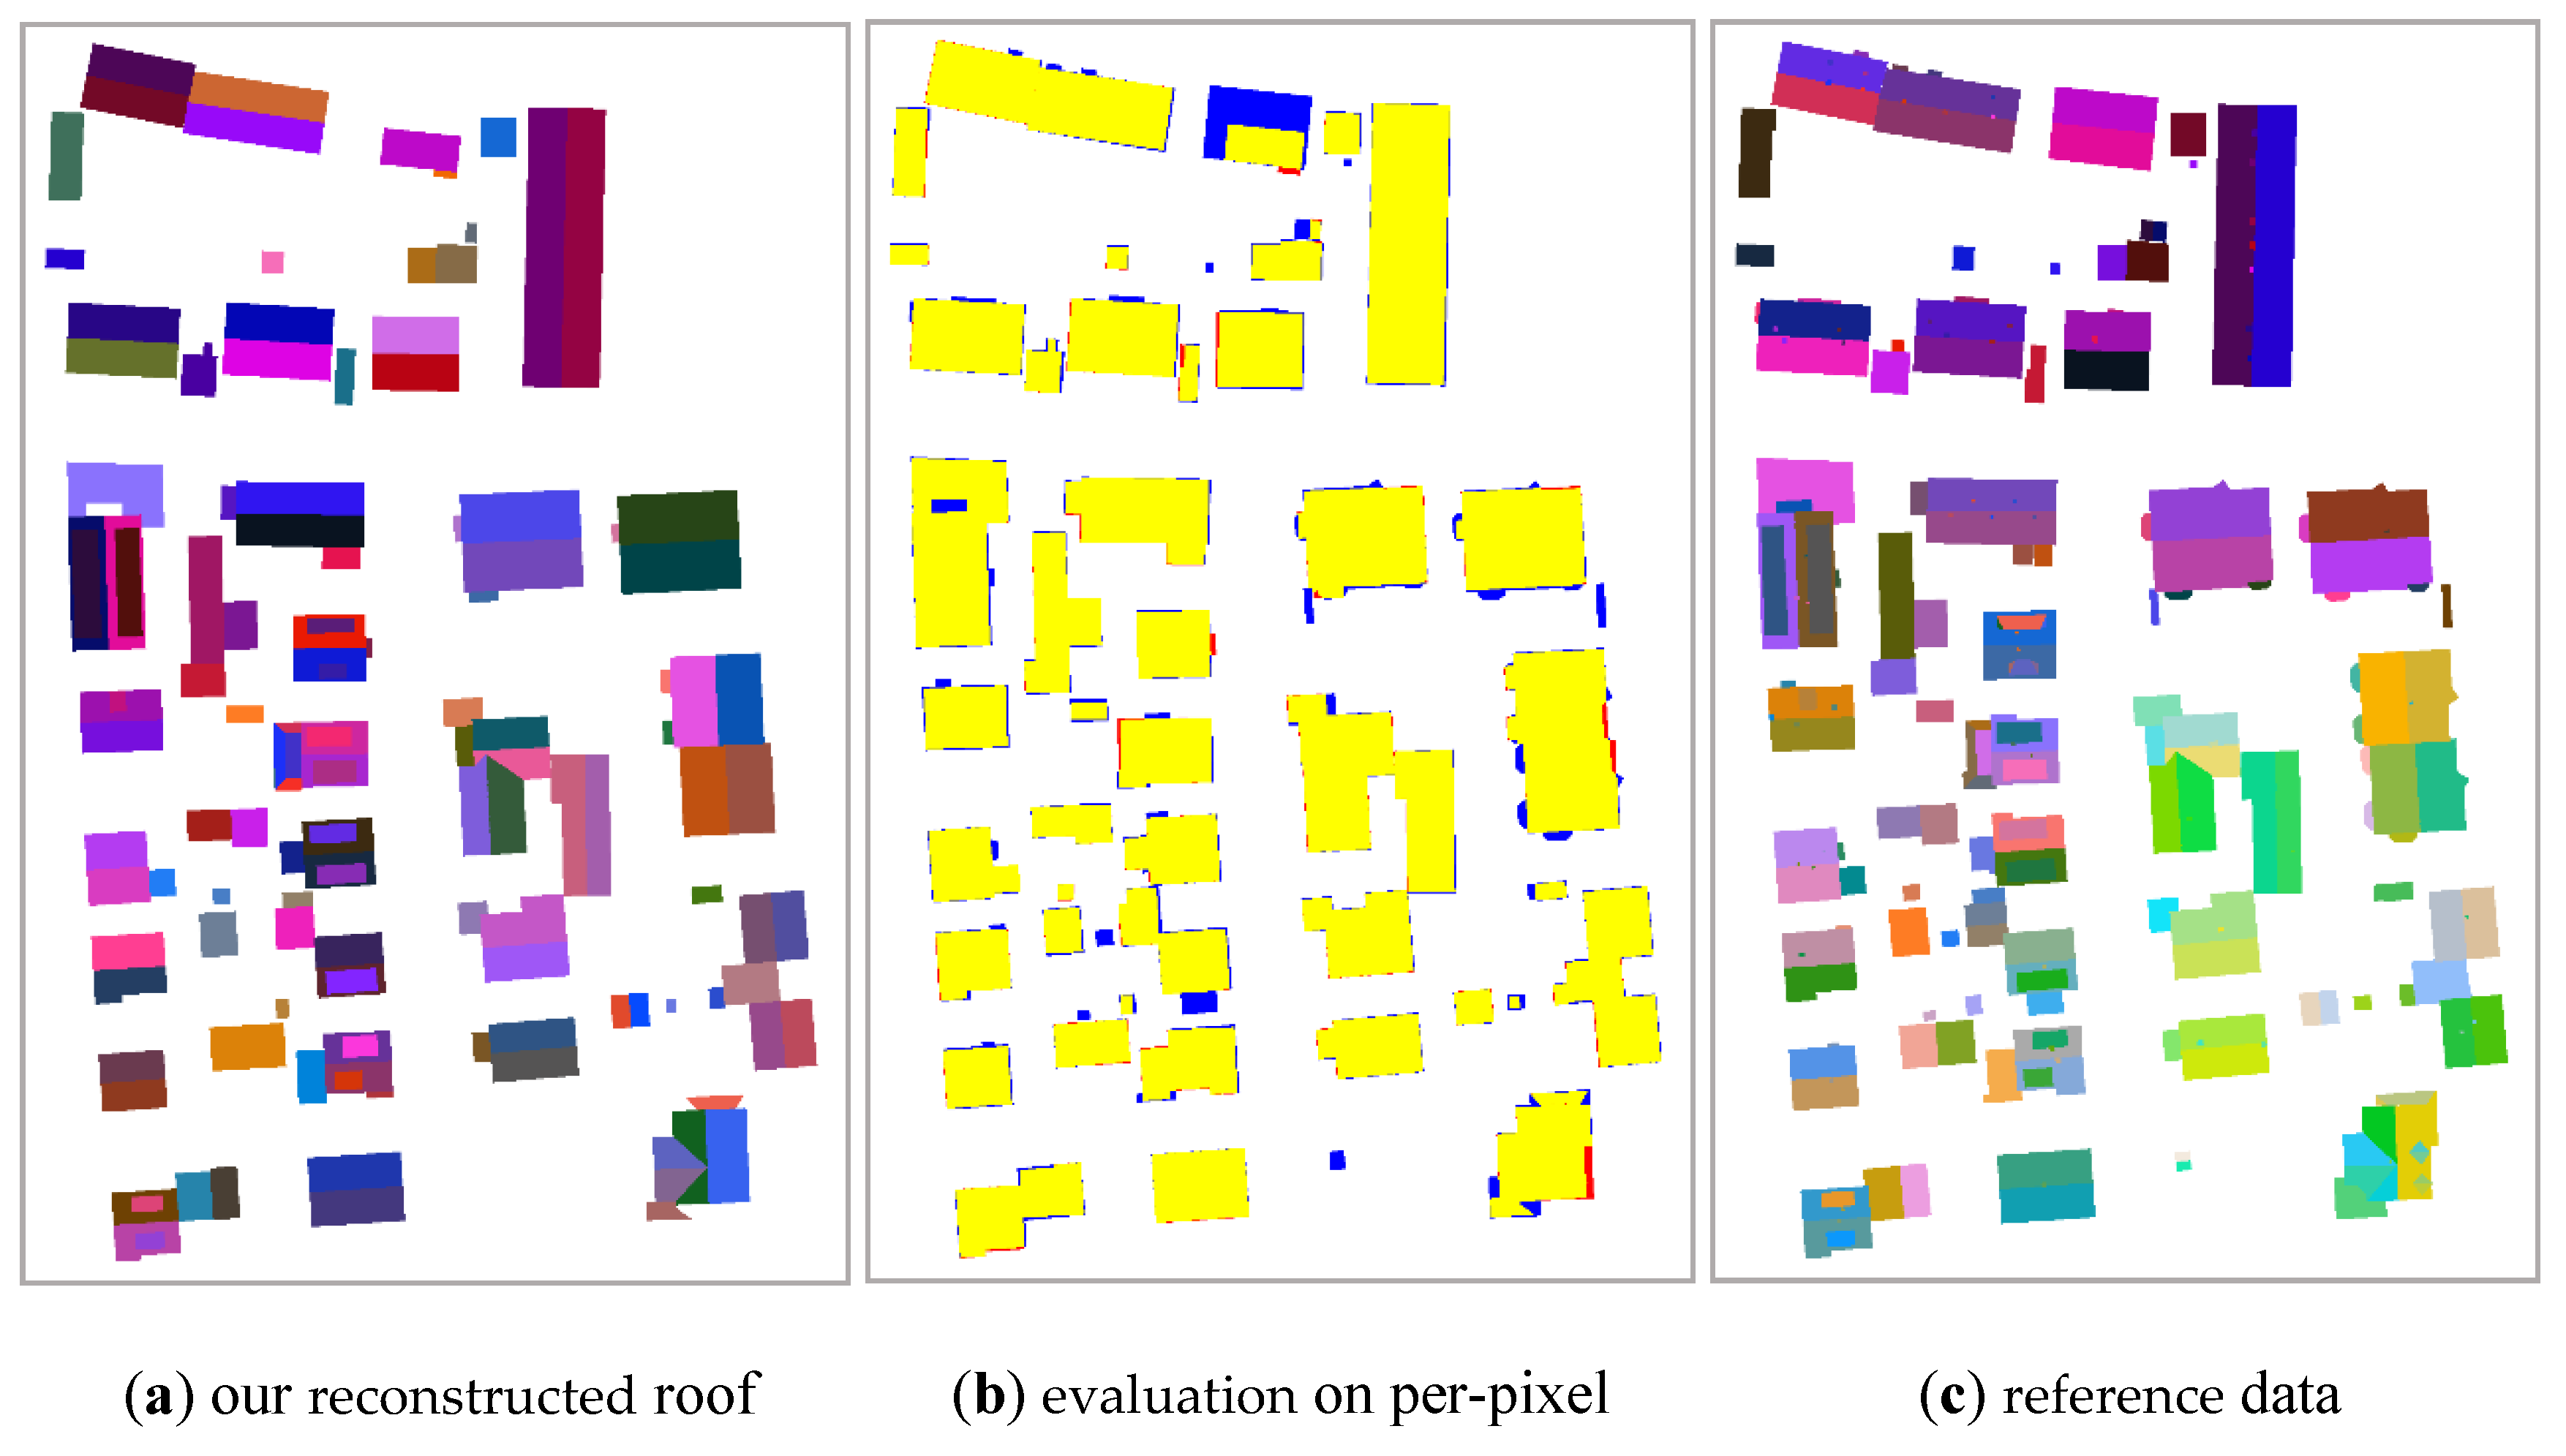
These 3D models reconstructed from the Vaihingen dataset were evaluated by the International Society for Photogrammetry and Remote Sensing in terms of their topology correctness and model precision. Figure 18 illustrates a comparison of the reconstructed roof planes with the reference information, where the 3D information was converted to a label image.
The ISPRS evaluation results are listed in Table 4, showing that the proposed method achieved 130 correctly reconstructed roof planes out of 133 fully reconstructed as True Positive (TP). The quality evaluation on a per-pixel level is shown in (b), captioned as evaluation on per-pixel. The most common reason for the false roof reconstruction was insufficient points for symmetry calculation and unsuccessful building extraction from the point cloud due to vegetation or other objects.
Histograms of the overlapping area related to the corresponding roof planes are shown in Figure 19. The dominant groups contain roof planes whose mutual cover area was greater than 97.5%, based on the ISPRS reference data. Since the symmetry and convexity of a roof structure were assumed, the plane overlap of some models did not fully reach 100%. Interestingly, unsuccessful preprocessing of the extracting building point cloud was the main reason why there were approximately 31 planes (2.5% area overlap) with a low overlapping area.
4.3.1. Topology Analysis
Figure 20 demonstrates the topological consistency evaluation results of the Vaihingen dataset by ISPRS. Based on the extraction results, the yellow label indicates that the pixels inside reference planes had a (1:1) relation to planes. A blue label means that there was no corresponding plane; and dark magenta represents pixels in reference roof planes that were merged with other planes in the reconstruction results (1:N relation). A bright magenta label means that the pixels in the reference roof planes split into to two or more planes during reconstruction (M:1 relation), while a dark cyan label indicates that the pixels in the roof planes were part of a plane cluster having (M:N) relations between planes in the reference image and planes in the reconstruction results. The relationship (M:1), suggests over-segmentation issues, indicating that a reconstructed plane refers to more than two planes in the reference data set, and the (1:N) relation represents under-segmentation.
The building reconstruction assessment results show a precise overlap (1:1) for 80 roof instances out of 133 (approximately 60.15%). The reason for the effective roof plane extraction was that the building roofs were extracted from a coarser level to a finer level using a morphological scale space [46]. The blue colors in the figure indicate that planes were either fully modeled or nearly completely neglected, a scenario caused by the missed point cloud during the building extraction or no LiDAR data. We also compared the reconstruction approach with four state-of-the-art algorithms from the website of ISPRS, with the details listed in Table 5.
It can be seen from the table that there was only one plane with (N:M) relations, where both over and under-segmentation occurred, and the primary reason for the low errors was the symmetry calculation after roof extraction. The most common difference was the (N:1) relation (under-segmentation), with a total number of 48 reconstructed instances. The primary reason for this difference was caused by the lost small structures overlapped in the base roof planes, but the final reconstructed models have not been affected according to the assessment. More importantly, the topological consistency in the relationship, (1:M), related to over-segmentation errors was zero, which indicates that there were no reconstructed roof planes resulting from a split plane. These successes can be attributed to roof segmentation in a morphological scale space.
4.3.2. Model Precision
Table 6 summarizes the quantitative metrics of the final reconstruction models by ISPRS on a per-area level (pixel size: 0.100 m). The quality on the per-area level for the Vaihingen dataset reached 96.0%, and the difference between the metrics for roof planes was larger than 10 m2 for all planes, indicating that the completeness was related to the plane size. Furthermore, these highly precise results benefit from [46], which preserved the correct segmentation at plane transition regions with sparse points.
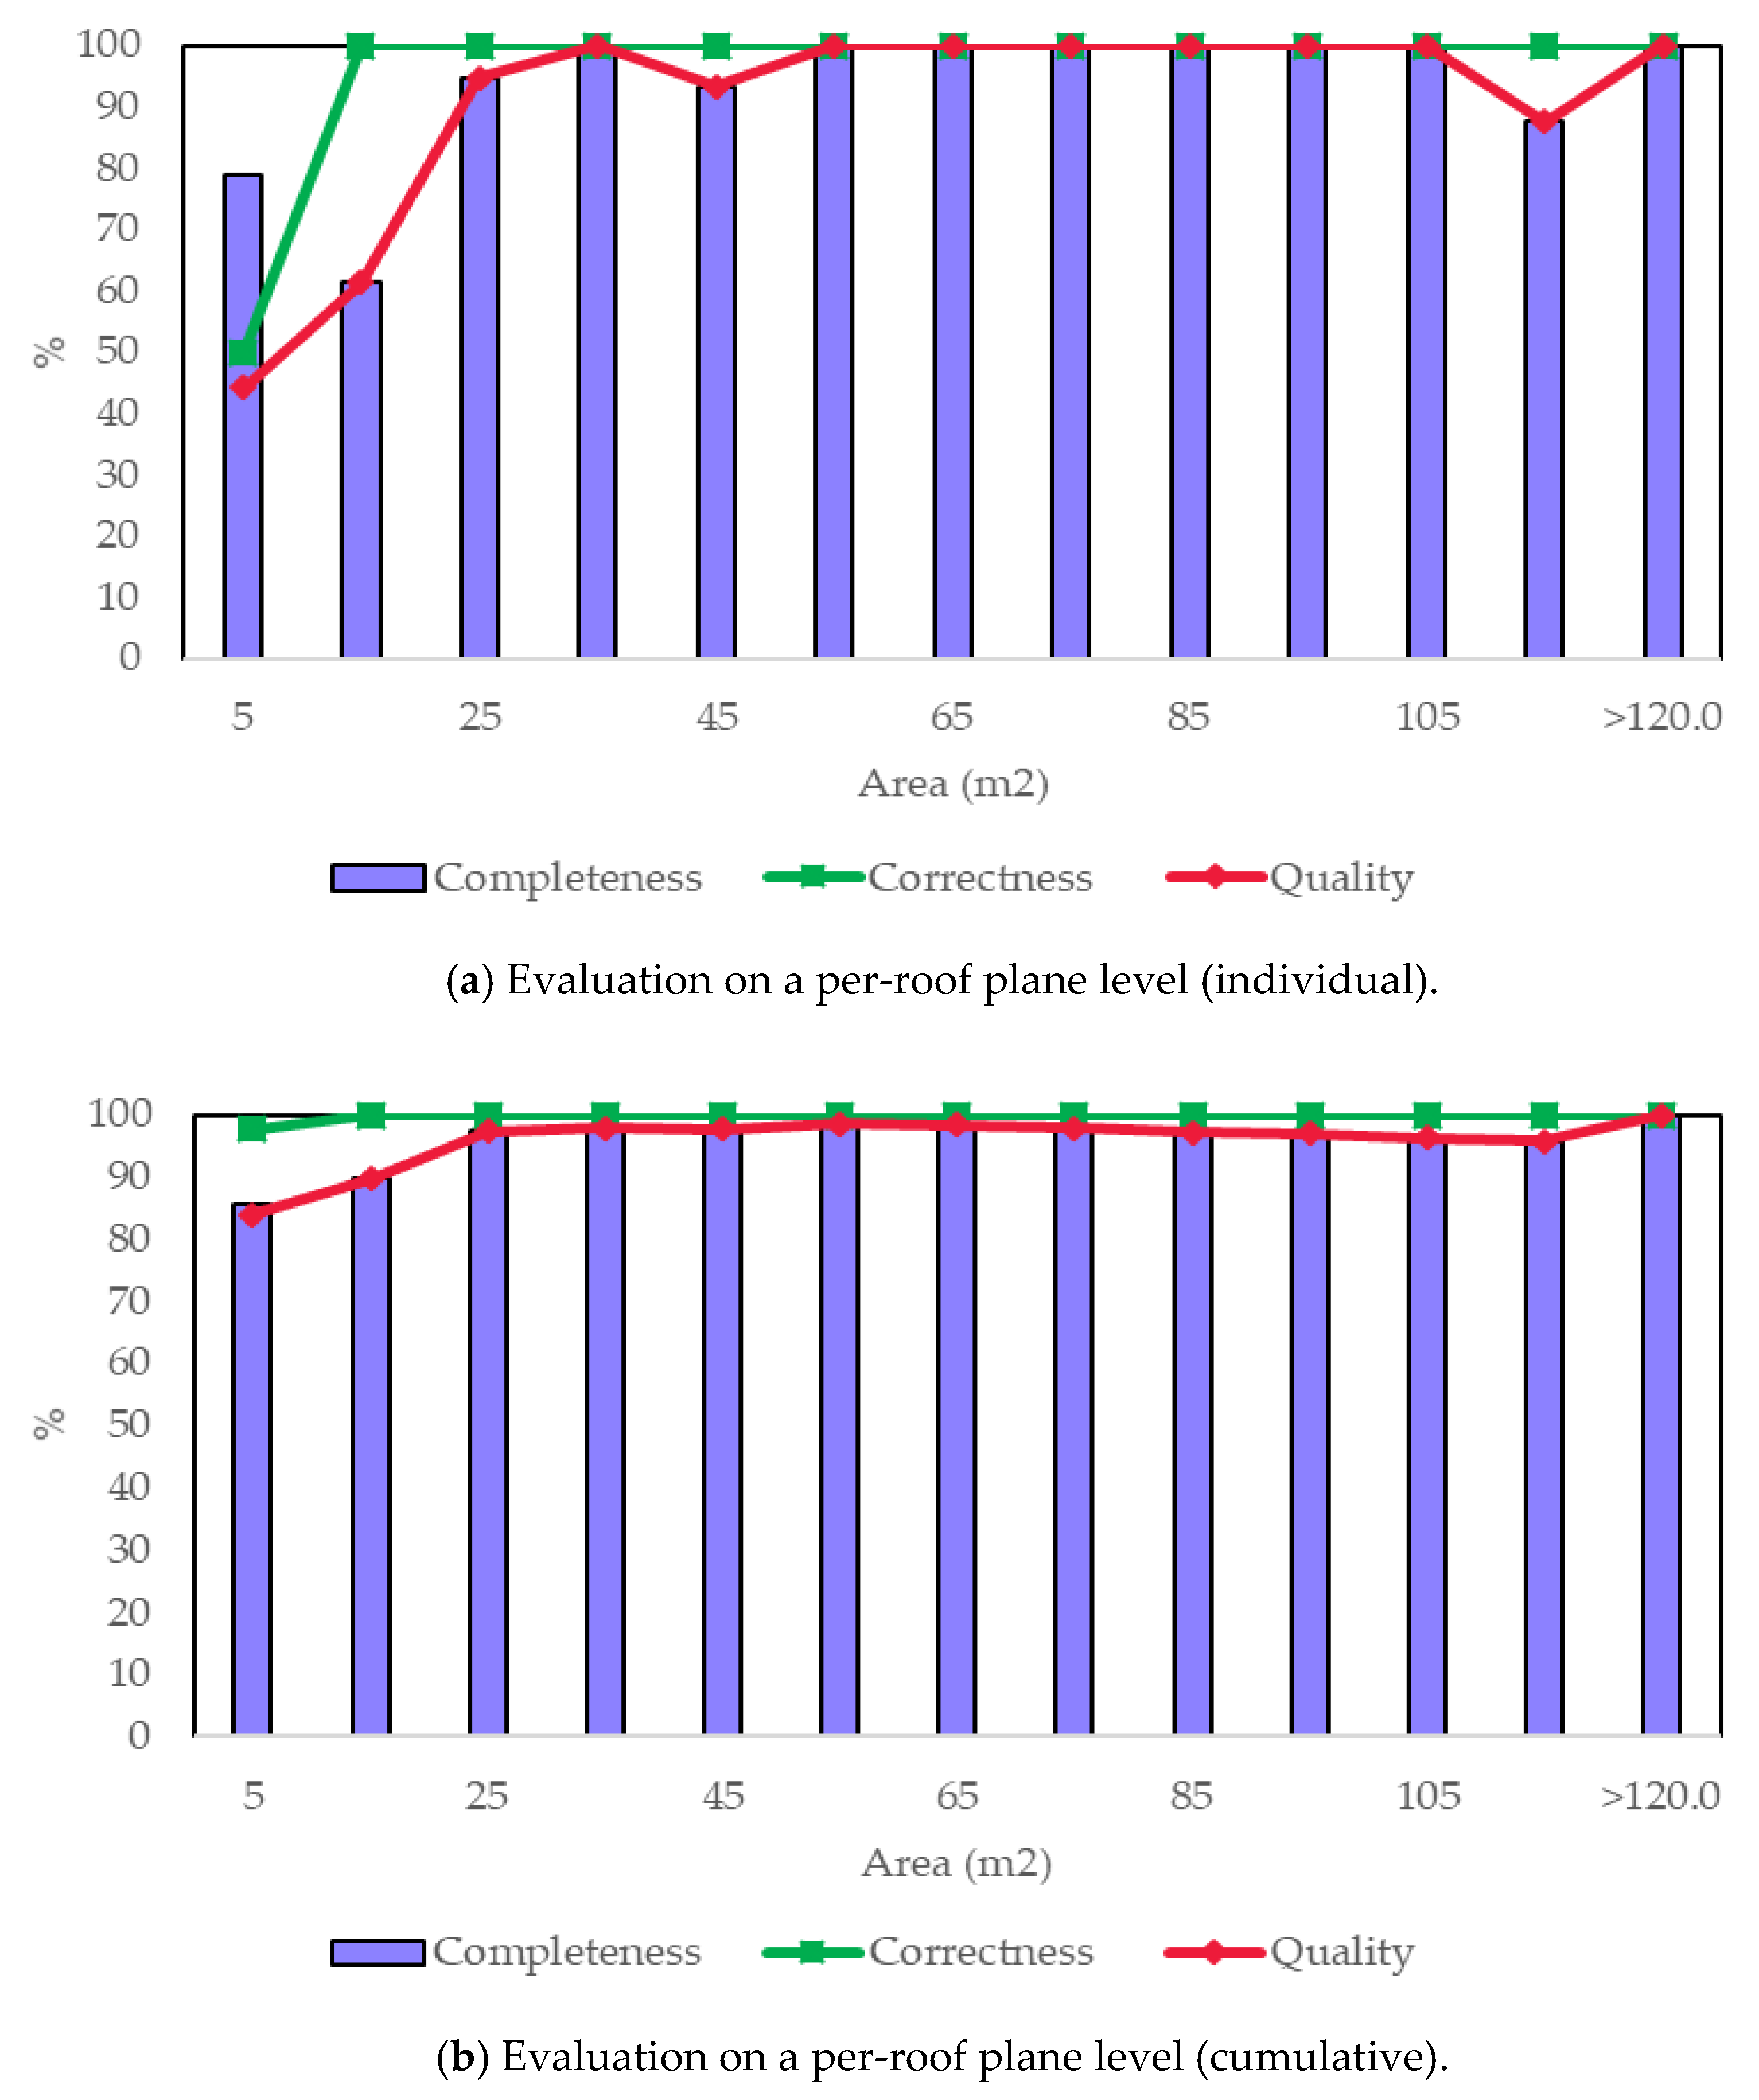
The evaluation of the dependency between the plane size and model quality is presented in Figure 21. It can be seen from the individual histogram that there was a leap between the completeness and quality (planes with an area of 5 m2). This is due to symmetry processing during model enhancement. In addition, the reconstruction completeness was greatly influenced by the accuracy of the roof extraction, as complex roof structures were more likely to be organized by small patches than large planes. These conclusions are in line with the methods based on an RTG library [2,6].
Comparative results were evaluated on a per-roof plane level in the two ways: All extracted roof planes and large roof planes that covered an area of more than 10 m2. Four state-of-the-art methods described in the website of ISPRS were selected for comparisons. The measures for the completeness and correctness of per-objects are displayed in Table 7.
As seen in the table, the differences in the metrics between all extracted and large roof planes indicates that completeness performance was related to the plane size. In addition, about 14.5% of the roof planes were not reconstructed. The main reason for this was the missing input data, caused by the building point cloud detection, as small patches had too few points for extraction, or the small roofs were neglected during regularization. These missed planes were previously evaluated and visualized in Figure 20. A reasonable approach to overcome this shortcoming is to improve the preprocessing step for the extraction of building points.
Four state-of-the-art methods from the ISPRS website were compared and visualized in Figure 22. For most of these methods, one of the two indicators exceeded the median value, while the other indicator was reduced. We obtained an 85.5% completeness and 97.7% correctness with our proposed method. The values of the two metrics approached the median, which means that we achieved a relative balance between completeness and correctness. The reason for this balance was the roof plane segmentation method [46], but more importantly, an unambiguous principal direction for the regularization was easily obtained from the locally clustered building structure. As shown in Figure 23, the average root mean squared error (RMSE) values were 0.5 m and 0.29 m in the horizontal and vertical directions, respectively, which indicates that the proposed approach has a high geometric accuracy, as compared to the four state-of-art methods.
5. Conclusions
In this paper, we presented a novel method for roof modeling from 3D point clouds based on the Roof Attribute Graph (RAG). The RAG is a logical model for building roofs, while the grouped sub-graph is a structure that incorporates geometric parameters. The output of the reconstruction process is a complete polyhedral structured model, and mutual relationships are organized by a hierarchical topology tree. By first segmenting the roof planes and constructing an RAG, we developed and applied category specific reconstruction methods to obtain visually pleasing structural models, even in the presence of occlusions and incomplete data. The key idea was to extract potential structures by hierarchical grouping, while an analysis-and-enhancement scheme was developed to improve the basic structure best fit to both human vision and knowledge constraints.
Our structural modeling scheme has a few limitations that lead to failures in the final model, including missing neighboring segments and sparse points, which resulted in ambiguous structural enhancement and segmentation errors for non-planar objects. The former two scenarios can be avoided by using a higher density and quality of points, while a new strategy for non-plane objects needs to be developed, as in [24]. We believe that there are many opportunities for further exploration. For example, we should be able to add more data, collected by mobile or ground laser scanners, into the RAG to construct a more reasonable and feasible building structural model to support advanced editing and calculation at LoD2 or LoD3, and images can be used to extract fine details and unambiguous semantic information during building reconstruction. Overall, these structural models with unambiguous geometries and topological relationships are expected to lead to better models that support not only high-fidelity visualization, but also editing, and could, eventually, become searchable.
Author Contributions
Conceptualization, P.H. and B.Y.; Methodology, P.H. and B.Y.; Software, P.H., P.Y. and X.S.; Validation, P.H., B.Y. and H.F.; Formal Analysis, P.H., B.Y., Z.D. and R.H.; Investigation, P.H., B.Y. and Z.D.; Resources, R.H. and Z.D.; Writing-Original Draft Preparation, P.H., B.Y. and H.F.; Writing-Review & Editing, P.H., B.Y., X.S. and H.F.; Visualization, P.H., P.Y. and X.S.; Supervision, B.Y. and H.F.; Project Administration, B.Y.
Funding
This research was jointly funded by the National Science Fund for Distinguished Young Scholars of China, grant number 41725005; the Key Program of the National Natural Science Foundation of China, grant number 41531177; the National Key Research and Development Program of China, grant number 2016YFF0103501; and the National Natural Science Foundation of China, grant number 41501427.
Acknowledgments
We would first like to thank the anonymous reviewers for their valuable feedback. The Vaihingen data set was provided by the German Society for Photogrammetry, Remote Sensing and Geoinformation (DGPF). The authors wish to thank Markus Gerke, Uwe Breitkopf, and the ISPRS Commission III/4 for the evaluation of the results, and thanks to Stephen C. McClure for his kind help to improve the language.
Conflicts of Interest
The authors declare no conflict of interest.
References
- Lafarge, F.; Mallet, C. Building large urban environments from unstructured point data. In Proceedings of the 2011 International Conference on Computer Vision, Barcelona, Spain, 6–13 November 2011; pp. 1068–1075. [Google Scholar]
- Xiong, B.; Oude Elberink, S.; Vosselman, G. A graph edit dictionary for correcting errors in roof topology graphs reconstructed from point clouds. ISPRS J. Photogramm. Remote Sens. 2014, 93, 227–242. [Google Scholar] [CrossRef]
- Bulatov, D.; Häufel, G.; Meidow, J.; Pohl, M.; Solbrig, P.; Wernerus, P. Context-based automatic reconstruction and texturing of 3D urban terrain for quick-response tasks. ISPRS J. Photogramm. Remote Sens. 2014, 93, 157–170. [Google Scholar] [CrossRef]
- Zhu, Z.; Stamatopoulos, C.; Fraser, C.S. Accurate and occlusion-robust multi-view stereo. ISPRS J. Photogramm. Remote Sens. 2015, 109, 47–61. [Google Scholar] [CrossRef]
- Toschi, I.; Nocerino, E.; Remondino, F.; Revolti, A.; Soria, G.; Piffer, S. Geospatial data processing for 3D city model generation, management and visualization. Int. Arch. Photogramm. Remote Sens. 2017, 42, 527–534. [Google Scholar] [CrossRef]
- Rychard, M.; Borkowski, A. 3D building reconstruction from als data using unambiguous decomposition into elementary structures. ISPRS J. Photogramm. Remote Sens. 2016, 118, 1–12. [Google Scholar] [CrossRef]
- Fletcher, A.T.; Erskine, P.D. Rehabilitation closure criteria assessment using high resolution photogrammetrically derived surface models. Int. Arch. Photogramm. Remote Sens. 2013, 40, 137–140. [Google Scholar] [CrossRef]
- Duan, L.; Lafarge, F. Towards Large-Scale City Reconstruction from Satellites; Springer International Publishing: Cham, Switzerland, 2016; pp. 89–104. [Google Scholar]
- Lin, H.; Gao, J.; Zhou, Y.; Lu, G.; Ye, M.; Zhang, C.; Liu, L.; Yang, R. Semantic decomposition and reconstruction of residential scenes from lidar data. ACM Trans. Graph. 2013, 32, 1–10. [Google Scholar] [CrossRef]
- Verdie, Y.; Lafarge, F.; Alliez, P. Lod generation for urban scenes. ACM Trans. Graph. 2015, 34, 1–14. [Google Scholar] [CrossRef]
- Nan, L.; Sharf, A.; Zhang, H.; Cohen-Or, D.; Chen, B. Smartboxes for interactive urban reconstruction. ACM Trans. Graph. 2010, 29, 1–10. [Google Scholar] [CrossRef]
- Oesau, S.; Lafarge, F.; Alliez, P. Planar shape detection and regularization in tandem. Comput. Graph. Forum 2016, 35, 203–215. [Google Scholar] [CrossRef]
- Elberink, S.O.; Vosselman, G. Building reconstruction by target based graph matching on incomplete laser data: Analysis and limitations. Sensors 2009, 9, 6101–6118. [Google Scholar] [CrossRef] [PubMed]
- Rottensteiner, F.; Sohn, G.; Gerke, M.; Wegner, J.D.; Breitkopf, U.; Jung, J. Results of the isprs benchmark on urban object detection and 3D building reconstruction. ISPRS J. Photogramm. Remote Sens. 2014, 93, 256–271. [Google Scholar] [CrossRef]
- Yang, B.; Dong, Z. A shape-based segmentation method for mobile laser scanning point clouds. ISPRS J. Photogramm. Remote Sens. 2013, 81, 19–30. [Google Scholar] [CrossRef]
- Vo, A.-V.; Truong-Hong, L.; Laefer, D.F.; Bertolotto, M. Octree-based region growing for point cloud segmentation. ISPRS J. Photogramm. Remote Sens. 2015, 104, 88–100. [Google Scholar] [CrossRef]
- Vosselman, G.; Gorte, B.G.; Sithole, G.; Rabbani, T. Recognising structure in laser scanner point clouds. Int. Arch. Photogramm. Remote Sens.Spat. Inf. Sci. 2004, 46, 33–38. [Google Scholar]
- Schnabel, R.; Wahl, R.; Klein, R. Efficient Ransac for Point-Cloud Shape Detection, Computer Graphics Forum; Wiley Online Library: Hoboken, NJ, USA, 2007; pp. 214–226. [Google Scholar]
- Chen, D.; Zhang, L.; Mathiopoulos, P.T.; Huang, X. A methodology for automated segmentation and reconstruction of urban 3-D buildings from als point clouds. IEEE J. Sel. Top. Appl. Earth Obs. Remote Sens. 2014, 7, 4199–4217. [Google Scholar] [CrossRef]
- Zhou, G.; Cao, S.; Zhou, J. Planar segmentation using range images from terrestrial laser scanning. IEEE Geosci. Remote Sens. Lett. 2016, 13, 257–261. [Google Scholar] [CrossRef]
- Kim, C.; Habib, A.; Pyeon, M.; Kwon, G.-R.; Jung, J.; Heo, J. Segmentation of planar surfaces from laser scanning data using the magnitude of normal position vector for adaptive neighborhoods. Sensors 2016, 16, 140. [Google Scholar] [CrossRef] [PubMed]
- Yan, J.; Shan, J.; Jiang, W. A global optimization approach to roof segmentation from airborne lidar point clouds. ISPRS J. Photogramm. Remote Sens. 2014, 94, 183–193. [Google Scholar] [CrossRef]
- Pham, T.T.; Eich, M.; Reid, I.; Wyeth, G. Geometrically consistent plane extraction for dense indoor 3D maps segmentation. In Proceedings of the 2016 IEEE/RSJ International Conference on Intelligent Robots and Systems (IROS), Daejeon, Korea, 9–14 October 2016; pp. 4199–4204. [Google Scholar]
- Dong, Z.; Yang, B.; Hu, P.; Scherer, S. An efficient global energy optimization approach for robust 3D plane segmentation of point clouds. ISPRS J. Photogramm. Remote Sens. 2018, 137, 112–133. [Google Scholar] [CrossRef]
- Sampath, A.; Shan, J. Segmentation and reconstruction of polyhedral building roofs from aerial lidar point clouds. IEEE Trans. Geosci. Remote Sens. 2010, 48, 1554–1567. [Google Scholar] [CrossRef]
- Zhou, Q.-Y. 2.5D building modeling by discovering global regularities. In Proceedings of the 2012 IEEE Conference on Computer Vision and Pattern Recognition (CVPR), Providence, RI, USA, 16–21 June 2012; pp. 326–333. [Google Scholar]
- Brenner, C. Towards fully automatic generation of city models. Int. Arch. Photogramm. Remote Sens. 2000, 33, 84–93. [Google Scholar]
- Fischer, A.; Kolbe, T.H.; Lang, F.; Cremers, A.B.; Förstner, W.; Plümer, L.; Steinhage, V. Extracting buildings from aerial images using hierarchical aggregation in 2D and 3D. Comput. Vis. Image Underst. 1998, 72, 185–203. [Google Scholar] [CrossRef]
- Gulch, E. Digital systems for automated cartographic feature extraction. Int. Arch. Photogramm. Remote Sens. 2000, 33, 241–257. [Google Scholar]
- Rottensteiner, F.B.C. A new method for building extraction in urban areas from high-resolution lidar data. Int. Arch. Photogramm. Remote Sens. Spat. Inf. Sci. 2002, 34, 295–302. [Google Scholar]
- Weidner, U.; Förstner, W. Towards automatic building extraction from high-resolution digital elevation models. ISPRS J. Photogramm. Remote Sens. 1995, 50, 38–49. [Google Scholar] [CrossRef]
- Tarsha-Kurdi, F.; Landes, T.; Grussenmeyer, P. Extended ransac algorithm for automatic detection of building roof planes from lidar data. Photogramm. J. Finl. 2008, 21, 97–109. [Google Scholar]
- Karantzalos, K.; Paragios, N. Large-scale building reconstruction through information fusion and 3-D priors. IEEE Trans. Geosci. Remote Sens. 2010, 48, 2283–2296. [Google Scholar] [CrossRef]
- Huang, X. Building reconstruction from airborne laser scanning data. Geo-Spat. Inf. Sci. 2013, 16, 35–44. [Google Scholar] [CrossRef] [Green Version]
- Lafarge, F.; Descombes, X.; Zerubia, J.; Pierrot-Deseilligny, M. Automatic building extraction from dems using an object approach and application to the 3D-city modeling. ISPRS J. Photogramm. Remote Sens. 2008, 63, 365–381. [Google Scholar] [CrossRef] [Green Version]
- Haala, N.; Kada, M. An update on automatic 3D building reconstruction. ISPRS J. Photogramm. Remote Sens. 2010, 65, 570–580. [Google Scholar] [CrossRef]
- Wang, H.; Zhang, W.; Chen, Y.; Chen, M.; Yan, K. Semantic decomposition and reconstruction of compound buildings with symmetric roofs from lidar data and aerial imagery. Remote Sens. 2015, 7, 13945–13974. [Google Scholar] [CrossRef]
- Suveg, I.; Vosselman, G. Reconstruction of 3D building models from aerial images and maps. ISPRS J. Photogramm. Remote Sens. 2004, 58, 202–224. [Google Scholar] [CrossRef] [Green Version]
- Verma, V.; Kumar, R.; Hsu, S. 3D building detection and modeling from aerial lidar data. In Proceedings of the 2006 IEEE Computer Society Conference on Computer Vision and Pattern Recognition, New York, NY, USA, 17–22 June 2006; Volume 2, pp. 2213–2220. [Google Scholar]
- Oude Elberink, S.; Vosselman, G. Quality analysis on 3D building models reconstructed from airborne laser scanning data. ISPRS J. Photogramm. Remote Sens. 2011, 66, 157–165. [Google Scholar] [CrossRef]
- Perera, G.S.N.; Maas, H.-G. Cycle graph analysis for 3D roof structure modelling: Concepts and performance. ISPRS J. Photogramm. Remote Sens. 2014, 93, 213–226. [Google Scholar] [CrossRef]
- Carlberg, M.; Gao, P.; Chen, G.; Zakhor, A. Urban landscape classification system using airborne lidar. In Proceedings of the IEEE International Conference on Image Processing, San Diego, CA, USA, 12–15 October 2008; pp. 1–9. [Google Scholar]
- Zhou, Q.-Y.; Neumann, U. 2.5D Dual Contouring: A Robust Approach to Creating Building Models from Aerial LiDAR Point Clouds; Springer: Berlin/Heidelberg, Germany, 2010; pp. 115–128. [Google Scholar]
- Xiong, B.; Jancosek, M.; Oude Elberink, S.; Vosselman, G. Flexible building primitives for 3D building modeling. ISPRS J. Photogramm. Remote Sens. 2015, 101, 275–290. [Google Scholar] [CrossRef]
- Xu, B.; Jiang, W.; Li, L. Hrtt: A hierarchical roof topology structure for robust building roof reconstruction from point clouds. Remote Sens. 2017, 9, 354. [Google Scholar] [CrossRef]
- Yang, B.; Huang, R.; Li, J.; Tian, M.; Dai, W.; Zhong, R. Automated reconstruction of building lods from airborne lidar point clouds using an improved morphological scale space. Remote Sens. 2017, 9, 14. [Google Scholar] [CrossRef]
- Kubovy, M.; van den Berg, M. The whole is equal to the sum of its parts: A probabilistic model of grouping by proximity and similarity in regular patterns. Psychol. Rev. 2008, 115, 131–154. [Google Scholar] [CrossRef] [PubMed]
- Wang, J.; Xu, Y.; Shum, H.-Y.; Cohen, M.F. Video tooning. ACM Trans. Graph. 2004, 23, 574–583. [Google Scholar] [CrossRef]
- Wertheimer, M. Classics in the History of Psychology—Laws of Organization in Perceptual Forms. Available online: http://psychclassics.yorku.ca/Wertheimer/Forms/forms.htm (accessed on 30 January 2018).
- Pu, S.; Vosselman, G. Knowledge based reconstruction of building models from terrestrial laser scanning data. ISPRS J. Photogramm. Remote Sens. 2009, 64, 575–584. [Google Scholar] [CrossRef]
Figure 1.
The pipeline of the proposed method.

Figure 2.
Hierarchy-tree representation of a building roof. A structure, such as a vertical chimney, can be represented as two pairs of parallel planes, while a dormer can be represented as two adjacent planes, and a roof can be combined with a set of planes.
Figure 2.
Hierarchy-tree representation of a building roof. A structure, such as a vertical chimney, can be represented as two pairs of parallel planes, while a dormer can be represented as two adjacent planes, and a roof can be combined with a set of planes.

Figure 3.
Illustration of the similarity law.

Figure 4.
Illustration of the continuity law for grouping between plane (a,b).

Figure 5.
Overview of the progressive grouping based on Roof Attribute Graphs (RAG). (a) RAG as the input and planes are denoted by different colors; (b) individual grouped structures shown as sub-graphs are represented by different colors, corresponding to the planes grouped together.
Figure 5.
Overview of the progressive grouping based on Roof Attribute Graphs (RAG). (a) RAG as the input and planes are denoted by different colors; (b) individual grouped structures shown as sub-graphs are represented by different colors, corresponding to the planes grouped together.

Figure 6.
One iteration of the progressive grouping process. A grouped structure is a sub-graph in the RAG, marked in the illustration with a yellow rectangle and black circles.
Figure 6.
One iteration of the progressive grouping process. A grouped structure is a sub-graph in the RAG, marked in the illustration with a yellow rectangle and black circles.

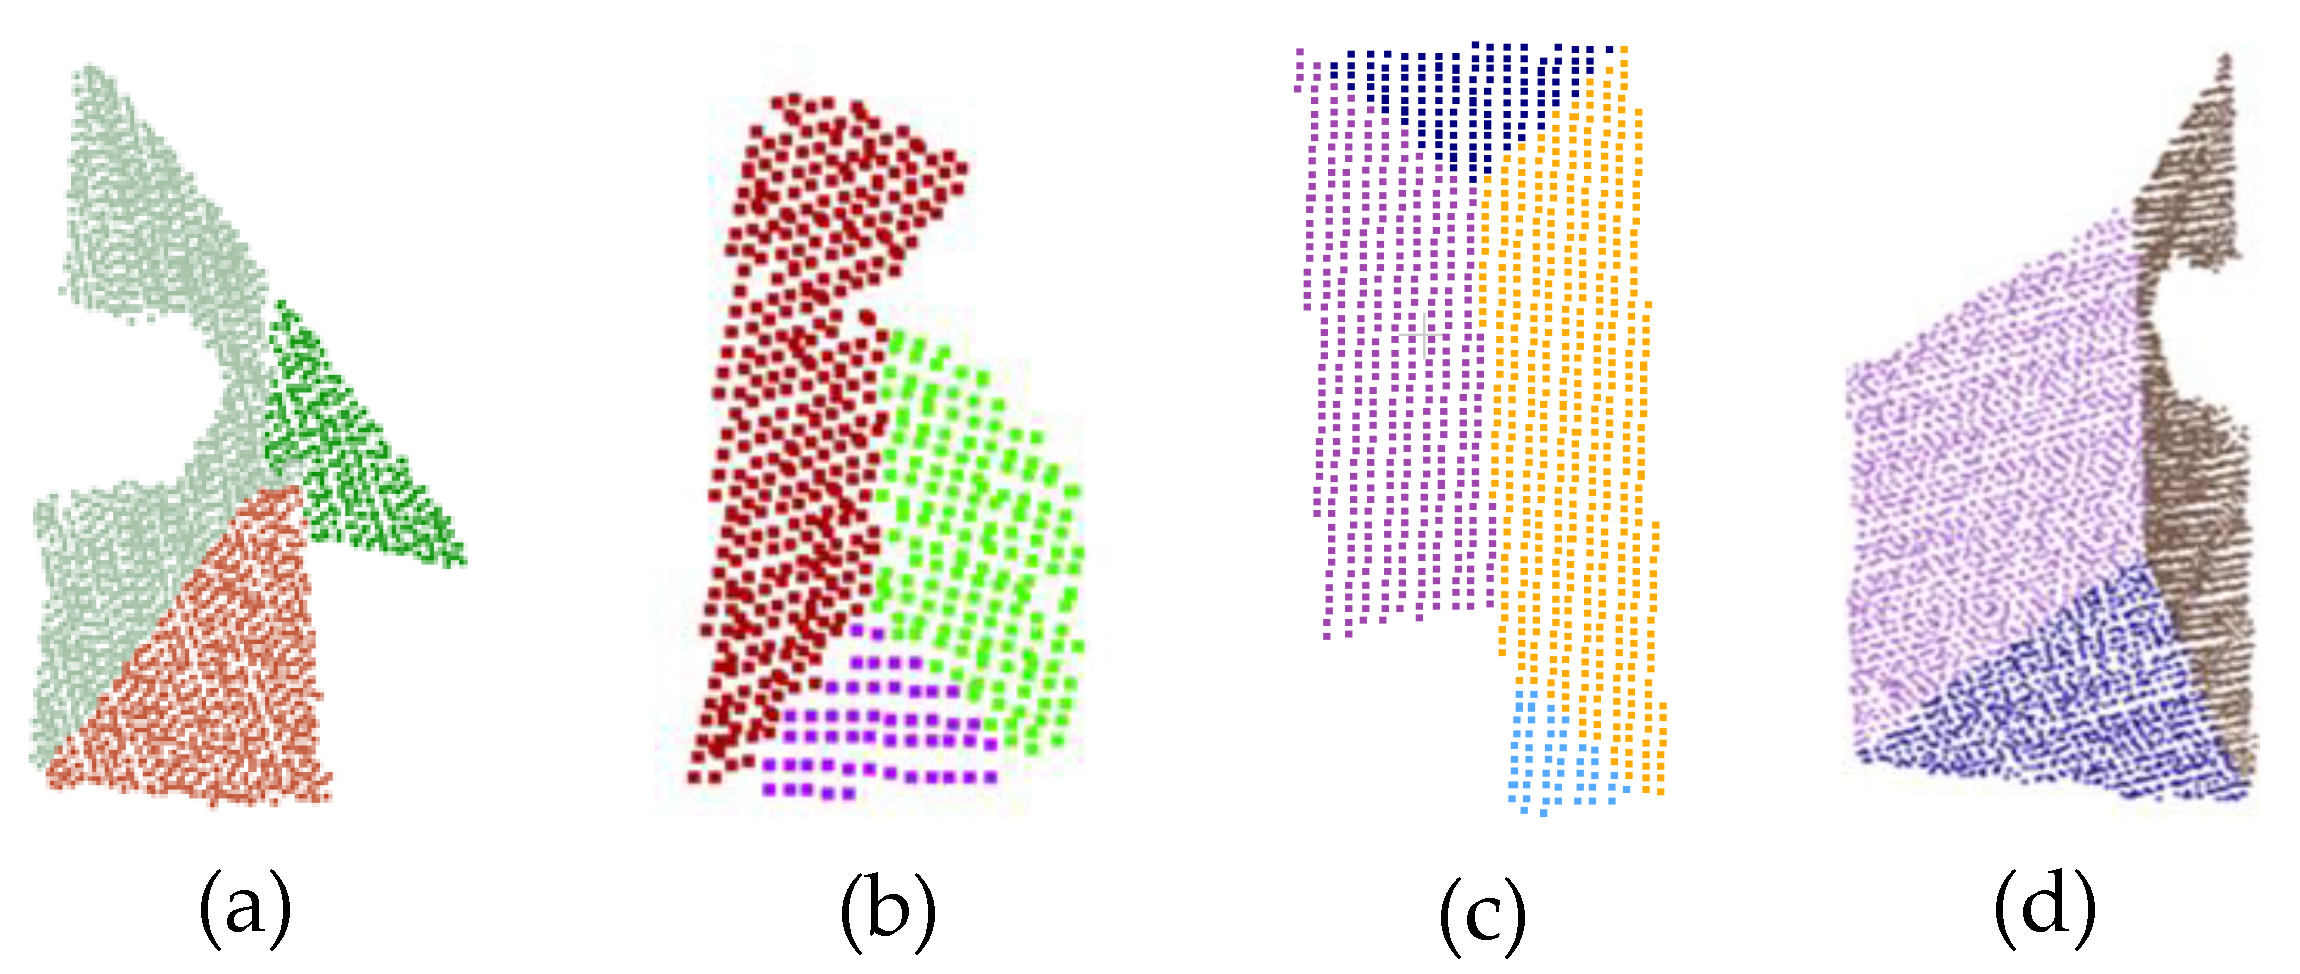
Figure 7.
Some ambiguous structures (a–d) need to be refined.

Figure 8.
Overview of the model refinement. (a) Structures before refinement; (b) the final structured model and the refined hierarchical structure tree. Each color represents an individual structure.
Figure 8.
Overview of the model refinement. (a) Structures before refinement; (b) the final structured model and the refined hierarchical structure tree. Each color represents an individual structure.

Figure 9.
Illustration of the symmetry characteristics between adjacent planes.

Figure 10.
A process of model refinement. (a) Initial grouped structures and the corresponding sub-graph of RAG; (b) symmetry enhancement with structural knowledge; (c) closed hull loop detection by the projected primitives; and (d) the final refined structures and updated graph.
Figure 10.
A process of model refinement. (a) Initial grouped structures and the corresponding sub-graph of RAG; (b) symmetry enhancement with structural knowledge; (c) closed hull loop detection by the projected primitives; and (d) the final refined structures and updated graph.

Figure 11.
The final hierarchical structure model after the enhancement. (a) Original building point cloud; (b) the refined structures and updated graph.
Figure 11.
The final hierarchical structure model after the enhancement. (a) Original building point cloud; (b) the refined structures and updated graph.

Figure 12.
Results of the plane segmentation and 3D reconstruction (Vaihinge, Area 3).

Figure 13.
Results of roof plane segmentation and 3D reconstruction from the Guangdong dataset.

Figure 14.
Results of roof reconstruction (a–c). Structural models (top) and its grouped structures (bottom): structures are marked with different colors; the black line is the geometric vector boundary.
Figure 14.
Results of roof reconstruction (a–c). Structural models (top) and its grouped structures (bottom): structures are marked with different colors; the black line is the geometric vector boundary.

Figure 15.
Comparison of the proposed building reconstruction approach with the standard methods. (a) The original input building point cloud; (b) a whole 3D model by [39]; (c) three roof parts constructed by [44]; and (d) the results of the proposed method. These red colored models are the 3D roof parts (top), while these black wireframes are the projection of the associated roof parts (bottom).

Figure 16.
Incorrect and ambiguous matching of different buildings from the same topological graph.

Figure 17.
Results of the incomplete and failed reconstruction models. Building models in the top of (a–c) are the incomplete models with segmented roof points, and the bottom are the ground truth. In addition, the left two in (d) are the results of the plane segmentation, while the right two are the failed models expressed by colored grouped points.

Figure 18.
Evaluation of our reconstructed roof planes and reference data. 3D information is converted to a label image. In the middle column, the yellow color denotes true positive pixels (TP), the red color denotes false positive pixels (FP), and the blue color denotes false negative pixels (FN).
Figure 18.
Evaluation of our reconstructed roof planes and reference data. 3D information is converted to a label image. In the middle column, the yellow color denotes true positive pixels (TP), the red color denotes false positive pixels (FP), and the blue color denotes false negative pixels (FN).

Figure 19.
Plane overlap assessment—histogram of the overlap of reference roof planes by ISPRS.

Figure 20.
Topological differences between the 3D roof planes (results: Reference).

Figure 21.
Evaluation on a per-roof plane level between the object size and reconstruction quality—individual (a) and cumulative (b).
Figure 21.
Evaluation on a per-roof plane level between the object size and reconstruction quality—individual (a) and cumulative (b).

Figure 22.
Comparison of all reconstruction roof planes with the four state-of-the-art methods on the ISPRS dataset. We use the same method name as the website described.
Figure 22.
Comparison of all reconstruction roof planes with the four state-of-the-art methods on the ISPRS dataset. We use the same method name as the website described.

Figure 23.
Comparison of the geometrical accuracy of the four-state-of-art reconstruction methods.


Table 1.
The details of the progressive decomposition and grouping algorithm.
| Input |
| Output: clustered roof structures and initial hierarchical tree |
| 1: generate a Roof Attribute Graph (RAG) |
| do |
| using a greedy grouping based RAG |
| from |
| do |
| and RAG |
| 9: end for |
| 10: end while |
Table 2.
Description of the two urban area datasets.
| Site | Guangdong (China) | Vaihingen (Germany) |
|---|---|---|
| Acquired Date | May 2016 | August 2008 |
| Acquisition System | Trimble Harrier 68i | Leica ALS50 |
| Fly Height | 800 m | 500m |
| Buildings | 83 | 56 |
| Covered Area | 340 × 360 m2 | 150 × 220 m2 |
| Point Density | 12–15 points/m2 | 4–6 points/m2 |
Table 3.
Quantitative evaluation results of 3D reconstruction with the Guangdong datasets.
| Items | Value |
|---|---|
| All buildings | 83 |
| All roof planes | 257 |
| Full reconstructed buildings | 77 |
| Reconstructed planes | 249 |
| Average distance between a point to the reconstructed plane (m) | 0.033 |
Table 4.
Roof segmentation: Quantitative assessment with respect to the reconstructed objects.
| Items of Roof Planes | Numbers | Area (m2) |
|---|---|---|
| Reconstructed | 133 | 7627.0 |
| True Positive (TP) | 130 | 7618.3 |
| False Positive (FP) | 3 | 8.7 |
| False Negative (FN) | 34 | 312.1 |
Table 5.
Comparison of topological errors between the reference and reconstructed (reference: Results).
Table 5.
Comparison of topological errors between the reference and reconstructed (reference: Results).
| Region | Method | (1:M) Over Segmentation | (N:1) Under Segmentation | (N:M) Over and Under Segmentation |
|---|---|---|---|---|
| Vaihingen Area 3 | CKU | 4 | 48 | 2 |
| ITCX3 | 3 | 50 | 2 | |
| YOR | 2 | 51 | 1 | |
| WROC_2b | 3 | 52 | 3 | |
| Proposed | 0 | 48 | 1 |
Note: The name of the four state-of-the-art algorithms is the same as the website.
Table 6.
Quality metrics of the building reconstruction results (per-area level).
| Completeness per-area | 92.9% |
| Correctness per-area | 98.8% |
| Quality per-area | 91.8% |
| Completeness objects larger than 10 m2 | 96.0% |
| Correctness objects larger than 10 m2 | 100.0% |
| Quality objects larger than 10 m2 | 96.0% |
Table 7.
Comparison of the final reconstruction performance (per-roof plane).
| Region | Method | All Roof Planes | Large Roofs with Area Greater than 10 m2 | ||
|---|---|---|---|---|---|
| Completeness | Correctness | Completeness | Correctness | ||
| Vaihingen Area 3 | CKU | 81.3% | 98.4% | 91.9% | 99.1% |
| ITCX3 | 88.1% | 88.2% | 96.8% | 95.8% | |
| YOR | 84.7% | 100.0% | 97.6% | 100.0% | |
| WROC_2b | 81.7% | 100.0% | 92.7% | 100.0% | |
| Proposed | 85.5% | 97.7% | 96.0% | 100.0% | |
Note: The name of the four state-of-the-art algorithms is the same as the website.
© 2018 by the authors. Licensee MDPI, Basel, Switzerland. This article is an open access article distributed under the terms and conditions of the Creative Commons Attribution (CC BY) license (http://creativecommons.org/licenses/by/4.0/).
Share and Cite
MDPI and ACS Style
Hu, P.; Yang, B.; Dong, Z.; Yuan, P.; Huang, R.; Fan, H.; Sun, X. Towards Reconstructing 3D Buildings from ALS Data Based on Gestalt Laws. Remote Sens. 2018, 10, 1127. https://doi.org/10.3390/rs10071127
AMA Style
Hu P, Yang B, Dong Z, Yuan P, Huang R, Fan H, Sun X. Towards Reconstructing 3D Buildings from ALS Data Based on Gestalt Laws. Remote Sensing. 2018; 10(7):1127. https://doi.org/10.3390/rs10071127
Chicago/Turabian StyleHu, Pingbo, Bisheng Yang, Zhen Dong, Pengfei Yuan, Ronggang Huang, Hongchao Fan, and Xuan Sun. 2018. "Towards Reconstructing 3D Buildings from ALS Data Based on Gestalt Laws" Remote Sensing 10, no. 7: 1127. https://doi.org/10.3390/rs10071127
Note that from the first issue of 2016, this journal uses article numbers instead of page numbers. See further details here.