Article

Glacier Change, Supraglacial Debris Expansion and Glacial Lake Evolution in the Gyirong River Basin, Central Himalayas, between 1988 and 2015

1
The Faculty of Geography and Resource Sciences, Sichuan Normal University, Chengdu 610101, China
2
Institute of Mountain Hazards and Environment, Chinese Academy of Sciences, Chengdu 610041, China
3
University of Chinese Academy of Sciences, Beijing 100049, China
4
Sino-Nepal Joint Research Center for Geography, Chengdu 610041, China
5
Department of Geography, Kansas State University, Manhattan, KS 66506, USA
6
Key Laboratory of Land Surface Pattern and Simulation, Institute of Geographic Sciences and Natural Resources Research, Chinese Academy of Sciences, Beijing 100101, China
7
Department of Earth Sciences, Karakoram International University, Gilgit-Baltistan 15100, Pakistan
*
Author to whom correspondence should be addressed.
Remote Sens. 2018, 10(7), 986; https://doi.org/10.3390/rs10070986
Submission received: 4 May 2018 / Revised: 28 May 2018 / Accepted: 20 June 2018 / Published: 21 June 2018
(This article belongs to the Special Issue Mountain Remote Sensing)

Abstract

:
Himalayan glacier changes in the context of global climate change have attracted worldwide attention due to their profound cryo-hydrological ramifications. However, an integrated understanding of the debris-free and debris-covered glacier evolution and its interaction with glacial lake is still lacking. Using one case study in the Gyirong River Basin located in the central Himalayas, this paper applied archival Landsat imagery and an automated mapping method to understand how glaciers and glacial lakes interactively evolved between 1988 and 2015. Our analyses identified 467 glaciers in 1988, containing 435 debris-free and 32 debris-covered glaciers, with a total area of 614.09 ± 36.69 km2. These glaciers decreased by 16.45% in area from 1988 to 2015, with an accelerated retreat rate after 1994. Debris-free glaciers retreated faster than debris-covered glaciers. As a result of glacial downwasting, supraglacial debris coverage expanded upward by 17.79 km2 (24.44%). Concurrent with glacial retreat, glacial lakes increased in both number (+41) and area (+54.11%). Glacier-connected lakes likely accelerated the glacial retreat via thermal energy transmission and contributed to over 15% of the area loss in their connected glaciers. On the other hand, significant glacial retreats led to disconnections from their proglacial lakes, which appeared to stabilize the lake areas. Continuous expansions in the lakes connected with debris-covered glaciers, therefore, need additional attention due to their potential outbursts. In comparison with precipitation variation, temperature increase was the primary driver of such glacier and glacial lake changes. In addition, debris coverage, size, altitude, and connectivity with glacial lakes also affected the degree of glacial changes and resulted in the spatial heterogeneity of glacial wastage across the Gyirong River Basin.

Graphical Abstract

1. Introduction

Glaciers are an important component of the global water cycle and are highly sensitive to climate change [1,2]. The Tibetan Plateau (TP), widely known as the “Third Pole”, hosts the largest coverage of glaciers except for the Antarctic and Arctic regions [3,4,5]. Under current global warming, glaciers on the TP are losing their areas and masses through extensive retreats and downwasting [3,6]. Of them, the Himalayan glaciers have exhibited the greatest deficit in mass balance during the recent decades and have attracted worldwide attention from both scientific and public communities [1,3,7,8,9]. Changing glaciers in the Himalayas affect not only regional water management [6,10] and chemical compositions of surface fresh water [11,12,13] but also the occurrence of glacier-related disasters, such as glacial lake outburst floods (GLOFs). Historical GLOFs result in catastrophic destructions and fatalities [14,15,16,17] in the Himalayas, which is labeled as one of the major GLOF-vulnerable regions in the world [18,19,20,21,22,23,24,25,26].
Due to difficult access to frigid alpine environments, remote sensing is the most feasible method for monitoring large-scale dynamics in glaciers and glacial lakes [27,28,29,30,31,32]. The freely available Landsat imagery since 1972, owing to its multi-decadal record and relatively high spatial resolution (30 m), has been widely used in inventorying and analyzing glacier and glacial lake changes [33,34,35,36,37,38,39]. Landsat imagery is also one of the primary data sources for many global and regional glacier products, such as the global land ice measurements from space (GLIMS) glacier data [40], the Gamdam glacier inventory (GGI) [41], the Randolph glacier inventory (RGI) [42], and the second China glacier inventory (CGI) [43]. These glacier products improve our understanding of land glacial distributions and have been widely applied in cryo-hydrological modeling. However, these existing products vary by data source, acquisition time, mapping method, and accuracy, which may lead to secondary errors in estimating glacier changes in a specific region. Case studies in the Xainza Xiegang Mountains and Koshi River Basin, for instance, show that the second CGI [43] outperforms other glacier datasets in terms of glacier outlines [5,44]. Such discrepancies often require the generation of new glacier datasets with consistent data sources and methods in order to reduce the uncertainties in change analysis.
Debris covers contribute to the spatial heterogeneity of glacier changes across the Himalayas [45,46,47]. However, existing glacier products, including GLIMS, GGI, RGI, and CGI, as well as results from other relevant studies [48,49,50], did not distinguish between the debris-free portion (thereafter C-part) and the debris-covered portion (D-part) of a debris-covered glacier (D-glacier). It is difficult to automatically extract the extent of D-part glaciers using optical satellite images alone because of the spectral mixture between supraglacial debris and other moraines [5,49,51,52,53,54,55]. Visual delineation of D-part glaciers is extremely time-consuming. Although a recent study revealed that the debris coverage over glaciers on the south slope of the Mount Everest increased by 17.6% between 1962 and 2011 [56], we know little about the development of glacier debris covers across the Himalayas. Recently, a glacier inventory in the eastern Himalayas was completed using manual digitization on the advanced land observing satellite (ALOS) images acquired between 2006 and 2011 [57]. In this regional inventory, D-glaciers were divided into the C-part and D-part. Debris mantle has implications for the glacier response to climate change and development of glacial lakes [46,58], which are also influenced by the slope and flow velocity of ice in the glacier ablation zones [59]. Inversely, the dynamics of supraglacial lakes on nine D-glaciers in the Everest region revealed the effect of glacial lakes on promoting ablation via ice cliff calving [60]. Inter-conversion of glacial lake types caused by continuous glacier retreat, such as from supraglacial lakes to moraine-dammed lakes, was observed in the Himalayas in previous studies [22,48]. The integrated assessments for dynamic evolutions of D-parts and the interplay between glacier and glacial lake changes at multiple spatio-temporal scales are urgently required.
The Gyirong River Basin (GRB), a total area of 4640 km2, is located between Gyirong County, China and Bagmati, Nepal (Figure 1) within the central Himalayas. The GRB extends from the lowest elevation of 590 m a.s.l. (above sea level) to the highest 7360 m a.s.l., and contained a total glacier area of 614 km2 in 1988. The Gyirong Pass in this basin has been the only open trade port between China and Nepal since the Nepal earthquake in 2015, which caused severe destruction and the closure of the previous Nyalam Pass. Historically, GLOFs, such as those originating from Longda Tsho and Zanaco, also destroyed downstream roads and villages in the GRB [23,61]. With the booming of Sino-Nepal economic trade, infrastructures such as transboundary highways and railways are complete, under construction, or upcoming. The issues of water resource and glacier-related hazards at the watershed scale have become increasingly important. However, the latest status, changes and, interplay between glaciers and glacial lakes in the GRB during the past decades are not fully understood.
To this end, we aim to (1) investigate the latest distribution of glaciers and glacial lakes using advanced mapping methods in the entire GRB; (2) reveal the changing characteristics for glaciers and glacial lakes using consistent Landsat images at six discrete episodes (1988, 1994, 2001, 2006, 2010, and 2015); and (3) improve the awareness of the interaction between glaciers and glacial lakes in the central Himalayas at a river basin scale.

2. Materials and Methods

2.1. Data

A total of 21 Landsat images were employed to map glacier and glacial lake extents in the studied GRB (Table 1). These images with a spatial resolution of 30 m were acquired from Landsat Thematic Mapper (TM), Enhanced Thematic Mapper Plus (ETM+), and Landsat 8 Operational Land Imager (OLI) in six discrete years (episodes) between 1988 and 2015. Because of frequent cloud contamination over the Himalayas, it was practically difficult to obtain ideal-quality imageries during the exact same month [49,62]. Based on existing hydrological observations, glacier ablation in the central Himalayas mainly occurs during the summer (between June and August) [30,63], and the seasonal changes in glaciers and glacial lakes from September and December are relatively minor. Therefore, we here acquired the best possible images during the latter period (between September and December). In addition, another 9 images were also selected as auxiliary data in order to reduce the uncertainties caused by sporadic noises such as seasonal snow, terrain shadow, and regional cloud covers.
Other datasets used in this study include the second CGI data set [43], high-resolution images from Google Earth, the ASTER Global Digital Elevation Model (ASTER GDEM, 30 m) version 2 [64,65,66], and the annual mean air temperature and precipitation data from the nearest two meteorological stations (Tingri County and Nyalam County) between 1988 and 2015 provided by the China Meteorological Administration (http://www.cma.gov.cn/).

2.2. Methods

We mapped the extents of glaciers and glacier lakes using an object-oriented automated algorithm followed by a rigorous visual quality assurance and manual inspection. Specifically, the normalized difference snow/ice index (NDSII) [67,68] was employed for extracting glaciers while the normalized difference water index (NDWI) [69,70] was used for mapping glacial lakes. The detailed procedure of the automated algorithm was described previously for both glacier mapping [5,49] and lake mapping [22,71,72,73]. Both the automatically mapping methods contain pre-processing of Landsat images, object segmentation, setting the threshold and converting from raster data into vector format. Outputs of the automated mapping in the format of shapefile were then meticulously inspected against their source Landsat imagery and, when necessary, modified with assistance of a graphical user interface (GUI) as developed by Wang et al. [71]. The GUI-based mapping tool was originally developed for mapping open surface water only [71,72,74]. Here we further extended this tool by adding the function of delineating and revising glacier extents using NDSII. As we described previously, mapped glaciers were classified into debris-free glaciers (C-glaciers) and D-glaciers, with the latter further classified into C-part and D-part areas using NDSII with aid of the interactive mapping tool. The C-glacier and C-part areas were well mapped by NDSII and separated individually by drainage divides while debris cover was arduous to be automatically extracted. The D-part area in this study was digitized manually with reference to the CGI data in China and GGI in Nepal, the source Landsat images, and high-resolution Google Earth images. The C-part and D-part layers were saved as single layers and were also merged to generate the new D-glacier data (approximate 1-month processing). Glacial lakes were classified into five groups based on their spatial relationships with ‘mother’ glaciers at the same acquisition time, namely (1) supraglacial lake; (2) C-glacier connected lake; (3) D-glacier connected lake; (4) glacier-fed but unconnected lake; and (5) non-glacier-fed lake. Our minimum mapping unit is five Landsat pixels (~0.005 km2) and polygons smaller than this threshold were removed. Quality assurance procedures includes three steps: (1) inspecting each lake and glacier at one time point with reference to Landsat source image and Google Earth high-resolution images and correcting the extent of lake and glacier if an error was found; (2) multi-temporal cross-checking for glacier and glacial lake data over the six episodes between 1988 and 2015 to remove unreasonable changes; and (3) validating the topology for glacier and glacial lake data, including deletion of small silver polygons, repeated polygon removal et al. The margins of D-part glaciers were visually identified and modified with the aid of multi-temporal high-resolution images from Google Earth and Landsat images. The misclassification of glaciers and glacial lakes because of seasonal snow or cloud cover, topographic shadows and cloud shadows was corrected by auxiliary images acquired in the same or adjacent years and cross-check from multi-temporal images. Although the chronological cross-validation is a time-consuming post-editing (approximate 2-month processing), this is essential to generate high quality data with removal of remnant noises and to improve the reliability of change detections.
The uncertainties in mapped glaciers and glacier lake areas were calculated using an error of ±0.5 pixels and the perimeter of each mapped glacier or glacial lake as the method described in previous studies [5,22,59,75]. Hypsometric and topographic characteristics were estimated for individual glaciers and glacial lakes in association with DEM, DEM-derived slopes and aspect data.

3. Results

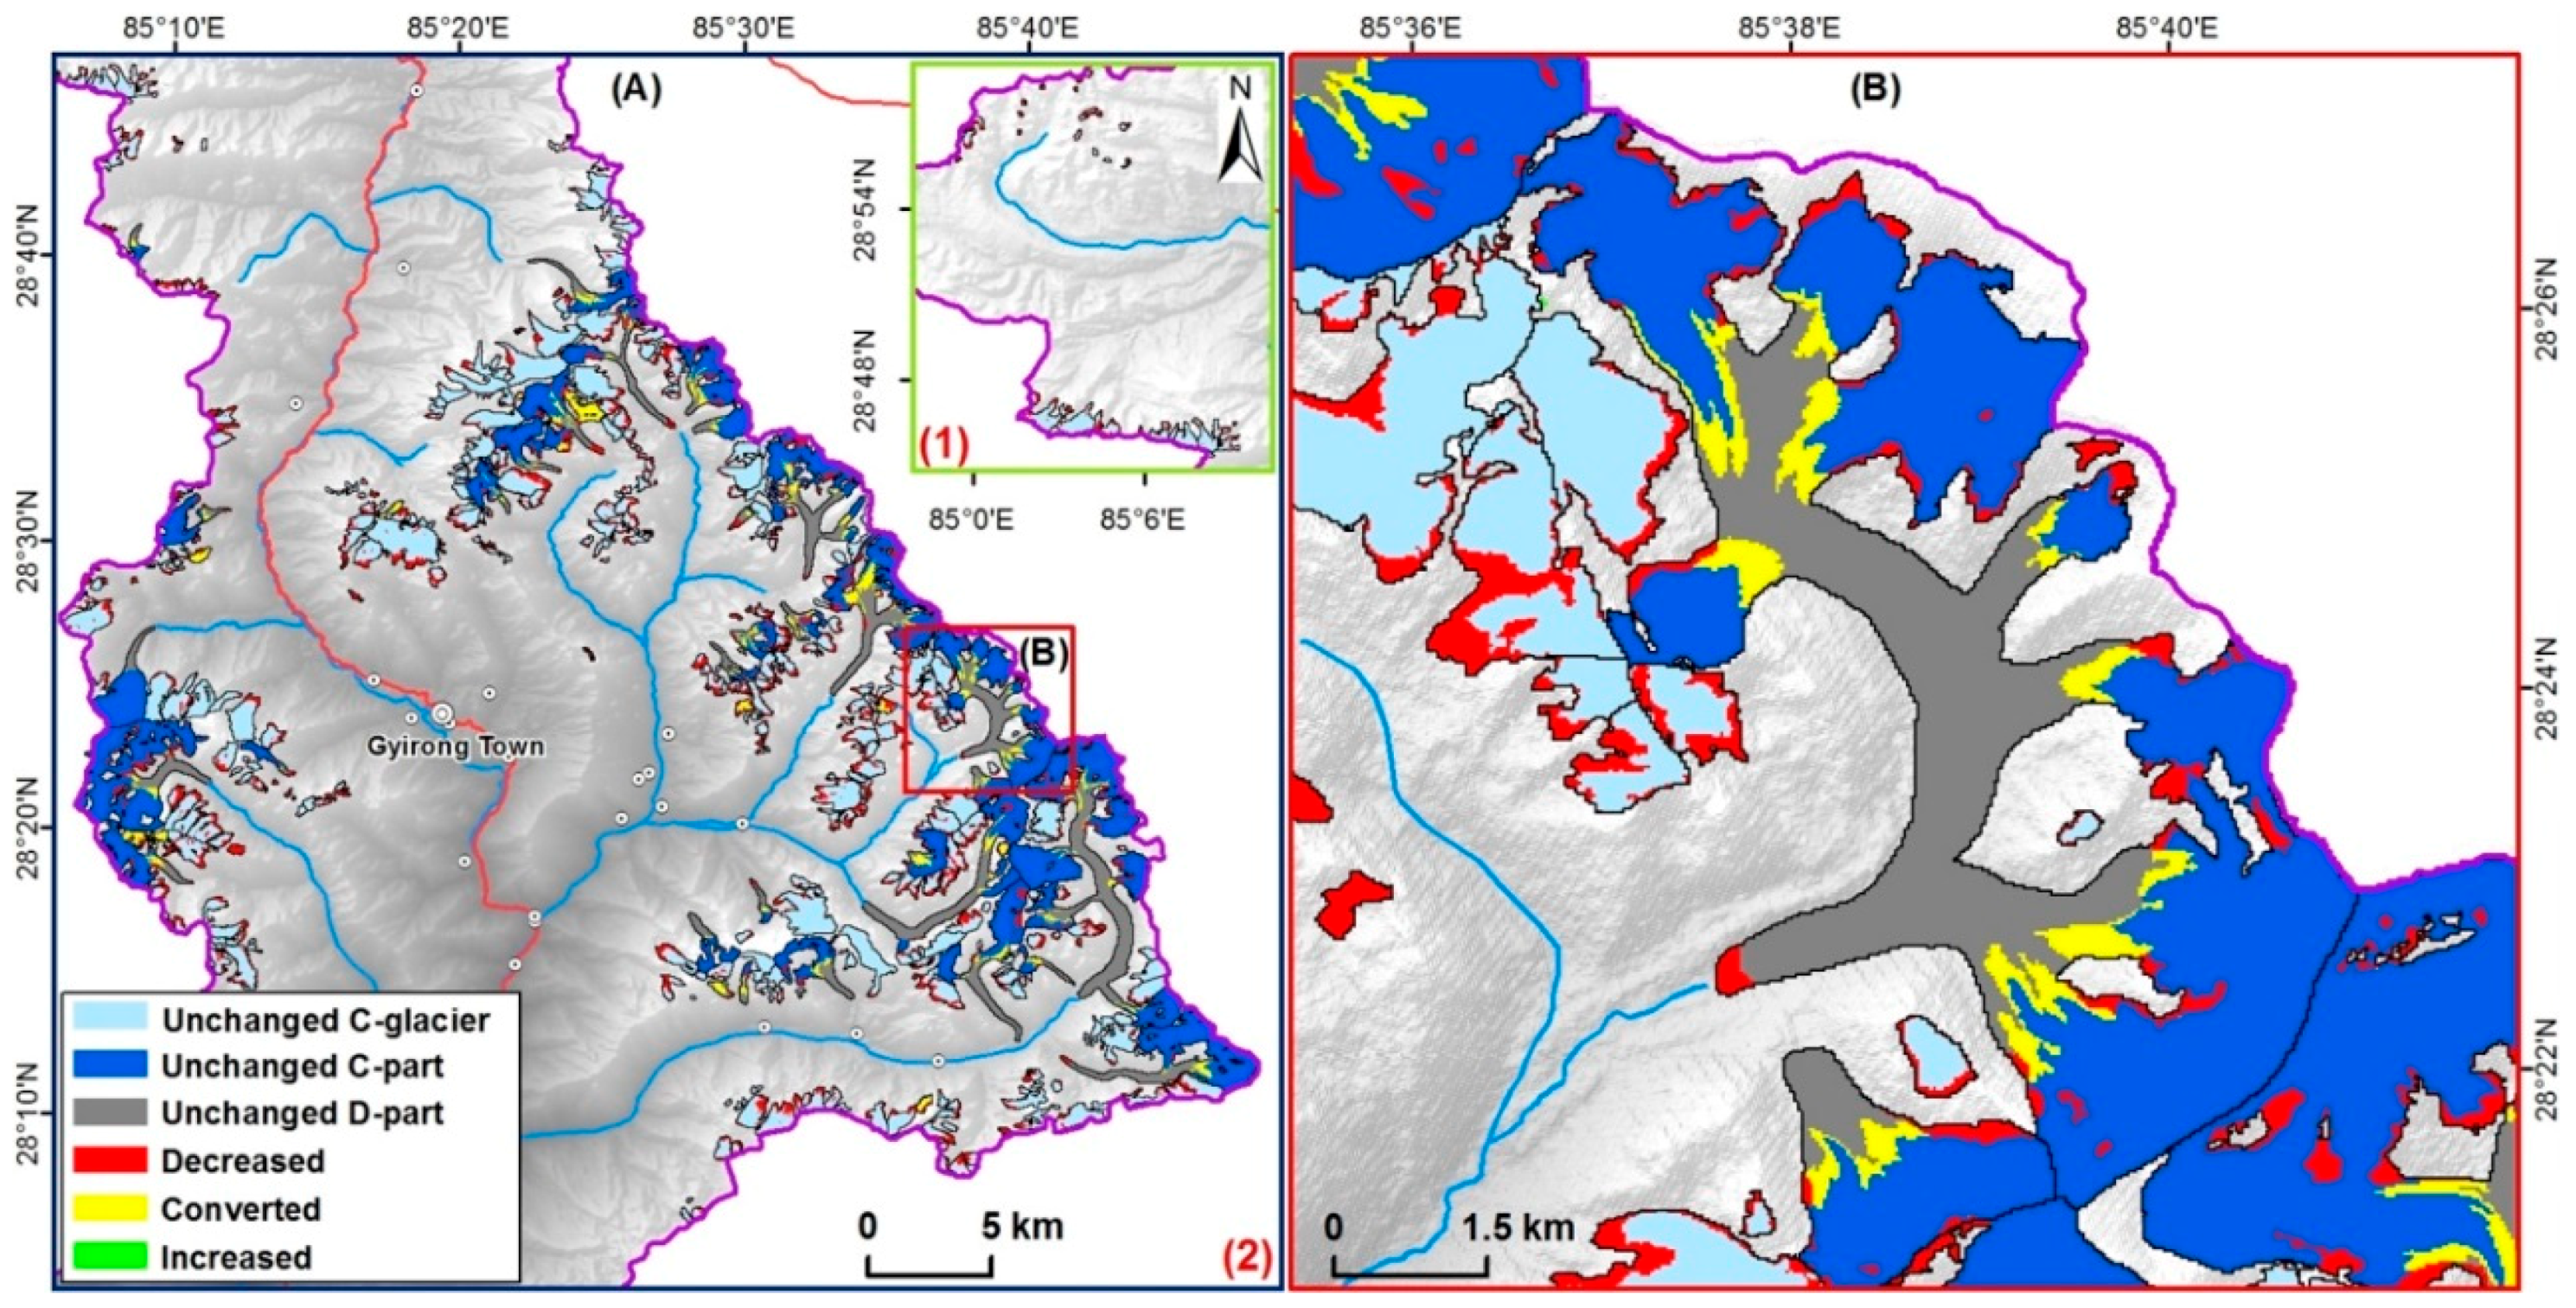
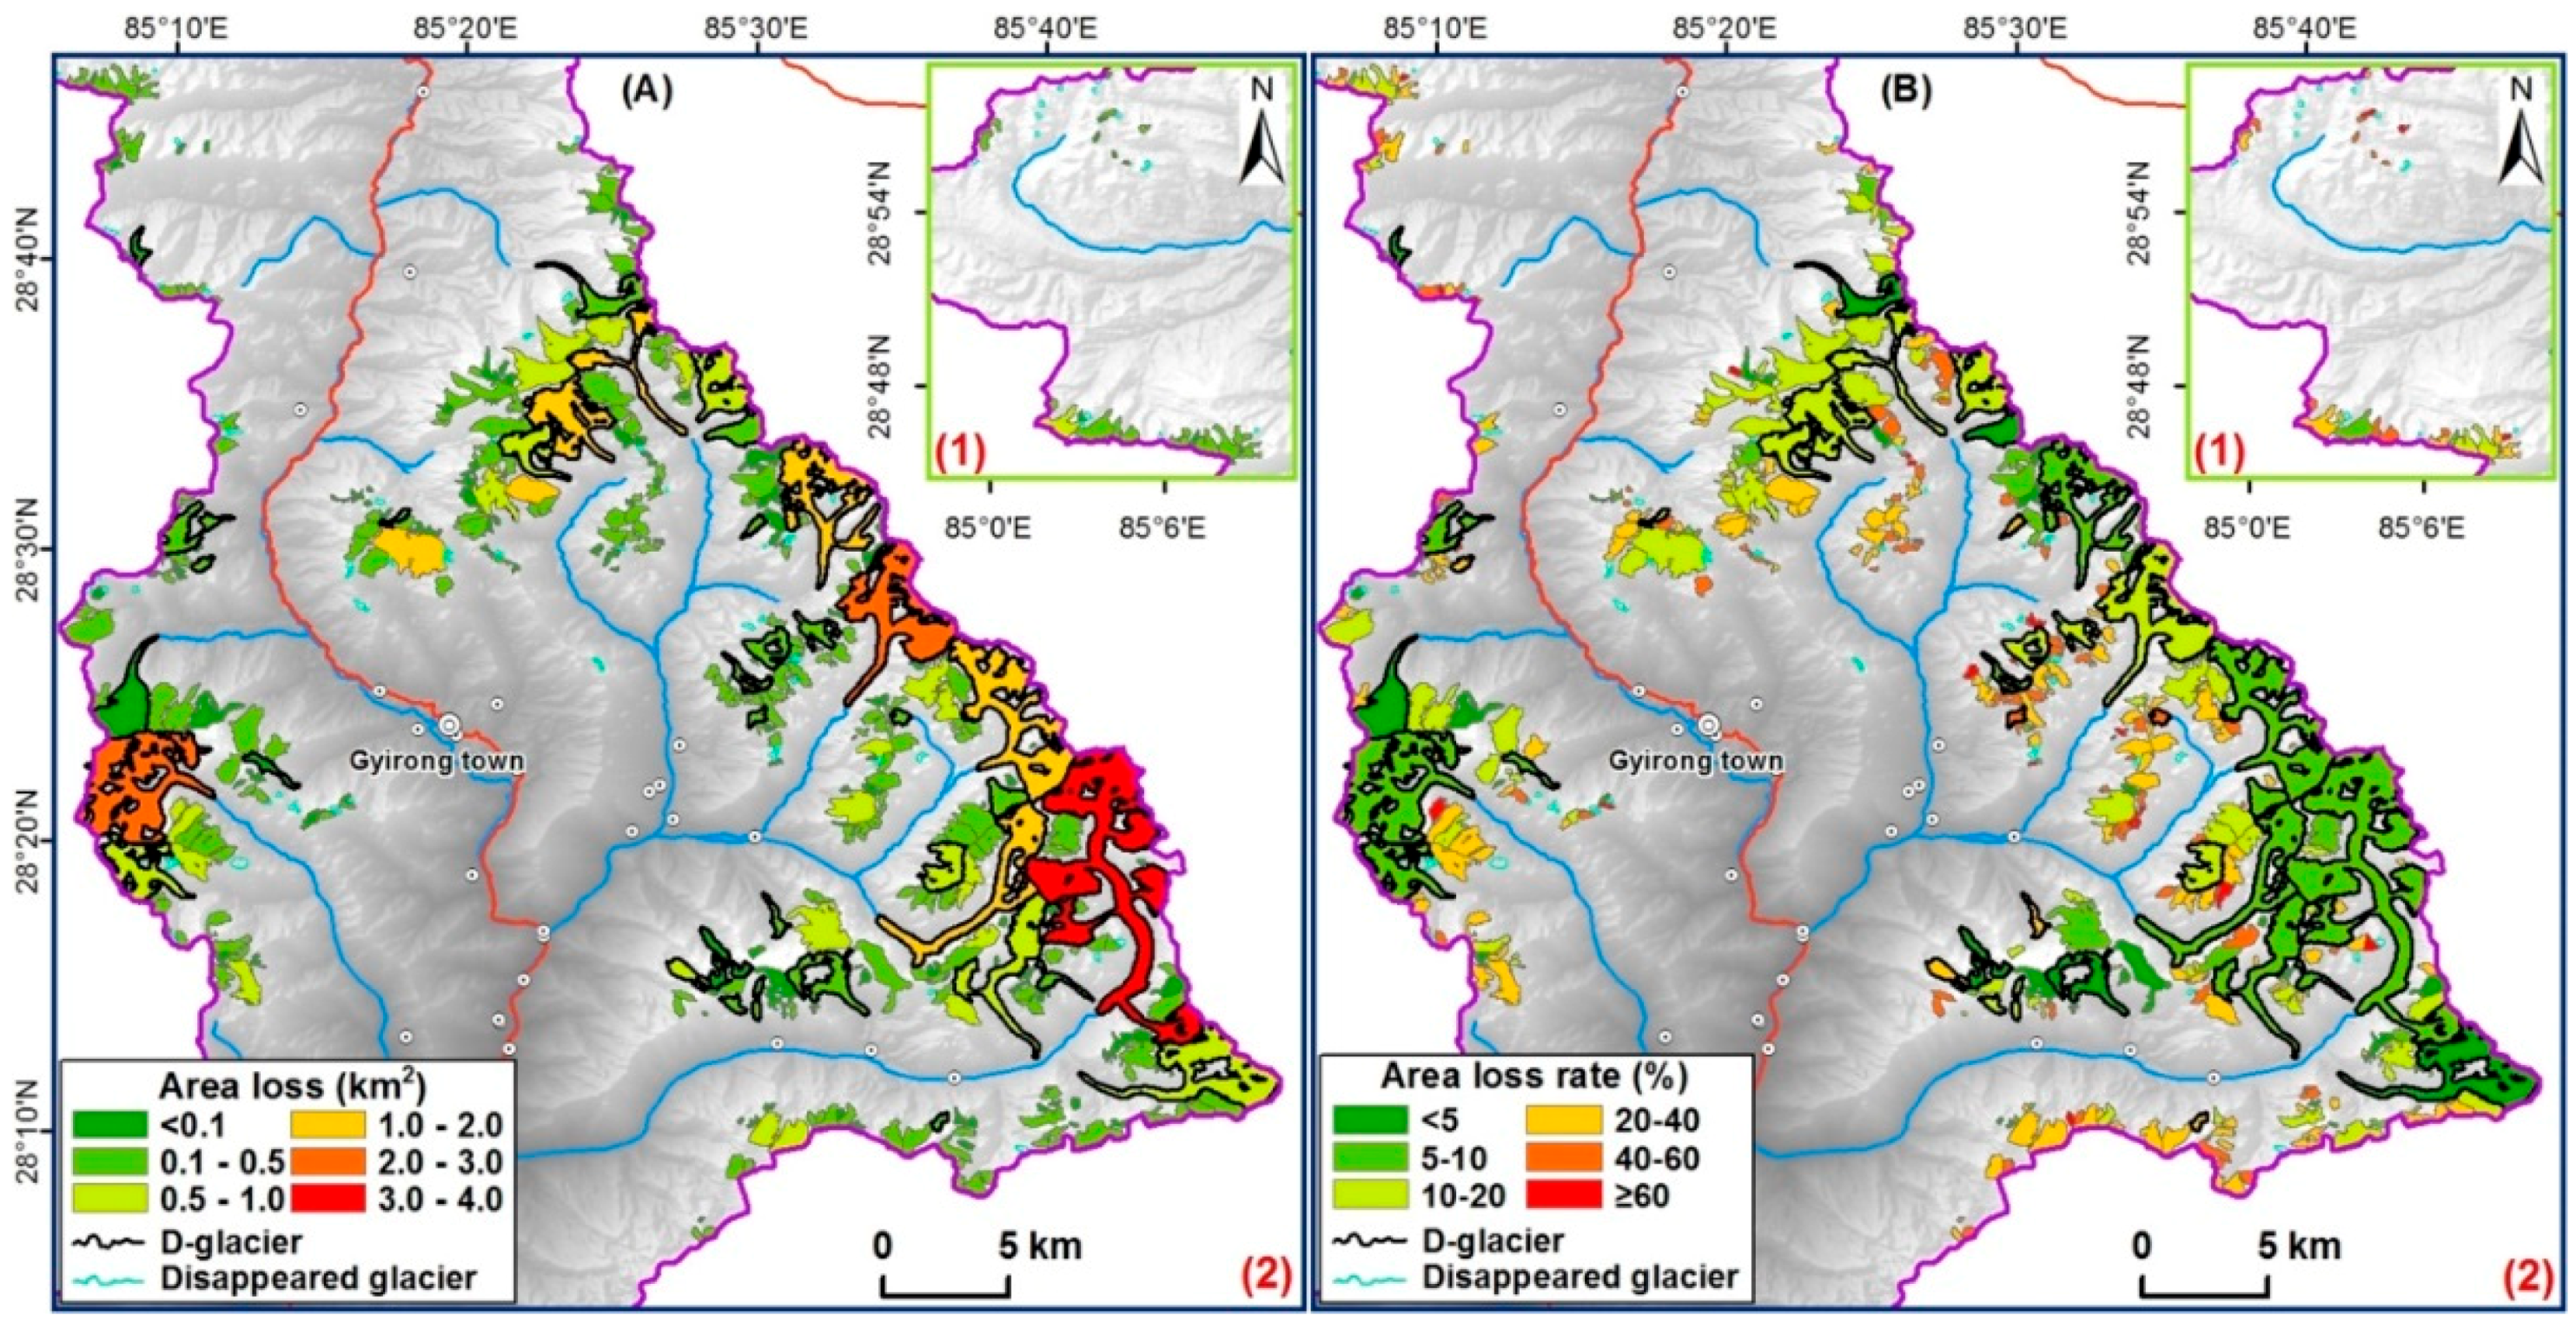
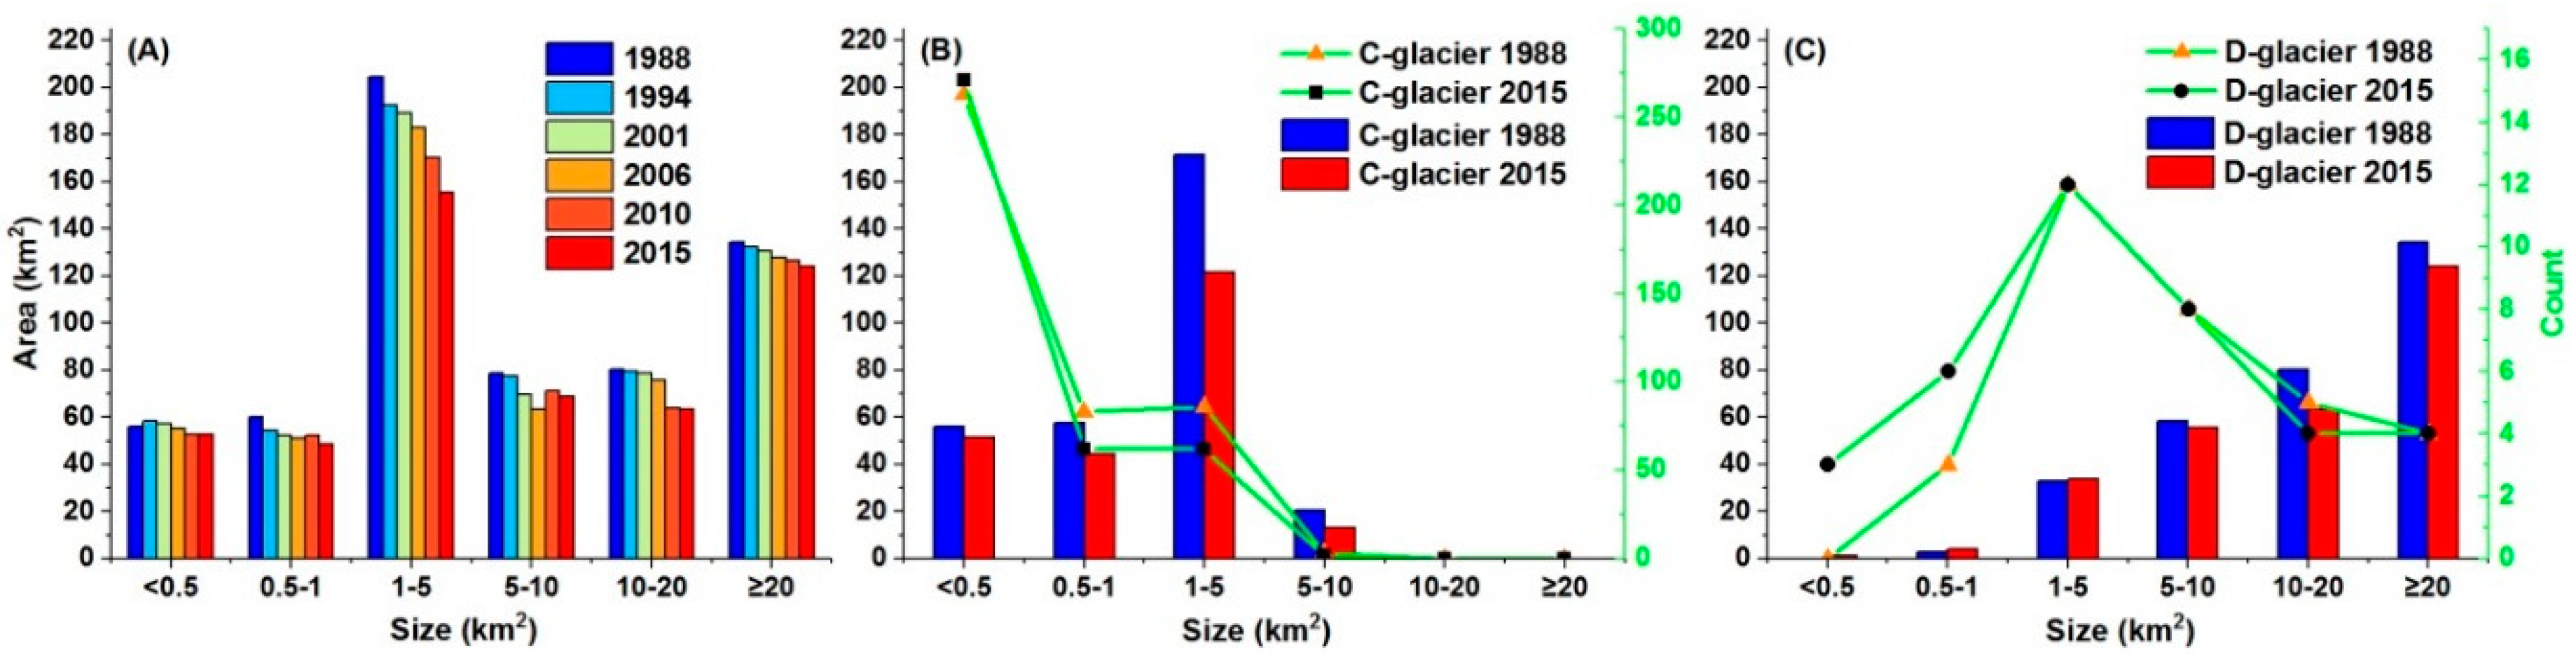
3.1. Glacier Distribution and Changes

Table 2 shows the statistics of our mapped glaciers between 1988 and 2015 across the GRB. During the past three decades, glaciers in the GRB exhibited a declining trend in both number and area: from 467 and 614.09 ± 36.69 km2 in 1988 to 434 and 513.07 ± 35.11 km2 in 2015. Glaciers in the GRB were dominated by type C in number, but type D in area, implying that D-glaciers tend to have a greater average area than C-glaciers. Within D-glaciers, the C-part area is predominant in each of the 6 studied episodes. However, the total C-part area shows a decreasing trend while the D-part area increased. Of the total areas of D-glaciers in 1988 (308.58 km2) and in 2015 (282.13 km2), the C-part accounts for 235.80 km2 (76.42%) and 191.56 km2 (67.90%), respectively, whereas debris cover increased by 17.79 km2, from 23.58% to 32.10% of D-glaciers.
As shown in Table 3, glaciers in the GRB retreated rapidly during 1988–2015, and the retreat rate appears to have accelerated further since 1994. A total of 38 C-glaciers disappeared from 1988 to 2015. Five D-glaciers emerged from the previous C-glaciers between 2001 and 2010, as a result of surface downwasting and then debris formation at the termini of C-glaciers. In general, the areas of C-glaciers, D-glaciers, and C-part glaciers continued to decrease throughout the six episodes from 1988 to 2015, which is in sharp contrast with the consecutive increase in the area of D-part glaciers.
We further summarized four major scenarios for glacial changes between 1988 and 2015, which are no change, decrease, conversion, and increase (Figure 2 and Table 4). The conversion among C-glacier, C-part glacier and D-part glacier was first calculated by spatial overlap analysis, then each changing type was summed and categorized into these four scenarios. The most evident decrease was identified in C-glaciers (−76.77 km2) and C-part glaciers (−21.88 km2). The conversions among C-part, D-part, and C-glaciers are also obvious. For example, quite a few C-part glaciers were converted to D-part glaciers during the process of glacial downwasting, and some C-part glaciers were disaggregated into smaller sizes owing to glacial splitting at the upper levels. Although glacier changes in the GRB are dominated by the decrease and conversion scenarios, minor expansions are also observed in C-glaciers and C-part glaciers (approximate 0.2 km2 in total), which were likely caused by ice motion or ice avalanche. In summary, the total area decreased by 74.57 km2 (24.41%) in C-glaciers and by 44.24 km2 (18.76%) in C-part glaciers between 1988 and 2015, while D-part glaciers increased by 17.79 km2 (24.44%) (Table 3 and Table 4).
Glacier changes in the GRB exhibit a strong spatial heterogeneity from 1988 to 2015. In comparison with C-glaciers, individual D-glaciers show greater area losses (Figure 3A). The largest D-glacier decreased by more than 3.0 km2 but the maximum area loss in C-glaciers is less than 2.0 km2. In addition, larger glaciers tend to have lower retreat rates (Figure 3B), whereas some small glaciers have completely perished. Most D-glaciers have a retreat rate lower than 20%, compared with higher than 20% of area loss for most C-glaciers.
Glacial retreat occurred in all size classes from 1988 to 2015 (Figure 4A). Of the size classes in Figure 4, 1–5 km2 has the largest area and also suffered the largest absolute loss of area, entirely due to loss by C-glaciers. D-glaciers are considerably larger than C-glaciers, and all glaciers larger than 10 km2 are D-glaciers (Figure 4B,C). Figure 4B reveals that most glaciers in the GRB are C-glaciers, of which over 99% in number have an area less than 5 km2. Although there are only 16 out of a total of 37 D-glaciers with areas greater than 5 km2, they contribute more than 86% of the total area in 2015 (Figure 4C). These patterns indicate that the glacial status has close relationship with its size and type.

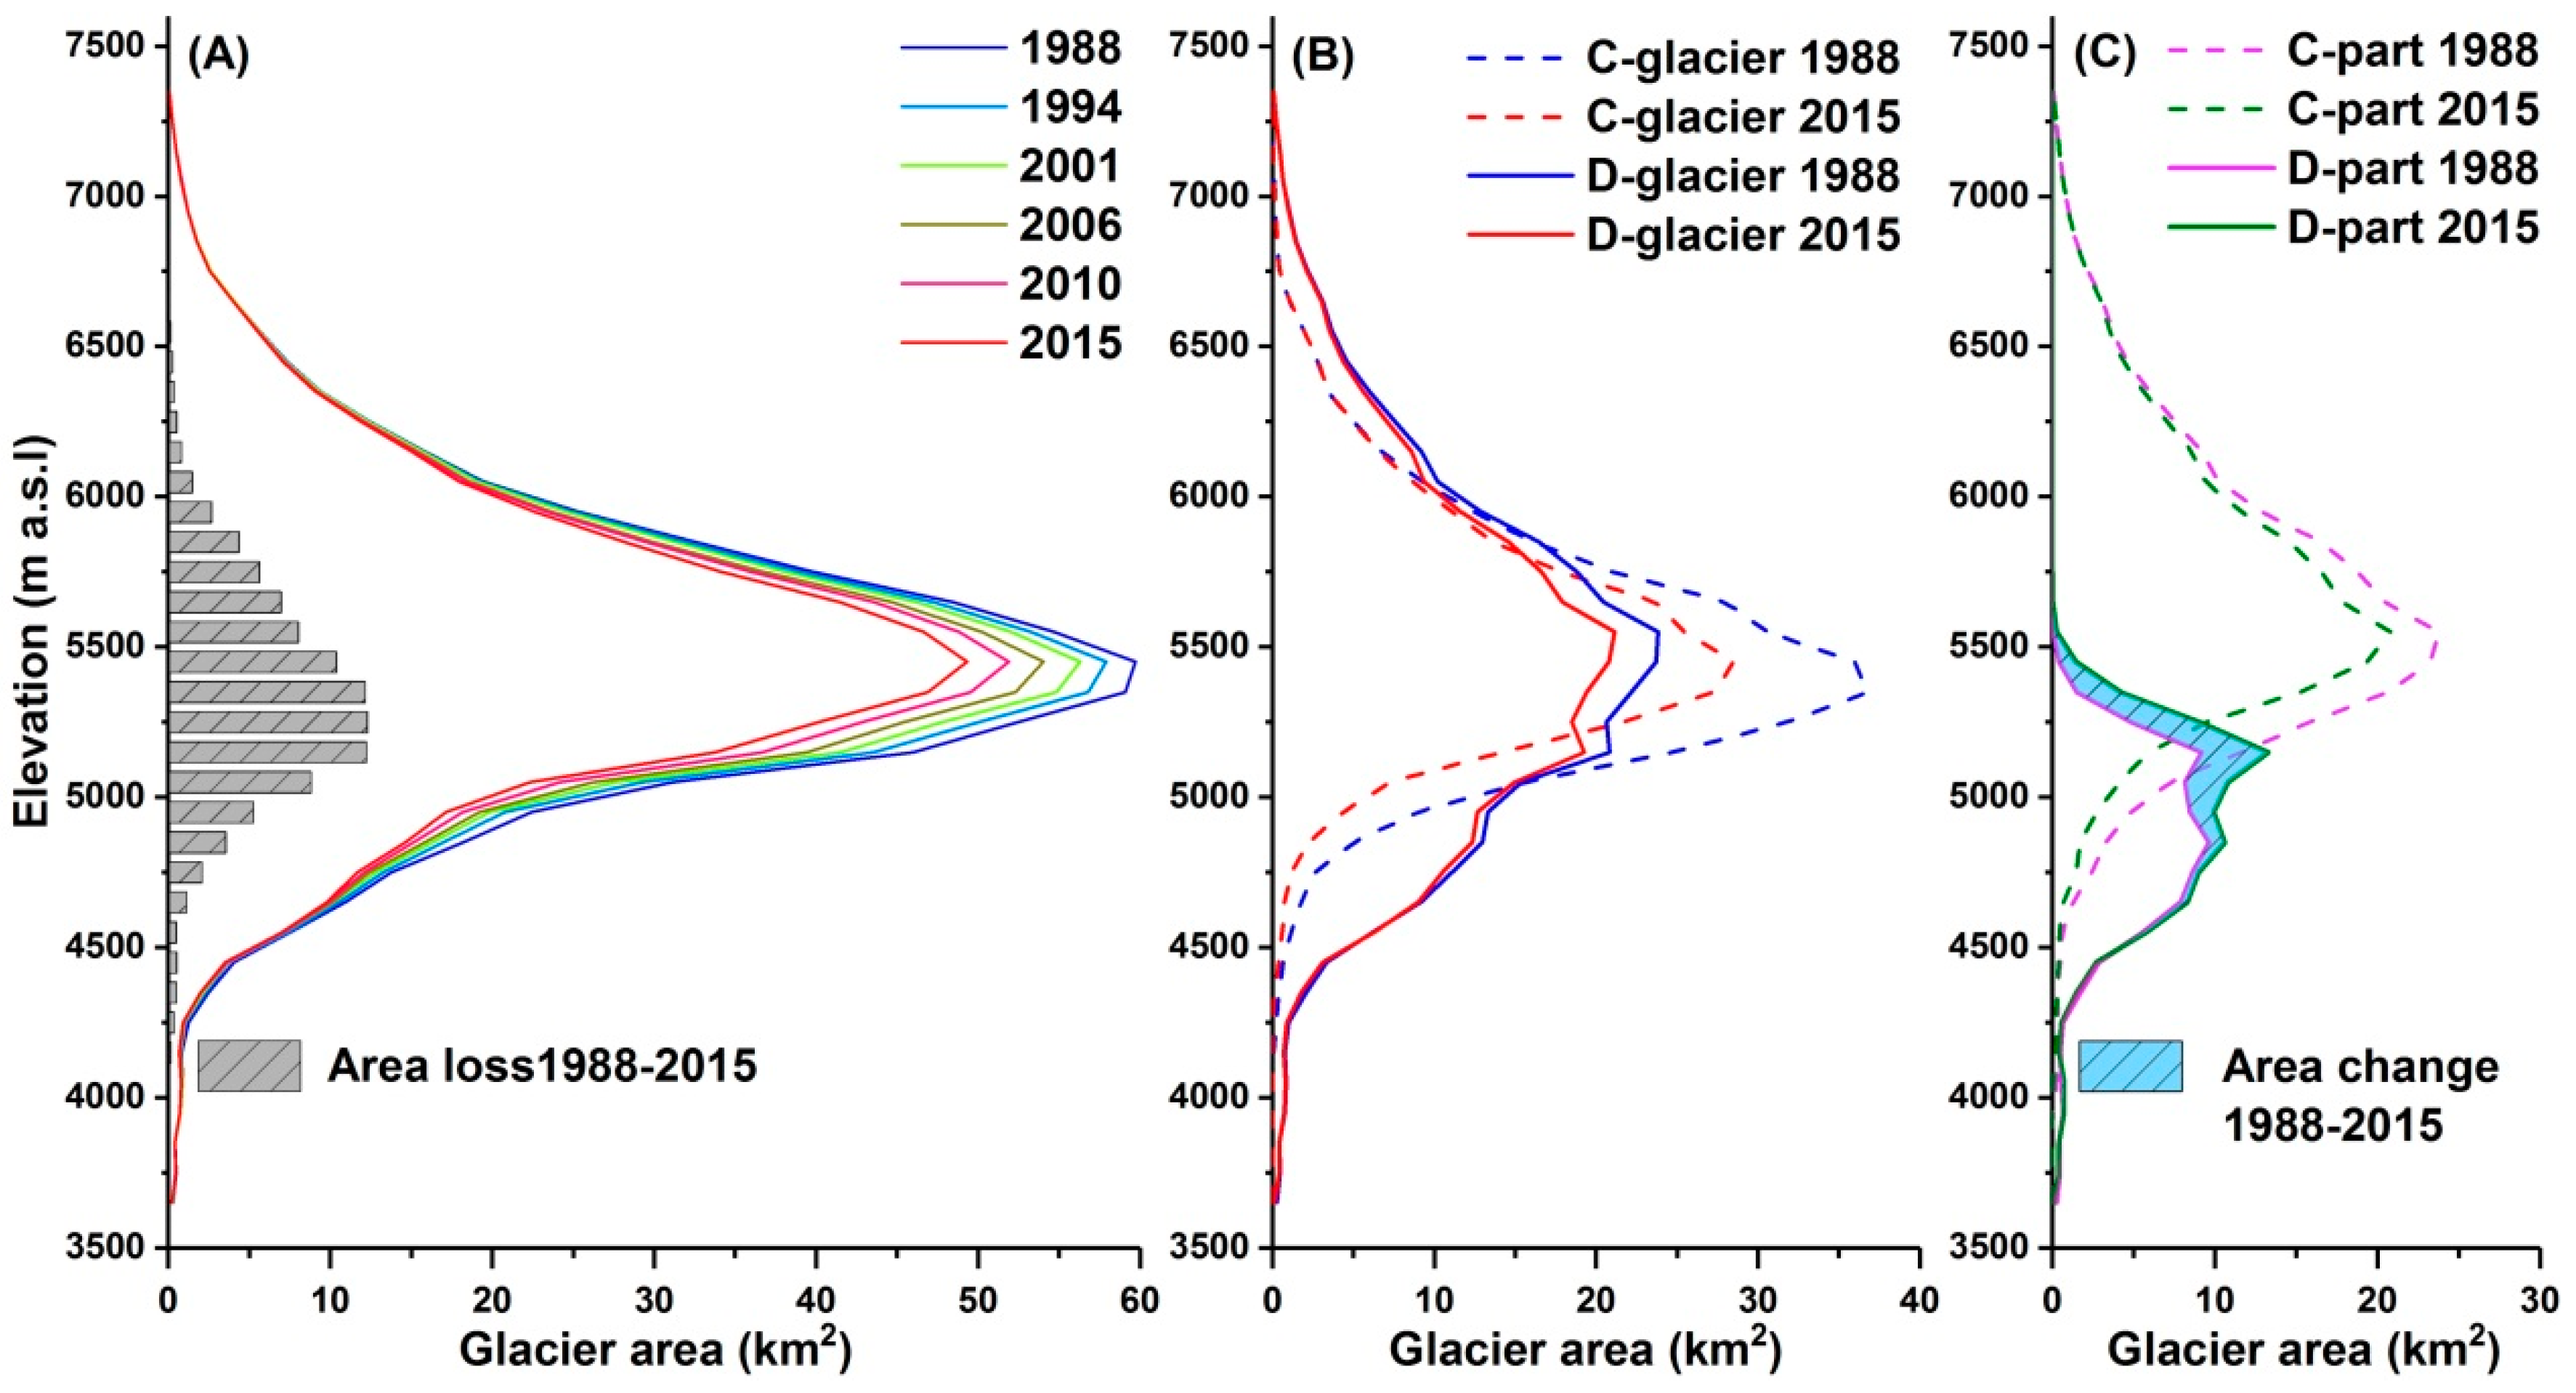
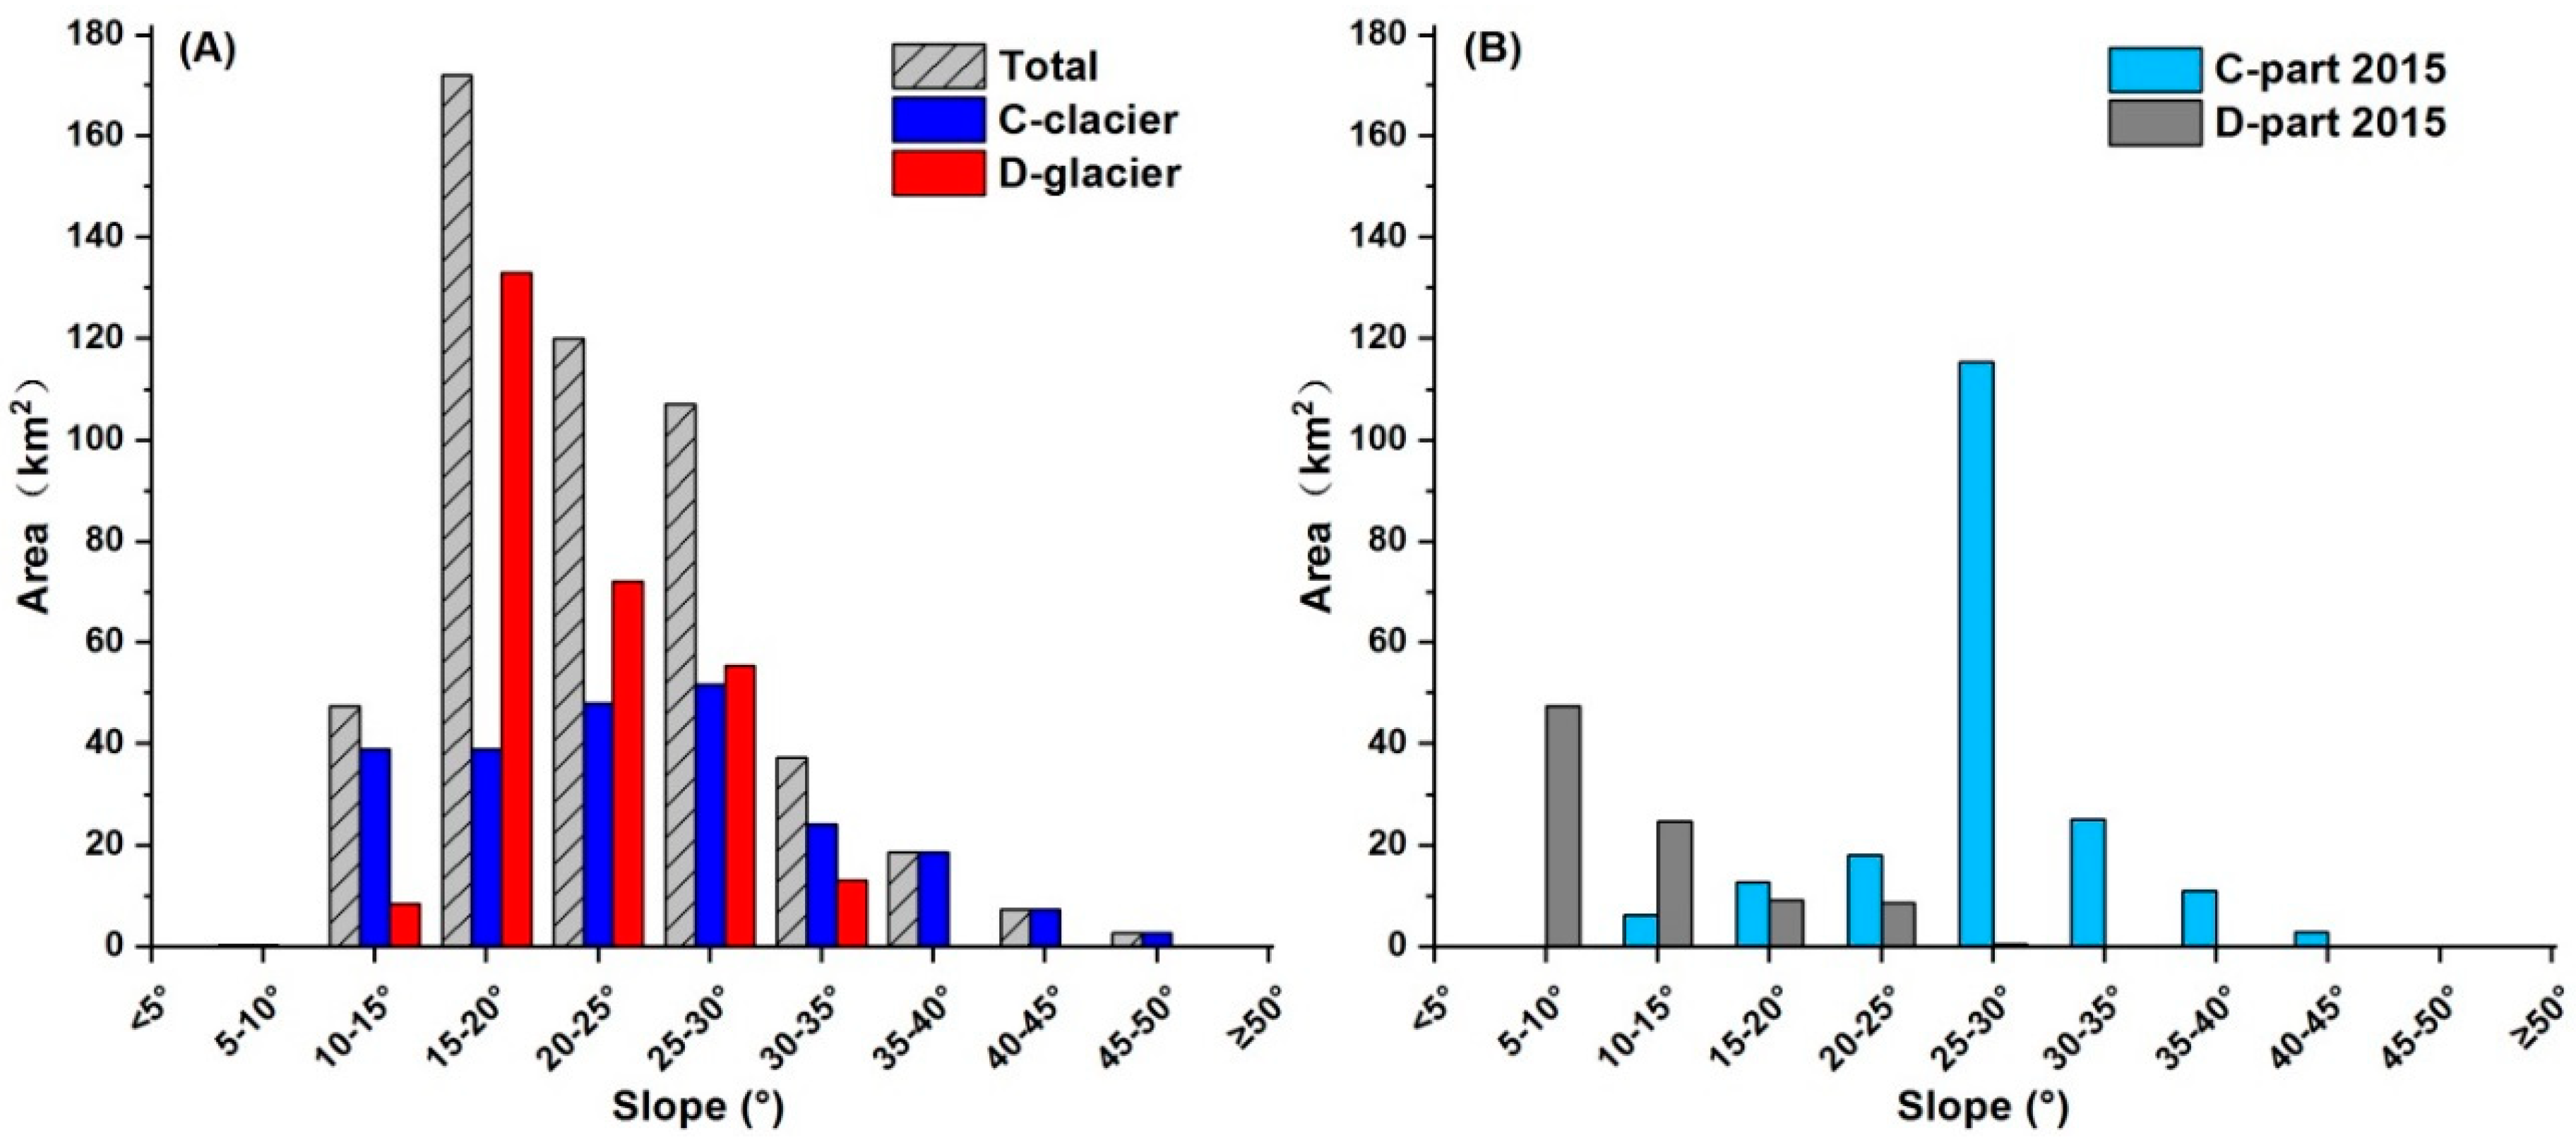
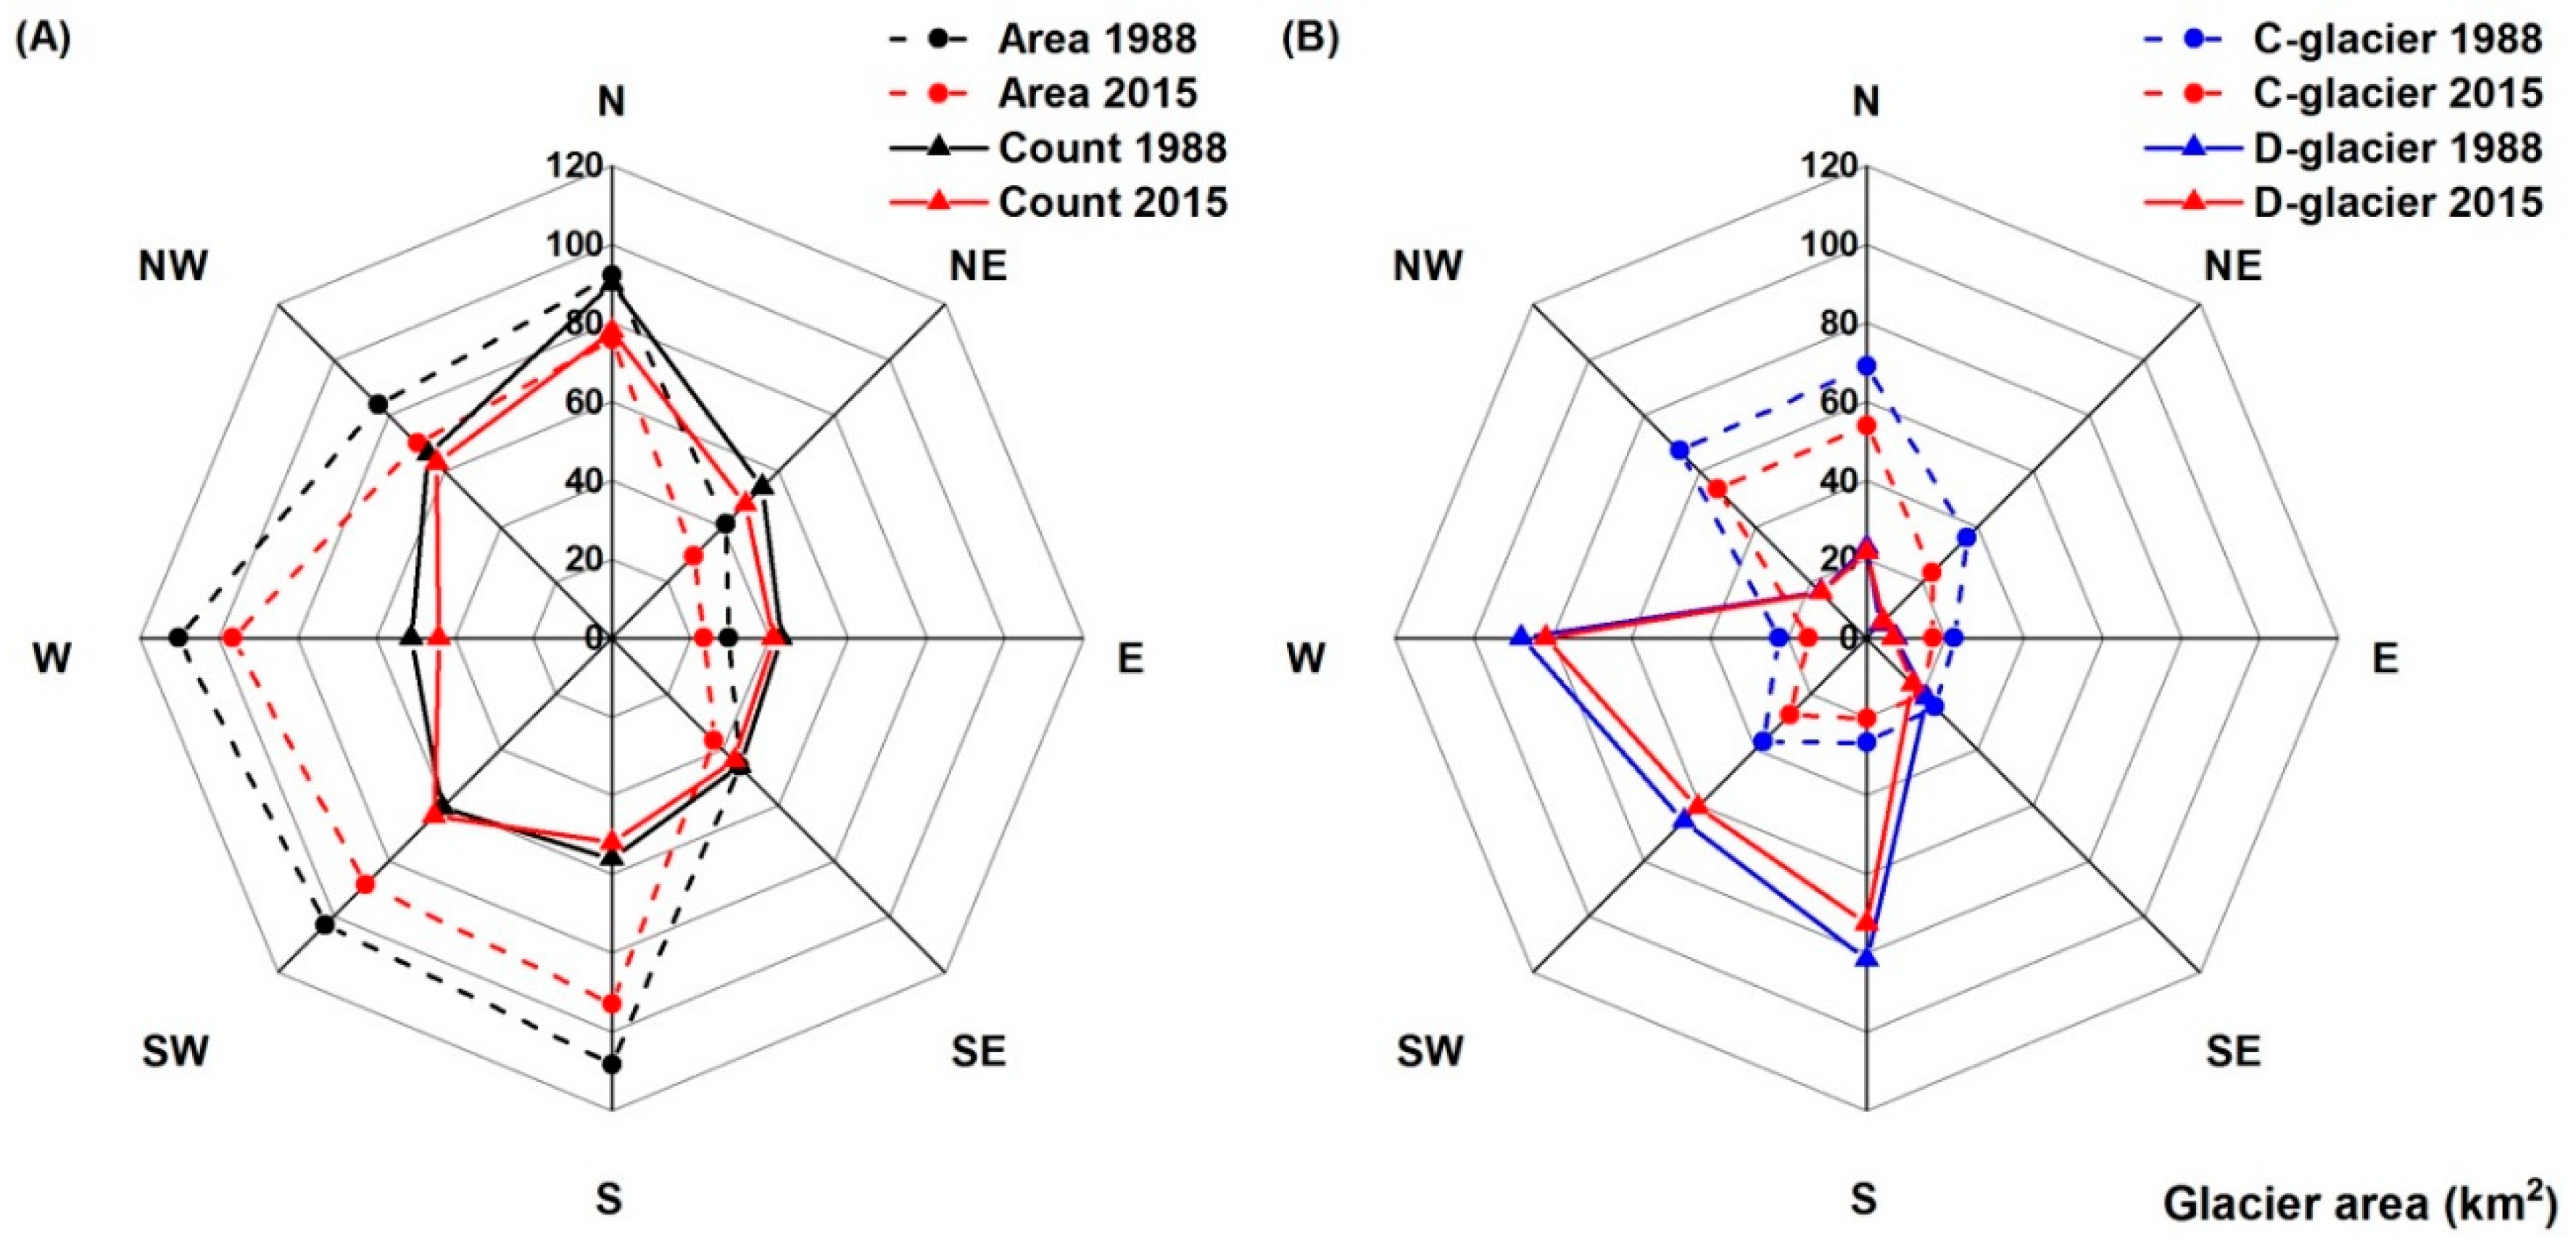
3.2. Hypsometry and Topographic Characteristics of Glaciers

Glaciers and glacier changes show distinct altitudinal distributions between 1988 and 2015 (Figure 5). In 2015, the altitudes of all glaciers in GRB range from 3600 m a.s.l. to 7300 m a.s.l., with a mean altitude of 5507 m a.s.l. The majority glacier area is distributed at 5000–6000 m a.s.l., occupying 71.22% of the total glacier area (Figure 5A). C-glaciers generally have a higher altitude than that of D-glaciers (Figure 5B), within which C-parts are distributed higher than D-parts (Figure 5C). In total, glacial area loss between 1988 and 2015 mainly occurred at 4800–6000 m a.s.l. (Figure 5A). Specifically, most area losses of C-glaciers are observed at 4800–5900 m a.s.l. and for D-glaciers at 5200–5800 m a.s.l. (Figure 5B). In contrast, the increasing areas of D-part are more prominent in higher elevations (mainly from 4900 m a.s.l. to 5500 m a.s.l.) on D-glaciers that previously be covered by C-part glaciers (Figure 5C). This indicates a trend of upward progression of debris covers induced by glacial downwasting.
In 2015, the slope of glaciers in the GRB ranges from 10° to 50°, with a mean of 31° (Figure 6). Most C-glaciers have an average slope between 10° and 35°. Compared with D-glaciers (with a mean slope of 27°), C-glaciers (mean slope of 31°) are distributed on steeper terrains. Similarly, C-parts of the D-glaciers are more likely to occur on steeper surfaces, which are consistent with their higher altitudes than D-parts.
In GRB, most glaciers are small C-glaciers and oriented towards north (Figure 7). The number of north facing glaciers decreased from 90 in 1988 to 78 in 2015 due to the disappearance of some small C-glaciers. In case of area, however, D-glaciers facing west, southwest, and south aspects contribute more than half of the total area since several largest glaciers in GRB are D-glaciers. Between 1988 and 2015, glaciers facing north, northwest, west, southwest, and south decreased more in area than those in the other aspects.

3.3. Glacial Lake Inventory and Lake Changes

A total of 107 (4.62 ± 1.12 km2) glacial lakes in 1988 and 148 (7.12 ± 1.50 km2) in 2015 were identified from our mapping (Table 5). The altitude of glacial lakes ranges from 3800 m a.s.l. to 5600 m a.s.l. in 2015 (Figure 8A). Most of the glacial lakes (130) in 2015 are smaller than 0.1 km2. The 18 lakes larger than 0.1 km2, however, account for over 50% to the total area (Figure 8B). The distribution of lake area in elevation is concentrated lower than that of lake count.
In general, glacial lakes in GRB expanded rapidly between 1988 and 2015, but the expanding status varies among lake types. The total number of glacial lakes increased by 41 (38.32%) and the total area by 2.50 km2 (54.11%). Except for C-glacier connected lakes, glacial lakes of the other types grew in number and expanded in area (Table 5). Integrating all lake types, the number and area experienced a net increase from 1988 to 2015 in each of the size classes (Figure 8B).

4. Discussion

4.1. Impact of Debris Cover on Glacier Changes

The retreat rate of D-glaciers in the GRB is lower than that of C-glaciers between 1988 and 2015 because of the role of debris coverage. Most of the D-glacier termini remain nearly stagnant, which was also observed in other Himalayan regions [44,45,58]. The stagnant behavior of D-glaciers was likely induced by thermal insulation between the glacier surface and the supraglacial debris [76]. The retreat of D-glaciers was further constrained by the thickening of supraglacial debris when they expanded upward [77]. Meanwhile, formations of new ice cliffs and supraglacial lakes in the debris-covered zones possibly promoted glacial ablation [45,59,78]. Downwasting of D-part glaciers is a complex process of mass losses for most of Himalayan D-glaciers.

4.2. Effect of Glacial Lake Changes on Glaciers

Glacial lakes may accelerate the melting of glaciers owing to the glacio-hydrological interplay. To elucidate this point, we further categorized C-glaciers and D-glaciers by their connections with or without glacial lakes. As shown in Table 6, C-glaciers and D-glaciers connected with glacial lakes experienced higher rates of area loss than those without connections to glacial lakes. The total areas for C-glaciers and D-glaciers decreased by 0.77 km2 and 0.75 km2 (summed through the related spatial conversion matrix), which was induced by the expansions of terminally connected glacial lakes between 1988 and 2015. This means that lake expansions contribute 15.88% to the total area loss in the connected C-glaciers and 16.41% to the total area loss of the connected D-glaciers. Clearly, glacial lake expansions result in faster glacial retreat through thermal energy transmission to glaciers from lake water [22,36,79].

4.3. Impact of Glacier Changes on Glacial Lakes

In the context of glacial retreat, the statuses of glacier changes significantly influence the formation, conversion, and current standing for glacial lakes. For supraglacial lakes on D-glaciers, they vary in location, size, and shape, as reported in previous publications [22,23,36]. A good case is the rapid evolution and expansion of supraglacial lakes on Lalaga Glacier (Figure 9A), where the lake labeled by green dot reached an area of 0.31 km2 in 2017 from 0.01 km2 in 1988. A total of 9 C-glacier connected lakes became glacier-fed unconnected lakes between 1988 and 2015 (such as the lake in Figure 9B), caused by continuous glacier retreat. D-glacier connected lakes (Figure 9C), generally named as moraine-dammed lakes, expanded by 1.77 times in area from 1988 to 2015, and are prone to form large lakes that are potentially dangerous to the downstream regions. Historically, this type of lake usually resulted in GLOFs. For example, Longda Tsho and Zanaco in the GRB burst and caused flooding hazards on 25 August 1964 and 7 June 1995, respectively [23,61]. This implies that close attention should be paid to the expansion of D-glacier connected lakes in the future.
Generally, glacial lakes unconnected from glaciers are relatively stable, such as the lakes in Figure 9D,E–H . C-glacier connected lakes are the most dynamic among all lake types. The process from connection to disconnection between a newly formed lake and its feeding C-glacier is distinctly observed across the GRB (Figure 9E–H ). Such conversion from new formation to disconnection makes a major contribution to the increase in number and area for glacier-fed unconnected lakes (Table 5). Similarly, the increase in number of non-glacier-fed lakes was caused by the disappearance of upstream glaciers (Figure 9H). It is obvious that glacier changes affect the hydrological connectivity between lakes and their feeding glaciers and therefore exert a profound influence on the evolution and status of glacial lakes.

4.4. Climate as a Major Factor Driving Glacial Retreat and Lacustrine Evolution

Glacial retreat is known to be a result of rising temperature in the Himalayas [3,7,49]. Warming is significantly observed in the central Himalayas (Figure 10A) based on in situ meteorological data from the nearest weather stations in Nyalam County and Tingri County, where annual mean air temperature increased by 0.35 °C per decade (adjusted R2 value of 0.29 and p-value of 0.002) during 1988–2015. Meanwhile, annual precipitation has remained stable (Figure 10B) at a negligible increasing rate of 2.83 mm per decade (adjusted R2 value of −0.04 and p-value of 0.875). The gridded GPCP precipitation data, however, show a decreasing trend across the high altitude region of the Himalayas from 1979 to 2014 [22]. This confirms that continuous warming is likely the dominant contributor to the accelerated glacial retreat in the GRB between 1988 and 2015 rather than the variation in precipitation. Debris cover is also considered as an important factor of glacier changes [45]. Upward expansion of D-part glaciers reflects the response of glaciers to climate change in the central Himalayas. Other properties, such as size, steepness, aspect, altitude, and connectivity with glacial lakes, also influence the heterogeneous wastage of glaciers [80,81,82]. The changing composition of glacier surface, such as the content of black sooty particles [83,84,85], is also a contributor to glacial retreat. All these factors indicate the complex nature of alpine glacial changes.
As discussed above, warming-induced glacial retreat controls the evolution of glacial lakes in the study area. Retreating glaciers cause a large volume of meltwater and space for connected lakes to expand [15,86]. The future glacier melt runoff was projected to increase by a glacio-hydrological model in the Langtang watershed, located at the south of our GRB [10]. As glacial lakes usually continue to expand in the case of accelerated glacier retreat and wastage, the risk of GLOFs is likely to increase in the Himalayas. We agree with others who predict GLOF frequency will increase during the next decades and into the 22nd century [87]. Therefore, a continuous monitoring of glaciers and glacial lakes will be crucially important for GLOF risk assessments, hazard management and mitigation.

5. Conclusions

This study provides a comprehensive monitoring of glaciers and glacial lakes across the entire GRB using archival Landsat imagery acquired in the past nearly three decades. Our results reveal dramatic retreats of C-glaciers and C-part glaciers in association with significant upward expansions of D-part glaciers in the studied six episodes between 1988 and 2015. We attribute the expansion of supraglacial debris primarily to the internal conversion from C-part to D-part. While C-glaciers retreated rapidly because of the lack of debris cover, D-glaciers appeared more stable due to thermal insulation under the thickening supraglacial debris.
We also demonstrate that the dynamics and conversions among glacial lake types were controlled strongly by glacier changes via hydrological connectivity. On the one hand, expanding glacial lakes likely accelerated the retreat of connected mother glaciers through thermal transmits. On the other hand, glacier lakes were hardly influenced by the upstream glaciers once they were disconnected from the lakes. The interplay between glaciers and glacial lakes implies the complexity of glacial downwasting. Under the current climate change, glaciers will possibly continue to retreat and downwaste. As a result, D-glacier-connected lakes may expand in the near future. Therefore, hazard assessment for the potentially dangerous glacial lakes is highly recommended in this important river basin, which contains the Gyirong Pass, the only trading port that currently functions between China and Nepal.

Author Contributions

Y.N. designed the research and collected the data; S.J. processed the remote sensing data and created the glacier and glacial lake inventory; J.W. developed the mapping tool; Y.N. and J.W. analyzed the data; Y.N., Q.L., and J.W. discussed and commented the paper; all authors contributed to the writing of the manuscript and improving the review.

Funding

This research was funded in part by the National Natural Science Foundation of China [Grant No. 41571104], CAS STS Program [KFJ-STS-ZDTP-015], CAS “Light of West China” Program, CPC Sichuan Provincial Committee Organization Department Talents Program, and CAS IMHE 135 Program [SDS-135-1708].

Acknowledgments

We would like to thank the Earth Resources Observation and Science (EROS) Center, U.S. Geological Survey, for sharing archival Landsat images. We thank the editor, Josh Gu, and Ian S. Evans from Durham University, as well as two anonymous referees for their valuable comments.

Conflicts of Interest

The authors declare no conflict of interest.

References

  1. Kääb, A.; Berthier, E.; Nuth, C.; Gardelle, J.; Arnaud, Y. Contrasting patterns of early twenty-first-century glacier mass change in the Himalayas. Nature 2012, 488, 495–498. [Google Scholar] [CrossRef] [PubMed]
  2. Huss, M.; Bookhagen, B.; Huggel, C.; Jacobsen, D.; Bradley, R.S.; Clague, J.J.; Vuille, M.; Buytaert, W.; Cayan, D.R.; Greenwood, G.; et al. Toward mountains without permanent snow and ice. Earth Future 2017, 5, 418–435. [Google Scholar] [CrossRef] [Green Version]
  3. Yao, T.D.; Thompson, L.; Yang, W.; Yu, W.S.; Gao, Y.; Guo, X.J.; Yang, X.X.; Duan, K.Q.; Zhao, H.B.; Xu, B.Q.; et al. Different glacier status with atmospheric circulations in Tibetan Plateau and surroundings. Nat. Clim. Chang. 2012, 2, 663–667. [Google Scholar] [CrossRef]
  4. Gardner, A.S.; Moholdt, G.; Cogley, J.G.; Wouters, B.; Arendt, A.A.; Wahr, J.; Berthier, E.; Hock, R.; Pfeffer, W.T.; Kaser, G.; et al. A Reconciled Estimate of Glacier Contributions to Sea Level Rise: 2003 to 2009. Science 2013, 340, 852–857. [Google Scholar] [CrossRef] [PubMed] [Green Version]
  5. Nie, Y.; Yang, C.; Zhang, Y.L.; Liu, L.S.; Xu, X. Glacier Changes on the Qiangtang Plateau between 1976 and 2015: A Case Study in the Xainza Xiegang Mountains. J. Resour. Ecol. 2017, 8, 97–104. [Google Scholar]
  6. Kraaijenbrink, P.; Bierkens, M.; Lutz, A.F.; Immerzeel, W.W. Impact of a global temperature rise of 1.5 degrees Celsius on Asia’s glaciers. Nature 2017, 549, 257–260. [Google Scholar] [CrossRef] [PubMed]
  7. Bolch, T.; Kulkarni, A.; Kääb, A.; Huggel, C.; Paul, F.; Cogley, J.G.; Frey, H.; Kargel, J.S.; Fujita, K.; Scheel, M.; et al. The state and fate of Himalayan glaciers. Science 2012, 336, 310–314. [Google Scholar] [CrossRef] [PubMed] [Green Version]
  8. Azam, M.F.; Wagnon, P.; Berthier, E.; Vincent, C.; Fujita, K.; Kargel, J.S. Review of the status and mass changes of Himalayan-Karakoram glaciers. J. Glaciol. 2018, 64, 61–74. [Google Scholar] [CrossRef] [Green Version]
  9. Racoviteanu, A.E.; Arnaud, Y.; Baghuna, I.M.; Bajracharya, S.R.; Berthier, E.; Bhambri, R.; Bolch, T.; Byrne, M.; Chaujar, R.K.; Frauenfelder, R.; et al. Himalayan Glaciers (India, Bhutan, Nepal): Satellite Observations of Thinning and Retreat. In Global Land Ice Measurements from Space; Kargel, J., Ed.; Springer Praxis Books; Springer: Berlin/Heidelberg, Germany, 2014. [Google Scholar]
  10. Immerzeel, W.W.; Pellicciotti, F.; Bierkens, M.F.P. Rising river flows throughout the twenty-first century in two Himalayan glacierized watersheds. Nat. Geosci. 2013, 6, 742–745. [Google Scholar] [CrossRef]
  11. Colombo, N.; Salerno, F.; Gruber, S.; Freppaz, M.; Williams, M.; Fratianni, S.; Giardino, M. Review: Impacts of permafrost degradation on inorganic chemistry of surface fresh water. Glob. Planet. Chang. 2018, 162, 69–83. [Google Scholar] [CrossRef]
  12. Salerno, F.; Rogora, M.; Balestrini, R.; Lami, A.; Tartari, G.A.; Thakuri, S.; Godone, D.; Freppaz, M.; Tartari, G. Glacier Melting Increases the Solute Concentrations of Himalayan Glacial Lakes. Environ. Sci. Technol. 2016, 50, 9150–9160. [Google Scholar] [CrossRef] [PubMed]
  13. Ilyashuk, B.P.; Ilyashuk, E.A.; Psenner, R.; Tessadri, R.; Koinig, K.A. Rock Glacier Outflows May Adversely Affect Lakes: Lessons from the Past and Present of Two Neighboring Water Bodies in a Crystalline-Rock Watershed. Environ. Sci. Technol. 2014, 48, 6192–6200. [Google Scholar] [CrossRef] [PubMed]
  14. Chen, X.Q.; Cui, P.; Li, Y.; Yang, Z.; Qi, Y.Q. Changes in glacial lakes and glaciers of post-1986 in the Poiqu River basin, Nyalam, Xizang (Tibet). Geomorphology 2007, 88, 298–311. [Google Scholar] [CrossRef]
  15. Wang, W.; Xiang, Y.; Gao, Y.; Lu, A.; Yao, T. Rapid expansion of glacial lakes caused by climate and glacier retreat in the Central Himalayas. Hydrol. Process. 2015, 29, 859–874. [Google Scholar] [CrossRef]
  16. Wolfgang, S.; Worni, R.; Huggel, C.; Stoffel, M.; Korup, O. Uncertainty in the Himalayan energy–water nexus: Estimating regional exposure to glacial lake outburst floods. Environ. Res. Lett. 2016, 11, 74005. [Google Scholar] [CrossRef]
  17. Carrivick, J.L.; Tweed, F.S. A global assessment of the societal impacts of glacier outburst floods. Glob. Planet. Chang. 2016, 144, 1–16. [Google Scholar] [CrossRef] [Green Version]
  18. Ives, J.D. Glacier Lake Outburst Floods and Risk Engineering in the Himalayas: A Review of the Langmoche Disaster, Khumbu Himal; Occasional Paper, No. 5; International Centre for Integrated Mountain Development (ICIMOD): Kathmandu, Nepal, 1986. [Google Scholar]
  19. Xu, D.; Feng, Q. Dangerous glacier lakes and their outburst features in the Tibetan Himalayas. Bull. Glacier Res. 1994, 12, 1–12. [Google Scholar]
  20. Quincey, D.J.; Lucas, R.M.; Richardson, S.D.; Glasser, N.F.; Hambrey, M.J.; Reynolds, J.M. Optical remote sensing techniques in high-mountain environments: Application to glacial hazards. Prog. Phys. Geogr. 2005, 29, 475–505. [Google Scholar] [CrossRef]
  21. Worni, R.; Huggel, C.; Stoffel, M. Glacial lakes in the Indian Himalayas—From an area-wide glacial lake inventory to on-site and modeling based risk assessment of critical glacial lakes. Sci. Total Environ. 2013, 468–469, S71–S84. [Google Scholar] [CrossRef] [PubMed]
  22. Nie, Y.; Sheng, Y.W.; Liu, Q.; Liu, L.S.; Liu, S.Y.; Zhang, Y.L.; Song, C.Q. A regional-scale assessment of Himalayan glacial lake changes using satellite observations from 1990 to 2015. Remote Sens. Environ. 2017, 189, 1–13. [Google Scholar] [CrossRef]
  23. Nie, Y.; Liu, Q.; Wang, J.; Zhang, Y.; Sheng, Y.; Liu, S. An inventory of historical glacial lake outburst floods in the Himalayas based on remote sensing observations and geomorphological analysis. Geomorphology 2018, 308, 91–106. [Google Scholar] [CrossRef]
  24. Liu, J.; Cheng, Z.; Su, P. The relationship between air temperature fluctuation and Glacial Lake Outburst Floods in Tibet, China. Quat. Int. 2014, 321, 78–87. [Google Scholar] [CrossRef]
  25. Emmer, A. GLOFs in the WOS: Bibliometrics, geographies and global trends of research on glacial lake outburst floods (Web of Science, 1979–2016). Nat. Hazards Earth Syst. Sci. 2018, 18, 813–827. [Google Scholar] [CrossRef]
  26. Westoby, M.J.; Glasser, N.F.; Hambrey, M.J.; Brasington, J.; Reynolds, J.M.; Hassan, M.A.A.M. Reconstructing historic Glacial Lake Outburst Floods through numerical modelling and geomorphological assessment: Extreme events in the Himalaya. Earth Surf. Process. Landf. 2014, 39, 1675–1692. [Google Scholar] [CrossRef]
  27. Huggel, C.; Kääb, A.; Haeberli, W.; Teysseire, P.; Paul, F. Remote sensing based assessment of hazards from glacier lake outbursts: A case study in the Swiss Alps. Can. Geotech. J. 2002, 39, 316–330. [Google Scholar] [CrossRef]
  28. Quincey, D.J.; Luckman, A.; Hessel, R.; Davies, R.; Sankhayan, P.L.; Balla, M.K. Fine-resolution remote-sensing and modelling of Himalayan catchment sustainability. Remote Sens. Environ. 2007, 107, 430–439. [Google Scholar] [CrossRef]
  29. Quincey, D.J.; Richardson, S.D.; Luckman, A.; Lucas, R.M.; Reynolds, J.M.; Hambrey, M.J.; Glasser, N.F. Early recognition of glacial lake hazards in the Himalaya using remote sensing datasets. Glob. Planet. Chang. 2007, 56, 137–152. [Google Scholar] [CrossRef]
  30. Nie, Y.; Liu, Q.; Liu, S.Y. Glacial Lake Expansion in the Central Himalayas by Landsat Images, 1990–2010. PLoS ONE 2013, 8, e83973. [Google Scholar] [CrossRef] [PubMed]
  31. Rounce, D.; Watson, C.; Mckinney, D. Identification of Hazard and Risk for Glacial Lakes in the Nepal Himalaya Using Satellite Imagery from 2000–2015. Remote Sens. 2017, 9, 654. [Google Scholar] [CrossRef]
  32. Paul, F.; Strozzi, T.; Schellenberger, T.; Kääb, A. The 2015 Surge of Hispar Glacier in the Karakoram. Remote Sens. 2017, 9, 888. [Google Scholar] [CrossRef]
  33. Higuchi, K.; Watanabe, O.; Fushimi, H.; Takenaka, S.; Nagoshi, A. Glaciers of Asia—Glaciers of Nepal—Glacier Distribution in the Nepal Himalaya with Comparisons to the Karakoram Range. In Satellite Image Atlas of Glaciers of the World; Williams, R.S., Ferrigno, J.G., Eds.; U.S. Geological Survey Professional Paper 1386-F-6; U.S. Geological Survey: Reston, VA, USA, 2010; pp. 293–320. [Google Scholar]
  34. Bolch, T.; Buchroithner, M.; Pieczonka, T.; Kunert, A. Planimetric and volumetric glacier changes in the Khumbu Himal, Nepal, since 1962 using Corona, Landsat TM and ASTER data. J. Glaciol. 2008, 54, 592–600. [Google Scholar] [CrossRef] [Green Version]
  35. Bolch, T.; Menounos, B.; Wheate, R. Landsat-based inventory of glaciers in western Canada, 1985–2005. Remote Sens. Environ. 2010, 114, 127–137. [Google Scholar] [CrossRef]
  36. Gardelle, J.; Arnaud, Y.; Berthier, E. Contrasted evolution of glacial lakes along the Hindu Kush Himalaya mountain range between 1990 and 2009. Glob. Planet. Chang. 2011, 75, 47–55. [Google Scholar] [CrossRef] [Green Version]
  37. Liu, Q.; Liu, S.; Guo, W.; Nie, Y.; Shangguan, D.; Xu, J.; Yao, X. Glacier changes in the Lancang River Basin, China, between 1968–1975 and 2005–2010. Arct. Antarct. Alp. Res. 2015, 47, 95–104. [Google Scholar]
  38. Liu, Q.; Guo, W.; Nie, Y.; Liu, S.; Xu, J. Recent glacier and glacial lake changes and their interactions in the Bugyai Kangri, southeast Tibet. Ann. Glaciol. 2016, 57, 61–69. [Google Scholar] [CrossRef] [Green Version]
  39. Zhu, Z. Change detection using landsat time series: A review of frequencies, preprocessing, algorithms, and applications. ISPRS J. Photogramm. 2017, 130, 370–384. [Google Scholar] [CrossRef]
  40. Armstrong, R.; Raup, B.; Khalsa, S.J.S.; Barry, R.; Kargel, J.; Kieffer, H. GLIMS Glacier Database; National Snow and Ice Data Center: Boulder, CO, USA, 2011.
  41. Nuimura, T.; Sakai, A.; Taniguchi, K.; Nagai, H.; Lamsal, D.; Tsutaki, S.; Kozawa, A.; Hoshina, Y.; Takenaka, S.; Omiya, S.; et al. The GAMDAM glacier inventory: A quality-controlled inventory of Asian glaciers. Cryosphere 2015, 9, 849–864. [Google Scholar] [CrossRef]
  42. Pfeffer, W.T.; Arendt, A.A.; Bliss, A.; Bolch, T.; Cogley, J.G.; Gardner, A.S.; Hagen, J.; Hock, R.; Kaser, G.; Kienholz, C.; et al. The Randolph Glacier Inventory: A globally complete inventory of glaciers. J. Glaciol. 2014, 60, 537–552. [Google Scholar] [CrossRef] [Green Version]
  43. Guo, W.; Liu, S.; Xu, J.; Wu, L.; Shangguan, D.; Yao, X.; Wei, J.; Bao, W.; Yu, P.; Liu, Q.; et al. The second Chinese glacier inventory: Data, methods and results. J. Glaciol. 2015, 61, 357–372. [Google Scholar] [CrossRef]
  44. Xiang, Y.; Yao, T.; Gao, Y.; Zhang, G.; Wang, W.; Tian, L. Retreat rates of debris-covered and debris-free glaciers in the Koshi River Basin, central Himalayas, from 1975 to 2010. Environ. Earth Sci. 2018, 77, 285. [Google Scholar] [CrossRef]
  45. Scherler, D.; Bookhagen, B.; Strecker, M.R. Spatially variable response of Himalayan glaciers to climate change affected by debris cover. Nat. Geosci. 2011, 4, 156–159. [Google Scholar] [CrossRef]
  46. Benn, D.I.; Bolch, T.; Hands, K.; Gulley, J.; Luckman, A.; Nicholson, L.I.; Quincey, D.; Thompson, S.; Toumi, R.; Wiseman, S. Response of debris-covered glaciers in the Mount Everest region to recent warming, and implications for outburst flood hazards. Earth-Sci. Rev. 2012, 114, 156–174. [Google Scholar] [CrossRef] [Green Version]
  47. Fujita, K.; Nuimura, T. Spatially heterogeneous wastage of Himalayan glaciers. Proc. Natl. Acad. Sci. USA 2011, 108, 14011–14014. [Google Scholar] [CrossRef] [PubMed] [Green Version]
  48. Bajracharya, S.R.; Mool, P. Glaciers, glacial lakes and glacial lake outburst floods in the Mount Everest region, Nepal. Ann. Glaciol. 2009, 50, 81–86. [Google Scholar] [CrossRef]
  49. Nie, Y.; Zhang, Y.L.; Liu, L.S.; Zhang, J.P. Glacial change in the vicinity of Mt. Qomolangma (Everest), central high Himalayas since 1976. J. Geogr. Sci. 2010, 20, 667–686. [Google Scholar] [CrossRef]
  50. King, O.; Quincey, D.J.; Carrivick, J.L.; Rowan, A.V. Spatial variability in mass loss of glaciers in the Everest region, central Himalayas, between 2000 and 2015. Cryosphere 2017, 11, 407–426. [Google Scholar] [CrossRef]
  51. Racoviteanu, A.E.; Williams, M.W.; Barry, R.G. Optical remote sensing of glacier characteristics: A review with focus on the Himalaya. Sensors 2008, 8, 3355–3383. [Google Scholar] [CrossRef] [PubMed]
  52. Racoviteanu, A.; Williams, M.W. Decision Tree and Texture Analysis for Mapping Debris-Covered Glaciers in the Kangchenjunga Area, Eastern Himalaya. Remote Sens. 2012, 4, 3078–3109. [Google Scholar] [CrossRef] [Green Version]
  53. Buchroithner, M.F.; Bolch, T. An automated method to delineate the ice extension of the debris-covered glaciers at Mt. Everest based on ASTER imagery. In Proceedings of the 9th international Symposium on High Mountain Remote Sensing Cartography, Obergurgl, Austria, 14–22 September 2007; pp. 71–78. [Google Scholar]
  54. Bhambri, R.; Bolch, T.; Chaujar, R.K. Mapping of debris-covered glaciers in the Garhwal Himalayas using ASTER DEMs and thermal data. Int. J. Remote Sens. 2011, 32, 8095–8119. [Google Scholar] [CrossRef] [Green Version]
  55. Herreid, S.; Pellicciotti, F.; Ayala, A.; Chesnokova, A.; Kienholz, C.; Shea, J.; Shrestha, A. Satellite observations show no net change in the percentage of supraglacial debris-covered area in northern Pakistan from 1977 to 2014. J. Glaciol. 2015, 61, 524–536. [Google Scholar] [CrossRef] [Green Version]
  56. Thakuri, S.; Salerno, F.; Smiraglia, C.; Bolch, T.; D’Agata, C.; Viviano, G.; Tartari, G. Tracing glacier changes since the 1960s on the south slope of Mt. Everest (central Southern Himalaya) using optical satellite imagery. Cryosphere 2014, 8, 1297–1315. [Google Scholar] [CrossRef] [Green Version]
  57. Ojha, S.; Fujita, K.; Sakai, A.; Nagai, H.; Lamsal, D. Topographic controls on the debris-cover extent of glaciers in the Eastern Himalayas: Regional analysis using a novel high-resolution glacier inventory. Quat. Int. 2017, 455, 82–92. [Google Scholar] [CrossRef]
  58. Rounce, D.R.; Mckinney, D.C. Debris thickness of glaciers in the Everest area (Nepal Himalaya) derived from satellite imagery using a nonlinear energy balance model. Cryosphere 2014, 8, 1317–1329. [Google Scholar] [CrossRef] [Green Version]
  59. Salerno, F.; Thakuri, S.; D’Agata, C.; Smiraglia, C.; Manfredi, E.C.; Viviano, G.; Tartari, G. Glacial lake distribution in the Mount Everest region: Uncertainty of measurement and conditions of formation. Glob. Planet. Chang. 2012, 92–93, 30–39. [Google Scholar] [CrossRef]
  60. Watson, C.S.; Quincey, D.J.; Carrivick, J.L.; Smith, M.W. The dynamics of supraglacial ponds in the Everest region, central Himalaya. Glob. Planet. Chang. 2016, 142, 14–27. [Google Scholar] [CrossRef] [Green Version]
  61. Bajracharya, S.R.; Mool, P.K.; Shrestha, B.R. Global Climate Change and Melting of Himalayan Glaciers. In Melting Glaciers and Rising Sea Levels: Impacts and Implications; Ranade, P.S., Ed.; The Icfai’s University Press: Hyderabad, India, 2008; pp. 28–46. [Google Scholar]
  62. Nie, Y.; Li, A. Assessment of alpine wetland dynamics from 1976–2006 in the vicinity of Mount Qomolangma (Everest). Wetlands 2011, 31, 875–884. [Google Scholar] [CrossRef]
  63. Liu, W.; Ren, J.; Qin, X.; Liu, J. A study of hydrological process around Rongbuk Glacier, Mt. Qomolangma. J. Glaciol. Geocryol. 2006, 28, 663–667. [Google Scholar]
  64. Wang, W.; Yang, X.; Yao, T. Evaluation of ASTER GDEM and SRTM and their suitability in hydraulic modelling of a glacial lake outburst flood in southeast Tibet. Hydrol. Process. 2012, 26, 213–225. [Google Scholar] [CrossRef]
  65. Tachikawa, T.; Kaku, M.; Iwasaki, A.; Gesch, D.; Oimoen, M.; Zhang, Z.; Danielson, J.; Krieger, T.; Curtis, B.; Haase, J.; et al. ASTER Global Digital Elevation Model Version 2—Summary of Validation Results; ASTER GDEM Validation Team; U.S. Geological Survey: Reston, VA, USA, 2011.
  66. Loibl, D.; Lehmkuhl, F.; Grießinger, J. Reconstructing glacier retreat since the Little Ice Age in SE Tibet by glacier mapping and equilibrium line altitude calculation. Geomorphology 2014, 214, 22–39. [Google Scholar] [CrossRef]
  67. Hall, D.K.; Foster, J.L.; Verbyla, D.L.; Klein, A.G.; Benson, C.S. Assessment of snow-cover mapping accuracy in a variety of vegetation-cover densities in central Alaska. Remote Sens. Environ. 1998, 66, 129–137. [Google Scholar] [CrossRef]
  68. Andreassen, L.M.; Paul, F.; Kääb, A.; Hausberg, J.E. Landsat-derived glacier inventory for Jotunheimen, Norway, and deduced glacier changes since the 1930s. Cryosphere 2008, 2, 131–145. [Google Scholar] [CrossRef] [Green Version]
  69. Mcfeeters, S.K. The use of the Normalized Difference Water Index (NDWI) in the delineation of open water features. Int. J. Remote Sens. 1996, 17, 1425–1432. [Google Scholar] [CrossRef]
  70. Thakuri, S.; Salerno, F.; Bolch, T.; Guyennon, N.; Tartari, G. Factors controlling the accelerated expansion of Imja Lake, Mount Everest region, Nepal. Ann. Glaciol. 2016, 57, 245–257. [Google Scholar] [CrossRef] [Green Version]
  71. Wang, J.; Sheng, Y.; Tong, T.S.D. Monitoring decadal lake dynamics across the Yangtze Basin downstream of Three Gorges Dam. Remote Sens. Environ. 2014, 152, 251–269. [Google Scholar] [CrossRef]
  72. Sheng, Y.; Song, C.; Wang, J.; Lyons, E.A.; Knox, B.R.; Cox, J.S.; Gao, F. Representative lake water extent mapping at continental scales using multi-temporal Landsat-8 imagery. Remote Sens. Environ. 2016, 185, 129–141. [Google Scholar] [CrossRef]
  73. Song, C.; Sheng, Y.; Wang, J.; Ke, L.; Madson, A.; Nie, Y. Heterogeneous glacial lake changes and links of lake expansions to the rapid thinning of adjacent glacier termini in the Himalayas. Geomorphology 2017, 280, 30–38. [Google Scholar] [CrossRef]
  74. Wang, J.; Sheng, Y.; Wada, Y. Little impact of the Three Gorges Dam on recent decadal lake decline across China’s Yangtze Plain. Water Resour. Res. 2017, 53, 3854–3877. [Google Scholar] [CrossRef]
  75. Fujita, K.; Sakai, A.; Nuimura, T.; Yamaguchi, S.; Sharma, R.R. Recent changes in Imja Glacial Lake and its damming moraine in the Nepal Himalaya revealed by in situ surveys and multi-temporal ASTER imagery. Environ. Res. Lett. 2009, 4, 45205. [Google Scholar] [CrossRef]
  76. Nicholson, L.; Benn, D.I. Calculating ice melt beneath a debris layer using meteorological data. J. Glaciol. 2006, 52, 463–470. [Google Scholar] [CrossRef]
  77. Robson, B.A.; Nuth, C.; Nielsen, P.R.; Girod, L.; Hendrickx, M.; Dahl, S.O. Spatial Variability in Patterns of Glacier Change across the Manaslu Range, Central Himalaya. Front. Earth Sci. 2018, 6, 12. [Google Scholar] [CrossRef]
  78. Watson, C.S.; Quincey, D.J.; Smith, M.W.; Carrivick, J.L.; Rowan, A.V.; James, M.R. Quantifying ice cliff evolution with multi-temporal point clouds on the debris-covered Khumbu Glacier, Nepal. J. Glaciol. 2017, 63, 823–837. [Google Scholar] [CrossRef] [Green Version]
  79. Sakai, A.; Nishimura, K.; Kadota, T.; Takeuchi, N. Onset of calving at supraglacial lakes on debris-covered glaciers of the Nepal Himalaya. J. Glaciol. 2009, 55, 909–917. [Google Scholar] [CrossRef] [Green Version]
  80. Racoviteanu, A.E.; Arnaud, Y.; Williams, M.W.; Manley, W.F. Spatial patterns in glacier characteristics and area changes from 1962 to 2006 in the Kanchenjunga–Sikkim area, eastern Himalaya. Cryosphere 2015, 9, 505–523. [Google Scholar] [CrossRef] [Green Version]
  81. Evans, I.S. Local aspect asymmetry of mountain glaciation: A global survey of consistency of favoured directions for glacier numbers and altitudes. Geomorphology 2006, 73, 166–184. [Google Scholar] [CrossRef]
  82. Evans, I.S.; Cox, N.J. Global variations of local asymmetry in glacier altitude: Separation of north–south and east–west components. J. Glaciol. 2005, 51, 469–482. [Google Scholar] [CrossRef] [Green Version]
  83. Xu, B.Q.; Cao, J.J.; Hansen, J.; Yao, T.D.; Joswia, D.R.; Wang, N.L.; Wu, G.J.; Wang, M.; Zhao, H.B.; Yang, W.; et al. Black soot and the survival of Tibetan glaciers. Proc. Natl. Acad. Sci. USA 2009, 106, 22114–22118. [Google Scholar] [CrossRef] [PubMed] [Green Version]
  84. Kang, S.C.; Xu, Y.W.; You, Q.L.; Flügel, W.; Pepin, N.; Yao, T. Review of climate and cryospheric change in the Tibetan Plateau. Environ. Res. Lett. 2010, 5, 15101. [Google Scholar] [CrossRef] [Green Version]
  85. Ming, J.; Du, Z.; Xiao, C.; Xu, X.; Zhang, D. Darkening of the mid-Himalaya glaciers since 2000 and the potential causes. Environ. Res. Lett. 2012, 7, 14021. [Google Scholar] [CrossRef] [Green Version]
  86. Song, C.; Sheng, Y.; Ke, L.; Nie, Y.; Wang, J. Glacial lake evolution in the southeastern Tibetan Plateau and the cause of rapid expansion of proglacial lakes linked to glacial-hydrogeomorphic processes. J. Hydrol. 2016, 540, 504–514. [Google Scholar] [CrossRef] [Green Version]
  87. Harrison, S.; Kargel, J.S.; Huggel, C.; Reynolds, J.; Shugar, D.H.; Betts, R.A.; Emmer, A.; Glasser, N.; Haritashya, U.K.; Klimeš, J.; et al. Climate change and the global pattern of moraine-dammed glacial lake outburst floods. Cryosphere 2018, 12, 1195–1209. [Google Scholar] [CrossRef] [Green Version]
Figure 1. Study area and distribution of glaciers and glacial lakes in 2015. The inset map is from ESRI’s world basemap and the background image was acquired on 25 October 2015 from Landsat 8 OLI. Rectangles 1 and 2 are the areas covered in Figure 2 and Figure 3.
Remotesensing 10 00986 g001
Figure 2. Spatial patterns of glacier changes between 1988 and 2015.
Remotesensing 10 00986 g002
Figure 3. Glacier area loss (A) and change rate (B) between 1988 and 2015. The glacier extents shown in both panels were mapped from 1988 imagery.
Remotesensing 10 00986 g003
Figure 4. Area and frequency of glaciers in various size classes: (A) glacier total areas in the studied six years; (B) C-glaciers in 1988 and 2015; (C) D-glaciers in 1988 and 2015. Glacier numbers are given in green.
Remotesensing 10 00986 g004
Figure 5. Altitudinal distribution of glaciers and their changes between 1988 and 2015: (A) distributions of glacier areas and the net area loss; (B) area distributions of C-glaciers and D-glaciers; (C) area distributions and changes of C-part and D-part glaciers. The shaded area in (C) is only the area increase in D-parts.
Remotesensing 10 00986 g005
Figure 6. Area distribution of glaciers at various slope classes in 2015: (A) area distributions of C-glaciers and D-glaciers; (B) area distributions of C-part and D-part of D-glaciers. The average slope was calculated based on DEM with a 30 m spatial resolution for individual C-glacier, D-glacier, C-part and D-part glaciers, and then we summed the area for each class.
Remotesensing 10 00986 g006
Figure 7. Aspect distributions of glaciers in GRB: (A) areas and counts for all glaciers; (B) areas for C-glaciers and D-glaciers in 1988 and 2015.
Remotesensing 10 00986 g007
Figure 8. Characteristics of altitudinal distributions and size groups of glacial lakes: (A) altitudinal distributions in area and frequency for glacial lakes in 2015; (B) area and frequency distributions of glacial lakes among size classes in 1988 and 2015.
Remotesensing 10 00986 g008
Figure 9. Evolution and changing status of typical glacial lakes (labeled by green dots) superimposed on background Landsat images: (A) supraglacial lake on Lalaga Glacier (85.563661°E, 28.426213°N); (B) lake connected with C-glacier (85.522556°E, 28.415646°N); (C) lake connected with D-glacier (85.494453°E, 28.508467°N); (D) unconnected glacier-fed lake (85.170447°E, 28.292374°N); (E) no lake at the glacier terminus (85.593496°E, 28.378879°N); (F) newly-formed lake connected with C-glacier; (G) lake unconnected with C-glacier; (H) lake becoming non-glacier-fed after the disappearance of the upstream glacier.
Remotesensing 10 00986 g009
Figure 10. Air temperature (A) and annual precipitation (B) changes in the central Himalayas observed from the nearest meteorological stations between 1988 and 2015. The blue line represents the linear regression. The red curve is the 5-year moving average.
Remotesensing 10 00986 g010
Table 1. Landsat images applied for glacier and glacial lake mapping.
No.WRS-2 Path/RowSatellite/SensorAcquisition Date (mm/dd/yyyy)Thematic Mapping
1141/040Landsat 5/TM26 September 1988Glacier/Lake
2141/040Landsat 5/TM27 September 1994Glacier/Lake
3141/040Landsat 5/TM27 December 2001Glacier/Lake
4141/040Landsat 5/TM14 October 2006Glacier/Lake
5141/040Landsat 5/TM25 October 2010Glacier/Lake
6141/040Landsat 8/OLI7 October 2015Glacier/Lake
7141/041Landsat 5/TM12 October 1988Lake
8141/041Landsat 5/TM13 October 1994Lake
9141/041Landsat 5/TM27 December 2001Lake
10141/041Landsat 5/TM1 December 2006Lake
11141/041Landsat 5/TM25 October 2010Lake
12141/041Landsat 8/OLI7 October 2015Lake
13141/040Landsat 5/TM29 November 1988 Glacier/Lake
14141/040Landsat 5/TM3 January 1990 Glacier/Lake
15141/040Landsat 5/TM13 October 1994 Glacier/Lake
16141/040Landsat 7/ETM+24 October 2001 Glacier/Lake
17141/040Landsat 7/ETM+22 September 2001 Glacier/Lake
18141/040Landsat 5/TM4 March 2006 Glacier/Lake
19141/040Landsat 5/TM28 December 2010 Glacier/Lake
20141/040Landsat 5/TM25 October 2010 Glacier/Lake
21141/040Landsat 8/OLI26 September 2017 Glacier/Lake
Note: selected as auxiliary data.
Table 2. Statistics of glacier inventories in six episodes between 1988 and 2015.
YearC-Glacier Count (Area, km2)D-GlacierSum Count (Area, km2)
Total Count (Area, km2)C-Part (km2)D-Part (km2)
1988435 (305.51)32 (308.58)235.8072.78467 (614.09)
1994432 (289.94)32 (304.63)226.0578.58464 (594.57)
2001429 (278.24)32 (298.98)218.1980.79461 (577.22)
2006415 (262.80)34 (293.47)211.1782.30449 (556.27)
2010402 (248.53)37 (288.59)203.5685.03439 (537.12)
2015397 (230.94)37 (282.13)191.5690.57434 (513.07)
Table 3. Glacier changes between 1988 and 2015.
PeriodCountArea (km2) (Annual Rate (% a−1))
C-GlacierD-GlacierC-GlacierD-GlacierC-PartD-Part
1988–1994−30−15.57 (−0.42)−3.95 (−0.11)−9.75 (−0.26)+5.80 (+0.16)
1994–2001−30−11.70 (−0.28)−5.65 (−0.14)−7.86 (−0.19)+2.21 (+0.05)
2001–2006−14+2−15.44 (−0.53)−5.51 (−0.19)−7.02 (−0.24)+1.51 (+0.05)
2006–2010−13+3−14.27 (−0.64)−4.88 (−0.22)−7.61 (−0.34)+2.73 (+0.12)
2010–2015−50−17.59 (−0.65)−6.46 (−0.24)−12.00 (−0.45)+5.54 (+0.21)
1988–2015−38+5−74.57 (−0.54)−26.45 (−0.19)−44.24 (−0.32)+17.79 (+0.11)
Table 4. Summary of various scenarios of glacier changes between 1988 and 2015.
ScenarioDescriptionArea (km2)
UnchangedC-glacier226.42
C-part glacier190.96
D-part glacier70.01
DecreasedC-glacier76.77
C-part glacier21.88
D-part glacier2.58
ConvertedC-part to D-part due to glacial downwasting18.57
C-part to C-glacier due to glacial splitting at the upper level4.39
C-glacier to D-part due to glacial downwasting1.99
C-glacier to C-part due to formation of D-part glacier0.33
D-part to C-part due to glacier motion0.19
IncreasedC-glacier0.13
C-part glacier0.07
D-part glacier from C-part or C-glacier (equivalent to related conversions above)20.56
Total changeC-glacier−74.57
C-part glacier−44.24
D-part glacier+17.79
Table 5. Inventory of glacial lakes in various types at six time points between 1988 and 2015 (units: count (area, km2)).
YearSupraglacialC-Glacier ConnectedD-Glacier ConnectedGlacier-Fed UnconnectedNon-Glacier-FedTotal
198811 (0.11)14 (0.67)7 (0.36)46 (2.38)29 (1.10)107 (4.62)
199420 (0.21)14 (0.52)7 (0.49)53 (2.69)29 (1.06)123 (4.97)
200121 (0.26)13 (0.39)5 (0.41)64 (3.04)29 (1.06)132 (5.16)
200625 (0.32)12 (0.57)6 (0.49)64 (3.30)32 (1.10)139 (5.78)
201023 (0.48)10 (0.40)6 (0.75)71 (3.47)32 (1.09)144 (6.19)
201524 (0.55)9 (0.77)8 (1.00)74 (3.56)33 (1.24)148 (7.12)
1988–2015+13 (+0.44)−5 (+0.10)+1 (+0.64)+28 (+1.18)+4 (+0.14)+41 (+2.50)
Table 6. Comparison of glacier changes by their connection with or without glacial lakes.
Type19881988–2015
CountArea (km2)Area Loss (km2)Area Loss Rate (%)
C-glacier connected with lake1418.884.8525.69
C-glacier unconnected with lake421286.6369.7224.32
D-glacier connected with lake6 a40.024.5711.42
D-glacier unconnected with lake26268.5621.888.15
a Note: two proglacial lakes in 1988 were at the same terminus of one D-glacier.

