Remotely Sensed Analysis of Channel Bar Morphodynamics in the Middle Yangtze River in Response to a Major Monsoon Flood in 2002


1
Department of Geography, School of Earth Sciences, China University of Geosciences, Wuhan 430074, China
2
Institute of Geodesy and Geophysics, Chinese Academy of Sciences, Wuhan 430077, China
*
Author to whom correspondence should be addressed.
Remote Sens. 2018, 10(8), 1165; https://doi.org/10.3390/rs10081165
Submission received: 28 May 2018
/
Revised: 11 July 2018
/
Accepted: 20 July 2018
/
Published: 24 July 2018
(This article belongs to the Special Issue Remote Sensing of Large Rivers)
Abstract
:Channel bars are a major depositional feature in channels, and are considered as an important part of the morphodynamics of an alluvial river. The long-term morphodynamics of bars have been intensively investigated. However, relatively little is known about the response of channel bars to a major river flood, which is considered to be the predominant force in shaping bar morphology. This is especially the case for the monsoon-affected Yangtze River, where fluvial geomorphic work is largely carried out during monsoon floods. In this study, multi-temporal satellite images and river stage data were used to examine the morphodynamics of four large channel bars in the middle Yangtze River in response to a major monsoon flood in 2002. Based on bar surface areas estimated with Landsat images at different river stages, a rating curve was developed for each of the four bars, which was used to estimate bar volume through an integral process. Our study shows that two of the bars tended to be stable, while the other two experienced severe erosion during the flood. The results reveal that the flood caused a total bar surface area decrease of 1,655,100 m2 (or 8.30%), and a total bar volume decline of 5.89 × 10⁶ m3 (or 6.10%) between the river stages of 20.81 m and 25.75 m. The volume decrease is equivalent to a sediment loss of approximately 8.25 × 10⁶ metric tons, based on an average bulk density of 1.4 metric tons per cubic meter. The results imply that channel bars in the middle Yangtze River can also be large sediment sources rather than depositional areas during the flood. The decrease of sediment load in the middle of Yangtze River was found to be responsible for the dramatic morphodynamics of channel bars, which could last for a long period of time, depending on the operation of the Three Gorges Dam, which opened in 2003. Hence, we suggest making management efforts to protect the bars from further erosion.
1. Introduction
Bars are elevated region in rivers that form by fluvial deposition of sediments within the channel. They can provide information about active processes and the sediment regime at the reach scale, and are employed for geomorphic and sediment assessments for rivers worldwide [1]. Bars are also an important part of the morphodynamics of a river, and are widely used to investigate the dynamics of flow regime [2].
The form and development of channel bars are important for understanding fluvial processes and their controlling factors, and have hence been the focus of a significant body of work. Jackson [3] ascribed the occurrence and characteristics of bars in rivers to the overall flow, sediment regime, and geological controls on morphology. Bridge [4] demonstrated the relations of unit and compound bar formation to patterns and mechanisms of flow and sediment transport in bends. Forced alternate bars have been investigated based on flume experiments and mathematical modelling, either due to small longitudinal sinusoidal variations of the channel width [5], or to a bend [6]. Schuurman [7] modeled bar pattern formation and dynamics using a 2-D depth-averaged morphodynamic model, which was highly sensitive to the constitutive relation for bed slope effects. Shi et al. [8] examined the long-term evolution of seven bars in the lower Yangtze River (YR) and found that the total area of bars decreased over time, with sediment and river discharge identified as the most significant factors governing bar morphology. Most of the above work was carried out either through experimental and theoretical studies, or was focused on long-term investigations. Little work has been reported regarding the dynamics of channel bars in response to a single flood event.
Floods have an important role on the morphologic evolution of fluvial systems, as their power and kinetic energy are very high [9]. This is especially true for monsoon-affected rivers, where all fluvial geomorphic work is carried out during the monsoon season in general and monsoon floods in particular [10]. In order to quantify the geomorphic impacts of a flood on a bar, detailed topographic information prior to and following the flood event is required. Although various modern measurement techniques have been exploited to acquire topographic data in river channels [11,12], such data before and after a flood might not be available because floods often occur suddenly and unexpectedly. In addition, these techniques are only efficient for relatively small study areas (i.e., a few hundred square meters), and hence, are too labor intensive and time consuming for the bars of large spatial extents. Recent advances in Earth observing techniques tackle this problem; satellites can observe and collect information over a specific area at a certain frequency [13]. Therefore, the morphologic change of bars can be estimated in a relatively straightforward way through the comparison of satellite images acquired before and after the event. For example, Grove et al. [9] used aerial imagery and LiDAR DEMs to estimate volumes of erosion during an extreme flood event in the Lockyer valley, Australia. Wang and Xu [14] utilized multi-temporal satellite imageries to assess areal and volumetric changes of three large channel bars in the Lowermost Mississippi River following an unprecedented flood. In their work, bar volume changes were estimated through the integral of a surface area-river stage rating curve. With this method, the total volume of 30 bars in the Lowermost Mississippi River was found to increase by 110,118,000 m3 in the past three decades [15]. Unlike direct measurements, a remote sensing approach offers an alternative, cost-efficient way to monitor bar features over broader spatial extents and in quick succession, and hence, can be used to investigate the geomorphic processes that shape channel bars.
The YR is the largest river on the Eurasian continent, with a length of 6300 km and a drainage basin area of 1.80 × 10⁶ km2. The YR basin lies mainly in the subtropical monsoon region, where floods occur annually in the summer, especially during June and August [16]. A number of studies have been carried out to investigate the long-term morphologic evolution of channel bars in the YR [8,17,18]. However, little work that examines the effects of extreme floods on channel bar dynamics in the short term, which are considered to be the major driver reshaping channel morphology [19]. From May to September 2002, frequent heavy rains drenched parts of central China, giving rise to floods along the YR. The flood peak crested at an exceptionally high river stage of 33.80 m at Luoshan on 28 August, 2002 (Figure 1d), which was 0.63 m higher than the crest stage of the 1954 severe flood, and 1.15 m lower than that of the 1998 unprecedented flood [20]. This flood was the latest, and perhaps the last, big flood in the YR, due to the closure of Three Gorges Dam (TGD) in 2003, which can effectively modulate extreme floods. Hence, the 2002 flood provides a unique opportunity for assessing morphologic changes of channel bars in the middle YR under the natural flow regime.
Utilizing multi-temporal satellite images and river stage records, this study aimed to investigate the morphodynamics of four channel bars in the middle YR in response to a major monsoon flood. Specifically, the study pursued the following objectives: (1) to characterize the morphology of four channel bars along the river reach following the flood; (2) to develop rating curves of bar surface area with the river stage for each of the channel bars; and (3) to quantify the volume changes of the bars responded to the flood using the rating curves. We also discuss the possible reasons for morphologic variations of the four bars in response to the flood. Finally, we compare the bar dynamics in the studied reach with those observed in the Lower Mississippi River and explore the underlying driving forces. This work contributes to a better understanding of channel bar morphodynamics following a single flood event.
2. Study Area and Data
2.1. Study Area
The study reach is a 65-km long, straight, alluvial-bed channel located in the middle YR, approximately 425 km downstream from the world's largest hydropower project, the TGD (Figure 1b). The reach flows from southwest to northeast across the Jianghan plain, which is dominated by loose alluvium and intensively developed agriculture. The study reach is one of the most flood-prone areas in the middle YR. Levees and revetments were built alongside both banks of the river to protect land from flooding. These constructions have regulated the river flow, allowing very little change in channel position. Hence, vertical accretion/erosion on bars occurred as the primary morphologic response of the alluvial river. The study reach contains four major mid-channel bars, including bars of unconsolidated sand and stable vegetated bars, which from upstream to downstream are Nanyangzhou (NYZ), Jiangnanxintan (JNXT), Nanmenzhou (NMZ), and Xinzhou (XZ). The surface areas of the bars change significantly with fluctuations in river stage, which range from 2.5 km2 (JNXT) to 10.0 km2 (NMZ) at the river stage of 23 m (see Section 4.1).
NYZ is located at the up end of the study reach, where the river is narrowed due to constrictions of hard rock. This bar mainly consists fine silt with vegetation covering the elevated portion. JNXT and NMZ are located in the middle of the reach. JNXT includes two parts (J1/J2) which are usually inundated by water in the flood season and integrated together as a whole in the dry season. There is no vegetation on this unconsolidated sand bar. NMZ also contains two parts (N1/N2) which cannot be fully inundated even in the flood season due to its having the highest elevation among the four bars. The bar is composed of clayey silt on the upper surface and fine silt on the lower part, and is densely vegetated with reeds [21]. XZ is situated in a bend of the reach. It consists of loose fine sand without vegetation [22]. Several river engineering structures exist in the reach, including a V-shaped dike built at the head of NMZ and spur dikes installed on the east bank of JNXT-1 (J1). These structures were completed during 1994 and 1998 [23].
The majority of the YR basin is located in the subtropical and temperate climate zones. The annual average precipitation is about 1100 mm. Dominated by the summer monsoon, about 70–90% of the total annual precipitation falls from May to September, which often leads to flooding in the main stream of middle YR [16]. There is a gauging station (Luoshan station) located within the study reach (Figure 1b). Since there are no major confluences, the station can be used to characterize the hydrology of the study reach. According to records from the gauging station, the discharge of peak floods in summer can reach an extreme of more than 40,000 m3/s (with the river stage of about 30 m), while the discharge in winter falls to less than 9000 m3/s (with the river stage of about 20 m), with an average of 20,000 m3/s. The huge stream power associated with these floods make them a significant factor in shaping the channel bar morphology in this reach.
2.2. River Stage Data and Satellite Images
Daily river stage data at Luoshan gauging station were collected from the Hydrological Bureau of the Changjiang Water Resources Commission, China (CWRC) (http://www.cjw.gov.cn). The data cover the period from September 2001 to May 2003, capturing the whole flood event under investigation (Figure 1d).
Multi-temporal remote sensing images were used to document the geomorphic effects of the flood. The primary data used in this study were 30-m spatial resolution Landsat TM/ETM+ images (path 123 and row 39), which are available free of charge from the USGS (http://glovis.usgs.gov). In order to quantify bar morphologic changes in response to the flood, satellite images should satisfy two basic requirements [14]: (1) images must be acquired shortly before and after the flood to highlight morphologic changes caused by the event; and (2) image acquisition dates must have similar river stages which is necessary to facilitate analysis of geomorphic changes. Based on these requirements, the images acquired on 19 November 2001 and 15 April 2003 were chosen, with river stages of 23.08 m and 23.22 m, respectively (Table 1, Figure 1d). Hence, a small river stage difference of 0.14 m is involved, which could be a possible source of uncertainty, and was analyzed in a following section. To develop a relationship between river stage and bar surface area, 27 cloud-free Landsat images acquired during September 2001 and May 2003 were collected; these were then divided into two groups, with 12 images prior to the flood and 15 during and after (Table 1). The selected images were acquired from low to high river stages (Figure 1d), allowing the establishment of surface area-river stage rating curves for each of the four bars.
3. Methodology
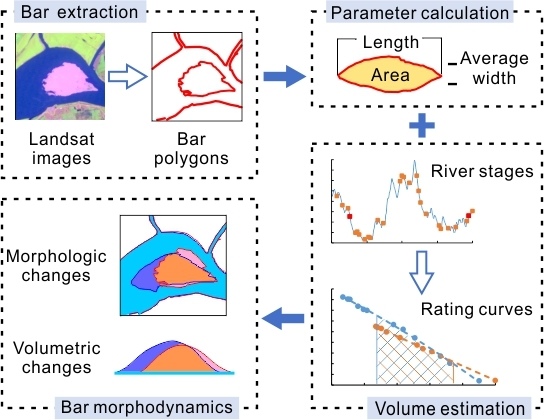
Three steps are involved in the analysis of channel bar morphodynamics in response to a flood, namely: bar extraction, parameter calculation, and volume estimation. Bars are firstly extracted from Landsat images and converted into vector polygons. Morphologic parameters such as areas and lengths are estimated, and average widths are then calculated using these parameters. The three parameters are employed to investigate bar morphologic changes following the flood. Bar areas and corresponding river stages are used to develop surface area-river stage rating curves, which are employed to estimate the bar volume through an integral process. Finally, bar volumes prior to and following the flood are compared to examine volumetric changes. Figure 2 illustrates the framework of the methodology. These major steps are detailed in the following sections.
3.1. Bar Extraction and Parameters Calculation
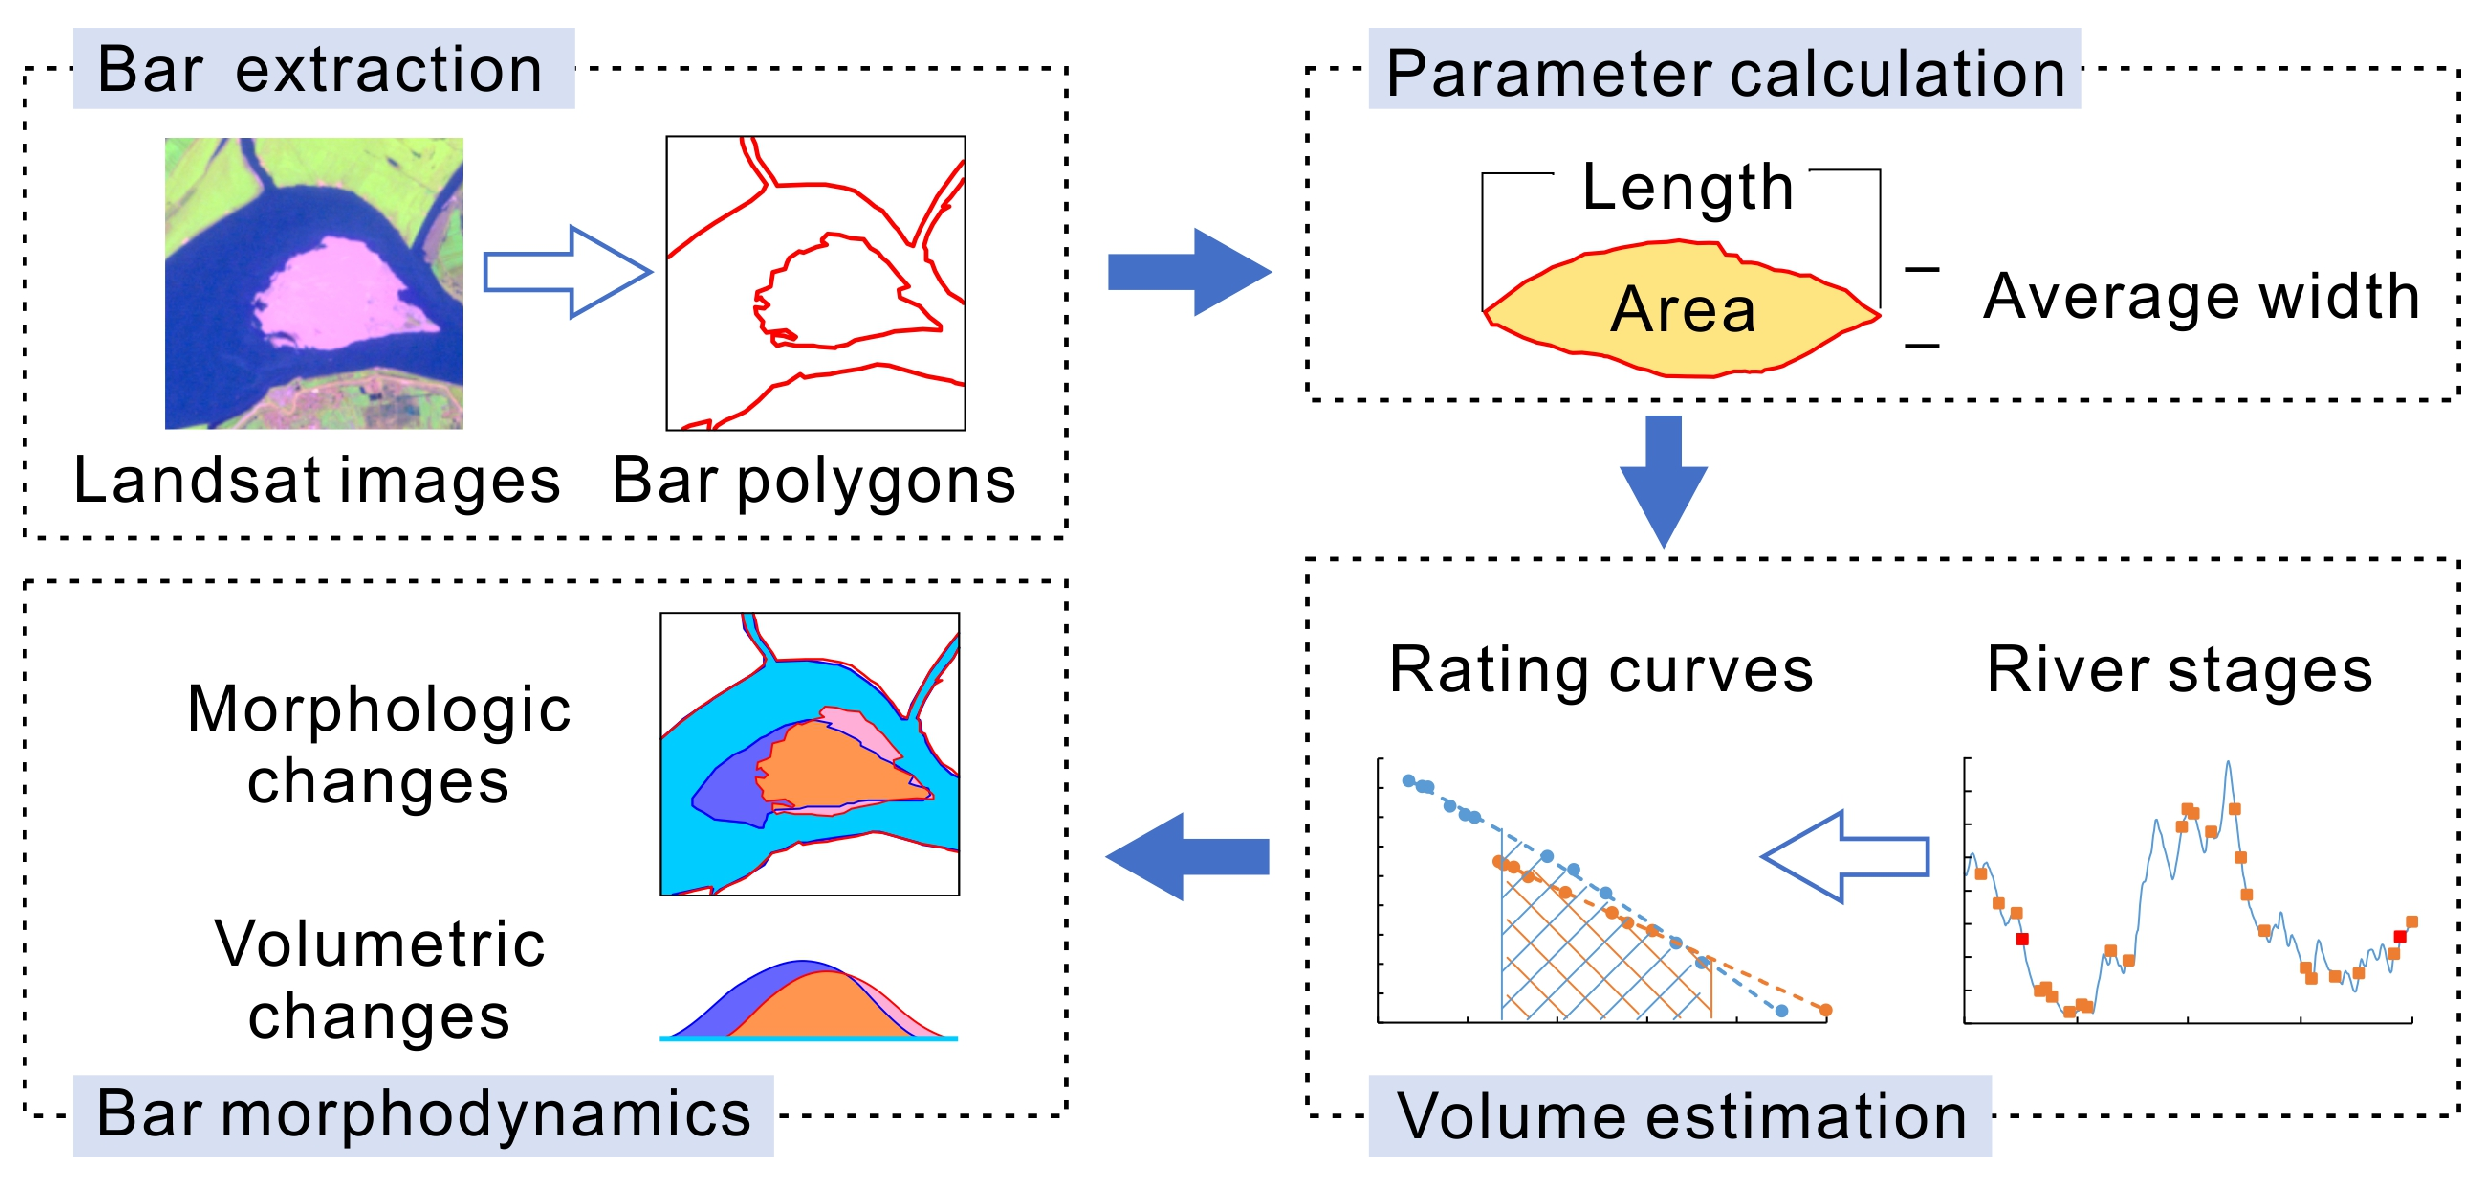
The first step in estimating bar morphologic changes following a flood is to extract the bars from the satellite images. This is usually based on some identifiable features, e.g., the wet-dry line, the mean high water line, an erosional scarp, or the vegetation line [24,25,26]. The bars under investigation are adjacent to the wetted channel; therefore, the wet-dry line is used to define bar-water boundaries. A number of methods have been proposed to extract water bodies from satellite images, including single band density slicing [27], unsupervised and supervised classification [28,29], and spectral water indices [30,31]. Among these existing methods, the Modified Normalized Difference Water Index (MNDWI), calculated from the green and Shortwave-Infrared (SWIR) bands, is one of the most popular water indices [32]. Previous studies have demonstrated that MNDWI is capable of enhancing water information and can extract water bodies with greater accuracy than NDWI [30,31,32]. Hence, the MNDWI is used in this study, and is given by:
where Green is the green band and SWIR is the shortwave infrared band, corresponding to band 2 and band 5 of Landsat TM images, respectively. In this paper, the MNDWI image of the studied reach was first calculated from the Landsat image using Equation (1). The water surface was then extracted by setting a threshold on the MNDWI image. The threshold was determined through trial and error, as well as by comparison to reference maps generated using visual interpretation. Finally, the resultant binary image was converted into vector polygons using the Raster to Polygon tool provided by ArcGIS 10.3 (ESRI, Redlands, CA, USA). (Figure 3).
Two images acquired on 19 November, 2001 and 15 April, 2003 with a similar river stage were selected to determine the morphologic changes of the bars. The surface area of each of the four bars were calculated based on the bar polygons. The bar length was measured from the upper to the lower end of each bar. The average width was estimated through dividing the area by the length. All the processing operations were completed in ArcGIS 10.3 (ESRI, Redlands, CA, USA). Additionally, river channel outlines were extracted from the two images, and used to examine morphologic changes in the channel. The areas of bars observed at multiple points in time were also estimated and used to develop a surface area-river stage rating curve to examine volumetric changes following the flood event.
3.2. Development of a Rating Curve of Bar Surface Area by River Stages
The surface areas of four studied bars were calculated based on 27 Landsat images using the method described in Section 3.1. Rating curves were plotted as river stage on the x-axis and bar surface area on the y-axis for each of the four bars (Figure 4a–d). Wang and Xu [14] suggested that a second order polynomial equation could best describe the relationship between bar area and river stage. Hence, a second order regression equation was developed for each of the bars (Figure 4a–d). The coefficient of determination (R2) and the standard error (SE) of the estimate were computed to evaluate the goodness of fit. In addition, the coefficient of variation (CV), the ratio of SE to the mean of the observed values, was also calculated to quantify model error. The R2 for the regression equations ranges from 0.99 to 1.00, suggesting an excellent fit. The SE and CV vary from 0.03 to 0.13 × 10⁶ m2, and from 0.3% to 5.5%, respectively, indicating good performance of the models.
3.3. Estimation of Bar Volume Changes
Volume changes for the studied channel bars were estimated using the method of surface area–river stage rating curve proposed by Wang and Xu [14]. The method assumes that the bar is of uniform geometry, which means the sediment is evenly distributed, such that it can be integrated. This approach has been successfully applied to estimate the volume changes of bars in response to either a flood event or long-term river engineering in the Lowermost Mississippi River [14,15], and hence, is employed in this study. According to this method, the volume of each bar between the lowest stage and the highest stage was calculated by integrating the surface area–river stage rating curves, which is given as follows [14]:
where Vs is the bar volume, Dl is the lowest stage, Dh is the highest river stage, and a, b, and c are constants, which can be obtained from the corresponding rating curves.
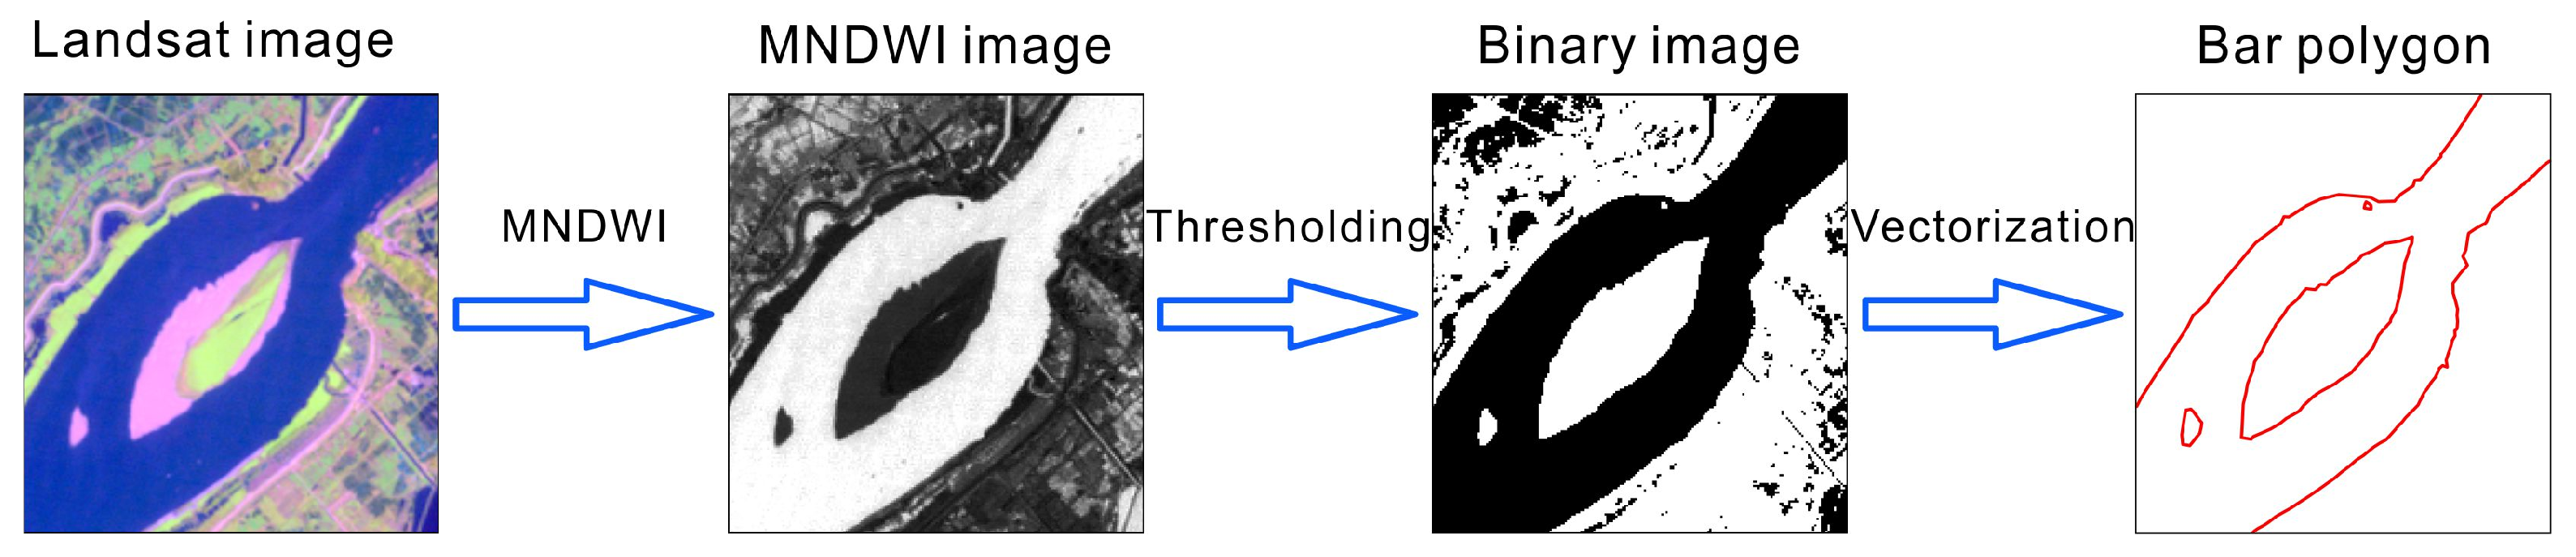
To examine volumetric changes of bar in response to a flood, a common stage range prior to and following the flood should be used in the integral process. In this work, the river stages associated with these images where all the four bars can be detected were from 19.12 m to 27.0 m before the flood, and from 20.81 m to 25.75 m afterwards. Hence, a common stage range of 20.81 m to 25.75 m was identified and used to estimate bar volume change. Taking XZ as an example, the detailed calculations of bar volume are illustrated in Figure 5. The volume of XZ before the flood is the area enclosed by the pre-flood rating curve, the x-axis, and the vertical lines at river stages of 20.81 m and 25.75 m (Figure 5). The volume is calculated by integrating the pre-flood rating curve between 20.81 m and 25.75 m. Similarly, the post-flood volume can be estimated through integrating the post-flood rating curve over the same stage range.
3.4. Error Analysis
Two major sources of uncertainty can be identified in the bar morphologic analysis, i.e., the error arising from bar extraction and the error caused by variation of river stages. The four bars were delineated using MNDWI in this work, since the wet-dry line is distinct. The reported accuracies of this method from the literatures were employed to assist the error analysis. In order to assess the errors introduced by the 0.14 m river stage difference, two images acquired in the same period with a river stage difference of 0.13 m were collected. The areas of each bar were calculated from the two images to investigate the areal errors caused by this small stage difference. It is not easy to assess the accuracy of estimated bar volume in such a direct way as that of the area change. Therefore, a qualitative evaluation of bar volume estimation was used in this work.
4. Results
4.1. Morphologic Changes of Bars
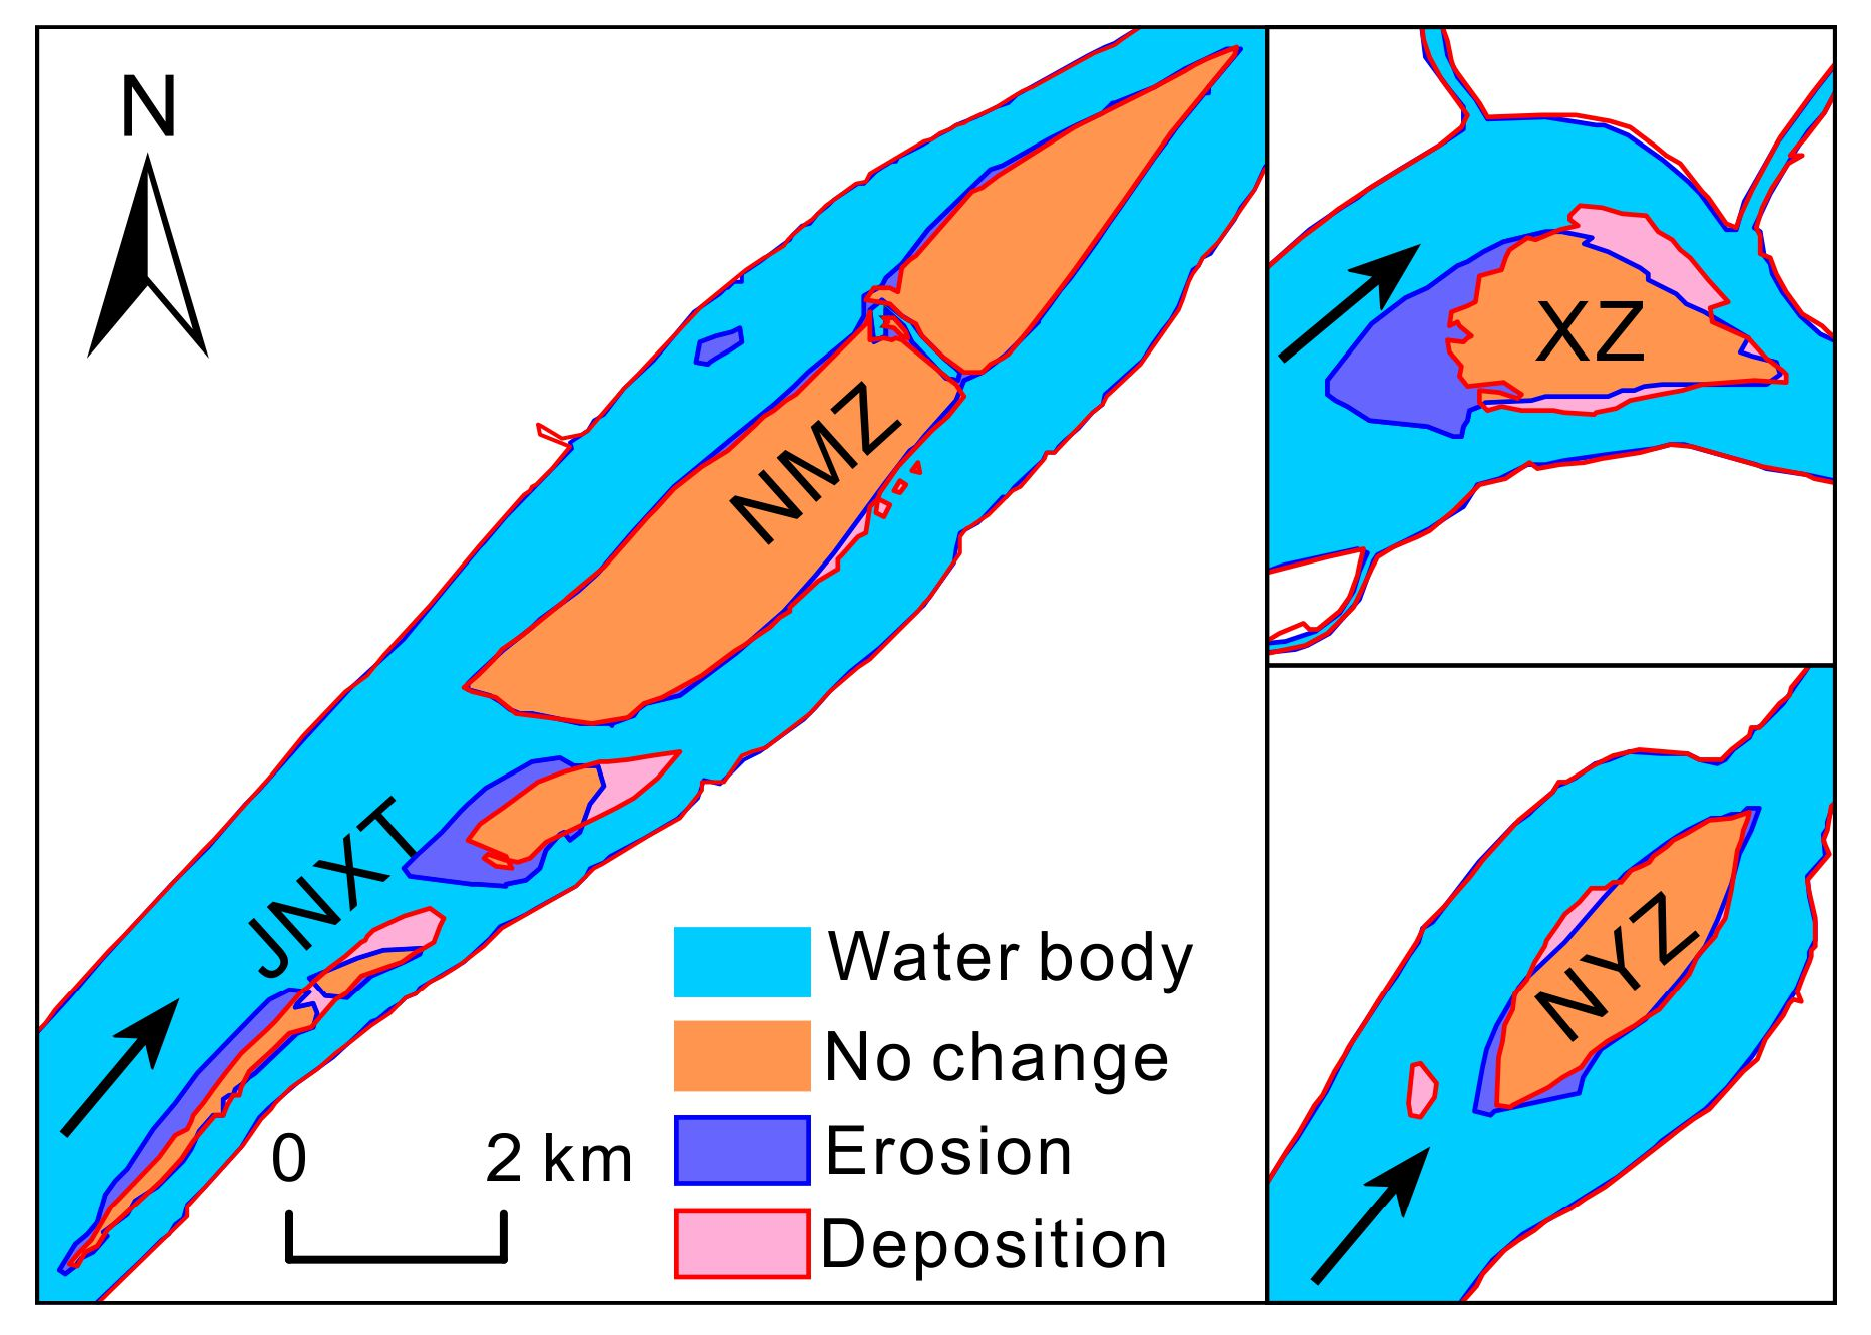
Figure 6 shows the bar morphology of the study reach before and after the 2002 flood, derived from the satellite images acquired on 19 November, 2001 and 15 April, 2003. Overall, the 65 km channel of study reach showed little morphologic change due to protection by levees and bank revetments. However, half of the bars had substantial changes in terms of surface area, length, and average width as a result of the erosion and deposition (Table 2). Among the four bars, JNXT and XZ underwent significant erosion, while NMZ and NYZ exhibited slight erosion (Figure 6), leading to substantial morphologic changes for the former and little change in the latter. Both parts of JNXT showed an increase in length and decrease in average width, becoming elongated and thinned. XZ exhibited a decrease of almost 1000 m in length and increase of about 100 m in width, leading to downstream migration. Meanwhile, NMZ and NYZ were relatively stable during the flood, with only slight changes occurring (Table 2).
The rating curves suggest that serious erosion occurred over JNXT during the flood as the post-flood curves is significantly below the pre-flood curve (Figure 4b). The post-flood curves of NMZ and NYZ are very similar to the pre-flood curves, indicating minor changes. It is worth noting that the post-flood area of XZ is clearly higher than its pre-flood area in the higher river stage (>25 m), but becomes lower in the lower river stage (<25 m), indicating serious planform erosion and a greater vertical deposition of the bar (Figure 4c).
As a result of this morphologic alteration, bar areas changed accordingly. Table 2 lists the areas of four bars before and after the flood estimated using the two images with similar stages. JNXT and XZ experienced significant erosion with a net area loss of 729,700 m2 and 666,900 m2, respectively. A minor area decline was found at NMZ and NYZ, with a net area loss of 252,000 m2 and 6500 m2, respectively. As a whole, the total surface area of the four bars above the river stage of 23.08 m has changed from 19,947,400 m2 before the flood to 18,292,300 m2 after the flood, resulting in a net surface area loss of 1,655,100 m2 during the flood, accounting for 8.30% of the total area.
4.2. Volumetric Changes of Bars
Table 3 summarizes the pre- and post-flood bar volumes calculated by Equation (2) and their changes. The estimated volumes of JNXT and XZ showed a significant decrease: 3,606,300 m3 and 2,254,000 m3, respectively. NMZ showed a slight volume decrease of 675,300 m3, while NYZ gained 645,700 m3. In general, the four bars lost a total volume of 5.89 × 10⁶ m3 in the river stages between 20.81 m and 25.75 m, accounting for 6.10% of the total volume. This value was equivalent to 8.25 million metric tons (Mt), assuming a bulk density of sediment of 1.4 metric tons per cubic meter [15]. The estimated amount of sediment loss from these four bars made up 3.65% of the total suspended sediment load in 2002 recorded by the Luoshan gauging station, which is quite significant. More importantly, our results imply that channel bars can also be the source of sediment, not just the depositional areas during flood events.
4.3. Accuracy Assessment
As for the accuracy of bar extraction, it has been reported that the extracted water body can achieve an overall accuracy of 99.85% using the MNDWI [32]. Numerous studies conducted around the world have reported similarly high accuracy for water body extraction based on this method as well [33,34,35]. Table 4 lists the areas of each bar calculated from the two images with a river stage difference of 0.13 m. The errors of bar areas range from 0.20% to 0.49%, which is negligible. JNXT is not listed, as there was heavy cloud present in one of the images above the bar. Overall, the total maximum error of bar area estimation is about 1%, taking the two error sources into consideration, which is very marginal in the analysis of morphologic changes.
The estimated 5.89 × 10⁶ m3 of total bar volume change is likely an underestimation of actual sediment loss from these bars. This is because we only calculated the volume over river stage ranges of 20.81 m to 25.75 m. The shapes of rating curves (Figure 4) suggest that the submerged bar volume between the water surface at the lower stage and the channel bed could be large. Therefore, it is likely that a large quantity of sediment is eroded on the bases of these bars below the river stage of 20.81 m, as the riverbed exhibits strong erosional mode [36]. Hence, it is reasonable to believe that the 5.89 × 10⁶ m3 volume loss is a conservative estimate of the loss of the four bars due to the 2002 flood.
5. Discussion
5.1. Possible Reasons for Morphologic Variations
This work examined the morphologic changes of four channel bars following the 2002 flood in the middle YR. The spatial pattern of morphologic changes was found to vary from one bar to another due to the differing erosion and deposition processes. Our analysis revealed that JNXT-2 (J2) is characterized by erosion of the bar head and the deposition at the bar tail. This conforms to the knowledge that a bar head is usually an area of net erosion as a result of the high stream power encountered, which is then decreased by the flow separation, leading to net deposition over the bar tail [37]. The head and right margin of JNXT-1 was, however, quite stable during the flood. This was likely due to the construction of spur dikes along the right bank of the channel located immediately upstream JNXT-1 (J1) (Figure 1). The spur dikes can change the direction of flow and reduce flow velocity along the bank, protecting the bank and bar head from erosion [15,23]. Meanwhile, a considerable amount of mass along the left margin of JNXT-1 was eroded. This was perhaps because the left margin is close to the principal thalweg of the reach, which is associated with relatively high stream power. Our work confirms the results of earlier studies [38] that suggested that different parts of the bar can experience erosion and deposition during a flood, independent of the net morphologic change of the area.
The riverine sediment supply and discharge are considered as the major factors controlling bar dynamics [3,4]. However, under similar flow and sediment conditions, NMZ and NYZ experienced quite different erosion and deposition processes, with very small changes occurring during the flood. Thus, other factors might also play important roles, such as vegetation, bar location, and river engineering projects. The vegetation can increase the coarseness of the bar and can trap more sands in the flood season; it can also enhance the anti-erosion ability of bars [39]. For example, we observed that the bars with relatively high vegetation coverage (i.e., NMZ and NYZ) tend to be stable during floods, while the bars with less vegetation (i.e., JNXT and XZ) are prone erosion. In addition to the high coverage of vegetation, the installation of a V-shaped dike at the head of NMZ is also responsible for the relatively small amount of morphologic change for this bar. Dikes are normally used to enhance navigation, improve flood control and protect erodible banks [40]. Due to the sheltering effect of the dike, the head of NMZ was made more resistant to erosion by decreasing the high stream power. It was noted that NYZ exhibited quite different characteristics from the other three bars by trapping some sediment during the flood; this may be linked to its location. The bar is situated right upstream of a transition where the average width of the channel decreased from 3180 m to 970 m. Therefore, the flow velocity slows down at NYZ, leading to a net deposition.
This work analyzed channel bar morphodynamics from a geometric point of view. Although two snapshots of the 2002 flood present a similar water level, there is a major difference between the selected time frames in terms of hydraulics. The 2001 image is capturing the river in the falling limb of the flood, while the 2003 image is, in contrast, encompassing the rising limb of the flood wave. The rising and recession limb of hydrograph are characterized by different hydrology and flood routing hydraulics that drive the river morphodynamics. Studies have reported that the peak of sediment transport occurs in the rising limb of flood, while a reduction in sediment mobility is found during the falling limb [41]. It suggests that part of the bars could be eroded during the rising limb after the 2002 flood. This may imply, therefore, that the estimated volume after the flood was possibly more than the actual lost volume during the flood.
5.2. Comparison with Bars in the Lower Mississippi River
Bars generally show an alternating erosion-deposition process over a hydrological year, with deposition in the flood season and erosion in the dry season [42]. For example, Wang and Xu [14] reported sediment deposition of approximately 1.0 Mt on top of three large emerged channel bars in the Lowermost Mississippi River during an unprecedented flood in 2011. However, in this work, channel bars exhibit a quite different seasonal process, as they experienced severe erosion with a sediment loss of 8.25 Mt during the 2002 flood. This may be due to the different sediment regimes during the flood. It is widely accepted that the morphology of a bar is mainly determined by riverine sediment supply and discharge [1,4,8]. The deposition over bars usually occurs at high discharge and with high sediment concentration, and vice versa. As for the study reach, it is reported that the suspended sediment load decreased greatly—from about 306 Mt in 2001 to 226 Mt in 2002—due to a sharp decline of sediment supply from the upper reaches of TGD, while the discharge increased from about 610 × 109 m3 to 701 × 109 m3 [43,44]. As a result, the sediment concentration reduced from 0.502 kg/m3 to 0.322 kg/m3. Meanwhile, a sharp rise of sediment concentrations was found in the Lowermost Mississippi River during the 2011 flood [45]. Therefore, we conclude that the sediment load is likely responsible for the quite different bar erosion-deposition process between Yangtze River and Mississippi River following flood events on each river.
During the last few decades, sediment delivery from many large alluvial rivers in the world to coastal areas has significantly decreased. For example, the annual average suspended sediment load from the Mississippi River to the Gulf of Mexico has decreased from 400 Mt before 1900 to 172 Mt during the last three decades [46]. Similarly, the annual average sediment load from the YR to the East China Sea has reduced by 40% in the 2000s compared to that during the 1950s and 1960s [47]. The morphology of channel bars in these rivers has evolved rapidly in response to sediment load decline. For example, the areas of bars in YR have been found to decrease during last few decades [17]. However, a different trend was observed for the Lower Mississippi River, where the total volume of 30 bars has increased by 154.17 Mt in the past three decades [15]. Further analysis revealed that river engineering projects were the most important contributor to the bar volume increase, especially the total dike length in a dike field [15]. Therefore, unlike the YR, river engineering projects are more likely to dominate over natural processes in governing channel bar evolution along the Mississippi River in the long run.
This study has some implications for bar protection in the YR. With the operation of TGD in 2003, an increasing amount of sediment would be trapped in the reservoir, leading to a decreasing downstream sediment supply. It was reported that in the 1300 km main channel between Yichang and Nanjing, the riverbed shows strong, intermediate, and weak erosional modes, depending on proximity to TGD [36]; this situation could persist for a long period of time. Several measures have already been taken to protect channel bars. For example, the V-shaped dike was installed at the head of XZ to stabilize the bar in 2004 [22]. There are more than 90 bars in the middle and lower YR [48]. More efforts should be made to protect these bars from being further eroded.
6. Conclusions
This study quantitatively examined the morphodynamics of four channel bars in the middle YR in response to a major monsoon flood in 2002. The results revealed that two of the bars were thinned and elongated while the other two remained relatively stable. The total surface area of the four bars decreased from 19,947,400 m2 to 18,292,300 m2, with a net surface area loss of 1,655,100 m2 (an 8.30% decrease). The flood caused a total volume loss of 5.89 × 10⁶ m3 for the four bars between the river stage of 20.81 m and 25.75 m, accounting for 6.10% of the total volume. Our results imply that channel bars can also be a source of sediment rather than just depositional areas. A comparison was made between the bars in the studied reach and those in the Lower Mississippi River. It was found that the sediment load is mainly responsible for the different erosion-deposition processes of bars in the two big rivers during flood events. However, unlike the YR, river engineering projects are more likely to dominate over natural processes in governing channel bar evolution along the Mississippi River in the long run. We suggest that more effort should be made to protect bars from further erosion, as there are over 90 bars in the middle and lower YR. In addition, the study demonstrates that the multi-temporal satellite remote sensing and the surface area-river stage rating curve are powerful techniques for assessing the morphodynamics of channel bars.
Author Contributions
Z.W. carried out image and numeric analyses, and wrote the first manuscript draft. H.L. conceived and designed the experiments, provided oversight throughout the study, and revised the manuscript. X.C. analyzed the data and provided constructive discussions. All authors read and approved the final manuscript.
Funding
This research was funded by the National Natural Science Foundation of China (grant numbers 41201429, 41391240191), and China Geological Survey (grant number DD20160255).
Acknowledgments
We gratefully thank the data distribution agencies who provided the publicly released data used in this work. We would like to thank the editors and the anonymous reviewers for their valuable suggestions. Their insightful comments helped us make a major improvement to this manuscript.
Conflicts of Interest
The authors declare no conflict of interest.
References
- Gilvear, D.; Willby, N. Channel dynamics and geomorphic variability as controls on gravel bar vegetation: River Tummel, Scotland. River Res. Appl. 2006, 22, 457–474. [Google Scholar] [CrossRef]
- Schuurman, F.; Kleinhans, M.G. Bar dynamics and bifurcation evolution in a modelled braided sand-bed river. Earth Surf. Process. Landf. 2015, 40, 1318–1333. [Google Scholar] [CrossRef] [Green Version]
- Jackson, R.G. Velocity-bed-form-texture patterns of meander bends in Lower Wabash River of Illinois and Indiana. Geol. Soc. Am. Bull. 1975, 86, 1511–1522. [Google Scholar] [CrossRef]
- Bridge, J.S. River and Floodplains: Forms, Processes, and Sedimentary Record; Blackwell: Oxford, UK, 2003. [Google Scholar]
- Wu, F.; Yeh, T. Forced bars induced by variations of channel width: Implications for incipient bifurcation. J. Geophys. Res. 1985, 110, F02009. [Google Scholar] [CrossRef]
- Crosato, A.; Mosselman, E. Simple physics-based predictor for the number of river bars and the transition between meandering and braiding. Water Resour. Res. 2009, 45, W03424. [Google Scholar] [CrossRef]
- Schuurman, F.; Marra, W.A.; Kleinhans, M.G. Physics-based modeling of large braided sand-bed rivers: Bar pattern formation, dynamics, and sensitivity. J. Geophys. Res. Earth Surf. 2013, 118, 2509–2527. [Google Scholar] [CrossRef] [Green Version]
- Shi, H.; Gao, C.; Dong, C.; Xia, C.; Xu, G. Variation of river islands around a large city along the Yangtze River from satellite remote sensing images. Sensors 2017, 17, 2213. [Google Scholar] [CrossRef] [PubMed]
- Grove, J.R.; Croke, J.; Thompson, C. Quantifying different riverbank erosion processes during an extreme flood event. Earth Surf. Process. Landf. 2013, 38, 1393–1406. [Google Scholar] [CrossRef]
- Kale, V.S. Geomorphic Effects of Monsoon Floods on Indian Rivers. Nat. Hazards 2003, 28, 65–84. [Google Scholar] [CrossRef]
- Wintenberger, C.L.; Rodrigues, S.; Claude, N.; Jugé, P.; Bréhéret, J.-G.; Villar, M. Dynamics of nonmigrating mid-channel bar and superimposed dunes in a sandy-gravelly river (Loire River, France). Geomorphology 2015, 248, 185–204. [Google Scholar] [CrossRef]
- Lotsari, E.; Vaaja, M.; Flener, C.; Kaartinen, H.; Kukko, A.; Kasvi, E.; Hyyppä, H.; Hyyppä, J.; Alho, P. Annual bank and point bar morphodynamics of a meandering river determined by high-accuracy multitemporal laser scanning and flow data. Water Resour. Res. 2014, 50, 5532–5559. [Google Scholar] [CrossRef] [Green Version]
- Yang, C.; Cai, X.; Wang, X.; Yan, R.; Zhang, T.; Zhang, Q.; Lu, X. Remotely sensed trajectory analysis of channel migration in lower Jingjiang reach during the period of 1983–2013. Remote Sens. 2015, 7, 16241–16256. [Google Scholar] [CrossRef]
- Wang, B.; Xu, Y. Sediment trapping by emerged channel bars in the lowermost Mississippi River during a major flood. Water 2015, 7, 6079–6096. [Google Scholar] [CrossRef]
- Wang, B.; Xu, Y. Dynamics of 30 large channel bars in the lower Mississippi River in response to river engineering from 1985 to 2015. Geomorphology 2018, 300, 31–44. [Google Scholar] [CrossRef]
- Zhang, Q.; Xu, C.; Zhang, Z.; Chen, Y.; Liu, C.; Lin, H. Spatial and temporal variability of precipitation maxima during 1960–2005 in the Yangtze River Basin and possible association with large-scale circulation. J. Hydrol. 2008, 353, 215–227. [Google Scholar] [CrossRef]
- Li, Z.; Wang, Z.; Jia, Y.; Li, W. Evolution analysis of channel bars in the middle and lower Yangtze River before and after impoundment of Three Gorges Reservoir. Res. Environ. Yangtze Basin 2015, 24, 65–73. (In Chinese) [Google Scholar] [CrossRef]
- Gao, C.; Chen, S.; Yu, J. River islands’ change and impacting factors in the lower reaches of the Yangtze River based on remote sensing. Quat. Int. 2013, 304, 13–21. [Google Scholar] [CrossRef]
- Dai, S.; Lu, X. Sediment deposition and erosion during the extreme flood events in the middle and lower reaches of the Yangtze River. Quat. Int. 2010, 226, 4–11. [Google Scholar] [CrossRef]
- Fan, P.; Li, J.; Liu, Q.; Singh, V.P. Case study: Influence of morphological changes on flooding in Jingjiang River. J. Hydraul. Eng. 2008, 134, 1757–1766. [Google Scholar] [CrossRef]
- Mao, B. Riverbed evolution of the Jiepai reach of Yangtze River. Yangtze River 2005, 36, 22–24. (In Chinese) [Google Scholar] [CrossRef]
- Yan, X.; Chen, L.; Yao, S.; Jin, Z.; Deng, C. Evolution of Goose-head Braided Channels in Luxikou Reach. J. Yangtze River Sci. Res. Inst. 2016, 33, 1–4. (In Chinese) [Google Scholar] [CrossRef]
- Wu, Z.; Zeng, Q.; Duan, W.; Yang, G. Effect analysis of the renovating project in the Jiepai reach of the Yangtze River. J. Sediment Res. 2003, 28, 53–57. (In Chinese) [Google Scholar] [CrossRef]
- Boak, E.H.; Turner, I.L. Shoreline definition and detection: A review. J. Coast. Res. 2005, 21, 688–703. [Google Scholar] [CrossRef]
- Chu, Z.; Sun, X.; Zhai, S.; Xu, K. Changing pattern of accretion/erosion of the modern Yellow River (Huanghe) subaerial delta, China: Based on remote sensing images. Mar. Geol. 2006, 227, 13–30. [Google Scholar] [CrossRef]
- Morton, R.A.; Speed, F.M. Evaluation of shore lines and legal boundaries controlled by water levels on sandy beaches. J. Coast. Res. 1998, 14, 1373–1384. [Google Scholar]
- Work, E.A.; Gilmer, D.S. Utilization of satellite data for inventorying prairie ponds and lakes. Photogramm. Eng. Remote Sens. 1976, 42, 685–694. [Google Scholar]
- Sivanpillai, R.; Miller, S.N. Improvements in mapping water bodies using ASTER data. Ecol. Inform. 2010, 5, 73–78. [Google Scholar] [CrossRef]
- Huang, C.; Chen, Y.; Wu, J. Mapping spatio-temporal flood inundation dynamics at large river basin scale using time-series flow data and MODIS imagery. Int. J. Appl. Earth Obs. Geoinf. 2014, 26, 350–362. [Google Scholar] [CrossRef]
- Li, W.; Du, Z.; Ling, F.; Zhou, D.; Wang, H.; Gui, Y.; Sun, B.; Zhang, X. A comparison of land surface water mapping using the normalized difference water index from TM, ETM plus and ALI. Remote Sens. 2013, 5, 5530–5549. [Google Scholar] [CrossRef]
- Du, Z.; Li, W.; Zhou, D.; Tian, L.; Ling, F.; Wang, H.; Gui, Y.; Sun, B. Analysis of Landsat-8 OLI imagery for land surface water mapping. Remote Sens. Lett. 2014, 5, 672–681. [Google Scholar] [CrossRef]
- Xu, H. Modification of normalized difference water index (NDWI) to enhance open water features in remotely sensed imagery. Int. J. Remote Sens. 2006, 27, 3025–3033. [Google Scholar] [CrossRef]
- Feyisa, G.L.; Meilby, H.; Fensholt, R.; Proud, S.R. Automated water extraction index: A new technique for surface water mapping using Landsat imagery. Remote Sens. Environ. 2014, 140, 23–35. [Google Scholar] [CrossRef]
- Zhang, H.; Gorelick, S.M.; Zimba, P.V.; Zhang, X. A remote sensing method for estimating regional reservoir area and evaporative loss. J. Hydrol. 2017, 555, 213–227. [Google Scholar] [CrossRef]
- Balázs, B.; Bíró, T.; Dyke, G.; Singh, S.K.; Szabó, S. Extracting water-related features using reflectance data and principal component analysis of Landsat images. Hydrol. Sci. J. 2018, 63, 269–284. [Google Scholar] [CrossRef]
- Dai, Z.; Liu, J. Impacts of large dams on downstream fluvial sedimentation: An example of the Three Gorges Dam (TGD) on the Changjiang (Yangtze River). J. Hydrol. 2013, 480, 10–18. [Google Scholar] [CrossRef]
- Ashworth, P.J.; Best, J.L.; Roden, J.E.; Bristow, C.S.; Klaassen, G.J. Morphological evolution and dynamics of a large, sand braid-bar, Jamuna River, Bangladesh. Sedimentology 2000, 47, 533–555. [Google Scholar] [CrossRef]
- Kasvi, E.; Vaaja, M.; Kaartinen, H.; Kukko, A.; Jaakkola, A.; Flener, C.; Hyyppä, H.; Hyyppä, J.; Alho, P. Sub-bend scale flow–sediment interaction of meander bends—A combined approach of field observations, close-range remote sensing and computational modelling. Geomorphology 2015, 238, 119–134. [Google Scholar] [CrossRef]
- Petts, G.E.; Gurnell, A.M. Dams and geomorphology: Research progress and future directions. Geomorphology 2005, 71, 27–47. [Google Scholar] [CrossRef]
- Copeland, R.R. Bank Protection Techniques Using Spur Dikes; U.S. Army Engineer Waterways Experiment Station: Vicksburg, MS, USA, 1983.
- Mao, L. The effect of hydrographs on bed load transport and bed sediment spatial arrangement. J. Geophys. Res. Earth Surf. 2012, 117, F03024. [Google Scholar] [CrossRef]
- Zhu, L.; Ge, H.; Li, Y.; Zhang, W. Branching channels in the middle Yangtze River, China. J. Basic Sci. Eng. 2015, 23, 246–258. (In Chinese) [Google Scholar] [CrossRef]
- Han, J.; Sun, Z.; Li, Y.; Yang, Y. Combined effects of multiple large-scale hydraulic engineering on water stages in the middle Yangtze River. Geomorphology 2017, 298, 31–40. [Google Scholar] [CrossRef]
- Yang, S.L.; Milliman, J.D.; Xu, K.H.; Deng, B.; Zhang, X.Y.; Luo, X.X. Downstream sedimentary and geomorphic impacts of the three gorges dam on the Yangtze River. Earth-Sci. Rev. 2014, 138, 469–486. [Google Scholar] [CrossRef]
- Ramirez, M.T.; Allison, M.A. Suspension of bed material over sand bars in the lower Mississippi River and its implications for Mississippi Delta environmental restoration. J. Geophys. Res. Earth Surf. 2013, 118, 1085–1104. [Google Scholar] [CrossRef]
- Meade, R.H.; Moody, J.A. Causes for the decline of suspended-sediment discharge in the Mississippi River system, 1940–2007. Hydrol. Process. 2010, 24, 35–49. [Google Scholar] [CrossRef]
- Yang, Z.; Wang, H.; Saito, Y.; Milliman, J.D.; Xu, K.; Qiao, S.; Shi, G. Dam impacts on the Changjiang (Yangtze) River sediment discharge to the sea: The past 55 years and after the Three Gorges Dam. Water Resour. Res. 2006, 42, W04407. [Google Scholar] [CrossRef]
- Li, Z.; Wang, Z.; Zhang, K. Relationship between morphology of typical sand bars and river channels. J. Sediment. Res. 2012, 1, 68–73. (In Chinese) [Google Scholar] [CrossRef]
Figure 1.
(a) A map of China indicating the location of YR basin; (b) The location of the study area (as indicated by the red polygon) in the middle YR; (c) Landsat composite image (RGB = band 5:4:1) of study reach showing the distribution of the four mid-channel bars (NYZ, JNXT, NMZ, and XZ). The image was acquired on 15 April 2003 with a river stage of 23.22 m. In this image, light green color indicates vegetation and pink represents for bare sediment, while blue indicates water bodies; (d) Daily river stage data from 1 September, 2001 to 1 May, 2003 at Luoshan gauging station. Orange squares indicate the acquisition dates of satellite images used in this study. Blue squares represent for the two images acquired on 19 November, 2001 and 15 April, 2003, with similar river stages of 23.08 m and 23.22 m, which are used to examine morphologic changes of bars following the flood.

Figure 2.
The framework of the methodology.

Figure 3.
The process of bar extraction from Landsat images using the MNDWI.

Figure 4.
Surface area–river stage rating curves for NYZ (a), JNXT (b), XZ (c), and NMZ (d) in the study reach. The pre-flood (PR) and post-flood (PT) regression equations are given accordingly, along with their coefficient of determination (R2), the standard error of the estimate (SE, ×106 m2) and the coefficient of variation (CV).

Figure 5.
An illustration of calculation of bar volumes at two different time points through the integral of surface area-river stage rating curves (RC). The volume of XZ before the flood was calculated by integrating the pre-flood rating curve for the river stage range from 20.81 to 25.75 m, while the volume of the same bar following the flood was calculated by integrating the post-flood rating curve for the same river stage range (modified from [15]).

Figure 6.
The changes of bar morphology following the 2002 flood in the study reach, based on Landsat images acquired on 19 November, 2001 and on 15 April, 2003, with similar river stages of 23.08 m and 23.22 m, respectively.
Figure 6.
The changes of bar morphology following the 2002 flood in the study reach, based on Landsat images acquired on 19 November, 2001 and on 15 April, 2003, with similar river stages of 23.08 m and 23.22 m, respectively.


Table 1.
Descriptions of Landsat images and the associated river stages used in this work.
| Before the Flood | During and After the Flood | ||||
|---|---|---|---|---|---|
| Date | River Stage (m) | SCENE_ID | Date | River Stage (m) | SCENE_ID |
| 24 September2001 | 27.00 | LE71230392001267AGS00 | 23 June 2002 | 29.85 | LE71230392002174HIJ00 |
| 18 October 2001 | 25.22 | LT51230392001291BJC00 | 1 July 2002 | 30.90 | LT51230392002182BJC00 |
| 11 November 2001 | 24.65 | LE71230392001315SGS00 | 9 July 2002 | 30.65 | LE71230392002190SGS01 |
| 19 November 2001 | 23.08 | LT51230392001323BJC00 | 2 August 2002 | 29.53 | LT51230392002214BJC00 |
| 13 December 2001 | 19.95 | LE71230392001347EDC00 | 3 September 2002 | 30.91 | LT51230392002246BJC01 |
| 21 December 2001 | 20.16 | LT51230392001355BJC00 | 11 September 2002 | 27.99 | LE71230392002254SGS02 |
| 29 December 2001 | 19.61 | LE71230392001363EDC00 | 19 September 2002 | 25.75 | LT51230392002262BJC01 |
| 22 January 2002 | 18.69 | LT51230392002022BJC00 | 13 October 2002 | 23.57 | LE71230392002286EDC00 |
| 7 February 2002 | 19.12 | LT51230392002038BJC00 | 8 December 2002 | 21.35 | LT51230392002342BJC00 |
| 15 February 2002 | 18.99 | LE71230392002046SGS00 | 16 December 2002 | 20.70 | LE71230392002350EDC00 |
| 19 March 2002 | 22.37 | LE71230392002078AGS00 | 17 January 2003 | 20.81 | LE71230392003017EDC00 |
| 12 April 2002 | 21.78 | LT51230392002102BJC00 | 18 February 2003 | 21.03 | LE71230392003049SGS00 |
| 7 April 2003 | 22.18 | LE71230392003097EDC00 | |||
| 15 April 2003 | 23.22 | LT51230392003105BJC00 | |||
| 1 May 2003 | 24.12 | LT51230392003121BJC00 | |||
Table 2.
The morphologic changes of the four channel bars following the flood in the study reach.
| Bars | Length (m) | Average Width (m) | Area (m2) | ||||||
|---|---|---|---|---|---|---|---|---|---|
| Before | After | Before | After | Before | After | Change | Percentage (%) | ||
| NYZ | 3890 | 3620 | 770 | 820 | 2,990,600 | 2,984,100 | 6500 | −0.22 | |
| JNXT | J1 | 4520 | 4750 | 290 | 210 | 1,298,300 | 972,500 | 325,800 | −25.09 |
| J2 | 2030 | 2140 | 610 | 390 | 1,236,800 | 832,900 | 403,900 | −32.66 | |
| NMZ | 9320 | 9320 | 1070 | 1050 | 10,003,500 | 9,751,500 | 252,000 | −2.52 | |
| XZ | 4220 | 3190 | 1050 | 1180 | 4,418,200 | 3,751,300 | 666,900 | −15.09 | |
| Total | - | - | - | - | 19,947,400 | 18,292,300 | 1,655,100 | −8.30 | |
Table 3.
The bar volumes (m3) and their changes (m3) following the flood.
| Period | NYZ | JNXT | NMZ | XZ | Total |
|---|---|---|---|---|---|
| Before | 14,666,800 | 12,196,600 | 49,284,100 | 20,419,700 | 96,567,200 |
| After | 15,312,500 | 8,590,300 | 48,608,700 | 18,165,700 | 90,677,200 |
| Changes | 645,700 | −3,606,300 | −675,300 | −2,254,000 | −5,890,000 |
| Percentage (%) | 4.4 | −29.57 | −1.37 | −11.04 | −6.10 |
Table 4.
The bar extraction errors introduced by the river stage difference.
| Bar | Acquired Date | River Stage (m) | Difference (m) | Area (m2) | Change (m2) | Error (%) |
|---|---|---|---|---|---|---|
| XZ | 7 February 2002 | 19.12 | 0.13 | 8,033,118 | 19,338 | 0.24 |
| 15 February 2002 | 18.99 | 8,052,456 | ||||
| NMZ | 7 February 2002 | 19.12 | 0.13 | 11,450,077 | 22,594 | 0.20 |
| 15 February 2002 | 18.99 | 10,168,075 | ||||
| NYZ | 7 February 2002 | 19.12 | 0.13 | 5,259,801 | 25,780 | 0.49 |
| 15 February 2002 | 18.99 | 5,285,581 |
© 2018 by the authors. Licensee MDPI, Basel, Switzerland. This article is an open access article distributed under the terms and conditions of the Creative Commons Attribution (CC BY) license (http://creativecommons.org/licenses/by/4.0/).
Share and Cite
MDPI and ACS Style
Wang, Z.; Li, H.; Cai, X. Remotely Sensed Analysis of Channel Bar Morphodynamics in the Middle Yangtze River in Response to a Major Monsoon Flood in 2002. Remote Sens. 2018, 10, 1165. https://doi.org/10.3390/rs10081165
AMA Style
Wang Z, Li H, Cai X. Remotely Sensed Analysis of Channel Bar Morphodynamics in the Middle Yangtze River in Response to a Major Monsoon Flood in 2002. Remote Sensing. 2018; 10(8):1165. https://doi.org/10.3390/rs10081165
Chicago/Turabian StyleWang, Zhaoyang, Hui Li, and Xiaobin Cai. 2018. "Remotely Sensed Analysis of Channel Bar Morphodynamics in the Middle Yangtze River in Response to a Major Monsoon Flood in 2002" Remote Sensing 10, no. 8: 1165. https://doi.org/10.3390/rs10081165
Note that from the first issue of 2016, this journal uses article numbers instead of page numbers. See further details here.