Quality Assurance Framework Development Based on Six New ECV Data Products to Enhance User Confidence for Climate Applications

 , , ,
, , , 
Abstract
:1. Introduction
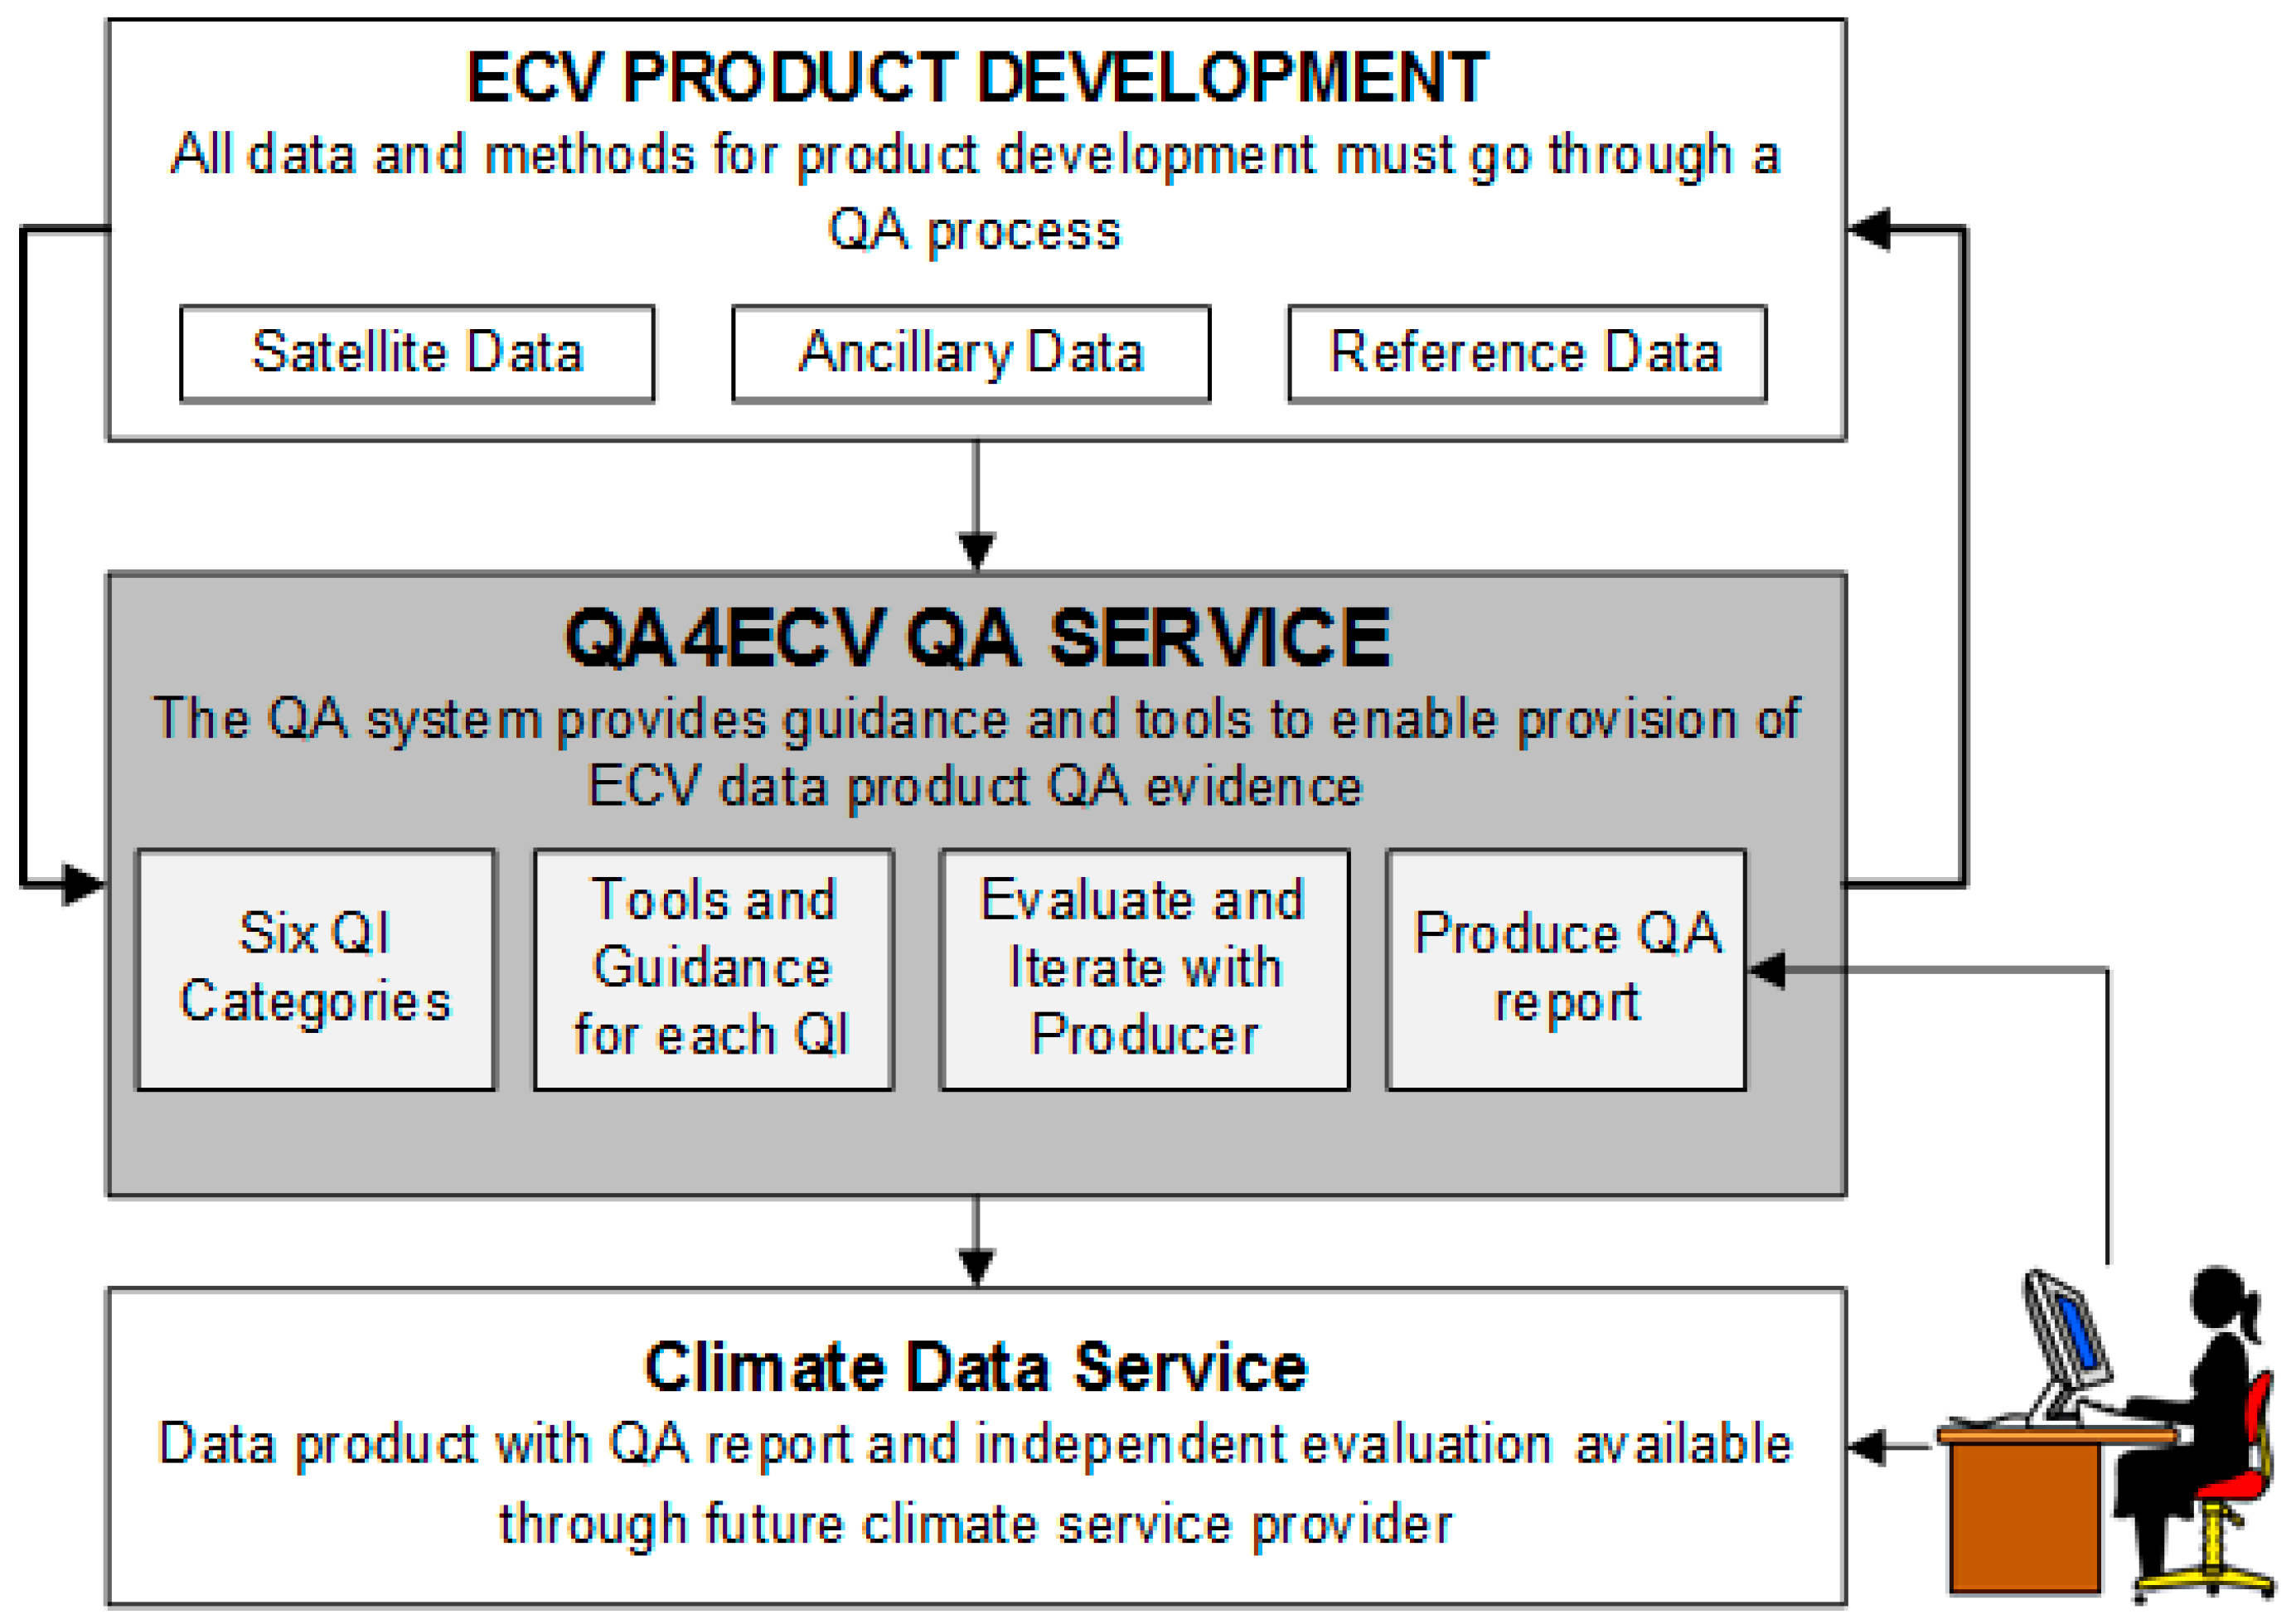
2. Quality Assurance for Essential Climate Variables (QA4ECV)
3. QA4ECV QA System
3.1. QA System Development
3.1.1. Product Details
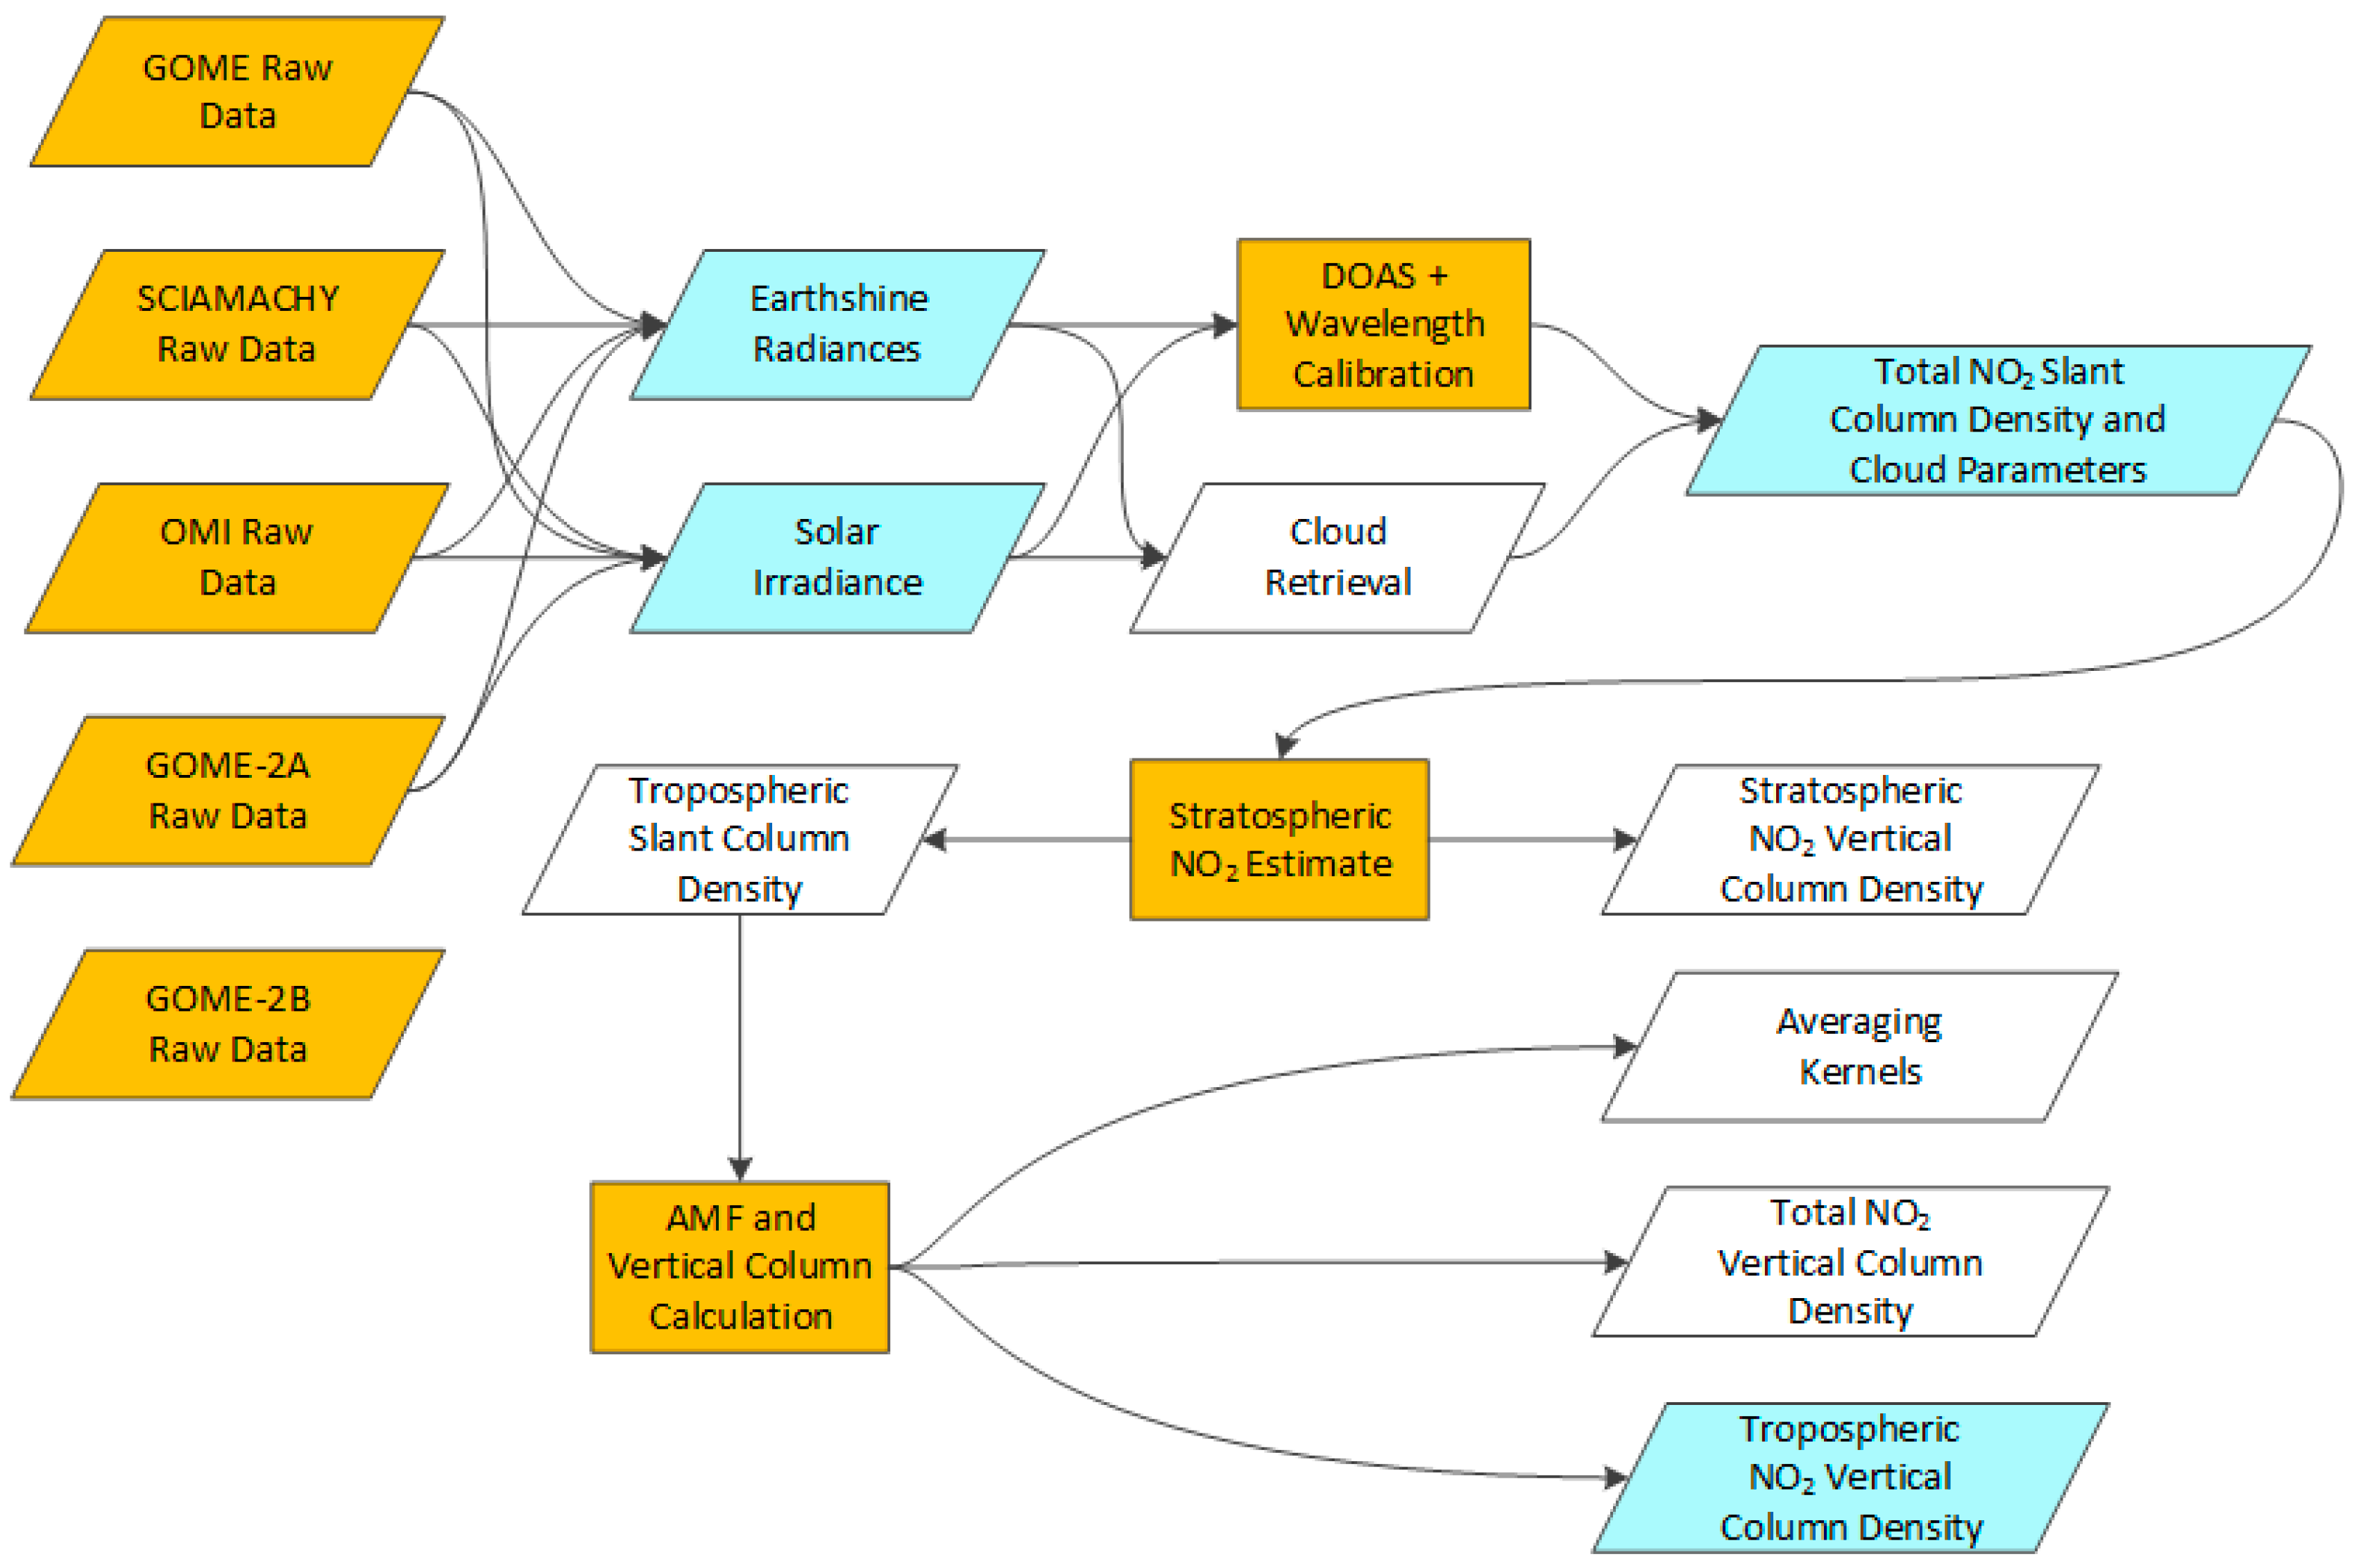
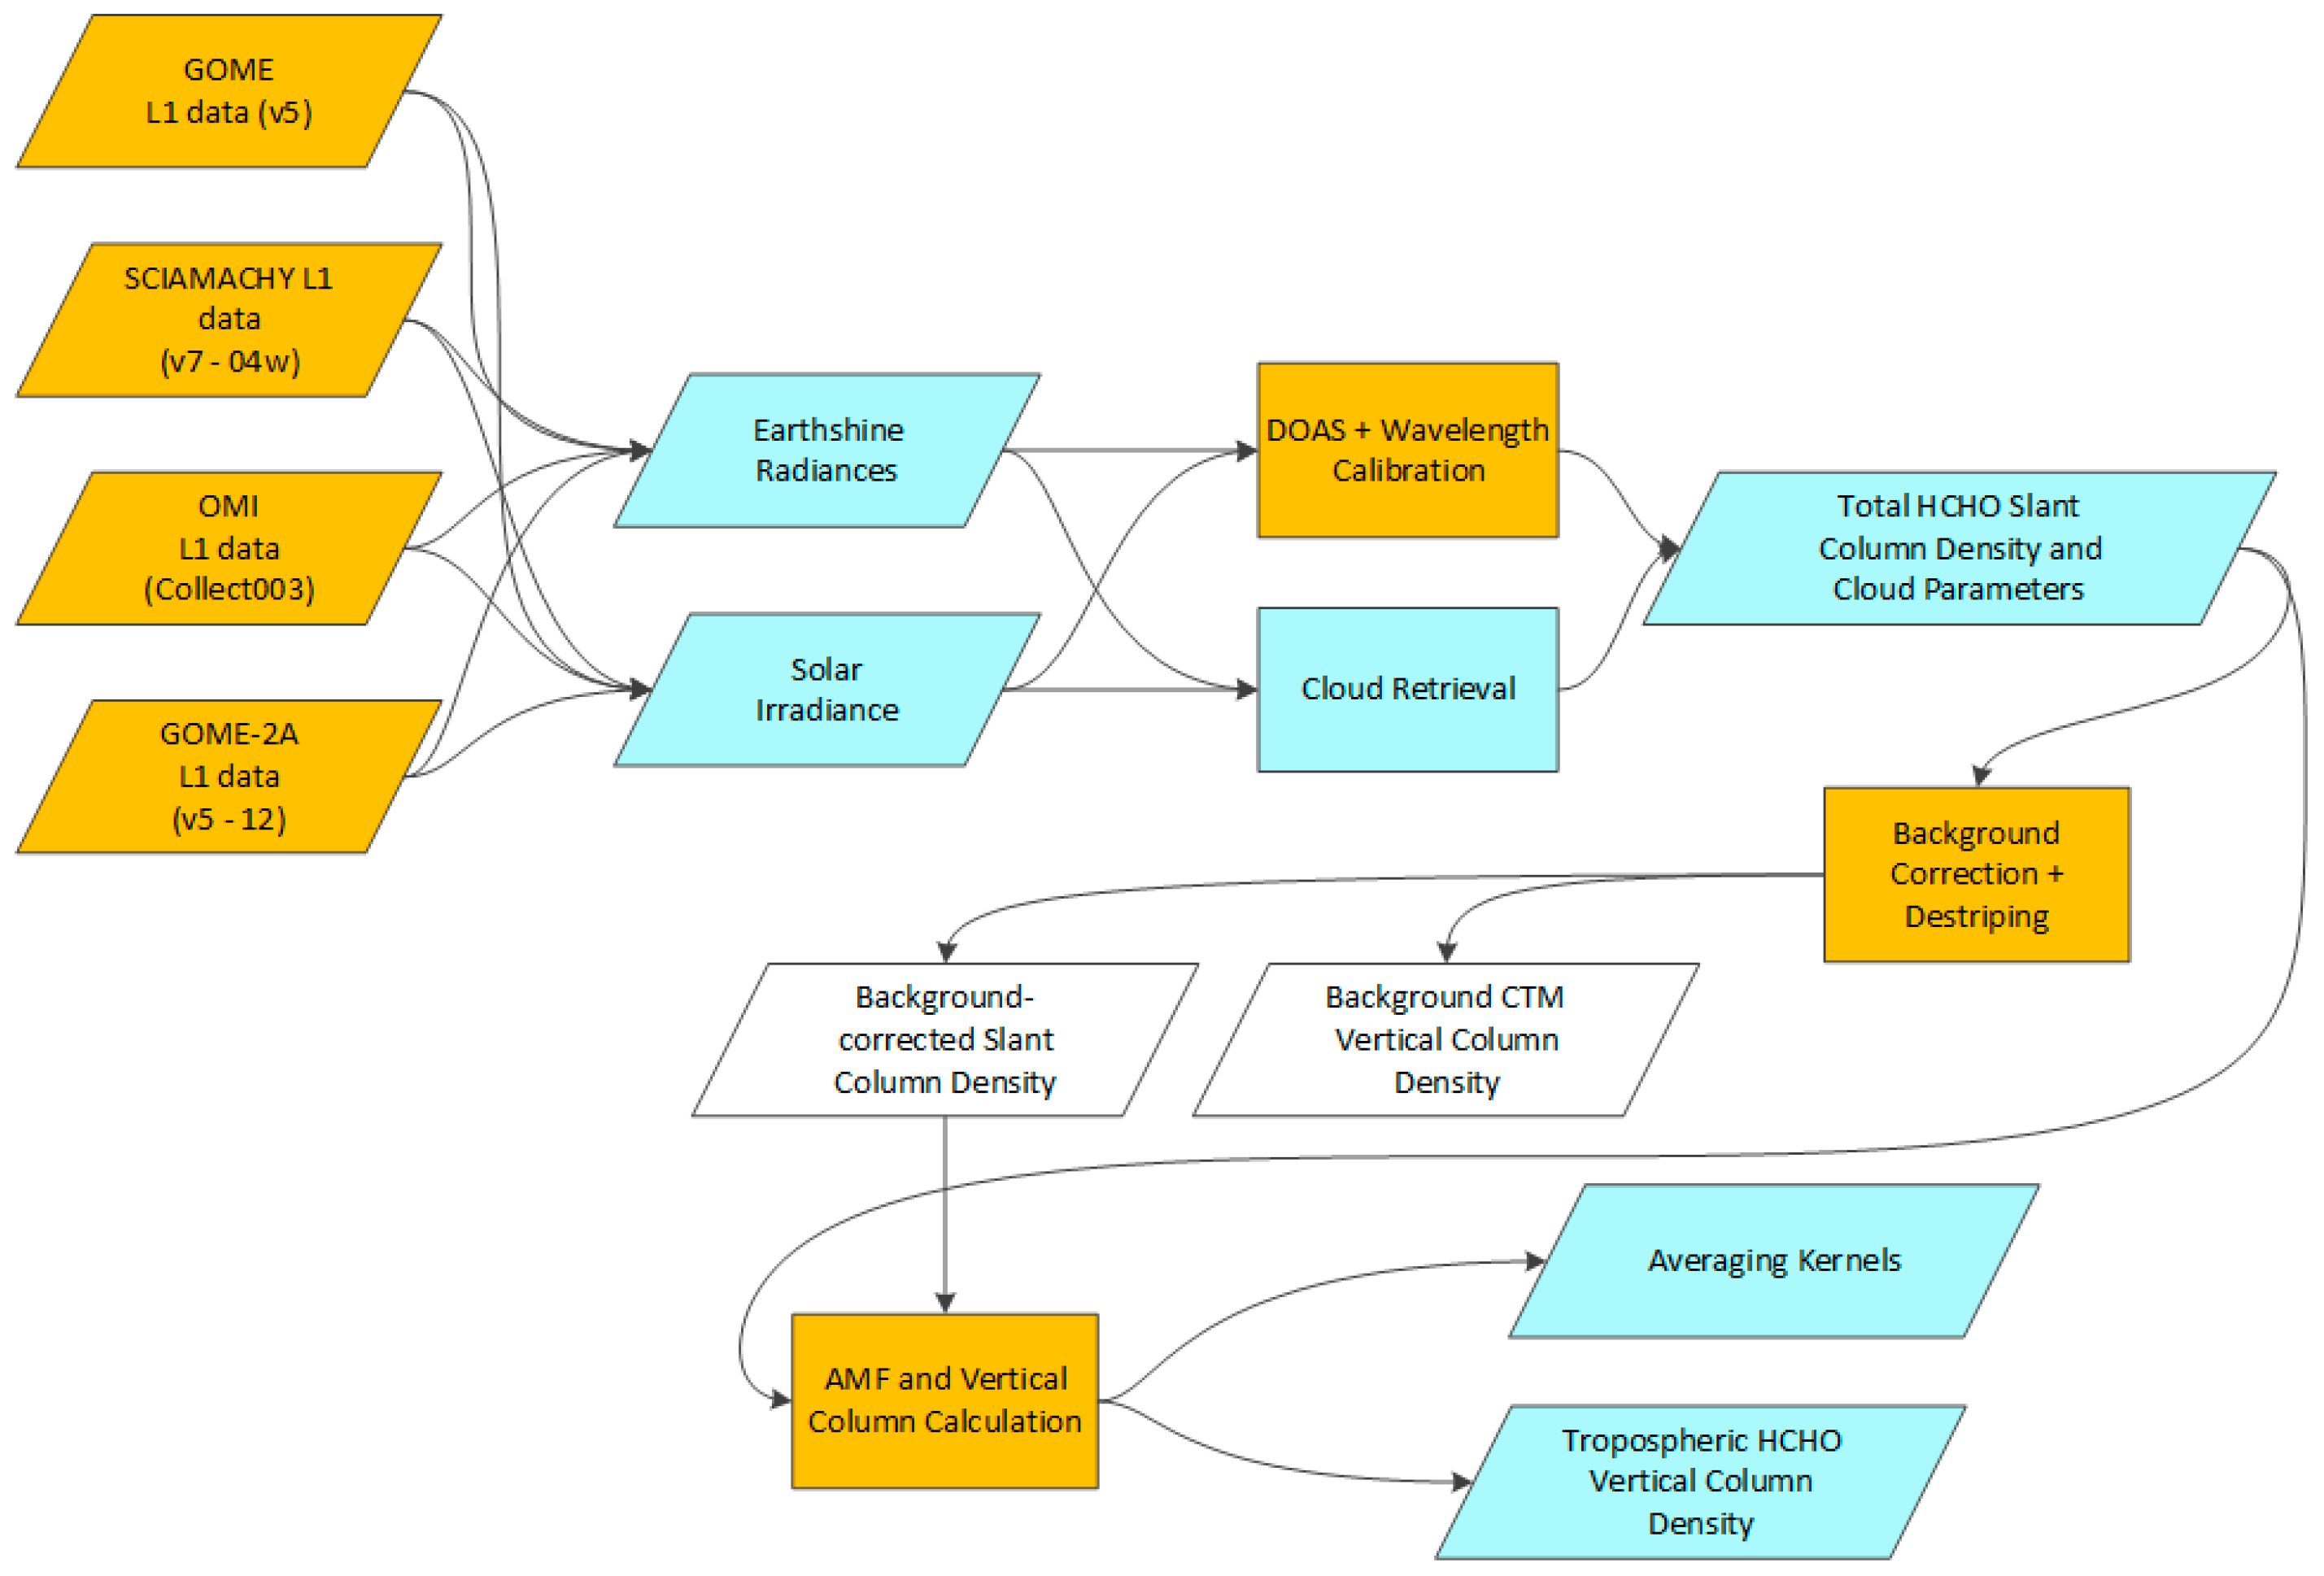
3.1.2. Algorithm Traceability Chain
3.1.3. Quality Flags
3.1.4. Validation and Inter-Comparison
3.1.5. Uncertainties
3.1.6. Assessment against Standards
3.2. QA System Process
3.2.1. A Dedicated QA Administration
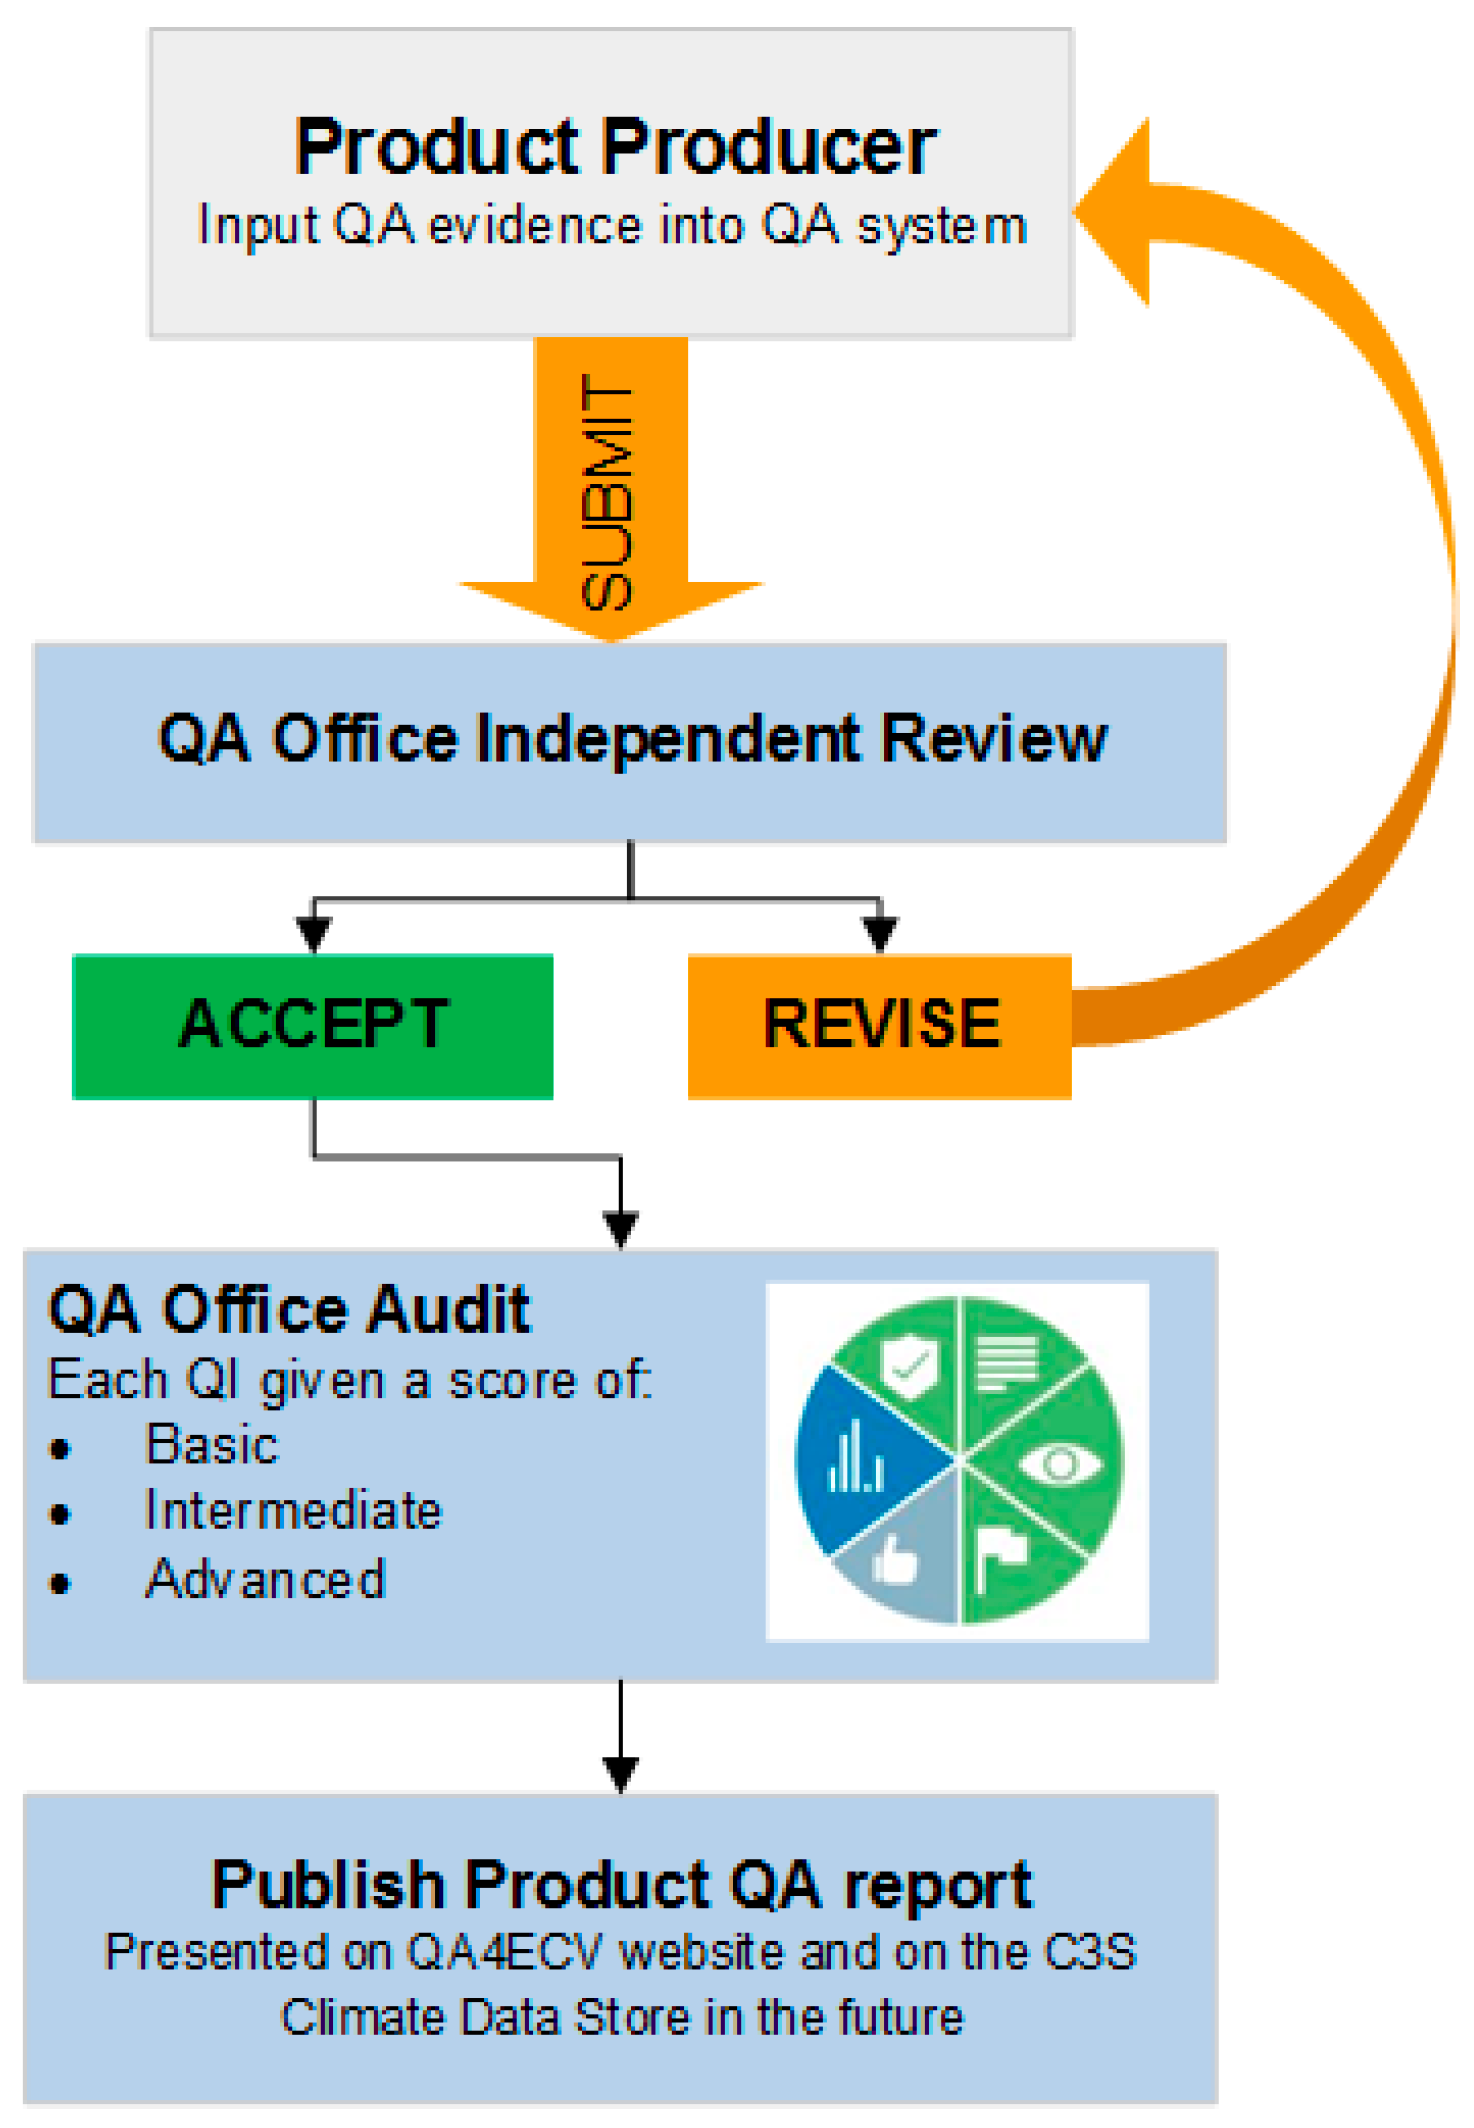
3.2.2. Product Producers
3.3. Training and Guidance
3.4. QA Evaluation (“Auditing”) Process
- Basic—Some information is provided on the quality of the product to allow the users to make a simple distinction between the product and others. (Light grey).
- Intermediate—Detailed information is provided on the product, allowing the user to understand how it was made and the quality and uncertainty information available to them. (Blue).
- Advanced—Significant detailed information is provided on the product, providing the user with enough information to make an informed decision about how the product should be used. (Green).
4. Six New ECV Climate Data Records
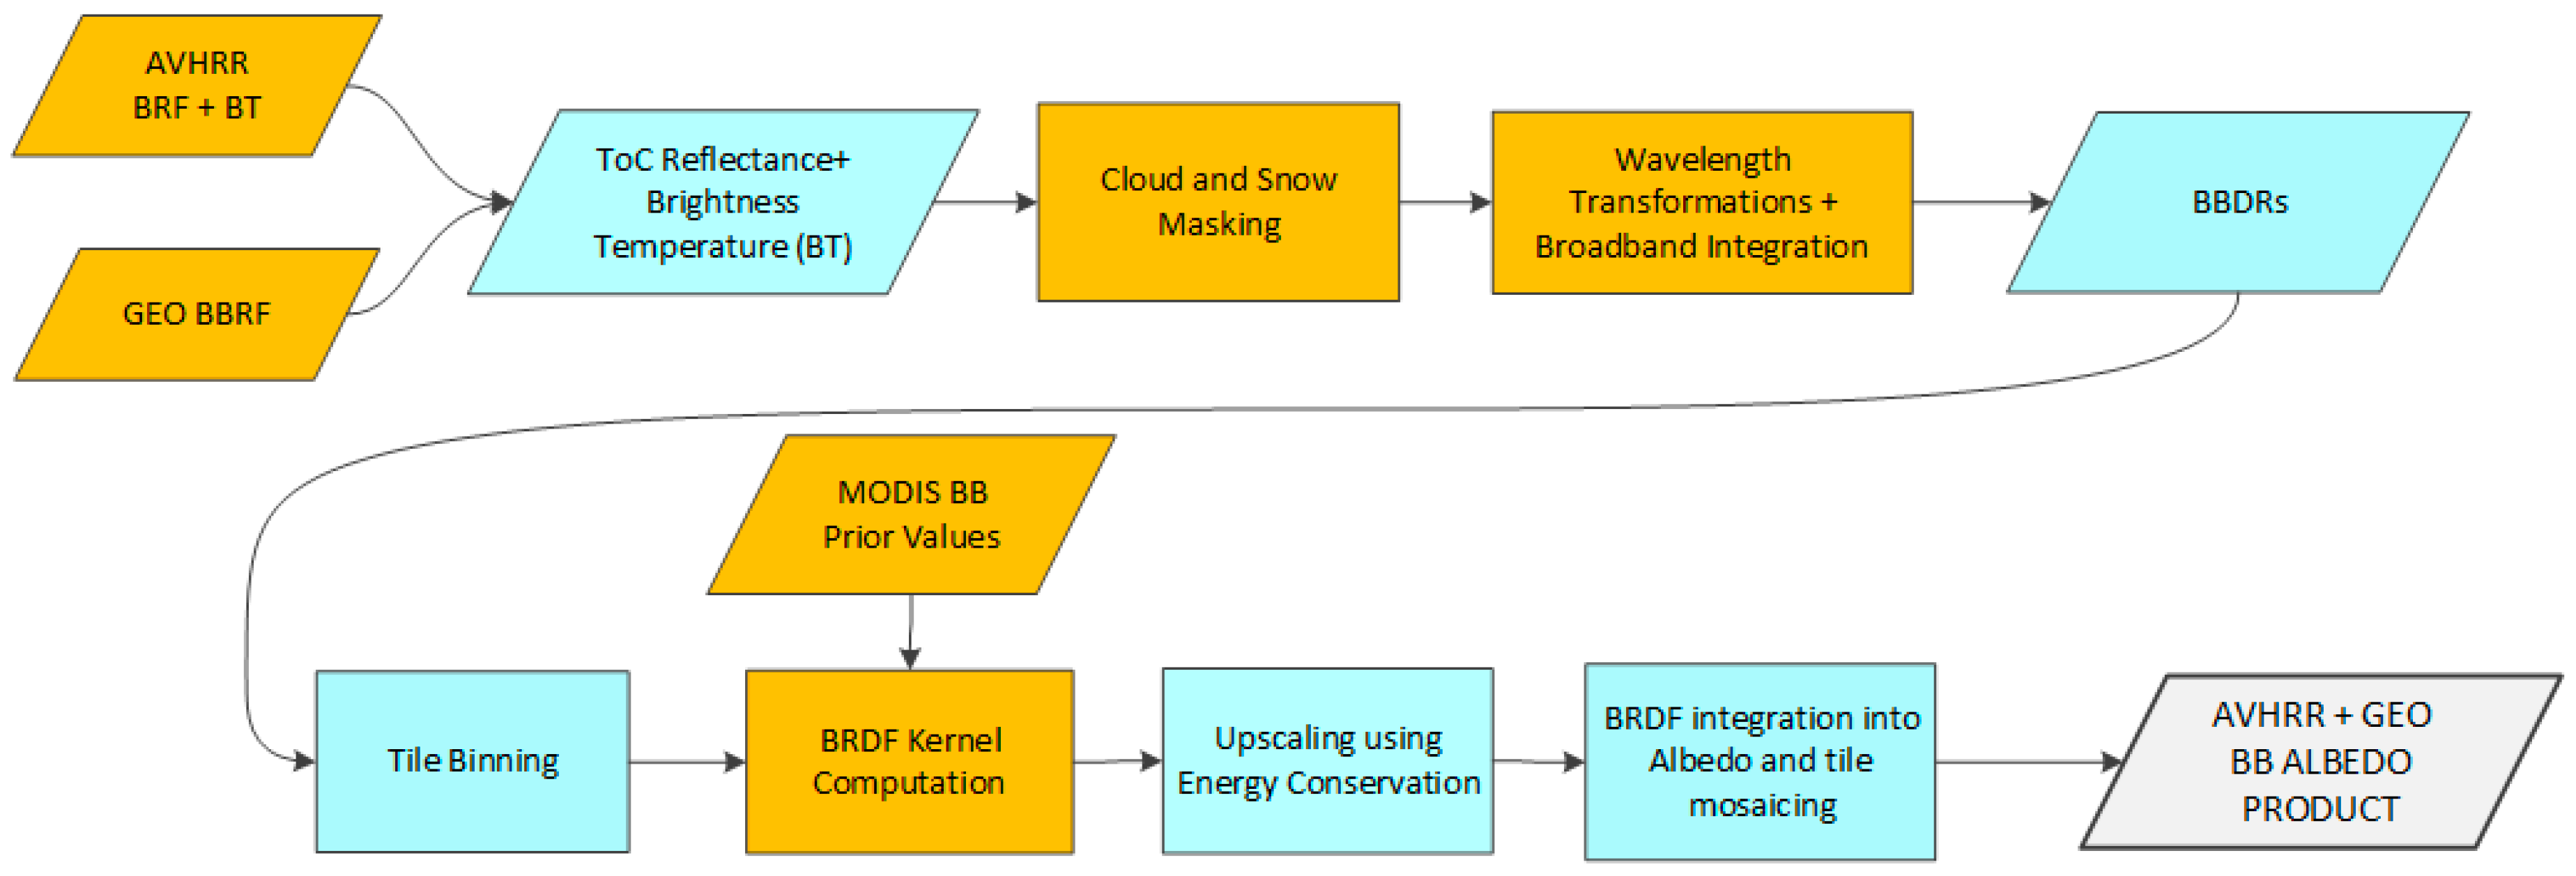
4.1. Broadband Albedo
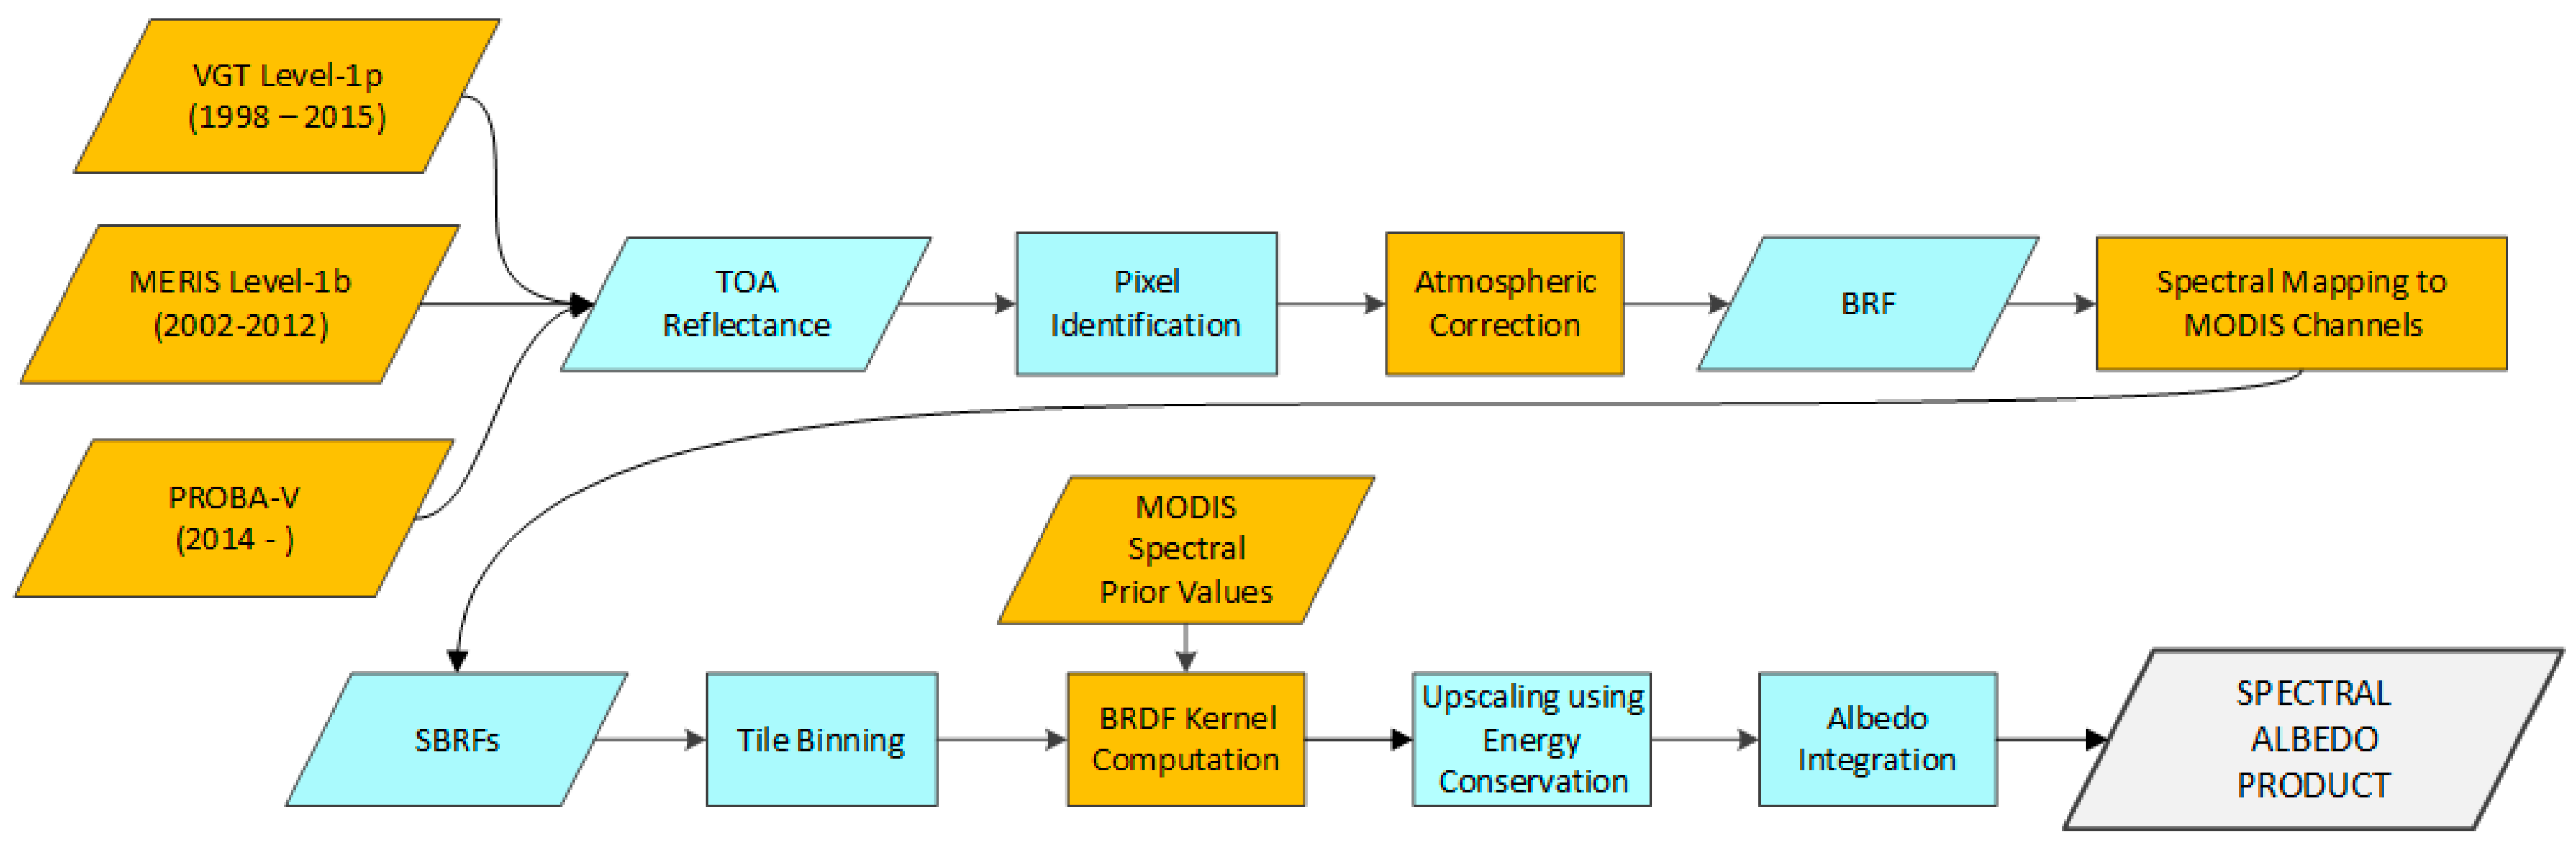
4.2. Spectral Albedo
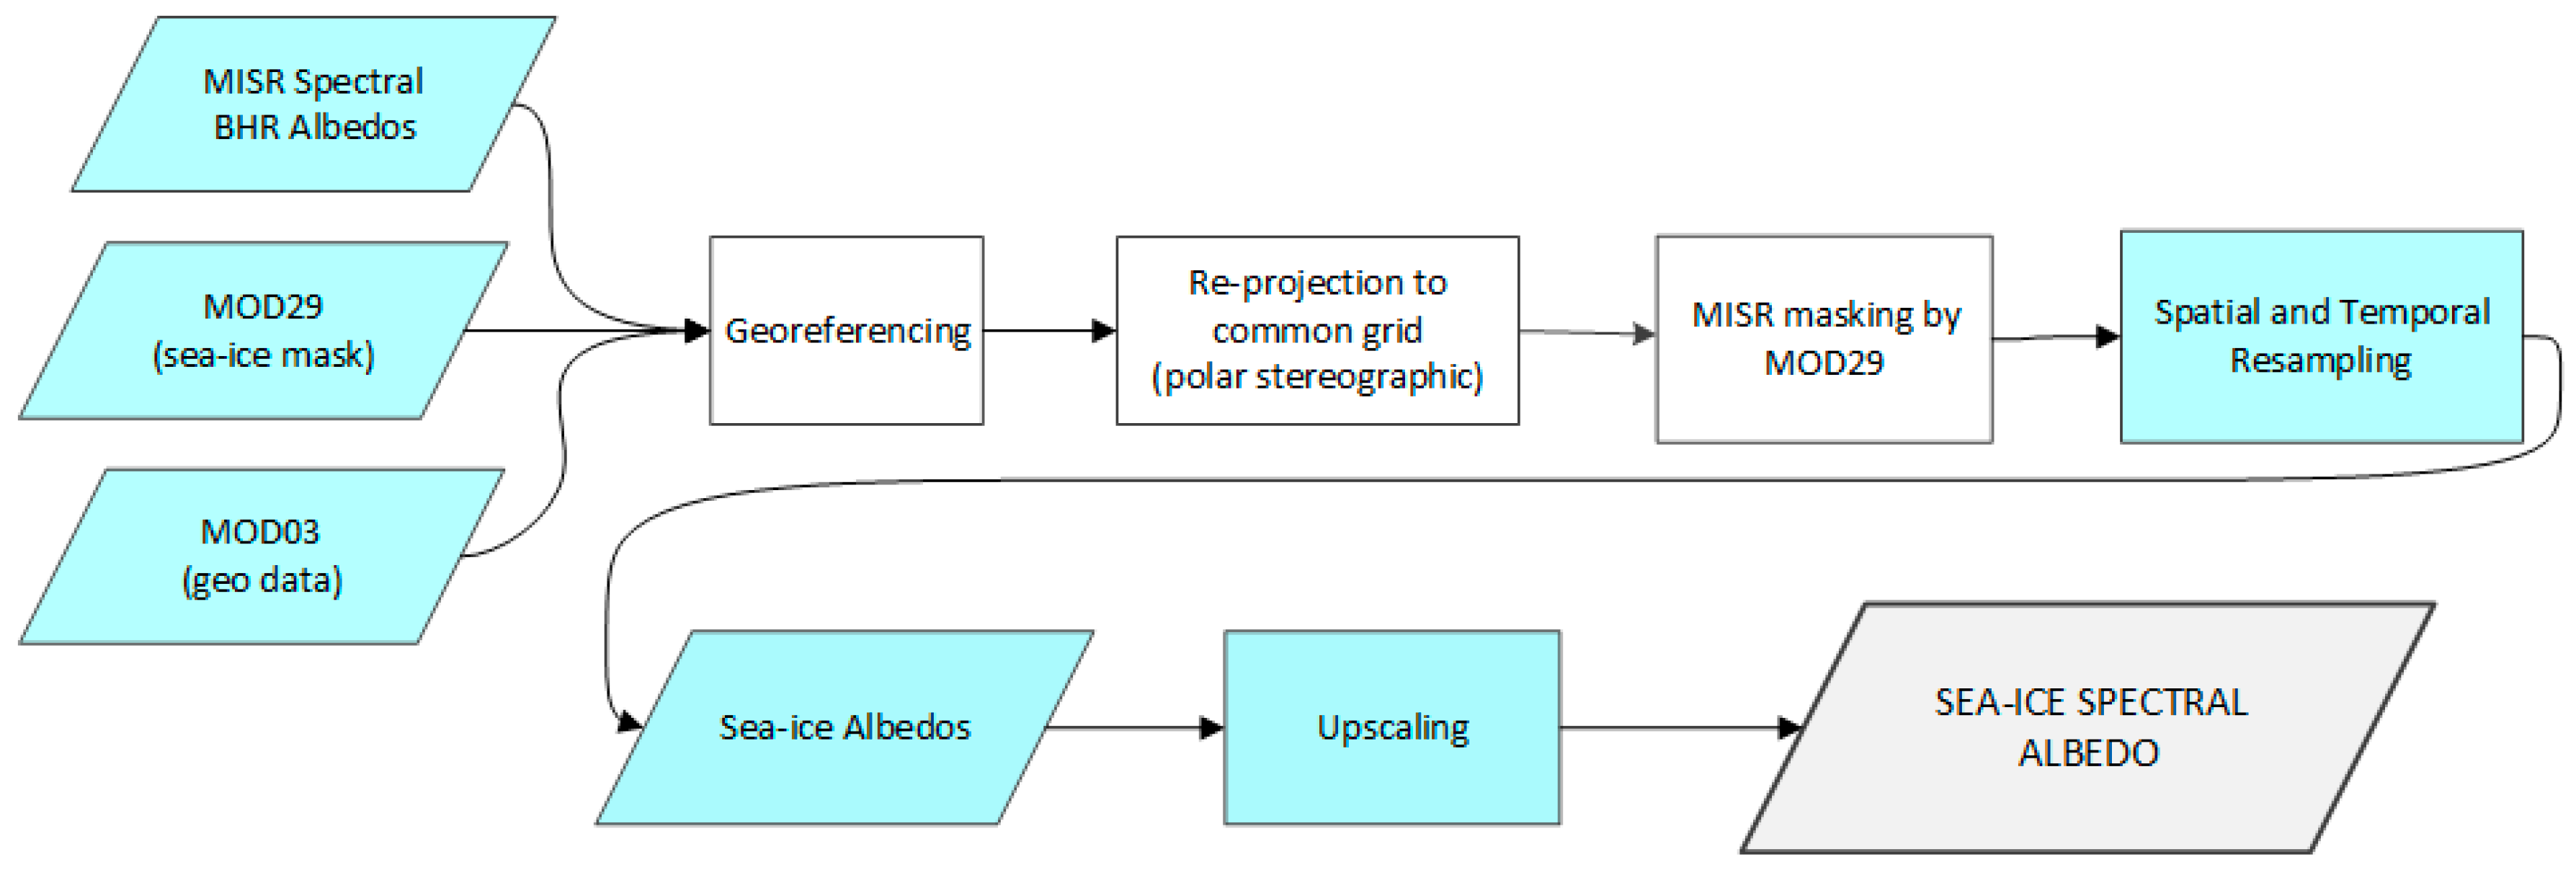
4.3. Sea-Ice Albedo
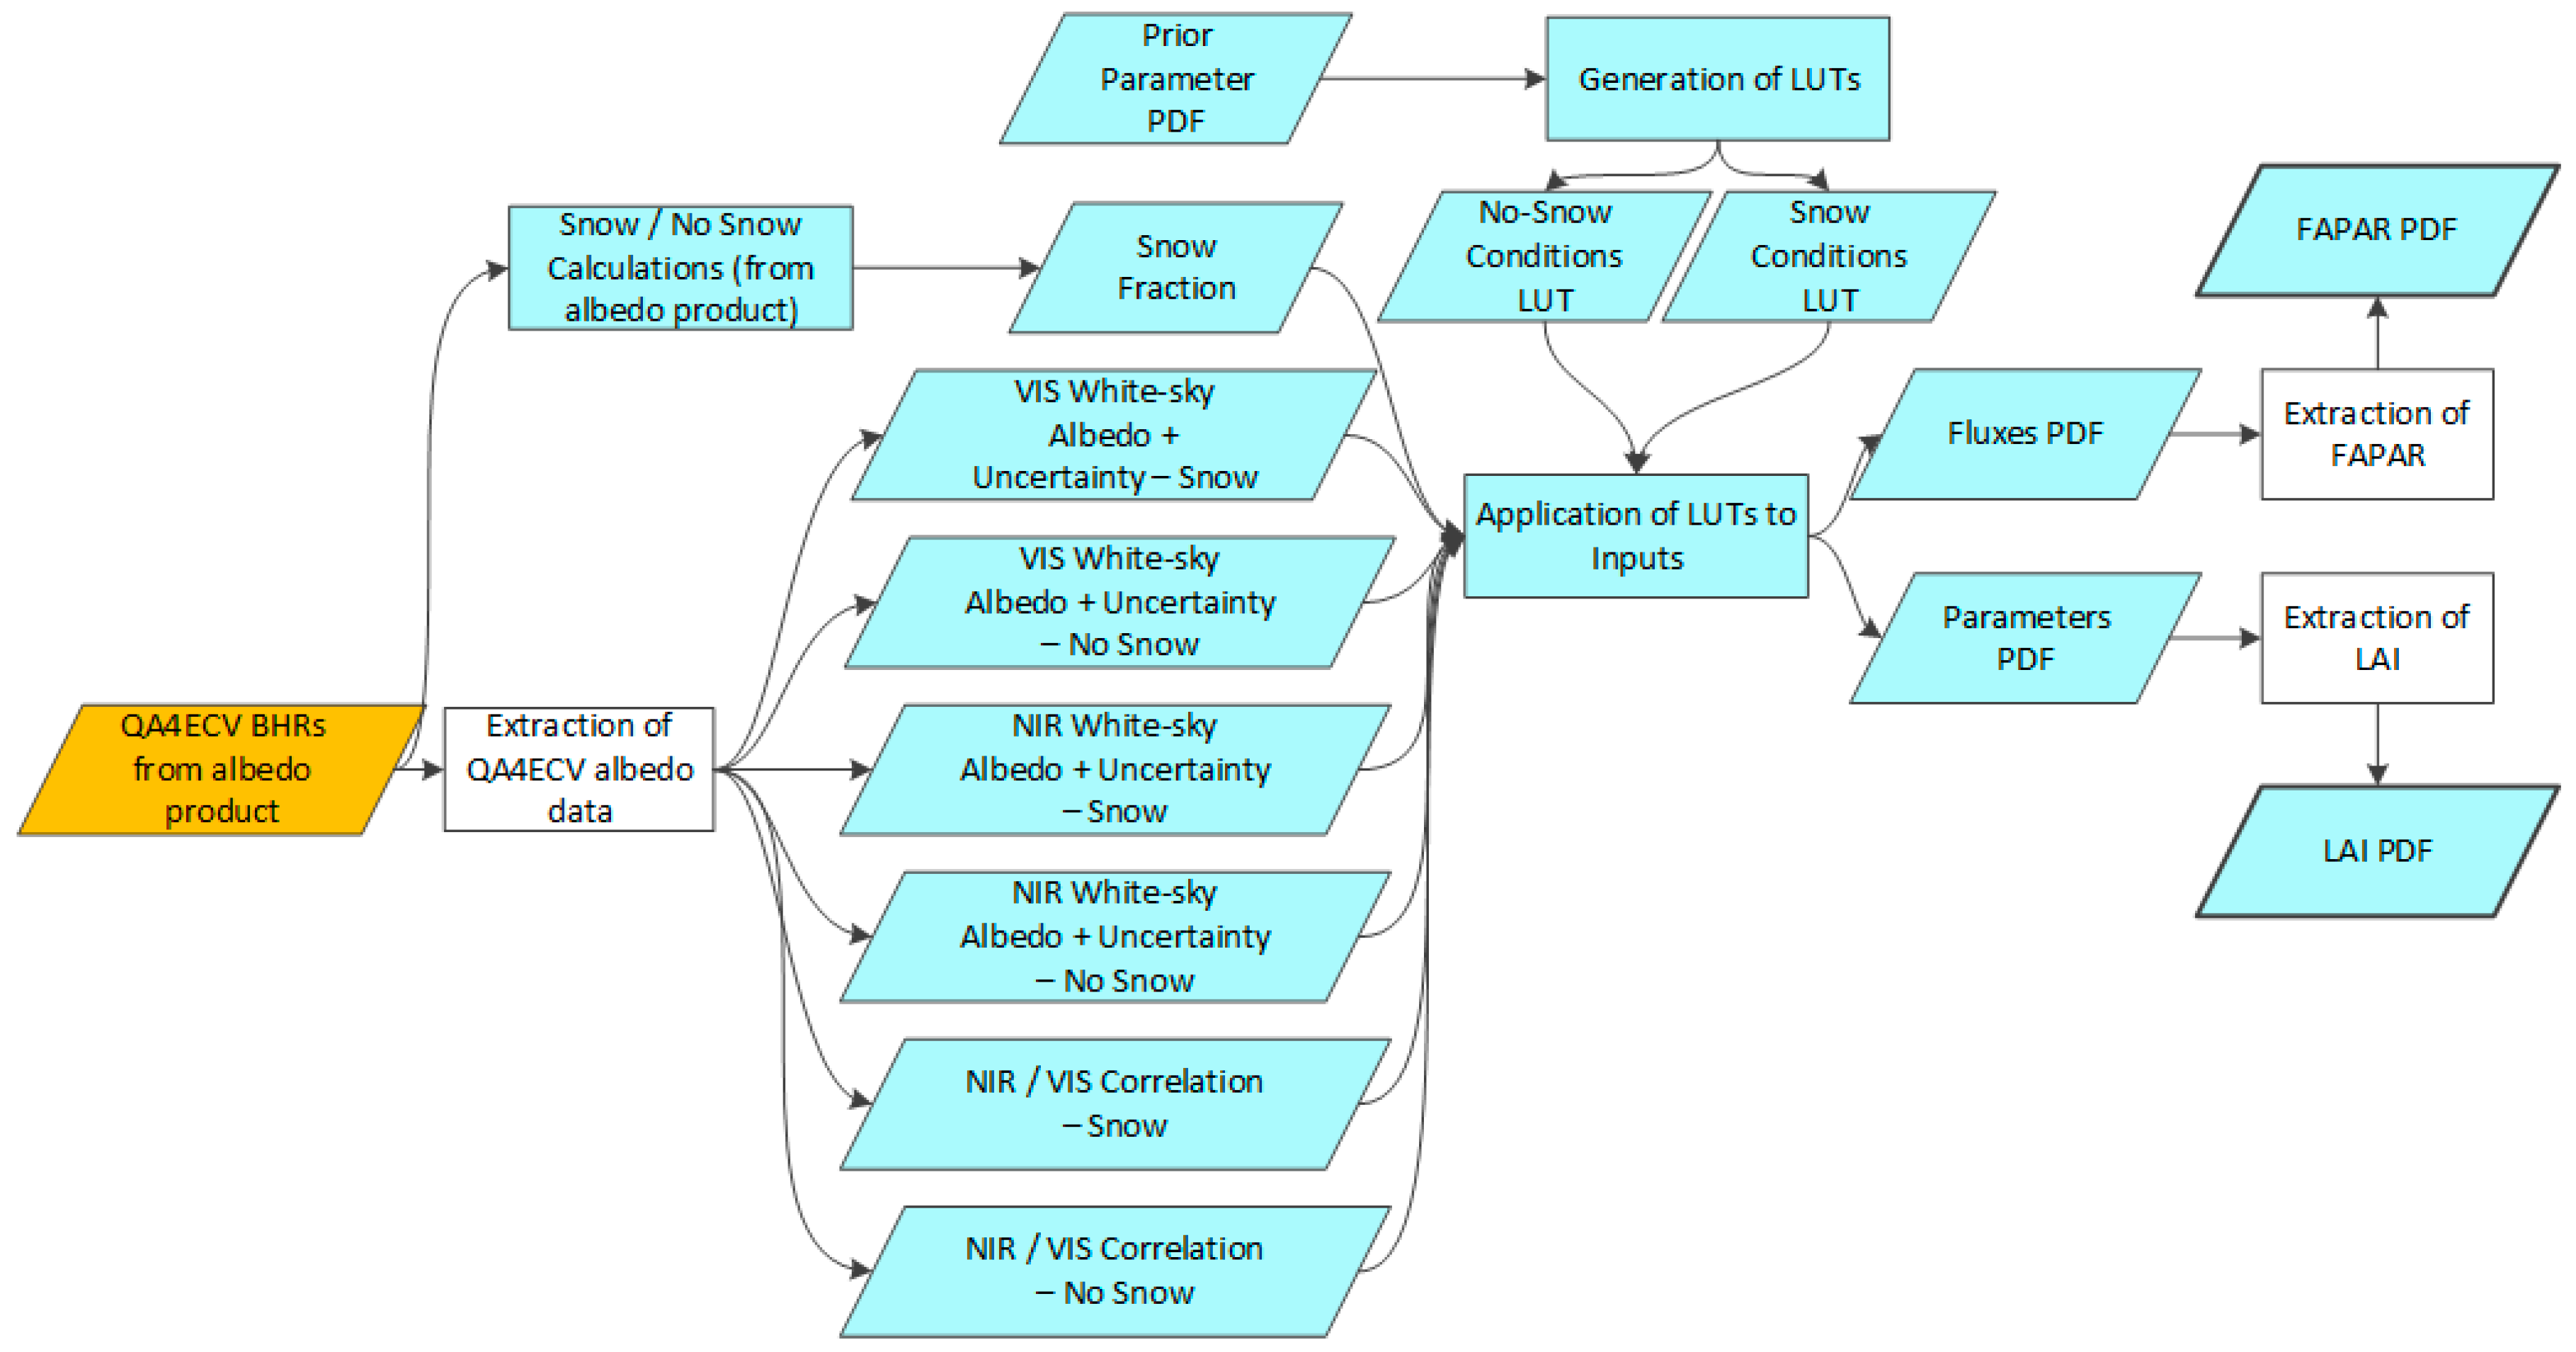
4.4. TIP LAI/FAPAR
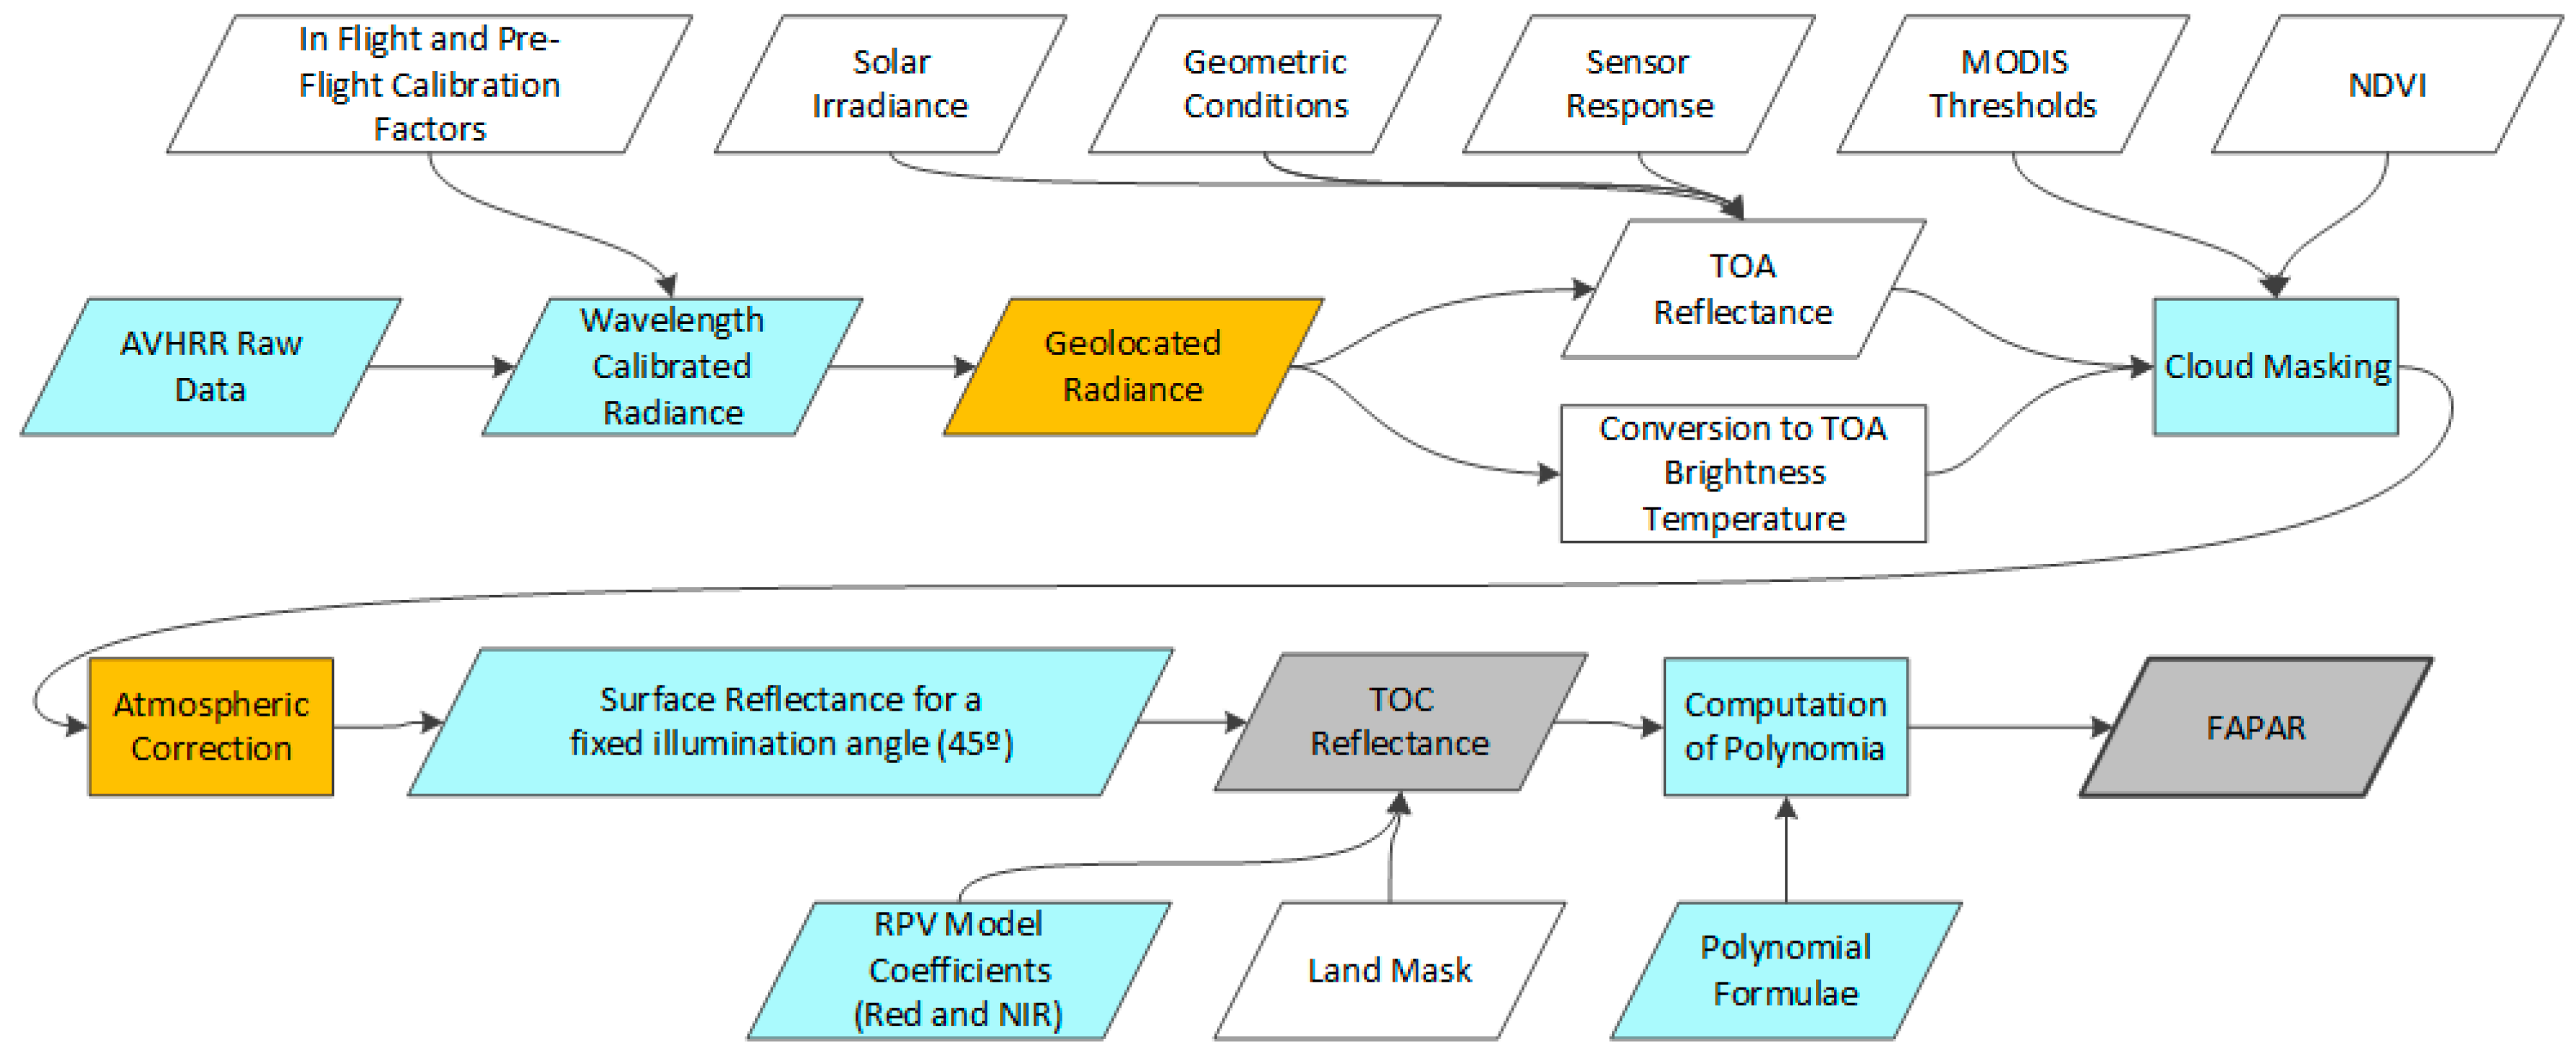
4.5. AVHRR FAPAR
4.6. NO2
4.7. HCHO
4.8. CO
5. QA4ECV Product Quality Reports
| Broadband Albedo The QA4ECV AVHRR + GEO broadband albedo product produced by UCL (University College London, MSSL (Mullard Space Science Laboratory) and Geography) and Brockmann Consult has achieved an advanced status for the product details, traceability chain, and assessment against standards; intermediate status for quality flags; and basic status for uncertainty assessment and validation. |  |
| Spectral Albedo The QA4ECV spectral albedo product produced by UCL (MSSL and Geography) and Brockmann Consult has achieved an advanced status for the product details and traceability chain; intermediate status for assessment against standards; and basic status for quality flags, uncertainty assessment, and validation. |  |
| Sea-Ice Albedo The QA4ECV sea-ice albedo product produced by UCL (MSSL and Geography) and Brockmann Consult has achieved an advanced status for the traceability chain and assessment against standards; intermediate status for product details; and basic status for quality flags, uncertainty assessment, and validation. |  |
| TIP LAI/FAPAR The QA4ECV FAPAR/LAI product produced by FastOpt has achieved an advanced status for the information provided for product details, traceability, quality flags, and assessment against standards; intermediate status for uncertainty assessment; and basic status for validation. |  |
| AVHRR FAPAR The QA4ECV AVHRR FAPAR product produced by JRC has achieved an advanced status for the traceability chain; intermediate status for information provided for product details, quality flags, and assessment against standards; and basic status for uncertainty assessment and validation. |  |
| NO2 The QA4ECV NO2 ECV precursor product has achieved advanced status for the information provided for product details, traceability, quality flags, and assessment against standards; intermediate status for uncertainty assessment; and basic status for validation. |  |
| HCHO The QA4ECV HCHO ECV precursor product has achieved advanced status for the information provided for product details, traceability, quality flags, and assessment against standards; intermediate status for uncertainty assessment; and basic status for validation. |  |
| CO The IASI FORLI CO product (version 20140922 and version 20100815) has achieved advanced status for the information provided for traceability and quality flags; intermediate status for product details; and basic status for uncertainty assessment, validation, and assessment against standards. |  |
6. Conclusions
Supplementary Materials
Author Contributions
Funding
Acknowledgments
Conflicts of Interest
References
- Stocker, T.F.; Qin, D.; Plattner, G.K.; Tignor, M.; Allen, S.K.; Boschung, J.; Nauels, A.; Xia, Y.; Bex, V.; Midgley, P.M. IPCC Summary for Policymakers; Cambridge University Press: Cambridge, UK; New York, NY, USA, 2013. [Google Scholar]
- UNFCCC. The Paris Agreement-2015. 2017, p. 27. Available online: http://unfccc.int/paris_agreement/items/9485.php (accessed on 6 August 2018).
- GCOS-200. The Global Observing System for Climate: Implementation Needs; World Meteorological Organisation: Geneva, Switzerland, 2016; Available online: https://library.wmo.int/opac/doc_num.php?explnum_id=3417 (accessed on 6 August 2018).
- Bojinski, S.; Verstraete, M.; Peterson, T.; Richter, C.; Simmons, A.; Zemp, M. The Concept of Essential Climate Variables in Support of Climate Research, Applications, and Policy. Bull. Am. Meteorol. Soc. 2014, 95, 1431–1443. [Google Scholar] [CrossRef] [Green Version]
- Cooke, R.; Golub, A.; Wielicki, B.; Young, D.; Mlynczak, M.; Baize, R. Using the social cost of carbon to value earth observing systems. Clim. Policy 2016, 17, 330–345. [Google Scholar] [CrossRef]
- Widlowski, J.-L. Conformity testing of satellite-derived quantitative surface variables. Environ. Sci. Policy 2015, 51, 149–169. [Google Scholar] [CrossRef]
- Nightingale, J.; Compernolle, S.; Lambert, J.-C.; Boersma, F.; Muller, J.-P.; Scanlon, T.; Douglas, S.; Fox, N. Framework for a Prototype QA Service in Support of C3S (Version 3.0). National Physical Laboratory, 2018. Available online: http://www.qa4ecv.eu/ (accessed on 6 August 2018).
- Nightingale, J.; de Rudder, A.; Boersma, F.; Scanlon, T.; Farquhar, C.; Muller, J.-P.; Fox, N. Results from the QA4ECV User Requirements Survey on Quality Assurance in Satellite Data Products; National Physical Laboratory: London, UK, 2015. [Google Scholar]
- IPCC. Chapter 8: Quality Assurance and Quality Control; IPCC: Montreal, QC, Canada, 2001. [Google Scholar]
- Henry, A.; Wood, A.; Mustafee, I.; Alegre, R.; Blower, J.D.; Kershaw, P.; Nagni, M.; Harwood, P.; Phipps, R. CHARMe: Earth Observation Metadata and the Semantic Web. In Proceedings of the 65th International Astronautical Congress, Toronto, Canada, 29 September–3 October 2014. [Google Scholar]
- Scanlon, T.; Douglas, S.; Nightingale, J.; Compernolle, S.; Lambert, J.-C. Linkages between the QA Service of QA4ECV and Other Projects and Initiatives. National Physical Laboratory, 2017. Available online: http://www.qa4ecv.eu/ (accessed on 6 August 2018).
- Justice, C.; Belward, A.; Morisette, J.; Lewis, P.; Privette, J.; Baret, F. Developments in the validation of satellite sensor products for the study of the land surface. Int. J. Remote Sens. 2000, 21, 3383–3390. [Google Scholar] [CrossRef]
- Nightingale, J.; Schaepman-Strub, G.; Nickeson, J. Assessing Satellite Derived Land Product Quality for Earth System Science Applications: Overview of the CEOS LPV Sub-Group. In Proceedings of the International Symposium on Remote Sensing of Envrionment, Sydney, Australia, 10–15 April 2011. [Google Scholar]
- Compernolle, S.; Lambert, J.-C.; Niemeijer, S. Prototype QA/Validation Service for Atmospheric ECV Precursors: Detailed Processing Model Version 2. 2016. Available online: http://www.qa4ecv.eu/ (accessed on 6 August 2018).
- Schulz, J.; John, V.; Kaiser-Weiss, A.; Tan, D.; Swinnen, E.; Roebeling, R. CORE-CLIMAX European ECV CDR Capacity Assessment Report; EUMETSAT: Darmstadt, Germany, 2015. [Google Scholar]
- Bates, J.J.; Privette, J.L. A maturity model for assessing the completeness fo climate data records. EOS Trans. Am. Geophys. Union 2012, 93, 441. [Google Scholar] [CrossRef]
- Farquhar, C.; Milnes, M.; Hurst, K.; Scanlon, T. Quality Assurance System User Guide. 2017. Available online: http://www.qa4ecv.eu/ (accessed on 6 August 2018).
- ISO9001. Quality Management Systems—Fundamentals and Vocabulary; International Organization for Standardization: Geneva, Switzerland, 2015. [Google Scholar]
- Franch, B.; Vermote, E.; Roger, J.-C.; Murphy, E.; Becker-Reshef, I.; Justice, C.; Claverie, M.; Nagol, J.; Csisza, I.; Meyer, D.; et al. A 30+ Year AVHRR Land Surface Reflectance Climate Data Record and Its Application to Wheat Yield Monitoring. Remote Sens. 2017, 9, 296. [Google Scholar] [CrossRef]
- Lattanzio, A.; Schulz, J.; Matthews, J.; Okuyama, A.; Theodore, B.; Bates, J.; Knapp, K.; Kosaka, Y.; Schuller, L. Land Surface Albedo from Geostationary Satelites: A Multiagency Collaboration within SCOPE-CM. Bull. Am. Meteorol. Soc. 2013, 94, 205–214. [Google Scholar] [CrossRef]
- Lewis, P.; Guanter, L.; Saldana, G.L.; Muller, J.-P.; Watson, G.; Shane, N.; Kennedy, T.; Fisher, J.; Domenech, C.; Preusker, R.; et al. The ESA GlobAlbedo Project: Algorithm. In Proceedings of the 2012 IEEE International Geoscience and Remote Sensing Symposium (IGARSS12), Munich, Germany, 22–27 July 2012; pp. 5745–5748. [Google Scholar]
- EUMETSAT. Meteosat Surface Albedo Retrieval: Algorithm Theoretical Basis Document. 2014. Available online: http://www.qa4ecv-land.eu/docs/BRDFalbedo/PDF_MSA_ATBD.pdf (accessed on 6 August 2018).
- Muller, J.P.; Kennedy, T.; Lewis, P.; Kharbouche, S.; Fisher, D.; North, P.; Fisher, J.; Preusker, R.; Brockmann, C.; Kramer, U.; et al. GlobAlbedo Algorithm Theoretical Basis Document Version 4.12. 2013. Available online: http://www.globalbedo.org/docs/GlobAlbedo_Albedo_ATBD_V4.12.pdf (accessed on 6 August 2018).
- Karlsson, K.G.; Anttila, K.; Trentmann, J.; Stengel, M.; Meirink, J.; Devasthale, A.; Hanschmann, T.; Kothe, S.; Jääskeläinen, E.; Sedlar, J.; et al. CLARA-A2: The second edition of the CM SAF cloud and radiation data record from 34 years of global AVHRR data. Atmos. Chem. Phys. 2017, 17, 5809–5828. [Google Scholar] [CrossRef]
- Riggs, G.; Hall, D. MODIS Sea Ice Products User Guide to Collection 6. 2015. Available online: https://nsidc.org/sites/nsidc.org/files/files/modis-sea-ice-user-guide-C6%5B1%5D.pdf (accessed on 6 August 2018).
- Muller, J.-P.; Kharbouche, S. Variation of Arctic’s Sea-ice Albedo between 2000 and 2016 by fusion of MISR and MODIS data. In Proceedings of the EGU General Assembly Conference Abstracts, Vienna, Austria, 23–28 April 2017. [Google Scholar]
- Kharbouche, S.; Muller, J.-P.; Gatebe, C.; Scanlon, T. Assessment of Satellite-Derived Surface Reflectances by NASA’s CAR Airborne Radiometer over Railroad Valley Playa. Remote Sens. 2017, 9, 562. [Google Scholar] [CrossRef]
- Voßbeck, M.; Clerici, M.; Kaminski, T.; Lavergne, T.; Pinty, B.; Giering, R. An inverse radiative transfer model of the vegetation canopy based on automatic differentiation. Inverse Probl. 2010, 26, 095003. [Google Scholar] [CrossRef]
- Peng, J.; Blessing, S.; Giering, R.; Muller, B.; Gobron, N.; Nightingale, J.; Boersma, F.; Muller, J.-P. Quality-assured long-term satllite-based leaf area index product. Glob. Chang. Biol. 2017, 23, 5027–5028. [Google Scholar] [CrossRef] [PubMed]
- Pinty, B.; Lavergne, T.; Dickinson, R.; Widlowski, J.-L.; Gobron, N.; Verstraete, M. Simplifying the interaction of land surfaces with radiation for relating remote sensing products to climate models. J. Geophys. Res. Atmos. 2006, 111, 20. [Google Scholar] [CrossRef]
- Disney, M.; Muller, J.-P.; Kharbouche, S.; Kaminski, T.; Vossbeck, M. fAPAR/LAI Product Validation Report. ESA, Ed.; 2013, p. 50. Available online: http://aramis.obspm.fr/~jimenez/Docs/WACMOSET/WACMOSET_WP2230_approved.pdf (accessed on 6 August 2018).
- Muller, J.-P.; Lewis, P.; Disney, M. Design of the Albedo/fAPAR/LAI Products. Technical Report WP2210-2220. 2013, p. 24. Available online: http://aramis.obspm.fr/~jimenez/Docs/WACMOSET/WACMOSET_WP2210_WP2220_approved.pdf (accessed on 6 August 2018).
- Kaminski, T.; Knorr, W.; Scholze, M.; Gobron, N.; Pinty, B.; Giering, R.; Mathieu, P.-P. Consistent assimilation of MERIS FAPAR and atmospheric CO2 into a terrestrial vegetation model and interactive mission benefit analysis. Biogeosciences 2012, 9, 3173–3184. [Google Scholar] [CrossRef] [Green Version]
- UCL/MSSL; Brockmann Consult; EUMETSAT; FastOpt; JRC. D7.5–Product User Guide Document. 2018. Available online: http://www.qa4ecv-land.eu/document.php (accessed on 6 August 2018).
- Muller, J.P.; Kharbouche, S.; Watson, G.; Danne, O.; Blessing, S.; Giering, R.; Gobron, N.; Govaerts, Y.; Schulz, J.; Lattanzio, A.; et al. Quality assessment of Land ECV Data Products. 2018. Available online: http://www.qa4ecv.eu/sites/default/files/D5.4_v1.0.pdf (accessed on 6 August 2018).
- Gobron, N.; Pinty, B.; Aussedat, O.; Taberner, M.; Faber, O.; Melin, F.; Lavergne, T.; Robustelli, M.; Snoeij, P. Uncertainty Estimates for the FAPAR Operational Products Derived from MERIS—Impact of Top-of-Atmosphere Radiance Uncertainties and Validation with Field Data. Remote Sens. Environ. 2008, 112, 1871–1883. [Google Scholar] [CrossRef]
- Gobron, N.; Belward, A.; Pinty, B.; Knorr, W. Monitoring Biosphere Vegetation 1998–2009. Geophys. Res. Lett. 2010, 37. [Google Scholar] [CrossRef]
- Gobron, N. Terrestrial vegetation dynamics. Bull. Am. Meteorol. Soc. 2017, 98, S57. [Google Scholar] [CrossRef]
- Boersma, K.F.; Eskes, H.H.J.; Richter, A.A.; de Smedt, I.I.; Lorente, A.A.; Beirle, S.; van Geffen, J.; Zara, M.; Peters, E.; van Roozendael, M.; et al. Improving algorithms and uncertainty estimates for satellite tropospheric NO2 retrievals: Results from the Quality Assurance for Essential Climate Variables (QA4ECV) project. Atmos. Meas. Tech. in preparation.
- Boersma, K.F.; Eskes, H.; Richter, A.; de Smedt, I.; Lorente, A.; Beirle, S.; van Geffen, J.; Peters, E.; van Roozendael, M.; Wagner, T. QA4ECV NO2 Tropospheric and Stratospheric Vertical Column Data from OMI (Version 1.1); Royal Netherlands Meteorological Institute (KNMI): De Bilt, The Netherlands, 2017. [Google Scholar]
- Vinken, G.C.M.; Boersma, K.F.; Maasakkers, J.D.; Adon, M.; Martin, R.V. Worldwide biogenic soil NOx emissions inferred from OMI NO2 observations. Atmos. Chem. Phys. 2014, 14, 10363–10381. [Google Scholar] [CrossRef]
- Verstraeten, W.W.; Neu, J.L.; Williams, J.E.; Bowman, K.W.; Worden, J.R.; Boersma, K.F. Rapid increases in tropospheric ozone production and export from China. Nat. Geosci. 2015, 8, 690–695. [Google Scholar] [CrossRef]
- Xu, X.; Wang, J.; Henze, D.K.; Qu, W.; Kopacz, M. Constraints on aerosol sources using GEOS-Chem adjoint and MODIS radiances, and evaluation with multisensor (OMI, MISR) data. Geophys. Res. Atmos. 2013, 118, 6396–6413. [Google Scholar] [CrossRef] [Green Version]
- Castellanos, P.; Boersma, K.F. Reductions in nitrogen oxides over Europe driven by environmental policy and economic recession. Sci. Rep. 2012, 2, 265. [Google Scholar] [CrossRef] [PubMed]
- Inness, A.; Baier, F.; Benedetti, A.; Bouarar, I.; Chabrillat, S.; Clark, H.; Clerbaux, C.; Coheur, P.; Engelen, R.J.; Errera, Q.; et al. The MACC reanalysis: An 8 yr data set of atmospheric composition. Atmos. Chem. Phys. 2013, 13, 4073–4109. [Google Scholar] [CrossRef] [Green Version]
- Boersma, K.F.; Vinken, G.C.M.; Eskes, H.J. Representativeness errors in comparing chemistry transport and chemistry climate models with satellite UV–Vis tropospheric column retrievals. Geosci. Model Dev. 2016, 9, 875–898. [Google Scholar] [CrossRef]
- De Smedt, I.; Theys, N.; Yu, H.; Danckaert, T.; Lerot, C.; Compernolle, S.; van Roozendael, M.; Richter, A.; Hilboll, A.; Peters, E.; et al. Algorithm Theoretical Baseline for formaldehyde retrievals from S5P TROPOMI and from the QA4ECV project. Atmos. Meas. Tech. 2018, 11, 2395–2426. [Google Scholar] [CrossRef]
- Stavrakou. Impact of climate variability on volatile organic compounds emissions assessed using OMI formaldehyde observations. Geophys. Res. Lett. 2018, in press. [Google Scholar]
- Bauduin, S.; Clarisse, L.; Theunissen, M.; George, M.; Hurtmans, D.; Clerbaux, C.; Coheur, P.-F. IASI’s sensitivity to near-surface carbon monoxide (CO): Theoretical analyses and retrievals on test cases. J. Quant. Spectrosc. Radiat. Transf. 2017, 189, 428–440. [Google Scholar] [CrossRef]
- Hurtmans, D.; Coheur, P.-F.; Wespes, L.; Clarisse, L.; Scharf, O.; Clerbaux, C.; Hadji-Lazaro, J.; George, M.; Turquety, S. FORLI radiative transfer and retrieval code for IASI. J. Quant. Spectrosc. Radiat. Transf. 2012, 113, 1391–1408. [Google Scholar] [CrossRef]
- George, M.; Clerbaux, C.; Bouarar, I.; Coheur, P.-F.; Deeter, M.; Edwards, D.; Francis, G.; Gille, J.; Hadji-Lazaro, J.; Hurtmans, A.; et al. An examination of the long-term CO records from MOPITT and IASI: Comparison of retrieval methodology. Atmos. Meas. Tech. 2015, 8, 4313–4328. [Google Scholar] [CrossRef] [Green Version]
- Müller, J.-F.; Stavrakou, T.; Bauwens, M.; George, M.; Hurtmans, D.; Coheur, P.-F.; Clerbaux, C.; Sweeney, C. Top-Down CO Emissions Based On IASI Observations and Hemispheric Constraints on OH Levels. Geophys. Res. Lett. 2018, 45, 1621–1629. [Google Scholar] [CrossRef]
- Nightingale, J.; Compernolle, S.; Boersma, F.; Muller, J.-P.; Blessing, S.; George, M.; de Smedt, I.; Danne, O.; Kharbouche, S.; Gobron, N.; et al. Audit Reports for the QA of the Six QA4ECV ECV Products. QA4ECV Deliverable D2.8. 2018. Available online: http://www.qa4ecv.eu/ (accessed on 6 August 2018).
- Nightingale, J.; Douglas, S.; Compernolle, S.; Boersma, F.; Muller, J.-P. Update of the User Requirements Report. QA4ECV Deliverable D1.3. 2018. Available online: http://www.qa4ecv.eu/ (accessed on 6 August 2018).
- Lee, Y.; Strong, D.; Kahn, B.; Wang, R. AIMQ: A methodology for information quality assessment. Inf. Manag. 2002, 40, 133–146. [Google Scholar] [CrossRef]
- Peng, J.; Privette, J.; Tilmes, C.; Bristol, S.; Maycock, R.; Bates, J.; Hausman, S.; Brown, O.; Kearns, E. A Conceptual Enterprise Framework for Managing Scientific Data Stewardship. Data Sci. J. 2018, 17. [Google Scholar] [CrossRef]


© 2018 by the authors. Licensee MDPI, Basel, Switzerland. This article is an open access article distributed under the terms and conditions of the Creative Commons Attribution (CC BY) license (http://creativecommons.org/licenses/by/4.0/).
Share and Cite
Nightingale, J.; Boersma, K.F.; Muller, J.-P.; Compernolle, S.; Lambert, J.-C.; Blessing, S.; Giering, R.; Gobron, N.; De Smedt, I.; Coheur, P.; et al. Quality Assurance Framework Development Based on Six New ECV Data Products to Enhance User Confidence for Climate Applications. Remote Sens. 2018, 10, 1254. https://doi.org/10.3390/rs10081254
Nightingale J, Boersma KF, Muller J-P, Compernolle S, Lambert J-C, Blessing S, Giering R, Gobron N, De Smedt I, Coheur P, et al. Quality Assurance Framework Development Based on Six New ECV Data Products to Enhance User Confidence for Climate Applications. Remote Sensing. 2018; 10(8):1254. https://doi.org/10.3390/rs10081254
Chicago/Turabian StyleNightingale, Joanne, Klaas Folkert Boersma, Jan-Peter Muller, Steven Compernolle, Jean-Christopher Lambert, Simon Blessing, Ralf Giering, Nadine Gobron, Isabelle De Smedt, Pierre Coheur, and et al. 2018. "Quality Assurance Framework Development Based on Six New ECV Data Products to Enhance User Confidence for Climate Applications" Remote Sensing 10, no. 8: 1254. https://doi.org/10.3390/rs10081254