Article

The Causative Fault of the 2016 Mwp 6.1 Petermann Ranges Intraplate Earthquake (Central Australia) Retrieved by C- and L-Band InSAR Data

Istituto Nazionale di Geofisica e Vulcanologia, Via di Vigna Murata 605, 00143 Rome, Italy
*
Author to whom correspondence should be addressed.
Remote Sens. 2018, 10(8), 1311; https://doi.org/10.3390/rs10081311
Submission received: 26 June 2018 / Revised: 27 July 2018 / Accepted: 16 August 2018 / Published: 20 August 2018

Abstract

:
On 21 May 2016, an Mwp 6.1 earthquake occurred along the Petermann Ranges in Central Australia. Such a seismic event can be classified as a rare intraplate earthquake because the affected area presents low seismicity, being at the center of the Indo-Australian plate. Also, the architecture and kinematics of shear zones in the Petermann Orogen are largely unknown. We used Sentinel-1 C-band descending data and ALOS-2 L-band ascending data to constrain the causative fault. Our analysis revealed that the earthquake nucleated along an unmapped secondary back-thrust of the main feature of the area, namely the Woodroffe thrust.

Graphical Abstract

1. Introduction

The Earth’s dynamics and tectonic phenomena occurring on its surface are well explained by the Plate Tectonics model [1,2,3], which is accepted by the majority of scientists. According to this theory, the plate boundaries (e.g., California, Japan, the Andean Countries) are the most seismically-active regions on the planet, accounting for more than 90% of the total seismic energy released around the world [4]. The box on the right-left corner in Figure 1, which shows the locations where Mw > 5.5 earthquakes occurred worldwide between 2016 and 2017 and the Peak Ground Acceleration (PGA) retrieved by the Global Seismic Hazard Assessment Program [5], demonstrates this clearly.
Although rarer, a few earthquakes also occur in intraplate environments, that is, inside a tectonic plate. For instance, in 1811–1812, the US state of Missouri was affected by a seismic sequence, called the 1811–1812 New Madrid earthquakes, with events of magnitude spanning between 7.2 and 8.1 [6]. Some years later, in 1886, the city of Charleston in the state of South Carolina (US East Coast) was partially destroyed by an Mw 6.5–7.3 intraplate earthquake [7]. The latter was particularly surprising because it occurred in an area where there was no history of even minor earthquakes. More recently, a strong intraplate earthquake (Mw 7.7) hit the region of Gujarat, India, in 2001 [8]. It occurred far from any plate boundaries and caused more than 20,000 casualties. In 2012, the largest known strike-slip intraplate earthquake (Mw 8.6) occurred in the Indian Ocean about 100 km from the Sumatra subduction zone [9]. Several natural and anthropic phenomena can induce this kind of seismic events. Sometimes they occur near ancient rifts because these old structures could be prone to regional tectonic strain. That is the case with most of the earthquakes occurring in the African continent [10], for example, due to the East African Rift System (EARS), which is slowly splitting the African Plate into two tectonic plates. In some cases, such as in the US state of Oklahoma, seismic events are induced by anthropic activities, such as hydraulic fracking, mining, or hydrocarbon extraction [11]. In most cases, however, they are produced by ground movements stressing intraplate environments. The effects of such earthquakes can be rather devastating, especially considering that the regions where they occur are not considered seismically hazardous and local residents are often unprepared to manage a seismic emergency [12].
On 21 May 2016, an Mwp 6.1 intraplate seismic event occurred along the Petermann Ranges Orogen [13], in the southwestern part of the Northern Territory (NT) state of Australia, about 460 km southwest of Alice Springs—the second most populous city of the state—and close to the Uluru, formerly known as Ayers Rock (Figure 1). Luckily, it did not cause any damage or casualties because the region which was affected by the seismic event is a sparsely-inhabited desert area. This event represented a rare intraplate earthquake because the region where it occurred is characterized by low seismicity. Moreover, the architecture and kinematics of the shear zones in the Petermann Orogen are mostly unknown. This work aims to investigate this Mwp 6.1 seismic intraplate event to retrieve the geometry and kinematics of the causative fault. For this purpose, we exploited both C-band Sentinel-1 and L-band ALOS-2 Synthetic Aperture Radar (SAR) data to image the coseismic ground deformation induced by the earthquake by applying the repeat-pass SAR Interferometry (InSAR) technique [14]. Then, we estimated the seismic source model and found the parameters of the causative fault by inverting the InSAR data.

2. Tectonic Framework

Australia is not a particularly seismic area, as it is located in the middle of the Indo-Australian plate. However, the continent experiences earthquakes because the Indo-Australian plate is being pushed northward and colliding with the Eurasian, Philippine, and Pacific plates (see the inset in Figure 2). This tectonic assessment causes the build-up of mainly compressive stresses, which are released during earthquakes. Despite this, though, only a few significant seismic events have shocked the country throughout its history.
The regions most affected by seismic activity are the Flinders Ranges in the southern part of the state of South Australia (SA), the western side of the state of Western Australia (WA), and some coastal areas of the New South Wales (NSW) and Victoria (Vic) states [16,17]. The largest recorded earthquake was in 1988 at Tennant Creek in the Northern Territory, with an estimated magnitude of 6.6. A 6.5-magnitude earthquake at Meckering in 1968 caused extensive damage to buildings and was felt over most of the southern part of Western Australia. Earthquakes of magnitude of 4.0 or more are relatively frequent in Western Australia, with one occurring approximately every five years in the Meckering region.
By contrast, the area affected by the 2016 Mwp 6.1 Petermann Ranges earthquake is characterized by low seismicity. Indeed, only 60 earthquakes were recorded between 1955 and 2016, and the maximum magnitude never exceeded grade 5 (Figure 2).
From a geological point of view, the epicentral area belongs to the Petermann Orogen and is characterized by the presence of plutonic and metamorphic rocks comprising granite and gneiss [18,19]. The tectonic setting mainly shows compressive and transpressional structures. In particular, the main tectonic feature is the northwest-striking, southwest-dipping Woodroffe thrust (Figure 2) [20,21]. However, associating the earthquake event with the mobilization of the Woodroffe Thrust is not straightforward. Indeed, the location and depth of the earthquake estimated through moment tensor solutions is affected by great uncertainties because of the low number of available seismic waveforms [22]. For example, the United States Geological Survey (USGS) provides solutions with a focal depth spanning from about 2 and 12 km [14]. Therefore, a seismic source estimated by direct observation of near-field InSAR coseismic ground deformation is certainly more reliable and accurate than moment tensor solutions.

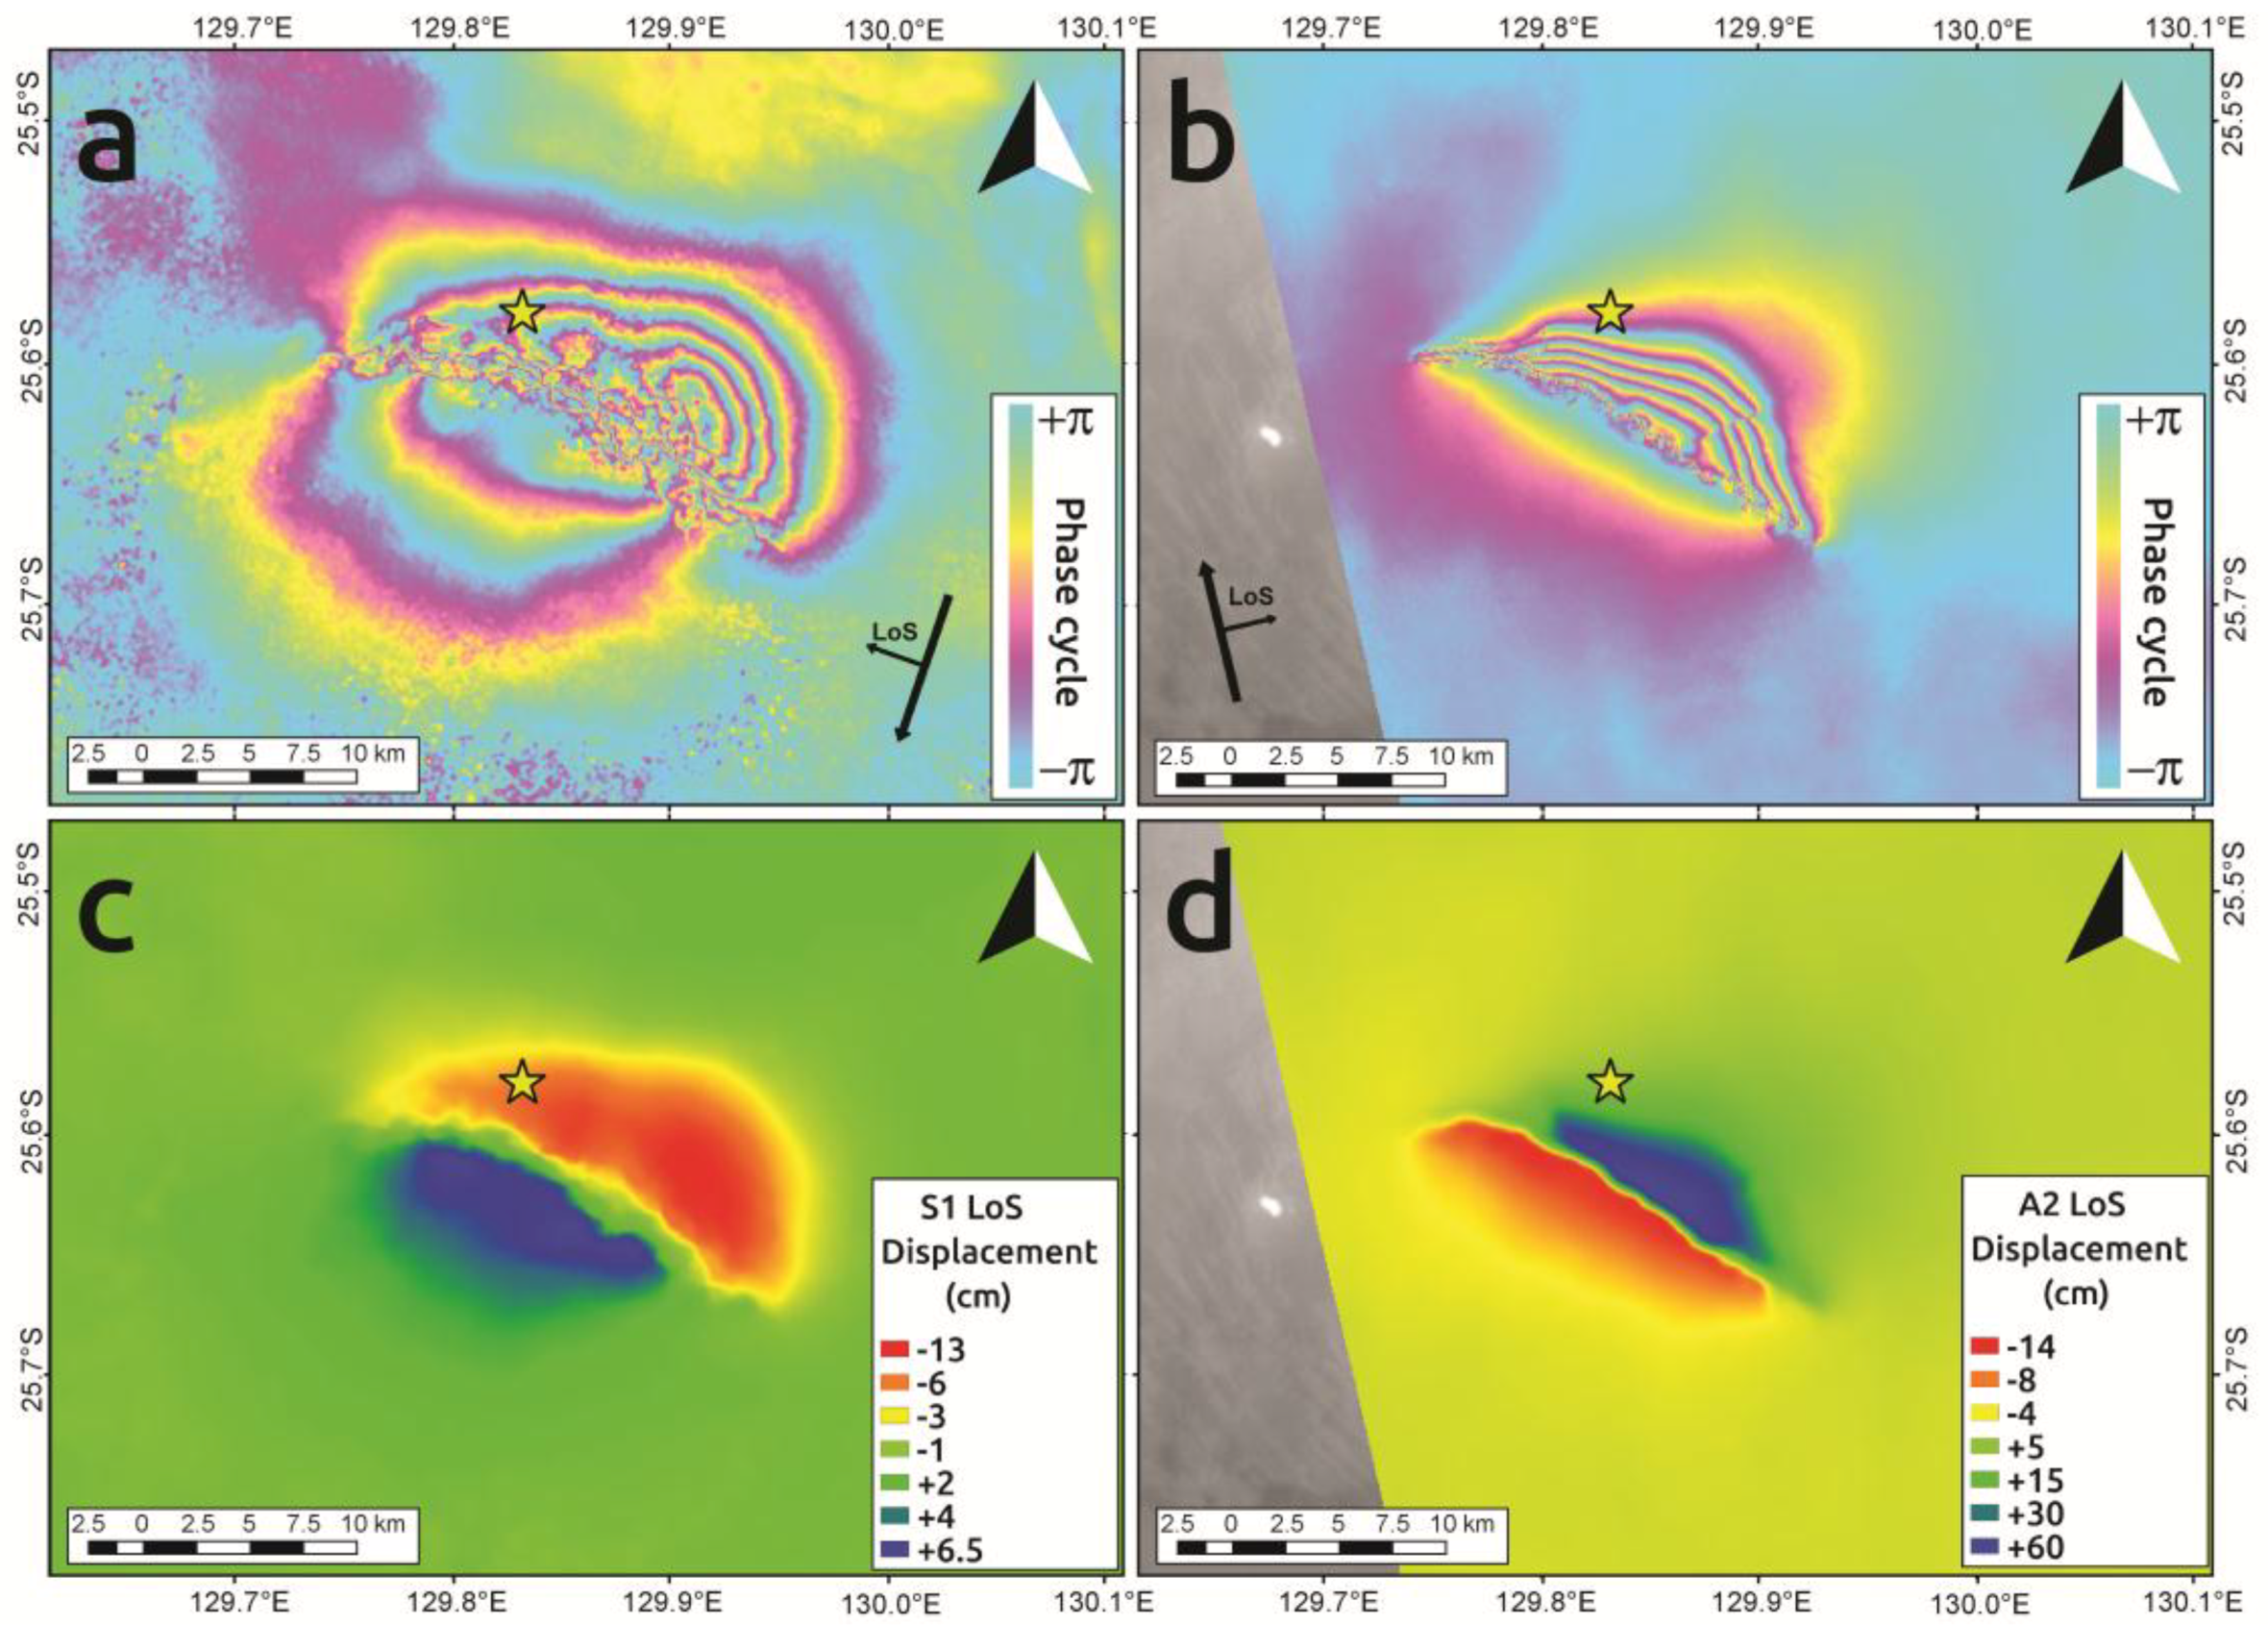
3. InSAR Data and Results

The SAR data used to highlight the coseismic ground deformation consisted of two pairs of Single Look Complex (SLC) images provided by the Sentinel-1A mission, the first satellite of the Sentinel-1 SAR-oriented constellation of the European Space Agency (ESA), and by the ALOS-2 mission of the Japan Aerospace Exploration Agency (JAXA). Unfortunately, the area affected by the seismic event is scarcely covered by SAR acquisitions and the selected data were the best available in terms of coverage and revisit time. The Sentinel-1 data were acquired along descending orbit on 17 October 2015 and 1 June 2016 and were characterized by a perpendicular baseline of ~56 m. The original pixel posting of the Sentinel-1 data was ~3.5 × 15 m along the range and azimuth direction and the acquisition parameters of the SAR sensors, that is, the incidence angle and the azimuth angle were approximately 39° and −167° respectively from the north. The ALOS-2 data were acquired along ascending orbit on 12 December 2015 and 14 June 2016, with incidence and azimuth angles of approximately 36° and −13° respectively from the north. The perpendicular baseline between the two acquisitions was ~90 m, whereas the pixel posting of the images was ~7.5 m × 4 m along range and azimuth. We processed the InSAR data with the help of GAMMA software [25], exploiting the packages specially designed for Sentinel-1 data [26]. In both cases, we used the ~90 m Digital Elevation Model (DEM) provided by the Shuttle Radar Topography Mission (SRTM) for removing the topographic phase from the interferograms. To obtain the same ~90 m pixel size for all the data, we first applied multilooking factors of 24 × 6 and 12 × 24 to Sentinel-1 and ALOS-2 SLC images respectively. Multilooking also allowed us to reduce the speckle noise characterizing the SLC data. The estimated differential interferograms were filtered with Goldstein filtering [27] and then unwrapped with the minimum cost flow algorithm [28]. Despite the long temporal baseline between the SAR acquisitions—228 days for Sentinel-1 data and 182 for ALOS-2—the InSAR analysis detected the coseismic surface deformation clearly. As shown in Figure 3a,b, several interferometric fringes are visible in the proximity of the epicenter on both interferograms. Each fringe represents a deformation estimated along the satellite Line-of-Sight (LoS) of approximately 2.83 cm for Sentinel-1 data and 12 cm for ALOS-2, corresponding to half of the C- and L-band wavelength respectively. Therefore, two deformation lobes characterized the resulting LoS displacement field. The Sentinel-1 and ALOS-2 displacement maps (Figure 3c,d) were opposed in sign, peaking respectively at ~−13 cm (Sentinel-1) and ~60 cm (ALOS-2) on the northern side and ~6 cm (Sentinel-1) and ~−14 cm (ALOS-2) on the southern side. The difference in the displacement signs was due to the acquisitions from different orbits—ascending and descending—and the presence of a strong horizontal displacement component; the latter, moreover, introduced the possibility of a fault mechanism characterized by both strike- and dip-slip dislocation components. In both cases, the retrieved coseismic ground deformation seemed to be compatible with a focal mechanism which was approximately northwest–southeast-oriented. Moreover, the abrupt changes in interferometric fringes of Figure 3a,b suggested that the source was relatively shallow and reached the ground surface.

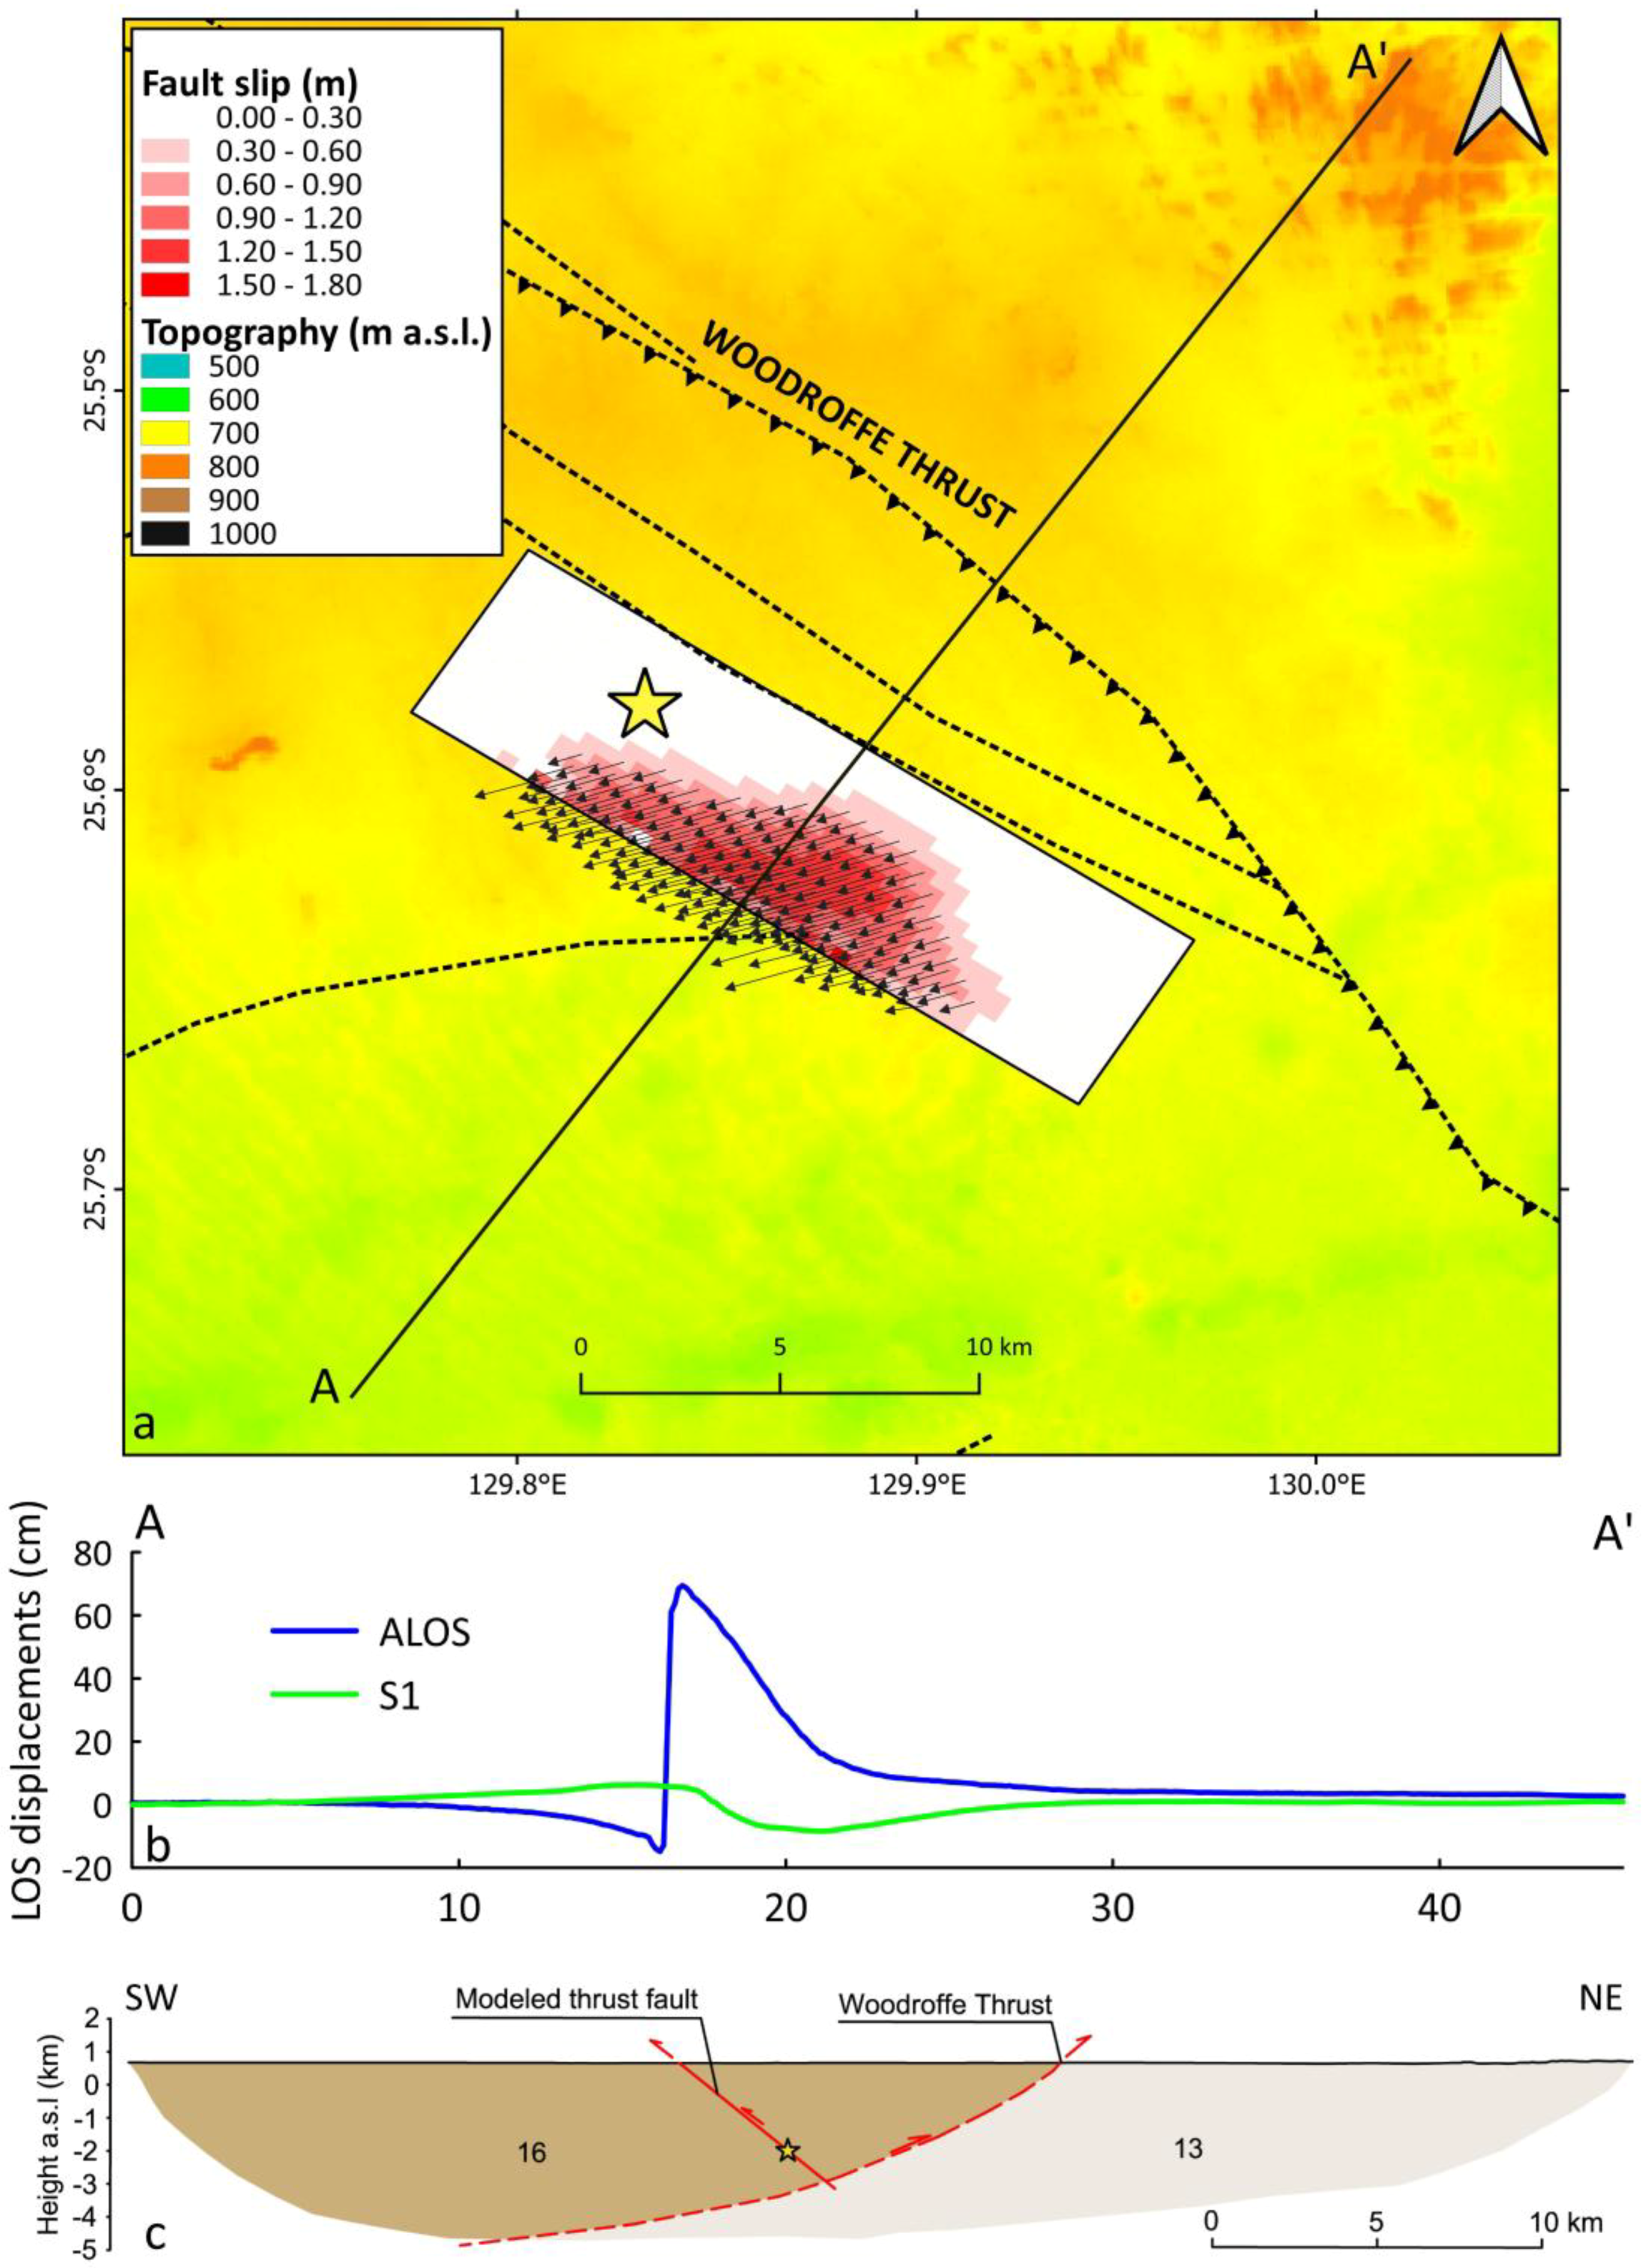
4. Seismic Source Modeling

Source modeling was carried out with a consolidated two-step approach, also implemented in SARscape® (from Sarmap, CH) software, consisting of a non-linear optimization to constrain the fault geometry followed by a linear inversion to retrieve the slip distribution (details about adopted algorithms can be found in [29]). InSAR data were preliminarily sampled over a regular grid (500 m in the fault proximity and 2000 m in the rest of the area, as in Figure 3), exploiting the InSAR spatial correlation to reduce the computation load. Together with the source parameters, we simultaneously assessed possible offsets and ramps affecting the InSAR data. The availability of ascending and descending maps, characterized by a sharp and clear signal, allowed the non-linear optimization of all the source parameters. In addition, we applied a compensation for the topography, accounting for the real depth from the ground surface. The plane resulting from the non-linear inversion was located approximately at 450 m depth (i.e., the depth of the top of the fault plane) and presented a dip of 39°, a strike of 303°, a rake of 49°, and a constant slip of about 1 m over a source of about 11 × 4 km (see Table 1, where the 1-σ uncertainty calculated in Figure S1 is also reported).
The retrieved parameters highlighted a dominant-thrust faulting mechanism with a left-lateral strike-slip component. The uniform-slip fault was then extended and subdivided into patches of 0.5 × 0.5 km to calculate the slip distribution using a linear inversion. The latter was carried out by also considering a Laplacian operator, opportunely weighted, to guarantee a reliable slip gently varying across the fault; further constraints were introduced by imposing non-negative slip values and narrowing the rake variability to only 20° centered on the mean value of 49° obtained via non-linear inversion [30]. The results of the linear inversion are summarized in Figure 4, where the comparison between the observed and modeled data is shown together with the residuals.
The modeled seismic source replicated the InSAR data clearly, given that the observed and modeled deformation pattern was very similar. Residuals of some centimeters were present at the top-left corner of the fault in particular, suggesting the presence of another fault segment with a different strike angle. However, the choice of a single fault model came after carefully considering and modeling the data with a two-segment fault, whose results are shown in Supplementary Material (Figures S3 and S4). Indeed, the improvement due to the introduction of the second source was relatively small compared to the questionable reliability of the solution, which seemed to be inconsistent with a tectonic and only optimal from a mathematical point of view.
The computed slip distribution over the modeled fault plane is shown in Figure 5a, together with the displacement vectors. The retrieved seismic source had a geodetic moment of 1.4 × 10¹⁸ Nm, corresponding to a 6.06 magnitude, very close to the Mw 6.0 estimated by the USGS. Further information and the performance of the retrieved seismic source are reported in the Supplementary Material, where the full variance-covariance analysis of the inverted non-linear parameters was also performed; this analysis revealed the ability of the data to identify the source parameters. Small correlations existed between some parameters (rake vs. depth, slip vs. depth, slip vs. rake) but they did not have a substantial impact on the results because of their small standard deviation (Figure S1).

5. Discussion

The inversion modeling results identified a shallow seismic source responsible for the 20 May 2016 Petermann Ranges earthquake. The retrieved geometry was compatible with a thrust faulting mechanism with a significant strike-slip component (Figure 5a). The solutions available in several earthquake catalogs, such as the Global Centroid Moment Tensor (CMT) or the USGS database, identified a deeper seismic source at about 12 km depth characterized by an almost pure thrusting mechanism. However, other solutions, such as the one provided by the Institut de Physique du Globe de Paris (IPGP) [24] or the alternative solution from body-waves provided by the USGS, showed a shallow source characterized by a depth spanning from 2 km and 6 km and a focal mechanism consistent with the one retrieved in this work. It is worth noting that the depth estimated from moment tensor solutions such as the USGS-preferred solution is affected by strong uncertainties because the nearest available seismic station (i.e., the Tennant Creek, NT) is more than 700 km from the earthquake epicenter [22]. It is well known that a reliable estimate of the earthquake depth can be obtained only when the distance between the earthquake epicenter and the closest seismic station is comparable with the earthquake depth. Therefore, our estimated source depth was undoubtedly more reliable and accurate than moment tensor solutions because it was estimated with near-field coseismic ground deformations. Our solution presented a slip distribution mostly concentrated in the proximity of the ground surface that explained the strong displacement field observed by the InSAR data (especially for the ALOS-2 one) (Figure 5b) and was compatible with the shallow source of earthquakes nucleating in the compressive Australian intraplate environment [31]. Moreover, the shallowness of the retrieved source was also in agreement with the ground ruptures identified over a length of approximately 20 km, trending northwest and exhibiting an apparent north-side-up motion [32].
According to the retrieved fault geometry, the seismic source of the event was not ascribable to the main tectonic structure of the area, that is, the Woodroffe thrust. Indeed, the fault responsible for the 21 May 2016 event was dipping towards northeast, given the associated strike angle of about 303°, whereas the Woodroffe thrust gently dipped south. In particular, in the area affected by the seismic event, the Woodroffe Thrust was southwest-dipping, as highlighted in Figure 5c. Therefore, the obtained results showed that the Mwp 6.1 Petermann Ranges earthquake was caused by the dislocation of a previously unmapped secondary back-thrust (Figure 5c). These findings were consistent with the compressive stress field produced in Australia by the relative movements between plates. Indeed, the Indo-Australian plate was moving northward and colliding with the Pacific plate in the east and the Eurasian plate to the north, thus resulting in compressive stresses inside the plate itself [33]. Such tectonic settings are the reason most of the earthquakes in the country nucleated along reverse faults [34].

6. Conclusions

We investigated the 2016 Mwp 6.1 Petermann Ranges earthquake through C- and L-band InSAR data to find the causative fault of the seismic event. The retrieved source model revealed a shallow seismic source approximately northwest–southeast-oriented and characterized by a thrust, northeast-dipping faulting mechanism with a left-lateral strike-slip component. Therefore, the Petermann Ranges event was most likely nucleated along a secondary back-thrust because the primary structure of the area, that is, the Woodroffe thrust was characterized by a southwest-dipping faulting mechanism. The analysis of intraplate earthquakes is essential to improve our knowledge of the earth and helps to mitigate the seismic hazard in regions unprepared for and not used to the occurrence of seismic events. Indeed, these phenomena are still not well understood, making the evaluation of the associated hazards difficult.

Supplementary Materials

The following are available online at https://www.mdpi.com/2072-4292/10/8/1311/s1, Figure S1: Fault parameter uncertainties and trade-offs for the seismic source model of the 2016 Petermann Ranges earthquake retrieved by C- and L-band InSAR data. Histograms show the a posteriori probability distribution of fault parameters, and scatterplots show trade-offs between parameters. Details on the estimation of these parameters can be found in Atzori et al., 2009. Figure S2: Focal Mechanism of the 21 May 2016 Petermann Ranges event retrieved by the InSAR data inversion. Figure S3: Results of InSAR data linear inversion obtained by adding a second fault segment: Sentinel-1 observed (a), Modelled (c) and Residuals (e); ALOS-2 Observed (b), Modelled (d) and Residuals (f). Table S1: Parameters of the second fault segment. Figure S4: 3D Sketch of the seismic source retrieved by using two fault segments and relative fit between data and model.

Author Contributions

Conceptualization, M.P. and M.A.; Investigation, M.P., M.A. and S.A.; Methodology, M.P. and S.A.; Software, S.A. and C.B.; Supervision, S.S.; Writing—original draft, M.P. and S.A.; Writing—review and editing, M.A., C.B. and S.S.

Funding

This research received no external funding.

Acknowledgments

The authors thank the European Space Agency (ESA) and the Japan Aerospace Exploration Agency (JAXA) for providing the C-band Sentinel-1 and the L-band ALOS-2 SAR data respectively.

Conflicts of Interest

The authors declare no conflict of interest.

References

  1. Vine, F.J. Spreading of the ocean floor: New evidence. Science 1966, 154, 1405–1415. [Google Scholar] [CrossRef] [PubMed]
  2. Cox, A.; Hart, R.B. Plate Tectonics: How It Works; Wiley-Blackwell Scientific Publications: Hoboken, NJ, USA, 1986; ISBN 978-1-444-31421-2. [Google Scholar]
  3. Kious, W.J.; Tilling, R.I. This Dynamic Earth: The Story of Plate Tectonics; U.S. Geological Survey: Reston, VA, USA, 1996; ISBN 0-16-048220-8.
  4. Bolt, B. Earthquakes: 2006 Centennial Update—The 1906 Big One; W.H. Freeman and Company: New York, HY, USA, 2005; ISBN 9780716775485. [Google Scholar]
  5. The Global Seismic Hazard Map Online—A Service of the GFZ Helmoltz Centre Potsdam. Available online: http://gmo.gfz-potsdam.de/ (accessed on 8 January 2018).
  6. Tuttle, P.; Schweig, E.; Sims, J.; Lafferty, R.; Wolf, L.; Haynes, M. The Earthquake Potential of the New Madrid Seismic Zone. Bull. Seismol. Soc. Am. 2002, 92, 2080–2089. [Google Scholar] [CrossRef]
  7. Bakun, W.; Hopper, M. Magnitudes and Locations of the 1811–1812 New Madrid, Missouri, and the 1886 Charleston, South Carolina, Earthquakes. Bull. Seismol. Soc. Am. 2004, 94, 64–75. [Google Scholar] [CrossRef]
  8. Saito, K.; Spence, R.; Going, C.; Markus, M. Using High-Resolution Satellite Images for Post-Earthquake Building Damage Assessment: A Study Following the 26 January 2001 Gujarat Earthquake. Earthq. Spectra 2004, 20, 145–169. [Google Scholar] [CrossRef]
  9. Yadav, R.K.; Kundu, B.; Gahalaut, K.; Catherine, J.; Gahalaut, V.; Ambikapthy, A.; Naidu, M. Coseismic offsets due to the 11 April 2012 Indian Ocean earthquakes (Mw 8.6 and 8.2) derived from GPS measurements. Geophys. Res. Lett. 2013, 40, 3389–3393. [Google Scholar] [CrossRef]
  10. Albano, M.; Polcari, M.; Bignami, C.; Moro, M.; Saroli, M.; Stramondo, S. Did anthropogenic activities trigger the 3 April 2017, Mw 6.5 Botswana earthquake? Remote Sens. 2017, 9, 1028. [Google Scholar] [CrossRef]
  11. Fielding, E.; Sangha, S.; Bekaert, D.; Samsonov, S.; Chang, J. Surface Deformation of North-Central Oklahoma Related to the 2016 Mw 5.8 Pawnee Earthquake from SAR Interferometry Time Series. Seismol. Res. Lett. 2017, 88, 971–982. [Google Scholar] [CrossRef]
  12. Roy, N.; Shah, H.; Patel, V.; Coughlin, R. The Gujarat Earthquake (2001) Experience in a Seismically Unprepared Area: Community Hospital Medical Response. Prehosp. Disaster Med. 2002, 17, 186–195. [Google Scholar] [CrossRef] [PubMed]
  13. Geoscience Australia. Available online: http://www.ga.gov.au/earthquakes/home.do (accessed on 11 January 2018).
  14. Massonet, D.; Rossi, M.; Carmona, C.; Adragna, F.; Peltzer, G.; Feigl, K.; Rabaute, T. The displacement field of the Landers earthquake mapped by radar interferometry. Nature 1993, 364, 138–142. [Google Scholar] [CrossRef]
  15. USGS Earthquake Hazards Program. Available online: https://earthquake.usgs.gov/earthquakes/eventpage/us10005iyk#scientific (accessed on 8 January 2018).
  16. Brown, A.; Gibson, G. A multi-tiered earthquake hazard model for Australia. Tectonophysics 2004, 390, 25–43. [Google Scholar] [CrossRef]
  17. Burbidge, D.; Leonard, M.; Allen, T.; Collins, C.; Volti, T. The 2012 National Earthquake Hazard Map of Australia. In Proceedings of the Australian Earthquake Engineering Society 2012 Conference, Quenslands, Australia, 7–9 December 2012. [Google Scholar]
  18. Wade, B.P.; Kelsey, D.E.; Hand, M.; Barovich, K.M. The Musgrave Province: Stitching north, west and south Australia. Precambr. Res. 2008, 166, 370–386. [Google Scholar] [CrossRef]
  19. Howard, H.M.; Smithies, R.H.; Kirkland, C.L.; Kelsey, D.E.; Aitken, A.; Wingate, M.T.D.; Maier, W.D. The burning heart—The Proterozoic geology and geological evolution of the west Musgrave Region, central Australia. Gondwana Res. 2015, 27, 64–94. [Google Scholar] [CrossRef]
  20. Sandiford, M.; Hand, M. Controls on the locus of intraplate deformation in central Australia. Earth Planet. Sci. Lett. 1998, 162, 97–110. [Google Scholar] [CrossRef]
  21. Hand, M.; Sandiford, M. Intraplate deformation in central Australia, the link between subsidence and fault reactivation. Tectonophysics 1999, 305, 121–140. [Google Scholar] [CrossRef]
  22. IRIS—Incorporated Research Institutions for Seismology. Available online: http://ds.iris.edu/wilber3/ (accessed on 10 January 2018).
  23. Forman, D.J. Petermann Ranges, Northern Territory: Sheet SG/52-7 International Index; Australian Government Publishing Service for the Bureau of Mineral Resources, Geology and Geophysics: Canberra, Australia, 1972; ISBN 0642946604.
  24. Institut de Physique du Globe de Paris. Available online: http://geoscope.ipgp.fr/index.php/en/catalog/earthquake-description?seis=us10005iyk (accessed on 8 January 2018).
  25. Wegmuller, U.; Werner, C. Gamma SAR processor and interferometry software. In Proceedings of the ERS Symposium on Space at the Service of Our Environment, Florence, Italy, 14–21 March 1997; ESA Publications Division: Florence, Italy, 1997; pp. 1687–1692. [Google Scholar]
  26. Wegmüller, U.; Werner, C.; Strozzi, T.; Wiesmann, A.; Frey, O.; Santoro, M. Sentinel-1 Support in the GAMMA Software. Procedia Comput. Sci. 2016, 100, 1305–1312. [Google Scholar] [CrossRef]
  27. Goldstein, R.; Werner, C. Radar interferogram filtering for geophysical applications. Geophys. Res. Lett. 1998, 25, 4035–4038. [Google Scholar] [CrossRef] [Green Version]
  28. Costantini, M. A novel phase unwrapping method based on network programming. IEEE Trans. Geosci. Remote Sens. 1998, 36, 813–821. [Google Scholar] [CrossRef]
  29. Atzori, S.; Hunstad, I.; Chini, M.; Salvi, S.; Tolomei, C.; Bignami, C.; Stramondo, S.; Trasatti, E.; Antonioli, A.; Boschi, E. Finite fault inversion of DInSAR coseismic displacement of the 2009 ’Aquila earthquake (Central Italy). Geophys. Res. Lett. 2009, 36, L15305. [Google Scholar] [CrossRef]
  30. Menke, W. Geophysical Data Analysis: Discrete Inverse Theory (First Edition); Academic Press, Inc.: New York, NY, USA, 1984; ISBN 9780080507323. [Google Scholar]
  31. Dawson, J.; Cummins, P.; Tregoning, P.; Leonard, M. Shallow intraplate earthquakes in Western Australia observed by Interferometric Synthetic Aperture Radar. J. Geophys. Res. 2008, 113, 1–19. [Google Scholar] [CrossRef]
  32. Geoscience Australia. Available online: http://www.earthquakegeology.com/materials/other_materials/menlo_park_docs/04-Clark_FDHA_intraplate_Australia.pdf (accessed on 23 February 2018).
  33. Veevers, J.J. Billion Year Earth History of Australia and Neighbours in Gondwanaland; GEMOC Press: Sydney, Australia, 2000; ISBN 1876315040. [Google Scholar]
  34. Allen, T.; Gibson, G.; Brown, A.; Cull, J. Depth variation of seismic source scaling relations: Implications for earthquake hazard in southeastern Australia. Tectonophysics 2004, 390, 5–24. [Google Scholar] [CrossRef]
Figure 1. Focus on the area affected by the 2016 Mwp 6.1 Petermann Ranges earthquake. The red star represents the epicenter of the seismic event with the United States Geological Survey (USGS) focal mechanism [15]. The black lines indicate the plate boundaries. The light blue circles indicate the Mw > 5.5 earthquakes which occurred worldwide in 2016–2017, whereas the orange circles indicate the Mw ≥ 4.5 seismic event that hit Australia starting from 1950. The Peak Ground Acceleration is retrieved by the Global Seismic Hazard Assessment Program [5].
Remotesensing 10 01311 g001
Figure 2. Simplified geological and tectonic map of the earthquake area (modified from [23]) with the earthquakes recorded in 1955–2016 [13]. The yellow star indicates the 21 May, Mwp 6.1 earthquake. The dashed black square indicates the study area and the detailed map of Figure 5. The plotted focal mechanisms are from (a) USGS [15] and (b) the Institut de Physique du Globe de Paris (IPGP) [24]. The inset shows the GPS velocity field retrieved by Geoscience Australia.
Remotesensing 10 01311 g002
Figure 3. Wrapped interferograms (a,b) and displacement maps (c,d) due to the Mwp 6.1 2016 Petermann Ranges earthquake retrieved by Sentinel-1 descending (a,c) and ALOS-2 ascending (b,d) InSAR data. In Sentinel-1 wrapped interferogram (a), each interferometric fringe corresponds to a Line-of-Sight (LoS) displacement of ~2.83 cm, whereas in ALOS-2 wrapped interferogram (b), one phase color cycle is ~12 cm of LoS displacement. Positive LoS displacement means a ground movement toward the satellite; conversely, a negative LoS displacement indicates a movement away from the satellite. The yellow star represents the epicenter of the seismic event.
Remotesensing 10 01311 g003
Figure 4. Results of InSAR data linear inversion: Sentinel-1 observed (a), Modelled (c) and Residuals (e); ALOS-2 Observed (b), Modelled (d) and Residuals (f). The black rectangle indicates the causative fault retrieved by the linear source modeling.
Remotesensing 10 01311 g004
Figure 5. (a) Detail of the study area, showing the geometry of the modeled fault after the linear inversion of InSAR data. The color bar indicates the fault slip magnitude, whereas the black vectors indicate the slip vector direction, that is, the rake. The yellow star indicates the 21 May 2017 earthquake epicenter. The black dashed lines identify the main faults of the area (for the legend see Figure 2). (b) InSAR displacement profiles along the A-A’ trace in panel (a). (c) The simplified geological cross section along the A-A’ trace in panel (a) (modified from Reference [23]), showing the modeled thrust fault and its relationship with the main structure of the area, the Woodroffe thrust. The lithology numbers refer to the legend of Figure 2. The location at a depth of the 21 May 2016 event, that is, 2 km (the yellow star), corresponds to the depth inferred from the USGS body-wave Moment Tensor solution [15].
Remotesensing 10 01311 g005
Table 1. Seismic source best-fit parameters, with 1-σ uncertainty, retrieved by the non-linear inversion modeling.
ParameterBest-Fit
Length (m)11,085.5 (σ 85)
Down-dip width (m)4024.2 (σ 140)
Depth (m)−449 (σ 30)
Dip (deg)39.08 (σ 2.5)
Strike (deg)303.41 (σ 0.1)
East (m)586,891.1 (σ 57)
North (m)7,166,353.3 (σ 95)
Rake (deg)48.68 (σ 3.1)
Slip (m)1.037 (σ 0.05)

