Article

An Improved Digital Elevation Model of the Lunar Mons Rümker Region Based on Multisource Altimeter Data

1
Chinese Antarctic Center of Surveying and Mapping, Wuhan University, 129 Luoyu Road, Wuhan 430079, China
2
State Key Laboratory of Information Engineering in Surveying, Mapping and Remote Sensing, Wuhan University, 129 Luoyu Road, Wuhan 430079, China
3
Observatoire Géodésique de Tahiti, University of French Polynesia, BP 6570, 98702 Faa’a, Tahiti, French Polynesia
4
School of Urban Design, Wuhan University, 129 Luoyu Road, Wuhan 430079, China
5
Electronic Information School, Wuhan University, 129 Luoyu Road, Wuhan 430079, China
*
Authors to whom correspondence should be addressed.
Remote Sens. 2018, 10(9), 1442; https://doi.org/10.3390/rs10091442
Submission received: 4 July 2018 / Revised: 29 August 2018 / Accepted: 7 September 2018 / Published: 10 September 2018
(This article belongs to the Special Issue Advances in Satellite Altimetry and Its Application)

Abstract

:
Mons Rümker is the primary candidate region for the lunar landing mission of Chang’E-5. We propose a data processing method that combines multisource altimeter data and we developed an improved digital elevation model (DEM) of the Mons Rümker region with a horizontal resolution of 256 pixels per degree. The lunar orbiter laser altimeter (LOLA) onboard the lunar reconnaissance orbiter (LRO) acquired 884 valid orbital benchmark data with a high precision. A special crossover adjustment of 156 orbital profiles from the Chang’E-1 laser altimeter (LAM) and 149 orbital profiles from the SELenological and ENgineering Explorer (SELENE) laser altimeter (LALT) was applied. The radial residual root mean square (RMS) of the LAM was reduced from 154.83 ± 43.60 m to 14.29 ± 27.84 m and that of the LALT was decreased from 3.50 ± 5.0 m to 2.75 ± 4.4 m. We used the adjusted LAM and LALT data to fill the LOLA gaps and created the merged LOLA + LAM and LOLA + LALT DEMs. The merged LOLA + LAM DEM showed distortions because of the horizontal geolocation errors in the LAM data. The merged LOLA + LALT DEM was closer to the ground truth than the LOLA-only DEM when validated with the images of the LRO camera (LROC).

Graphical Abstract

1. Introduction

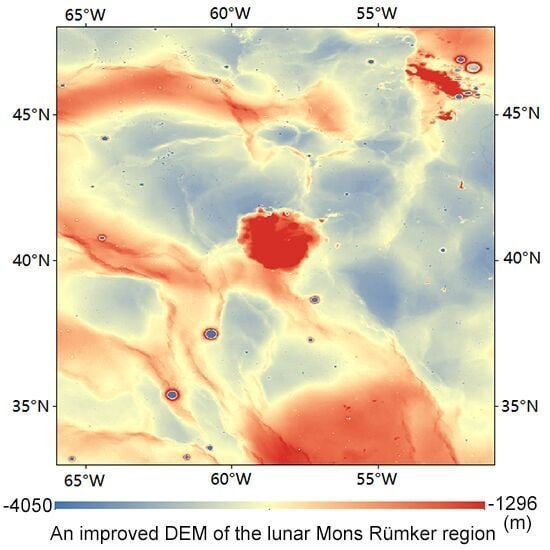
The Mons Rümker region is centered at 301.9°E, 40.7°N and is comprised of a plateau with an area of ~4000 km2. Mons Rümker is the primary candidate for the landing region of the Chang’E-5 lunar sample return mission and an accurate digital elevation model (DEM) is indispensable for selecting and assessing the landing site [1,2]. First, an accurate DEM improves our knowledge of the lunar surface, aids in the identification and characterization of the topography, and helps us to understand the impact history by evaluating the relative ages of the geological units [3,4]. In addition, illumination and communication maps can be simulated based on a DEM for optimizing the potential lunar landing sites [5,6].
Laser altimeters are commonly used to map the lunar topography. The Apollo 15 to Apollo 17 missions provided preliminary laser altimeter data for creating maps of the lunar topography [7]. Subsequently, the laser ranging instrument onboard the Clementine mission obtained lidar data, which were used to produce a global topographic model with a spatial resolution of 0.25° [8]. Over the last ten years, the knowledge of lunar topography has greatly improved because of the SELenological and ENgineering Explorer (SELENE) mission, the Chang’E-1 (CE-1) mission, and the lunar reconnaissance orbiter (LRO), all of which carried laser altimeters [9,10,11]; thus, new global lunar DEMs have been produced with a variety of resolutions and accuracies.
The SELENE spacecraft was launched in 2007 and carried onboard a laser altimeter (LALT hereafter for SELENE laser altimeter). The LALT has a radial uncertainty of 4 m and a horizontal uncertainty of 77 m, deriving a global DEM with a spatial resolution of 0.625° [12]. The CE-1 spacecraft was also launched in 2007 and carried a laser altimeter (LAM hereafter for the CE-1 laser altimeter). Ping et al. [13] processed the initial 3 million LAM points and produced the CE-1 lunar topographic model s01 (CLTM-s01), with a radial uncertainty of 31 m. Li et al. [14] used 9.12 million LAM points to construct a global DEM with a spatial resolution of 3 km, a plane-positioning accuracy of 445 m (1σ), and a vertical accuracy of 60 m (1σ). The LRO was launched in 2009 and the lunar orbiter laser altimeter (LOLA) onboard the LRO has a vertical accuracy of 1 m. The mode of multi-beams and high frequency and improved satellite orbit accuracy of the LRO increase the resolution and precision of the LOLA data compared to previous lunar missions [15,16]. Thus, global DEMs at high resolutions and the most accurate polar DEMs were constructed using the LOLA data [11].
All laser altimeters collect the altitude of the points of the lunar surface and the points are then used to construct the DEM using an interpolation method. Therefore, the accuracy of the pixels of the constructed DEM varies and is determined by the distance from the points of the grid to the measured points and the lunar topographic relief. Furthermore, LOLA cannot reliably measure laser returns at ranges >120 km. The altimeter data are exclusively concentrated in the Southern Hemisphere when the LRO was placed in an elliptical polar orbit. The coverage of the data restricts the resolution of the constructed DEM. To solve this problem, Barker et al. [17] used a five-parameter coordinate transformation and a bounded downhill simplex minimization algorithm to register the stereo-derived DEMs (each 1° × 1°) from the SELENE terrain camera (TC) to the LOLA points, thereby obtaining a LOLA + TC merged DEM (SLDEM2015) that covered the latitudes of ±60°. A comparison of the SLDEM2015 and the LOLA DEM indicates the existence of bands with a width of one or two pixels in the SLDEM2015. We believe that the residual errors of the stereo-derived DEMs are responsible for these bands when merging the LOLA points and the stereo-derived DEMs.
Mons Rümker is located in the mid-latitude region of the northern hemisphere and there is little LOLA data coverage in the Mons Rümker region. Merging multisource altimeter data is a direct approach to improve the DEM coverage. In addition, an improvement in the data coverage also provides a better constraint for the study of Barker et al. [17].
The precision discrepancy is the main issue when merging multisource altimeter data. A crossover adjustment is used to model the error and improve the orbit determination to yield more precise DEMs [18,19]. We used the LOLA data as a benchmark and designed a special crossover adjustment to reduce the radial error in the LALT and LAM data. We evaluated the LOLA data using a grid of 1/256° resolution to find the gaps in the LOLA measurement points. If the points in the LAM and LALT data were located in pixels with a sufficient number of LOLA points (>3), then these points were used as crossovers. We used the LOLA data to interpolate the elevation at these points, calculated the residuals, and derived a one-parameter model to fit the systematic error in the LAM and LALT data. The adjusted LAM and LALT data were combined with the LOLA data in order to develop an improved DEM.
In Section 2, we provide the details of the datasets used in this study. In Section 3, we discuss the methods of noise elimination and special crossover adjustment. In Section 4, we describe the valid data distribution and results of the crossover adjustment. In 
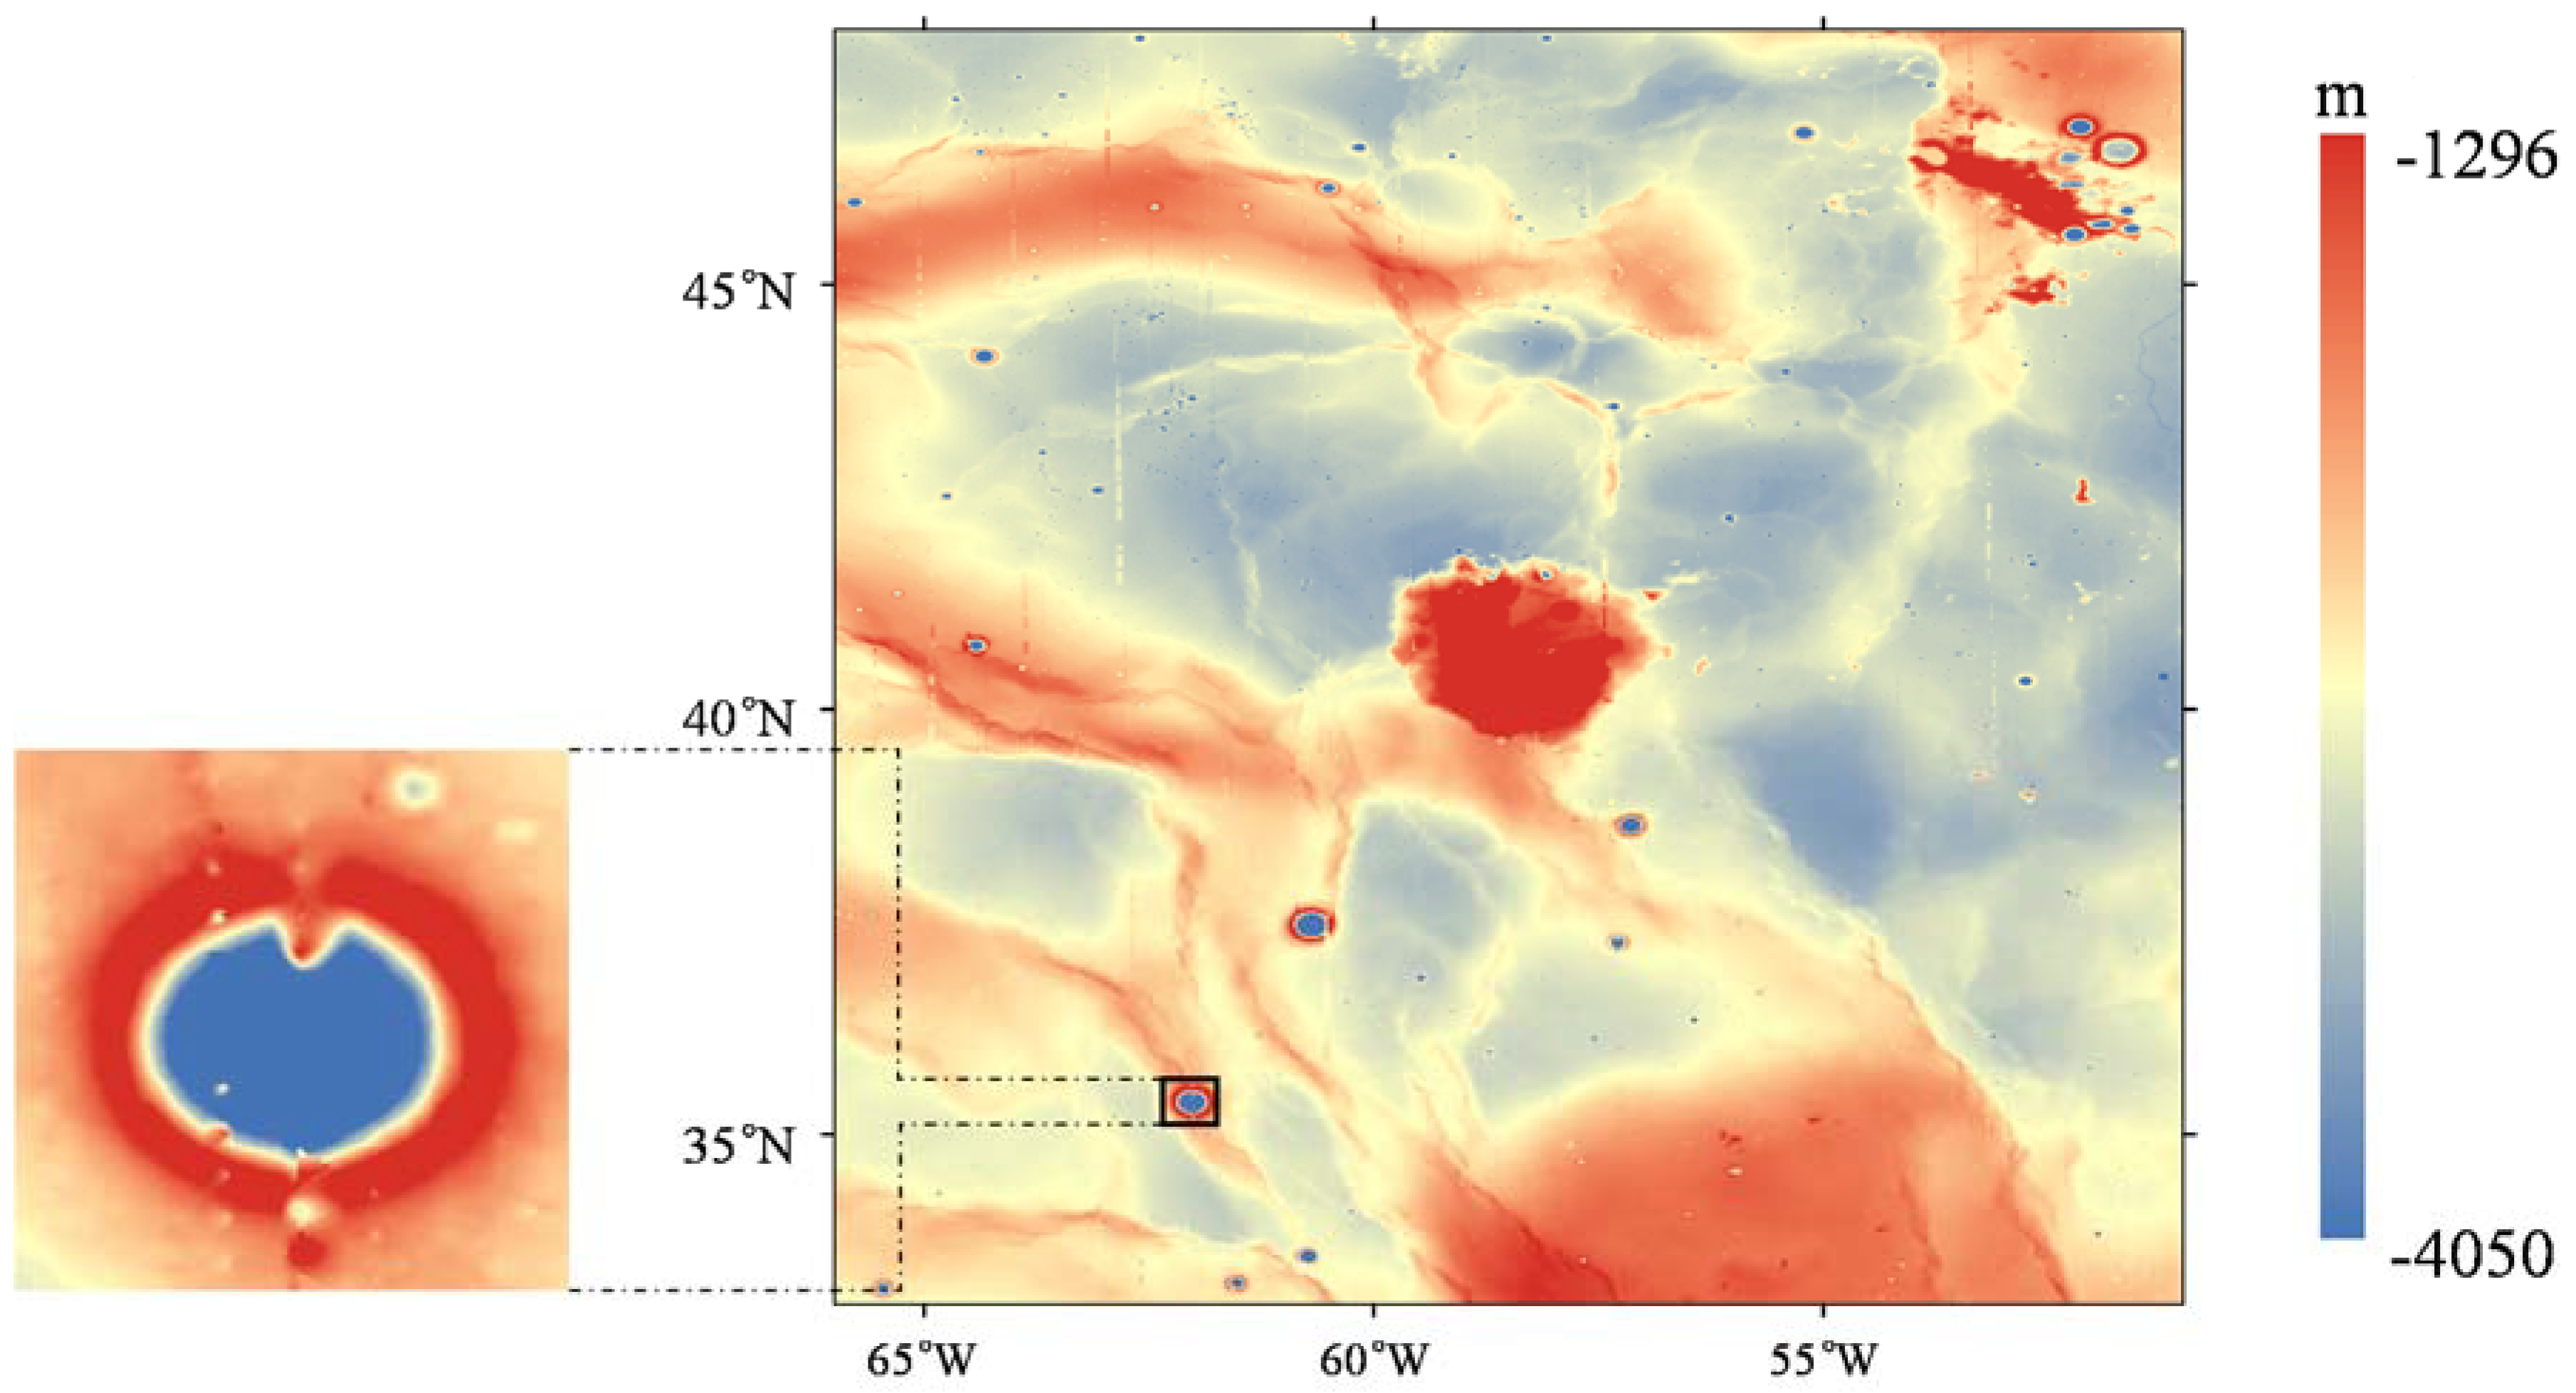
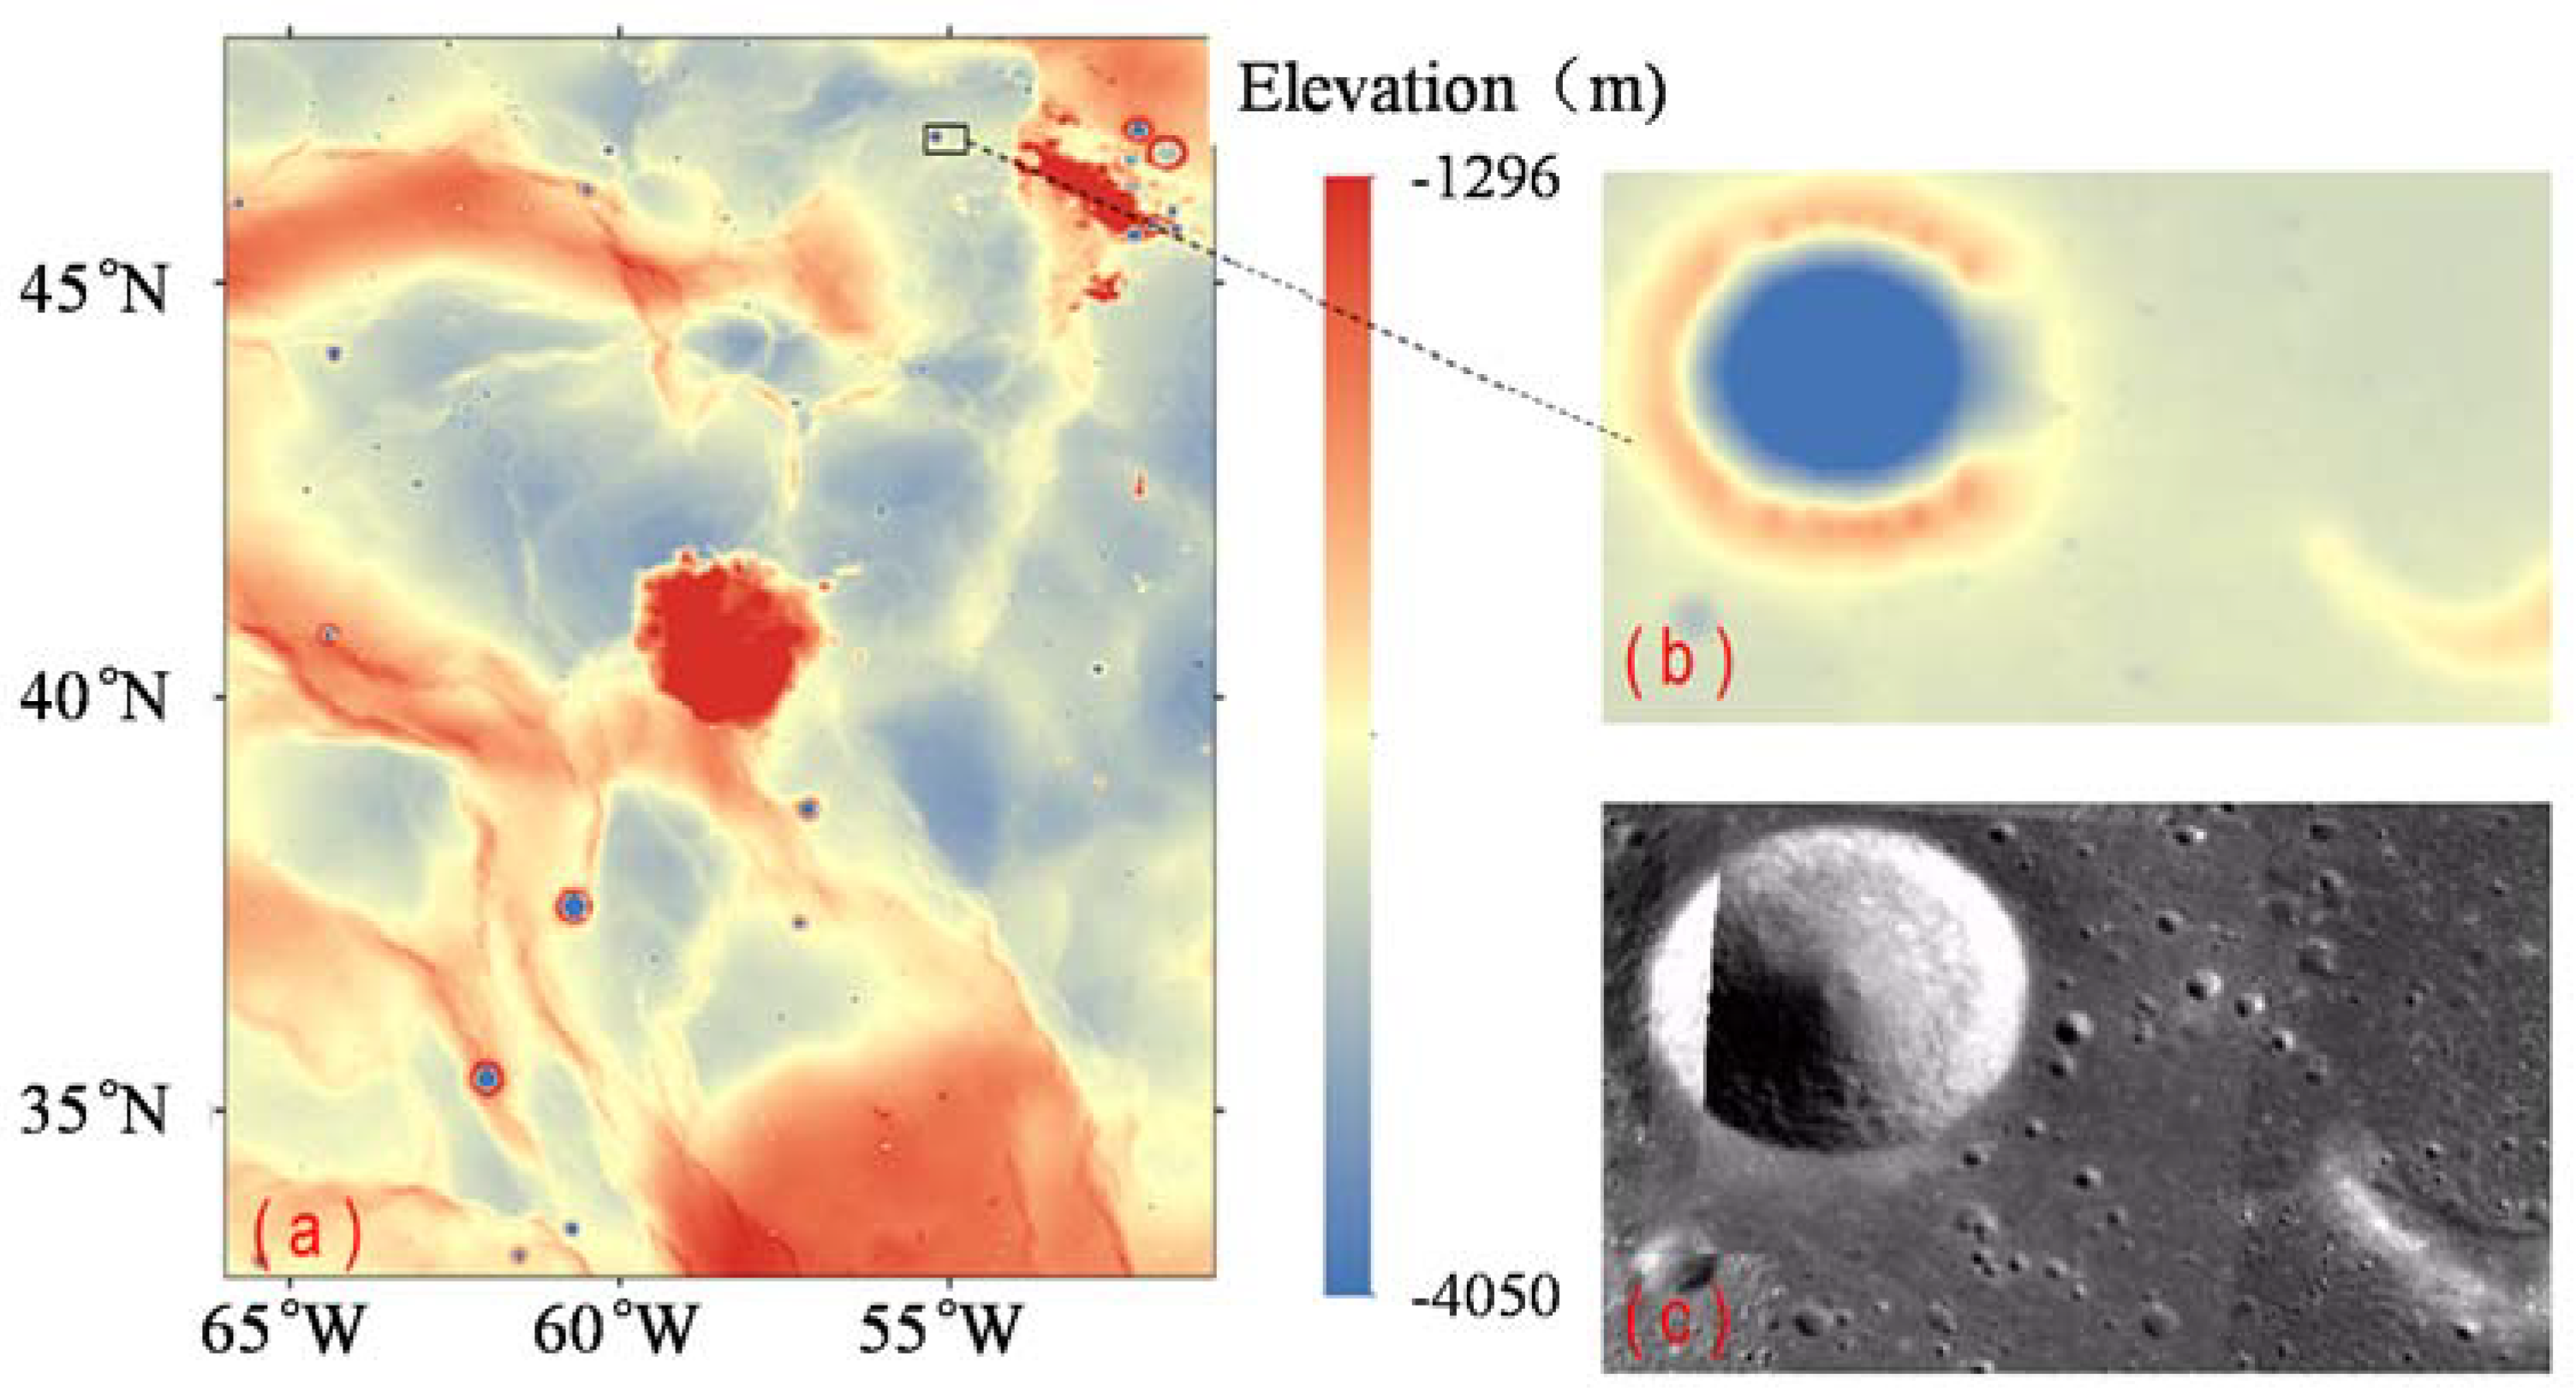
Section 5, we discuss the merged DEMs and SLDEM2015. Finally, the conclusions and future research directions are provided. It is noted that when we consider the use of the DEM, i.e., the simulation of communication and illumination conditions based on the DEM, impact of the surrounding terrain need to be taken into account. We expanded the scope of the calculation and chose the Mons Rümker and its surrounding area as the study area (33°N~48°N, 51°W~66°W).

2. Data

2.1. LOLA Data

The LRO entered the lunar orbit on 27 June 2009 and was placed in a ~30 × 200-km near-polar orbit with a periapsis near the South Pole. Three months later, on 27 September, the spacecraft moved into a near-circular 50-km orbit for a one-year normal mapping mission. On 11 December 2011, the spacecraft was placed back into a quasi-stable elliptical orbit similar to the commissioning orbit to save fuel and extend its lifetime [20].
The LOLA is a multi-beam laser altimeter onboard the LRO and operates at 28 Hz. A single laser beam is split by a diffractive optical element into five output beams, each of which has a divergence of 100 mrad and illuminates a 5-m diameter spot from an elevation of 50 km in the normal LRO mission. The along-track shot spacing of LOLA are about 50 m. The LOLA sampling strategy produces five parallel profiles along the LRO ground track [21]. The LOLA Science Team processed the raw data and produced publicly available data sets (http://pds-geosciences.wustl.edu/).
The LOLA reduced data records (RDR) were used in this study. The RDR comprise time-of-flight ranges to the lunar surface and ancillary data in the geodetic coordinate frame around the center of the lunar mass. After range calibration and orbital processing, the range to each laser spot was located on the surface using the spacecraft trajectory, attitude history, and lunar orientation model. The range profiles were organized into an RDR product containing calibrated, geo-located pulse returns, radii, and energies. The RDR data are divided into serial orbits with increasing numbers at each ascending equator crossing.
The LOLA cannot reliably measure laser returns at ranges larger than 120 km and the altimeter data are exclusively concentrated in the Southern Hemisphere in the elliptical orbit [22]. Therefore, the period for the data used in this study was from September 2009 to December 2011, covering the entire mapping phase and the first 15 months of the LRO science phase. There were 884 orbits of data collected in the target region.

2.2. LALT Data

The Japanese lunar explorer Kaguya (SELENE) mission to the Moon was launched on 14 September 2007 and entered an elliptical lunar orbit on 4 October 2007. After orbital maneuvers, SELENE reached its nominal 100 km circular orbit on 19 October 2007. The mission ended on 10 June 2009 and the spacecraft was destroyed in a controlled collision onto the lunar surface [23].
The LALT onboard the SELENE was designed to measure distances to the lunar surface from an altitude of 100 km. The LALT operated at 1 Hz. The beam divergence was 0.4 mrad, resulting in a laser spot size on the lunar surface of typically 40 m from the orbiter altitude of 100 km. The along-track shot spacing of LALT are about 1.4 km [12]. The SELENE operation and data analysis center (SOAC) processed the raw LALT data from 30 December 2007 to 27 October 2008 and produced publicly available datasets (http://darts.isas.jaxa.jp/pub/pds3/).
The LALT lunar global topographic data as a time series (LALT_LGT_TS) was used in this study. For the calculations, the SPICE toolkit software developed by the Navigation and Ancillary Information Facility was used to obtain the time series of the data based on the LALT range data, the main orbiter’s position/attitude data, and the ephemeris DE421. The time stamp is in UTC (transmit time). The reference surface is a sphere with a radius of 1737.4 km and its center is the gravity center. There are 149 orbital LALT_LGT_TS profiles in the target region.

2.3. LAM Data

The CE-1 mission was launched on 24 October 2007 and served as a prelude to China’s deep space exploration program. CE-1 entered the lunar orbit on 5 November 2007, remained in orbit for 494 days, and successfully completed a controlled landing on the Moon on 1 March 2009 [9].
LAM was one of the main payloads onboard the CE-1 and was designed to measure the topography of the lunar surface from the normal altitude of 200 km. The LAM operated at 1 Hz and illuminated a 200-m diameter spot from an elevation of 200 km. The along-track shot spacing of LAM are about 1.4 km [14]. The National Astronomical Observatories of the Chinese Academy of Sciences processed the raw LALT data and produced publicly available datasets (http://moon.bao.ac.cn/).
The time series of the LAM level_2B data comprise the geo-located longitude and latitude, the range to the mass center, and the quality status at each laser spot. We calculated the altitude of a reference sphere surface with a radius of 1737.4 km similar to the LOLA and LALT data. There are 156 orbital LAM level_2B profiles in the target region, collected from 27 November 2007 to 4 January 2009. The orbital accuracy of Chang’E-1 is far worse than that of SELENE or LRO. The former is about 200 m, and the latter are about 50 m and 20 m, respectively. In addition, the temperature, voltage, and drift due to aging of the oven-controlled crystal oscillator make the LAM frequency during the mission far different from the standard frequency [24].

2.4. Data Analysis

The number of tracks of LOLA, LAM and LALT are 884, 156, and 149, respectively, which suggests that the sum of tracks of LAM and LALT is about one third of that of LOLA. Therefore, combining the LOLA with LAM and LALT is indispensable to assemble a new DEM. In fact, the points of LALT and LAM exist near LOLA points or even coincide with LOLA points. Moreover, we think that the contribution of LAM and LALT to the LOLA-only DEM is due to the sampling frequency. LOLA has 19 million points and its multi-beam mode makes the distribution more concentrated. The sampling frequency of LALT and LAM is only 1/28 of that of LOLA. Only a small number of points of LALT and LAM can complement LOLA pixels with data gaps. From another point of view, the distance between each point of the LALT and LAM is about 1.4 km. These points are evenly distributed along the track, which represent the elevation values in different locations. These points can be used to supplement the blank pixels of LOLA-only DEM, which can better describe the relief features and changes of the terrain located far away from the more concentrated points.

3. Methods

3.1. Noise Elimination

Noise is randomly encountered in the signal returning to the receiver during laser altimeter sampling due to the instability of the satellite and other factors. The noise points are irregular and need to be eliminated before creating a DEM. The maximum and minimum elevation of the lunar surface is within the elevations >−10 km or <11 km [11]. We regarded the points for which elevations were beyond this range as outliers, and they were eliminated. Noise points with elevations within this range were handled by a long-track mean filtering and by comparing the elevation of each point h i with the mean elevation h a ¯   and h b ¯ (Equation (1)) of several points around the given point (Equation (3)). The threshold of the filtering was the standard deviation of several points around the given point (Equation (2)) or simply a constant [25,26].
h ¯ a = j = i n i 1 h j n , h ¯ b = j = i + 1 i + n h j n
σ a = j = i n i 1 ( h j h ¯ a ) 2 n 1 ,   σ b = j = i + 1 i + n ( h j h ¯ b ) 2 n 1
| h i h ¯ a | < N σ a , | h i h ¯ b | < N σ b
If an elevation hi did not satisfy Equation (3), then that point was considered as noise and was eliminated. We used n = 4 in the mountainous areas and n = 2 in the maria [25].
Along-track mean filtering is flawed because the points at small bumps or depressions in local flat areas are eliminated. To overcome the limitation of a long-track mean filtering, a filtering method based on cluster analysis was used. We obtained h a ¯ and h b ¯ of 5 points around the given point, and calculated the residual | h i h a ¯ |   and   | h i h b ¯ | at each point. Then, we performed a cluster analysis using the residuals, and classified them into noise and normal points.
A k-means clustering was used because it is an appropriate clustering method, in which the classification is performed manually and initial cluster centers are generated randomly [27]. The classification is performed by calculating and comparing the Euclidean distances to the cluster centers. The geometric centers of each class are used as the next clustering center to classify again until the collections no longer change. Two classes were used: one class comprised the noise points to be eliminated and the other comprised the normal points.
Noise points cannot be eliminated by a combined filtering and cluster analysis method completely at one time. Because the noise points with small errors are included in the normal class, we calculated the residuals by filtering and clustering again until the points no longer had large errors. This process is repeated and does not stop until all noise points are eliminated, however, the number of noise points is unknown and relative. Instead, the number of eliminated points suddenly increases during processing, suggesting that normal points with steep slopes have been wrongly eliminated. At this time, the program stops and uses the normal points obtained in the last step as the result. The normal size of a LOLA profile was about 8000 points, and the average number of eliminated points was about 50. We typically carried out filtering and clustering about 5 or 6 times. At the final time, the number of eliminated points suddenly increased to about 300 to 600 for a majority of profiles, and at this point our program stopped and retained those points. The LALT data are a filtered dataset, and LAM used the above method to remove approximately 15 noise points from every track (about 330 points).

3.2. Crossover Adjustment

Crossover adjustment aims to combine the multisource altimeter data by improving the radial precision of the LAM and LALT data. Treating the LOLA data as a benchmark, a new crossover adjustment method is proposed based on the LOLA multi-beam pattern. We used a grid with a resolution of 256 pixels per degree to count the LOLA points. The data gap and distribution are confirmed using this grid.
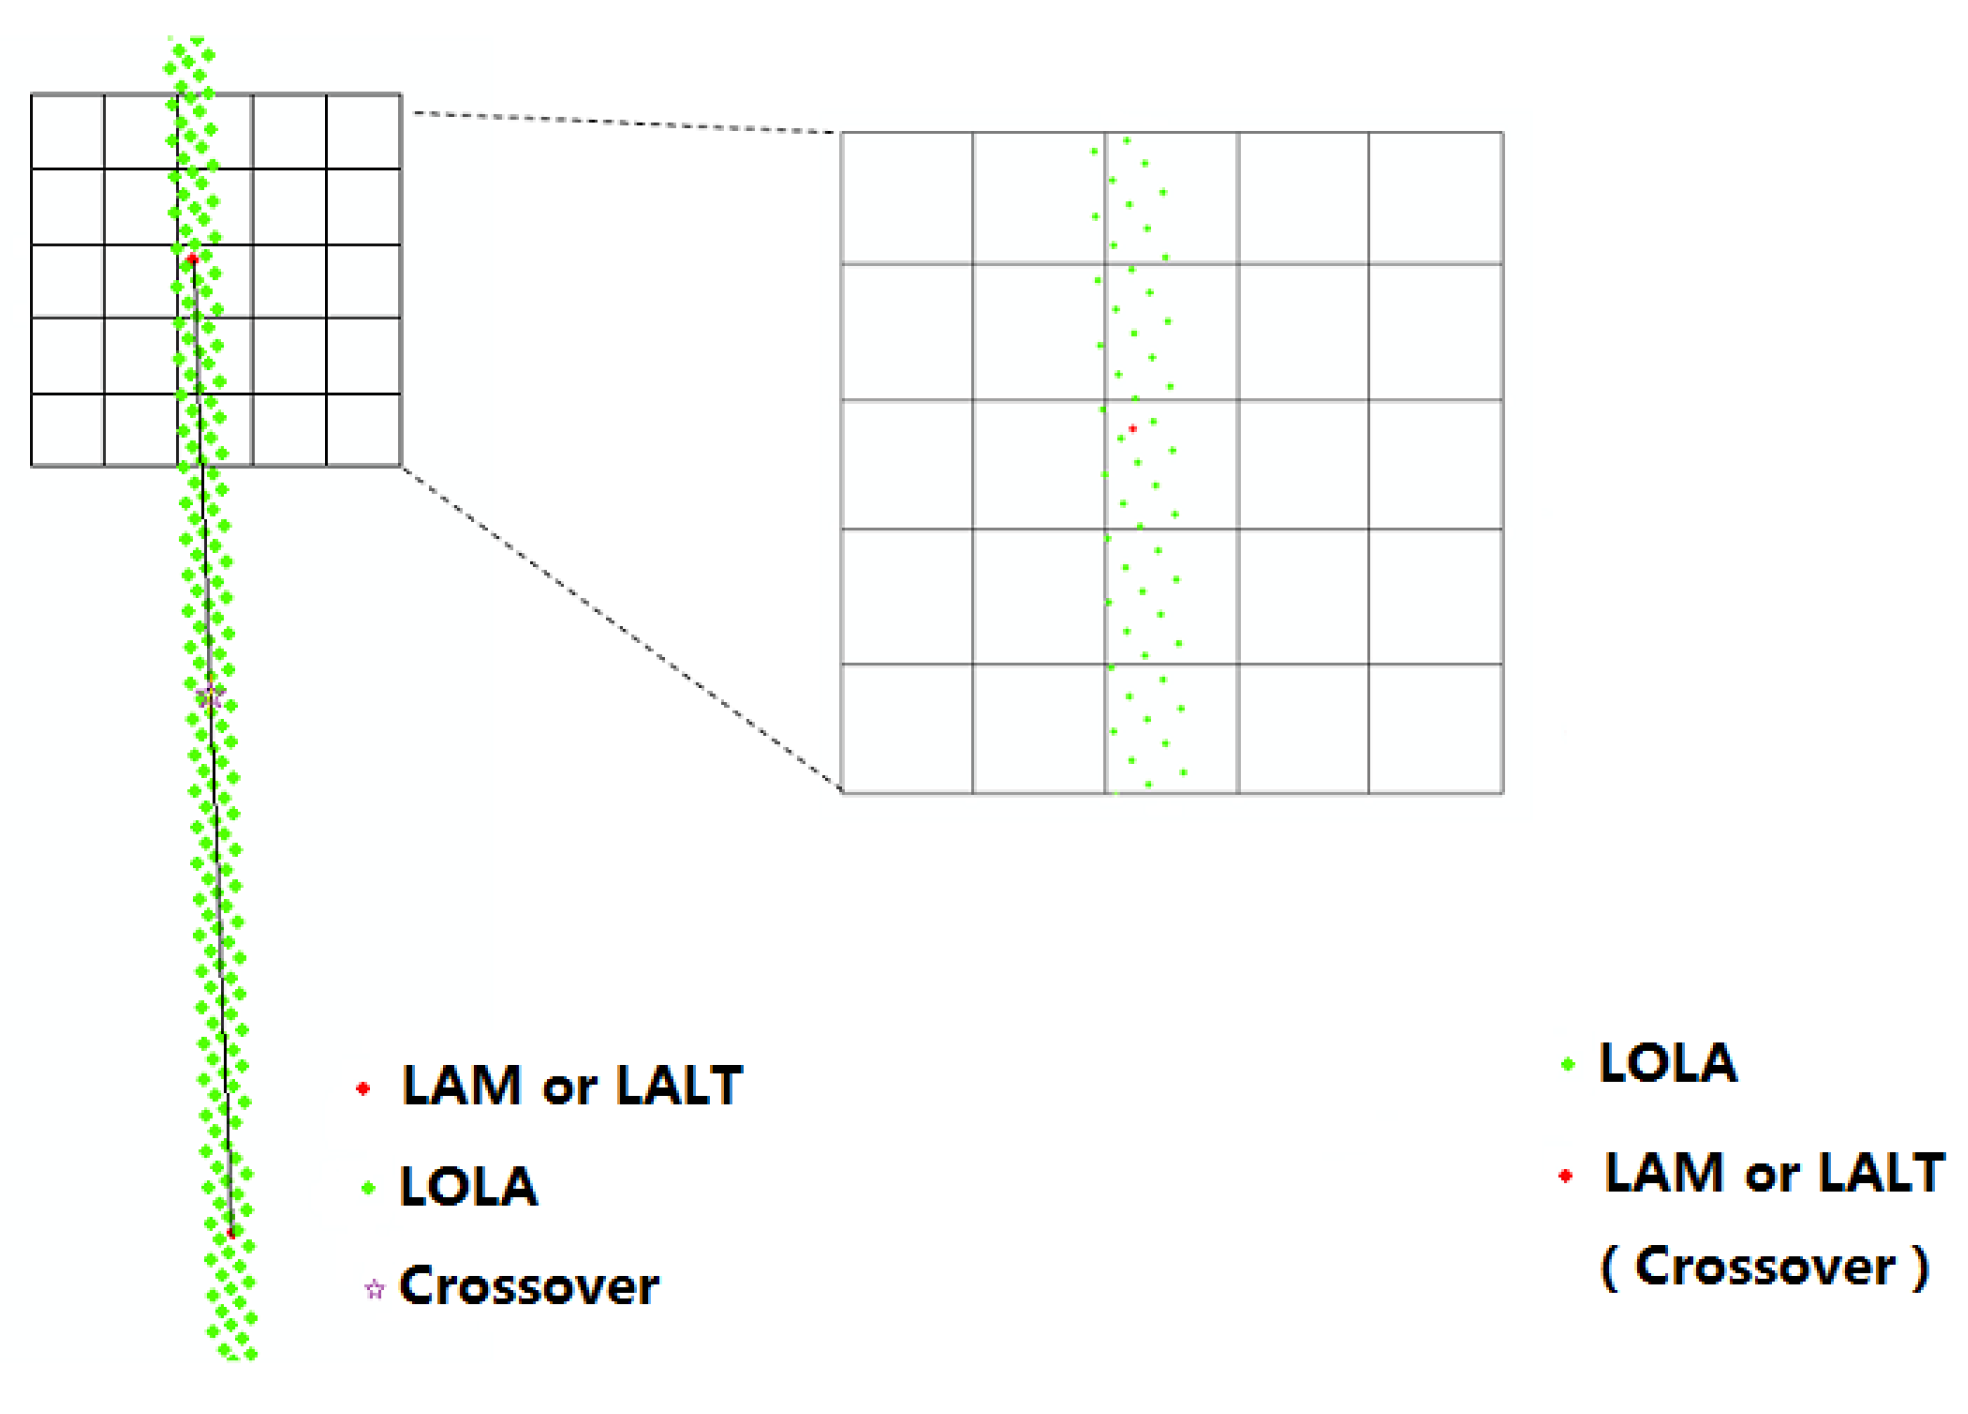
Traditional crossovers are locations where two spacecraft ground tracks intersect but this traditional concept is unsuitable for a multi-beam sampling pattern and the high sampling frequency of the LOLA. As Figure 1 shows, the traditional single-beam crossover is interpolated from the nearest points in the two tracks. The interpolated elevation from the two LAM or LALT points is extremely inaccurate relative to the LOLA points. Thus, the traditional single-beam crossover is inappropriate and we thus define the crossover for an improved use of the LOLA sampling pattern.
As the partial enlargement of Figure 1 shows, if the LAM and LALT data points are located at the pixels where the LOLA points are >3, we can use them as crossovers and then we interpolate the elevations of the crossover points using the LOLA points in the pixel and the 8 pixels around it with interpolation of inverse distance to a power. At each crossover, the interpolated altitudes entering the altimetry residuals are:
Δ h = alt ( lon , lat ) LAM   or   LALT   interp [ ( lon , lat , alt ) LOLA alt ( lon , lat ) LAM   or   LALT   ]
There are two main items in the Equation (4); the former is the elevation of the LAM/LALT points and the latter is the interpolated elevation obtained using LOLA points. The arrow is intended to illustrate the interpolation process.
The target region is small and some tracks have few crossovers. Moreover, from our experimental analysis, we have concluded that the primary error is systematic and that it is stable in such a small region. Thus, we used a one-parameter model as our final adjustment model.
Δ h i j = alt ( lon , lat )   i j LAM   or   LALT + δ i interp [ ( lon , lat , alt ) LOLA alt ( lon , lat )   i j LAM   or   LALT ]
where i is the track number, j is the jth crossover of the ith track, and δ i is the parameter of the ith track. Parameter δ i of each orbit is obtained by the least squares method and the adjusted elevation is subsequently calculated.

4. Results

4.1. Valid Data Distribution

There were about nineteen million valid LOLA points in the target region after eliminating the noise points. We used a grid with 256 pixels per degree to count the LOLA data (Figure 2a). Each pixel value represents the number of the LOLA measurements. The largest pixel value is 45, which means there are 45 LOLA points in this pixel. The largest longitudinal gap is 42 pixels long (about 3.8 km) and the average longitudinal gap is about 5.8 pixels long (about 0.5 km).
There are no data for about 79% of the pixels (Figure 2b) and the elevation values in the LOLA-only DEM were obtained entirely from interpolation. The accuracy of the elevation values decreases with an increasing distance from the LOLA points, especially where large slopes on the lunar surface are present. We constructed a LOLA-only DEM (Figure 3a). As Figure 3b shows, the LOLA-only DEM shows that the Louville–K crater has a clearly visible notch. The size of the notch is about 20 × 12-pixels, or ~2.4 × 1.4-km. We examined the LROC image (Figure 3c) that shows a complete crater edge. LOLA-only DEM differs from the real situation due to the inaccuracy of the elevation interpolated in the data gap. The LALT and LAM points are more reliable than the values interpolated from the LOLA data further away from the LOLA points. Thus, the LAM and LALT data for those gaps might help in obtaining a denser surface coverage for creating a more accurate DEM of the Mons Rümker region.
There were about 37,000 valid LAM points in the target region after eliminating the noise points (Figure 4a) and about 40,000 LALT points in the target region (Figure 4b). The LALT points in some craters were missing and those points are more meaningful than the points in the flat region. This is probably due to range failures on the crater’s limb and/or low albedo region such as mares [26].
We analyzed the relationship between the distances from the LAM and LALT points to the LOLA points and determined the quantity of the LAM and LALT points (Figure 5). As shown, the number of points of the LALT and LAM data decrease with the increasing distance from the LOLA points and this occurs rapidly when the distance is >4 pixels.

4.2. Crossover Adjustment

The three altimeters possess different accuracies. The LOLA data are more precise than the LAM and LALT data. In the subsequent analysis, we ignored the different size of footprints and used the LOLA data as a benchmark to conduct the special crossover adjustment. The size of a LAM footprint is less than 200 m (the elevation is the average value within the range of the LAM/LALT footprint), while the footprint size of LALT is about 40 m. We chose 1/256° (equal to ~120 m) as the computing grid spacing, which basically includes the ranges of both footprints. Employing the elevations from the LOLA data to interpolate the LAM and LALT crossover points yields elevation values that are consistent with the ranges of the LAM or LALT footprints.
There were 5896 crossovers in the 156 LAM orbital profiles. We calculated the altimetry residuals and analyzed the distribution of the residuals (Figure 6a). There were systematic errors in each orbit due to the orbit determination error of the CE-1 and the systematic bias of the reference frequency of the LAM oscillator. Poor-quality data were found in the 17 November 2008 data (Figure 6b) and were excluded in the subsequent processing. The poor-quality data has nothing to do with the altimeter but may arise from the orbit determination.
The crossover adjustment was performed to reduce the systematic errors. The radial residual root mean square (RMS) of the LAM points decreased from 154.83 ± 43.60 m to 14.29 ± 27.84 m (Figure 7). This value is consistent with the analysis of the LAM external calibration [24] and the orbit determination accuracy of the CE-1 [28].
The LALT data were handled similarly. There were 6690 crossovers in the 149 LALT orbital profiles. The distribution of the altimetry residuals shows that the LALT data have better accuracy than the LAM data (Figure 8a). The radial residual RMS decreased from 3.50 ± 5 m to 2.75 ± 4.4 m (Figure 8b).
The crossover adjustment reduced the radial systematic errors of the LAM and LALT orbital profiles. Subsequently, the adjusted LAM and LALT points were used with the LOLA points to create the merged DEMs and a LAM + LOLA merged DEM and a LALT + LOLA merged DEM were produced.

5. Discussion

5.1. LAM + LOLA Merged DEM

We used the adjusted LAM points and the LOLA points to produce a LAM + LOLA merged DEM with a 1/256° resolution in the Mons Rümker region by Kriging interpolation (Figure 9). The LAM + LOLA merged DEM possesses many distortions and exhibits a banded distribution. We think this is mainly due to the horizontal errors of the CE-1 orbit and the LAM pointing errors and partly to the remaining residuals after the crossover adjustment.
The crossover adjustment did not handle the horizontal error of the LAM data. If we use the LAM data at greater distances from the LOLA data, the problem of distortion is reduced, but the amount of LAM data is small, which makes little contribution to the merged DEM. The LAM data need to be relocated by reconstructing the CE-1 orbit.

5.2. LALT + LOLA Merged DEM

We used the adjusted LALT points and the LOLA points to create a LALT + LOLA merged DEM with a 1/256° resolution in Mons Rümker region by Kriging interpolation (Figure 10a). There is no distortion in the merged DEM because of the more accurate horizontal geolocation of the LALT data.
The LOLA-only DEM shows that the Louville–K crater has a notch (Figure 10b) but this notch is not apparent in the LALT + LOLA merged DEM (Figure 10c). We examined the LROC image of the Louville–K crater (Figure 10d) and the visual examination suggests that the merged LALT + LOLA DEM is closer to the ground truth.
We have calculated the average change in height and gap size over the whole study area. In the study area, there are 3,123,665 pixels with LOLA, and the LALT can make 31,514 blank pixels be supplemented. A further comparison is shown in Figure 11a; we calculated the difference between each pixel in the LOLA-only DEM and the LALT + LOLA merged DEM. The large differences follow a banded distribution, reflecting the position of the added LALT points. The added LALT points contribute to the gaps of the LOLA-only DEM, in which the maximum change in the pixel value was about 200 m. Figure 11b,c show the profiles of lines A and B of both DEMs. The profiles of the LALT + LOLA merged DEM are wavy whereas the profiles of the LOLA-only DEM are straight, proving the benefit of the added LALT points. The rate of elevation change of line A is 58.8%, and the average change is 3.83 m; the rate of elevation change of line B is 15.2%, and the average change 1.45 m. Clearly, a more accurate DEM can be produced by combined multisource altimeter data.

5.3. SLDEM2015

Barker et al. [17] used a five-parameter coordinate transformation and a bounded downhill simplex minimization algorithm to register the stereo-derived DEMs (each 1° × 1°) from the SELENE TC to the LOLA reference geodetic framework. Subsequently, the authors used the co-registered TC data to estimate and correct the orbital and pointing geolocation errors from the LOLA altimeter profiles. Typically, empty pixels in the LOLA-only map were interpolated with a continuous curvature surface but the empty pixels were filled with the corresponding pixels of the geodetically-controlled TC tiles to create the SLDEM2015.
We compared the differences between SLDEM2015 and LALT + LOLA merged DEM. Figure 12 shows overall differences in the entire study area and Table 1 gives the statistics of difference. As a whole, the two DEMs are more consistent, with a mean difference of only 0.02 m and a standard deviation of 7.72 m. However, there is still large difference in local areas, and the maximum difference is 323.12 m, the minimum is −500.59 m, mainly concentrated in the impact crater, mountains, ridges and other topographic undulating areas. There are two main reasons for the large difference. One is that there are still many data blank areas in LALT + LOLA merged DEM, which is limited by the current amount and distribution of altimetry data. The other is that SELENE TC DEM has large residual error after adjustment in a local area and the errors are taken into the production process of SLDEM 2015.
The SLDEM2015 possesses good quality and combines the finer details of the stereo-derived DEM and the LOLA reference geodetic framework but we find that this map shows inconsistency in some areas. As Figure 13a shows, many bands with a width of one or two pixels occur in the SLDEM2015 and these bands can also be clearly distinguished in the difference map of the SLDEM2015 and LALT + LOLA merged DEM (Figure 13c). The case in Figure 13(a2) is the worst area of SLDEM2015 in our study area, which has clearly distortion, and the bands in Figure 12c are universal. The difference values of those bands are near zero. We checked the positions of the LOLA profiles and found that these bands nearly coincided with the LOLA profiles. Thus, we believe that co-registered stereo-derived DEMs result in larger errors in some areas and we try to explain this result based on the process of Barker et al. [17].
The size of each cell in the stereo-derived DEM is 1° × 1° in the study of Barker et al. [17], but the boundaries of the original TC ground swath acquisitions do not generally align with the 1° × 1° tiles and have different systematic errors. Barker et al. [17] thought of these systematic errors as being the same in the calculation. Thus, these systematic errors were not completely eliminated and some errors even increased in some areas after the co-registration. Subsequently, the co-registered stereo-derived DEMs were used to fill the empty pixels of the LOLA data. This approach results in the differences between SLDEM2015 and LALT + LOLA merged DEM and the bands are produced in the merged DEM (SLDEM2015).
Our approach does not result in a more distinct map than that of Barker et al. [17] because the resolution of our DEM is limited by the amount of altimeter data currently available. However, our DEM is consistent for the whole region. It should be noted that the consistency we highlight is that the pixels with the similar distance from the altimeter points are of consistent accuracy. However, the accuracy of pixels interpolated with altimeter data is not same in different position. The farther the distance is from the altimeter data, the lower the accuracy of the pixels is. Nevertheless, from the perspective of the strip with little difference between SELDEM2015 and DEM generated from LOLA, we can speculate that our DEM has smaller accuracy difference between the pixels with the data and its adjacent pixels with no data.
The DEM generated by multi-source altimeter data is not as good as SELDEM2015 in terms of the details clarity at present. But our DEM could have high accuracy and resolution if more new altimetry data can be collected in the following mission.

6. Conclusions

A method combining filtering and cluster analysis was used to eliminate the noise points in multisource altimeter data and a special crossover adjustment was used to model the radial errors in the LAM and LALT data. The LAM radial residual RMS was reduced from 154.83 ± 43.60 m to 14.29 ± 27.84 m and the LALT radial residual RMS was reduced from 3.50 ± 5.0 m to 2.75 ± 4.4 m. To fill the gaps in the LOLA data, the adjusted LAM and LALT data were used to produce the merged DEMs. The LAM + LOLA merged DEM shows that there are large horizontal geolocation errors in the adjusted LAM data but the LALT + LOLA merged DEM is more credible than the LOLA-only DEM. The combined multisource altimetry data improves the spatial coverage and helps to create more precise DEMs.
The target region in this study is only 15° × 15° of the lunar surface and the adjustment model has only one parameter. The adjustment model must be replaced by a higher order polynomial when handling an expanded research area. Future work will cover latitudes from 0°N to 60°N, as determined by the LOLA data coverage. The horizontal geolocation of the LALT and LAM data is another problem that must be tackled. The 3-D crossover adjustment is a good way to reduce horizontal and radial errors. In our study, there are few crossover points between a LAM/LALT track and LOLA cloud points. And it is hardly possible to do a 3D match with limited crossover points. If the number of the new data by the future lunar mission becomes as much as LOLA data, horizontal position error can be adjusted as the radial one.

Author Contributions

W.H. and Q.C. principally conceived of the idea for the study. C.Z., W.H. and Q.C. were responsible for designing the experiments, completing the experiments, and processing the data. J.-P.B., J.Y., M.Y. and T.S. contributed to the analysis and discussion. C.Z. and F.L. finalized the manuscript. All authors contributed to the writing of the manuscript and improving the review.

Funding

This research was funded by the National Natural Science Foundation of China (no. 41604004, 41874010), the Hubei Province Natural Science Foundation of innovation group project (no. 2015CFA011), and the fundamental research funds for the central universities (no. 2042018kf0231).

Acknowledgments

We thank the LRO Mission Operations Center and the LOLA science teams for the LOLA RDR data used in this study. We also thank the SELENE LALT team and the SELENE Data Archive for providing the LALT data. We also thank the CE-1 LAM team and Data Publishing and Information Service System of the Chinese Lunar Exploration Project. We are grateful to the anonymous reviewers and editors for constructive feedback, which improved the quality of this paper. Jean-Pierre Barriot was funded by a DAR grant in planetology from the French Space Agency (CNES).

Conflicts of Interest

The authors declare no conflict of interest.

References

  1. Zhao, J.N.; Xiao, L.; Qiao, L.; Glotch, T.D.; Huang, Q. The mons Rümker volcanic complex of the moon: A candidate landing site for the Chang’E-5 mission. J. Geophys. Res. Planets 2017, 122, 1419–1442. [Google Scholar] [CrossRef]
  2. Hao, W.F.; Li, F.; Xiao, C.; Yan, J.G.; Ye, M. Understanding the moon’s internal structure through moonquake observations and remote sensing technologies. Sci. China Earth Sci. 2018, 61, 995–1006. [Google Scholar] [CrossRef]
  3. Head, J.W., III; Fassett, C.I.; Kadish, S.J.; Smith, D.E.; Zuber, M.T.; Neumann, G.A.; Mazarico, E. Global distribution of large lunar craters: Implications for resurfacing and impactor populations. Science 2010, 329, 1504–1507. [Google Scholar] [CrossRef] [PubMed]
  4. Fassett, C.I.; Head, J.W.; Kadish, S.J.; Mazarico, E.; Neumann, G.A.; Smith, D.E.; Zuber, M.T. Lunar impact basins: Stratigraphy, sequence and ages from superposed impact crater populations measured from lunar orbiter laser altimeter (LOLA) data. J. Geophys. Res. Planets 2012, 117, 1–13. [Google Scholar] [CrossRef]
  5. Gläser, P.; Scholten, F.; Rosa, D.D.; Figuera, R.M.; Oberst, J.; Mazarico, E.; Neumann, G.A.; Robinson, M.S. Illumination conditions at the lunar south pole using high resolution digital terrain models from LOLA. Icarus 2014, 243, 78–90. [Google Scholar] [CrossRef]
  6. Hao, W.F.; Li, F.; Yan, J.G.; Zhang, J.; Su, X.L. Lunar polar illumination based on Chang’E-1 laser altimeter. Chin. J. Geophys. 2012, 55, 46–52. [Google Scholar]
  7. Kaula, W.M.; Schubert, G.; Lingenfelter, R.E.; Sjogren, W.L.; Wollenhaupt, W.R. Apollo laser altimetry and inferences as to lunar structure. In Proceedings of the Lunar and Planetary Science Conference, Houston, TX, USA, 18–22 March 1974; Volume 3, pp. 3049–3058. [Google Scholar]
  8. Smith, D.E.; Zuber, M.T.; Neumann, G.A.; Lemoine, F.G. Topography of the moon from the clementine lidar. J. Geophys. Res. Planets 1997, 102, 1591–1611. [Google Scholar] [CrossRef]
  9. Ouyang, Z.Y.; Li, C.L.; Zou, Y.L.; Zhang, H.B.; Chang, L.; Liu, J.Z.; Liu, J.J.; Zuo, W.; Su, Y.; Wen, W.B. Primary scientific results of Chang’E-1 lunar mission. Sci. China Earth Sci. 2010, 53, 1565–1581. [Google Scholar] [CrossRef]
  10. Kato, M.; Sasaki, S.; Tanaka, K.; Iijima, Y.; Takizawa, Y. The Japanese lunar mission SELENE: Science goals and present status. Adv. Space Res. 2008, 42, 294–300. [Google Scholar] [CrossRef]
  11. Smith, D.E.; Zuber, M.T.; Neumann, G.A.; Mazarico, E.; Lemoine, F.G.; Head, J.W., III; Lucey, P.G.; Aharonson, O.; Robinson, M.S.; Sun, X.L.; et al. Summary of the results from the lunar orbiter laser altimeter after seven years in lunar orbit. Icarus 2017, 283, 70–91. [Google Scholar] [CrossRef]
  12. Araki, H.; Tazawa, S.; Noda, H.; Ishihara, Y.; Goossens, S.; Sasaki, S.; Kawano, N.; Kamiya, I.; Otake, H.; Oberst, J. Lunar global shape and polar topography derived from kaguya-LALT laser altimetry. Science 2009, 323, 897–900. [Google Scholar] [CrossRef] [PubMed]
  13. Ping, J.S.; Qian, H.; Yan, J.G.; Cao, J.F.; Tang, G.S.; Rong, S. Lunar topographic model CLTM-s01 from Chang’E-1 laser altimeter. Sci. China Ser. G 2009, 52, 1105–1114. [Google Scholar] [CrossRef]
  14. Li, C.L.; Liu, J.J.; Wang, J.Y.; Wei, Z.; Xin, R.; Zou, X.D.; Mu, L.L.; Rong, S.; Zou, Y.L.; Zhang, H.B. Laser altimetry data of Chang’E-1 and the global lunar DEM model. Sci. China Earth Sci. 2010, 53, 1582–1593. [Google Scholar] [CrossRef]
  15. Mazarico, E.; Goossens, S.J.; Lemoine, F.G.; Neumann, G.A.; Torrence, M.H.; Rowlands, D.D.; Smith, D.E.; Zuber, M.T. Improved orbit determination of lunar orbiters with lunar gravity fields obtained by the grail mission. In Proceedings of the Lunar and Planetary Science Conference, Woodlands, TX, USA, 18–22 March 2013; p. 2414. [Google Scholar]
  16. Mazarico, E.; Neumann, G.A.; Barker, M.K.; Goossens, S.; Smith, D.E.; Zuber, M.T. Orbit determination of the lunar reconnaissance orbiter: Status after seven years. Planet. Space Sci. 2017. [Google Scholar] [CrossRef]
  17. Barker, M.K.; Mazarico, E.; Neumann, G.A.; Zuber, M.T.; Haruyama, J.; Smith, D.E. A new lunar digital elevation model from the lunar orbiter laser altimeter and SELENE terrain camera. Icarus 2016, 273, 346–355. [Google Scholar] [CrossRef]
  18. Hu, W.; Di, K.; Liu, Z.; Ping, J. A new lunar global DEM derived from Chang’E-1 laser altimeter data based on crossover adjustment with local topographic constraint. Planet. Space Sci. 2013, 87, 173–182. [Google Scholar] [CrossRef]
  19. Neumann, G.A.; Rowlands, D.D.; Lemoine, F.G.; Smith, D.E.; Zuber, M.T. Crossover analysis of mars orbiter laser altimeter data. J. Geophys. Res. Planets 2001, 106, 23753–23768. [Google Scholar] [CrossRef]
  20. Keller, J.W.; Petro, N.E.; Vondrak, R.R. The lunar reconnaissance orbiter mission - six years of science and exploration at the moon. Icarus 2016, 273, 2–24. [Google Scholar] [CrossRef]
  21. Smith, D.E.; Zuber, M.T.; Jackson, G.B.; Cavanaugh, J.F.; Neumann, G.A.; Riris, H.; Sun, X.; Zellar, R.S.; Coltharp, C.; Connelly, J.; et al. The lunar orbiter laser altimeter investigation on the lunar reconnaissance orbiter mission. Space Sci. Rev. 2010, 150, 209–241. [Google Scholar] [CrossRef]
  22. Smith, D.E.; Zuber, M.T.; Neumann, G.A.; Lemoine, F.G.; Mazarico, E.; Torrence, M.H.; Mcgarry, J.F.; Rowlands, D.D.; Head, J.W., III; Duxbury, T.H.; et al. Initial observations from the lunar orbiter laser altimeter (LOLA). Geophys. Res. Lett. 2010, 37, 109–118. [Google Scholar] [CrossRef]
  23. Kato, M.; Sasaki, S.; Takizawa, Y.; The Kaguya Project Team. The Kaguya mission overview. Space Sci. Rev. 2010, 154, 3–19. [Google Scholar] [CrossRef]
  24. Ping, J.S.; Su, X.L.; Liu, J.Z.; Shu, R.; Yan, J.G. External calibration for laser altimetry mission in Chang’E-1. Sci. Sin.-Phys. Mech. Astron. 2013, 43, 1438–1447. [Google Scholar] [CrossRef]
  25. Cai, Z.C.; Zheng, C.M.; Tang, Z.S.; Qi, D.X. Lunar digital elevation model and elevation distribution model based on Chang’E-1 lam data. Sci. China Technol. Sci. 2010, 53, 2558–2568. [Google Scholar] [CrossRef]
  26. Araki, H.; Noda, H.; Tazawa, S.; Ishihara, Y.; Goossens, S.; Sasaki, S. Lunar laser topography by LALT on board the KAGUYA lunar explorer—Operational history, new topographic data, peak height analysis of laser echo pulses. Adv. Space Res. 2013, 52, 262–271. [Google Scholar] [CrossRef]
  27. Hartigan, J.A.; Wong, M.A. A k-means clustering algorithm. J. R. Stat. Soc. 1979, 28, 100–108. [Google Scholar]
  28. Yan, J.G.; Ping, J.S.; Li, F.; Cao, J.F.; Huang, Q.; Fung, L.H. Chang’E-1 precision orbit determination and lunar gravity field solution. Adv. Space Res. 2010, 46, 50–57. [Google Scholar]
Figure 1. Schematic of the traditional single-beam crossover and the special crossover used in this study (the length of the pixels is 1/256°).
Remotesensing 10 01442 g001
Figure 2. (a) The number of lunar orbiter laser altimeter (LOLA) points in each pixel; (b) quantity of pixels with fixed numbers of LOLA points.
Remotesensing 10 01442 g002
Figure 3. (a) LOLA-only digital elevation model (DEM); (b) LOLA-only DEM of the Louville–K crater; (c) lunar reconnaissance orbiter camera (LROC) image of the Louville–K crater.
Remotesensing 10 01442 g003
Figure 4. (a) The distribution of LAM points; (b) the distribution of LALT points (base map is the LOLA-only DEM).
Remotesensing 10 01442 g004
Figure 5. Relationship between the minimum distance from the LOLA points and the number of LAM and LALT points (the non-integer values are rounded).
Remotesensing 10 01442 g005
Figure 6. (a) Distribution of the residuals of the LAM crossovers (different colors represent different orbital data); (b) list of poor-quality LAM orbital data (red arrow).
Remotesensing 10 01442 g006
Figure 7. LAM root mean square (RMS) of the radial residuals before (red) and after (blue) the adjustment.
Remotesensing 10 01442 g007
Figure 8. (a) Distribution of the residuals of the LALT crossovers (the different colors represent different orbital data); (b) distribution of the RMS of the radial residuals before (red) and after (blue) the adjustments.
Remotesensing 10 01442 g008
Figure 9. LAM + LOLA merged DEM (inside the black frame is a case of distortion in the LAM + LOLA merged DEM).
Remotesensing 10 01442 g009
Figure 10. (a) LALT + LOLA merged DEM; (b) LOLA-only DEM of the Louville–K crater; (c) LALT + LOLA merged DEM of the Louville–K crater; (d) the LROC image of the Louville–K crater.
Remotesensing 10 01442 g010
Figure 11. (a) Differences between the LOLA-only DEM and the LALT + LOLA merged DEM; (b) profiles of line A in the LOLA-only DEM and the LALT + LOLA merged DEM; (c) profiles of line B in the LOLA-only DEM and the LALT + LOLA merged DEM.
Remotesensing 10 01442 g011aRemotesensing 10 01442 g011b
Figure 12. Comparison between SLDEM2015 and LALT + LOLA DEM in the entire study area. (a) The distribution of differences; (b) frequency distribution histogram of differences.
Remotesensing 10 01442 g012
Figure 13. Comparison of SLDEM2015 and LALT + LOLA merged DEM in two areas. (a) SLDEM2015; (b) LALT + LOLA merged DEM; (c) difference between SLDEM2015 and LOLA DEM.
Remotesensing 10 01442 g013
Table 1. The difference statistics in the entire study area between the SLDEM2015 and LALT + LOLA DEM.
Maximum ValueMinimum ValueMean ValueStandard Deviation
323.12 m−500.59 m0.02 m7.72 m

