Comparison of C-Band Quad-Polarization Synthetic Aperture Radar Wind Retrieval Models


1
School of Marine Sciences, Nanjing University of Information Science and Technology, Nanjing 210044, China
2
Fisheries & Oceans Canada, Bedford Institute of Oceanography, Dartmouth, NS B2Y 4A2, Canada
3
School of Remote Sensing and Geomatics Engineering, Nanjing University of Information Science and Technology, Nanjing 210044, China
4
Laboratory for Regional Oceanography and Numerical Modeling, Qingdao National Laboratory for Marine Science and Technology, Qingdao 266237, China
5
State Key Laboratory of Satellite Ocean Environment Dynamics, Second Institute of Oceanography, State Oceanic Administration, Hangzhou 310012, China
*
Author to whom correspondence should be addressed.
Remote Sens. 2018, 10(9), 1448; https://doi.org/10.3390/rs10091448
Submission received: 13 July 2018
/
Revised: 3 September 2018
/
Accepted: 5 September 2018
/
Published: 11 September 2018
(This article belongs to the Special Issue Sea Surface Roughness Observed by High Resolution Radar)
Abstract
:This work discusses the accuracy of C-2PO (C-band cross-polarized ocean backscatter) and CMOD4 (C-band model) geophysical model functions (GMF) for sea surface wind speed retrieval from satellite-born Synthetic Aperture Radar (SAR) images over in the Northwest Pacific off the coast of China. In situ observations are used for comparison of the retrieved wind speed using two established wind retrieval models: C-2PO model and CMOD4 GMF. Using 439 samples from 92 RADARSAT-2 fine quad-polarization SAR images and corresponding reference winds, we created two subset wind speed databases: the training and testing subsets. From the training data subset, we retrieve ocean surface wind speeds (OSWSs) from different models at each polarization and compare with reference wind speeds. The RMSEs of SAR-retrieved wind speeds are: 2.5 m/s: 2.11 m/s (VH-polarized), 2.13 m/s (HV-polarized), 1.86 m/s (VV-polarized) and 2.26 m/s (HH-polarized) and the correlation coefficients are 0.86 (VH-polarized), 0.85(HV-polarized), 0.87(VV-polarized) and 0.83 (HH-polarized), which are statistically significant at the 99.9% significance level. Moreover, we found that OSWSs retrieved using C-2PO model at VH-polarized are most suitable for moderate-to-high winds while CMOD4 GMF at VV-polarized tend to be best for low-to-moderate winds. A hybrid wind retrieval model is put forward composed of the two models, C-2PO and CMOD4 and sets of SAR test data are used in order to establish an appropriate wind speed threshold, to differentiate the wind speed range appropriate for one model from that of the other. The results show that the OSWSs retrieved using our hybrid method has RMSE of 1.66 m/s and the correlation coefficient are 0.9, thereby significantly outperforming both the C-2PO and CMOD4 models.
1. Introduction
Ocean surface wind speed (OSWS) plays a significant role in the global climate, directly influencing energy transport between ocean basins, ocean water mass formations and circulation. As a result, observations and monitoring of OSWS can improve our understanding of the physical mechanisms of oceanic-atmospheric interactions, hurricane and severe storm predictions and decision making and numerical weather predication (NWP) and marine forecasts [1].
In recent decades, with the development of satellite remote sensing, the reliability of OSWS retrieved from various satellite sensors has matured and improved. Among various satellites, the microwave scatterometers (SCAT) play a vital role in getting coverage over the entire global ocean. However, a major drawback for SCAT-derived wind speeds is the coarse resolution of the data (12.5–50 km), which limits our ability to get a better understanding of the coastal oceans and to study related processes in the lower atmospheric and oceanic boundary layers, such as surface currents, waves, winds and their interactions [2]. Spaceborne synthetic aperture radar (SAR) can mitigate this difficulty, because of its ability to retrieve OSWSs, day or night, in almost all-weather conditions, at high spatial resolution and large areal coverage [3]. At this time, the retrieval of OSWS at high (<1 km) resolution from quad-polarized spaceborne SAR images is a mature geophysical application. Many efforts have been devoted to developing optimal reliable methodologies to elucidate the geophysical relationship between the normalized radar cross section (NRCS) and OSWS and to apply this relationship to accurately compute wind speeds [4,5,6,7,8].
OSWS retrieved from co-polarized (HH-and VV-polarized; horizontal transmit, horizontal receive and vertical transmit, vertical receive, respectively) SAR data are normally computed employing various empirical geophysical model functions (GMFs). For VV polarized SAR data, these GMFs were initial developed from C-band scatterometer measurements. They are routinely called CMOD (C-band model) GMFs and they relate the wind speeds and directions to the local incidence angle and NRCS. Using radar incidence angle and wind direction, along with the NRCS at each pixel in the VV-polarized channel from C-band SAR, the associated OSWS can be retrieved from various CMOD GMFs, such as CMOD4 [9], CMOD-IFR2 [10], CMOD5 [11] and CMOD5.N [12]. Recently, the latest CMOD GMF, called CMOD7, was developed in several steps from CMOD5.N for application to intercalibrate ERS (ESCAT) and ASCAT scatterometers [13]. Although CMOD GMFs for VV-polarized have been widely used, based on a large number of SAR data, however, no similarly well-developed GMF exists for HH-polarized SAR imagery. To remedy this difficulty, hybrid model functions, called the polarization ratios (PRs), were proposed to map the expected NRCS at VV-polarized mode to the HH-polarized value for the same wind direction and speed. When these CMOD GMFs, as mentioned above, are applied to HH-polarized SAR images, various PR models have to be used to convert HH-NRCS to VV-NRCS before application for wind retrieval [14,15,16,17,18].
In conclusion, OSWSs retrieved at co-polarized channel are a mature technical achievement that has been widely validated in different SAR systems. However, the NRCS value for co-polarized SAR imagery exhibits data saturation when wind speeds exceed about 16 m/s for local incidence angle under 35° [19]. Moreover, available experimental and theoretical evidence suggest that dampening or single saturation of co-polarized channel radar backscatter occurs across a wide range of wind speeds and radar frequencies [20,21]. In recent years, C-band cross-polarized (HV-and VV-polarized, horizontal transmit, vertical receive and vertical transmit, horizontal receive, respectively) ocean backscatter has been shown to be almost independent of incidence angle and wind direction and to be quite linear with respect to the OSWS. This unique sensitivity for cross-polarized data is mainly attributed to the contribution of breaking waves [22]. The relationship between the cross-polarized NRCS and OSWS can directly provide wind speeds from SAR images, without the requirement of wind direction or incidence angles. Some cross-polarized OSWS retrieval models have been developed based on this relationship [23,24]. And more critically, the measured NRCS values for cross-polarized SAR seem to be almost not saturated, even at very high speeds (up to 50 m/s), which indicates that they can potentially be used to retrieve hurricane-generated winds [25,26,27,28].
Based on the above developments, it is apparent that OSWSs can be retrieved from cross- and co-polarized SAR data using these established methods. The differing sensitivity between contemporaneous cross and co-polarized SAR signals can be advantageously exploited to infer local information about the wind fields. However, each model has its own wind speed application range; for example, cross-polarized NRCS does not suffer from saturation effects at high wind speeds, which are evident in the co-polarized NRCS. Moreover, retrieved OSWSs from cross-polarized SAR data have better accuracy than winds retrieved from co-polarized NRCS at high wind speed regimes, especially at wind speeds above 20 m/s [27,28]. La et al. [29] compare different retrieval models for OSWS based on empirical (EP) and theoretical electromagnetic (EM) approaches. They show that OSWS estimates from CMOD5.N GMF and two-scale EM models (small-slope and resonant curvature approximation) are very close, for low and moderate incidence angles, whereas retrieved OSWS from EM models give overestimates for high wind speeds. Our objective in this paper is to validate and elucidate the advantages and disadvantages of retrieval models for the cross- and co-polarized data and their respective wind speed ranges for reliable applications. Based on our results, we attempt to propose a new hybrid OSWS retrieval model, which can more accurately retrieve wind speed data from C-band RS-2 quad-polarized SAR data. Two C-band OSWS retrieval GMFs, namely C-2PO and CMOD4 and the SAR data are introduced at Section 2. Section 3 introduces the OSWS retrieval results for quad-polarized RS-2 images. Discussion is given in Section 4 and conclusions, in Section 5.
2. Materials and Methods
2.1. RADARSAT-2 Quad-Polarized SAR Images
In this study, in order to retrieve OSWS from cross- and co-polarized SAR images, 92 RS-2 fine quad-polarized model single-look complex (SLC) SAR images were used. The area covered by the selected SAR images includes Chinese waters: the Yellow Sea, the East China Sea and the South China Sea, covering the area from 14°N to 38°N and 110°E to 130°E between February 2011 and December 2015. The RS-2 satellite transit times for our research area are about 10:00 (Ascending) and 22:00 (Descending) Coordinate Universal Time (UTC). The range of local radar angles is between 20°and 49° and the nominal incidence angles vary by about 1.5° across a swath of 25 km. RS-2 fine quad-polarized model SLC data have the capability to provide C-band VV, HH, HV and HV polarized images with a low noise floor. In addition, inter-channel cross talk is corrected in the processor to better than −35 dB, which is appropriate for cross-polarized backscatter measurements, without contamination from the co-polarized (HH- and VV-polarized) data.
For each individual SAR image with a specific beam mode, the spatial resolution (pixel spacing) in range and azimuth is about 5 m. Direct calculation of OSWS from the original scene can result in noisy patterns due to the presence of speckle noise in the raw SAR image. Therefore, the raw RS-2 SAR data is preprocessed in order to obtain the orthorectified NRCS images at each polarization. Firstly, the OSWS can only be retrieved from SAR images that are independent of ocean surface features that are not due to the local wind. In order to exclude SAR scenes that contain features not associated with the local wind, a filter is applied in this study. The filter is used to distinguish between inhomogeneous and homogeneous SAR images and, additionally, to retrieve ocean waves and wind speeds [30,31]. In the next step, the calibrated 5-m spatial resolution image is degraded to 100-m resolution image. To achieve this, we perform 20 × 20 pixel boxcar averaging of the NRCS in each polarization, so that the reconstructed pixel spacing is 100 m. Finally, the radiometric correction method is used to transform NRCS values from intensity units to decibel units. The conversion formula is expressed as follows:
where the NRCS value in decibels (dB).
2.2. ECMWF ERA-Interim Reanalysis Winds
Carvalho et al. [32] evaluated the performance of different reanalysis wind datasets and found that ERA-Interim reanalysis provides the most realistic initial and boundary data for oceanographic applications, therefore allowing the possibly for development of reliable retrieval models of OSWS from spaceborne SAR data. Therefore, we select ERA-Interim wind field data as the reference wind data for this study.
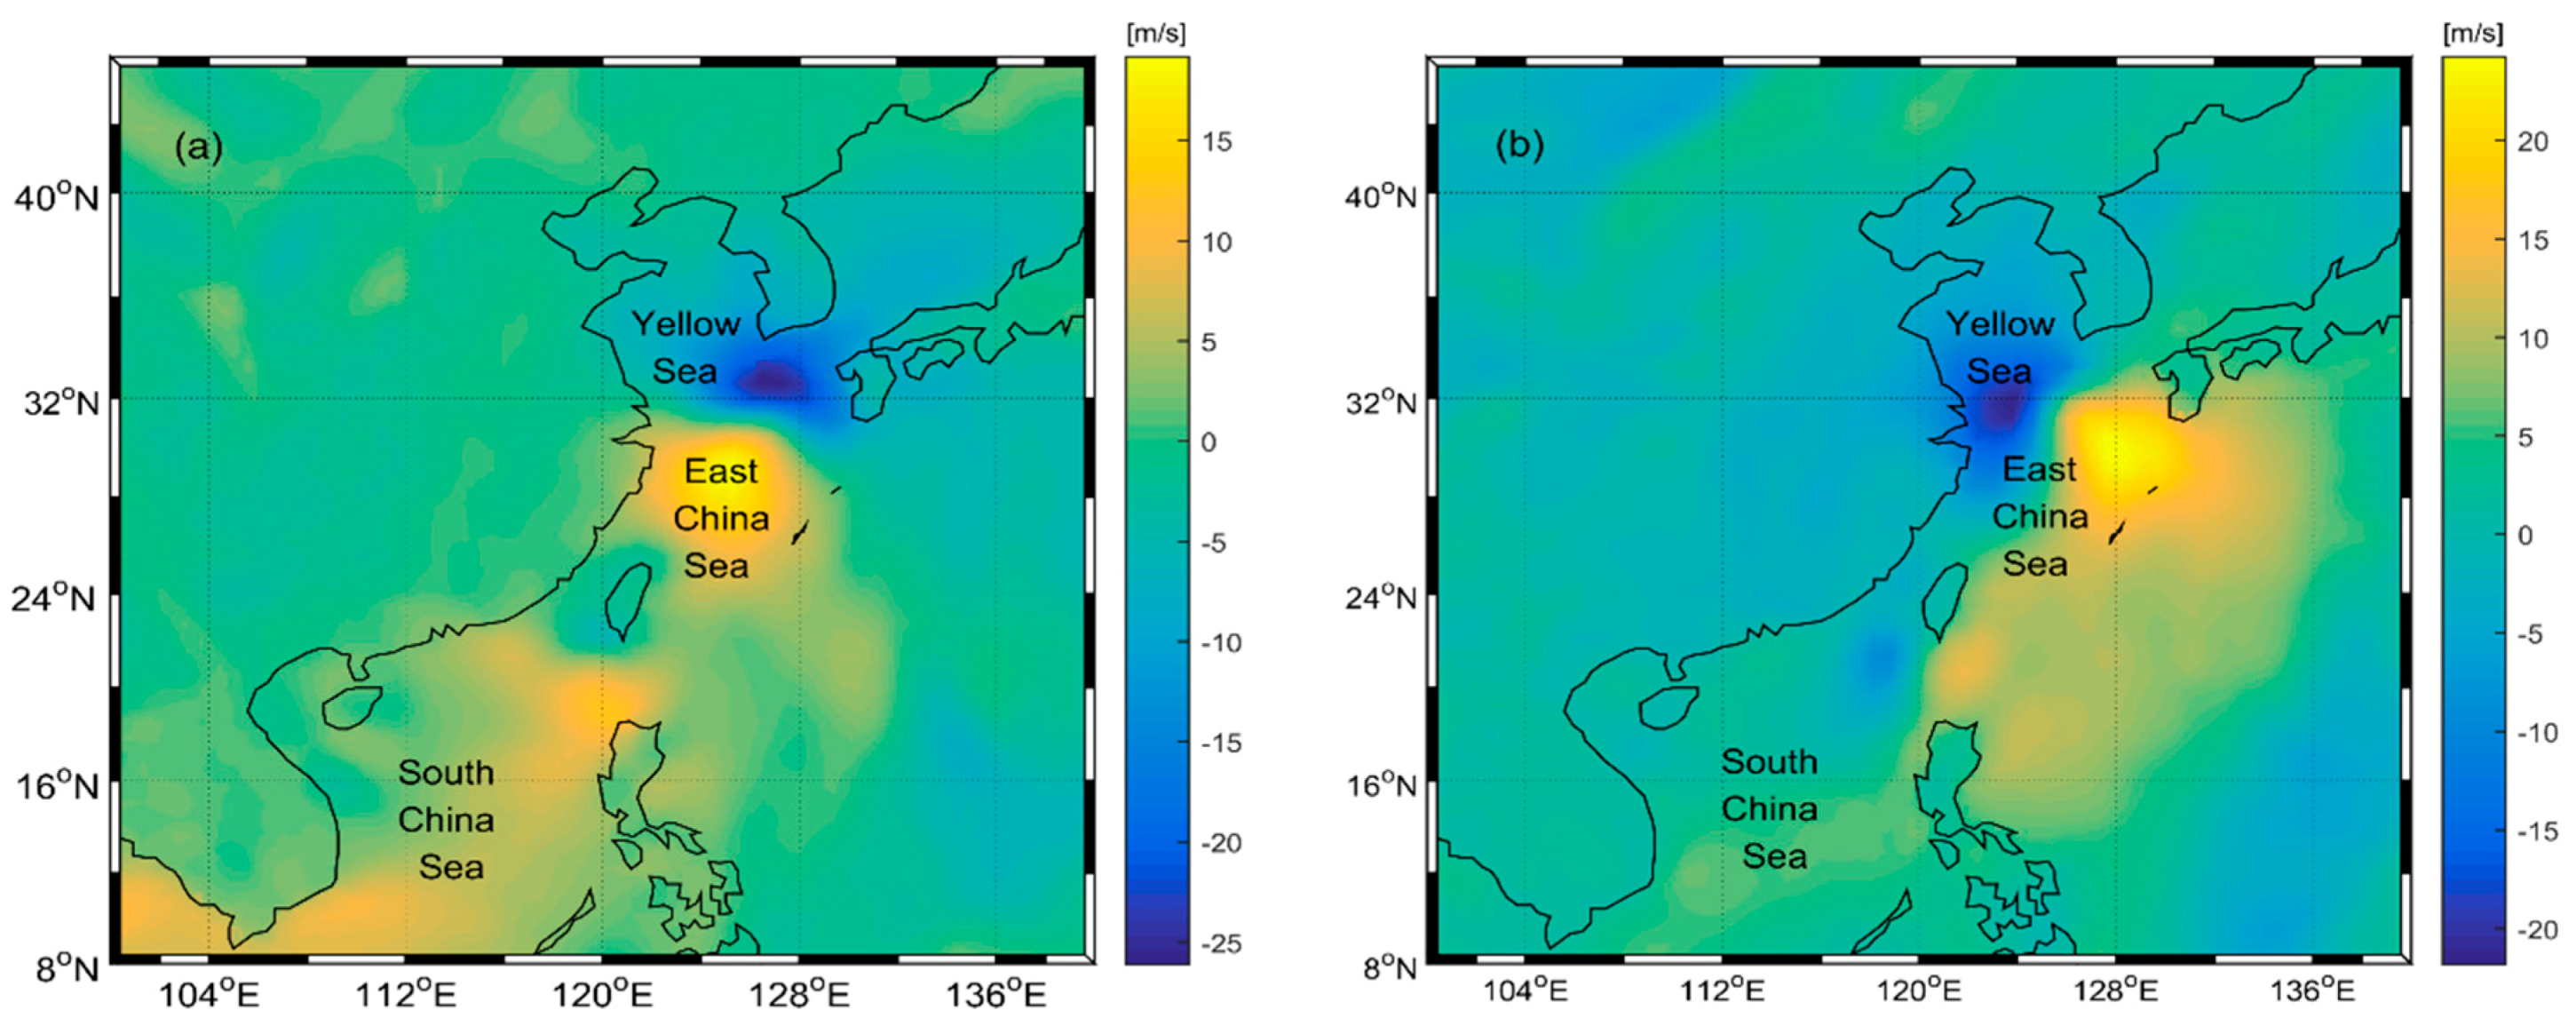
The ERA-Interim global atmospheric reanalysis daily wind speed of components U (east-west direction) and V (south-north direction) at 10-m height with a high spatial resolution (up to ) at 6-h intervals are provided by the European Center for Medium Range Weather Forecasts (ECMWF) [33]. These data are available for the period from 1979 to the present. Figure 1 shows the wind speed in the study areas in this paper. In order to validate the wind retrievals from SAR images with collocated in situ measurements, ERA-Interim wind speeds were taken as reference values. However, the swaths of RS-2 SAR scenes are about 25 km, which means that there are about 5–6 ERA-Interim grid cells in each SAR image. In our study, the acquisition time for RS-2 SAR images is 1~2 h earlier than the ERA-Interim data. For a viable comparison, the ERA-Interim wind grid cells at 12:00:00 and 24:00:00 UTC are interpolated to generate the wind vectors at the RS-2 acquisition time [34]. In addition, conventional co-polarized CMOD GMFs have two unknown parameters, that is, wind direction and speed which must be provided by external sources, prior to wind speed retrieval. Therefore, auxiliary data for wind directions are necessary as inputs to these GMFs because wind directions are difficult to directly measure from SAR images.
2.3. Creation of Wind Speed Databases
A general flowchart (Figure 2) for the establishment of the wind speed database for the developing wind speed retrieval method is described in this section. Firstly, all available quad-polarized RS-2 SAR images are preprocessed. Subsequently, we identify all existing ERA-Interim grid cells that are located inside the corresponding SAR scenes. In our study, the ERA-Interim wind field data are available at -resolution grids whereas our RS-2 imagery has a higher spatial resolution: 5.4 m in the range direction and 8.0 m in the azimuth direction. The swath widths of RS-2 SAR scenes are about 25 km, which means that the number of ERA-Interim grid cells inside one SAR scene varies from 5 to 6. Thus, 439 samples are extracted from 92 SAR images. As the resolution of the ERA-Interim wind data is 0.125°, there are about one hundred pixels between the adjacent SAR measurements we selected. These selected measurements can be treated as essentially independent. It is notable that the locations (latitude and longitude) of ERA-Interim grid cells and SAR pixels are misalignment in most cases. To obtain the radar incidence angles, NRCS at each polarization and other parameters, we use the bilinear interpolation method rather than other downscaling approaches such as the nearest grid-points [35].
Finally, we created two subset wind speed databases: the training subset and the testing subset. Each subset contains SAR parameters (including NRCS at each polarization, radar incidence angles and external wind directions) and ERA-Interim wind speeds at the same location. The training subset contains 285 samples that are used for training different OSWS retrieval models at each polarization. Based on the analyzed retrieval results, we build a hybrid wind speed retrieval method and employ the testing subset (154 samples) to validate these algorithms.
2.4. Quad-Polarized SAR Wind Speed Retrieval Algorithm
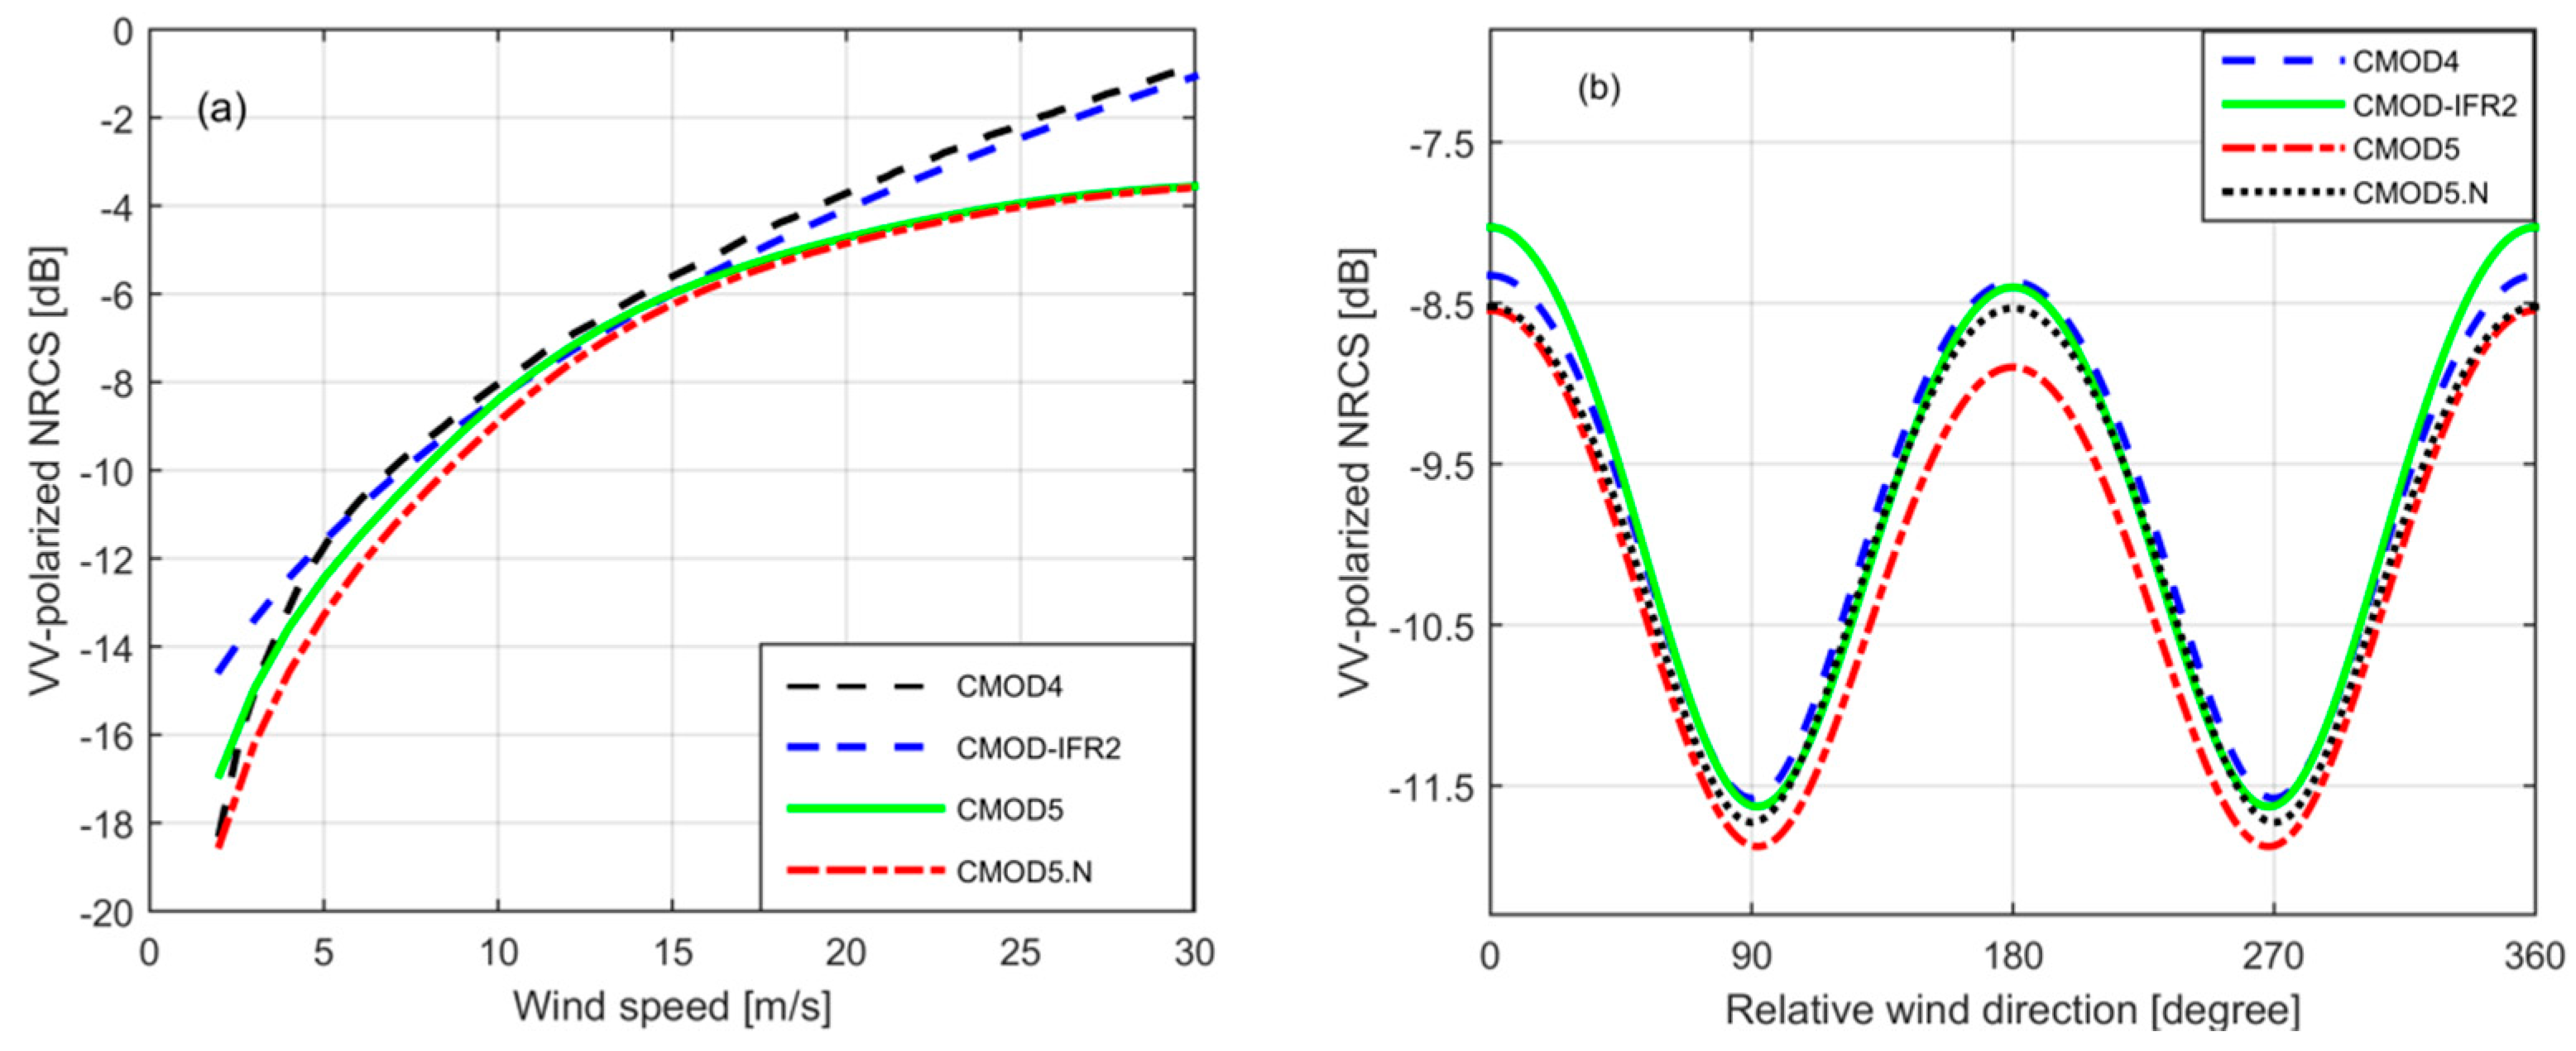
For the instruments operating at C-band and VV-polarized channel, several empirical GMFs, for example, CMOD4, CMOD-IFR2, CMOD5 and CMOD5.N have been developed and validated through a series of satellite scatterometer missions. Figure 3a shows the variations of SAR-simulated VV-polarized NRCSs from CMOD GMFs with wind speed at a local radar incidence angle of 30°, with relative wind direction of 180°. Clearly, all CMOD functions produce very similar results for wind speeds below 20 m/s. In fact, C-band VV-polarized OSWS retrieval will always become saturated under high wind conditions. Han et al. [36] retrieved OSWS based on CMOD4, CMOD-IFR2 and CMOD5 using RS-2 SAR images of the East China Sea and the results suggested that CMOD4 is the most promising GMF of these formulations.
In this study, we selected CMOD4 GMF as the VV-polarized wind speed retrieve algorithm and the general form is expressed as follows:
Here, is the VV-polarized NRCS, is the external wind direction ψ relative radar look angle. The other parameters, and are coefficients which are dependent on the local radar incidence angle . and OSWS at 10-m reference height . Moreover, the external wind direction, defined as ψ, should be obtained from ERA-Interim data, whereas the local incidence angle and the NRCS can be directly computed from the corresponding RS-2 SAR image.
To date, although many CMOD GMFs have been presented for VV-polarized data, no similar well-developed, verified OSWS retrieval models exist to extract wind speed from HH-polarized SAR images. To overcome this deficiency, the empirical PR models, which are related to local radar incidence angles, were developed for application in retrieving OSWS using the HH-polarized SAR channel. Following the usual notation, we define PR as
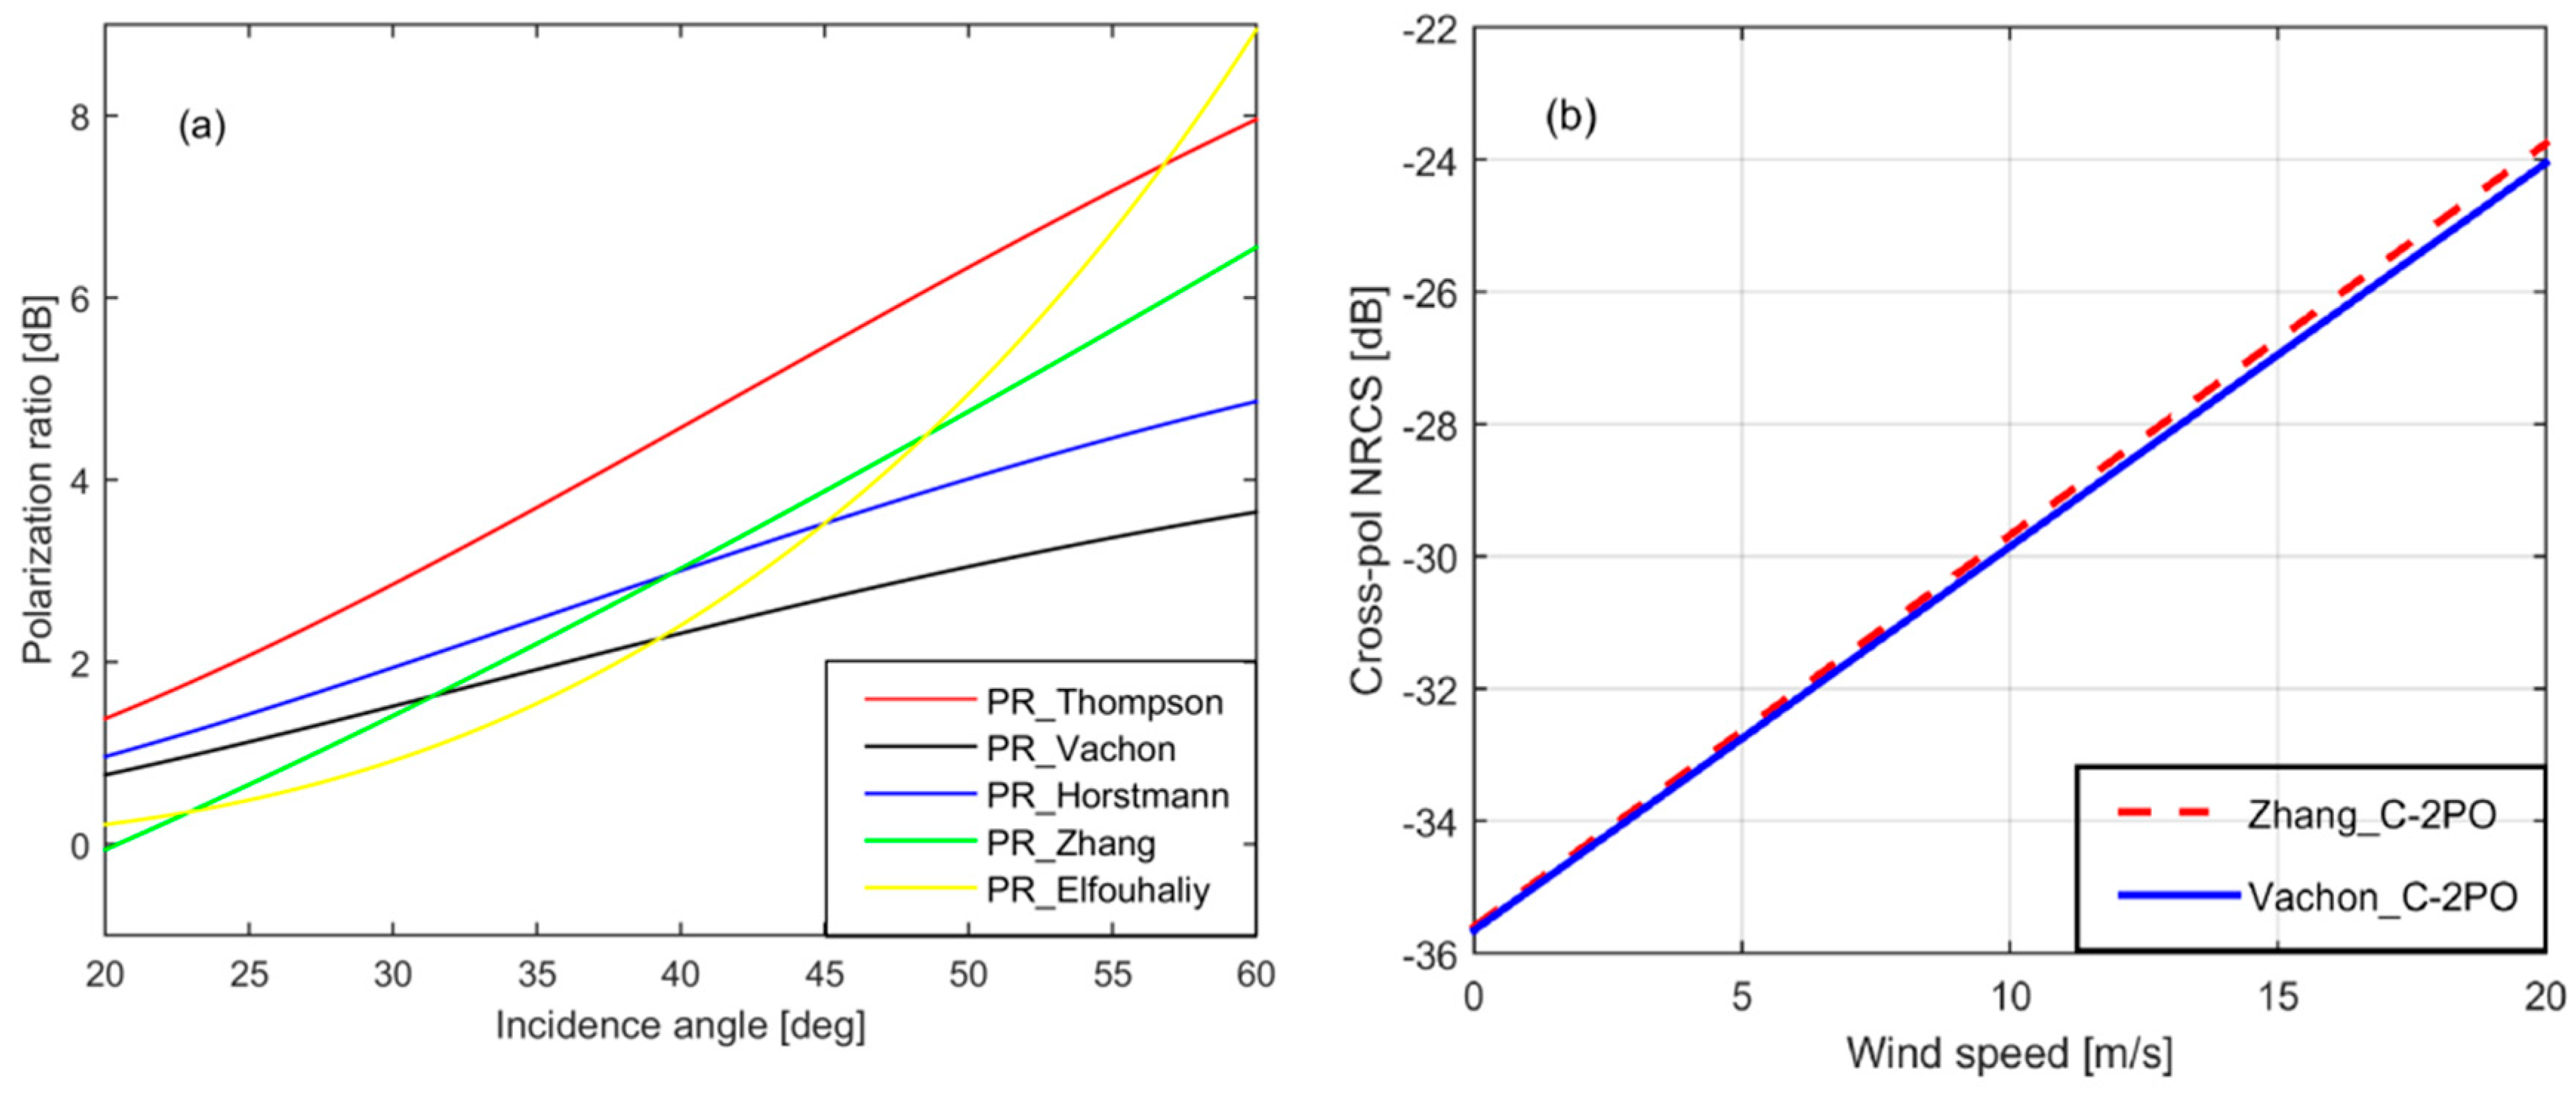
where and are the NRCSs of VV and HH polarizations, respectively. Various PR models have been proposed as functions of incidence angles and several PR models are compared in the Figure 3. Recently, using a nonlinear least squares algorithm to fit the collocated 877 RS-2 fine quad-polarization PR and incidence angles, a new C-band PR incidence angle dependent model was proposed by Zhang et al. [20], given as
where , , and R represent the polarization ration value, respectively. In our study, we have selected Zhang’s PR model to retrieve OSWS from HH-polarized data, because this PR model is based on RS-2 fine quad-polarization data which is the same as the data used in this study. Moreover, for convenience, the OSWS retrieved from CMOD4 GMF using VV-polarized data is denoted CMOD4+VV and the alternative, using converted HH-polarized data by the PR model, is denoted CMOD4+HH+PR.
Generally speaking, co-polarized scattering is the result of ocean surface scattering, whereas cross-polarized scattering results from sea surface tilts or by volume scattering; thus, cross-polarized scattering is less correlated than co-polarized scattering data. Studies show that the NRCS in cross-polarized mode is essentially independent of radar incidence angle and wind direction but has a linear relationship with respect to OSWS and thus generates a new potential capability to monitor marine wind speed [24]. Using RS-2 fine quad-polarized mode SAR images and collocated buoy data, via a nonlinear least squares method, two C-band cross-polarized ocean backscatter models (C-2PO) relating to the equivalent neutral OSWS at 10 m height were presented by Vachon et al. [23] and Zhang et al. [24], although only the latter specifically denote their model by the acronym, ‘C-2PO.’ These two C-2PO models are as follows:
where is the HV- or VH-polarized NRCS and is OSWS at the 10-m height. Figure 4b shows the NRCSs simulated by both the Zhang_model and the Vachon_model, with OSWS. It can be noticed that the NRCSs increase with increasing OSWS and there is little difference between these two models. Here, we select Zhang’s C-2PO model as the cross-polarized OSWS retrieval algorithm in this study. In addition, for the sake of consistency and convenience, the C-2PO model at VH-polarization is denoted VH-C2PO and the other, at HV-polarization is denoted HV-C2PO.
3. Results
3.1. OSWS Retrieval Case
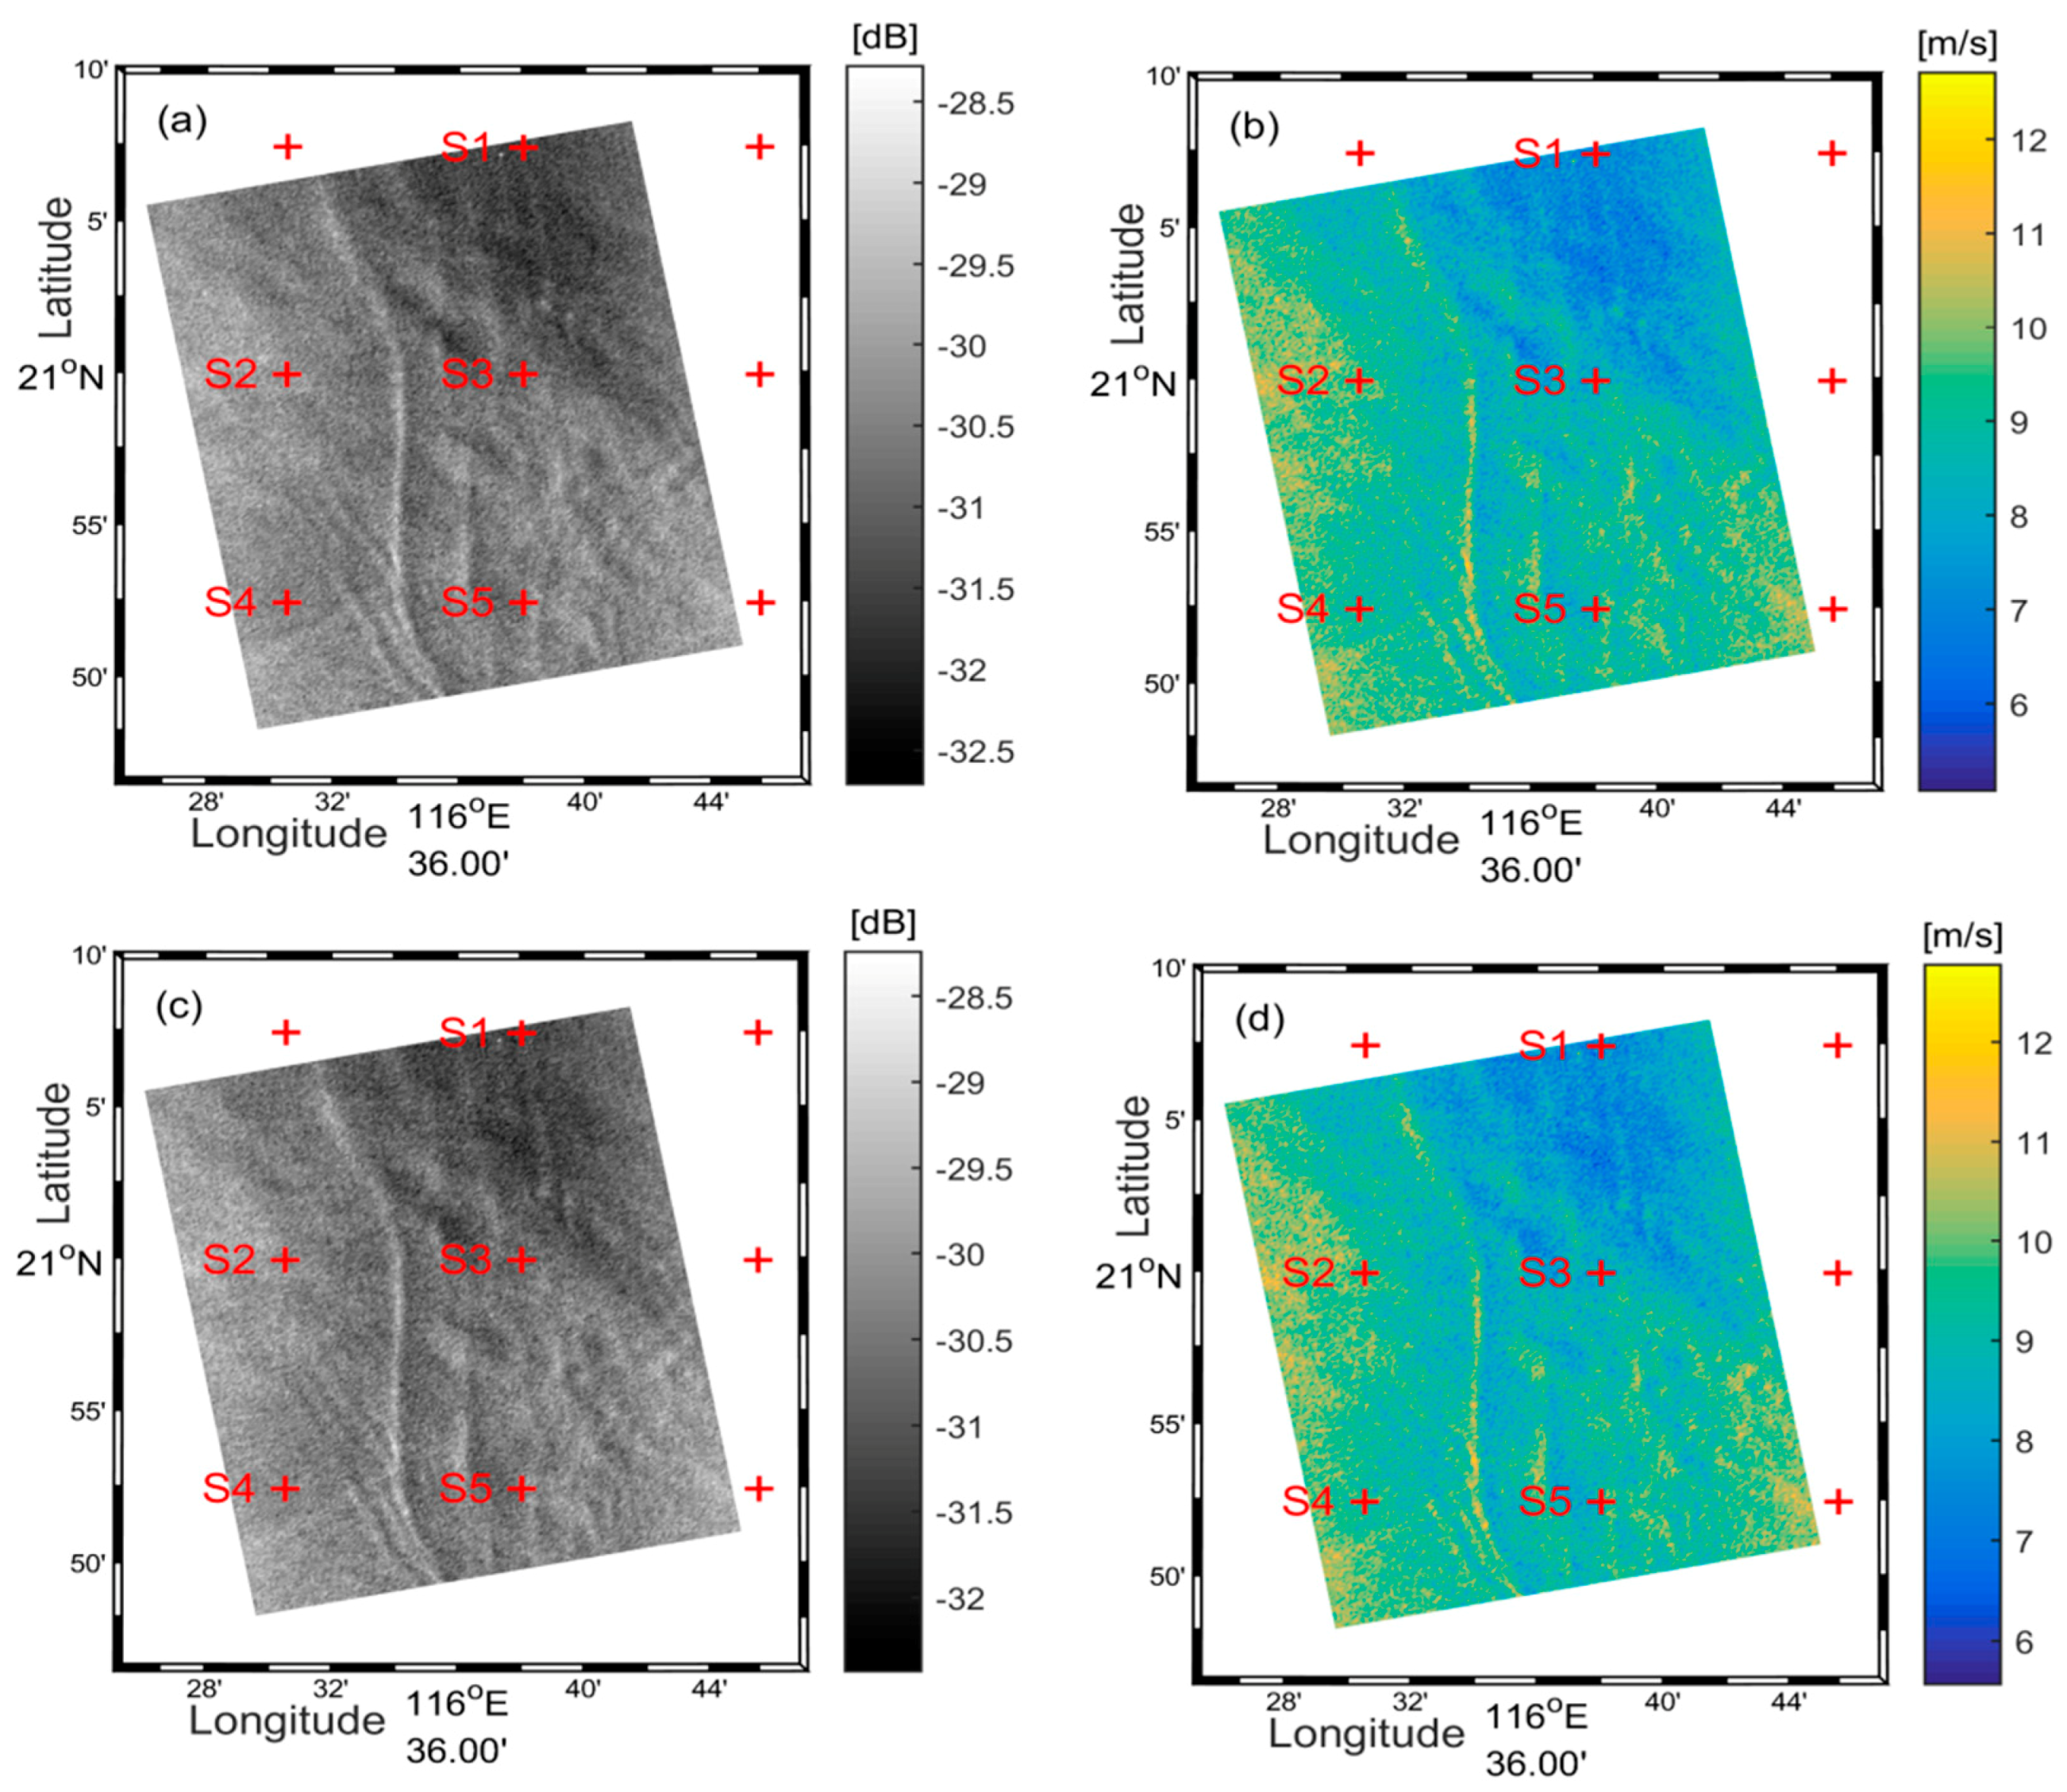
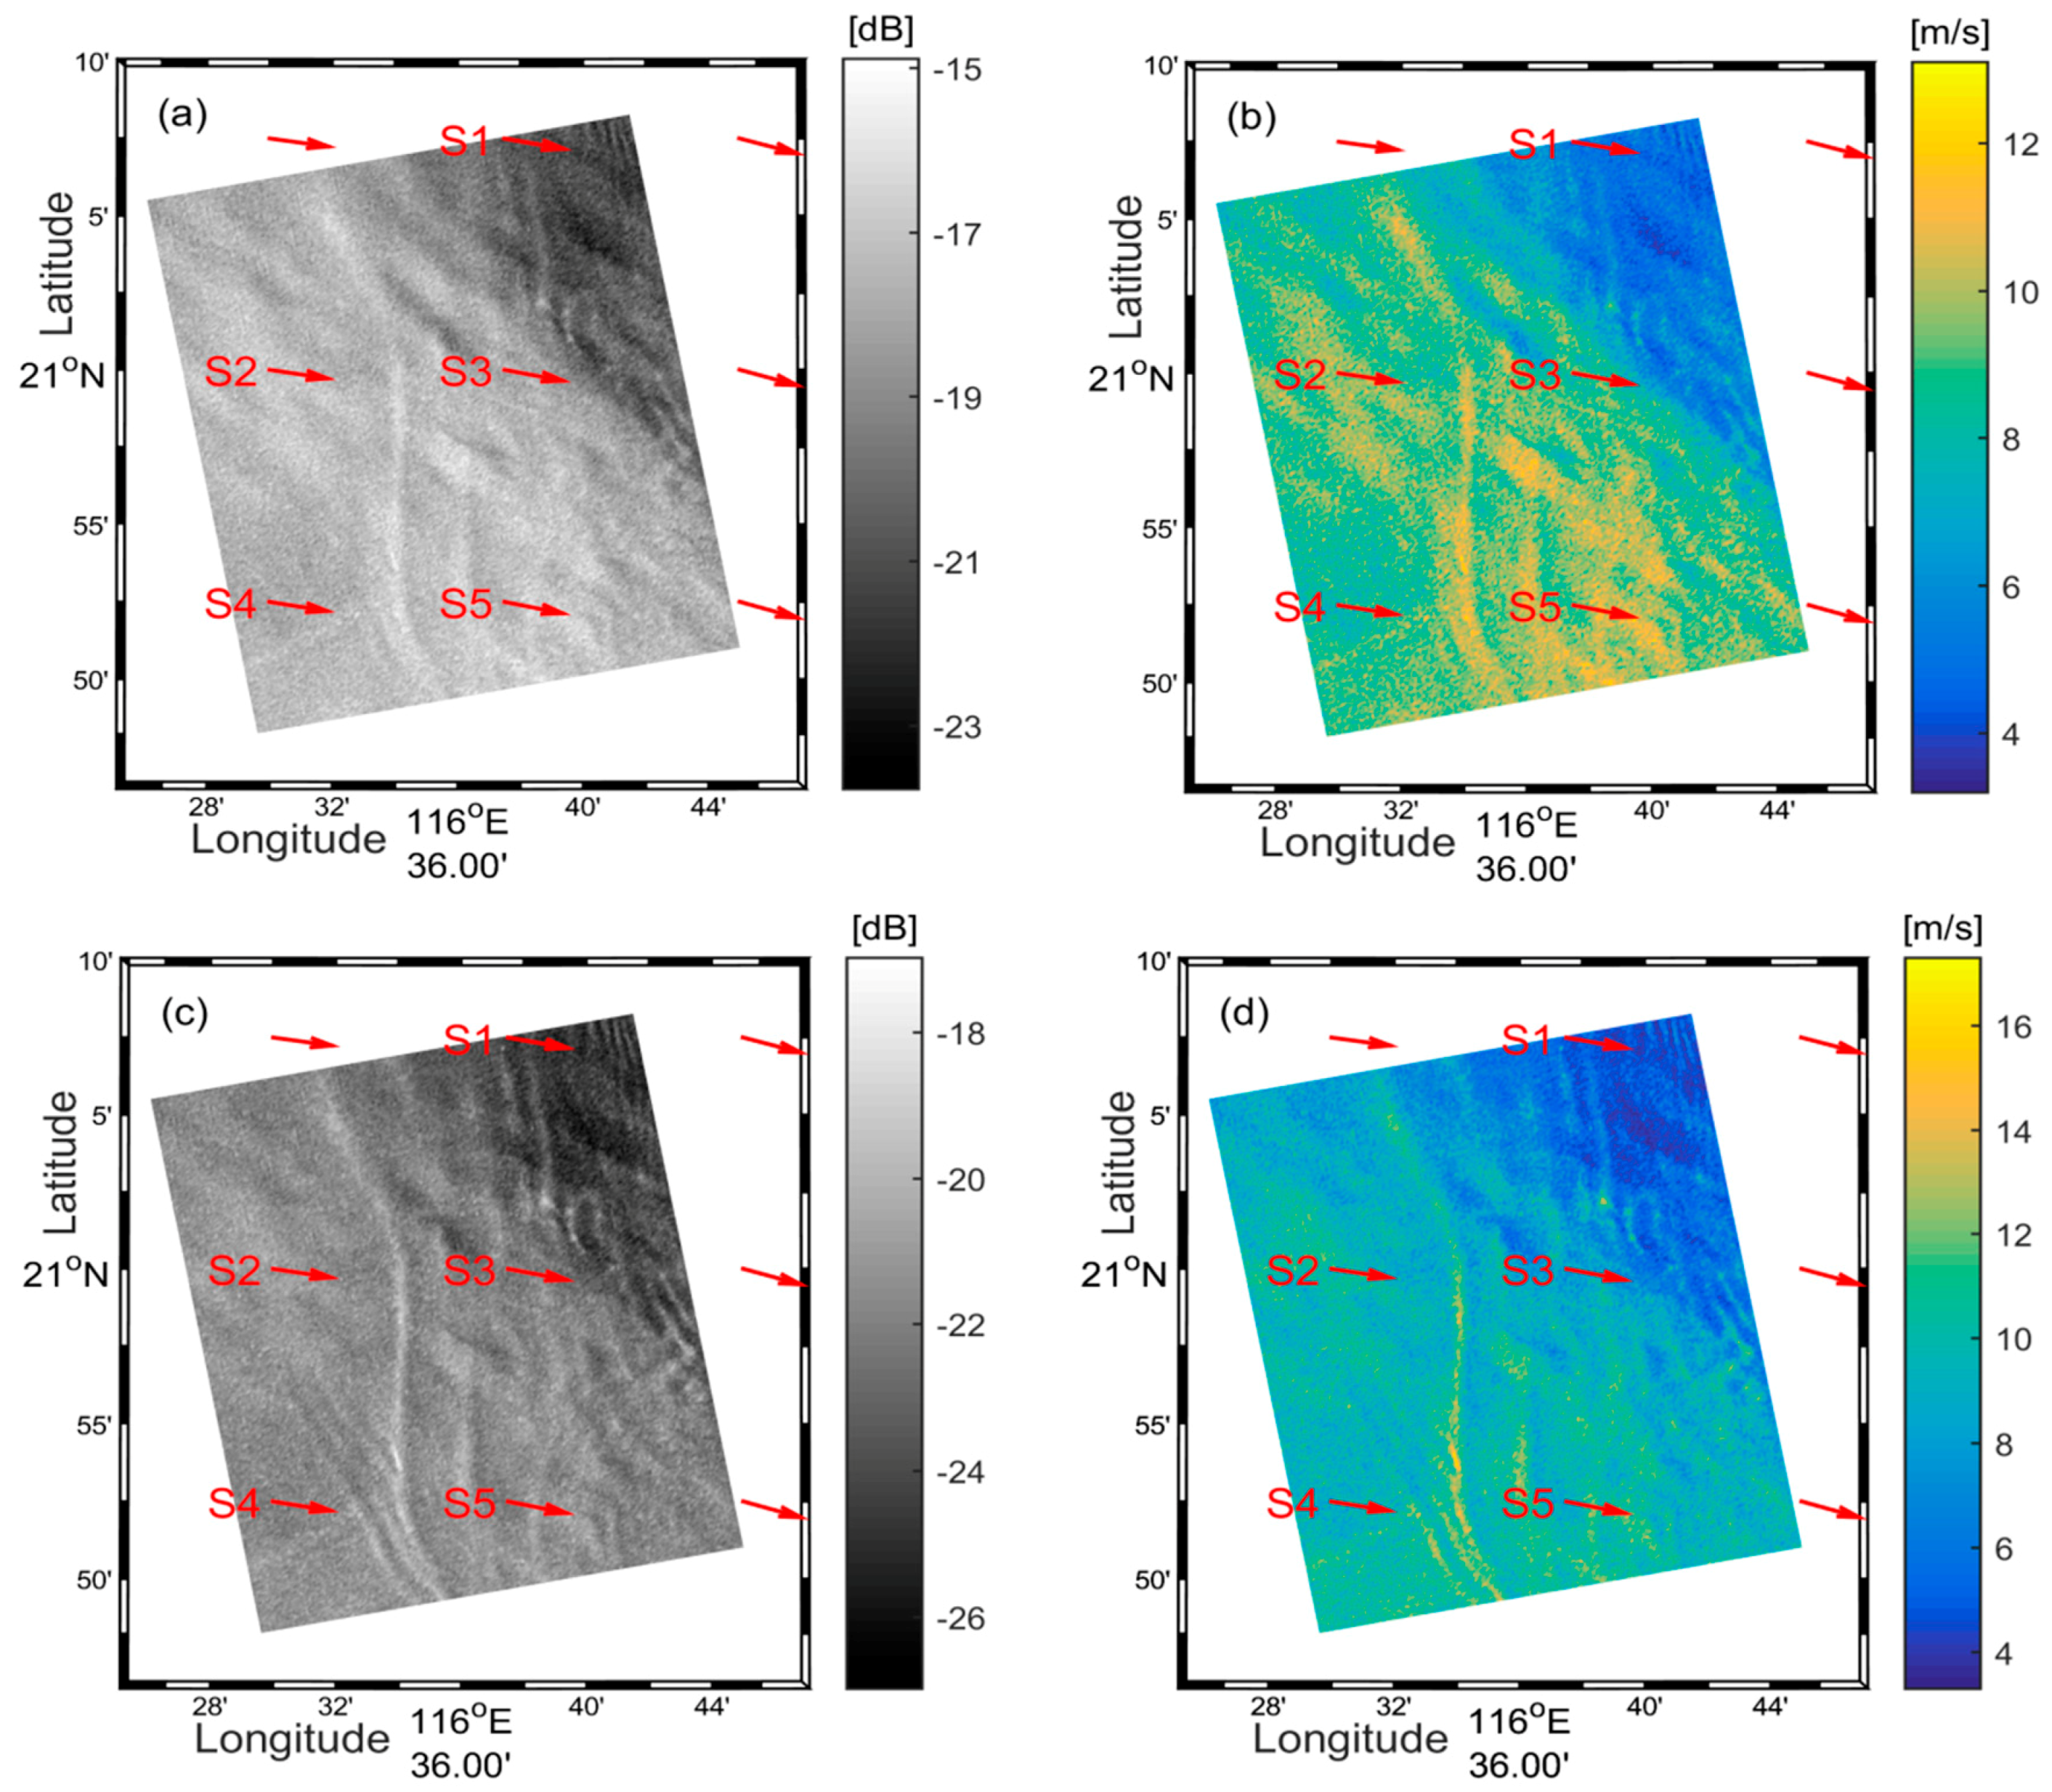
In the following discussion, we apply the above-mentioned quad-polarized SAR OSWS retrieval algorithm to one case and we describe the calculation process in detail. This case is a RS-2 fine quad-polarized SLC SAR image acquired on 27 August 2012, at 10:25:24 UTC. First, we reconstruct the spatial resolution at 100 m and extract the corresponding NRCS and incidence angle from each pixel at each polarization. Next, we compute how many ERA-Interim grid cells fall within the SAR scene and then we interpolate the NRCSs and incidence angles at the coordinates for each grid cell. With this calculation, the example shown in Figure 5 has 5 grid cells, indicated by numbers S1 to S5, which fall within this SAR scene. For the cross-polarized channel, the procedure to retrieve OSWSs from the C-2PO models is relatively simple because they are only related to VH- and HV-polarized NRCS values. Figure 5 shows the SAR-retrieved wind speeds from VH- and HV-polarized image, and the corresponding NRCS distribution, on a 100-m resolution scale, without need for radar incidence angle or any external wind-direction inputs. Wind speed retrieval results can be seen in Table 1.
For co-polarized data, we first extract the external wind directions from ERA-Interim reanalysis data on 27 August 2012, at 10:00:00 UTC. Specifically, the NRCS values of the HH-polarized data need to be converted by the PR model before being input to the CMOD4 GMF. In this case, the radar incidence angles are in the range from 41.04° to 42.42° and thus, the PR value can be directly computed from Equation (4) at coordinates S1 to S5. Figure 6 shows the SAR-retrieved wind speeds from VV- and HH-polarized image, and the corresponding NRCS distribution. Based on the above parameters, wind speeds in the VV- and HH-polarized data can be calculated from CMOD4 and the results can be seen in Table 1.
3.2. OSWS Retrieval Using Training Database
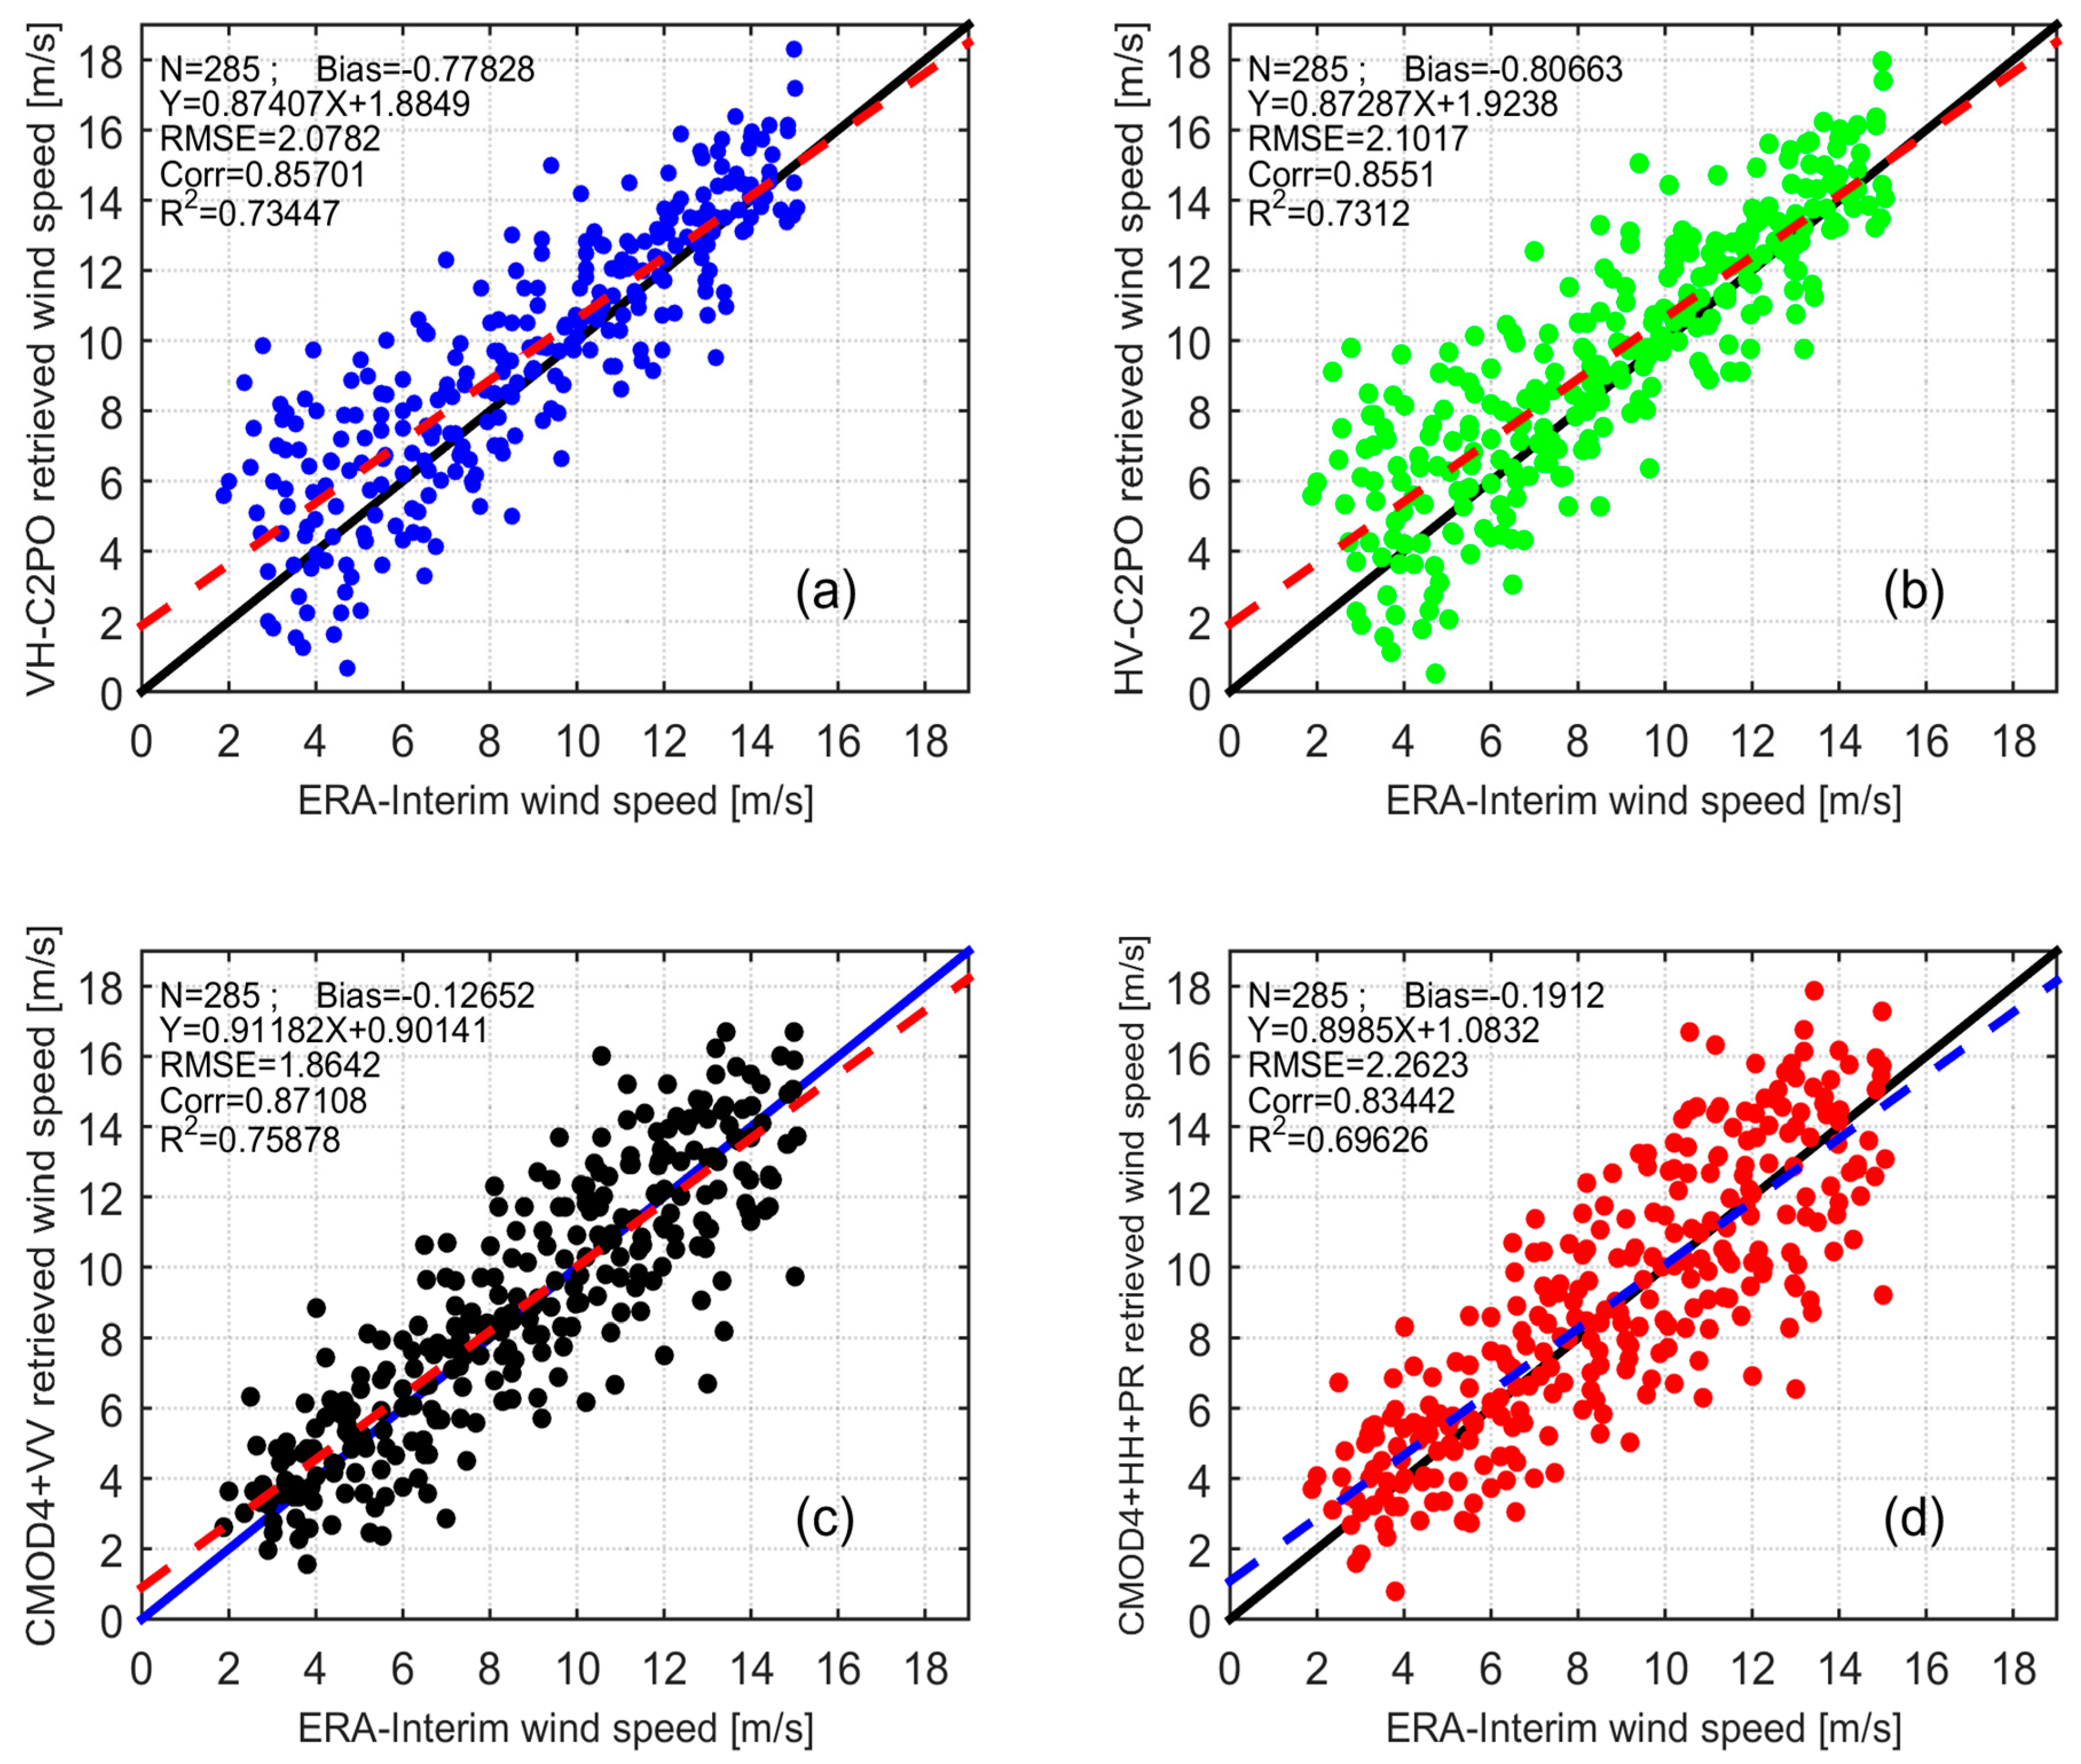
The comparison results for OSWS are computed for each ERA-Interim grid cell at each polarization using the training database. The overall training data are included in Figure 7, which compares the results between SAR-retrieved winds and in situ ERA-Interim winds. As can be seen, winds from all of the OSWS retrieval models exhibit a good agreement with ERA-Interim reanalysis winds at both validations sites. The RMSEs of SAR-retrieved wind speeds are all below 2.5 m/s: 2.11 m/s (VH-polarized), 2.13 m/s (HV-polarized), 1.86 m/s (VV-polarized) and 2.26 m/s (HH-polarized) and the correlation coefficients are 0.86 (VH-polarized), 0.85 (HV-polarized), 0.87 (VV-polarized) and 0.83 (HH-polarized) which are statistically significant at the 99.9% significance level, respectively. For VH- and HV-C2PO retrieval results (Figure 7a,b), the scatter plot and RMSE results are quite similar because the NRCS values in these two polarizations are quite similar. In fact, because of the monostatic property of the RADARSAT-2 SAR and the reciprocity theorem, the VH-polarized component is equal to the HV-polarized component of the Polarimetric Scattering Matrix (PSM), specifically . Moreover, the NRCSs in the C-2PO model are calculated from the dual-channel intensity information of the cross-polarized SAR images and thus, . This also means that the wind speed retrieval results from the C-2PO model for VH- and HV-polarized modes are consistent. Therefore, in the next section, we only focus on VH-polarized OSWS retrieval in cross-polarized SAR data.
In terms of OSWS retrieval from co-polarized SAR data, the VV-polarized retrieved wind speed significantly outperforms the HH-retrieved winds, as the former produces a smaller RMSE value of 1.86 m/s and correlation coefficient of 0.87 m/s, which is statistically significant at the 99.9% significance level. In addition, the RMSE value of the HH-retrieved wind speed is much larger than that reported in previous studies [20]. This fact indicates that the SAR OSWSs retrieved at these locations in the Northwest Pacific are slightly inaccurate. The most important factor in this process is the PR model. Theoretically, the most accurate PR model is that which can convert values to exact values. The empirical PR model that we selected in this study is empirically fit to 877 RS-2 observed PR values and incidence angles off the East and West Coasts of USA and the Gulf of Mexico, while the study area in this work is the Northwest Pacific near China. Another factor to consider is that the reference wind speed data in previous studies [20] are from National Data Buoy Center (NDBC) buoys whereas our reference wind speeds are from ERA-Interim reanalysis wind data. To sum up, for co-polarized channel, whether VV-polarized or HH-polarized, both can use CMOD4 GMF to calculate OSWS from the SAR images. Therefore, in order to obtain better accuracy for OSWS retrieval results, for co-polarized SAR data, we recommend retrieving OSWS using VV-polarized data. Additional discussion is given in the next section.
3.3. Different between C-2PO and CMOD4 GMF OSWS Retrievals
In previous studies, Vachon et al. [23] used ‘their C-2PO model’ to compute OSWSs using the VH- and HV-polarized channels to achieve a good agreement with wind data from NDBC buoys. However, these good results benefit from relatively high wind speed observations, to a certain degree. Similarly, Zhang et al. [24] retrieved OSWS from their C-2PO function and then compared their results with NDBC buoy measurements. The retrieved wind speeds have essentially no bias (0.04 m/s) with an RMSE of 1.39 m/s. Nevertheless, the OSWS values less than about 6 m/s are excluded in this retrieval experiment. Thus, the C-2PO model using cross-polarized data seems to be not suitable for low wind speeds but performs relatively well at moderate-to-high wind speeds. Thus far in this study, we have assumed that 8 m/s is the wind speeds threshold according to the training dataset. Based on this assumption, we retrieved OSWSs from C-2PO model for OSWSs greater than 8 m/s; and from CMOD4 GMF for OSWSs less than or equal to 8 m/s. Results show that the RMSEs of the SAR-retrieved OSWSs are 2.53 m/s in the former case using VH-C2PO and 1.61 m/s in the latter case using CMOD4-VV, when winds are less than or equal to 8 m/s. Similarly, the RMSEs of the SAR-retrieved OSWSs are 1.86 m/s (VH-C2PO) in the former case and 2.31 m/s (CMOD4+VV) in the latter case, when winds are less than or equal 8 m/s.
4. Discussion
4.1. A Hybrid OSWS Retrieval Algorithm Using Quad-Polarized RS-2 SAR Data
4.1.1. Methodology for Precise OSWS Threshold Based on the Training Dataset
The preliminary, estimated OSWS threshold (8 m/s) in the above discussion was selected as an empirical or test value. However, to better understand the appropriate scope of applications for C-2PO and CMOD4 GMF, an accurate OSWS threshold value is essential. In the next section, we put forward a method to find the best threshold, from the perspective of a quantitative analysis of the training dataset. The procedure is as follows:
- (1)
- Create three one-dimensional arrays of wind speeds (OSWS): ERA-Interim, retrieved from C-2PO and retrieved from CMOD4. These three arrays have the same number of elements and one-to-one correspondence to the ERA-Interim OSWS.
- (2)
- Calculate the maximum, minimum and length of the ERA-Interim array and denote as max_ERA, min_ERA and n, respectively;
- (3)
- Set up OSWS threshold array from min_ERA to max_ERA in steps of 0.05 and with m as the length of these arrays.
- (4)
- Design a double loop program. The outer loop variable is j from 1 to m and the inner loop variable is i from 1 to n;
- (5)
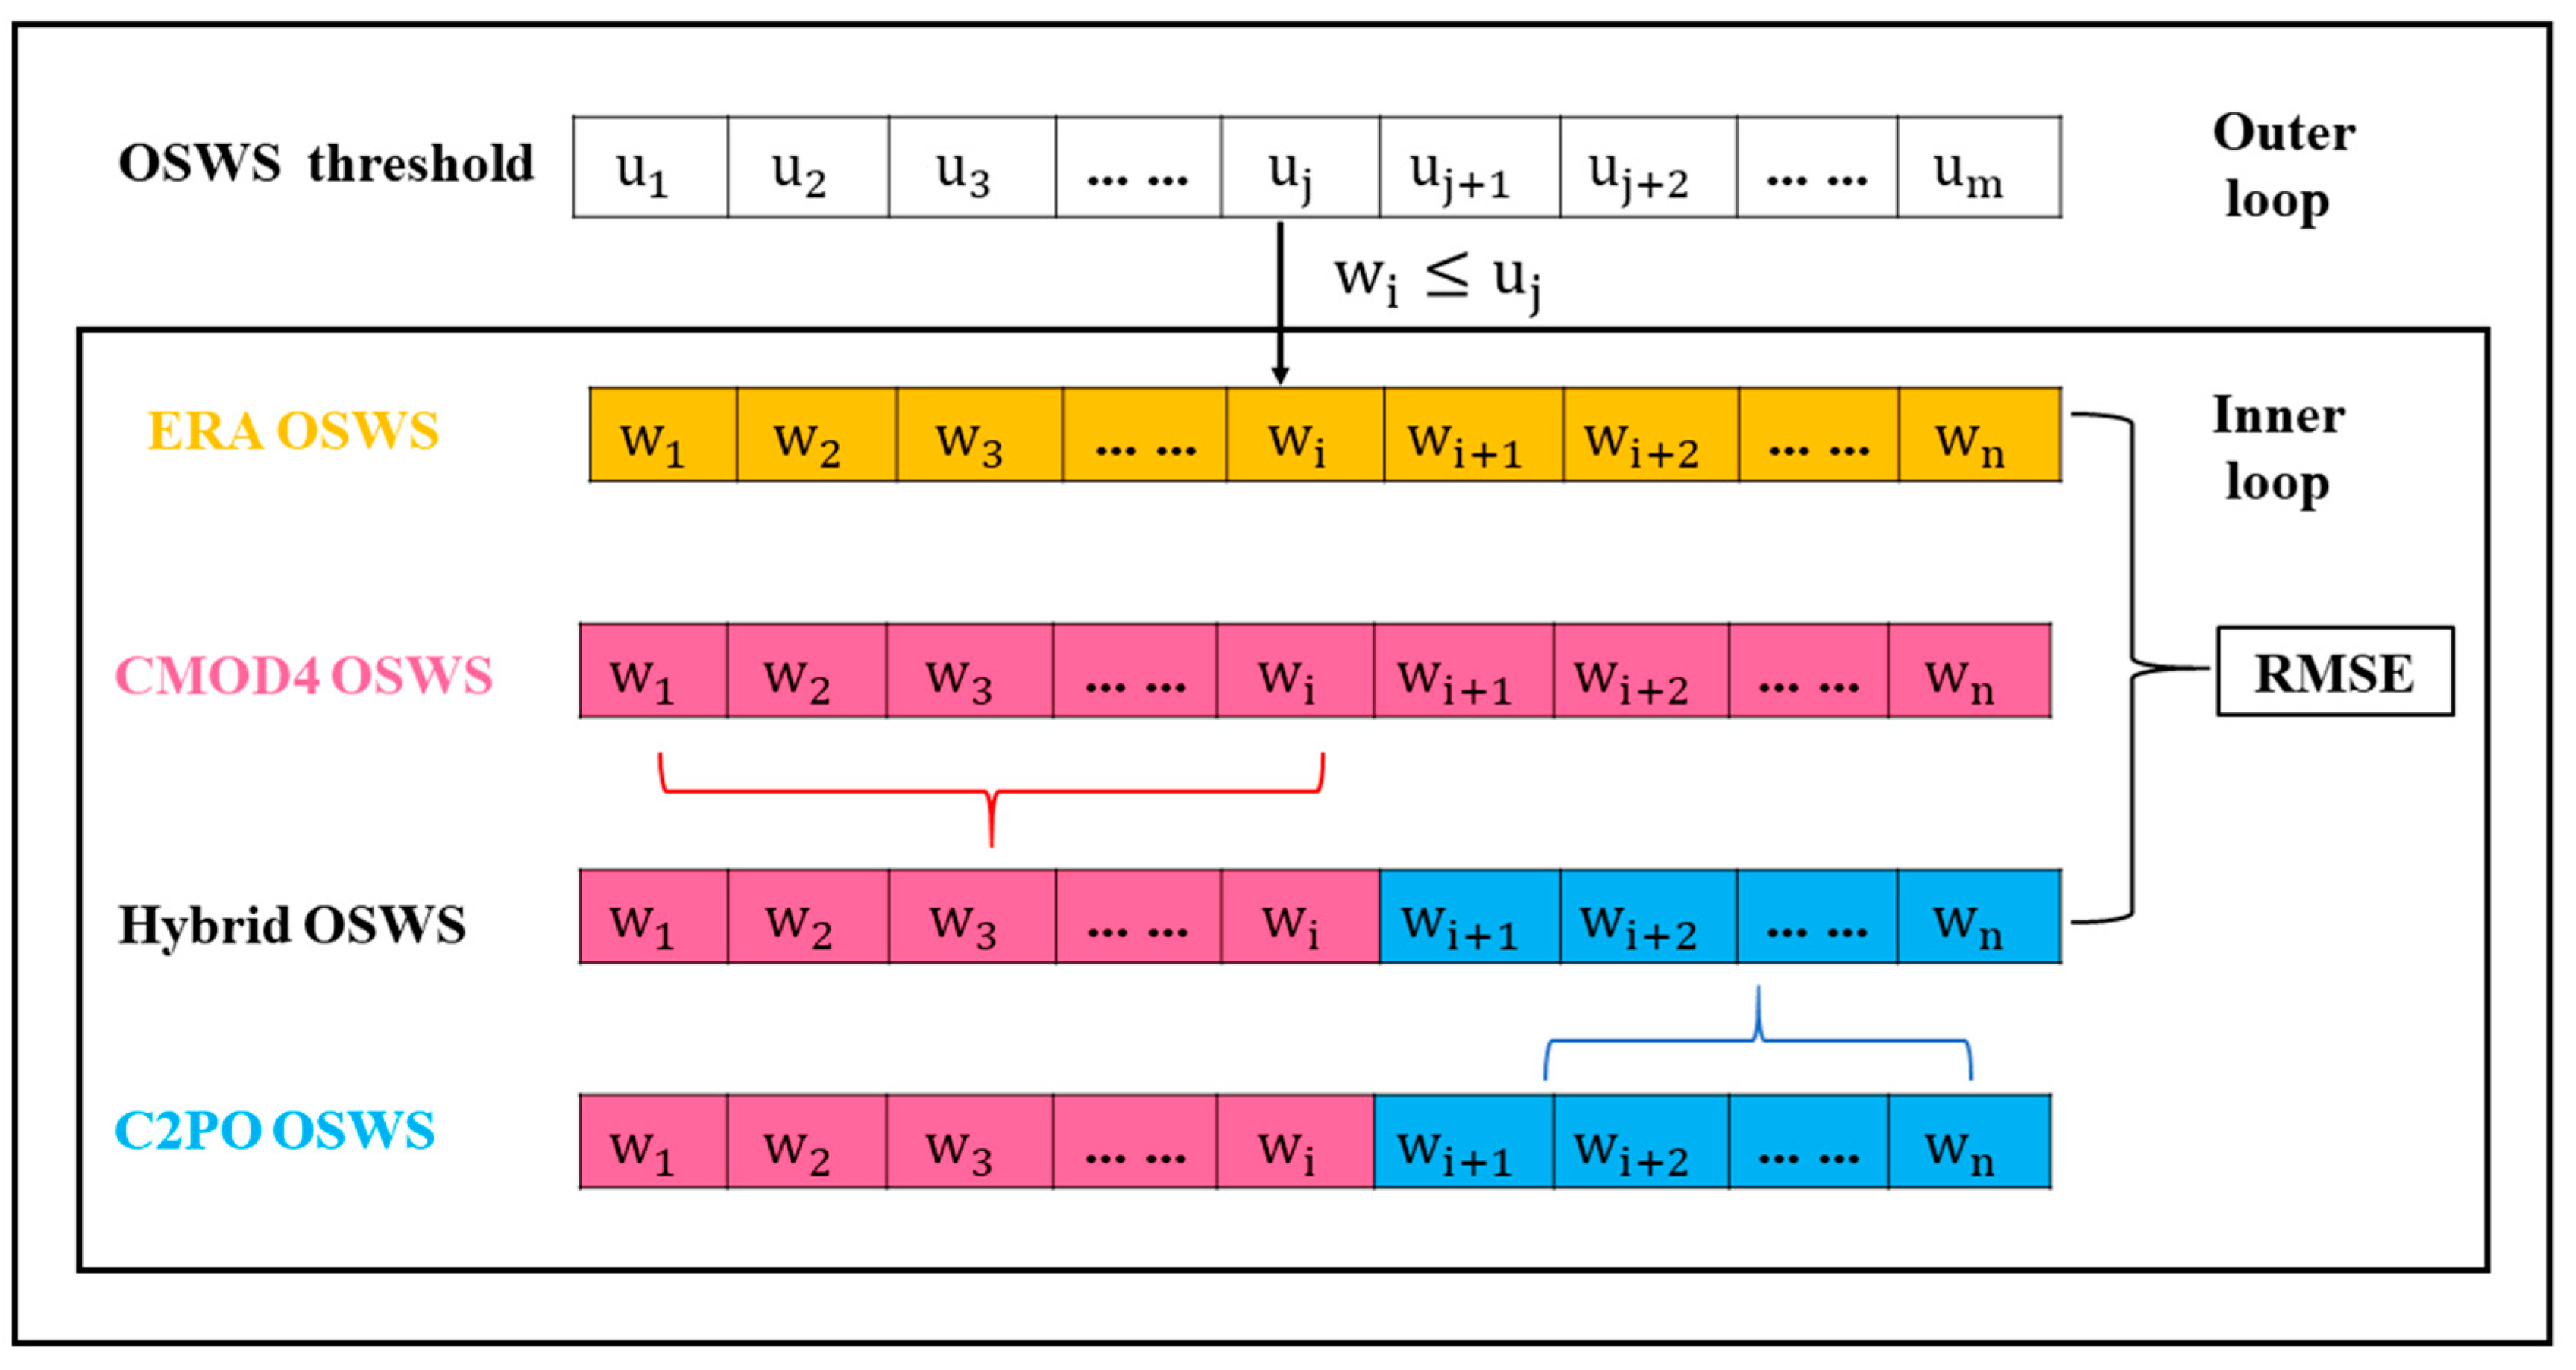
- In the outer loop, the OSWS threshold value ranges from min_ERA to max_ERA in steps of 0.05 m/s. In the inner loop, we compute a new one-dimensional array when the threshold is a constant, called the hybrid OSWS array, depending on the follow rule: we select CMOD4 retrieved OSWS when ERA-Interim OSWS less than or equal to the reference OSWS; otherwise, we select the C-2PO retrieved OSWS, when ERA-Interim OSWS greater than the reference array; then, compute RMSEs between ERA-Interim OSWS and the hybrid OSWS array.
- (6)
- Find the position of the minimum RMSE value. The reference array element corresponding to this position is the best threshold value. Figure 8 shows a sketch of this method.
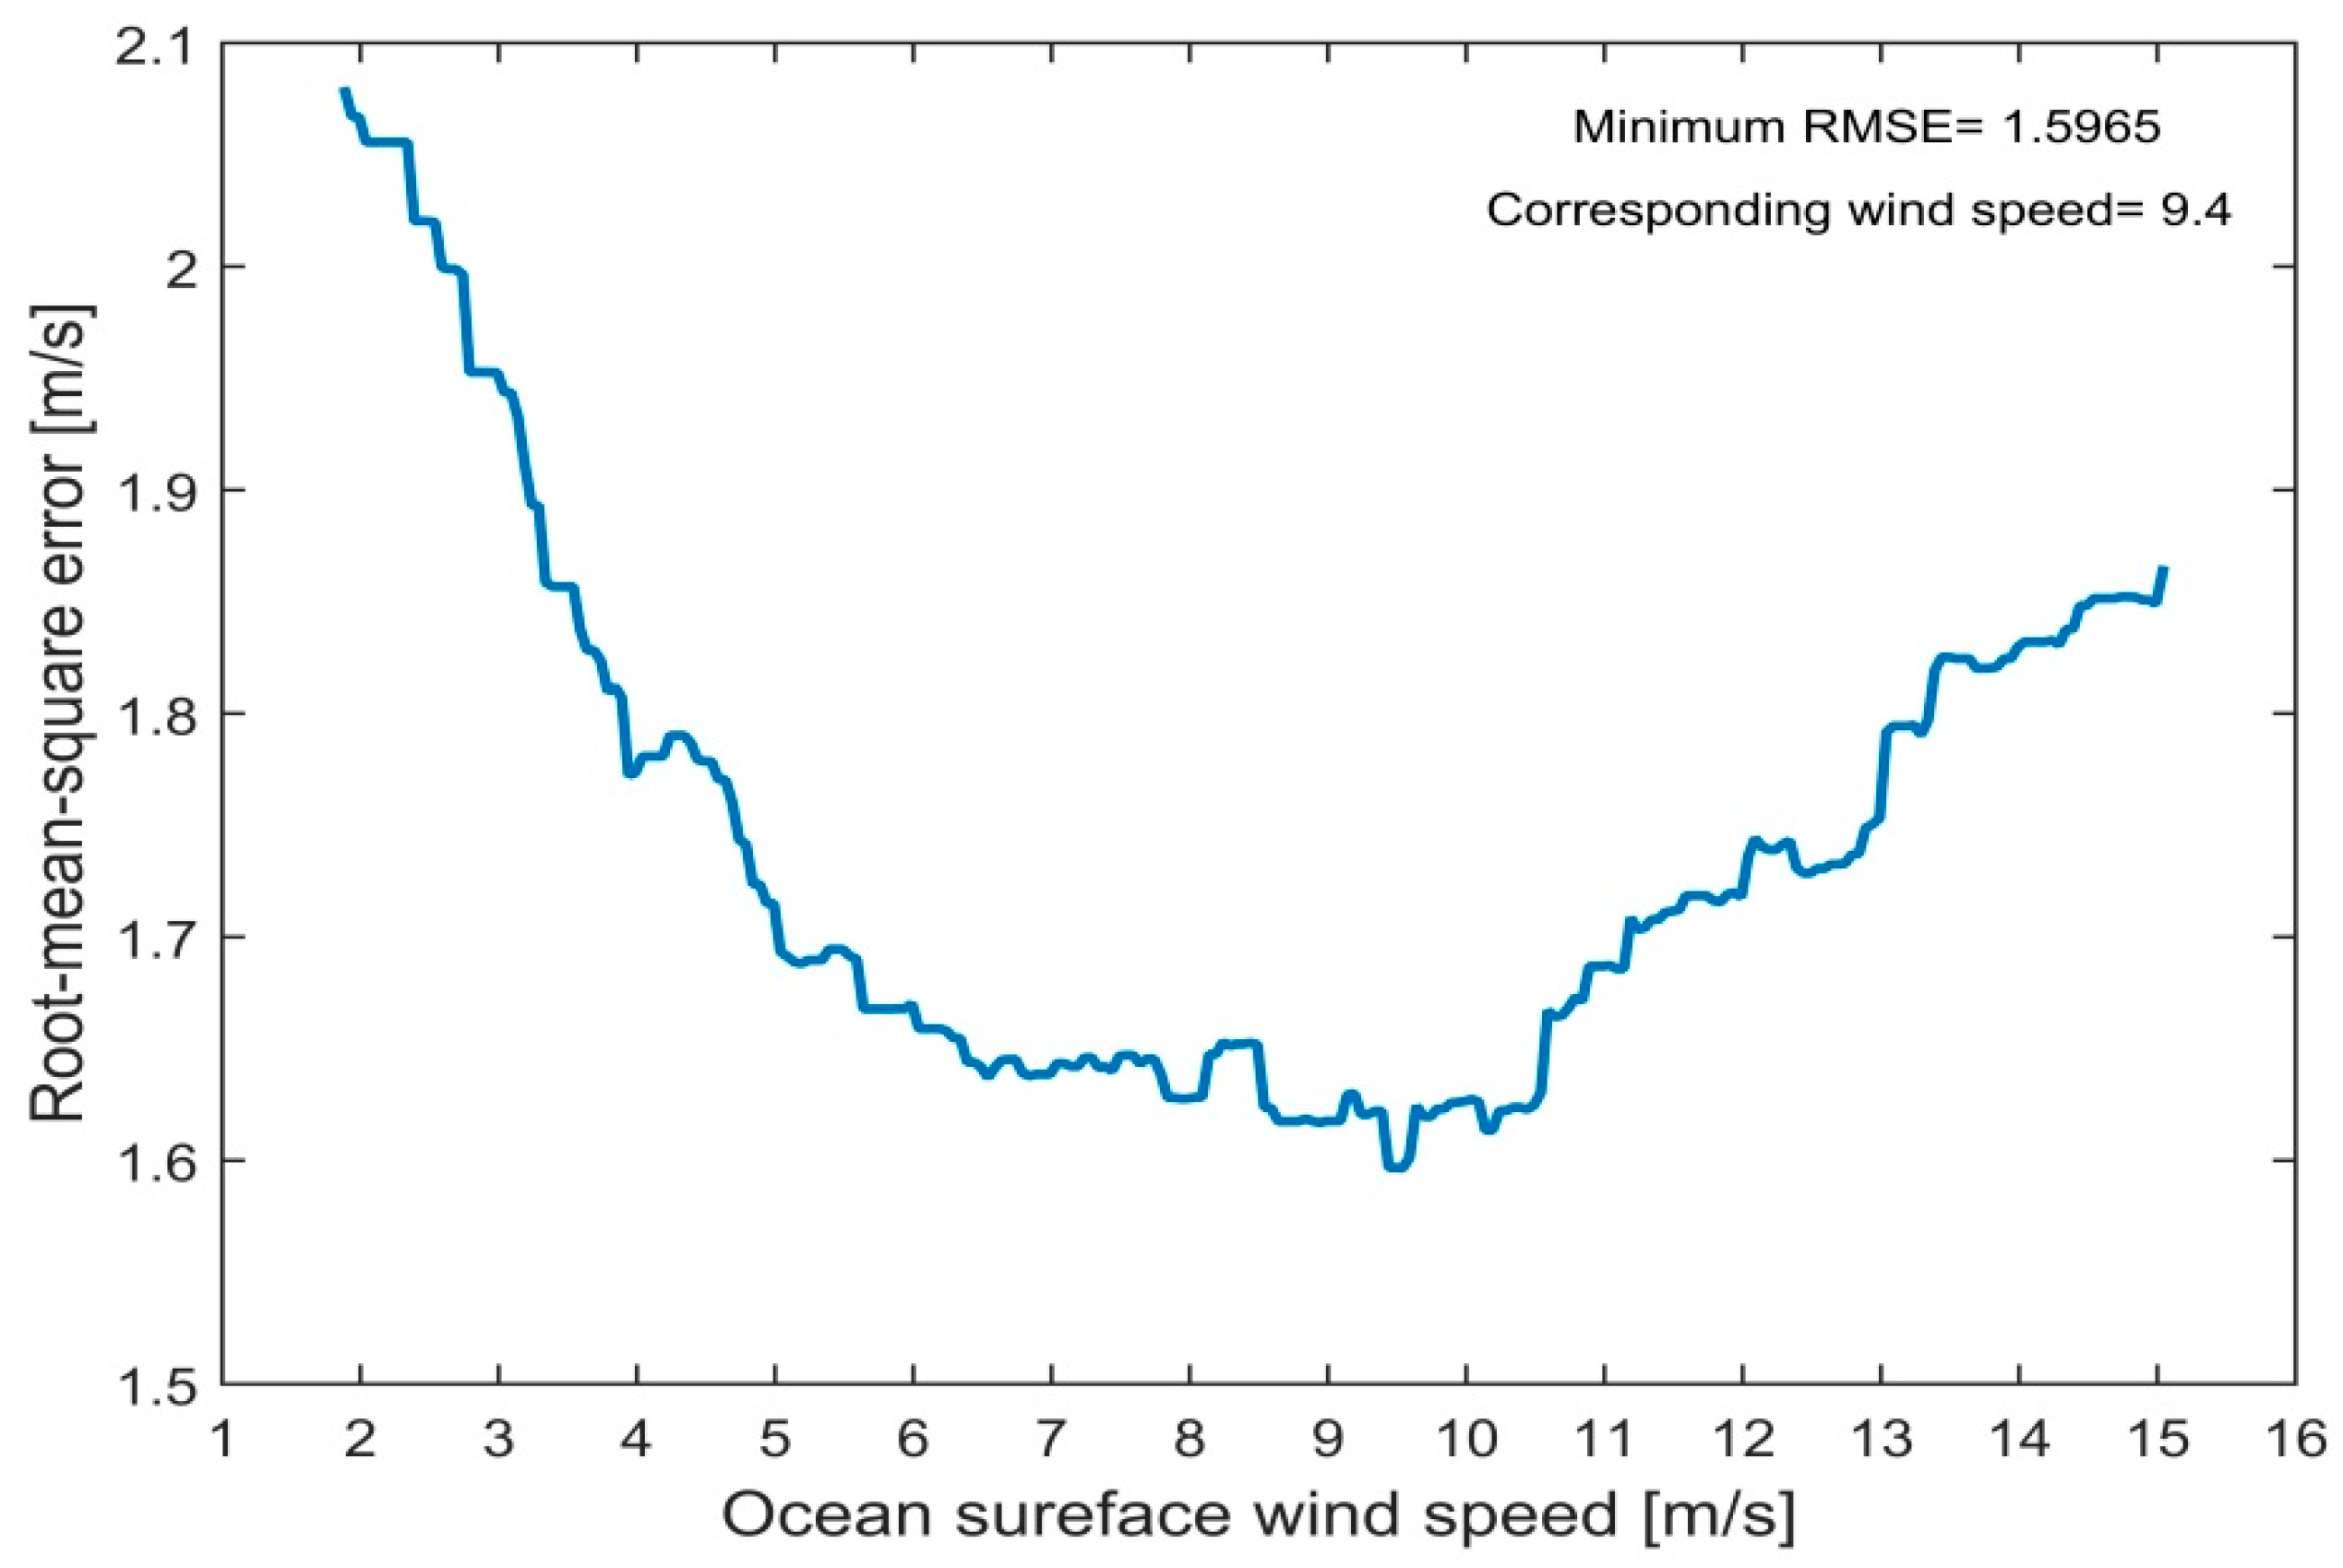
Next, we calculate the most appropriate OSWS threshold value using the above method, based on our training dataset. Figure 9 shows the variation in RMSE between the ERA-Interim OSWS array and the hybrid OSWS array. In addition, when the loop variable is equal to 1, the hybrid OSWS array is the C2PO-retrieved OSWS array with RMSE of 2.07 m/s. Similarly, when the loop variable is equal to 285, the hybrid array is the CMOD4-retrieved OSWS array with RMSE of 1.86 m/s. These results are in complete conformity to Figure 7a,c. Finally, from Figure 9, we can estimate that the RMSE reaches a minimum of 1.59 m/s when the loop variable equals 156. The corresponding wind speed element is 9.4 m/s. Therefore, the most appropriate OSWS threshold value is 9.4 m/s based on our training dataset.
4.1.2. Establishment and Validation of the Hybrid OSWS Retrieval Model
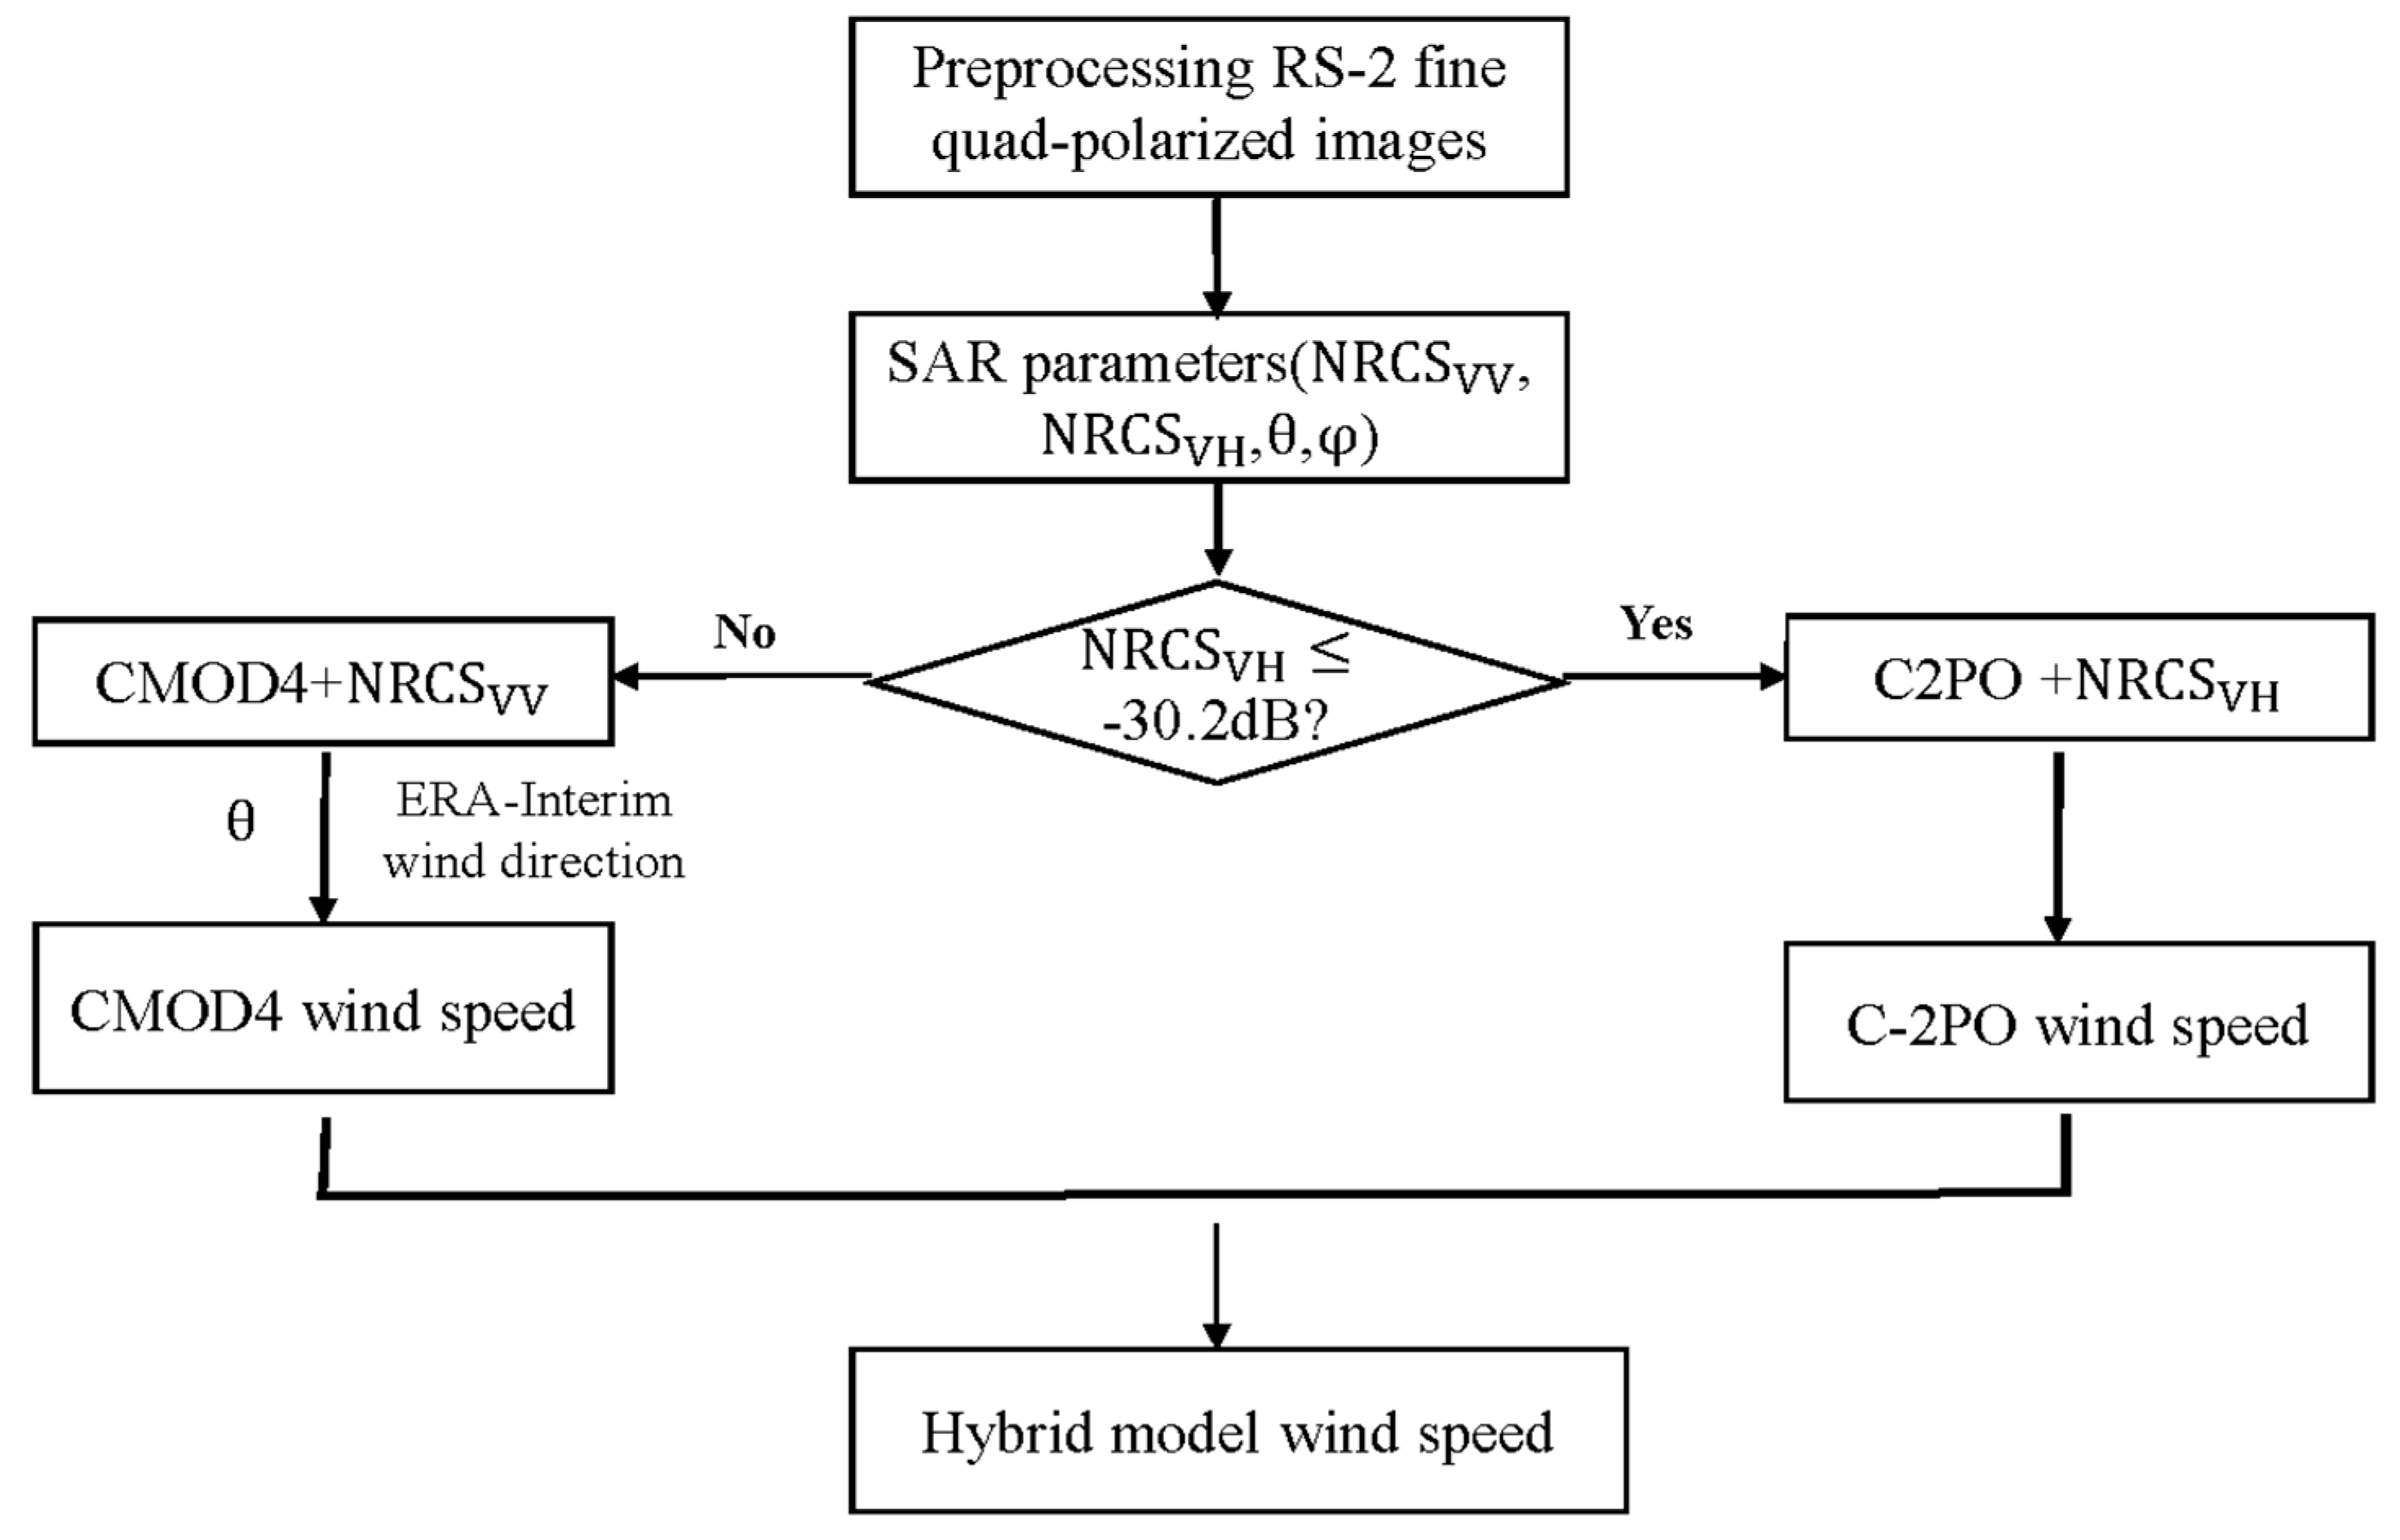
According to the analysis presented previously, we computed the most appropriate OSWS threshold (9.4 m/s) based on our training dataset. It is important to note that the C-2PO model provides a relationship between the VH-polarized NRCS and OSWS which can be simplified as an empirical linear equation. Thus, we can use the values as a discriminant, meaning that when the OSWS is less than or equal to 9.4 m/s (corresponding is −30.2 dB), we select CMOD4+VV as our OSWSs retrieval model. By contrast, when the wind speeds are higher than 9.4 m/s, we use VH-C2PO as our OSWSs retrieval algorithm. Figure 10 shows the flowchart for the new hybrid wind speed retrieval method.
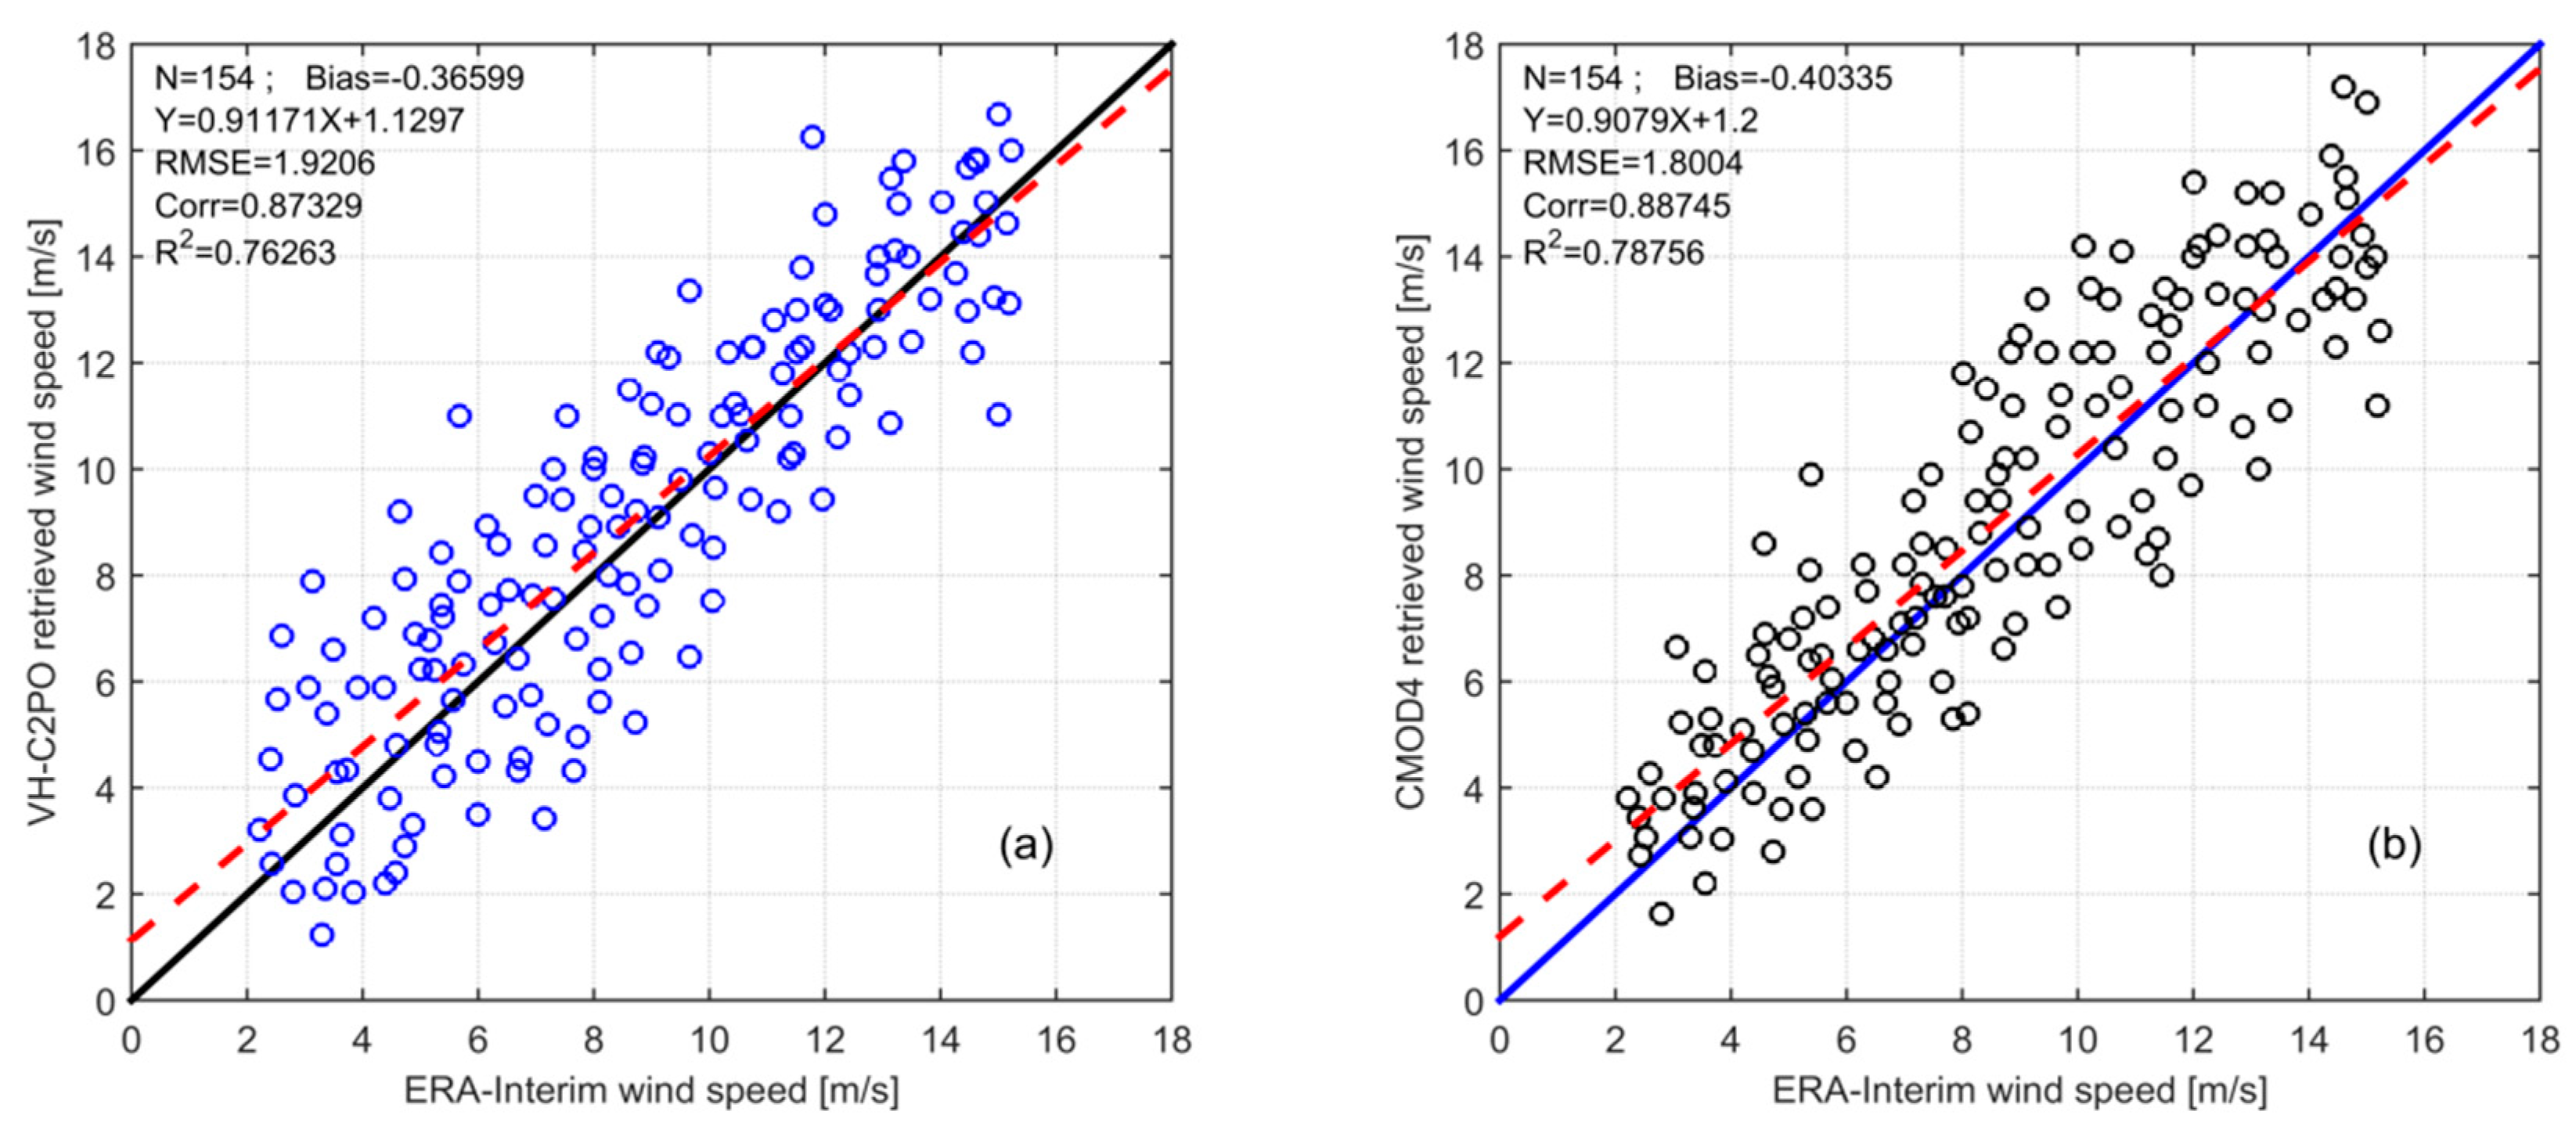
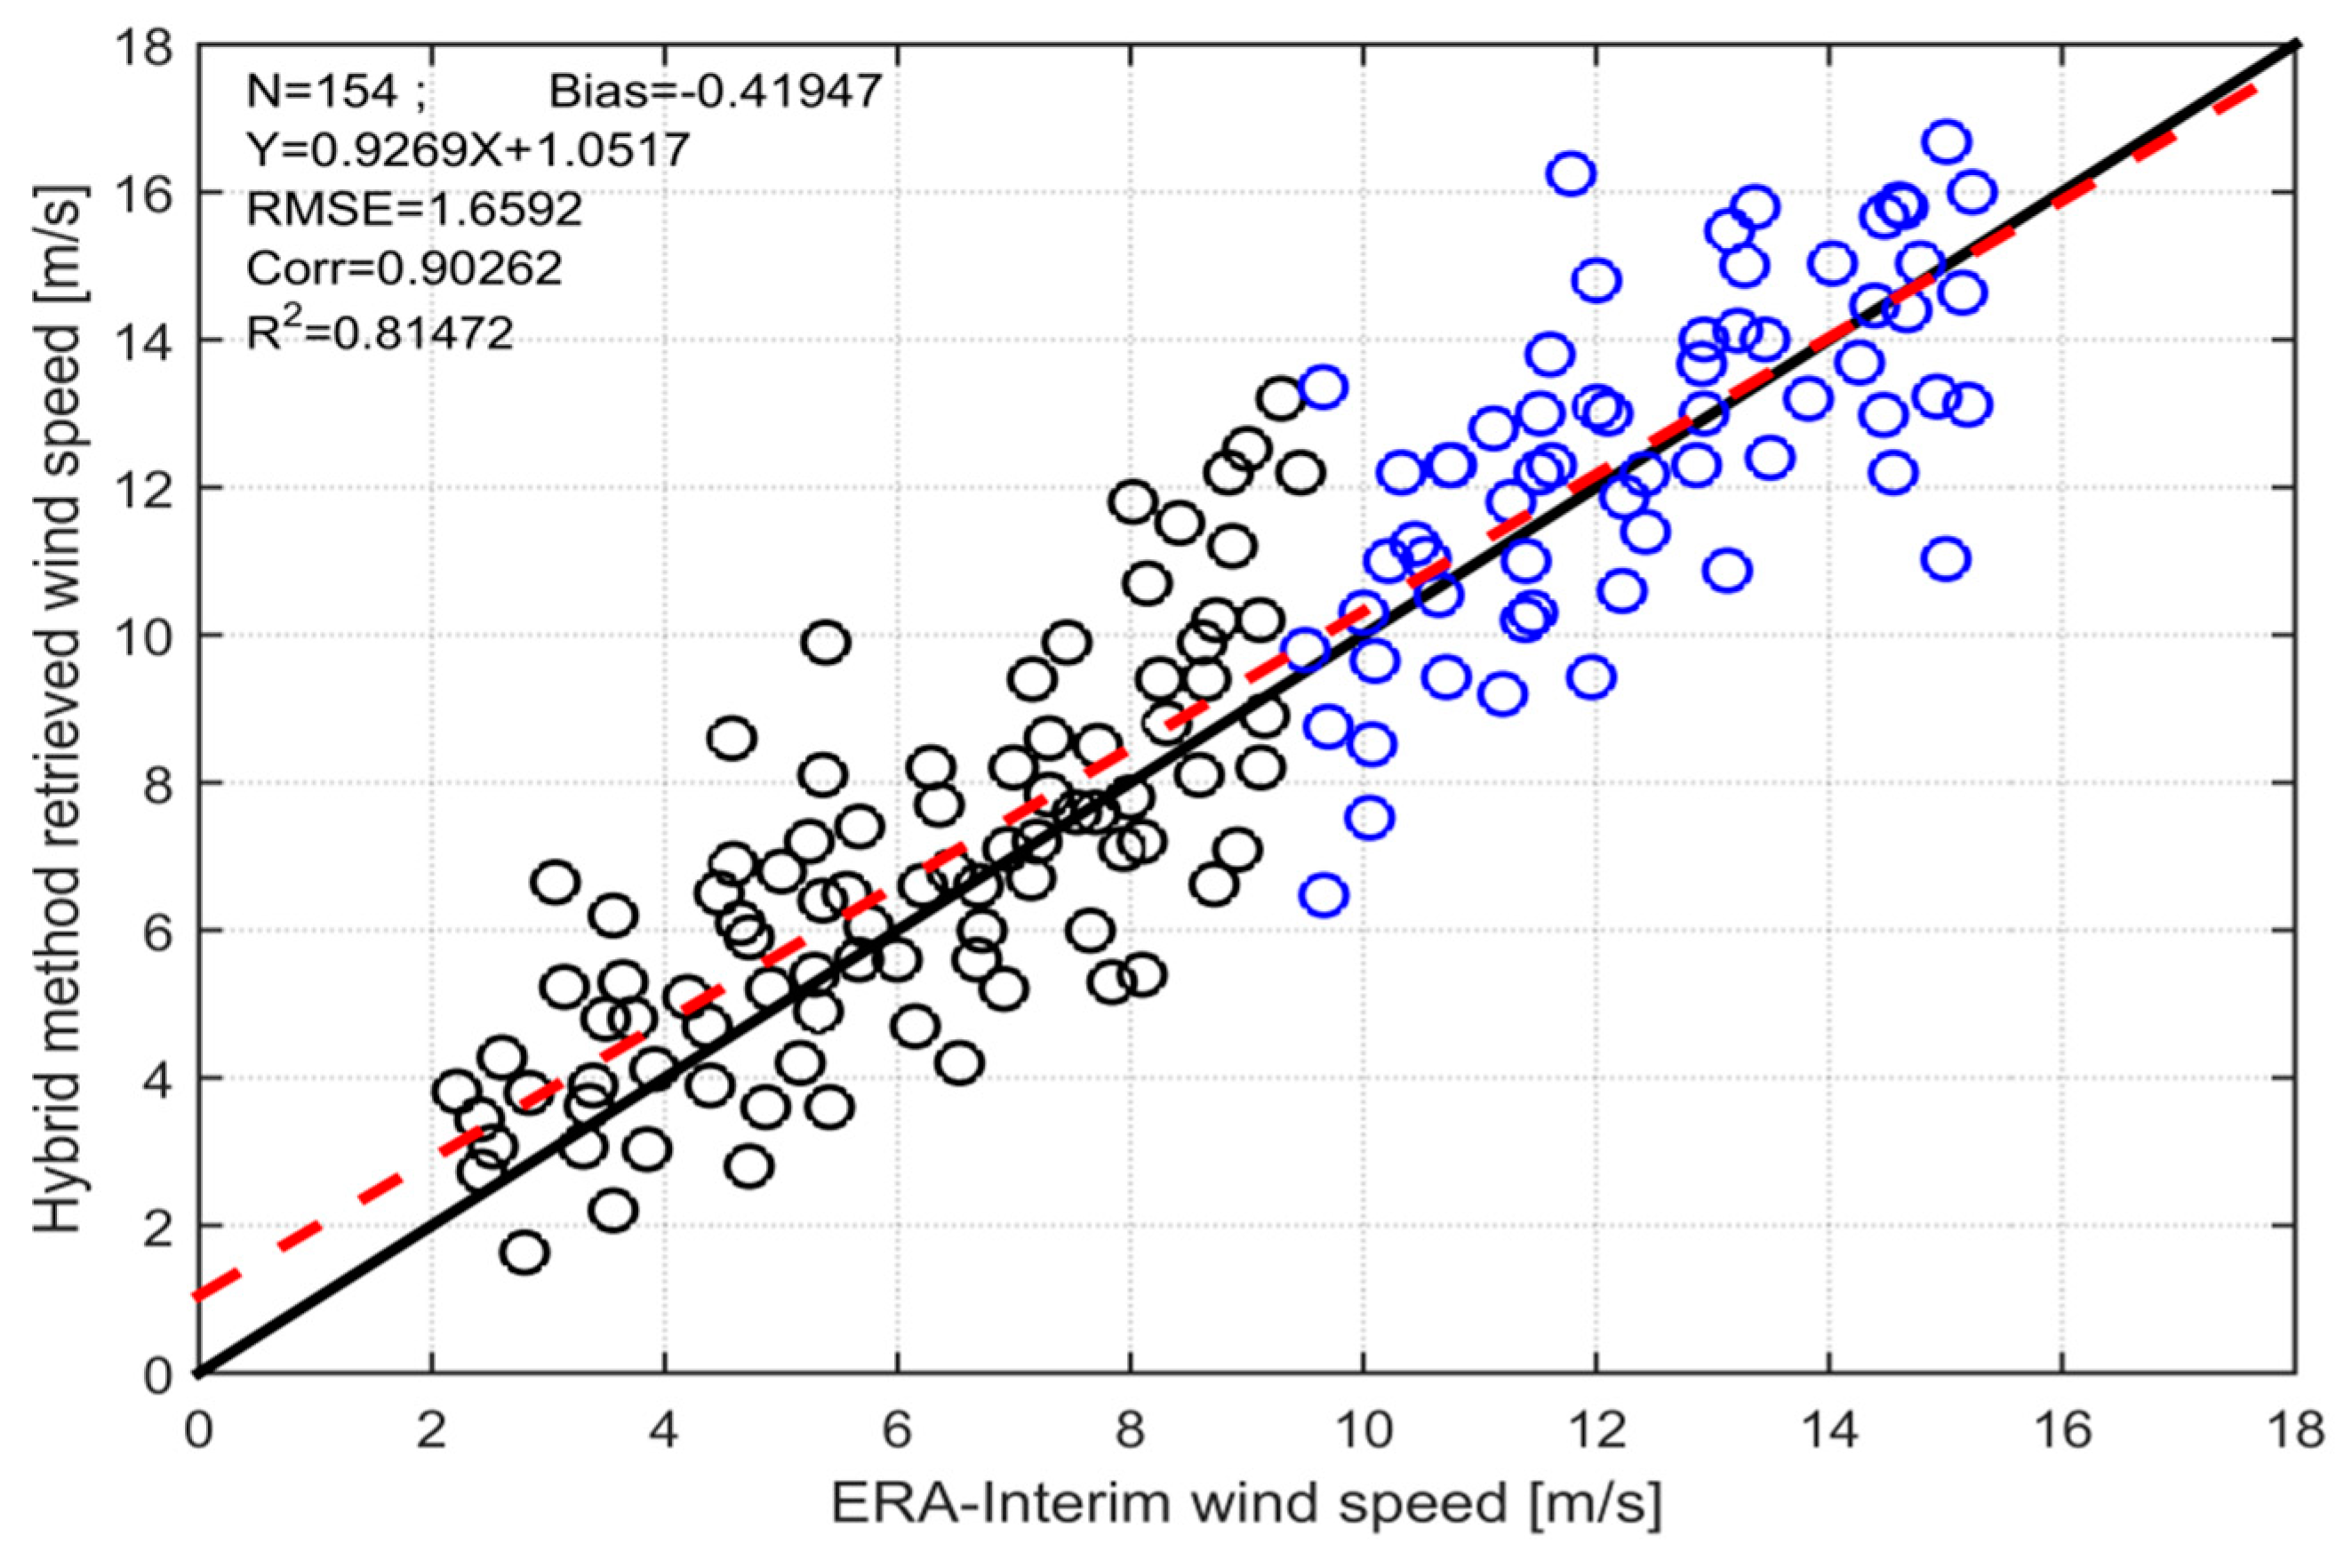
In the next test, we first use VH-C2PO and CMOD4+VV models to retrieve OSWSs based on our empirical test database. The results are shown in Figure 11. Subsequently, the wind speeds retrieved from our hybrid model using the same data are shown in Figure 12. The RMSEs of the SAR-retrieved wind speeds are 1.92 m/s (VH-C2PO), 1.80 m/s (CMOD4+VV) and 1.66 m/s (Hybrid model), respectively. Clearly, our hybrid OSWS model has the smallest RMSE and thus it can be considered to be most suitable for wind speed retrievals at winds within the range from 1 to 16 m/s.
4.2. Error Analysis of OSWS Retrieved Using C-2PO Model at Low-to-Moderate Winds
For low-to-moderate winds, OSWSs retrieved from the C-2PO model for VH- and HV-polarized data have a relatively large RMSE which indicates that this model has a relatively poor retrieval performance. However, SAR systems are quite complicated and thus the OSWS retrievals from SAR images can depend on a number of factors. In this section, on the basis of the underlying mechanisms for the SAR imagery, we propose three possible reasons to explain why the C-2PO model based on cross-polarized data might have a poor performance for the retrieval of low-to-moderate winds.
4.2.1. Effect of Modeling the Data from C-2PO
Based on 546 RS-2 fine quad-polarized mode SAR images and in situ weather buoys maintained by Environment Climate Change Canada (ECCC) and Fisheries and Oceans Canada (DFO) off the east and west coasts of Canada, Vachon and Wolf [23] first proposed a new C-band cross-polarized empirical model. This model, as yet unnamed, suggested that the relationship between NRCS and OSWS is independent of wind direction and incidence angle and that there is no saturation effect at high wind speeds and that it can directly retrieve OSWS. Note that the data source for the establishment of this model is from higher wind speed observations which simplifies wind speed retrieval from SAR imagery for sufficiently high wind speeds.
Within the following year, independent of Vachon’s work, Zhang and Perrie [24] developed a C-band cross-polarization ocean model, which they denoted as C-2PO, using the RS-2 fine quad-polarized mode SAR measurements for high (>20 m/s) wind retrievals. Zhang and Perrie selected 534 RS-2 SAR images collocated with NDBC buoy measurements under different sea states and retrieved wind speeds from C-2PO model. The retrieved wind speeds have essentially no bias (0.04 m/s) with an RMS error of 1.39 m/s. However, these good results exclude the wind speeds less than about 6 m/s. Thus, from the point of the modeling, the C-2PO model may not be suitable for low wind speed retrievals from SAR images.
4.2.2. Effect of the Noise Level
For the low wind speed retrieved from SAR data, VV-polarized CMOD4 GMF performs better than the VH-polarized C-2PO model. The reasons are related to noise level are as follows: (1) the noise level (floor) is the same value at VV- and VH-polarized mode in the same pixels, (2) VV-polarized NRCS values are much stronger than the VH-polarized NRCS values under the same wind conditions and (3) VH-polarized NRCS values are close to the noise level whereas VV-polarized NRCS values are much larger that the noise level and thus the VH-polarized NRCS values are sometimes annihilated by the noise level.
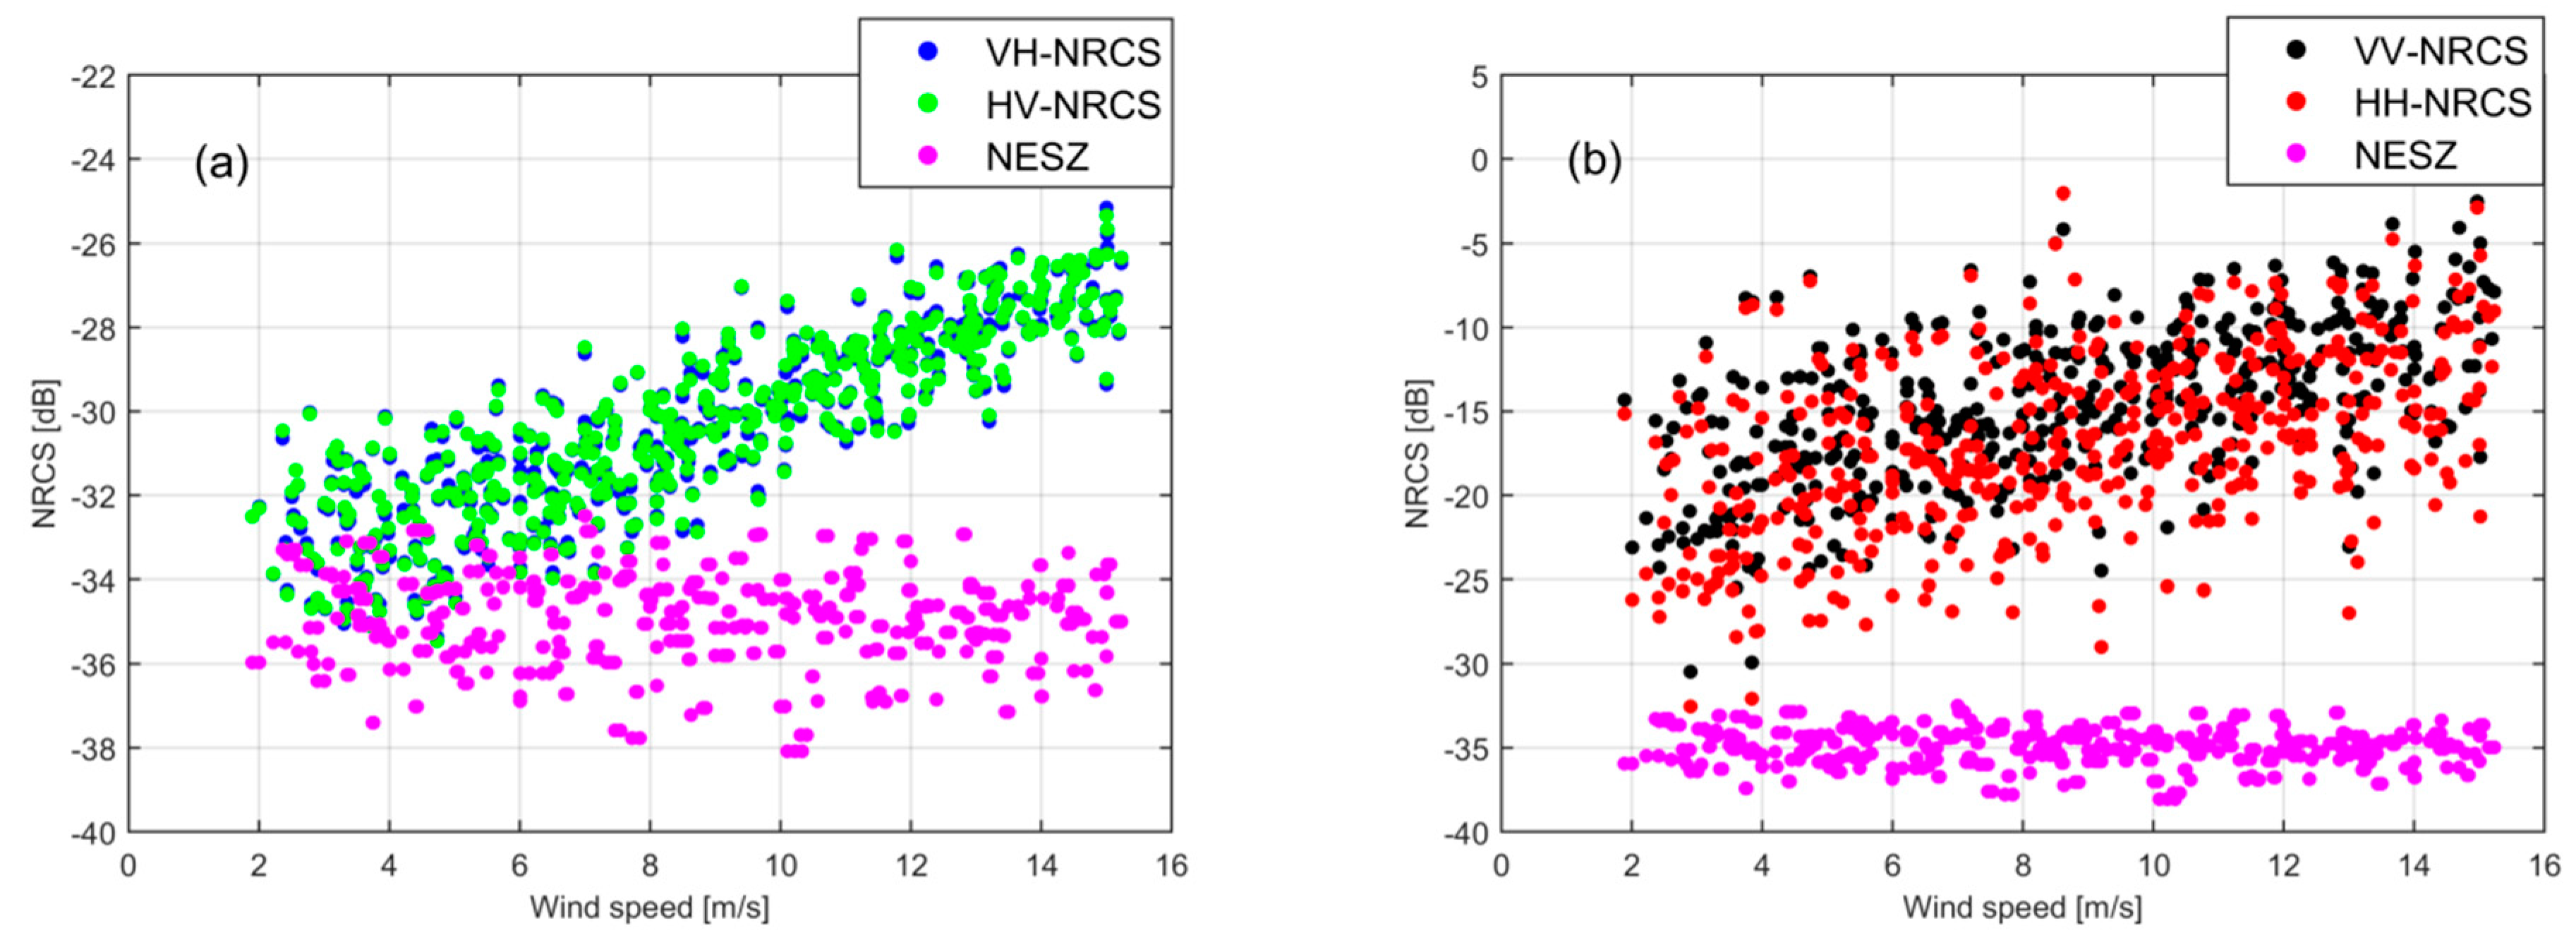
In terms of cross-polarized SAR wind speed retrieval, the C-2PO model is applied to the NRCSs without removing the noise level because of the complicated relationship of the Signal-to Noise Ratio (SNR) [24,26]. In fact, the NRCS values induced by local winds are close to the noise level values, especially under low wind speed conditions (Figure 13). One reason is that the actual noise level for RADARSAT-2 fine quad-polarized SAR data in an individual pixel is unknown and only the estimated noise level is provided. The other reason is that the cross-polarized NRCSs induced by the low wind might be above the actual noise level. However, sometimes, these NRCSs may be beneath the noise level. If we remove the estimated noise level for all pixels, we cannot apply C-2PO model to retrieve the wind speed.
4.2.3. Effect of the Wind-Roughness Relationship
In previous studies focusing on linear polarizations [37], several EM mechanisms are relevant to the radar backscatter denoted as the NRCS from the ocean surface: (1) Bragg resonance scattering, (2) quasi-specular reflection and (3) diffraction of radio waves on sharp wedges. Generally speaking, Bragg resonance scattering mechanisms, as related to ocean surface roughness and quasi-specular reflection and diffraction of radio waves, are considered in relation to wave breaking.
Bragg resonance plays a main role in the VV-polarized NRCS but is negligible for the VH-polarization NRCS [38]. In addition, non-Bragg scattering dominates the VH-polarized NRCS but is negligible for the VV-polarized NRCS. A summary is shown in Table 2 for the roles of Bragg and non-Bragg resonance scattering mechanisms with respect to the VH and VV polarizations. For SAR imaging under the low wind speed conditions, VV-polarized NRCS values mainly depend on the ocean surface roughness, which can be described by the Bragg resonance. The relationship among winds, roughness and NRCS values is ‘stable’ and thus the VV-polarized NRCSs (CMOD4) apply to low wind speed retrieval. The VH-polarized imaging depends on the wave breaking mechanism. However, waves induced by winds are not easily broken at low wind speeds. The relationship among winds, roughness and NRCS values is ‘instable’ and thus the VH-polarized NRCSs model (C-2PO) is not suitable for low wind speed retrieval.
4.2.4. Effect of the Reconstructed Spatial Resolution
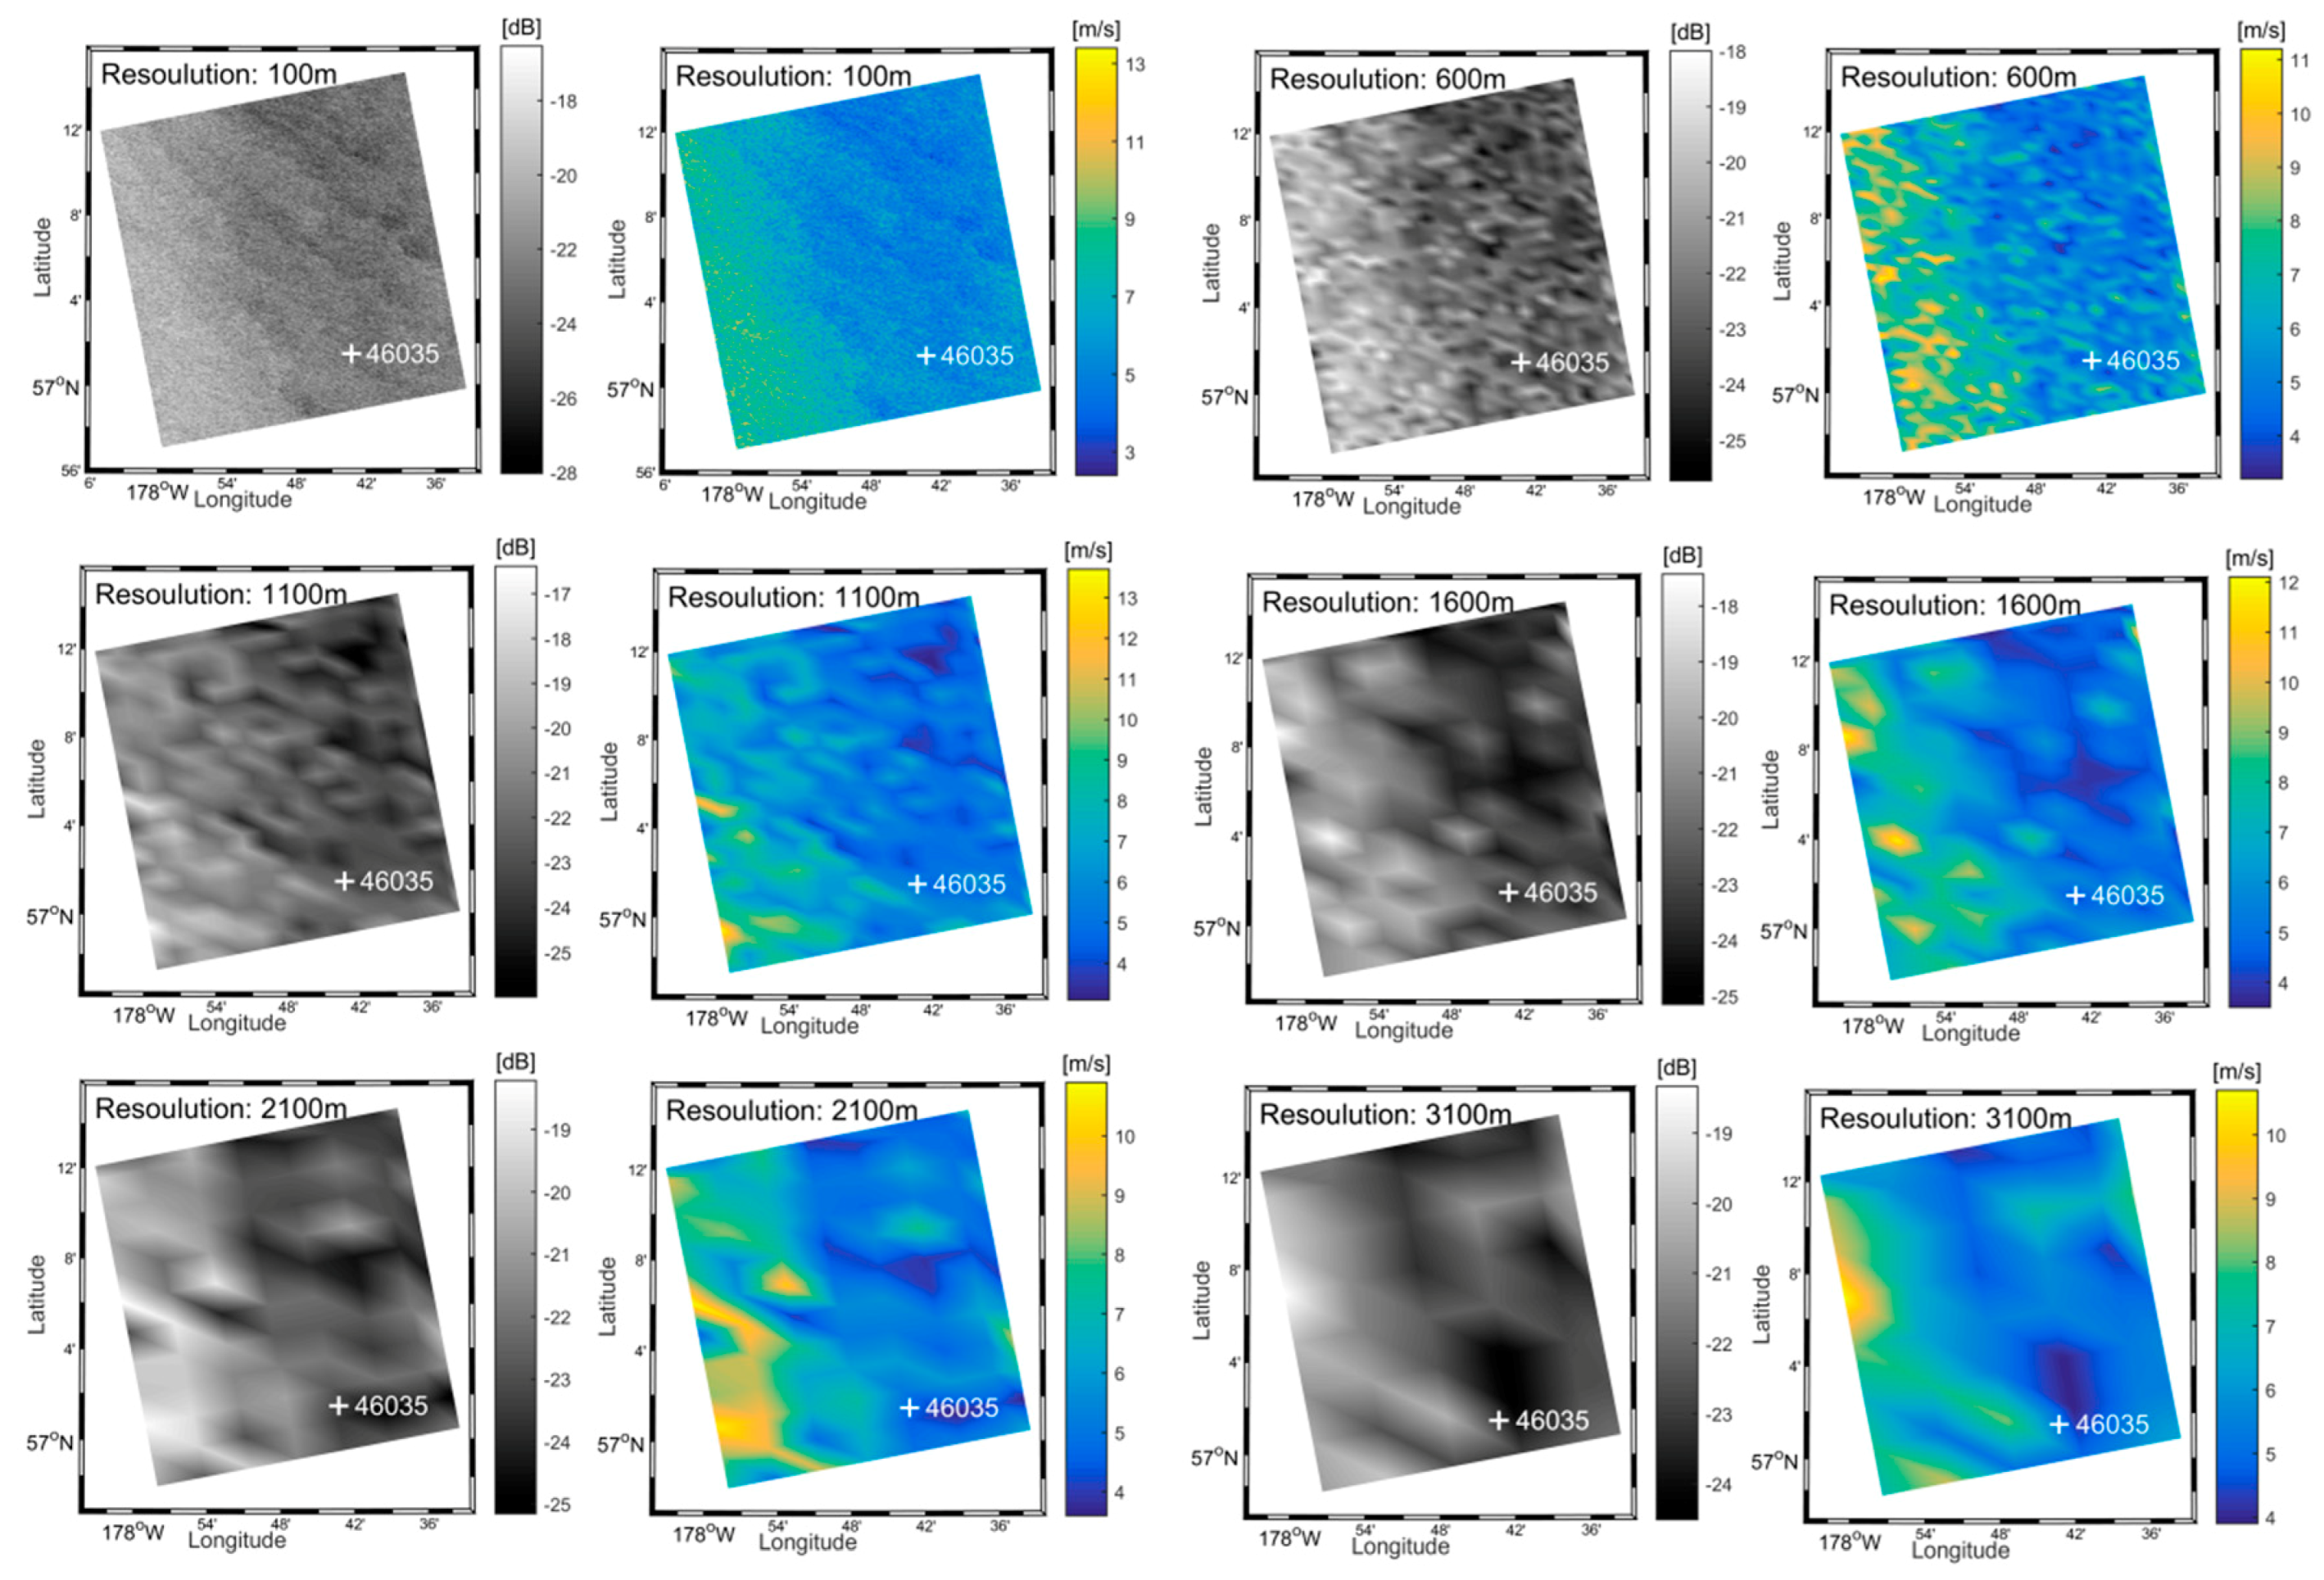
Direct calculation of OSWSs from the original SAR scene can result in noisy patterns due to the presence of speckle noise in the raw SAR images. Therefore, the raw RS-2 SAR data needs to be preprocessed to reconstruct an appropriate spatial resolution. For this reason, we make a 20 × 20 pixel boxcar averaging of the NRCS, in each polarization, so that the reconstructed pixel spacing is 100 m. Previous research has suggested that the reconstructed spatial resolution has an effect on the accuracy of OSWS retrieval with the C-2PO model for the cross-polarized channels from RS-2 fine quad-polarized images [39]. To investigate this phenomenon thoroughly, we selected one SAR image under very low wind speed conditions. This case is a RS-2 quad-polarized SLC SAR image acquired on 29 April 2012, at 05:33:24 UTC and collocated with a NDBC buoy (#46035; ) in the Bering Sea. In addition, most of the NDBC buoy anemometers are installed at a height of 5 m. Therefore, the OSWS from the 5-m anemometers is converted to OSWS at 10-m height using the power-law wind profile method under near-neutral stability conditions [40]. Finally, the NDBC buoy-measured 10-m OSWS is 2.93 m/s on 29 April 2012, at 05:30:00 UTC.
In the next step, we first reconstruct the spatial resolution at VH- and VV-polarized mode at 100, 600, 1100, 1600, 2100 and 3100 m, respectively. Various SAR data including NRCSs, incidence angles and external wind directions are interpolated to the buoy location. VH-polarized wind speeds retrieved from the C-2PO model can be directly computed from Equation (5). The results of the SAR-retrieved wind speeds are 7.72 m/s (100 m), 6.18 m/s (600 m), 5.14 m/s (1100 m), 4.67 m/s (1600 m), 6.46 m/s (2100 m) and 6.69 (3100 m) and the differences are 4.79 m/s (100 m), 3.25 m/s (600 m), 2.21 m/s (1100 m), 1.64 m/s (1600 m), 2.33 m/s (2100 m) and 3.19 m/s (3100 m), respectively. A more intuitive and straightforward assessment of the influence of influence of different spatial scales is given in Figure 14., which shows the reconstructed SAR images and corresponding retrieved OSWS at spatial resolutions of 100, 600, 1100, 1600, 2100 and 3100 m for the VH-polarized channel.
Obviously, the retrieved OSWS values from C-2PO model at 1600 m spatial resolution have the smallest difference and thus the optimal resolution from VH-polarized data is 1600 m, in this case. This phenomenon can be explained by the fact that the speckles in the SAR images have been suppressed by averaging the pixel spacing to coarser resolution and the wind field is smoothed by the increase in the wind cell spacing.
For VV-polarized data, the ERA-Interim reanalysis wind field are used as external wind directions acquired on 29 April 2012, at 00:00:00 UTC. SAR retrieved wind speeds from CMOD4 GMF can be taken from Equation (2). The results of the SAR-retrieved wind speeds are 6.6 m/s (100 m), 4.69 m/s (600 m), 4.91 m/s (1100 m), 5.25 m/s (1600 m), 5.6 m/s (2100 m) and 5.95 m/s (3100 m) and the differences are 3.67 m/s (100 m), 1.76 m/s (600 m), 1.98 m/s (1100 m), 2.32 m/s (1600 m), 2.67 m/s (2100 m) and 3.02 m/s (3100 m), respectively. Similarly, Figure 15 shows the reconstructed SAR images and corresponding retrieved OSWS values at spatial resolutions of 100, 600, 1100, 1600, 2100 and 3100 m for the VV-polarized channel. The CMOD4 GMF retrieves OSWS at 600 m spatial resolution has the smallest difference and thus, the optimal resolution in VV-polarized mode is 600 m, in this case.
Compared with OSWS retrieval from VV-polarized SAR mode data, OSWS can be retrieved with better accuracy (at 1600 m) for the VH-polarized channel for low winds. However, the results appear to exhibit ‘instability’ for cross-polarized OSWS retrieval with the C-2PO model for the RS-2 fine quad-polarization data. The simple explanation is as follows: OSWSs retrieved from the SAR image are based on the Bragg scattering theory and thus the accuracy of retrieved wind speeds are closely related to the radar backscatter signal. In terms of the backscatter signal, the intensity at VH-polarized channel is far less than the intensity at the VV-polarized channel. With increased pixel averaging, the speckle is reduced. Although the SNR for the VH-polarized channel becomes stronger when the noise is reduced, the changes are small because the backscatter signal intensity is itself quite weak. As a result, OSWSs retrieved from C-2PO model for VH-polarized mode have ‘instability’, with the change of spatial resolution (due to averaging) in low winds. For the VV-polarized channel, the signal intensity is strong and thus the speckle noise has little effect, with the decrease in spatial resolution. Therefore, OSWSs retrieved from the CMOD4 GMF for VV-polarized mode data are more accurate with the change of spatial resolution due to appropriate averaging, in relatively low winds.
5. Conclusions
In this paper, ocean surface wind speed measurements made by RADARSAT-2 in cross-polarized and co-polarized modes were analyzed, using 439 samples from 92 fine quad-polarization SAR images and corresponding ERA-Interim winds in the Northwest Pacific in waters off the coast of China. We first created two subset wind speed databases: the training and testing subsets. From the training data subset, we retrieve OSWSs from different GMF models for different polarizations, as appropriate and we compared the results with corresponding ERA-Interim winds. The RMSEs of SAR-retrieved wind speeds are all below 2.5 m/s: specifically, 2.11 m/s (VH-polarized), 2.13 m/s (HV-polarized), 1.86 m/s (VV-polarized) and 2.26 m/s (HH-polarized) and the correlation coefficients are 0.86 (VH-polarized), 0.85 (HV-polarized), 0.87 (VV-polarized) and 0.83 (HH-polarized), which are statistically significant at the 99.9% significance level, respectively.
Through analysis of the SAR data considered in this study, we have presented the advantages and disadvantages for SAR wind retrieval models for cross- and co-polarized data and the respective wind speed ranges for reliable application. We found that OSWS retrieved using the C-2PO model for VH-polarized data are most suitable for moderate-to-high winds while the CMOD4 GMF at VV-polarized tends to be best for low-to-moderate winds. In addition, under higher wind conditions, such as generated by hurricanes, many studies have suggested that the NRCS in cross-polarization mode essentially does not saturate [19,23,25,26,28]. Thus, the cross-polarized channel is more appropriate for retrieval of high winds, as may be generated by hurricanes. To better understand the appropriate scope of applications for C-2PO and CMOD4 GMF, an accurate OSWS threshold value algorithm is proposed based on our training dataset, from the perspective of a quantitative analysis. According to the analysis results, a hybrid methodology is put forward and applied to the test data subset. The results show that the accuracy of the retrieved OSWSs from our hybrid method can significantly outperform C-2PO or the CMOD4 models, producing an RMSE of 1.66 m/s and correlation coefficient of 0.9. Finally, we proposed four possible reasons to explain why the C-2PO model based on the cross-polarized retrieved wind speeds has a rather poor performance at low wind speeds. They are modeling, noise level, wind-roughness relationship and reconstructed spatial resolution.
From the perspective of data analysis and physical mechanism, we put forward the hybrid OSWS retrieval model, which provide readers a new idea to retrieve OSWS from C-band quad-polarized SAR images. However, for OSWS retrieved from quad-polarized SAR images, there are still some deficiencies in using reference wind speeds from the ERA-Interim winds data in this paper. For example, the spatial resolution retrieved from SAR images may be not comparable to the resolution of wind grid cells from the reference data. In future work, in order to set up a more accurate OSWS retrieval model, we will take real in-situ (i.e., buoys) as our reference wind data. Besides, from a model perspective, whether C-2PO or CMOD GMFs are used, they are empirical formulations based on relationships between the NRCSs and wind speed. In the future, we plan to make a more thorough comparison of all the model functions and include comparisons using multiple remotely sensed datasets and additional buoy measurements to improve results. There is hope that a new C-band wind speed retrieval model will provide improved retrievals, without having to consider differing wind intensities, such as low, moderate, high and so forth.
Author Contributions
The first author of this paper, H.F., wrote the manuscript. T.X. conceived and designed the experiments. H.F. and G.Z. performed the experiments. J.Y. and Y.H. supervised the work. W.P. reviewed, edited and provided valuable suggestions and inputs for the final manuscript. H.F. and W.P. wrote the paper.
Funding
This research received no external funding other than what is acknowledging below.
Acknowledgments
This work was supported by the National Key R&D Program of China (2016YFC1401007), the Global Change Research Program of China (2015CB953901), the National Natural Science Foundation of China project (41776181), the Jiangsu Meteorological Bureau 2014 modernization project “Jiangsu Ocean meteorological Integrated Service System”, the Postgraduate Research & Practice Innovation Program of Jiangsu Province (KYCX18_1012), the China Scholarship Council for 1 year’s study at the Bedford Institute of Oceanography, the National Natural Science Youth Foundation of China (41706193), the Canadian Space Agency DUAP Program “Winds from SAR” RCM Readiness Project and the Canadian Office of Energy Research and Development.
Conflicts of Interest
The authors declare no conflict of interest.
References
- Monaldo, F.M.; Li, X.; Pichel, W.G.; Jackson, C.R. Ocean wind speed climatology from spaceborne SAR imagery. Bull. Am. Meteorol. Soc. 2014, 95, 565–569. [Google Scholar] [CrossRef]
- Duan, B.; Zhang, W.; Yang, X. Assimilation of Typhoon Wind Field Retrieved from Scatterometer and SAR Based on the Huber Norm Quality Control. Remote Sens. 2017, 9, 987. [Google Scholar] [CrossRef]
- Xie, T.; Perrie, W.; He, Y.; Li, H.; Fang, H.; Zhao, S.; Yu, W. Ocean surface wave measurements from fully polarimetric SAR imagery. Sci. China Earth Sci. 2015, 58, 1849–1861. [Google Scholar] [CrossRef]
- Shen, H.; Perrie, W.; He, Y.; Liu, G. Wind speed retrieval from VH dual-polarization RADARSAT-2 SAR images. IEEE Trans. Geosci. Remote Sens. 2014, 52, 5820–5826. [Google Scholar] [CrossRef]
- Fang, H.; Xie, T.; Perrie, W.; Zhao, L.; Yang, J.; He, Y. Ocean Wind and Current Retrievals Based on Satellite SAR Measurements in Conjunction with Buoy and HF Radar Data. Remote Sens. 2017, 9, 1321. [Google Scholar] [CrossRef]
- Denbina, M.; Collins, M.J. Wind speed estimation using C-band compact polarimetric SAR for wide swath imaging modes. ISPRS J. Photogramm. Remote Sens. 2016, 113, 75–85. [Google Scholar] [CrossRef]
- Liu, G.; Yang, X.; Li, X.; Zhang, B.; Pichel, W.; Li, Z.; Zhou, X. A systematic comparison of the effect of polarization ratio models on sea surface wind retrieval from C-band synthetic aperture radar. IEEE J. Sel. Top. Appl. Earth Obs. Remote Sens. 2013, 6, 1100–1108. [Google Scholar] [CrossRef]
- Jagdish; Kumar, S.; Chakraborty, A.; Kumar, R. Validation of wind speed retrieval from RISAT-1 SAR images of the North Indian Ocean. Remote Sens. Lett. 2018, 9, 421–428. [Google Scholar] [CrossRef]
- Stoffelen, A.; Anderson, D. Scatterometer data interpretation: Derivation of the transfer function CMOD4. J. Geophys. Res. 1997, 102, 5767–5780. [Google Scholar] [CrossRef]
- Quilfen, Y.; Chapron, B.; Elfouhaily, T.; Katsaros, K.; Tournadre, J. Observation of tropical cyclones by high-resolution scatterometry. J. Geophys. Res. 1998, 103, 7767–7786. [Google Scholar] [CrossRef] [Green Version]
- Hersbach, H.; Stoffelen, A.; Haan, S. An improved C-band scatterometer ocean geophysical model function: CMOD5. J. Geophys. Res. Oceans 2007, 112, C03006. [Google Scholar] [CrossRef]
- Mouche, A.; Chapron, B.; Zhang, B.; Husson, R. Combined Co- and Cross-Polarized SAR Measurements under Extreme Wind Conditions. IEEE Trans. Geosci. Remote Sens. 2017, 55, 6746–6755. [Google Scholar] [CrossRef]
- Stoffelen, A.; Verspeek, J.A.; Vogelzang, J.; Verhoef, A. The CMOD7 geophysical model function for ASCAT and ERS wind retrievals. IEEE J. Sel. Top. Appl. Earth Obs. Remote Sens. 2017, 10, 2123–2134. [Google Scholar] [CrossRef]
- Thompson, D.R.; Elfouhaily, T.M.; Chapron, B. Polarization ratio for microwave backscattering from the ocean surface at low to moderate incidence angles. In Proceedings of the 1998 IEEE International Geoscience and Remote Sensing Symposium Proceedings (IGARSS’98), Seattle, WA, USA, 6–10 July 1998; Volume 3, pp. 1671–1673. [Google Scholar]
- Vachon, P.W.; Dobson, F.W. Wind retrieval from RADARSAT SAR images: Selection of a suitable C-band HH polarization wind retrieval model. Can. J. Remote Sens. 2000, 26, 306–313. [Google Scholar] [CrossRef]
- Horstmann, J.; Koch, W.; Lehner, S.; Tonboe, R. Wind retrieval over the ocean using synthetic aperture radar with C-band HH polarization. IEEE Trans. Geosci. Remote Sens. 2000, 38, 2122–2131. [Google Scholar] [CrossRef]
- Mouche, A.A.; Hauser, D.; Daloze, J.F.; Guerin, C. Dual-polarization measurements at C-band over the ocean: Results from airborne radar observations and comparison with ENVISAT ASAR data. IEEE Trans. Geosci. Remote Sens. 2005, 43, 753–769. [Google Scholar] [CrossRef]
- Johnsen, H.; Engen, G.; Guitton, G. Sea-surface polarization ratio from Envisat ASAR AP data. IEEE Trans. Geosci. Remote Sens. 2008, 46, 3637–3646. [Google Scholar] [CrossRef]
- Shen, H.; Perrie, W.; He, Y. On SAR wind speed ambiguities and related geophysical model functions. Can. J. Remote Sens. 2009, 35, 310–319. [Google Scholar] [CrossRef]
- Zhang, B.; Perrie, W.; He, Y. Wind speed retrieval from RADARSAT-2 quad-polarization images using a new polarization ratio model. J. Geophys. Res. Atmos. 2011, 116. [Google Scholar] [CrossRef] [Green Version]
- Hwang, P.A.; Zhang, B.; Toporkov, J.V.; Perrie, W. Comparison of composite Bragg theory and quad-polarization radar backscatter from RADARSAT-2, with applications to wave breaking and high wind retrieval. J. Geophys. Res. Oceans 2010, 115. [Google Scholar] [CrossRef]
- Hwang, P.A.; Perrie, W.; Zhang, B. Cross-polarization radar backscattering from the ocean surface and its dependence on wind velocity. IEEE Trans. Geosci. Remote Sens. Lett. 2014, 11, 2188–2192. [Google Scholar] [CrossRef]
- Vachon, P.W.; Wolfe, J. C-band cross-polarization wind speed retrieval. IEEE Trans. Geosci. Remote Sens. Lett. 2011, 8, 456–458. [Google Scholar] [CrossRef]
- Zhang, B.; Perrie, W.; Vachon, P.W.; Li, X.; Pichel, W.G.; Guo, J.; He, Y. Ocean vector winds retrieval from C-band fully polarimetric SAR measurements. IEEE Trans. Geosci. Remote Sens. 2012, 50, 4252–4261. [Google Scholar] [CrossRef]
- Zhang, B.; Perrie, W. Cross-polarized synthetic aperture radar: A new potential technique for hurricanes. Bull. Am. Meteorol. Soc. 2012, 93, 531–541. [Google Scholar] [CrossRef]
- Horstmann, J.; Falchetti, S.; Wackerman, C.; Maresca, S.; Caruso, M.J.; Graber, H.C. Tropical cyclone winds retrieved from C-band cross-polarized synthetic aperture radar. IEEE Trans. Geosci. Remote Sens. 2015, 53, 2887–2898. [Google Scholar] [CrossRef]
- Zhang, G.; Li, X.; Perrie, W.; Hwang, P.A.; Zhang, B.; Yang, X. A Hurricane Wind Speed Retrieval Model for C-Band RADARSAT-2 Cross-Polarization ScanSAR Images. IEEE Trans. Geosci. Remote Sens. 2017, 55, 4766–4774. [Google Scholar] [CrossRef]
- Touzi, R.; Vachon, P.W.; Wolfe, J. Requirement on antenna cross-polarization isolation for the operational use of C-band SAR constellations in maritime surveillance. IEEE Trans. Geosci. Remote Sens. 2010, 7, 861–865. [Google Scholar] [CrossRef]
- La, T.V.; Khenchaf, A.; Comblet, F.; Nahum, C. Assessment of Wind Speed Estimation from C-Band Sentinel-1 Images Using Empirical and Electromagnetic Models. IEEE Trans. Geosci. Remote Sens. 2018, 56, 4075–4087. [Google Scholar] [CrossRef]
- Lehner, S.; Schulz-Stellenfleth, J.; Schattler, B.; Breit, H.; Horstmann, J. Wind and wave measurements using complex ERS-2 SAR wave mode data. IEEE Trans. Geosci. Remote Sens. 2000, 38, 2246–2257. [Google Scholar] [CrossRef]
- Horstmann, J.; Schiller, H.; Schulz-Stellenfleth, J.; Lehner, S. Global wind speed retrieval from SAR. IEEE Trans. Geosci. Remote Sens. 2003, 41, 2277–2286. [Google Scholar] [CrossRef] [Green Version]
- Carvalho, D.; Rocha, A.; Gómez-Gesteira, M. Ocean surface wind simulation forced by different reanalyses: Comparison with observed data along the Iberian Peninsula coast. Ocean Model. 2012, 56, 31–42. [Google Scholar] [CrossRef]
- Dee, D.P.; Uppala, S.M.; Simmons, A.J.; Berrisford, P.; Poli, P.; Kobayashi, S.; Andrae, U.; Alonso-Balmaseda, M.; Balsamo, G.; Bauer, P.; et al. The ERA-Interim reanalysis: Configuration and performance of the data assimilation system. Q. J. R. Meteorol. Soc. 2011, 137, 553–597. [Google Scholar] [CrossRef]
- Xu, Q.; Lin, H.; Li, X.F.; Zheng, Q.; Pichel, W.; Liu, Y. Assessment of an analytical model for sea surface wind speed retrieval from spaceborne SAR. Int. J. Remote Sens. 2010, 31, 993–1008. [Google Scholar] [CrossRef]
- Komarov, A.; Zabeline, V.; Barber, D. Ocean surface wind speed retrieval from C-band SAR images without wind direction input. IEEE Trans. Geosci. Remote Sens. 2014, 52, 980–990. [Google Scholar] [CrossRef]
- Han, B.; Xu, X.; Li, H. Wind Speed Retrieval of Ocean Surface Using Radarsat-2 Co-polarization Data. Remote Sens. Technol. Appl. 2017, 32, 419–426. [Google Scholar]
- Kudryavtsev, V.; Hauser, D.; Caudal, G.; Chapron, B. A semiempirical model of the normalized radar cross-section of the sea surface 1. Background model. J. Geophys. Res. 2003, 108. [Google Scholar] [CrossRef] [Green Version]
- Zhang, G.; Perrie, W.; Li, X.; Zhang, J.A. A hurricane morphology and sea surface wind vector estimation fmodel based on C-band cross-polarization SAR imagery. IEEE Trans. Geosci. Remote Sens. 2017, 55, 1743–1751. [Google Scholar] [CrossRef]
- Zhang, K.; Xu, X.; Han, B.; Mansaray, L.R.; Guo, Q.; Huang, J. The Influence of Different Spatial Resolutions on the Retrieval Accuracy of Sea Surface Wind Speed with C-2PO Models Using Full Polarization C-Band SAR. IEEE Trans. Geosci. Remote Sens. 2017, 55, 5015–5025. [Google Scholar] [CrossRef]
- Ren, Y.; Li, X.; Zhou, G. Sea surface wind retrievals from SIR-C/X-SAR data: A revisit. Remote Sens. 2015, 7, 3548–3564. [Google Scholar] [CrossRef]
Figure 1.
ERA-Interim wind speeds: (a) east-west direction and (b) south-north direction in Chinese waters. The ERA-Interim wind products are acquired on 20 August 2012 at 12:00:00 UTC from ECWMF website.
Figure 1.
ERA-Interim wind speeds: (a) east-west direction and (b) south-north direction in Chinese waters. The ERA-Interim wind products are acquired on 20 August 2012 at 12:00:00 UTC from ECWMF website.

Figure 2.
Flowchart for building a database for the developing wind speed retrieval method.

Figure 3.
(a) Dependence of VV-polarized normalized radar cross section (NRCS) from CMOD geophysical model functions (GMFs) versus ocean surface wind speeds (OSWSs) at a local incidence angle of and wind direction relative radar look angle of 180°. (b) Dependence of VV-polarized NRCS from CMOD GMFs versus wind direction relative radar look angle at a local incidence angle of 30° and wind speed of 10 m/s.

Figure 4.
(a) Polarization ratio (PR) as a function of the radar incidence angle from the literature; (b) The relationship between wind speed and cross-polarized NRCS.
Figure 4.
(a) Polarization ratio (PR) as a function of the radar incidence angle from the literature; (b) The relationship between wind speed and cross-polarized NRCS.

Figure 5.
C-band (a) VH- and (c) HV-polarized SAR images in the South China Sea waters from RADARSAT-2 fine quad-polarization mode SLC SAR data acquired on 27 August 2012, at 10:25:24 UTC (grayscale color bar denoted NRCS). OSWS retrieved from (b) VH- and (d) HV-C2PO model. Symbol ‘+’ denotes winds grid cells from ERA-Interim data. RADARSAT-2 Data and Product MacDonald, Detweiler and Associates Ltd., All Rights Reserved.

Figure 6.
C-band (a) VV- and (c) HH-polarized SAR images in the South China Sea waters from RADARSAT-2 fine quad-polarization mode SLC SAR data acquired on 27 August 2012, at 10:25:24 UTC (grayscale and color bar denote NRCS). OSWS retrieved from CMOD using (b) VV and (d) HH-polarized imagery. Red arrows denote wind directions from ERA-Interim data. RADARSAT-2 Data and Product MacDonald, Detweiler and Associates Ltd., All Rights Reserved.

Figure 7.
(a) VH-, (b) HV-, (c) VV- and (d) HH-polarized OSWS values retrieved from SAR images using corresponding GMF models compared to ERA-Interim winds data as the training database.
Figure 7.
(a) VH-, (b) HV-, (c) VV- and (d) HH-polarized OSWS values retrieved from SAR images using corresponding GMF models compared to ERA-Interim winds data as the training database.

Figure 8.
Design of a double loop program to find the best OSWS threshold value based on the training data.
Figure 8.
Design of a double loop program to find the best OSWS threshold value based on the training data.

Figure 9.
Variation of RMSE with different wind speeds using our hybrid OSWS retrieval model.

Figure 10.
Flowchart for the hybrid wind speed retrieval algorithm.

Figure 11.
OSWSs retrieved from (a) VH-C2PO and (b) CMOD4+VV models from quad-polarized RADARSAT-2 images.
Figure 11.
OSWSs retrieved from (a) VH-C2PO and (b) CMOD4+VV models from quad-polarized RADARSAT-2 images.

Figure 12.
OSWSs retrieved from hybrid model in this study from quad-polarized RADARSAT-2 images.

Figure 13.
Sigma naught versus in situ ERA-Interim wind speed for (a) cross- and (b) co-polarized data.
Figure 13.
Sigma naught versus in situ ERA-Interim wind speed for (a) cross- and (b) co-polarized data.

Figure 14.
VH-polarized SAR images at reconstructed spatial resolutions of 100, 600, 1100, 1600, 2100 and 3100 m and corresponding OSWSs retrieved from C2PO model. The in-situ buoy (#46035, 57°1′33″N 177°44′16″W) wind speed is 2.92 m/s. RADARSAT-2 Data and Product MacDonald, Detteiler and Associates Ltd., All Rights Reserved.

Figure 15.
VV-polarized SAR images at reconstructed spatial resolutions of 100, 600, 1100, 1600, 2100 and 3100 m and corresponding OSWSs retrieved from the C2PO model. The in-situ buoy (#46035, 57°1′33″N 177°44′16″W) wind speed is 2.92 m/s. RADARSAT-2 Data and Product MacDonald, Detteiler and Associates Ltd., All Rights Reserved.


Table 1.
OSWSs retrieved from the RS-2 fine quad-polarized mode SAR images compared with corresponding wind acquired from ERA-Interim daily (in units of m/s).
Table 1.
OSWSs retrieved from the RS-2 fine quad-polarized mode SAR images compared with corresponding wind acquired from ERA-Interim daily (in units of m/s).
| Sample | Coordinate | ERA-Interim | VH | HV | VV | HH |
|---|---|---|---|---|---|---|
| S1 | 116.625°E 21.125°N | 7.3682 | 6.28 | 6.45 | 6.96 | 5.47 |
| S2 | 116.50°E 21.000°N | 7.9413 | 9.60 | 9.87 | 10.72 | 10.13 |
| S3 | 116.625°E 21.000°N | 7.3628 | 8.16 | 8.31 | 8.82 | 7.98 |
| S4 | 116.50°E 20.875°N | 7.2097 | 9.39 | 9.66 | 8.75 | 8.11 |
| S5 | 116.625°E 20.875°N | 7.3583 | 9.78 | 9.89 | 8.26 | 8.73 |
Table 2.
The roles of the two mechanisms with respect to the VH and VV polarizations.
| Mechanisms | VH-Polarized | VV-Polarized |
|---|---|---|
| Bragg Resonance | Negligible | Main |
| Non-Bragg | Main | Negligible |
© 2018 by the authors. Licensee MDPI, Basel, Switzerland. This article is an open access article distributed under the terms and conditions of the Creative Commons Attribution (CC BY) license (http://creativecommons.org/licenses/by/4.0/).
Share and Cite
MDPI and ACS Style
Fang, H.; Xie, T.; Perrie, W.; Zhang, G.; Yang, J.; He, Y. Comparison of C-Band Quad-Polarization Synthetic Aperture Radar Wind Retrieval Models. Remote Sens. 2018, 10, 1448. https://doi.org/10.3390/rs10091448
AMA Style
Fang H, Xie T, Perrie W, Zhang G, Yang J, He Y. Comparison of C-Band Quad-Polarization Synthetic Aperture Radar Wind Retrieval Models. Remote Sensing. 2018; 10(9):1448. https://doi.org/10.3390/rs10091448
Chicago/Turabian StyleFang, He, Tao Xie, William Perrie, Guosheng Zhang, Jingsong Yang, and Yijun He. 2018. "Comparison of C-Band Quad-Polarization Synthetic Aperture Radar Wind Retrieval Models" Remote Sensing 10, no. 9: 1448. https://doi.org/10.3390/rs10091448
Note that from the first issue of 2016, this journal uses article numbers instead of page numbers. See further details here.