Monitoring Retreat of Coastal Sandy Systems Using Geomatics Techniques: Somo Beach (Cantabrian Coast, Spain, 1875–2017)

 ,
,  and
and
Abstract
:
1. Introduction
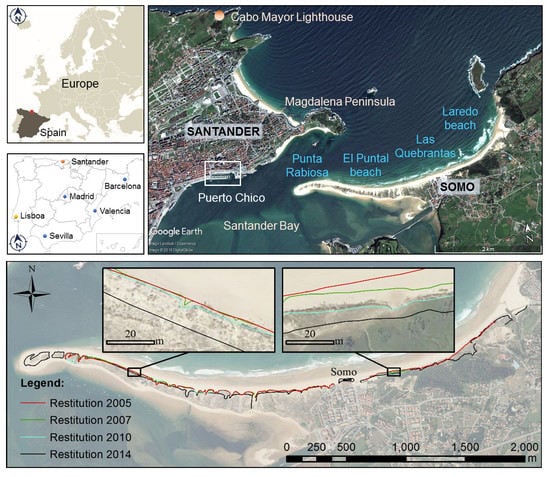
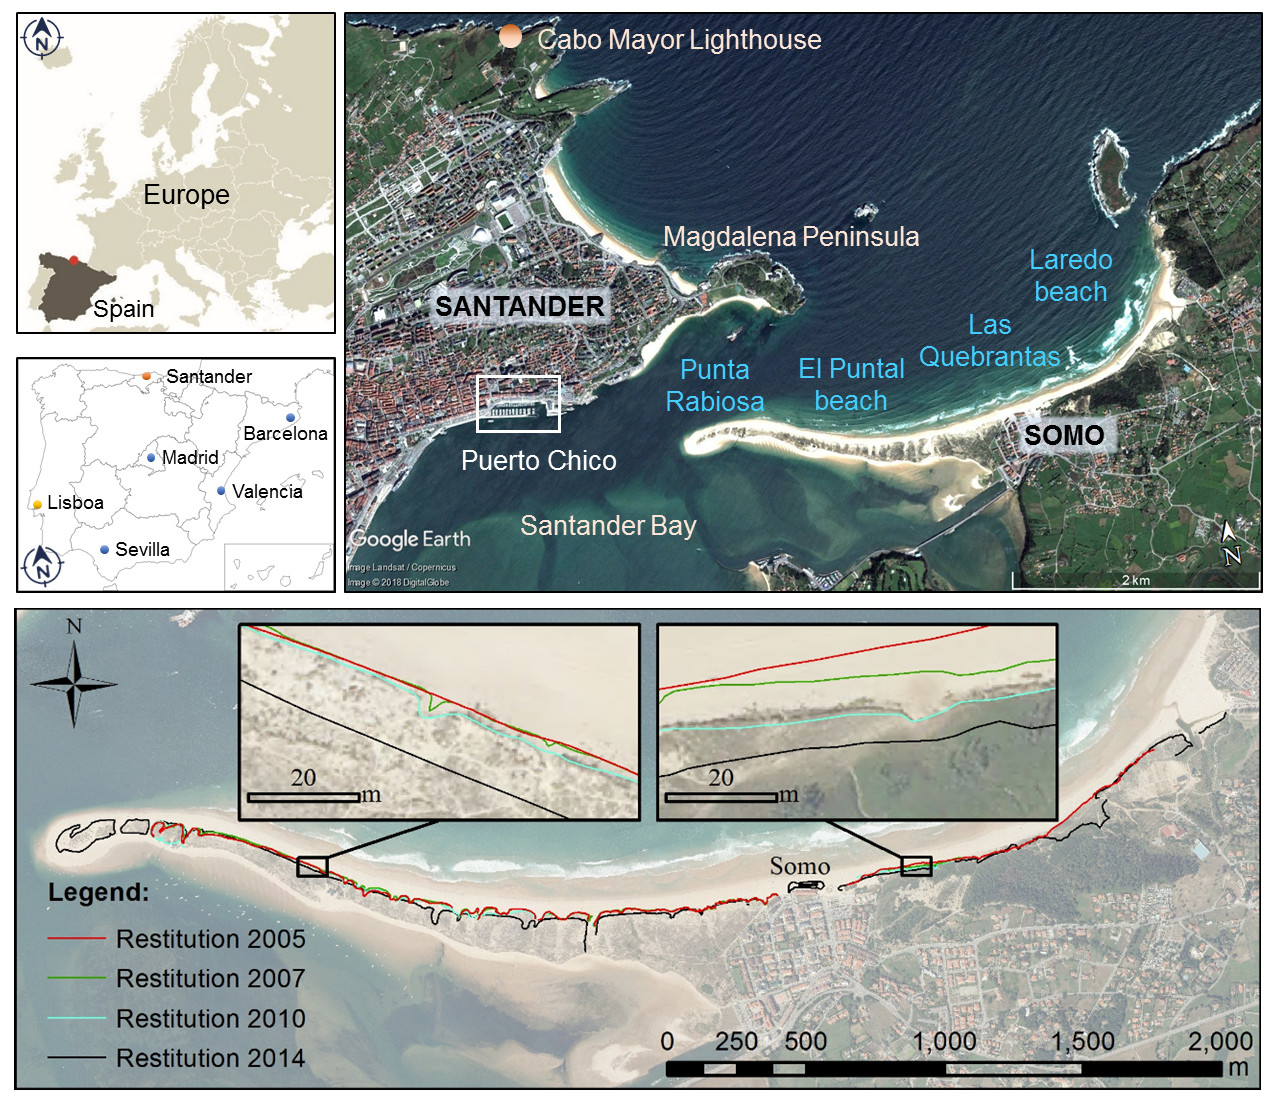
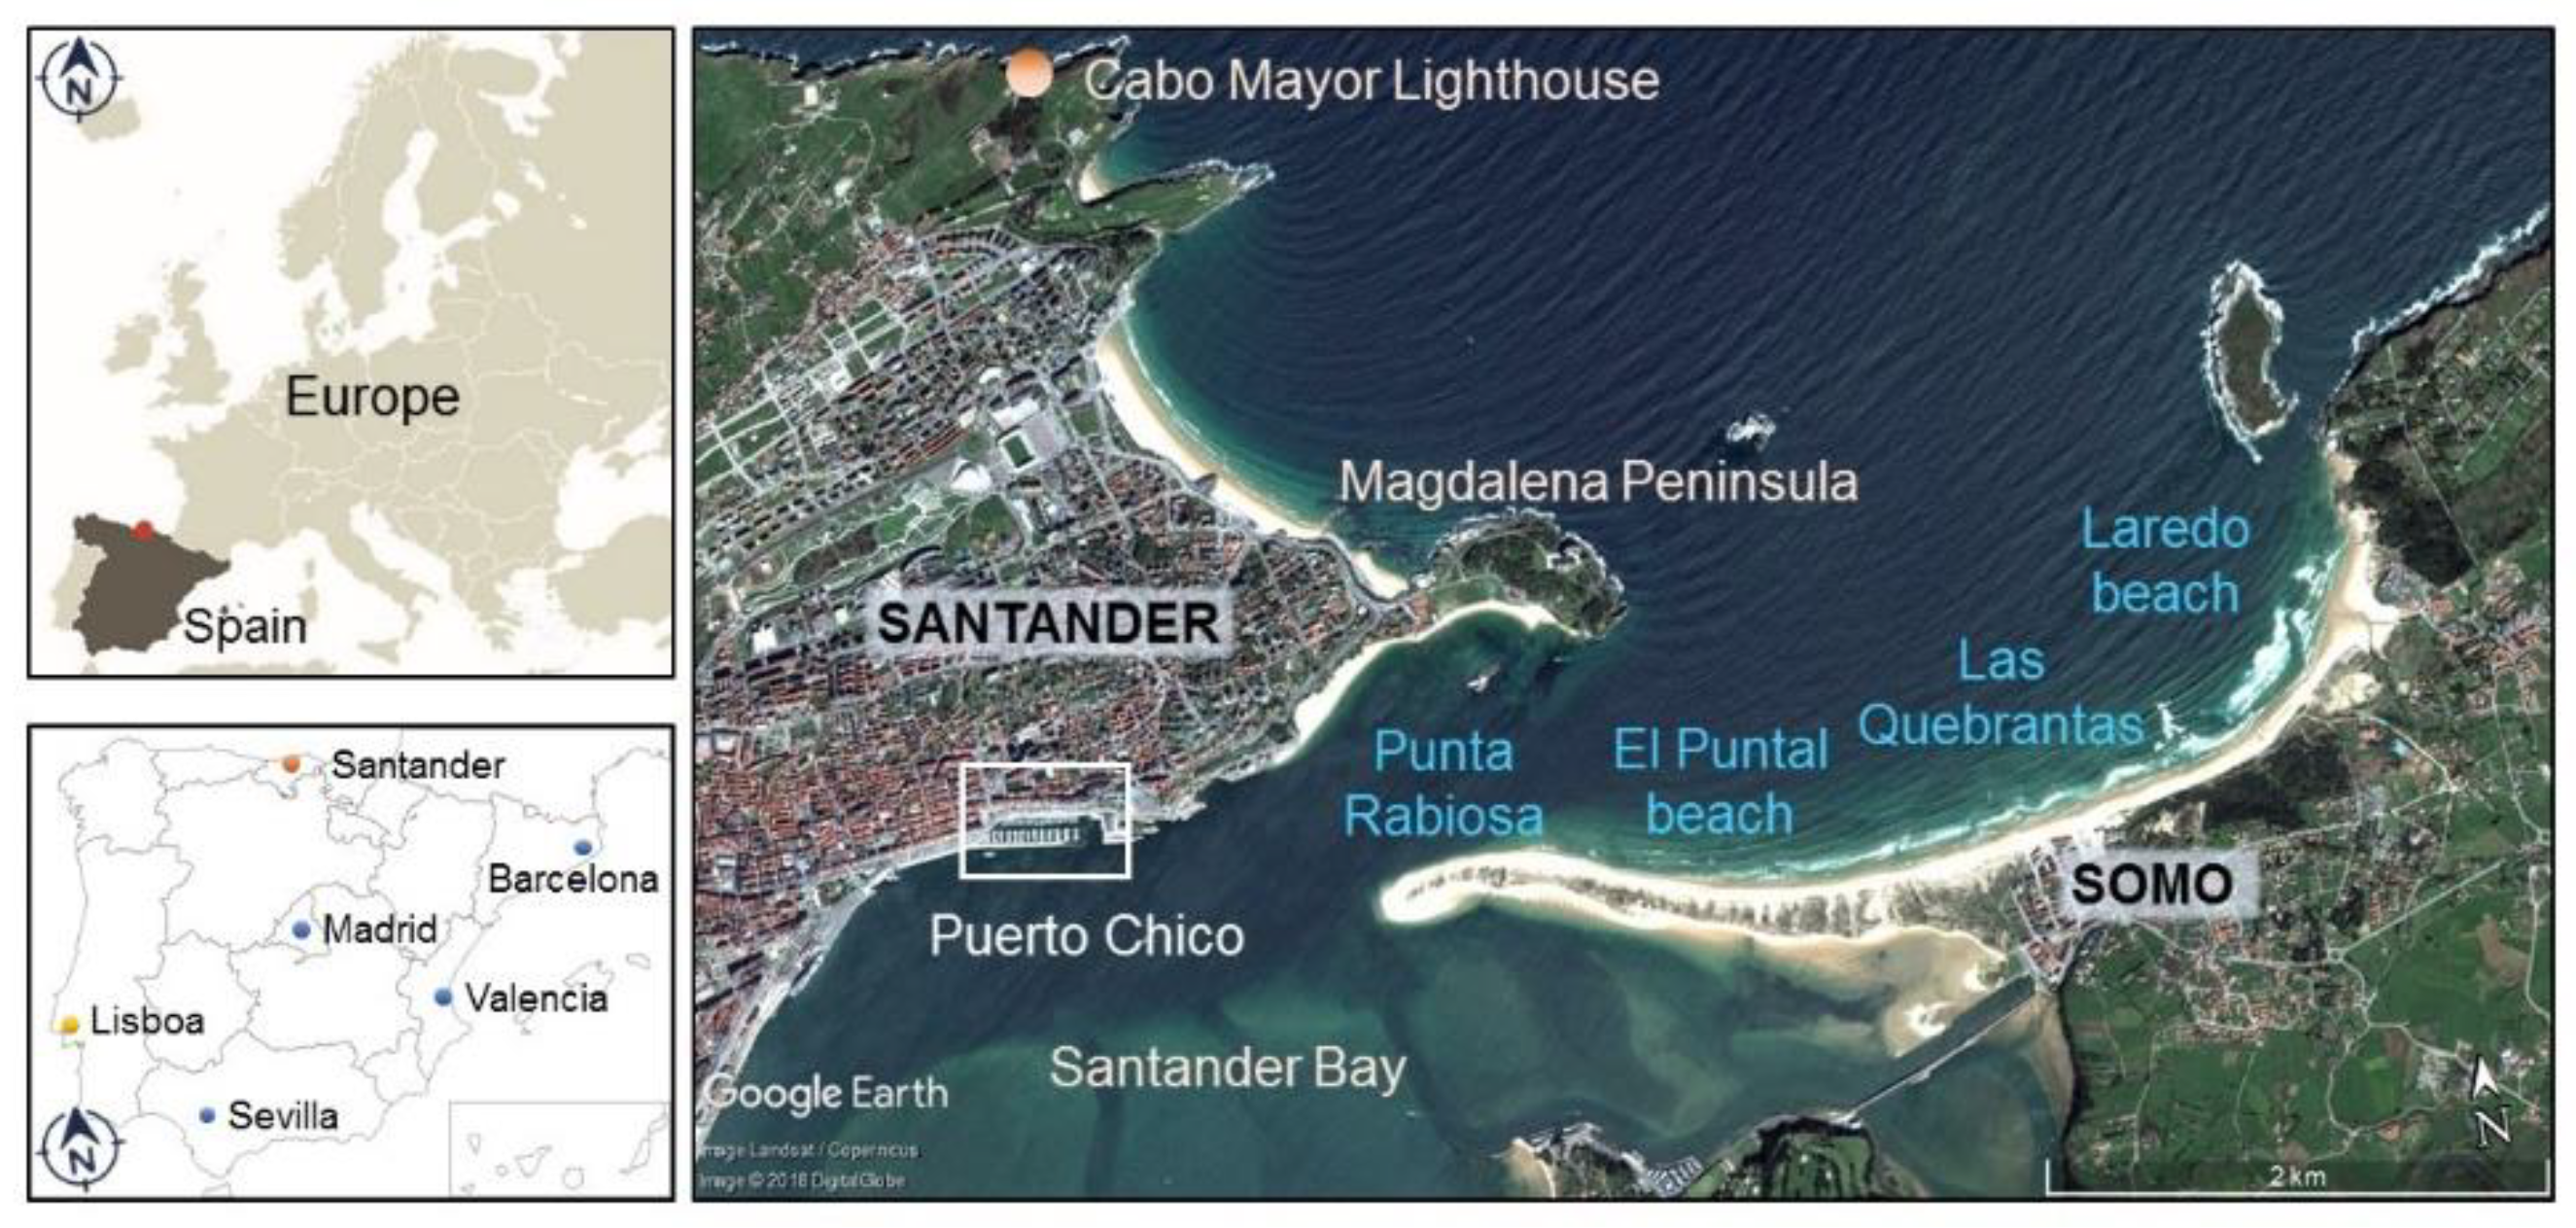
2. The Study Area
3. Methodology
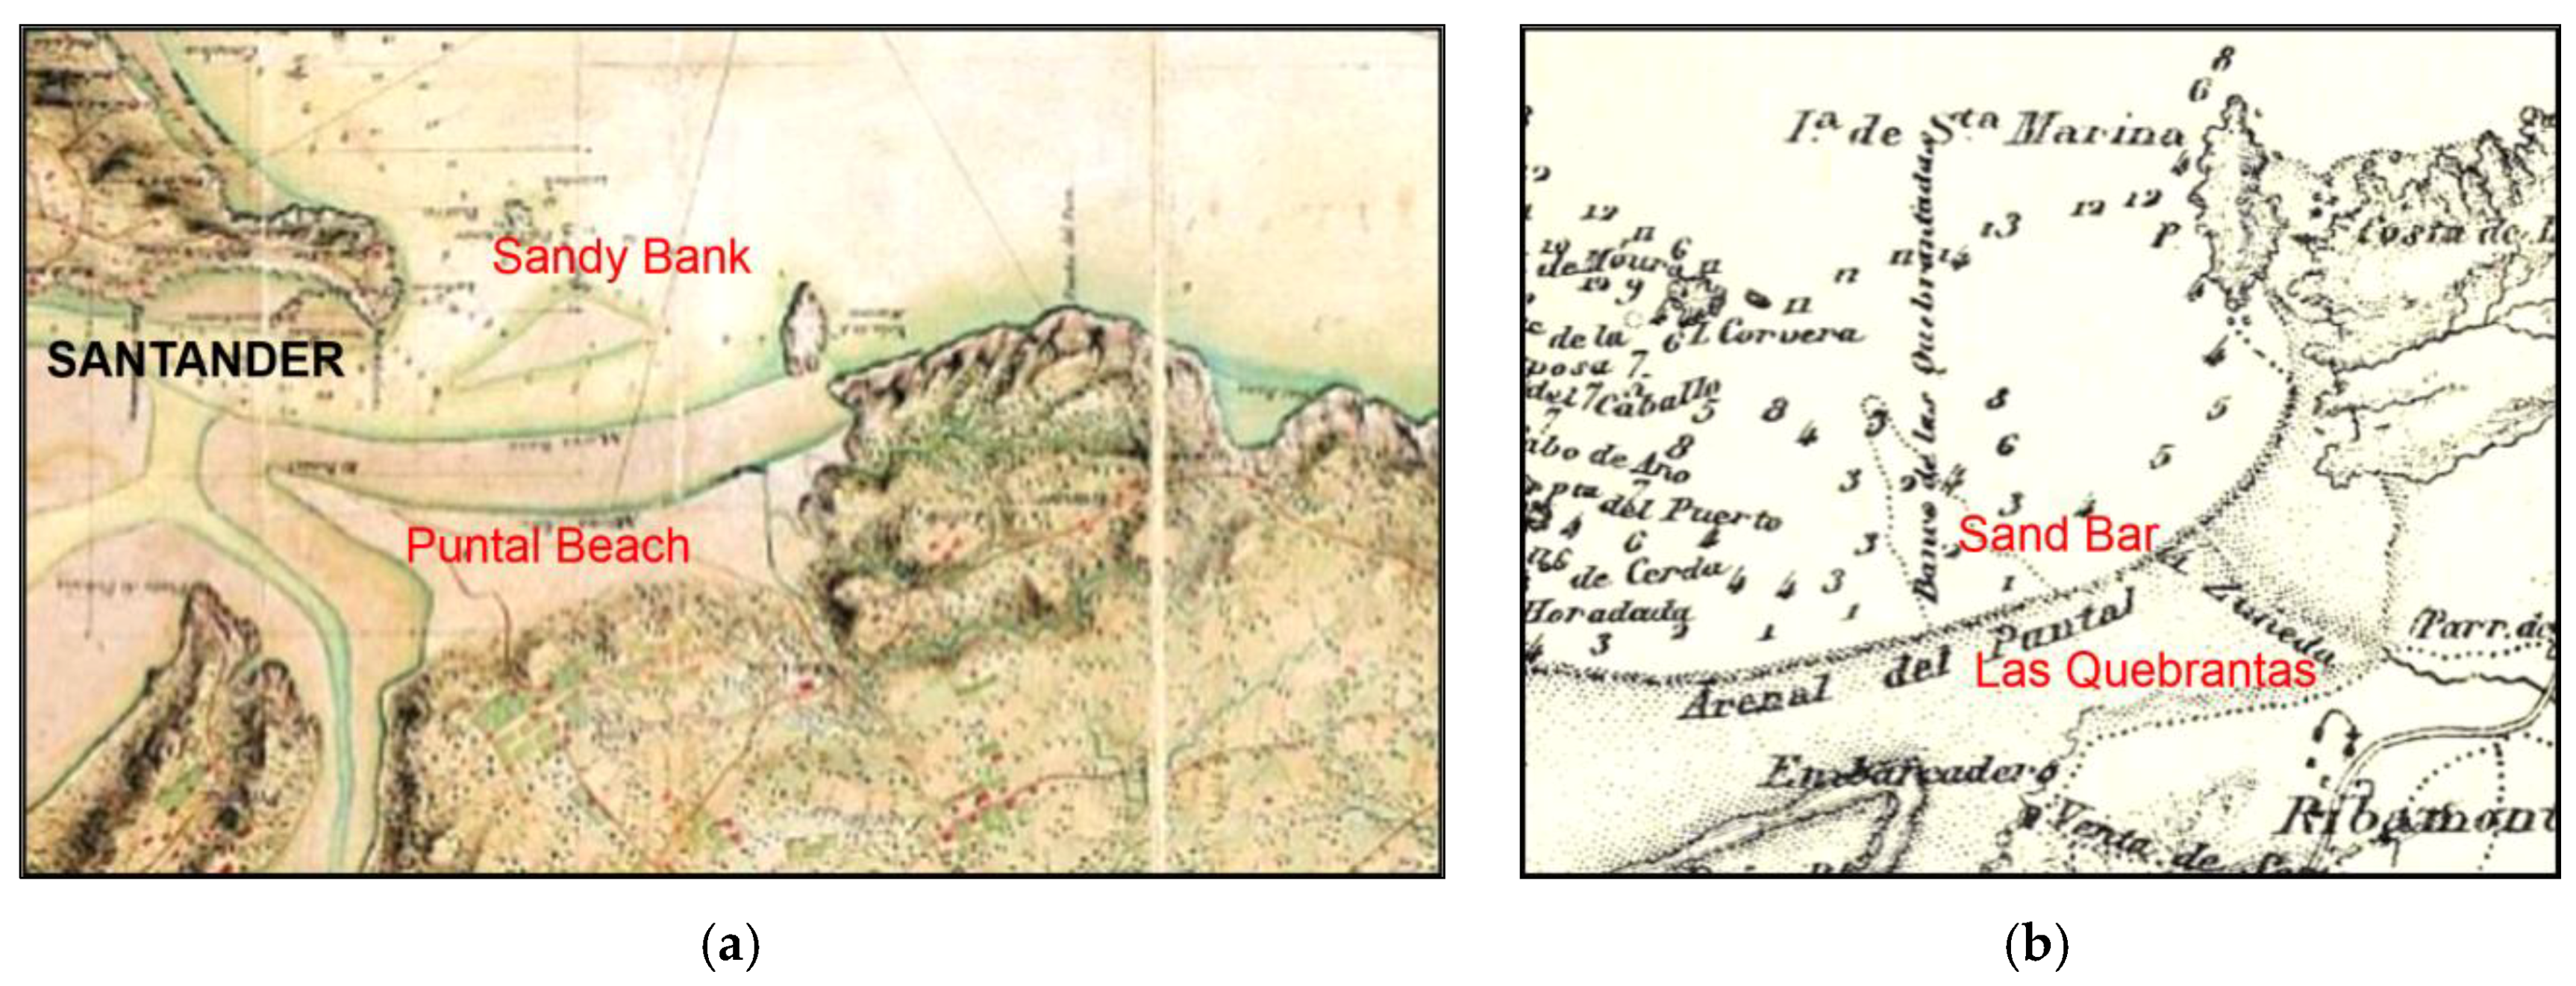
3.1. Analysis of Historical Mapping (1726–1860)
3.2. Analysis of Sea Storms (1985–2017)
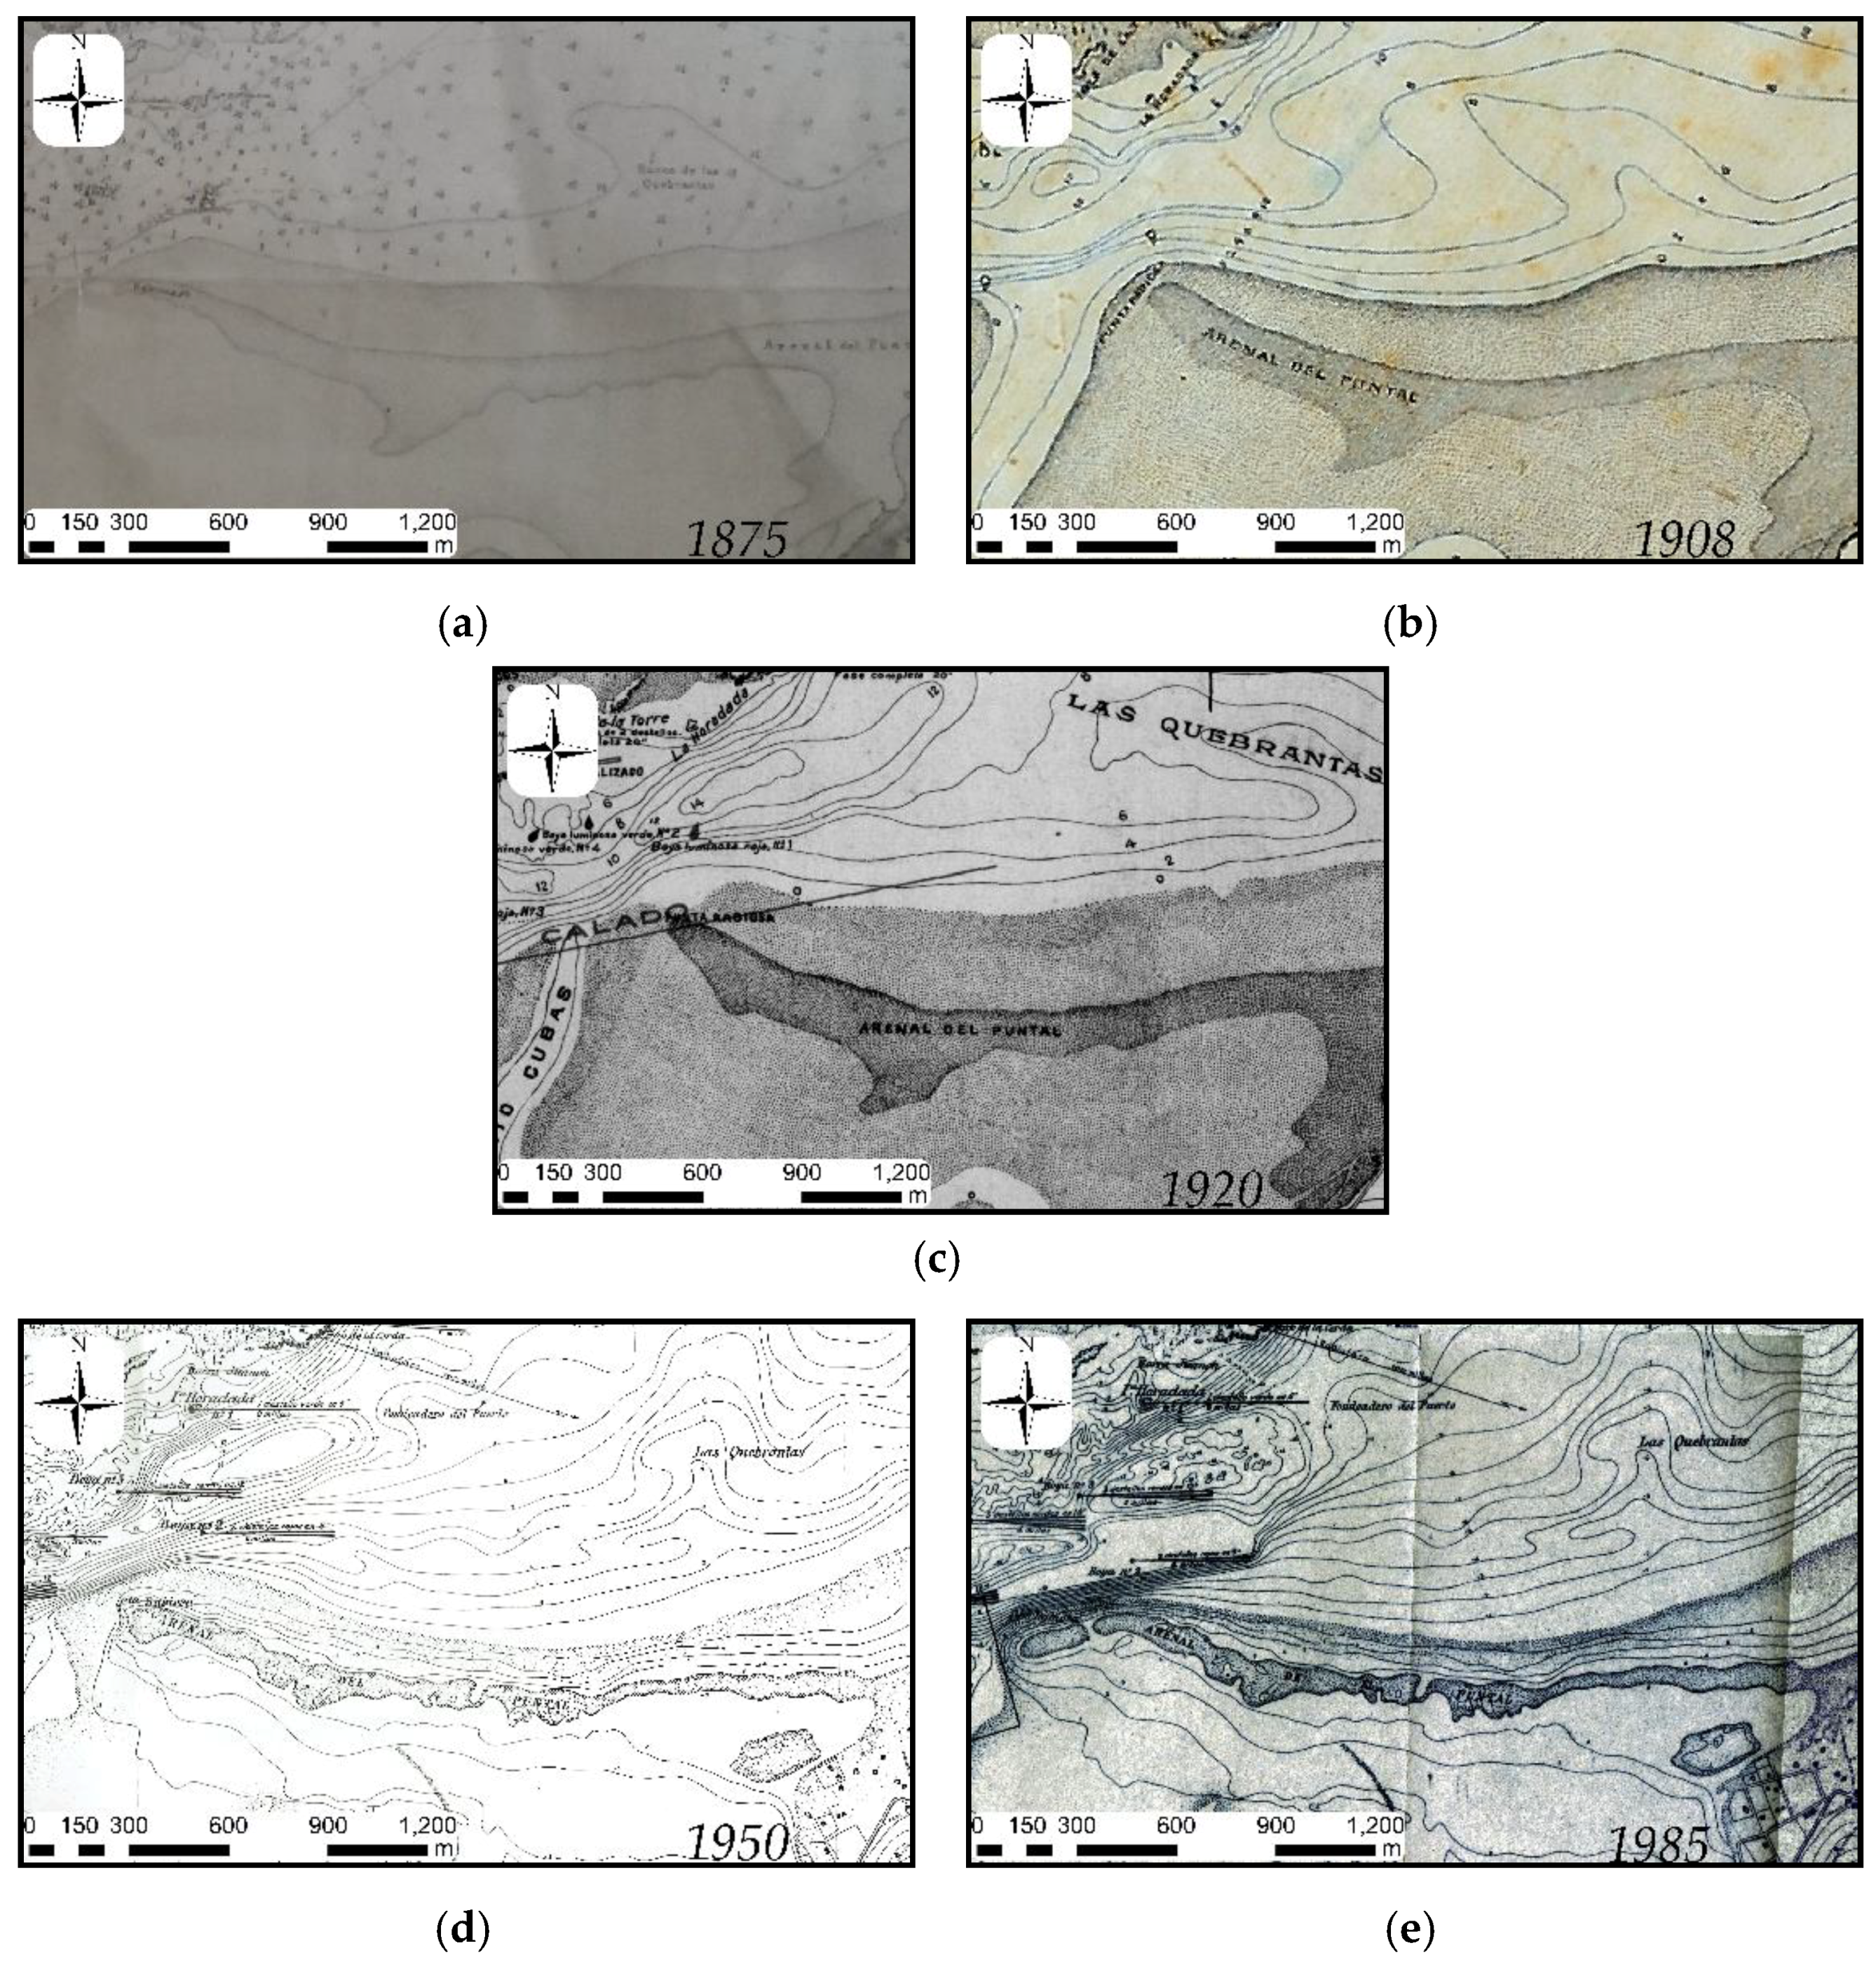
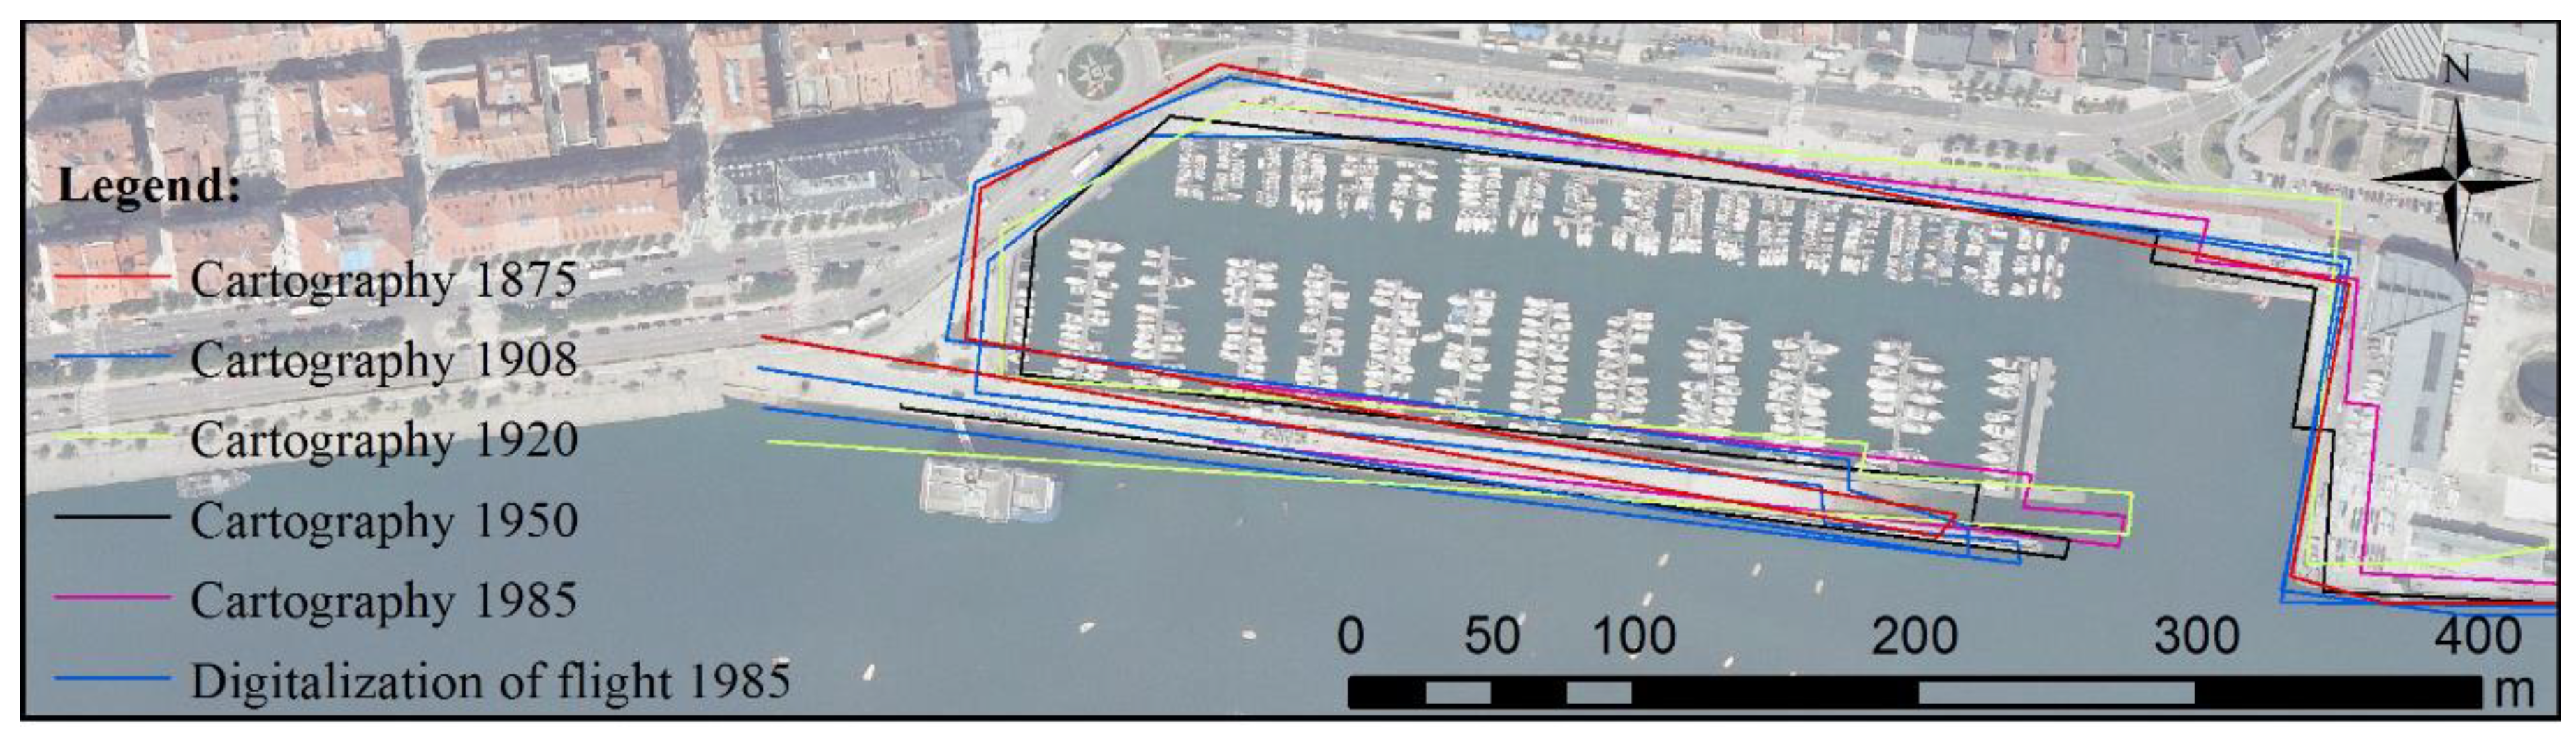
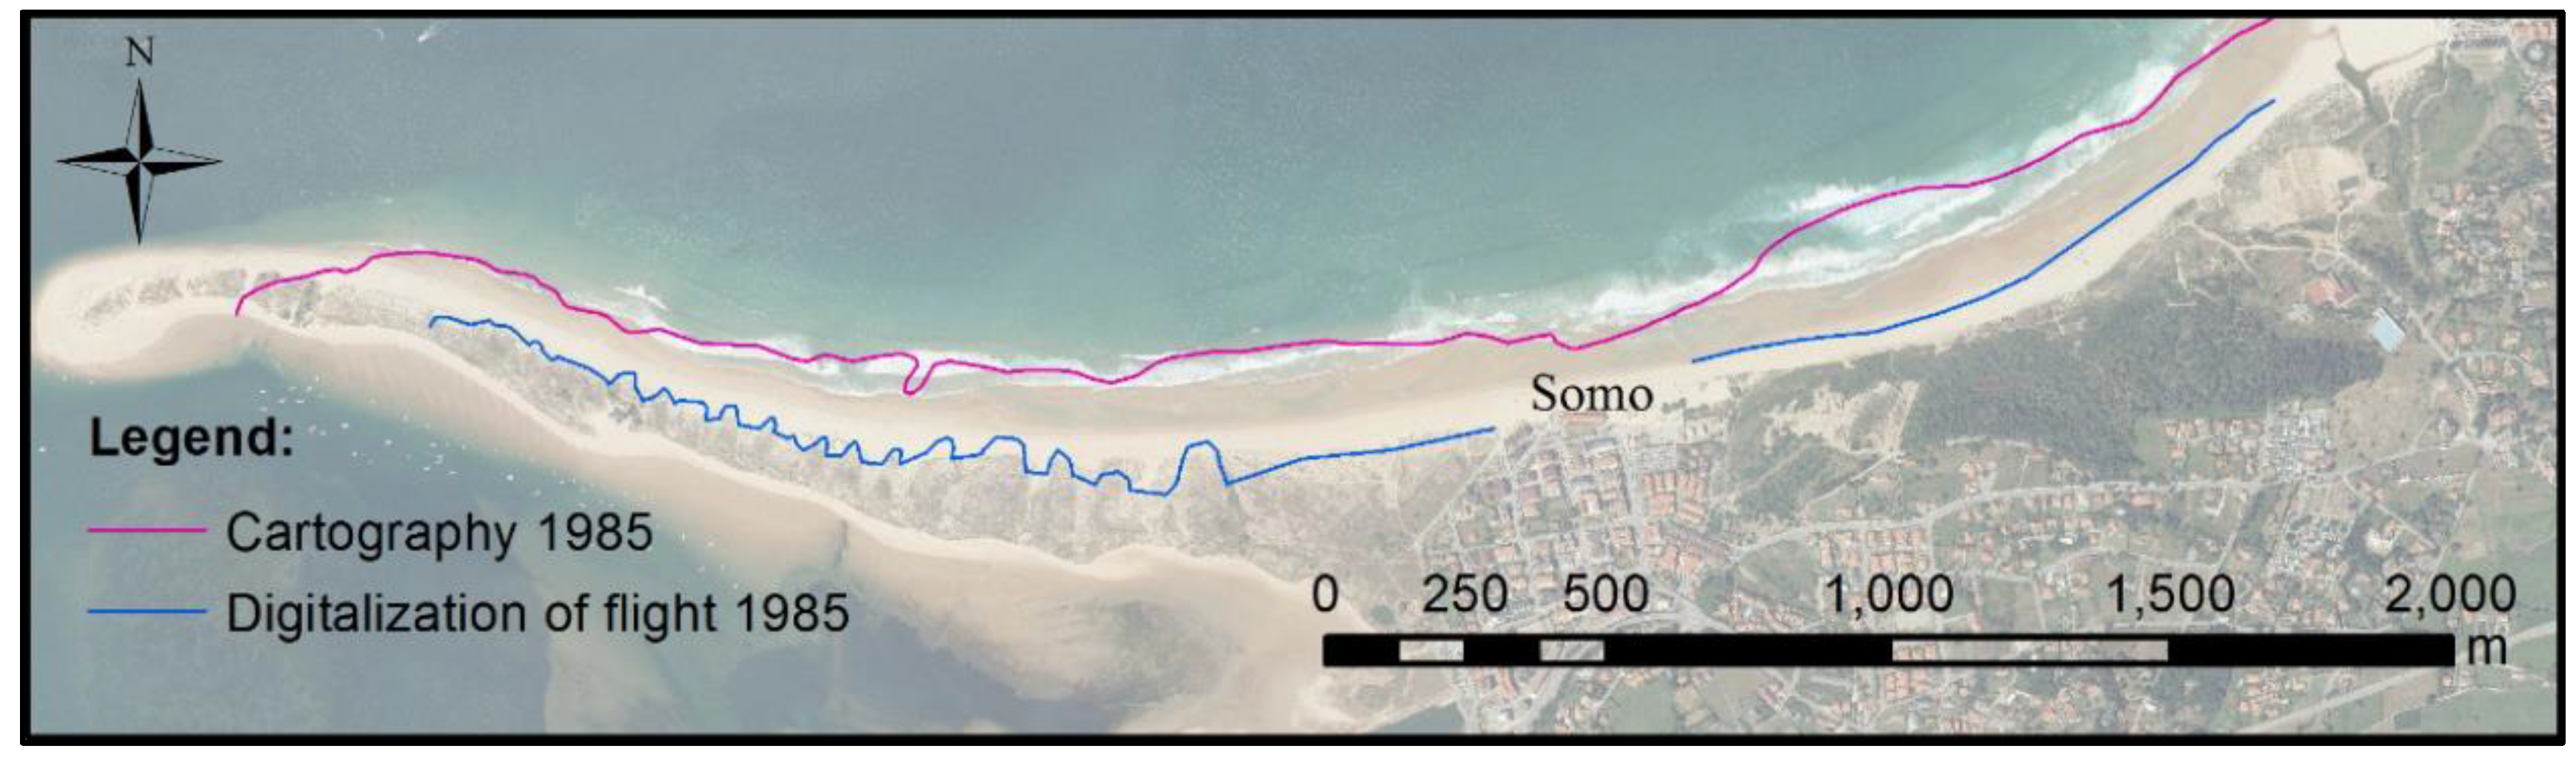
3.3. Cartographical Study (1875–1985)
3.4. Photogrammetric Analysis (1985–2014)
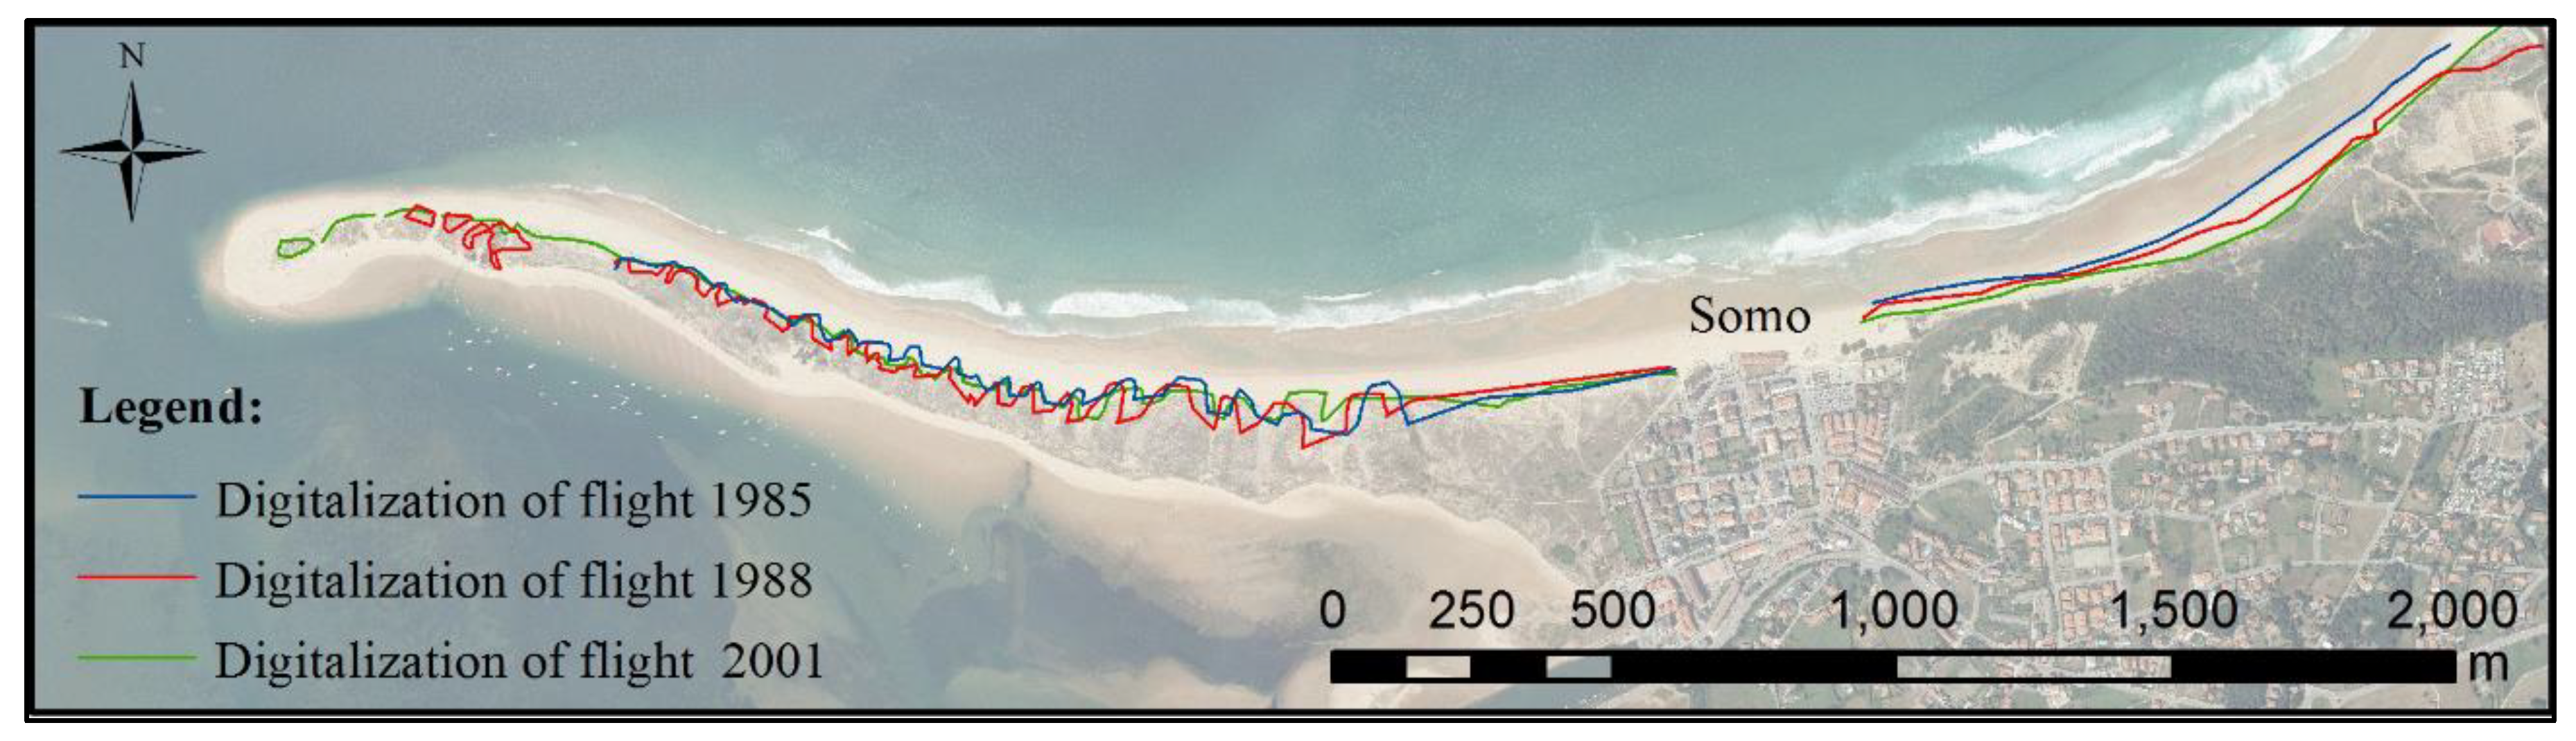
- Flights without photogrammetric information (1985, 1988, and 2001): There is no certification of camera calibration. The aerial photography was rectified using points situated on the beach, and later, the front of the sandy slope was digitalized.
- Photogrammetric flights (2005, 2007, 2010, and 2014): These are of good photogrammetric quality and open up the possibility of orienting pairs of photographs and generating stereoscopes. Camera calibrations were certified and mapping was performed in the digital stereoplotter, Digi 3D.
3.4.1. Digitalization of Photogrammetric Flights (1985–2001)
3.4.2. Photogrammetric Restitutions (2005–2014)
3.5. Topographical Measurement (1988–1993)
3.6. Terrestrial Laser Scanner (2011–2017)
4. Results and Discussion
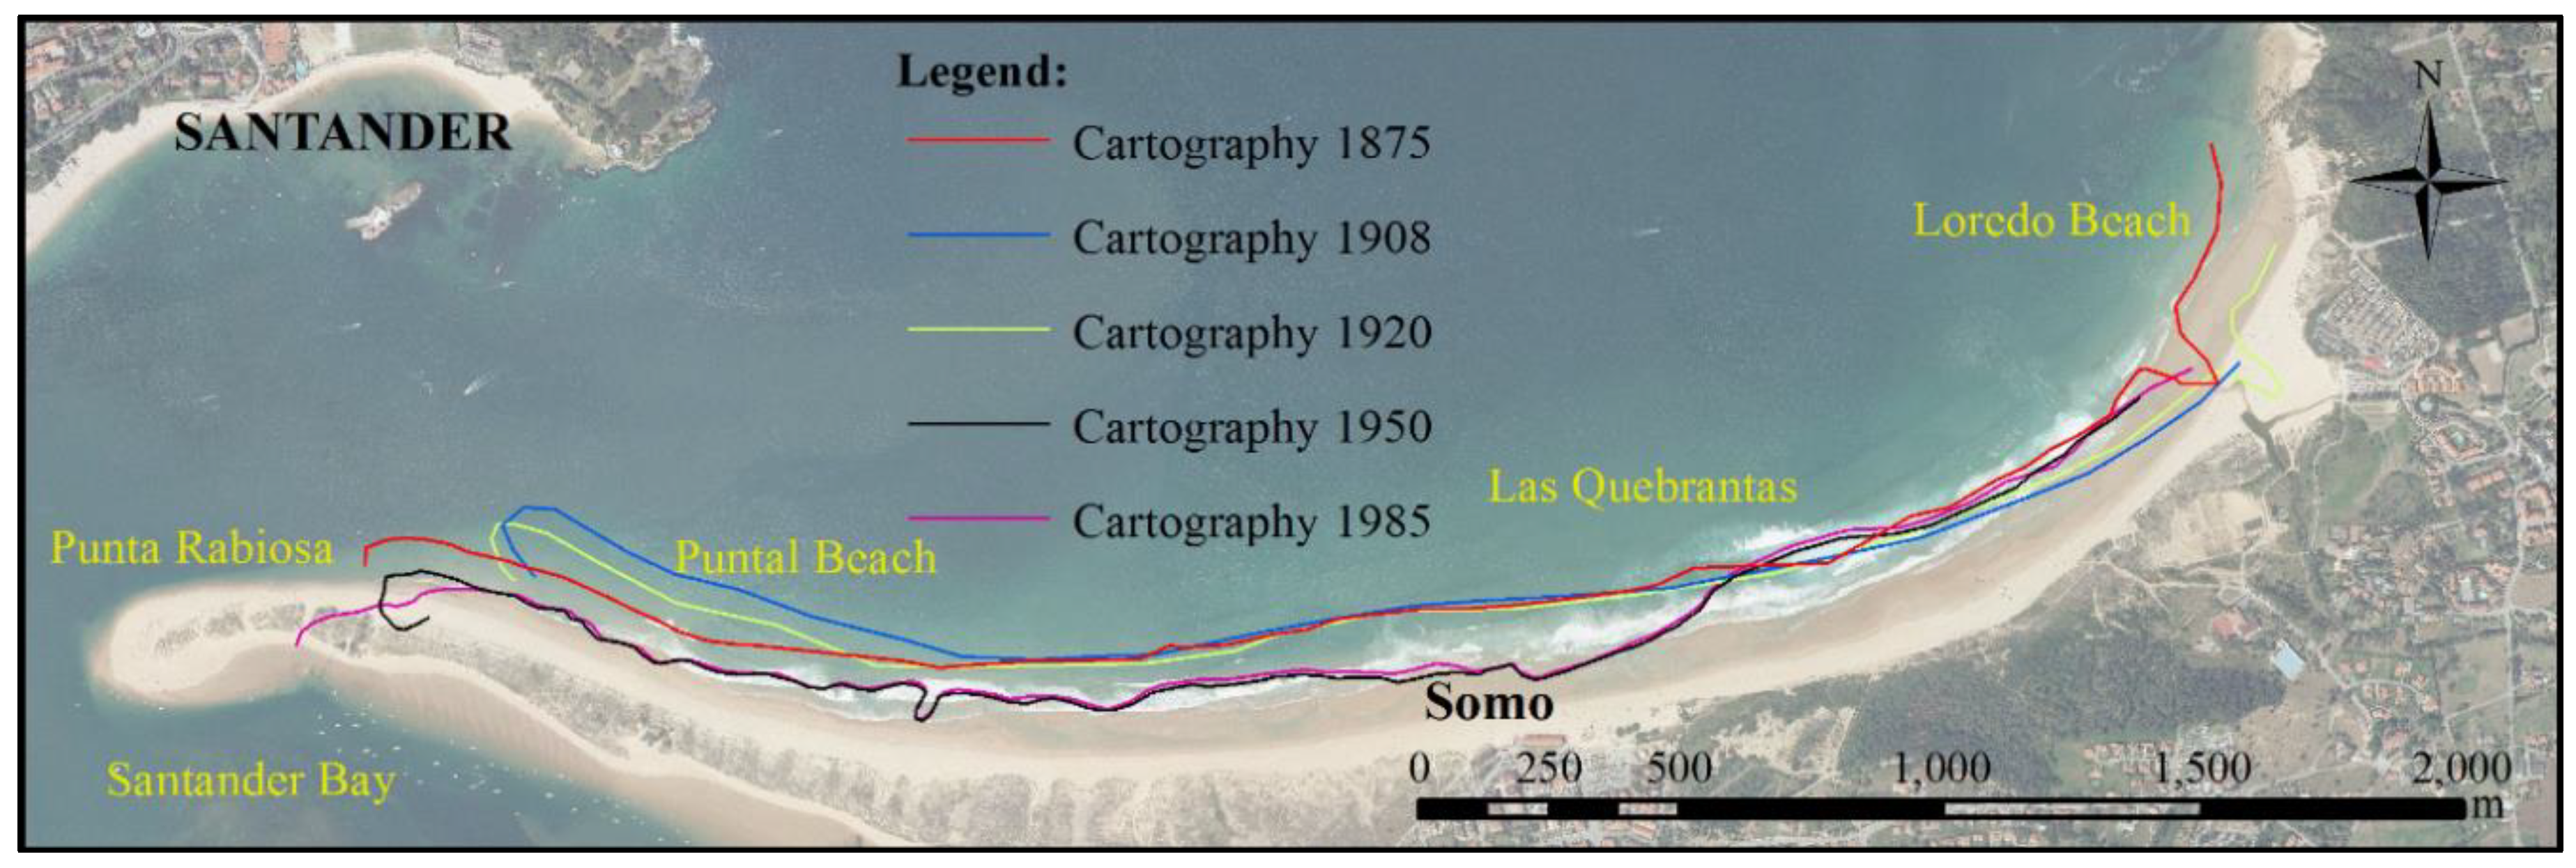
- Cartography of 1875, 1908, 1920, and 1950, and digitalization of the flight in 1985: The curve of the 5-m level in Punta Rabiosa between 1875 and 1920 indicates a turn from west to northeast (Figure 5). In the period of 1950–1985, it underwent a deviation in its trajectory toward the west (Figure 5). This change in direction is still ongoing today and is possibly because of dredging at the mouth of the bay of Santander. There are estimates indicating that, from 1870 to the present, Punta Rabiosa grew by 1075 m toward the west [20], while [48] some estimate this growth to be 425 m since 1926. During this period (1875–2017), our calculations determine a westward advance of 470 m.
- This area of the El Puntal Beach retreated southward due to erosion, a process that is ongoing. There was an estimate of the shoreline retreat of 100 m between 1929 and 1960 [10], while Reference [48] suggests a retreat of 200 m between 1920 and 1985 (Table 4). Our calculations indicate a retreat of around 200 m between 1950 and 1985, and of approximately 375 m from 1875 to 1985 (Table 4).
- Digitalizations of the flights in 1985, 1988, and 2001: The coastal retreat in this period was 25 m.
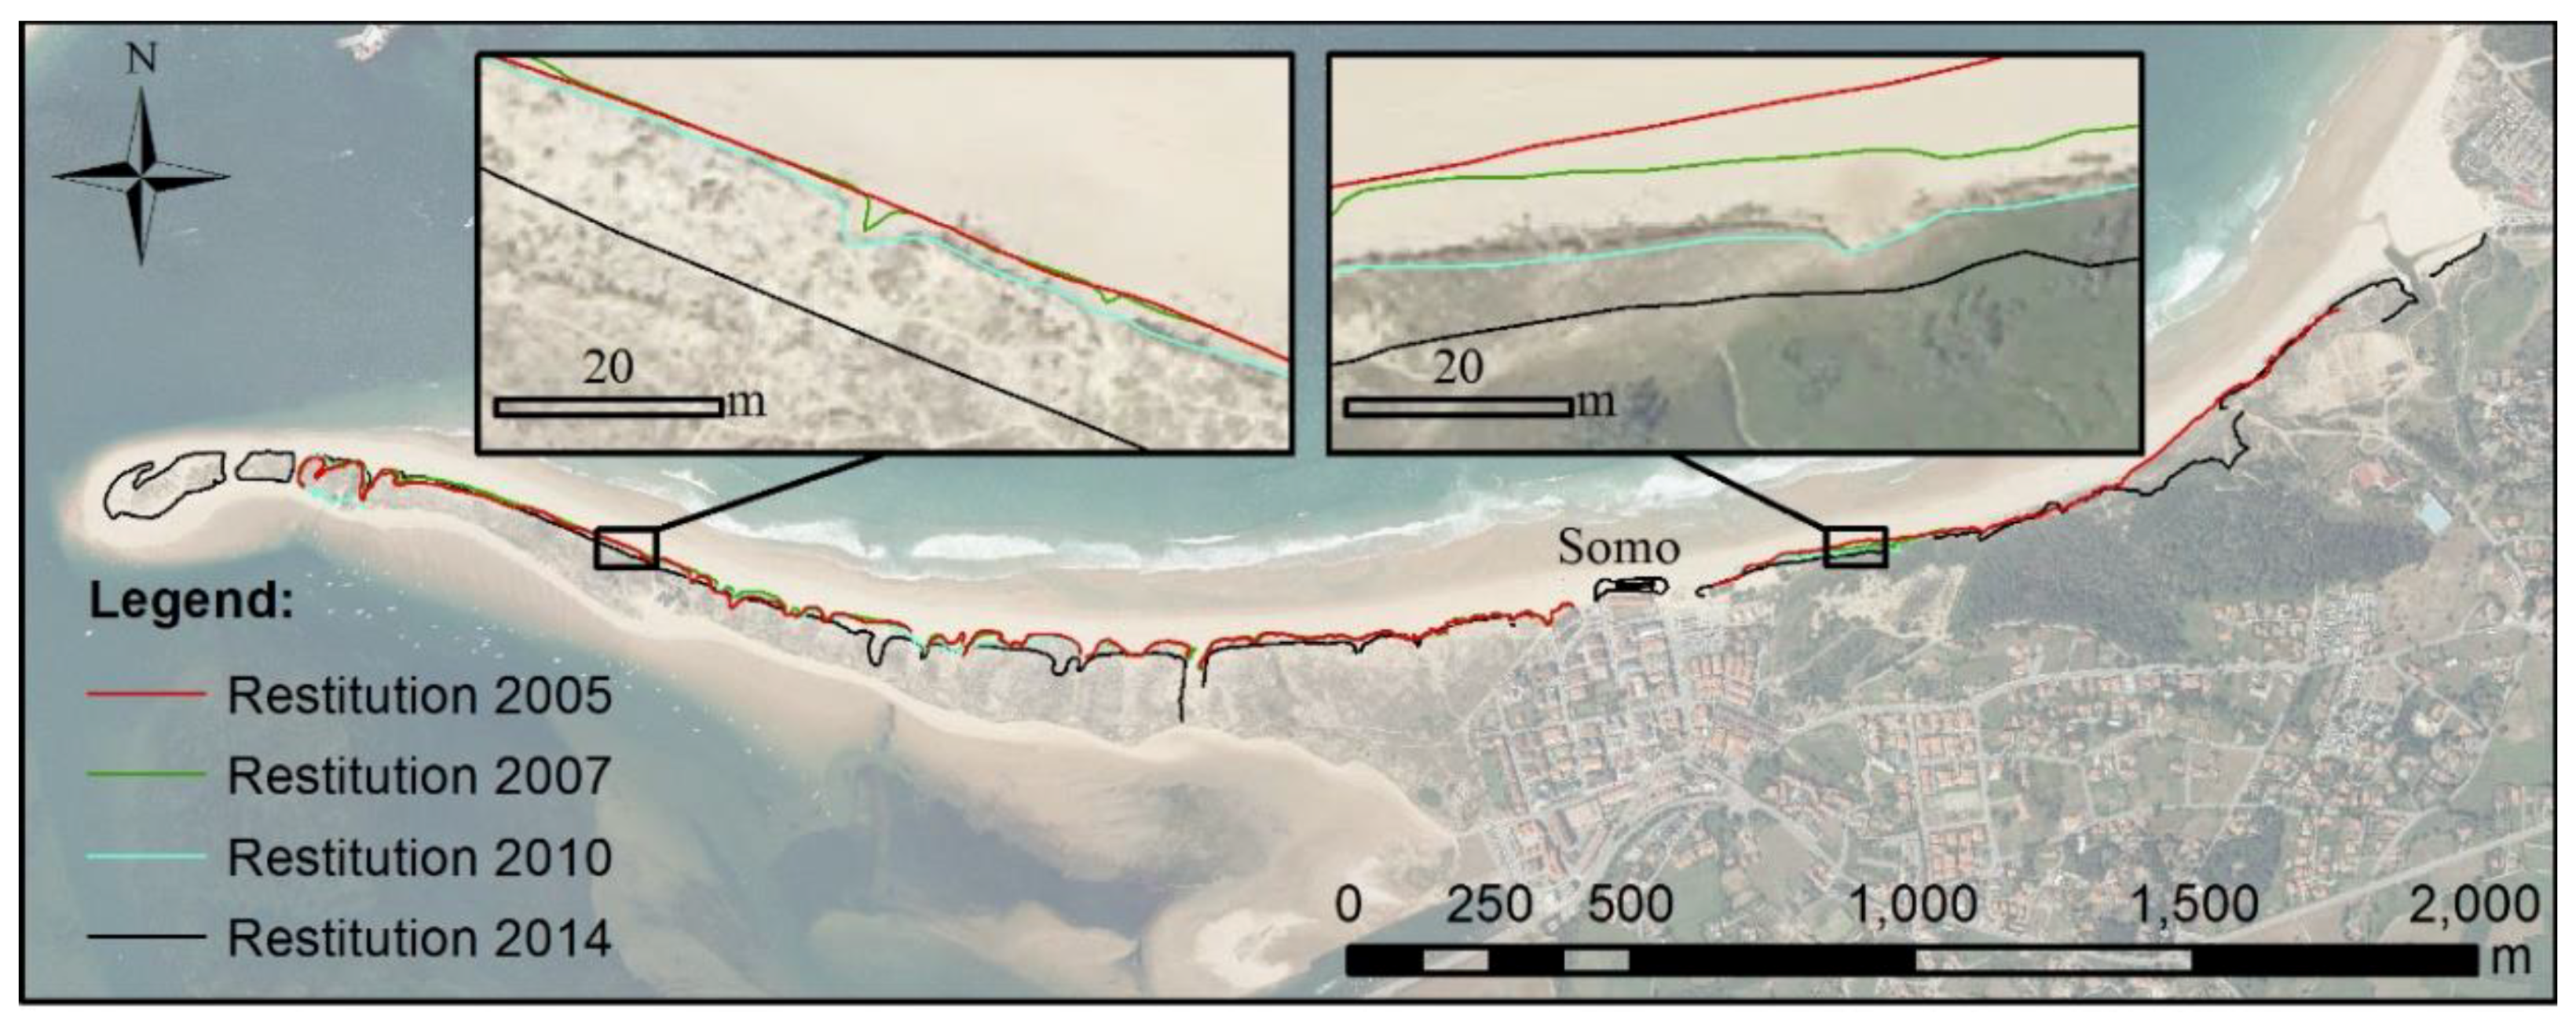
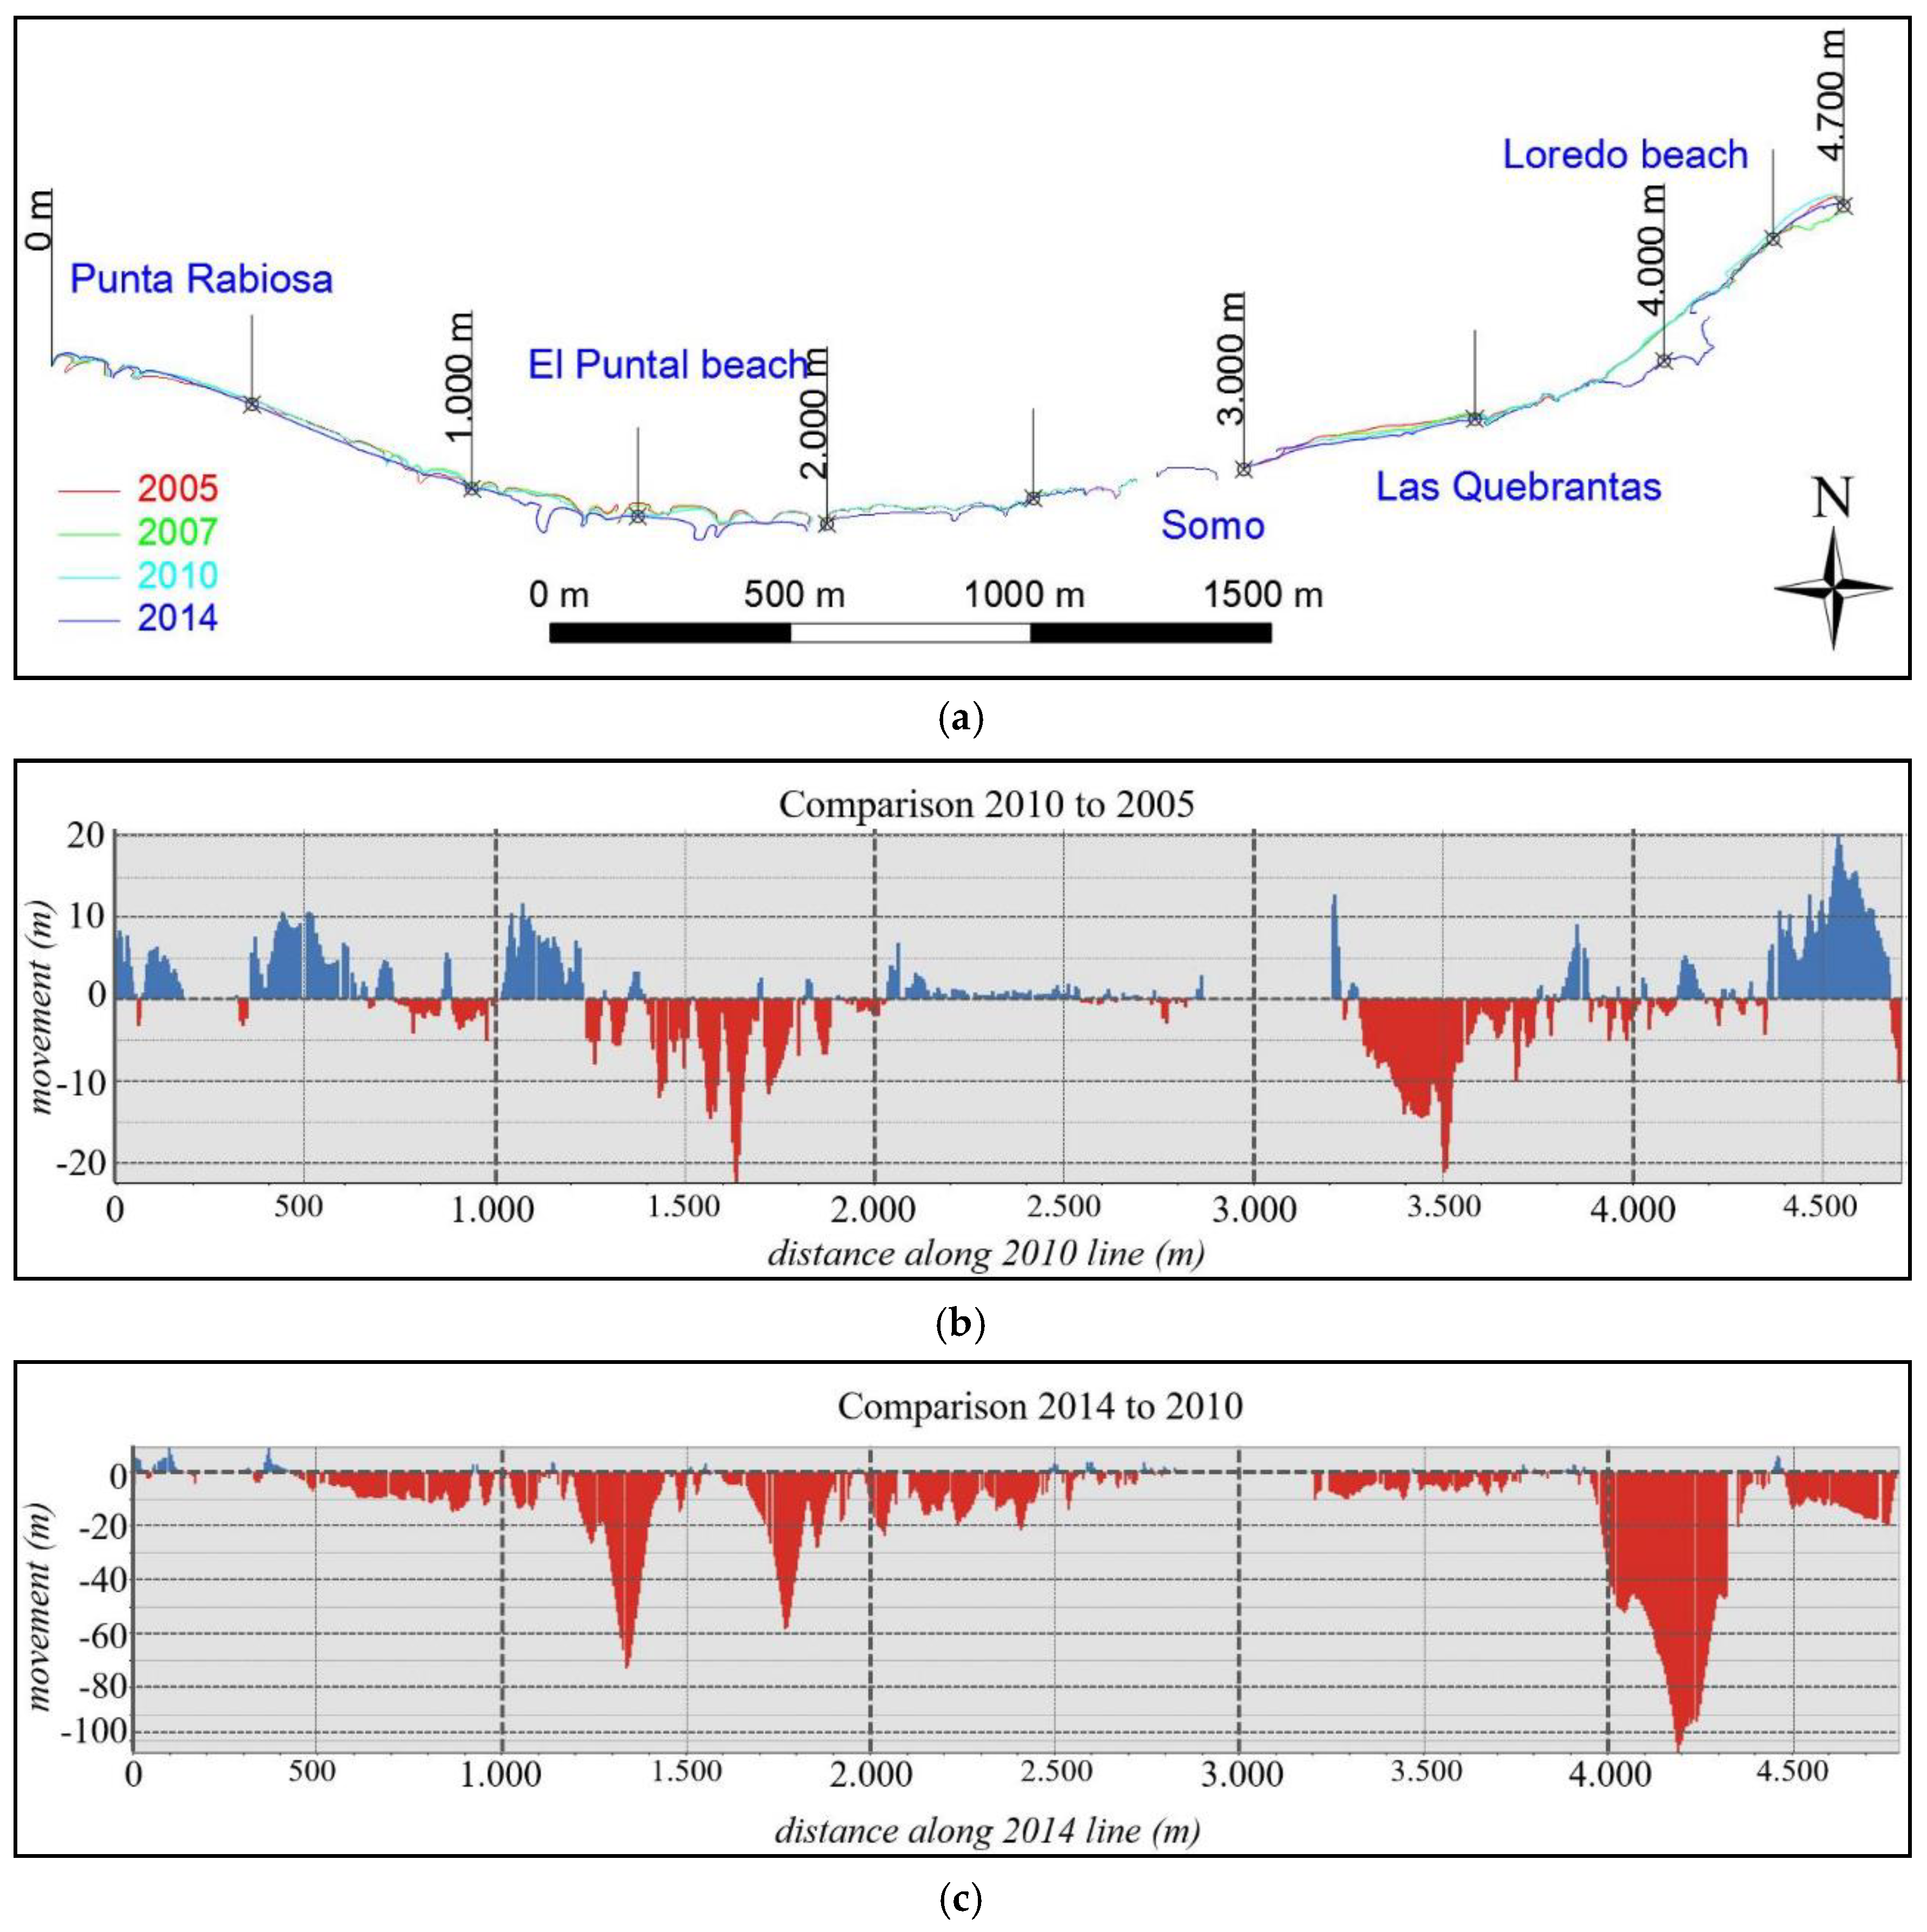
- Digitalization of the flight in 2001 and the photogrammetric restitutions of the flights in 2005, 2007, 2010, and 2014 (Figure 11a): From 2005 to 2010, there was a mean retreat of the shoreline of 5 m, although there are sections with retreats of over 20 m and others that advanced in the period (Figure 11b). Between 2010 and 2014, there was an accentuated retreat of the shoreline, particularly in the winter of 2013–2014 as a result of large storms that hit the Cantabrian Sea (Figure 11c). The estimated retreat in this area during these storms was 10 m. Thus, in the 2001–2014 period, there was a retreat of around 15 m.
- The cartography of 1875, 1908, 1920, and 1950, and the flight of 1985: The values of coastal retreat are the same as those of the rest of the El Puntal Beach, that is, 375 m.
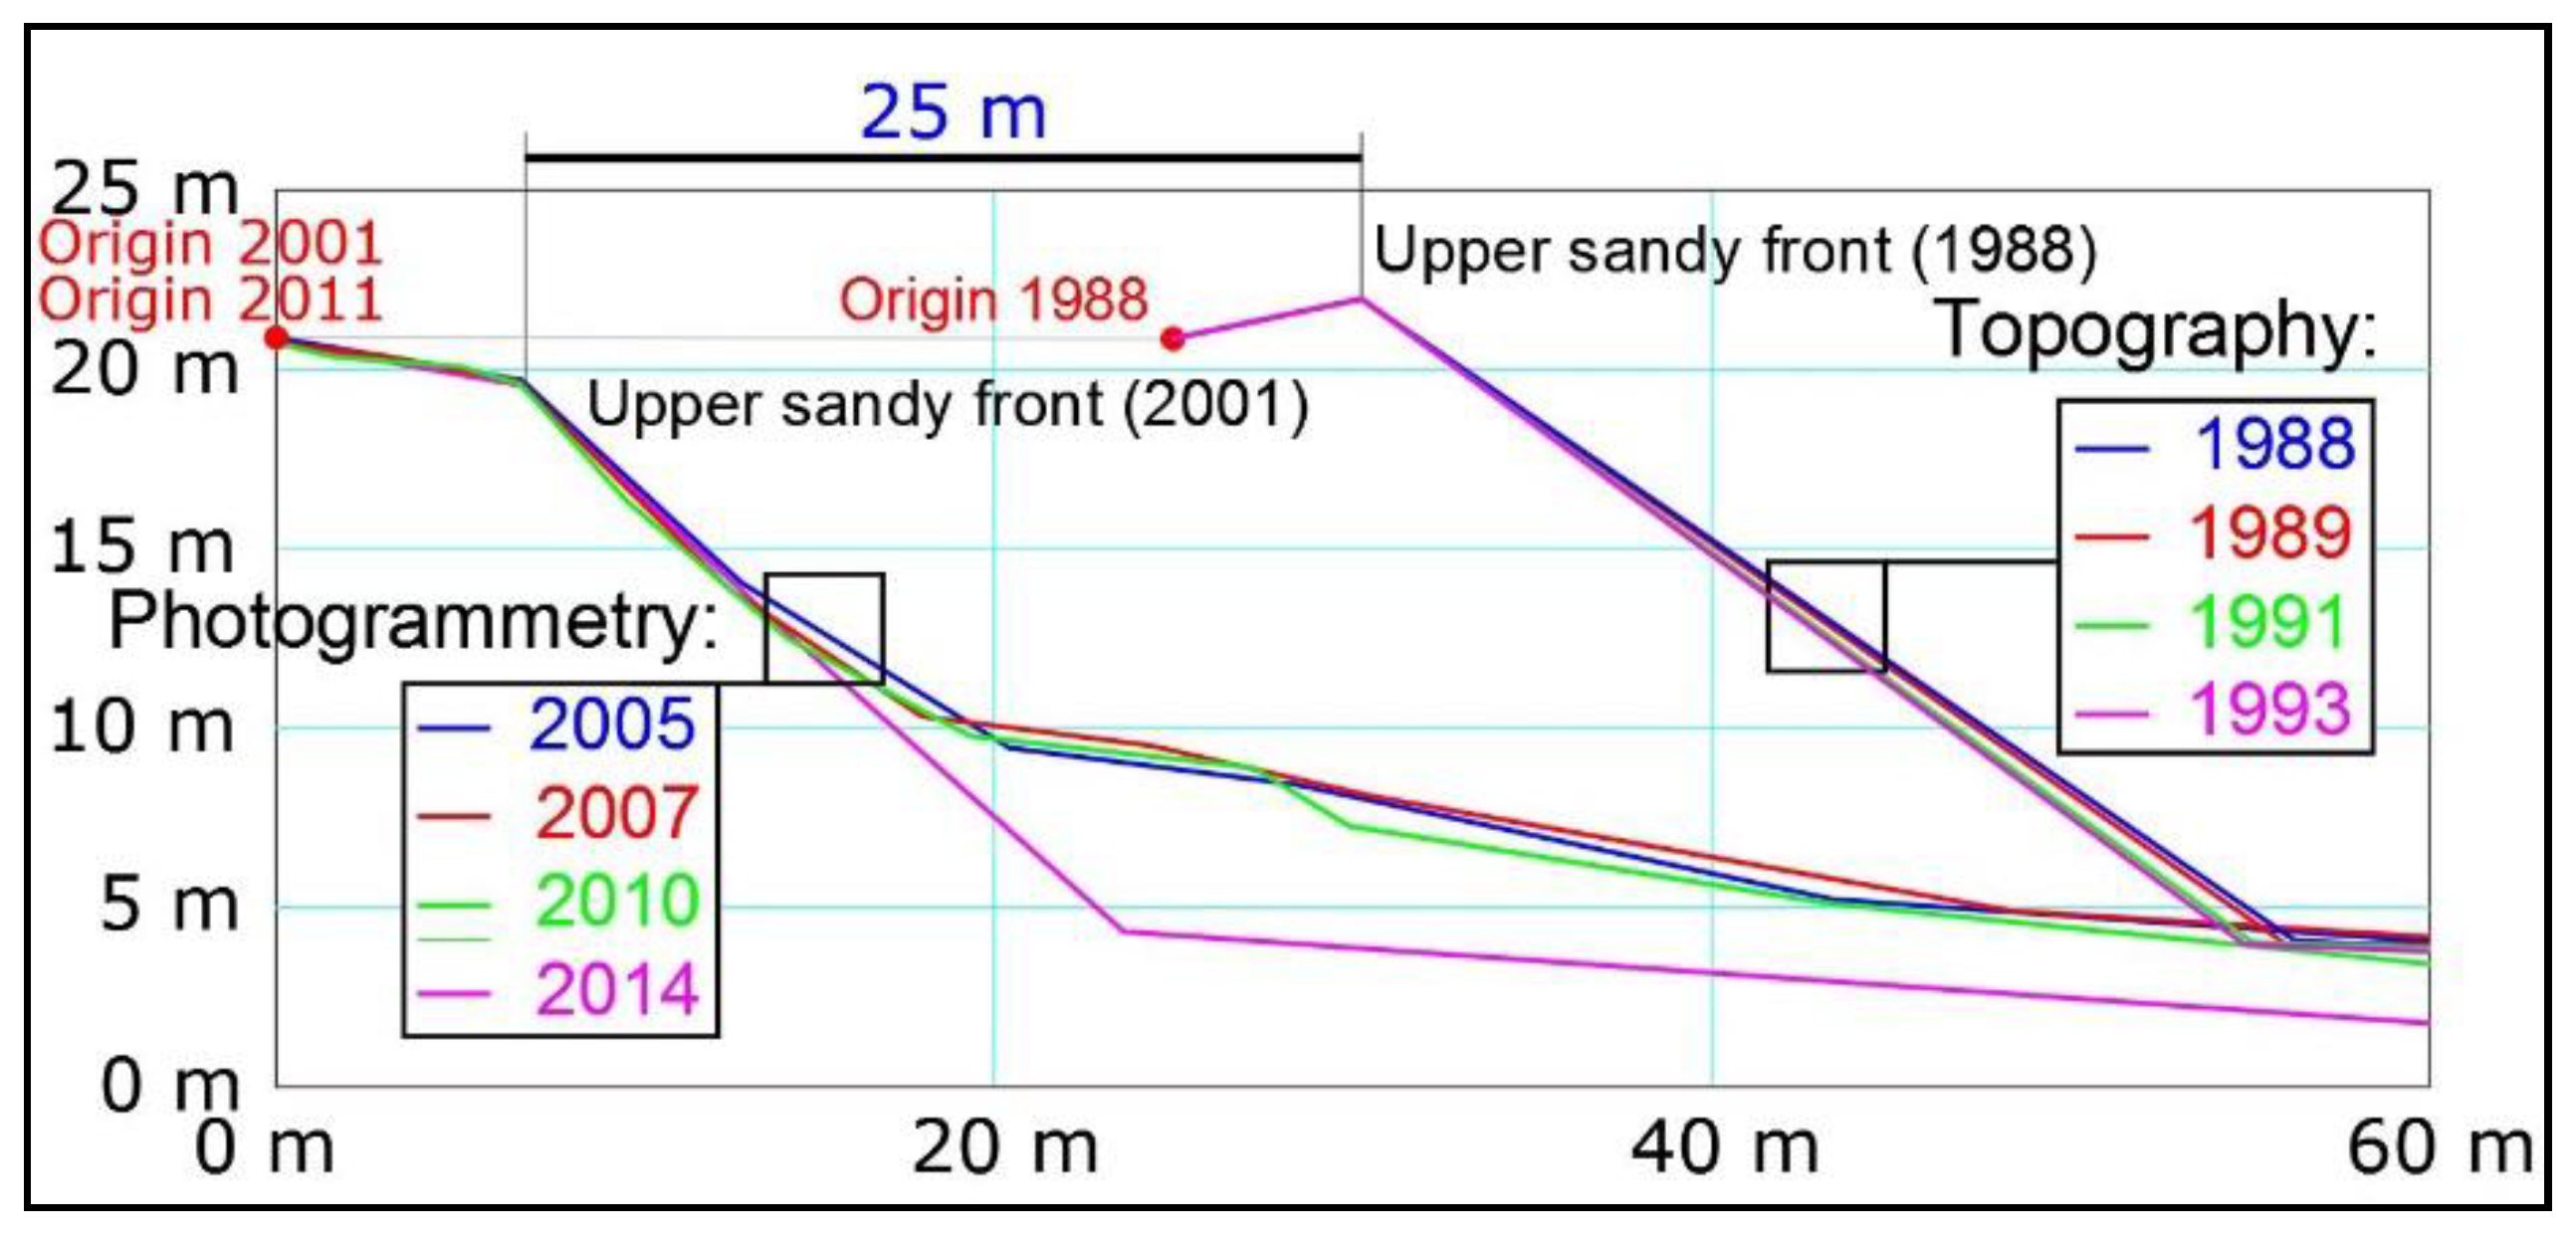
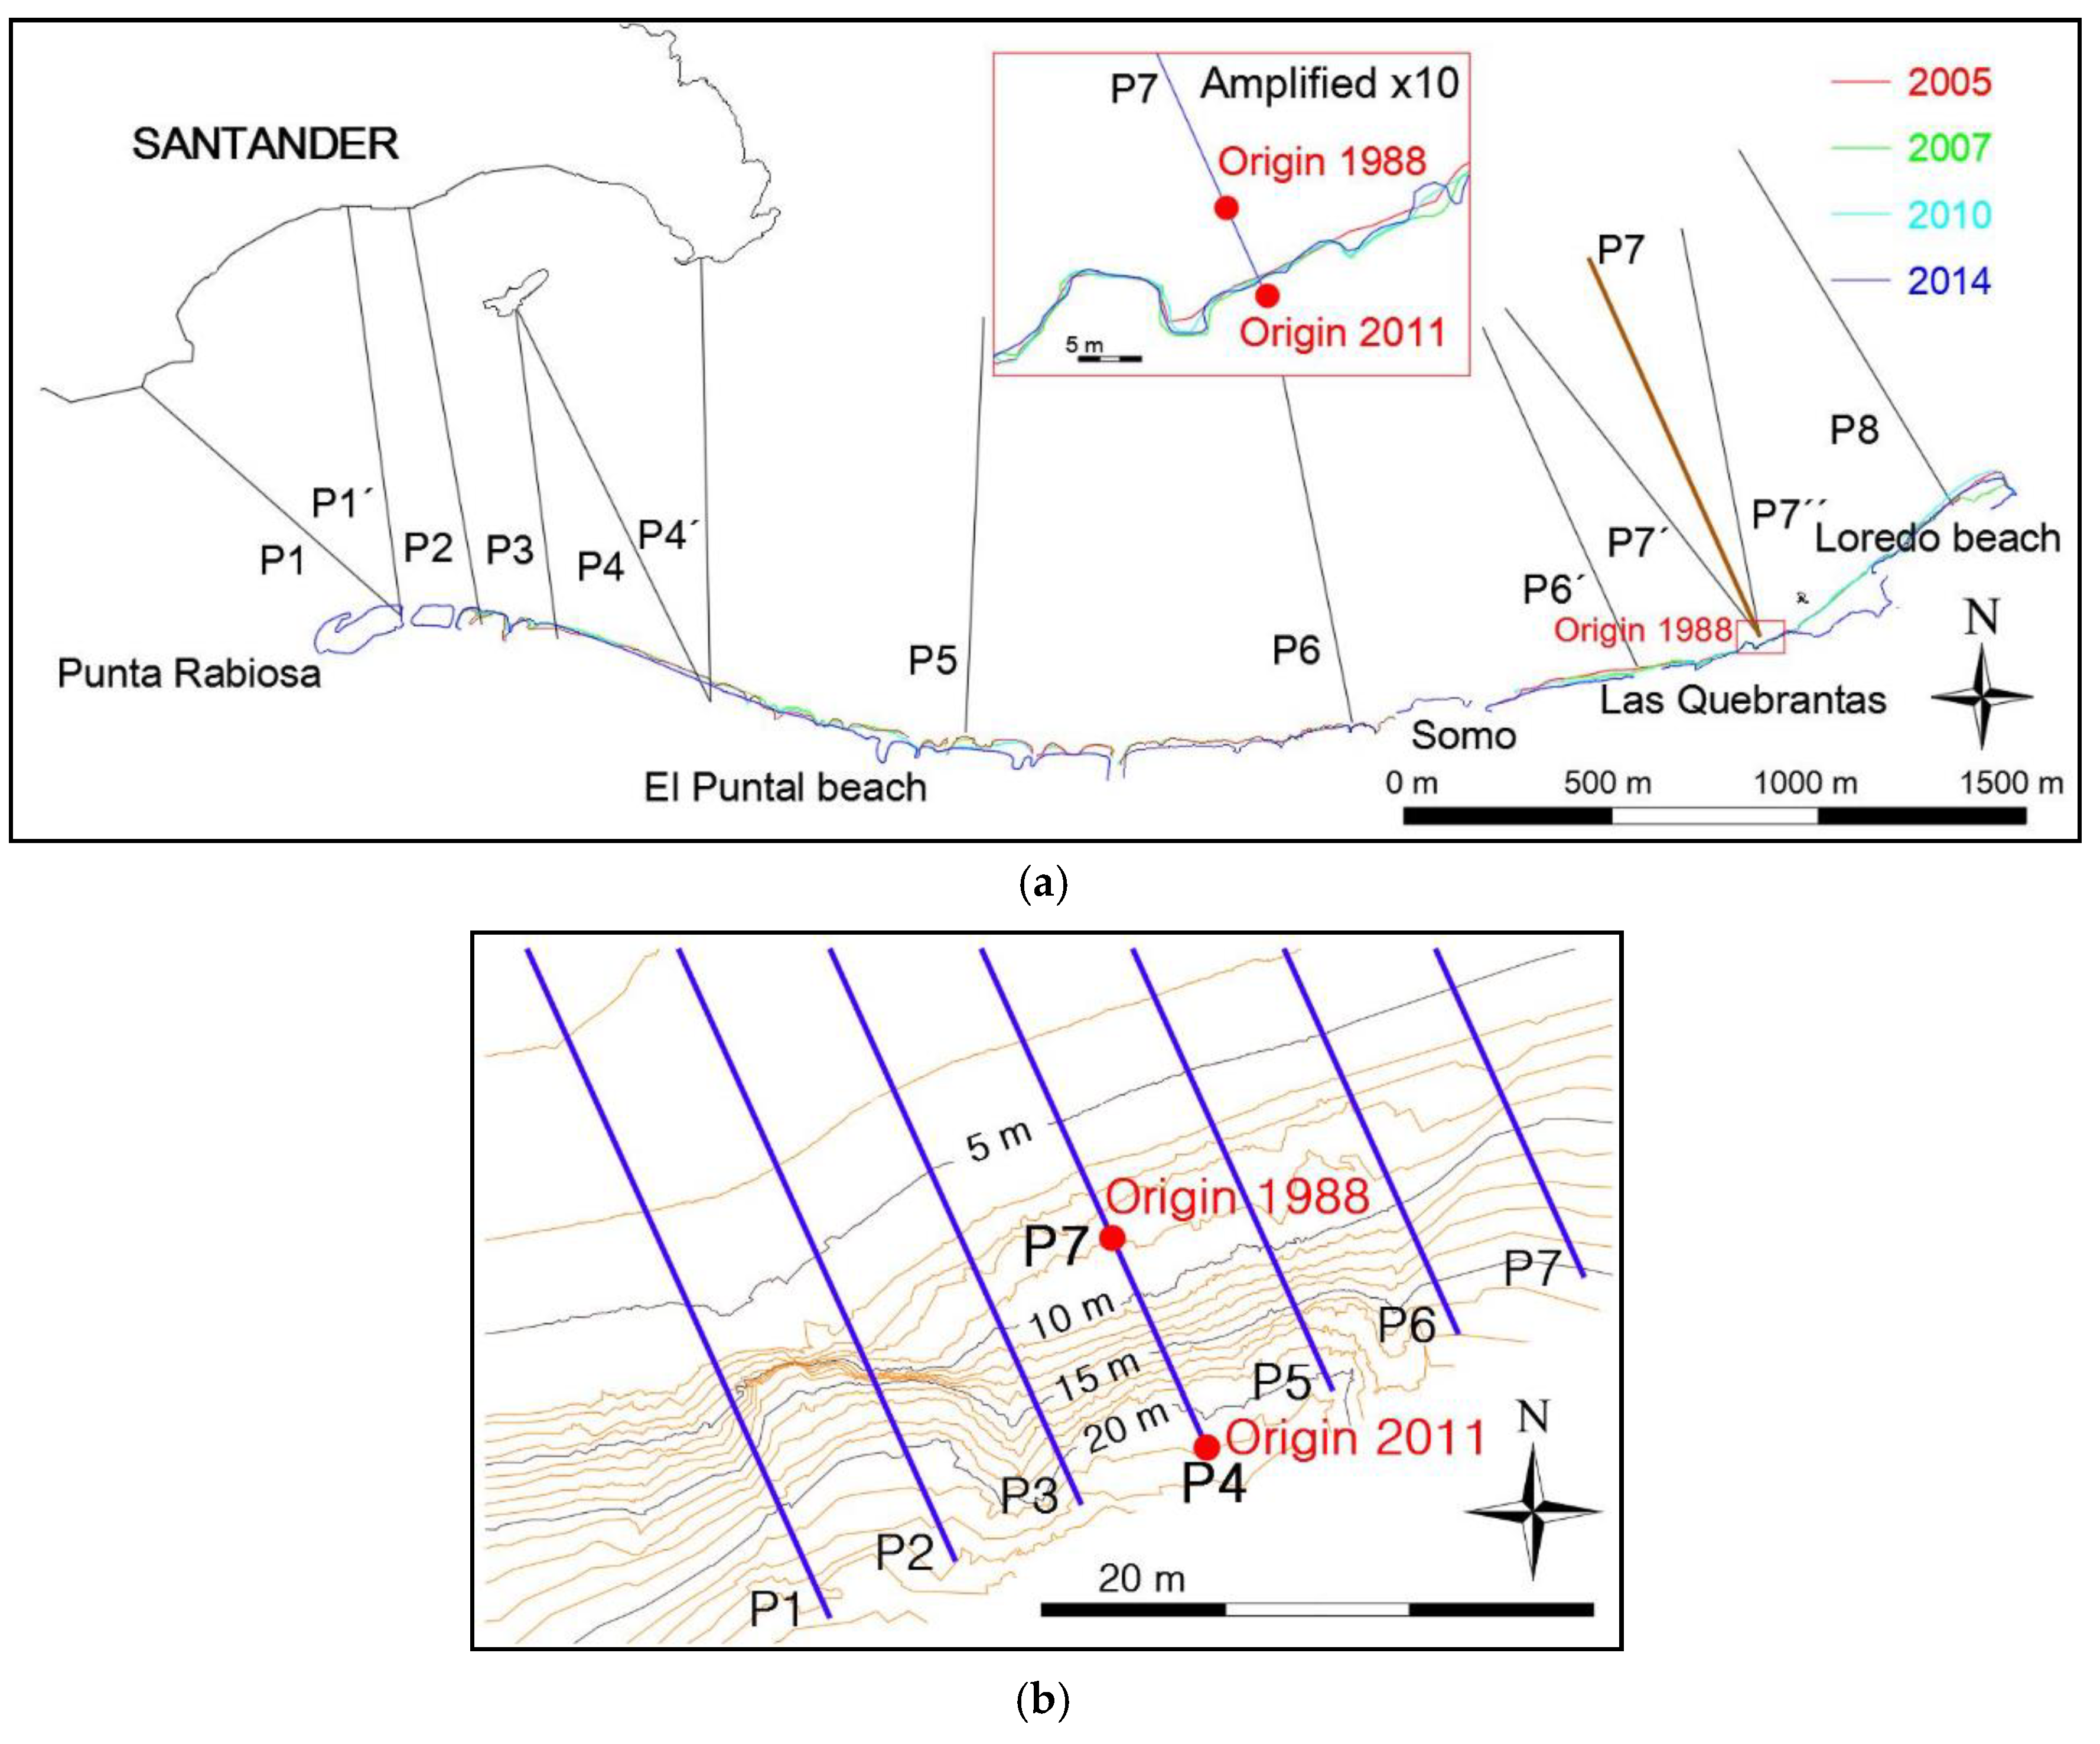
- Digitalization of the flights in 1985, 1988, and 2001: The retreat of the shoreline during the period was 30 m. Within this period, the analysis of the topographical profile (P4) between 1988 and 1993 showed a retreat of less than 1 m (Figure 12). Between the topographical profile of 1993 and the photogrammetric restitution of 2005, the shoreline retreated by 25 m given that the upper part of the slope of the sandy front between 1988 and 1993 was found to be 25 m farther out to sea with respect to 2005.
- Digitalization of the flight in 2001 and photogrammetric restitutions of the flights in 2005, 2007, 2010, and 2014: There was hardly any retreat in the foredune ridge between 2001–2014, although this was not the case at the base of the slope of the sandy front, which was affected by the winter storms of 2013–2014 (Figure 12). These variations were analyzed in greater detail using TLS.
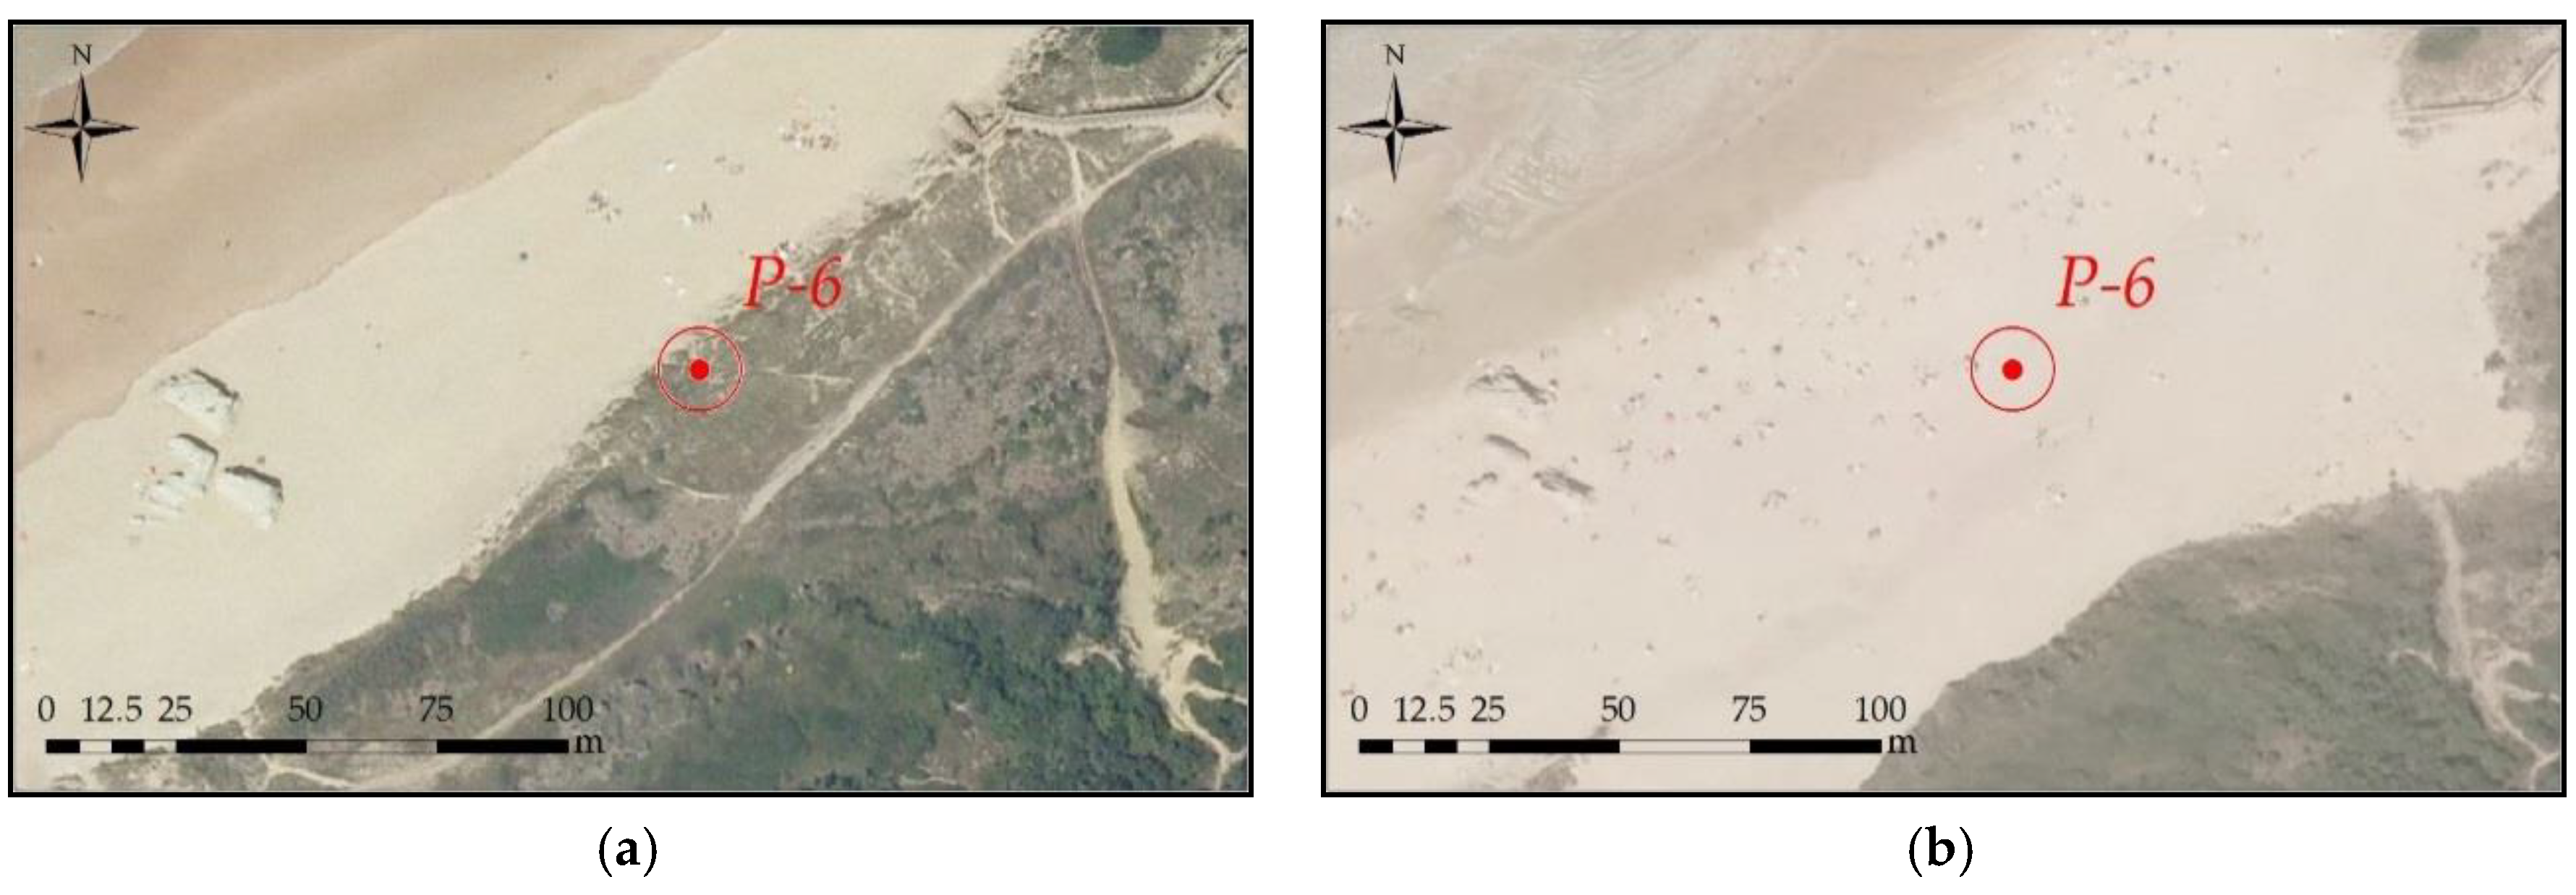
- Terrestrial laser scanning (TLS): Measurements taken using TLS in the period from August 2011 to November 2013 show stability with slight variations in the intertidal area. In April 2014, large retreats are seen with respect to the measurements made in November 2013 (Figure 13) and these coincide with the photogrammetric measurements (Figure 12). The retreat of the base of the slope of the sandy front in the position of profile 4 between November 2013 and April 2014 was 8 m. The fall in the level of the entire beach by 3 m was also significant, even as much as 5.431 m in some areas (point 6) (Table 2). From April 2014 to April 2017, the upper part of the slope retreated by 2 m, stabilizing the gradient of the sandy slope (Figure 13).
5. Conclusions
Author Contributions
Acknowledgments
Conflicts of Interest
References
- Medina, R.; Losada, M.; Dalrymple, R. Análisis de perfiles de playa por medio de funciones ortogonales empíricas (método FOE). Revista de Obras Públicas 1990, 3292, 9–17. [Google Scholar]
- Izaguirre, C.; Losada, Í.; Méndez-Incera, F.; Díaz-Simal, P.; Lara, J.L.; Ondiviela, B.; Jiménez Toribio, M. Flooding and erosion risk analysis in santander bay, spain. In En: Coastal Riks Management in a Changing Climate; Zanuttigh, B., Nicholls, R., Vanderlinden, J.P., Burcharth, H.F., Thompson, R.C., Eds.; Butterworth-Heinemann: Waltham, MA, USA, 2015; pp. 559–591. [Google Scholar]
- Villatoro, M.; Silva, R.; Méndez, F.J.; Zanuttigh, B.; Pan, S.; Trifonova, E.; Losada, I.J.; Izaguirre, C.; Simmonds, D.; Reeve, D.E.; et al. An approach to assess flooding and erosion risk for open beaches in a changing climate. Coast. Eng. 2014, 87, 50–76. [Google Scholar] [CrossRef]
- Martínez-Cedrún, P.; Flor, G.; Flor-Blanco, G.; Fernández Maroto, G. Relaciones texturales y composición mineralógica de los sistemas de playa/dunas en una costa rocosa: caso de Cantabria (NO de España). Revista de la Sociedad Geológica de España 2014, 27, 13–27. [Google Scholar]
- Losada, I.J.; Izaguirre, C.; Diaz-Simal, P. Cambio Climático en la Costa Española. Plan Nacional de Adaptación al Cambio Climático; Ministerio de Agricultura, Alimentación Y Medio Ambiente: Madrid, Spain, 2014.
- Pellón, E.; Garnier, R.; Medina, R. Intertidal finger bars at el puntal, bay of santander, spain: Observation and forcing analysis. Earth Surf. Dyn. Discuss. 2013, 1, 673–710. [Google Scholar] [CrossRef]
- Medellín, G.; Medina, R.; Falqués, A.; González, M. Coastline sand waves on a low-energy beach at “el puntal” spit, Spain. Mar. Geol. 2008, 250, 143–156. [Google Scholar] [CrossRef]
- Medina, R.; Losada, I.J.; Losada, M.Á.; Vidal, C. Variabilidad de los perfiles de playa: Forma y distribución granulométrica. Ingeniería del agua 1995, 2, 133–142. [Google Scholar] [CrossRef]
- Losada, M.A.; Medina, R.; Vidal, C.; Losada, I.J. Temporal and spatial cross-shore distributions of sediment at “el puntal” spit, Santander, Spain. Coastal Eng. 1993, 1992, 2251–2264. [Google Scholar]
- Losada, M.; Medina, R.; Vidal, C.; Roldan, A. Historical evolution and morphological analysis of “el puntal” spit, santander (Spain). J. Coast. Res. 1991, 7, 711–722. [Google Scholar]
- Lim, S.; Thatcher, C.A.; Brock, J.C.; Kimbrow, D.R.; Danielson, J.J.; Reynolds, B.J. Accuracy assessment of a mobile terrestrial lidar survey at padre island national seashore. Int. J. Remote Sens. 2013, 34, 6355–6366. [Google Scholar] [CrossRef]
- Deng, J.; Harff, J.; Dudzinska-Nowak, J. Quantitative method on historical reconstruction of coastal geomorphological change on wave-dominated coast: A case study of the pomeranian bay, southern baltic sea. In Mathematics of Planet Earth; Springer: Berlin/Heidelberg, Germany, 2014; pp. 347–350. [Google Scholar]
- Furmańczyk, K.; Andrzejewski, P.; Benedyczak, R.; Bugajny, N.; Cieszyński, Ł.; Dudzińska-Nowak, J.; Giza, A.; Paprotny, D.; Terefenko, P.; Zawiślak, T. Recording of selected effects and hazards caused by current and expected storm events in the baltic sea coastal zone. J. Coast. Res. 2014, 338–342. [Google Scholar] [CrossRef]
- Bonte, Y.; Levoy, F. Field experiments of beach scarp erosion during oblique wave, stormy conditions (Normandy, France). Geomorphology 2015, 236, 132–147. [Google Scholar] [CrossRef]
- Tysiac, P.; Wojtowicz, A.; Szulwic, J. Coastal Cliffs Monitoring and Prediction of Displacements Using Terrestial Laser Scanning. In Proceedings of the IEEE Geodetic Congress (Geomatics), Gdansk, Poland, 2–4 June 2016; pp. 61–66. [Google Scholar]
- Le Mauff, B.; Juigner, M.; Ba, A.; Robin, M.; Launeau, P.; Fattal, P. Coastal monitoring solutions of the geomorphological response of beach-dune systems using multi-temporal lidar datasets (Vendée coast, France). Geomorphology 2018, 304, 121–140. [Google Scholar] [CrossRef]
- Medjkane, M.; Maquaire, O.; Costa, S.; Roulland, T.; Letortu, P.; Fauchard, C.; Antoine, R.; Davidson, R. High-resolution monitoring of complex coastal morphology changes: Cross-efficiency of sfm and tls-based survey (Vaches-noires cliffs, Normandy, France). Landslides 2018, 15, 1097–1108. [Google Scholar] [CrossRef]
- Terefenko, P.; Giza, A.; Paprotny, D.; Kubicki, A.; Winowski, M. Cliff retreat induced by series of storms at międzyzdroje (Poland). J. Coast. Res. 2018, 181–185. [Google Scholar] [CrossRef]
- GIOC. Documento Temático: Regeneración de Playas; Ministerio de medio Ambiente, Universidad de Cantabria (Grupo de Ingeniería Oceanográfica y de Costas): Cantabria, Spain, 2000. [Google Scholar]
- Flor-Blanco, G.; Flor, G.; Borghero, C.; de Sanjosé Blasco, J.J.; Gómez-Lende, M. Evolución de la flecha arenosa de somo (santander). Factores naturales y antrópicos. Evolution of the somo sandy spit (santander). Natural and athropogenic factors. Geo-Temas 2016, 16, 275–278. [Google Scholar]
- Belmonte, M.; Garzon, J.; Losada, M.; Martinez, R.; Ortega, J. Oyambre Espacio Natural; Estudos Santander: Santander, Spain, 1987; p. 166. [Google Scholar]
- Garrote, J.; Garzón, G.; Page, J. Condicionamientos antrópicos en la erosión de la playa de oyambre (Cantabria). Actas V Reunión de Cuaternario Ibérico 2001, 1, 67–70. [Google Scholar]
- Garrote, J.; Page, J.; Garzón Heydt, G. Morfodinamica en un Complejo Playa-Ría Bajo Condicionantes Antrópicos; Oyambre: Cantabria, Spain, 2001. [Google Scholar]
- Garrote, J.; Heydt, G.; Alcantara Carrio, J. Influencia de Los Temporales Sobre el Transporte de Sedimentos en la Playa de Oyambre (Cantabria, n de España); Dpto. Geografía-UVA: Valladolid, Spain, 2002; pp. 361–371. [Google Scholar]
- Lorenzo, F.; Alonso, A.; Pagés, J. Evolución y erosión comparada de tres sistemas playa/flecha en las rías de ortigueira, o barqueiro y viveiro (Galicia, España). Cuaternario y Geomorfología 2003, 17, 75–89. [Google Scholar]
- Lorenzo, F.; Alonso, A.; Pagés, J.L. Erosion and accretion of beach and spit systems in northwest spain: A response to human activity. J. Coast. Res. 2007, 23, 834–845. [Google Scholar] [CrossRef]
- Flor-Blanco, G.; Flor, G.; Pando, L. Evolution of the salinas-el espartal and xagó beach/dune systems in north-western spain over recent decades: Evidence for responses to natural processes and anthropogenic interventions. Geo-Mar. Lett. 2013, 33, 143–157. [Google Scholar] [CrossRef]
- Flor-Blanco, G.; Pando, L.; Morales, J.A.; Flor, G. Evolution of beach–dune fields systems following the construction of jetties in estuarine mouths (Cantabrian coast, NW Spain). Environ. Earth Sci. 2015, 73, 1317–1330. [Google Scholar] [CrossRef]
- Vasco, H.; Garrote, J. Influencia de Los Parámetros que Definen Eventos de Alta Energía en la Costa y su Influencia en la Erosión de Playas. El caso del Complejo Playa-Cordón Dunar de Oyambre (Cantabria). In Proceedings of the III Congreso de la Sociedad de Análisis de Riesgos Latino Americana, Säo Paulo, Brazil, 10–13 May 2016. [Google Scholar]
- Flor-Blanco, G.; Flor, G.; Martínez-Cedrún, P.; Bruschi, V. La costa occidental de cantabria (Santander-estuario de Tina Menor). Guía de Excursiones de Campo. XII Reunión Nacional de Geomorfología, Santander 2010, 2012, 25–44. [Google Scholar]
- Saiz de Omeñaca, J.; Flor-Blanco, G.; Flor, G.; Barba-Regidor, F.J.; Francés, E.; Bruschi, V.M. La península de la magdalena. In Geolodía; Sociedad Gológica de España: Santander, España, 2013; Volume 4, pp. 1–14. [Google Scholar]
- Ramírez del Pozo, J.; Portero García, J.M. Mapa Geológico de España 1/50.000; Instituto Geologico y Minero de España, Ministerio de Economía Industria y Competitividad: Madrid, Spain, 1976; p. 41. [Google Scholar]
- Cendrero, A.; Díaz de Terán, J.R.; Salinas, J.M. Environmental-economic evaluation of the filling and reclamation process in the bay of santander, spain. Environ. Geol. 1981, 3, 325–336. [Google Scholar] [CrossRef]
- Cereceda, J.D. Evolución Morfológica de la Bahía de Santander; Museo Nacional de Ciancias Naturales: Madrid, Spain, 1917. [Google Scholar]
- Díaz de Terán, J. Sedimentología y dinámica de las arenas de el puntal (Santander). Anal. Inst. Est. Ind. Econ. Ciencias Institución Cultural de Cantabria 1976, 1, 229–329. [Google Scholar]
- Flor, G.; Flor-Blanco, G. Subsistemas estuarinos de la bahía de santander (Cantabria, norte de España). In XIII Reunión Nacional de Geomorfología. Universidad de Extremadura; Sociedad Española de Geomorfología: Cáceres, Spain, 2014; pp. 568–571. [Google Scholar]
- MAGRAMA. Plantación de Refuerzo de las Dunas de Somo y Loredo. Available online: http://www.mapama.gob.es/es/costas/temas/proteccion-costa/actuaciones-proteccion-costa/cantabria/390489-plantacion-somo-loredo.aspx (accessed on 4 April 2018).
- Revertido, M.; Ruiz, J.R. Ayer, Hoy y Mañana, la Modernización del Puerto de Santander, 1985–2005; Editorial del Puerto de Santander: Santander, Spain, 2006. [Google Scholar]
- González López, J.M. Un Modelo Viscoplástico Para la Caracterización Tenso-Deformacional de Materiales Asfálticos; Universitat Politècnica de Catalunya: Catalunya, Spain, 2003. [Google Scholar]
- Mullen, R. Manual of Photogrammetry; American Society for Photogrammetry and Remote Sensing: Rockville, MD, USA, 2004. [Google Scholar]
- De Sanjosé-Blasco, J.J. Perfiles Dinámicos de la Bahía de Santander; Universidad de Extremadura: Extremadura, Spain, 1989. [Google Scholar]
- De Sanjosé-Blasco, J.J.; Serrano, E.; Berenguer, F.; González-Trueba, J.; Gómez-Lende, M.; González-García, M.; Guerrero-Castro, M. Evolución histórica y actual de la línea de costa en la playa de somo (cantabria), mediante el empleo de la fotogrametría aérea y escáner láser terrestre. Cuaternario y Geomorfología 2016, 30, 119–130. [Google Scholar] [CrossRef]
- Sanjosé, J.D.; Serrano, E.; Berenguer, F.; González-Trueba, J.J.; Gómez-Lende, M.; González-García, M.; Guerrero-Castro, M. Evolución histórica y actual de la línea de costa en las playas de somo y gerra (cantabria) mediante fotogrametría aérea y escáner láser. In En XIII Reunión Nacional de Geomorfología; Schnabel, Y.S., Gómez, A., Eds.; Universidad de Extremadura: Cáceres, Spain, 2016; Volume 30, pp. 560–563. [Google Scholar]
- Hoffmeister, D.; Tilly, N.; Curdt, C.; Aasen, H.; Ntageretzis, K.; Hadler, H.; Willershäuser, T.; Vött, A.; Bareth, G. Terrestrial laser scanning for coastal geomorphologic research in western greece. Int. Arch. Photogramm. Remote Sens. Spat. Inf. Sci. 2012, 39, 511–516. [Google Scholar] [CrossRef]
- Lindenbergh, R.C.; Soudarissanane, S.S.; Vries, S.D.; Gorte, B.G.H.; Schipper, M.A.D. Aeolian beach sand transport monitored by terrestrial laser scanning. Photogramm. Rec. 2011, 26, 384–399. [Google Scholar] [CrossRef]
- González Amuchastegui, M.J.; Ibisate González de Matauco, A.; Rico Lozano, I.; Sánchez Fernández, M.; Sanjosé, J. Cambios Geomorfológicos y Gvolución de una Barra de Arena en la Desembocadura del río lea, Lekeitio-Mendexa (Bizkaia); Spanish Quaternary Research Association: Madrid, Spain, 2016. [Google Scholar]
- De Sanjosé-Blasco, J.J.; Serrano, E.; Berenguer, F.; González-Trueba, J.J.; Gómez-Lende, M.; González-García, M. Evolución de la línea de costa para el periodo 1988–2014 de la playa de somo (Cantabria), mediante el empleo de técnicas geomáticas. In Geo-Temas; Universitat Politècnica de Catalunya: Barcelona, Spain, 2015. [Google Scholar]
- Badia Cebada, E. Long-Term Morphodynamic Modelling of Tidal Basins with Rivers; Universitat Politècnica de Catalunya: Catalunya, Spain, 2003. [Google Scholar]


| Period | Swell between 5 m and 6 m | Swell >6 m |
|---|---|---|
| Tidal Range >80 | Tidal Range >100 | |
| 1985–1989 | 2 days (2 storms) | 0 days |
| 1990–1994 | 2 days (2 storms) | 0 days |
| 1995–1999 | 9 days (8 storms) | 3 days (2 storms) |
| 2000–2004 | 2 days (2 storms) | 2 days (2 storms) |
| 2005–2009 | 3 days (2 storms) | 3 days (2 storms) |
| 2010–2014 | 4 days (3 storms) | 6 days (3 storms) |
| 2015–2017 | 0 days | 0 days |
| Point | Coordinate | Year 2005 | Year 2007 | Year 2010 | Year 2014 | Difference in x | Difference in y | Difference in z |
|---|---|---|---|---|---|---|---|---|
| 1 | x | 441,240.502 | 441,240.947 | 441,240.656 | 441,240.911 | 2007–2005: 0.445 m | ||
| y | 4,812,198.858 | 4,812,198.384 | 4,812,198.881 | 4,812,198.883 | 2014–2007: 0.499 m | |||
| z | 6.034 | 6.491 | 6.303 | 6.197 | 2007–2005: 0.457 m | |||
| 2 | x | 440,874.853 | 440,874.947 | 440,874.986 | 440,874.947 | 2010–2005: 0.133 m | ||
| y | 4,811,762.369 | 4,811,762.654 | 4,811,762.266 | 4,811,762.764 | 2014–2010: 0.498 m | |||
| z | 33.641 | 34.002 | 33.506 | 33.584 | 2007–2010: 0.496 m | |||
| 3 | x | 441,367.931 | 441,367.949 | 441,367.748 | 441,367.481 | 2007–2014: 0.468 m | ||
| y | 4,812,533.321 | 4,812,533.011 | 4,812,533.384 | 4,812,532.973 | 2010–2014: 0.411 m | |||
| z | 12.253 | 12.287 | 11.788 | 11.884 | 2007–2010: 0.499 m | |||
| 4 | x | 441,327.687 | 441,327.666 | 441,327.509 | 441,327.660 | 2005–2010: 0.178 m | ||
| y | 4,812,791.151 | 4,812,791.116 | 4,812,791.273 | 4,812,790.938 | 2010–2014: 0.335 m | |||
| z | 9.326 | 9.327 | 8.835 | 8.829 | 2007–2014: 0.498 m | |||
| 5 | x | 441,270.233 | 441,270.492 | 441,270.456 | 441,269.998 | 2007–2014: 0.494 m | ||
| y | 4,812,287.476 | 4,812,287.488 | 4,812,287.441 | 4,812,287.448 | 2007–2010: 0.047 m | |||
| z | 2.676 | 2.465 | 2.217 | 2.359 | 2005–2010: 0.459 m | |||
| 6 | x | 440,823.517 | 440,823.428 | 440,823.290 | 440,823.428 | 2005–2010: 0.227 m | ||
| y | 4,812,064.215 | 4,812,064.070 | 4,812,064.470 | 4,812,064.070 | 2010–2007: 0.400 m | |||
| z | 8.749 | 8.266 | 8.427 | 3.318 | 2005–2014: 5.431 m |
| Geomatic Method | Maximum Error (m) |
|---|---|
| Cartography (1875–1985) | 40.00 |
| Photogrammetry (1985–2014) | 0.50 |
| Topography (1988–1993) | 0.07 |
| Terrestrial Laser Scanner (2011–2017) | 0.03 |
| Date | Total Years | Retreat (m) | Retreat (m/yr) | Authors |
|---|---|---|---|---|
| 1929–1960 | 31 | 100 | 3.2 | [10] |
| 1920–1985 | 65 | 200 | 3.1 | [48] |
| 1875–1985 | 110 | 375 | 3.4 | [41,42,43] |
| 1950–1985 | 35 | 200 | 5.7 | |
| 1875–2014 | 139 | 415 ± 40 | 2.7–3.3 |
| Date | Years | Retreat (m) | Retreat (m/yr) | Authors |
|---|---|---|---|---|
| 1870–1926 | 56 | 210 | 3.7 | Badía, 2003 |
| 1920–1985 | 65 | 200 | 3.1 | |
| 1875–1985 | 110 | 375 ± 40 | 3.0–3.8 | Sanjosé et al., in this work |
| 1985–2017 | 32 | 32 | 1.0 |
© 2018 by the authors. Licensee MDPI, Basel, Switzerland. This article is an open access article distributed under the terms and conditions of the Creative Commons Attribution (CC BY) license (http://creativecommons.org/licenses/by/4.0/).
Share and Cite
De Sanjosé Blasco, J.J.; Gómez-Lende, M.; Sánchez-Fernández, M.; Serrano-Cañadas, E. Monitoring Retreat of Coastal Sandy Systems Using Geomatics Techniques: Somo Beach (Cantabrian Coast, Spain, 1875–2017). Remote Sens. 2018, 10, 1500. https://doi.org/10.3390/rs10091500
De Sanjosé Blasco JJ, Gómez-Lende M, Sánchez-Fernández M, Serrano-Cañadas E. Monitoring Retreat of Coastal Sandy Systems Using Geomatics Techniques: Somo Beach (Cantabrian Coast, Spain, 1875–2017). Remote Sensing. 2018; 10(9):1500. https://doi.org/10.3390/rs10091500
Chicago/Turabian StyleDe Sanjosé Blasco, José Juan, Manuel Gómez-Lende, Manuel Sánchez-Fernández, and Enrique Serrano-Cañadas. 2018. "Monitoring Retreat of Coastal Sandy Systems Using Geomatics Techniques: Somo Beach (Cantabrian Coast, Spain, 1875–2017)" Remote Sensing 10, no. 9: 1500. https://doi.org/10.3390/rs10091500