Article

On the Potentiality of UAV Multispectral Imagery to Detect Flavescence dorée and Grapevine Trunk Diseases

1
Ecole d’Ingénieurs de PURPAN, Université de Toulouse, Toulouse INP, 75 voie du TOEC, BP 57611, F-31076 Toulouse CEDEX 3, France
2
AIRBUS Defense and Space, 5 rue des satellites, F-31400 Toulouse, France
3
UMR 1201 DYNAFOR, Université de Toulouse, INRA, 24 chemin de borderouge, CS 52627, F-31326 Castanet-Tolosan CEDEX, France
4
Groupe ICV, La Jasse de Maurin, F-34970 Lattes, France
5
CESBIO, Université de Toulouse, UMR 5126 CNES-UPS-CNRS-IRD, 18 avenue Edouard Belin, BPI 2801, F-31401 Toulouse CEDEX 9, France
6
TerraNIS, 12 avenue de l’Europe, F-31520 Ramonville-saint-agne, France
*
Author to whom correspondence should be addressed.
These authors contributed equally to this work.
Current address: Ecole d’Ingénieurs de PURPAN, 75 voie du TOEC, BP57611, F-31076 Toulouse CEDEX 3, France.
Remote Sens. 2019, 11(1), 23; https://doi.org/10.3390/rs11010023
Submission received: 7 November 2018 / Revised: 14 December 2018 / Accepted: 18 December 2018 / Published: 23 December 2018

Abstract

:
Among grapevine diseases affecting European vineyards, Flavescence dorée (FD) and Grapevine Trunk Diseases (GTD) are considered the most relevant challenges for viticulture because of the damage they cause to vineyards. Unmanned Aerial Vehicle (UAV) multispectral imagery could be a powerful tool for the automatic detection of symptomatic vines. However, one major difficulty is to discriminate different kinds of diseases leading to similar leaves discoloration as it is the case with FD and GTD for red vine cultivars. The objective of this paper is to evaluate the potentiality of UAV multispectral imagery to separate: symptomatic vines including FD and GTD (Esca and black dead arm) from asymptomatic vines (Case 1) and FD vines from GTD ones (Case 2). The study sites are localized in the Gaillac and Minervois wine production regions (south of France). A set of seven vineyards covering five different red cultivars was studied. Field work was carried out between August and September 2016. In total, 218 asymptomatic vines, 502 FD vines and 199 GTD vines were located with a centimetric precision GPS. UAV multispectral images were acquired with a MicaSense RedEdge® sensor and were processed to ultimately obtain surface reflectance mosaics at 0.10 m ground spatial resolution. In this study, the potentiality of 24 variables (5 spectral bands, 15 vegetation indices and 4 biophysical parameters) are tested. The vegetation indices are selected for their potentiality to detect abnormal vegetation behavior in relation to stress or diseases. Among the biophysical parameters selected, three are directly linked to the leaf pigments content (chlorophyll, carotenoid and anthocyanin). The first step consisted in evaluating the performance of the 24 variables to separate symptomatic vine vegetation (FD or/and GTD) from asymptomatic vine vegetation using the performance indicators from the Receiver Operator Characteristic (ROC) Curve method (i.e., Area Under Curve or AUC, sensibility and specificity). The second step consisted in mapping the symptomatic vines (FD and/or GTD) at the scale of the field using the optimal threshold resulting from the ROC curve. Ultimately, the error between the level of infection predicted by the selected variables (proportion of symptomatic pixels by vine) and observed in the field (proportion of symptomatic leaves by vine) is calculated. The same methodology is applied to the three levels of analysis: by vineyard, by cultivar (Gamay, Fer Servadou) and by berry color (all red cultivars). At the vineyard and cultivar levels, the best variables selected varies. The AUC of the best vegetation indices and biophysical parameters varies from 0.84 to 0.95 for Case 1 and 0.74 to 0.90 for Case 2. At the berry color level, no variable is efficient in discriminating FD vines from GTD ones (Case 2). For Case 1, the best vegetation indices and biophysical parameter are Red Green Index (RGI)/ Green-Red Vegetation Index (GRVI) (based on the green and red spectral bands) and Car (linked to carotenoid content). These variables are more effective in mapping vines with a level of infection greater than 50%. However, at the scale of the field, we observe misclassified pixels linked to the presence of mixed pixels (shade, bare soil, inter-row vegetation and vine vegetation) and other factors of abnormal coloration (e.g., apoplectic vines).

Graphical Abstract

1. Introduction

Vine diseases have a strong impact on vineyards sustainability [1,2], which in turns leads to strong economic consequences. Among them, Flavescence dorée (FD) and Grapevine Trunk Diseases (GTD) are considered the two most important diseases for the European principal wine-production areas [3]. They are both widespread in the French vineyard, but only FD is a quarantine disease in the European and Mediterranean Plant Protection Organization (EPPO) region (Directive 77/1993 amended 92/103) due to its epidemic potential. FD is therefore subject to mandatory control procedures that includes the use of pesticides and the uprooting of every infected plant [1]. Detection of infected plants is presently expensive and time consuming, and, despite efforts made, FD keeps propagating in Southern Europe, and particularly in France (58% of French vineyards concerned in 2013 against 69% in 2015 [4,5]).
Flavescence dorée is a phytoplasma–borne disease transmitted by the leafhopper Scaphoideus titanus Ball. (Hemiptera: Cicadellidae) [1,6,7]. This leafhopper feeds and reproduces almost exclusively on grapevines (Vitis vinifera L., Vitaceae) and is the only known vector of FD [1]. FD’s main visible symptoms appear in the summer and remain visible until mid-autumn. They consist of drying of the inflorescence and berries, the droop of the canes because of a lack of lignification in the new shoots, leaves curling downwards, and leaves becoming yellowish or reddish in white and red cultivars, respectively [8,9]. The leaves discoloration may affect only one shoot up to the whole grapevine, and its intensity varies according to the grape variety and the year [10,11,12]. Grapevine Trunk Diseases (i.e., Esca and Black Dead Arm) are caused by fungi. Symptoms can be observed at wood and foliar levels [13,14]. Discoloration on the leaves can be similar to those observed with FD, even if its form and texture varies. For the slow form, symptomatic leaves show mottling that consists in necrotic parts and yellow and red spots for white and red grape cultivars, respectively. For the fast form, symptomatic leaves totally dry out and fall prematurely [8,14,15,16].
Remote sensing is an efficient tool to determine crops’ health status. Stress, deficiencies, and diseases induce changes in biophysical and biochemical characteristics of the plant tissues, which can in turn result in changes to their optical properties [17,18,19,20,21,22,23]. In optical remote sensing, even if biophysical parameters estimated using canopy reflectance modeling may also be good candidates [24,25], the more commonly used methodology to detect those changes relies on spectral indices calculated from multi- or hyperspectral images. When it comes to detect specific diseases, the development of more complex indices is required because classical vegetation indices have been proved less effective [26,27].
In the field of precision viticulture, optical remote sensing is considered as a relevant tool [28] and has already been used for the detection of various diseases such as Phylloxera [29], grapevine leafroll disease [30], Esca [31,32], and more recently Flavescence dorée [32,33,34,35]. The main remaining difficulties in the process of detecting the Flavescence dorée disease in a robust way are (1) to discriminate the disease on both white and red cultivars whatever the severity of the leaves symptoms are, and (2) to differentiate different kinds of diseases leading to similar leaf discoloration, as it is the case with FD and GTD for red vine cultivars [30,31,35]. We here propose a new methodology to address this latter challenge using UAV imagery. This work focuses on seven red cultivars vineyards, selected over the Gaillac and Minervois vinegrowing regions (South of France). We evaluate the potential of 24 variables (5 spectral bands, 15 vegetation indices and 4 biophysical parameters) to separate (1) symptomatic vine vegetation areas (FD or GTD) from asymptomatic vine vegetation areas (AS), and (2) FD symptomatic vine areas from GTD ones. The best discriminating variables are selected for three scales of analysis that correspond to an increasing level of operationality: by vineyard, by cultivar and by berry color.

2. Materials and Methods

2.1. Data Acquisition

Data acquisition includes field data and multispectral data acquisitions in the selected vineyards. Those acquisitions were conducted when the disease symptoms were fully expressed, i.e., in August 2016 for the Minervois AOC area (“Appellation d’Origine Contrôlée” in French or “controlled designation of origin” in English), and September 2016 for the Gaillac AOC area.

2.1.1. Experimental Sites

Seven vineyards within five experimental sites located in the Tarn and Herault departments in Southwestern France have been studied: five vineyards were selected over the Gaillac AOC area (Duras, Fer Servadou a.k.a. Braucol and Gamay cultivars) and two vineyards over the Minervois AOC area (Grenache and Mourvèdre cultivars) (See Figure 1). For sake of clarity, vineyards will be named further using their “vineyard ID” which is composed of cultivars’ name and eventually a letter (“A” or “B”) when two plots of the same vine were studied. The left part of Table 1 summarizes the main characteristics of studied vineyards’ plots. In the vineyards studied, the vine training systems used are mainly single or double guyot and cordon de Royat. Regarding the technical itinerary, pruning is carried out during the winter (December–March). Bud-burst and flowering take place during the spring period (March–June). Leaf thinning and veraison occur in summer (June–September) and finally ripening and harvesting during the autumn (September–December). The vineyards are located in AOC regions. Consequently, if the wine makers want to sell their production with this label (added-value for their product), specific crop management practices have to be respected. It includes actions on vine health conditions and soil quality protection. The climate of both studied regions is hot and dry, especially in the Minervois AOC region. In the latter, the summer water deficit is important meaning that irrigation is necessary for some vineyards.

2.1.2. Field Data Acquisition

A portable differential GPS (model Trimble Geo 7x) was used to collect over the selected vineyards the precise location (horizontal precision of 0.01 m) of some asymptomatic vines and all vines presenting symptoms of Flavescence dorée (FD), Grapevine trunk disease (GDT), including Esca and Black Dead Arm (BDA), and other leaf coloration factors (OF). In this study, the severe form of Esca known as “apoplexy” is not considered as belonging to the group of GTD vines as other factors can also cause apoplexy (e.g., the drought). Only vines with a “tiger-stripe” aspect are considered as GTD symptomatic vines.
For each vegetation area where symptomatic vine were observed, one GPS point was taken at the center of the symptomatic area. Length (size of the area in vine’s row direction), thickness (size of the area orthogonally to vine’s row direction) and disease severity were recorded (Figure 2). Disease severity (respectively labeled FD d s and GTD d s ) corresponds to the percentage of vine leaves exhibiting the symptoms. Observations are grouped in four categories [35], ds1, ds2, ds3, and ds4, that correspond to 1 to 25%, 26 to 50%, 51 to 75% and 76 to 100% of the vine presenting leaves symptoms, respectively (Figure 3). Table 1 presents the total number of GPS points corresponding to asymptomatic (AS) and symptomatic areas (FD, GTD and OF) collected over the seven selected vineyards. Figure 4 shows for each vineyard the GPS points acquired and a picture highlighting leaves symptoms of FD and GTD observed in the field.

2.1.3. Multispectral Data Acquisition

Multispectral images were acquired in August and September 2016 by the DELAIR company (Toulouse, France) using a DT-5Bands imaging instrument on-board a long range DT-18 UAV platform. The DT-5Bands camera is based on the MicaSense RedEdge® sensor and acquires images at five wavelengths: Blue (455–495 nm), Green (540–580 nm), Red (658–678 nm), Red-Edge (707–727 nm), and Near Infrared (800–880 nm). Characteristics of UAV and sensor are presented in Table 2. The MicaSense RedEdge® sensor data were converted to reflectance based on the measurement in the field of a Spectralon reference surface. Image radiance data were divided by the radiance measured on the reference surface and multiplied by the known, calibrated reflectance of this surface. This pre-processing was performed by the UAV operator (DELAIR Company). The Pix4D software (Available at: https://pix4d.com/) was used to orthorectify, mosaic and resample at 0.10 m spatial resolution the UAV images. In the final product, pixel values correspond to surface reflectance in each spectral band (see Figure 4).

2.2. Data Processing and Analysis

Figure 5 shows the methodological framework’s main steps used in this study. Statistical analyses are conducted at three scales: by vineyard (five vineyards), by cultivar when possible (two vineyards by cultivar for Fer Servadou and Gamay) and by berry color (all vineyards). For each scale, two steps associated with the two discrimination’s cases are considered:
- Case 1: identification of the best variables (spectral bands, vegetation indices and/or biophysical parameters) to discriminate FD and GTD symptomatic vine vegetation from asymptomatic vine vegetation. This first case allows us to investigate if detection of vine diseases is possible.
- Case 2: identification of the best variables to discriminate FD from GTD symptomatic vine vegetation (from vines identified as symptomatic in case 1). This case allows us to determine if FD symptoms can be specifically detected.
For each scale and for each case, the same methodology is applied to test each variable (see Table 3 and Table 4): selection of the best variable(s), mapping of symptomatic vine vegetation with the selected variable(s) and validation using field data.

2.2.1. Computing Vegetation Indices and Biophysical Parameters

Selected vegetation indices (VI) and biophysical parameters (BP) are computed from the UAV images’ spectral bands (SB). Table 3 gives the name, formula, biophysical indicator, and associated reference(s) for each vegetation indices. Most of the vegetation indices were found in literature on detecting plant diseases and changes in the pigment content of plants. Two vegetation indices (GRVI and NDRE) are based on the results obtained with hyperspectral database providing leaf reflectance measurements collected on FD and asymptomatic vine leaves during 2015 in the plots of Gaillac AOC area [36]. At this scale, GRVI is the best vegetation index to discriminate symptomatic leaves from asymptomatic ones for red cultivars and NDRE for white cultivars. Table 4 gives the name, the description, the unit and the typical range of the four selected biophysical parameters. The biophysical parameters are generated by inverting a canopy reflectance model based on the coupling of the PROSPECT-D leaf [37,38] and the SAIL canopy model [39] using the Overland software developed by AIRBUS DS Geo-Intelligence (Toulouse, France) [37]. The possibility with the Overland software to use the new model PROSPECT-D [38,40], which includes the three main families of leaf pigments (chlorophylls, carotenoids, and anthocyanins) as independent constituents, is particularly interesting for our study as we know that leaves’ discolorations observed in FD symptomatic vines are linked to a change in leaves’ pigment concentration, particularly in anthocyanins for red cultivars [41]. The full calculation method is described in [35]. The performance of the biophysical information that is retrieved with the Overland software actually depends on the radiometric performance, calibration and spectral band set of the sensor. The radiometric performance of MicaSense RedEdge® sensor data is good (low noise level) and gain accuracy can reach 3–5% if properly calibrated. According to Overland developers and considering the five spectral bands (including red-edge) of the MicaSense RedEdge® sensor, sensitivity (i.e., precision) is good for chlorophylls and anthocyanins (precision of 2–3 μ g/cm 2 ) and moderate for carotenoids; accuracy is more variable as systematic bias could appear in this UAV application due to sensor radiometric calibration and canopy heterogeneity at such high spatial resolution.

2.2.2. Extraction of Symptomatic and Asymptomatic Vine Vegetation Areas

The classification used to create the mask of vine vegetation has been realized with the Orfeo ToolBox [56] developed by the French National Space Agency. For this study, we train an SVM (Support vector Machine) model using a radial basis function (RBF) kernel classification [57] with three or four output classes, from 1000 randomly generated training samples, each of them having five components (five spectral bands). For AOC gaillac vineyards (Fer Servadou (A), Fer servadou (B), Gamay (A), Gamay (B) and Duras), four classes are used: 1—bare soil, 2—shadow, 3—inter-row vegetation and 4—grapevine vegetation. In the case of AOC Minervois vineyards (Mourvèdre and Grenache), only three classes are used: 1—bare soil, 2—shadow, and 3—grapevine vegetation. The classification is applied for each vineyard separately. The accuracy metric [58] for each vineyard is shown in Table 5. Best results are obtained in the vineyards of Mourvèdre, Grenache and Gamay (B). From the export of class grapevine vegetation, a mask of vine vegetation is created
From this mask, the pixel values of the 5 SB, 15 VI and 4 BP located within (FD or GTD) and asymptomatic (AS) areas were extracted (Figure 5) as well as the pixel type (AS, FD or GTD) and a categorical variable representing the disease severity observed in the field (ds1, ds2, ds3 and ds4). Buffers corresponding to symptomatic and asymptomatic vine vegetation areas were created from the GPS points and from the width and length of the vine vegetation collected in field. The number of vine vegetation areas and the total number of pixels finally used for the statistical analysis (training and validation) are presented in the Table 6.

2.2.3. Statistical Analysis

The initial dataset of vine vegetation areas is split in two parts: one part for the selection of the best variables and mapping of symptomatic vines (training dataset) and the other part for the validation (validation dataset).
For case 1, the training dataset contains 80% of symptomatic areas (FD or GTD) with the most severe symptoms (FD d s 4 /GTD d s 4 ) and the same number of asymptomatic areas. The validation dataset corresponds to the vine vegetation areas belonging to the three other disease severity categories of FD and GTD (ds1, ds2 et ds3) and the remaining asymptomatic and symptomatic areas (20% of FD d s 4 /GTD d s 4 ).
For case 2, the dataset is composed only by symptomatic areas. The training dataset contains 80% of FD d s 4 symptomatic areas and the same number of GTD d s 4 symptomatic areas. The validation dataset consists of the remaining symptomatic areas (FD or GTD). Table 6 provides the total number of vines and pixels corresponding to the dataset used for statistical analysis (training and validation). Equally, this dataset is used for the three scales of analysis (vineyard, cultivar and berry color) and for two cases of discrimination (Case 1 and Case 2).

Step 1: Selection of the best discriminating variables

The objectives of the statistical analyses carried out is to select the SB or VI and BP that present the best discrimination potential. This analysis was realized using the samples available for each scale of analysis (as shown in Table 6), based on the Receiver Operator Characteristic (ROC) analysis [59,60,61]. The capacity of each selected variable to discriminate symptomatic (FD or GTD) from asymptomatic areas (Case 1) and FD from GTD symptomatic areas (Case 2) is evaluated. Table 7 provides an example of the interpretation of potential classification outcomes for Case 1. Three indicators of classification performance derived from the ROC analysis are used: the sensitivity (Se = TP/TP + FN), the specificity (Sp = TN/FP + TN) and the Area Under Curve (AUC). We define an optimal threshold that corresponds to the maximum of the Youden index (Se + Sp − 1) and allows for minimizing errors on both sensibility and specificity values [59]. AUC ranges from 0.0 to 1.0 and a random classifier presents an AUC of 0.5 (high amount of errors). Applied to the training dataset, experiments are performed using a random repeated hold-out strategy. The number of repetitions is 200. For each run, 2/3 of the training dataset are used for calibration and 1/3 for testing the classification accuracy (test) [62]. All selected variables with an AUC under 0.7 are considered as non-performing and then eliminated. The remaining variables are first ordered according to the mean AUC value, then to the mean sensitivity value, and then to the mean specificity value. The comparison between the means of these parameters (AUC, sensibility and specificity) for each variable is realized using the Welch’s t-test [63].

Step 2: Mapping of symptomatic vine vegetation at the whole vineyard scale

This mapping is carried out by applying an optimal threshold on the selected variables (binary approach). The threshold values are obtained using the ROC method from the training datasets (see Table 6) available for each scale of analysis (vineyard, cultivar and berry color) and the two discrimination cases. For Case 1, the optimal threshold is applied to the entire vineyard. A binary map showing predicted symptomatic (FD or GTD) and asymptomatic pixels for each selected variable is obtained. For Case 2, the optimal threshold is applied to the symptomatic areas previously detected with Case 1. This allows for creating a binary map showing predicted symptomatic FD and symptomatic GTD pixels.

Step 3: Validation

The objectives are first to appreciate if the mapping established in the step before could allow the detection of symptoms even inside areas where they are more diffuse and then if it is sensitive enough to characterize the level of infection of vine vegetation areas. This work was realized using the validation dataset available for each scale of analysis (as shown in Table 6). Validation samples are mainly composed of FD or GTD vegetation areas with disease levels of less than 75%. Inside each of these validation samples, the model was applied. A rate of predicted symptomatic pixels (FD or GTD) with respect to the total number of pixels was calculated from the mapping of symptomatic vines. This rate corresponds to the classifier-predicted disease severity. For the three scales of analysis (vineyard, cultivar and berry color), classifier-predicted disease severity was compared to disease severity observed in the field for Cases 1 and 2. In order to get comparable information between field disease severity and classifier-predicted disease severity, rates were first converted into five discrete classes (0, 1, 2, 3 or 4), each corresponding to one of the four disease severity (0%, 1–25%, 26–50%, 51–75% and 75–100%) classes. For Case 1, class 0 corresponds to asymptomatic areas and, for Case 2, to GTD symptomatic areas. For this last case, asymptomatic pixels were excluded and only the four disease severity of FD classes were considered. Considering that those classes are ordinal and equidistant, the validation was handled as a regression problem. The overall agreement between field and predicted classes for a given vineyard was verified through the root-mean-squared error (RMSE) as formalized in Equation (1). Values of 1 or 3 respectively mean a difference of 1 or 3 FD d s classes between field and predicted classes:
RMSE = C l a s s V a l u e predicted C l a s s V a l u e field 2 n .

3. Results

3.1. Selection of the Best Discriminating Variables

Table 8 and Table 9 present the best VI and BP and corresponding mean performance parameters (AUC, sensibility and specificity) for Case 1 and Case 2 at the three scales of analysis considered in this work (vineyard, cultivar and berry color). Figure 6 illustrates the distribution of symptomatic and asymptomatic pixels values for one of the best discriminating variables. Based on the comparison of performance parameters’ values, we can first note that performances of selected variables (SB, VI and BP) globally decrease with the scales of analysis (from vineyard to berry color scale) and that variables are in general more efficient for Case 1. This is easily understandable when looking at Figure 6 where we observe—particularly for BP—a higher cover-up for variables selected for Case 2, leading to a global higher confusion between FD symptomatic and GTD symptomatic pixels. Consequently, best AUC values, whatever the variable selected, reach at maximum 0.95, 0.89 and 0.84 for Case 1 at vineyard, cultivar and berry color scale, respectively. For Case 2, best AUC values reach 0.90 and 0.79 at vineyard and cultivar scales, respectively. No variables show satisfactory discriminating performance at the berry color scale (AUC < 0.7). Associated sensibility and specificity values are generally lower than for Case 1, meaning that commission and/or omission errors are even more frequent. The best discriminating VI and BP parameters are not necessarily the same according to the case and the scale studied. Next, results are analyzed for the two interesting categories of variables, vegetation indices and biophysical parameters.

3.1.1. Best Vegetation Indices

For Case 1 (Table 8), RGI and GRVI (both based on green and red spectral bands) or CI and NDRE (both based on RedEdge and NIR) are globally found as the best discriminating vegetation indices at the three considered scales (except for the Fer_Servadou (A) vineyard) with quite good performances. At berry color scale, RGI and GRVI are the best variables. They show both the same poor discrimination performances with a mean AUC equal to 0.77, which is close to a random classifier. The sensitivity of 0.77 obtained for these two indices implies that 23% of the pixels located within the symptomatic areas showing a high level of infection (75–100%) were classified as asymptomatic pixels. The sensitivity of 0.66 implies that 34% of the pixels located within the asymptomatic areas are classified as symptomatic pixels.
In Case 2 (Table 9), RERI and REGI are the best vegetation indices at vineyard and cultivar scale (except for the Fer_Servadou (B) and Gamay (A) vineyards). However, performances are always very poor (AUC < 0.8) at the cultivar scale. For example, when applying the REGI variable to the Gamay plots at cultivar scale, the sensitivity of 0.56 and the specificity of 0.94 indicate that: 44% of the pixels within the FD symptomatic areas are classified as GTD symptomatic pixels, and conversely 6% of the pixels located within the GTD symptomatic areas are classified as FD symptomatic pixels. At berry color scale, no vegetation index presents satisfying AUC values (up to 0.7).

3.1.2. Best Biophysical Parameters

For Case 1, whatever the scale of analysis considered (vineyard, variety or berry color), the BP Car (related to leaf carotenoid content) is the most often selected as the best biophysical parameter with mean AUC values between 0.84 and 0.93. Car values are always higher for symptomatic areas than for asymptomatic ones with a global low covering up between the datasets (Figure 6). At the berry color scale, performances are even better with the Car parameter (AUC 0.84, Sensibility/Specificity 0.75/0.8) than with the selected GRVI/RGI indices. For Case 2, whatever the scale of analysis considered, overall performances are not satisfying. AUC values are below or close to 0.7. Results do not highlight a common biophysical parameter that can be used either at vineyard, variety or berry color scales.

3.2. Validation and Mapping at the Vineyard Scale

Figure 7 presents, for the three scales of analysis and the two discrimination cases, the comparison between the infection level predicted by the best variables (i.e., with the lowest RMSE) against the infection level observed in field. RMSE values globally indicate a difference of around one disease severity class, with RMSE values ranging from 0.63 to 1.18. Figure 7 shows a slight increase in RMSE for Case 2 compared to Case 1. Differences of performances are observed between vineyards, although similar results are obtained regarding vineyard scale and berry color scale. For example, in the case of symptomatic areas for Case 1 with a level of infection of 1–25%, the RMSE close to 1 means that symptomatic areas (FD or GTD) with an infection level of 1–25% (Class 2) are often classified as symptomatic areas with an infection level of 25–50% (Class 3) or as asymptomatic areas (Class 1). In Case 2, all GTD symptomatic areas were grouped into Class 1. The RMSE close to 1 indicates that FD symptomatic areas with an infection level of 1–25% (Class 2) are often classified as FD symptomatic areas with an infection level of 25–50% (Class 3) or as GTD symptomatic areas (whatever the level of infection).
The validation step is completed by visually analyzing the maps realized with the best selected variables at the whole vineyard scale. Figure 8 shows, for the Gamay (B) vineyard and each scale of analysis, an example of the mapping of predicted symptomatic vines (Case 1, FD or GTD) and predicted FD or GTD for the Case 2. No mapping has been performed for the Case 2 at the berry color scale because no variables have shown satisfying discrimination performances. Figure A1, Figure A2 and Figure A3 show the mapping for all vineyards and all scales of analysis.
In Case 1 (left part of Figure 8) and for the Gamay (B) vineyard taken as an example, the maps of predicted symptomatic areas obtained using the Car variable are very similar for the three scales of analysis because the three optimal thresholds are very close: 5.59, 5.65 and 5.67 for the vineyard, cultivar and berry color scales, respectively (Figure 6). Whatever the level of analysis, we observe a lot of commission errors (false FD or GTD predicted pixels) over areas where no symptoms have been observed in the field. Figure 9 illustrates the main situations causing misclassification of false symptomatic pixels. Table 10 shows the percentage of each of the situation observed over the whole validation dataset used in the study for each vineyard.
For five vineyards over the seven studied, the first situation of commission errors concerns the area along the vine rows where mixed soil/vegetation (Edges of the rows of vines) or shadow/vegetation (Drop shadow) pixels are observed. Commission errors also occur in the middle of the vine rows where pixels can be grouped or dispersed (random pixels). Some omission errors are also visible. It is interesting to notice that the vegetation areas with disease verity inferior to 50% (DS1 and DS2) are more difficult to detect and are often classified as asymptomatic vine vegetation. As it can be seen in Figure 3, sometimes the leaves affected by the discoloration are located on the side of the vine row and are consequently not visible on the UAV images for the lower infection levels. This fact could explain the confusion among asymptomatic and DS1/DS2 classes. In the higher infection levels, there are so many discolored leaves that many of them are visible in the upper part of the vine canopy.
Therefore, in the end, despite the good potential of the selected variable highlighted before, the mapping of predicted FD or GTD symptomatic vegetation areas over all of the parcels does not reflect the phytosanitary status observed in the field at all.
For Case 2 (right part of Figure 8), the misclassifications between FD and GTD pixels can concern a few pixels inside several vegetation areas as it is the case in the example for the Gamay showed here. However, it can also concern an entire vine vegetation area in other cases (for example, Fer_Servadou (B) and Duras). In all vineyards, most of the mixed pixels are classified as symptomatic GTD pixels (see Appendix A.1 and Appendix A.2).

4. Discussion

4.1. Case 1: Discrimination of FD or GTD Symptomatic Vines from Asymptomatic Vines

Using one variable (vegetation index or biophysical parameter) provides promising results to discriminate symptomatic vine vegetation (FD or GTD) from asymptomatic vine vegetation for red cultivars. Nevertheless, at the berry color scale, considered as the most operational one, the sensitivity (0.75) and specificity values (0.80) obtained with the best variable (BP Car) implies that 25% of the symptomatic pixels are classified as asymptomatic pixels, and 20% of the asymptomatic pixels are classified as symptomatic pixels. It is definitely not satisfying. The sensitivity value could partly be explained by the use of symptomatic areas with an infection level of 75–100% in which few asymptomatic pixels could exist. The specificity value could be explained partly by the presence of mixed pixels, misclassified in the edges of the rows of vines.
The variables that are most often selected at the vineyard, cultivar and berry color scales are the vegetation indices RGI/GRVI and CI/NDRE, and the biophysical parameter Car. These variables are related to the anthocyanins [25], chlorophylls [43,53] and carotenoids [38] leaf content, respectively. This is in agreement with literature as Flavescence dorée and Grapevine Trunk diseases cause a modification in the photosynthesis process, and therefore in the leaf pigment content. Variation in anthocyanin content, the main factor explaining discoloration of leaves in red cultivars, was verified for leaves affected by Flavescence dorée [41].
At the vineyard scale, the vegetation indices RGI and GRVI were also found with the 2015 dataset acquired over the Gaillac AOC area that focused on symptomatic FD areas vs. asymptomatic areas discrimination only [35]. These VI are based on the green and red spectral bands (RGI, GRVI). These results are quite coherent with previous studies as the GRVI was also found as the best index to discriminate FD symptomatic leaves from healthy leaves for red cultivars at the leaf scale [36].
Concerning the biophysical parameter, the Car, linked to the leaves’ carotenoid content, shows the best performances. With the 2015 dataset, we found the Ant as the best discriminating parameter [35]. We assume this result could be linked to a difference of the reddish coloration intensity observed in the field, higher in 2015 than in 2016 (see Figure 10). Complementary work is needed to go further and confirm this assumption. According to the Car values calculated with the Overland software, symptomatic pixels show higher values than asymptomatic ones for all red cultivars studied. Few studies [50,54] have reported that senescent leaves (with FD leaves’ comparable discolorations) present a lower carotenoid content than green healthy leaves; however, to our knowledge, no study bringing information about real carotenoid content of FD leaves has been carried out so far. Such studies would be the only way to validate the consistency of our results.

4.2. Case 2: Discrimination of FD from GTD Vines

Discriminating FD from GTD symptomatic vine vegetation using one variable appears to be more challenging given the discrimination performances observed. It could be interesting only at the vineyard or cultivar scales where best selected vegetation indices are the RERI and REGI, both using Red-Edge and Red or Green spectral bands. Concerning the biophysical parameters, AUC values are either not acceptable (below 0.7) or still low for the best classifiers.
Vegetation indices and biophysical parameters related to the leaf pigment content are not efficient in discriminating FD and GTD. Both diseases lead to similar pigment variations. The non-specificity of multispectral variables has also been found by [31] in the case of ESCA (grapevine disease) detection using the NDVI vegetation index. In addition, as we have mentioned, FD symptomatic vines show a slight discoloration of the leaves in 2016. FD symptomatic vines with a strong discoloration (like those observed in 2015) are easier to differentiate from GTD symptomatic vines. Further studies could focus on the areas with stronger discoloration to aim at specific discrimination between FD and GTD.
Whatever the discrimination case, when the selected variables are applied to the whole vineyard, pixels are misclassified. It implies further work to provide an operational service. The limits identified are mainly related to the presence of (i) mixed pixels, (ii) symptomatic areas with a low level of infection, and (iii) other abnormal factors of leaf discoloration (e.g., apoplexy). These limits have already been found in the studies on the detection of grapevine leafroll disease [30] or ESCA [31], and in the study we carried out in 2015 on Flavescence dorée [35].

5. Conclusions and Perspectives

Flavescence dorée is a grapevine disease with important economic consequences for winegrowers. The most effective means of control is the uprooting of the vine presenting the symptoms of the disease. However, the detection of these strains in the vineyard is time-consuming. Use of remote sensing images acquired from UAVs appears as a fast and accurate tool for detecting the symptomatic vine foliage. One of the first studies carried out on a dataset acquired in 2015 over four selected vineyards has highlighted the potentiality of UAV multispectral images to discriminate FD symptomatic areas from asymptomatic areas [35]. This first study also showed the necessity to discriminate Flavescence dorée from other vineyard diseases presenting similar changes in leaf coloration when considering red cultivars.
The new study presented in this paper aims at testing the potential of 20 variables (5 spectral bands, 15 vegetation indices and 4 biophysical parameters) computed from UAV multispectral imagery to remotely discriminate (1) symptomatic from asymptomatic vines (Case 1) and (2) FD from GTD symptomatic vine (Case 2). Receiver operator characteristic (ROC) analysis was used to determine the capacity of each variable to discriminate FD from AS pixels using both univariate classification approaches. Our proposed method, tested over seven red cultivar vineyards, seems promising to detect diseases leading to leaf discolorations such as FD and GTD. However, the specific detection of FD still appears to be limited. A visual analysis of the disease mapped at whole vineyard scale highlights problems of misclassifications of true symptomatic FD or GTD and asymptomatic pixels, already observed in the 2015 study. Most of those misclassifications could be related to the presence of mixed soil/vine vegetation or shadow/vine vegetation pixels. Thus, from an operational perspective, future work should focus on improving vine vegetation masking. It could be done by using the surface elevation extracted from UAV images to separate rows from the row spacing as suggested by [64]. Another alternative would be the use of image processing algorithm based on dynamic segmentation, Hough Space Clustering and Total Least Squares techniques proposed by [65]. Another option for improving the results could be working with a better spatial resolution (flying at lower height). However, the economic cost should be considered for the detection of Flavescence dorée to become operational. Another work perspective is definitely to analyze in more detail spectral signatures of vineyard diseases leading to FD similar discolorations that will complete the results obtained by Guttler and al. [36] and Al-saddik and al. [66]. This could lead to the development of a specific spectral index and to suggesting specifications in terms of the number and width of bands to adapt existing sensors, or build future sensors for enhanced FD detection. This index should be able to take into account mixed infections and different levels in leaves’ coloration intensity.

Author Contributions

J.A., S.D., A.J. and H.C. are principal authors of this manuscript. J.A., S.D. and G.D. conceived and designed the experiments. J.A., S.D., A.J. and H.C. performed the experiments and wrote the manuscript. J.A., M.G., S.D., J.A. and H.C. analyzed the data and the results. H.P. provided expert knowledge about image processing and biophysical parameters. J.R. provided expert knowledge about data collection and vineyard diseases. All authors participated in the discussions, provided comments and suggestions during the writing of the paper.

Funding

This research was funded by the regional OENOMIP project which is co-funded by the European Union and by the PURPAN Engineer school (INP Toulouse, France).

Acknowledgments

This study was performed at the PURPAN Engineer school (INP Toulouse, France) in close collaboration with the TerraNIS company (Toulouse, French). It was partly funded within the regional OENOMIP project which is co-funded by the European Union. We thank the DELAIR company, the Maison des Vins de Gaillac, the Chamber of Agriculture of Tarn (82), and the Institut Coopératif du Vin group for their help and support for data collection.

Conflicts of Interest

The authors declare no conflicts of interest.

Appendix A

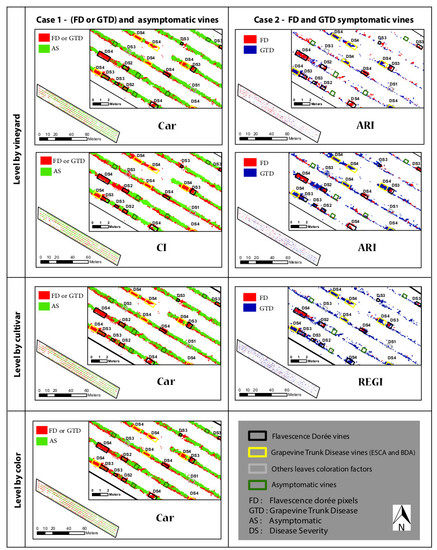
Appendix A.1. Map Disease Level of Vineyard Analysis

Figure A1. Map disease using the best multispectral variable (Spectral band, vegetation index or biophysical parameter) calibrated by vineyard to discriminate symptomatic vine vegetation (Flavescence dorée and Grapevine Trunk Disease) from asymptomatic vine vegetation (AS) (case 1) and Flavescence dorée vine vegetation (FD) from Grapevine Trunk Disease vine vegetation (GTD) (case 2).
Remotesensing 11 00023 g0a1

Appendix A.2. Map Disease Level of Cultivar Analysis

Figure A2. Map disease using the best multispectral variable (Spectral band, vegetation index or biophysical parameter) calibrated by cultivar to discriminate symptomatic vine vegetation (Flavescence dorée and Grapevine Trunk Disease) from asymptomatic vine vegetation (AS) (case 1) and Flavescence dorée symptomatic vine vegetation (FD) from Grapevine Trunk Disease vine vegetation (GTD) (case2).
Remotesensing 11 00023 g0a2

Appendix A.3. Map Disease Level of Berry Color Analysis

Figure A3. Map disease using the best multispectral variable (Spectral band, vegetation index or biophysical parameter) calibrated by color to discriminate symptomatic vine vegetation (Flavescence dorée and Grapevine Trunk Disease) from asymptomatic vine vegetation (AS) (case 1).
Remotesensing 11 00023 g0a3

References

  1. Chuche, J.; Thiéry, D. Biology and ecology of the Flavescence dorée vector Scaphoideus titanus: A review. Agron. Sustain. Dev. 2014, 34, 381–403. [Google Scholar] [CrossRef]
  2. Bruez, E.; Lecomte, P.; Grosman, J.; Doublet, B.; Bertsch, C.; Fontaine, F.; Ugaglia, A.; Teissedre, P.L.; Da Costa, J.P.; Guerin-Dubrana, L.; et al. Overview of grapevine trunk diseases in France in the 2000s. Phytopathol. Mediterr. 2013, 52, 262–275. [Google Scholar]
  3. Fontaine, F.; Gramaje, D.; Armengol, J.; Smart, R.; Nagy, Z.A.; Borgo, M.; Rego, C.; Corio-Costet, M.F. Grapevine Trunk Diseases. A Review; Cahiers de recherche, OIV Publications: Paris, France, 2016. [Google Scholar]
  4. MAAF. Rapport annuel de la Surveillance biologique du territoire de l’année 2013; Technical Report; Ministère de l’Agriculture de l’Agroalimentaire et de la Forêt: Paris, France, 2013.
  5. MAAF. Rapport annuel de la Surveillance biologique du territoire de l’année 2015; Technical Report; Ministère de l’Agriculture de l’Agroalimentaire et de la Forêt: Paris, France, 2015.
  6. Schvester, D.; Carle, P.; Moutous, G. Transmission de la flavescence dorée de la vigne par Scaphoideus littoralis Ball. Annales des Epiphyties 1963, 14, 175–198. [Google Scholar]
  7. Mori, N.; Bressan, A.; Martin, M.; Guadagnini, M.; Girolami, V.; Bertaccini, A. Experimental transmission by Scaphoideus titanus Ball of two Flavescence doree-type phytoplasmas. VITIS J. Grapevine Res. 2002, 41, 99–102. [Google Scholar]
  8. Galet, P. Les maladies et les parasites de la vigne Tome 1; Tec & Doc Distribution: Montpellier, France, 1999. [Google Scholar]
  9. Bovey, R. Maladies à virus et affections similaires de la vigne; La Maison rustique: Paris, France, 1980. [Google Scholar]
  10. Chuche, J. Comportement de Scaphoideus Titanus, ConséQuences Spatiales et DéMographiques. Ph.D. Thesis, Université Victor Segalen Bordeaux 2, Bordeaux, France, 2010. [Google Scholar]
  11. Pueyo, C.; Carrara, J.; Parent, E. Flavescence dorée en Languedoc Roussillon: Bilan de 10 années de lutte (Synthese des données 1997–2007); Direction Régionale de l’Agriculture et de la Forêt Languedoc-Roussillon, Service Régional de la Protection des Végétaux: Montpellier, France, 2008. [Google Scholar]
  12. Vitali, M.; Chitarra, W.; Galetto, L.; Bosco, D.; Marzachì, C.; Gullino, M.; Spanna, F.; Lovisolo, C. Flavescence dorée phytoplasma deregulates stomatal control of photosynthesis in Vitis vinifera. Ann. Appl. Biol. 2013, 162, 335–346. [Google Scholar] [CrossRef]
  13. Mugnai, L.; Graniti, A.; Surico, G. Esca (black measles) and brown wood-streaking: Two old and elusive diseases of grapevines. Plant Dis. 1999, 83, 404–418. [Google Scholar] [CrossRef]
  14. Guerin-Dubrana, L.; Labenne, A.; Labrousse, J.C.; Bastien, S.; Rey, P.; Gégout-Petit, A. Statistical analysis of grapevine mortality associated with esca or Eutypa dieback foliar expression. Phytopathol. Mediterr. 2012, 52, 276–288. [Google Scholar] [CrossRef]
  15. Denizot, A.M.; Larignon, P. Description des symptômes des maladies du bois—Black Dead Arm; Institut Français de la Vigne et du Vin: Le Grau du Roi, France, 2008. [Google Scholar]
  16. Denizot, A.M.; Larignon, P. Description des symptômes des maladies du bois—ESCA; Institut Français de la Vigne et du Vin: Le Grau du Roi, France, 2008. [Google Scholar]
  17. Sankaran, S.; Mishra, A.; Ehsani, R.; Davis, C. A review of advanced techniques for detecting plant diseases. Comput. Electron. Agric. 2010, 72, 1–13. [Google Scholar] [CrossRef]
  18. Martinelli, F.; Scalenghe, R.; Davino, S.; Panno, S.; Scuderi, G.; Ruisi, P.; Villa, P.; Stroppiana, D.; Boschetti, M.; Goulart, L.R.; et al. Advanced methods of plant disease detection. A review. Agron. Sustain. Dev. 2015, 35, 1–25. [Google Scholar] [CrossRef]
  19. Yang, C.M.; Cheng, C.H.; Chen, R.K. Changes in spectral characteristics of rice canopy infested with brown planthopper and leaffolder. Crop Sci. 2007, 47, 329–335. [Google Scholar] [CrossRef]
  20. Naidu, R.A.; Perry, E.M.; Pierce, F.J.; Mekuria, T. The potential of spectral reflectance technique for the detection of Grapevine leafroll-associated virus-3 in two red-berried wine grape cultivars. Comput. Electron. Agric. 2009, 66, 38–45. [Google Scholar] [CrossRef]
  21. Meroni, M.; Rossini, M.; Colombo, R. Characterization of Leaf Physiology Using Reflectance and Fluorescence Hyperspectral Measurements; Optical Observation of Vegetation Properties and Characteristics; Research Signpost: Trivandrum, India, 2010; pp. 165–187. [Google Scholar]
  22. Mahlein, A.K.; Steiner, U.; Hillnhütter, C.; Dehne, H.W.; Oerke, E.C. Hyperspectral imaging for small-scale analysis of symptoms caused by different sugar beet diseases. Plant Methods 2012, 8, 3. [Google Scholar] [CrossRef] [PubMed]
  23. Mahlein, A.K. Plant Disease Detection by Imaging Sensors—Parallels and Specific Demands for Precision Agriculture and Plant Phenotyping. Plant Dis. 2015, 100, 241–251. [Google Scholar] [CrossRef]
  24. Steele, M.R.; Gitelson, A.A.; Rundquist, D.C.; Merzlyak, M.N. Nondestructive estimation of anthocyanin content in grapevine leaves. Am. J. Enol. Vitic. 2009, 60, 87–92. [Google Scholar]
  25. Gamon, J.A.; Surfus, J.S. Assessing leaf pigment content and activity with a reflectometer. New Phytol. 1999, 143, 105–117. [Google Scholar] [CrossRef] [Green Version]
  26. Zhang, M.; Qin, Z.; Liu, X.; Ustin, S.L. Detection of stress in tomatoes induced by late blight disease in California, USA, using hyperspectral remote sensing. Int. J. Appl. Earth Obs. Geoinf. 2003, 4, 295–310. [Google Scholar] [CrossRef]
  27. Mahlein, A.K.; Rumpf, T.; Welke, P.; Plümer, L.; Steiner, U.; Oerke, E.C. Development of spectral indices for detecting and identifying plant diseases. Remote Sens. Environ. 2013, 128, 21–30. [Google Scholar] [CrossRef]
  28. Hall, A.; Lamb, D.; Holzapfel, B.; Louis, J. Optical remote sensing applications in viticulture—A review. Aust. J. Grape Wine Res. 2002, 8, 36–47. [Google Scholar] [CrossRef]
  29. Lobitz, B.; Johnson, L.; Hlavka, C.; Armstrong, R.; Bell, C. Grapevine Remote Sensing Analysis of Phylloxera Early Stress (GRAPES): Remote Sensing Analysis Summary; Technical Report; National Aeronautics and Space Administration: Washington, DC, USA, 1997. [Google Scholar]
  30. MacDonald, S.L.; Staid, M.; Staid, M.; Cooper, M.L. Remote hyperspectral imaging of grapevine leafroll-associated virus 3 in cabernet sauvignon vineyards. Comput. Electron. Agric. 2016, 130, 109–117. [Google Scholar] [CrossRef]
  31. Gennaro, S.F.D.; Battiston, E.; Marco, S.D.; Facini, O.; Matese, A.; Nocentini, M.; Palliotti, A.; Mugnai, L. Unmanned Aerial Vehicle (UAV)-based remote sensing to monitor grapevine leaf stripe disease within a vineyard affected by esca complex. Phytopathol. Mediterr. 2016, 55, 262–275. [Google Scholar] [CrossRef]
  32. Al-Saddik, H.; Laybros, A.; Cointault, F. Using Image Texture and Spectral Reflectance Analysis to Detect Yellowness and Esca in Grapevines at Leaf-Level. Remote Sens. 2018, 10, 618. [Google Scholar] [CrossRef]
  33. Paindavoine, M.; Zunino, P.; Brossaud, F.; Cointault, F. Détection de foyers infectieux de Flavescence Dorée par imagerie de drone; Presented at 8e; Les Rencontres du Végétal: Angers, France, 2015. [Google Scholar]
  34. Al-Saddik, H.; Simon, J.; Cointault, F. Assessment of the optimal spectral bands for designing a sensor for vineyard disease detection: The case of Flavescence dorée. Precis. Agric. 2018, 1–25. [Google Scholar] [CrossRef]
  35. Albetis, J.; Duthoit, S.; Guttler, F.; Jacquin, A.; Goulard, M.; Poilvé, H.; Féret, J.B.; Dedieu, G. Detection of Flavescence dorée Grapevine Disease Using Unmanned Aerial Vehicle (UAV) Multispectral Imagery. Remote Sens. 2017, 9, 308. [Google Scholar] [CrossRef]
  36. Guttler, F.; Duthoit, S.; Fauvel, M.; Jacquin, A. Spectral analysis of Vitis vinifera leaves for the detection of the Flavescence dorée disease in red and white cultivars. Science 2018. Article in preparation. [Google Scholar]
  37. Poilvé, H. Towards an Operational GMES Land Monitoring Core Service—BioPar Product User Manual—MERIS FR Biophysical Products; Technical Report, European Research Project geoland2 (FP7, EC Proposal Reference No.: FP-7-218795); European Research: Brussels, Belgium, 2010. [Google Scholar]
  38. Féret, J.B.; Gitelson, A.A.; Noble, S.D.; Jacquemoud, S. PROSPECT-D: Towards modeling leaf optical properties through a complete lifecycle. Remote Sens. Environ. 2017, 193, 204–215. [Google Scholar] [CrossRef] [Green Version]
  39. Jacquemoud, S.; Verhoef, W.; Baret, F.; Bacour, C.; Zarco-Tejada, P.J.; Asner, G.P.; François, C.; Ustin, S.L. PROSPECT + SAIL models: A review of use for vegetation characterization. Remote Sens. Environ. 2009, 113, S56–S66. [Google Scholar] [CrossRef]
  40. Féret, J.B.; François, C.; Asner, G.P.; Gitelson, A.A.; Martin, R.E.; Bidel, L.P.; Ustin, S.L.; le Maire, G.; Jacquemoud, S. PROSPECT-4 and 5: Advances in the leaf optical properties model separating photosynthetic pigments. Remote Sens. Environ. 2008, 112, 3030–3043. [Google Scholar] [CrossRef]
  41. Margaria, P.; Ferrandino, A.; Caciagli, P.; Kedrina, O.; Schubert, A.; Palmano, S. Metabolic and transcript analysis of the flavonoid pathway in diseased and recovered Nebbiolo and Barbera grapevines (Vitis vinifera L.) following infection by Flavescence dorée phytoplasma. Plant Cell Environ. 2014, 37, 2183–2200. [Google Scholar] [CrossRef] [PubMed]
  42. Rouse, J., Jr.; Haas, R.H.; Schell, J.A.; Deering, D.W. Monitoring vegetation systems in the Great Plains with ERTS. NASA Spec. Publ. 1974, 351, 309. [Google Scholar]
  43. Gitelson, A.A.; Kaufman, Y.J.; Stark, R.; Rundquist, D. Novel algorithms for remote estimation of vegetation fraction. Remote Sens. Environ. 2002, 80, 76–87. [Google Scholar] [CrossRef] [Green Version]
  44. Gitelson, A.A.; Kaufman, Y.J.; Merzlyak, M.N. Use of a green channel in remote sensing of global vegetation from EOS-MODIS. Remote Sens. Environ. 1996, 58, 289–298. [Google Scholar] [CrossRef]
  45. Yuan, L.; Pu, R.; Zhang, J.; Wang, J.; Yang, H. Using high spatial resolution satellite imagery for mapping powdery mildew at a regional scale. Precis. Agric. 2016, 17, 332–348. [Google Scholar] [CrossRef]
  46. Richardson, A.J.; Wiegand, C.L. Distinguishing vegetation from soil background information. Photogramm. Eng. Remote Sens. 1977, 43, 1541–1552. [Google Scholar]
  47. Cui, D.; Zhang, Q.; Li, M.; Zhao, Y.; Hartman, G.L. Detection of soybean rust using a multispectral image sensor. Sens. Instrum. Food Qual. Saf. 2009, 3, 49–56. [Google Scholar] [CrossRef]
  48. Huete, A.R. A soil-adjusted vegetation index (SAVI). Remote Sens. Environ. 1988, 25, 295–309. [Google Scholar] [CrossRef]
  49. Gitelson, A.A.; Merzlyak, M.N.; Chivkunova, O.B. Optical properties and nondestructive estimation of anthocyanin content in plant leaves. Photochem. Photobiol. 2001, 74, 38–45. [Google Scholar] [CrossRef]
  50. Gitelson, A.A.; Keydan, G.P.; Merzlyak, M.N. Three-band model for noninvasive estimation of chlorophyll, carotenoids, and anthocyanin contents in higher plant leaves. Geophys. Res. Lett. 2006, 33, L11402. [Google Scholar] [CrossRef]
  51. Patrick, A.; Pelham, S.; Culbreath, A.; Holbrook, C.C.; Godoy, I.J.D.; Li, C. High throughput phenotyping of tomato spot wilt disease in peanuts using unmanned aerial systems and multispectral imaging. IEEE Instrum. Meas. Mag. 2017, 20, 4–12. [Google Scholar] [CrossRef]
  52. van den Berg, A.K.; Perkins, T.D. Nondestructive estimation of anthocyanin content in autumn sugar maple leaves. HortScience 2005, 40, 685–686. [Google Scholar]
  53. Steele, M.R.; Gitelson, A.A.; Rundquist, D.C. A comparison of two techniques for nondestructive measurement of chlorophyll content in grapevine leaves. Agron. J. 2008, 100, 779–782. [Google Scholar] [CrossRef]
  54. Zarco-Tejada, P.J.; Miller, J.R.; Noland, T.L.; Mohammed, G.H.; Sampson, P.H. Scaling-up and model inversion methods with narrowband optical indices for chlorophyll content estimation in closed forest canopies with hyperspectral data. IEEE Trans. Geosci. Remote Sens. 2001, 39, 1491–1507. [Google Scholar] [CrossRef] [Green Version]
  55. Peñuelas, J.; Gamon, J.A.; Fredeen, A.L.; Merino, J.; Field, C.B. Reflectance indices associated with physiological changes in nitrogen- and water-limited sunflower leaves. Remote Sens. Environ. 1994, 48, 135–146. [Google Scholar] [CrossRef]
  56. Inglada, J.; Christophe, E. The Orfeo Toolbox remote sensing image processing software. In Proceedings of the 2009 IEEE International Geoscience and Remote Sensing Symposium (IGARSS 2009), Cape Town, South Africa, 12–17 July 2009; IEEE: Piscataway, NJ, USA, 2009; Volume 4, pp. IV–733. [Google Scholar]
  57. Cortes, C.; Vapnik, V. Support-vector networks. Mach. Learn. 1995, 20, 273–297. [Google Scholar] [CrossRef] [Green Version]
  58. Hossin, M.; Sulaiman, M. A review on evaluation metrics for data classification evaluations. Int. J. Data Min. Knowl. Manag. Process 2015, 5, 1. [Google Scholar]
  59. Delacour, H.; Servonnet, A.; Perrot, A.; Vigezzi, J.F.; Ramirez, J.M. La courbe ROC (Receiver operating characteristic): Principes et principales applications en biologie clinique. Ann. De Biol. Clin. 2005, 63, 145–154. [Google Scholar]
  60. Fawcett, T. An introduction to ROC analysis. Pattern Recognit. Lett. 2006, 27, 861–874. [Google Scholar] [CrossRef]
  61. Saatchi, S.; Buermann, W.; Ter Steege, H.; Mori, S.; Smith, T.B. Modeling distribution of Amazonian tree species and diversity using remote sensing measurements. Remote Sens. Environ. 2008, 112, 2000–2017. [Google Scholar] [CrossRef]
  62. Hastie, T.; Tibshirani, R.; Friedman, J. The Elements of Statistical Learning New York; Springer: New York, NY, USA, 2001; pp. 115–163. [Google Scholar]
  63. Welch, B.L. The generalization of students’ problem when several different population variances are involved. Biometrika 1947, 34, 28–35. [Google Scholar]
  64. Weiss, M.; Baret, F. Using 3D Point Clouds Derived from UAV RGB Imagery to Describe Vineyard 3D Macro-Structure. Remote Sens. 2017, 9, 111. [Google Scholar] [CrossRef]
  65. Comba, L.; Gay, P.; Primicerio, J.; Ricauda Aimonino, D. Vineyard detection from unmanned aerial systems images. Comput. Electron. Agric. 2015, 114, 78–87. [Google Scholar] [CrossRef]
  66. Al-Saddik, H.; Simon, J.C.; Cointault, F. Development of Spectral Disease Indices for ’Flavescence Dorée’ Grapevine Disease Identification. Sensors 2017, 17, 2772. [Google Scholar] [CrossRef] [PubMed]
Figure 1. Locations of the five experimental sites selected in the Tarn and Herault departments. Maps were projected in the RGF93/Lambert-93 coordinate system.
Remotesensing 11 00023 g001
Figure 2. Each GPS point is located at the center of the symptomatic area where leaves’ discoloration is observed. Recorded associated parameters are the length (size of the area in vine’s row direction), the thickness (size of the area orthogonally to vine’s row direction) and the disease severity (described in Figure 3).
Remotesensing 11 00023 g002
Figure 3. Visual appearance of the four disease severity categories (ds1, ds2, ds3, and ds4) that are used to report the percentage of vine leaves exhibiting symptoms of Flavescence dorée (FD). The same approach is used for classification of Grapevine Trunk Disease (GTD) severity, figure retrieved from [35].
Remotesensing 11 00023 g003
Figure 4. Localization of the collected GPS points over the seven selected vineyards and their associated disease level (point size increases as a function of disease severity). Typical examples of abnormal discolorations (Flavescence dorée and Grapevine Trunk Disease) observed for each plots are reported in the top right of each subset. RGB colored-composition from Unmanned Aerial Vehicle (UAV) multispectral images are used as background.
Remotesensing 11 00023 g004
Figure 5. Methodological framework with the main steps of data acquisition, processing and analysis. Class A and Class B vary according to the case of discrimination. For example, when the potential of multispectral variables for the discrimination of symptomatic vine vegetation (FD or GTD) from asymptotic vine vegetation (AS) is evaluated (Case 1), class A corresponds to symptomatic vine vegetation and class B to asymptomatic vine vegetation.
Remotesensing 11 00023 g005
Figure 6. Boxplot of one best vegetation index and biophysical parameter per case and scale of analysis to separate symptomatic (FD or GTD) and asymptomatic vines (Case 1); and FD and GTD symptomatic vines (Case 2). For each variable, we show the optimal threshold (Red line).
Remotesensing 11 00023 g006
Figure 7. Validation results for Case 1 (discrimination between symptomatic FD or GTD/asymptomatic) and Case 2 (discrimination between symptomatic GTD and symptomatic FD) and each scale of analysis (vineyard, cultivar and berry color). RMSE: root-mean-square error.
Remotesensing 11 00023 g007
Figure 8. Map disease using the best variable (vegetation index or biophysical parameters) calibrated by vineyard, cultivar and color to discriminate symptomatic vine vegetation (red pixels) from asymptomatic vine vegetation (green pixels) (Case1); and Flavescence dorée (FD) symptomatic vine vegetation (red pixels) from Grapevine Trunk Disease (GTD) symptomatic vine vegetation (blue pixels) (Case 2). The rectangles correspond to the FD (Black), GTD (yelow), other leaves’ coloration factors (grey) symptomatic vines and asymptomatic vines (green) located in the field; the example with the Gamay (B) field (red cultivar).
Remotesensing 11 00023 g008
Figure 9. Description of classification errors within asymptomatic areas using the biophysical parameter Car calibrated by berry color (Optimal threshold = 5.62).
Remotesensing 11 00023 g009
Figure 10. Different levels of leaf coloration intensity affected by the Flavescence dorée grapevine disease for the same cultivar in 2015 and 2016. The images were taken on a vineyard located in the Gaillac AOC ("Appellation d’Origine Contrôlée" in French or "controlled designation of origin" in English).
Remotesensing 11 00023 g010
Table 1. Main characteristics of studied vineyards plots (site number refers to the experimental sites as defined in Figure 1) and the total number of GPS points collected, with respect to symptomatic vines (which include Flavescence dorée (FD), Grapevine Trunk Diseases (GTD) and others factors of abnormal coloration (OF)) and asymptomatic vines (AS) collected for the seven selected vineyards. The classes “ds1”, “ds2”, “ds3” and “ds4” refer to FD and GTD disease severity, expressed as the percentage of vine leaves presenting the symptoms, and correspond to the ranges 1 to 25%, 26 to 50%, 51 to 75% and 76 to 100%, respectively.
FDGTDOFAS
ID VineyardVineyard Size (ha)Site n°OrientationTotal Numb. of GPS Pointsds1ds2ds3ds4ds1ds2ds3ds4TotalTotal
Fer_Servadou (A)0.11132°142194133131036323
Fer_Servadou (B)0.1288°140302914634771525
Gamay (A)0.22132°1831738372323413937
Gamay (B)0.53165°1213671431419221023
Duras0.31115°168173015123810102439
Mourvèdre0.54139°10217176131642135
Grenache0.45102°130191268141983536
Table 2. Unmanned Aerial Vehicle (UAV) platform and sensor characteristics used for the multispectral data acquisition.
Characteristic NameDescription
PlatformLong range DT-18
SensorDT-5Bands
Number of bands5
Spectral wavelengthsBlue (455–495 nm)
Green (540–580 nm)
Red (658–678 nm)
Red-edge (707–727 nm)
NIR (800–880 nm)
Focal length5.5 mm
Field of view47.2°
Flight altitude Above Ground Level (AGL)150 m
Ground resolution0.08 m/pixel
Table 3. Vegetation indices selected to discriminate FD and/or GTD symptomatic vines. For each variable, we show the formula, the biophysical indicator and the references.
Index NameFormulaBiophysical IndicatorReferences
- Normalized Difference
Vegetation Index (NDVI)
(NIR − Red)/(NIR + Red)Biomass[31,42]
- Green-Red Vegetation
Index (GRVI)
(Green + Red)/(Green + Red)[36,43]
- Green Normalized Difference
Vegetation Index (GNDVI)
(NIR − Green)/(NIR + Green)[44,45]
- Difference Vegetation
Index (DVI)
NIR − Red[46,47]
- Soil Adjusted Vegetation
Index (SAVI)
(NIR − Red) × (1 + L)/(NIR + Red + L)
L = 0.5
[19,48]
- Anthocyanin Reflectance
Index (ARI)
Green 1 − RedEdge 1 Anthocyanins
Content
[24,49]
- Modified Anthocyanin
Reflectance Index (MARI)
(Green 1 − RedEdge 1 ) × NIR[24,50]
- Red Green Index
(RGI)
Red/Green[25]
- Modified Anthocyanin
Content Index (MACI)
NIR/Green[24,51]
- Anthocyanin Content
Index (ACI)
Green/NIR[52]
- Chlorophyll Index
(CI)
(NIR/RedEdge) − 1Chlorophyll
content
[43,53]
- Normalized Pigment
Chlorophyll Index (NPCI)
(RedEdge − Blue)/(RedEdge + Blue)[51,54,55]
- Normalized Difference
Red-edge Index (NDRE)
(NIR − RedEdge)/(NIR + RedEdge)[36,51]
- Red-edge Green
Index (REGI)
(RedEdge − Green)/(RedEdge + Green)Not defined-
- Red-edge Rouge
Index (RERI)
(RedEdge − Red)/(RedEdge + Red)-
Table 4. Biophysical parameters estimated with the Overland software.
Parameter NameAcronymDescriptionUnit and Typical Range
fCoverfCoverFractional cover of green vegetation
(interception in vertical view)
0.0 to 1.0
Leaf Anthocyanin contentAntAnthocyanin content in the leaves
(per leaf unit area)
0 to 12 μg/cm2
Leaf Carotenoid contentCarCarotenoid content of the leaves
(per leaf unit area)
0 to 15 μg/cm2
Leaf Chlorophyll contentChlChlorophyll content in the leaves
(per leaf unit area)
20 to 80 μg/cm2
Table 5. Accuracy metric obtained with the Support Vector Machine (SVM) classification applied on the multispectral imagery acquired by Unmanned Aerial Vehicle (UAV).
VineyardAccuracy Metric (%)
Fer_Servadou (A)90.13
Fer_Servadou (B)95.87
Gamay (A)98.43
Gamay (B)99.02
Duras92.53
Mourvèdre99.64
Grenache99.51
Table 6. Number of vine vegetation (VV) areas and corresponding number of valid pixels (VP) (between brackets) used for the selection of the best variables and mapping of symptomatic vines (training dataset) and the validation steps (validation dataset) for each scale of analysis (vineyard, cultivar and berry color) for Case 1 (discrimination of asymptomatic AS and symptomatic FD or GTD) and Case 2 (discrimination of symptomatic FD and symptomatic GTD). DS1, DS2, DS3 and DS4 corresponds to the different levels of disease severity observed in the field.
Study Case Case 1Case 2
Statical Analysis TrainingValidationTrainingValidation
Disease Severity ASFD or GTDASFD or GTDFDGTDFDGTD
-DS4-DS1DS2DS3DS4DS4DS4DS1DS2DS3DS4DS1DS2DS3DS4
Vineyard
Fer_Servadou (A)VV1414920413654419413391-32
(VP)(285)(634)(184)(819)(1917)(1813)(254)(196)(228)(762)(1917)(1715)(323)(57)(98)(141)
Fer_Servadou (B)VV991633332144430291423473
(VP)(295)(340)(503)(934)(1187)(723)(164)(81)(181)(828)(1011)(410)(97)(106)(176)(313)(145)
Gamay (A)VV2828919414181010173837132343
(VP)(608)(1003)(201)(583)(1481)(1468)(336)(409)(372)(484)(1393)(1262)(449)(99)(88)(206)(109)
Gamay (B)VV181856202618111136733141911
(VP)(291)(710)(78)(149)(777)(867)(504)(443)(405)(78)(146)(181)(81)(71)(631)(686)(285)
DurasVV171722203825588173015438102
(VP)(355)(539)(421)(542)(1224)(787)(126)(228)(291)(466)(1026)(410)(103)(76)(198)(377)(43)
Cultivar
Fer_ServadouVV25252353745771010497047944103
(VP)(635)(1117)(632)(1753)(3104)(2536)(275)(387)(513)(1590)(2928)(2125)(310)(163)(176)(411)(182)
GamayVV575732561671528282044449517237
(VP)(1124)(1955)(54)(732)(2258)(2335)(598)(996)(944)(562)(1539)(1443)(386)(170)(719)(892)(227)
Berry color
RedVV121121971492271733150501221731183927545513
(VP)(2460)(4488)(1930)(4448)(8203)(6438)(1130)(1757)(1844)(3603)(6402)(4437)(1535)(845)(1801)(2001)(482)
Table 7. Interpretation of potential classification outcomes for Case 1.
Reference Data
Symptomatic (FD or GTD)Asymptomatic
Classification resultsSymptomatic (FD or GTD)True positive (TP)
(Symptomatic pixel classified as Symptomatic)
False positive (FP)
(Asymptomatic pixel classified as Symptomatic)
asymptomaticFalse negative (FP)
(Symptomatic pixel classified as Asymptomatic)
True negative (TN)
(Asymptomatic pixel classified as Asymptomatic)
Table 8. Two best biophysical parameters and vegetation indices to discriminate symptomatic vines vegetation areas (Flavescence dorée or Grapevine Trunk disease) from asymptomatic vines vegetation areas at three scale of analysis (by vineyard, by cultivar and by berry color. When two vegetation indices appear on the same line, their discrimination performances are equal).
Study Case Case 1—FD or GTD and Asymptomatic Vines
scale of Analysis Best VI or BSBest BP
PositionVariable(AUC, Sens./Spe.)Variable(AUC, Sens./Spe.)
Vineyard
Fer Servadou (A)1REGI(0.92, 0.83/0.87)Car(0.93, 0.84/0.91)
2GRVI(0.90, 0.82/0.82)AUC < 0.70-
Fer Servadou (B)1RGI(0.94, 0.85/0.85 )fCover(0.89, 0.7/0.92)
2GRVI(0.94, 0.84/0.87)AUC < 0.70-
Gamay (A)1CI, NDRE(0.89, 0.85/0.75)Car(0.90, 084/0.82)
2NDVI(0.80, 0.89/0.63)fCover(0.82, 0.87/0.70)
Gamay (B)1RGI, GRVI(0.86, 0.81/0.74)Car(0.90, 0.82/0.79)
2CI, NDRE(0.81, 0.64/0.76)fCover(0.86, 0.85/0.75)
Duras1GRVI(0.95, 0.93/0.85 )Car(0.92, 0.81/0.89)
2RGI(0.95, 0.92/0.85)fCover(0.91, 0.84/0.81)
Cultivar
Fer Servadou1RGI, GRVI(0.89, 0.81/0.81)Car(0.87, 0.75/0.94 )
2REGI(0.88, 0.73/0.89)fCover(0.86, 0.75/0.84)
Gamay1CI, NDRE(0.88, 0.77/0.8)Car(0.84, 0.71, 0.84)
2NDVI(0.80, 0.84/0.64)fCover(0.78, 0.72/0.74)
Berry color
Red1GRVI, RGI(0.77, 0.77/0.66)Car(0.84, 0.75/0.80)
2CI, NDRE(0.71, 0.80/0.55)fCover(0.74, 0.78/0.62)
Table 9. Two best biophysical parameters and vegetation indices to discriminate Flavescence dorée symptomatic vines vegetation areas from Grapevine Trunk Disease symptomatic vine vegetation areas at three scale of analysis (vineyard, cultivar and berry color).
Study Case Case 2—FD and GTD Vines
Scale of Analysis Best VI or SBBest BP
PositionVariable(AUC, Sens./Spe.)Variable(AUC, Sens./Spe.)
Vineyard
Fer Servadou (A)1RERI(0.84, 0.76/0.74)fCover(0.79, 0.76/0.62)
2GRVI(0.78, 0.69/0.69)Car(0.78, 0.67/0.72)
Fer Servadou (B)1AUC < 0.70-Ant(0.77, 0.64/0.82)
2AUC < 0.70-
Gamay (A)1ARI(0.85, 0.79/0.76)AUC < 0.70-
2RED(0.80, 0.71/0.79)
Gamay (B)1REGI(0.90, 0.77/0.9)Car(0.77, 0.67/0.79)
2ARI(0.81, 0.69/0.81)AUC < 0.70-
Duras1REGI(0.84, 0.76/0.80)AUC < 0.70-
2MARI(0.81, 0.72/0.75)
Cultivar
Fer Servadou1RERI(0.79, 0.76/0.67)Car(0.74, 0.72/0.70)
2RED(0.75, 0.79/0.55)AUC < 0.70-
Gamay1REGI(0.78, 0.56/0.94)AUC < 0.70-
2MARI(0.72, 0.5/0.80)AUC < 0.70-
Berry color
Red1AUC < 0.70-AUC < 0.70-
2
Table 10. Percentage of pixels for each of the main misclassification situations for Case 1 for each vineyard using the biophysical parameter Car calibrated by berry color (Optimal threshold = 5.62).
ID VineyardRandom Pixels (%)Edges of Vines Rows (%)Drop Shadow (%)Absence (%)Total AS Vines
Fer_Servadou (A)36.3654.550.009.0911
Fer_servadou (B)0.0063.649.0927.2711
Gamay (A)25.0056.250.0018.7516
Gamay (B)0.0012.500.0087.508
Duras6.2543.756.2543.7516
Mourvedre0.0069.230.0030.7713
Grenache80.000.000.0020.0020

