The Need for a Standardized Methodology for Quantitative Assessment of Natural and Anthropogenic Land Subsidence: The Agosta (Italy) Gas Field Case


ISPRA (Italian Institute for Environmental Protection and Research), Via Vitaliano Brancati 48/60, 00144 Roma, Italy
*
Author to whom correspondence should be addressed.
Remote Sens. 2019, 11(10), 1178; https://doi.org/10.3390/rs11101178
Submission received: 11 April 2019
/
Revised: 14 May 2019
/
Accepted: 15 May 2019
/
Published: 17 May 2019
(This article belongs to the Special Issue Remote Sensing of Land Subsidence)
Abstract
:In the last years, the advanced synthetic aperture radar (SAR) interferometry (InSAR) has proven its effectiveness in the assessment of ground gotion with millimetric accuracy. Its integrated use with traditional (in-situ) topographic height determination techniques, such as geometric leveling and Global Navigation Satellite System (GNSS), is consolidated in underground fluids extraction areas for detecting and monitoring land subsidence. Nevertheless, the lack of a specific standardized methodology does not allow for evaluating different results obtained from different types of analysis. Starting from the description of two independent estimations of land subsidence in the Agosta (Comacchio, Italy) area, where an environmental impact assessment procedure was carried out following a request for gas exploitation, this paper points out the need for a standardized methodology, focused on the in-situ calibration of InSAR data. This last purpose requires an adequately dense and homogeneous reference GNSS network. The in progress initiatives, at European and national level, aiming at providing a Copernicus Ground Motion service could offer the opportunity to structure a reliable and dedicated GNSS network, starting from the large amount of stations run by different institutions already existing in Italy.
1. Introduction
Land subsidence is a natural phenomenon affecting worldwide lowland areas and especially coastal areas, where thick sedimentary bodies are still consolidating [1,2,3,4,5]. Generally, natural subsidence rates are in the order of mm/yr, but land subsidence can be also induced or accelerated by anthropic activities, such as water, gas, or oil exploitation from underground reservoirs, with rates that can be in the order of cm/yr [6,7,8,9,10,11]. While it may be relatively easy to measure the fastest subsidence rates, it is certainly more challenging to accurately appreciate the millimetric motions. When preparing an environmental impact assessment (EIA) of underground fluids exploitation that may last for several decades, it is necessary to know the rate and areal distribution of natural subsidence in order to avoid attributing the amount of natural lowering to the impact of the future mining activities. This may require detecting millimetric ground motions on areas extending for tens to hundreds of square kilometers. In order to achieve this goal, in recent years the use of synthetic aperture radar (SAR) interferometry (InSAR) techniques and, in particular, advanced InSAR [12,13,14,15,16,17,18,19,20,21,22,23]. These in addition to traditional (in-situ) techniques for topographic elevation determination such as geometric leveling and GPS, has consolidated with satisfactory results [24,25,26,27,28,29,30,31,32,33,34,35,36].
This paper shows a case of controversial evaluation of land subsidence in a territory located in the Po alluvial Plain (Figure 1), a few kilometers south of the current river delta in the Comacchio Valleys, a complex of brackish lagoons and wetlands close to the Adriatic Sea. Located in the municipal territory of Comacchio (province of Ferrara), the exploration well Agosta1, about 2000 m deep, discovered a gas reservoir. The oil and gas company Eni S.p.A. applied for permission to exploit the Agosta reservoir (the estimated lifetime of two production strings is 13 years), submitting its project to the evaluation of the Italian Ministry of the Environment (Ministero dell’Ambiente e della Tutela del Territorio e del Mare—MATTM), which is in charge for the EIA.
Being the considered territory prone to land subsidence, the ground lowering induced by the gas exploitation for the estimated duration of the concession was one of the impacts considered by MATTM in the EIA. In order to prepare its assessment, MATTM consulted, among others, the Emilia Romagna Region that with the technical support of Agenzia Regionale per la Protezione dell’Ambiente dell’Emilia Romagna (ARPAE), has been monitoring subsidence phenomena on the whole regional territory since 2002. The measurements of the current land subsidence carried out independently by ARPAE and by Eni S.p.A. show a slight difference of about 4–5 mm/yr. Such a difference, even if small in absolute, becomes relevant for the correct evaluation of the impact induced by the gas extraction activity, whose working life generally lasts for decades.
ARPAE based its assessment on permanent scatterers interferometry synthetic aperture radar (PSInSAR) [12,13] and SqueeSAR [38] results, while the later Eni study took advantage only of the more recent SqueeSAR technique. The analyzed stacks of satellite SAR images were not exactly the same (Table 1 and Table 2).
The PSInSAR technique is capable of detecting displacements, with millimetric accuracy, of particular benchmarks called permanent scatterers (PS) (which are stable targets, generally man-made artifacts, which reflect the radar signal with characteristics that remain unchanged in time) when compared to a reference point, also a PS, that is considered stable. The SqueeSAR technique is capable to derive ground deformation not only from point-wise deterministic objects like PS, but also from distributed scatterers (DS), targets associated with ground resolution cells occurring mainly in rural areas.
Unfortunately, the assumption of stability for a specific PS clashes with the reality of an ever-moving land surface. In fact, to find a stable PS in a subsiding alluvial plain can be very challenging. Moreover, InSAR data lacks an absolute reference datum and are affected by low frequency velocity noise, that can be removed by Global Navigation Satellite System calibration [39]. In order to calibrate the InSAR data with in-situ constraints, both ARPAE and Eni used Continuous Global Positioning System (CGPS) data, but belonging to different Global Navigation Satellite System (GNSS) networks.
The differences in the two independent evaluation processes means that the two estimates are not directly comparable. Even if not the only reason, the uncertainties on the estimation of the subsidence rate induced by gas exploitation was certainly among the motivations that led the region to give an unfavorable evaluation of the proposed project.
Any further processing of the same sets of SAR data and related in-situ calibration would not provide a truer estimate given the lack of a standard procedure in the GNSS and PSInSAR processing and calibration. Thus, given the current situation, a further assessment is not deemed necessary and is outside the scope of this paper. Starting from the description of an exemplary case, this article raises attention to the need of a standardized procedure aimed at establishing minimum requirements to be met in ground motion assessments based on the application of InSAR techniques. In fact, without reference guidelines agreed upon by the scientific community and then adopted by the competent administrations, all correctly applied techniques provide acceptable, despite discordant results, which possibly lead to legal controversies. It would be beneficial, in particular in EIA and other hazard assessment processes, to have a defined, validated, and reliable in-situ system for calibrating InSAR data applicable across the whole national territory. Thus, the basic aims of this paper are to illustrate, through the test case of the Agosta gas field, the issue of the calibration procedure of InSAR data through GNSS networks [39,40,41,42] and the need for a reference homogeneous in-situ network on which a practical official procedure must be based. In this perspective, the initiatives currently in progress at national and European level in the framework of the Copernicus Program (www.copernicus.eu), aimed at providing a Ground Motion service based on InSAR data, will offer the opportunity to set a universally acknowledged methodology and build the infrastructure to put it into practice.
2. Geological and Geomorphological Framework
The investigated area, located in the southeastern part of the Po Plain, constitutes a portion of the Plio-Quaternary foreland basin of the Apennine chain, thrust northeast onto the Adriatic plate [43,44]. The lower portion of Quaternary sedimentary sequences of the Po River and Adriatic coast that fill this basin are structured in a series of parallel-oriented folds and thrusts with orientation about NW–SE and reach the maximum thickness of about 2000 m [45,46]. These thrust-related ridges, known as Emilia and Ferrara Folds [45], are approximately in concurrence of the present Po River course, represent the outermost Apennine fronts [47]. The Agosta anticline, part of the Ferrara Folds, due to subsidence both tectonic and by consolidation, is buried under Pleistocene and Holocene sediments; the only outstanding morphologies in the area correspond to paleo-channels, dune belts, and artificial banks bordering watercourses or reclaimed areas [48,49]. Before the massive reclamation works carried out starting from 1873 and then, more intensely, between the years 1920 and 1960, almost half of the territory of Ferrara was occupied by watercourses, swamps, and marshes. The topographic surface currently ranges between −2 and +4 m above the sea level.
The upper part of the Quaternary succession shows the alternating of clayey and silty alluvial (diffused palaeo-channels) deposits with sandy littoral (dune bars) and deltaic deposits. The surficial stratigraphy is generally composed, from top to bottom, by: half a meter of soil, 2–5 m of dark peat clay deposits, typical of fluvial-lacustrine facies with abundant shell remains, sandy deposits with peat levels and shell levels down to the depth of 12 m, compacted silty clay down to 16 m, and then silty sand deposits reaching the depth of 20 m.
The well Agosta1 (2253 m deep, corresponding to −1989.7 m a.s.l.), had the first 1000 m drilled into Pleistocene sandy deposits with silt and clay intercalations (Emiliano-Romagnolo Supersynthem and other Quaternary deposits) and then the Pliocene turbiditic dominantly sandy levels of the Porto Garibaldi and Porto Corsini Formations, where two sandy layers resulted mineralized with gas.
About 8 km southeast of the Agosta field, the important Dosso degli Angeli gas field is located (Figure 1). The two reservoirs, placed at different depths, are considered hydraulically separate. Through 32 abstraction wells deep from 2900 to 3800 m, Dosso degli Angeli has produced 32 billion Sm3 of gas (94% of recoverable resources) in 1971–2004 [50] and, after an interruption of several years due to groundwater inflow, has resumed production in 2011 with 2027 as target closing date. In the 1970–1999 period, a subsidence up to 20 mm/yr was measured above the Dosso degli Angeli field [51] triggering the concern of the local communities. Since then, a decay of the lowering has been observed that is currently noticeably reduced. Despite appearing to be very modest in relation to the ongoing production, the effects of lowering induced by the Dosso field affect also the area of Agosta, based on modelling [37,50]. Further south, closer to Ravenna, there are several gas reservoirs inducing local subsidence; however, their cones of influence do not reach the study area [52].
3. Land Subsidence Assessment: Two Different Methods
In 2015, the project “Messa in produzione del pozzo Agosta1 Dir” (Start of production of the Agosta1 Dir well), which envisages, after a trial period, the exploitation of the Agosta methane field, has been subject to the EIA procedure, for which a technical committee appointed by the Italian Ministry of the Environment (MATTM) has been in charge. Since the area (Figure 1) is already subject to natural and anthropogenic subsidence, the land lowering potentially induced by the gas extraction has been one of the impacts evaluated in the EIA. The Italian national Institute for Environmental Protection and Research (ISPRA) provided technical support to the technical committee in the preliminary activities related to the evaluation of the studies carried out by Eni on the expected induced subsidence.
The data here reported was published in the MATTM website dedicated to EIA procedures [53].
The oil company simulated the expected subsidence both at Dosso degli Angeli and at Agosta since 1980 to 2060 by applying a finite-element elasto-plastic geomechanical model (simulator developed by ISAMGEO Engineering GmbH). Two separate fluid dynamic studies were performed for the two reservoirs. The results of the simulation were compared with the available control points (location in Figure 2), represented by a GPS station (at Smarlacca, Ravenna province) above the Dosso degli Angeli field, two geometric levelling benchmarks and five SqueeSAR scatterers.
The comparison between measured and computed data requires that the former are “cleaned” from subsidence components not attributable to gas extraction (in this case the production from the Dosso field). The subsidence non-attributable to gas extraction is composed of compaction and oxidation of surface sediments (rich in organic matter), water abstraction component if any, and a deep tectonic component. Acknowledging the high local variability and uncertainty about the amount of tectonic subsidence, Eni assumed, for the whole area under examination, an average subsidence component not attributable to gas extraction of −5 mm/yr, based on recent integrated analyses of the various historical available measurements [37]. This estimate is in agreement with the 1897–1957 land subsidence rate map of the Ravenna Municipality [54] which can be considered a reliable representation of the natural land subsidence, since in that period the exploitation of the subsurface resources was still negligible. In addition, the proposer analyzed interferometric data from 1992 to 2011 over an area extending from Ravenna to the Comacchio valleys. In particular, line of sight (LOS) SAR images in ascending (Asc) and descending (Desc) acquisition geometry (see Table 1) processed with SqueeSAR technique [38] and derived vertical velocity maps (Figure 3) were analyzed.
ARPAE also carried out its own analysis of interferometric data (Table 2), over a slightly larger area. The 1992–2006 data were processed with the PSInSAR technique [12,13], and the 2006–2011 data with the SqueeSAR technique [38].
Furthermore, ARPAE published the Regional vertical velocity maps for the following years: (a) 1970/93–1999, based on geometric levelling data [59]; 1992–2000, based on PSInSAR data calibrated with levelling data [56,57] (Figure 4a); (b) 2002–2006, based on PSInSAR data calibrated with levelling data [57] (Figure 4b); (c) 2006–2011, based on the SqueeSAR data, calibrated with 16 CGPS stations (Figure 4c) [58,60].
More recently, in April 2018, Regione Emilia Romagna and ARPAE published the new vertical velocity map of the whole Region [61], which referred to the 2011–2016 period, that was not available during the EIA process.
The comparison, in the area of Dosso degli Angeli, between the InSAR velocity data (not calibrated) obtained by ARPAE and by Eni, shows differences of 5–10 mm/yr for the period 1992–2000 and over 10 mm/yr for the period 2003–2006; for the period 2006–2011 the velocities are in agreement. The diverging results before 2006 might be due to the use of different techniques (PSInSAR vs. SqueeSAR).
With the aim of calibrating the satellite data with an in-situ constraint, Eni used a CGPS station, located at Smarlacca (in the province of Ravenna), above the Dosso field (Figure 2 and Figure 5), controlled and certified by the University of Bologna. The Smarlacca CGPS station, managed by Eni together with four other nearby stations (Figure 5), was active since 2002 and, from this date until 2015, showed an average velocity of −6.48 mm/yr.
Eni calibrated the 2003–2006 and the 2006–2011 InSAR data by adding them to the difference in velocities between the Smarlacca CGPS (−8.18 and −6.10 mm/yr) for the two time periods and the average velocities for the same periods of the backscatterers within 150 m from the CGPS [55].
Moreover, Eni analyzed COSMO-SkyMed (CSK) Asc and Desc data processed with SqueeSAR technique, for the period 2012–2015, calibrated with the Smarlacca CGPS and the results were validated with the Spinaroni CGPS (that in the period 2002–2015 showed a velocity of −7.58 mm/yr), located about 11 km South of Smarlacca (see Figure 5). The SAR scatterers falling within a radius of 100 m from the Smarlacca CGPS have been used for calibration, their average velocity resulting −1.56 mm/yr. In order to calibrate with the velocity of the Smarlacca CGPS (−6.48 mm/yr) their velocity, the value of −4.92 has been added to them. Afterwards, the calibrated velocities of the scatterers falling within 100 m from the Spinaroni CGPS have been compared with the velocity of the Spinaroni CGPS, resulting in good agreement [55]. Figure 6a shows the CSK calibrated vertical components.
In the Agosta field area the average calibrated vertical velocity of the points falling within a radius of about 2 km resulted −4 ± 1.5 mm/yr, while in the area of Dosso degli Angeli −5.5 ± 1.5 mm/yr (Figure 7).
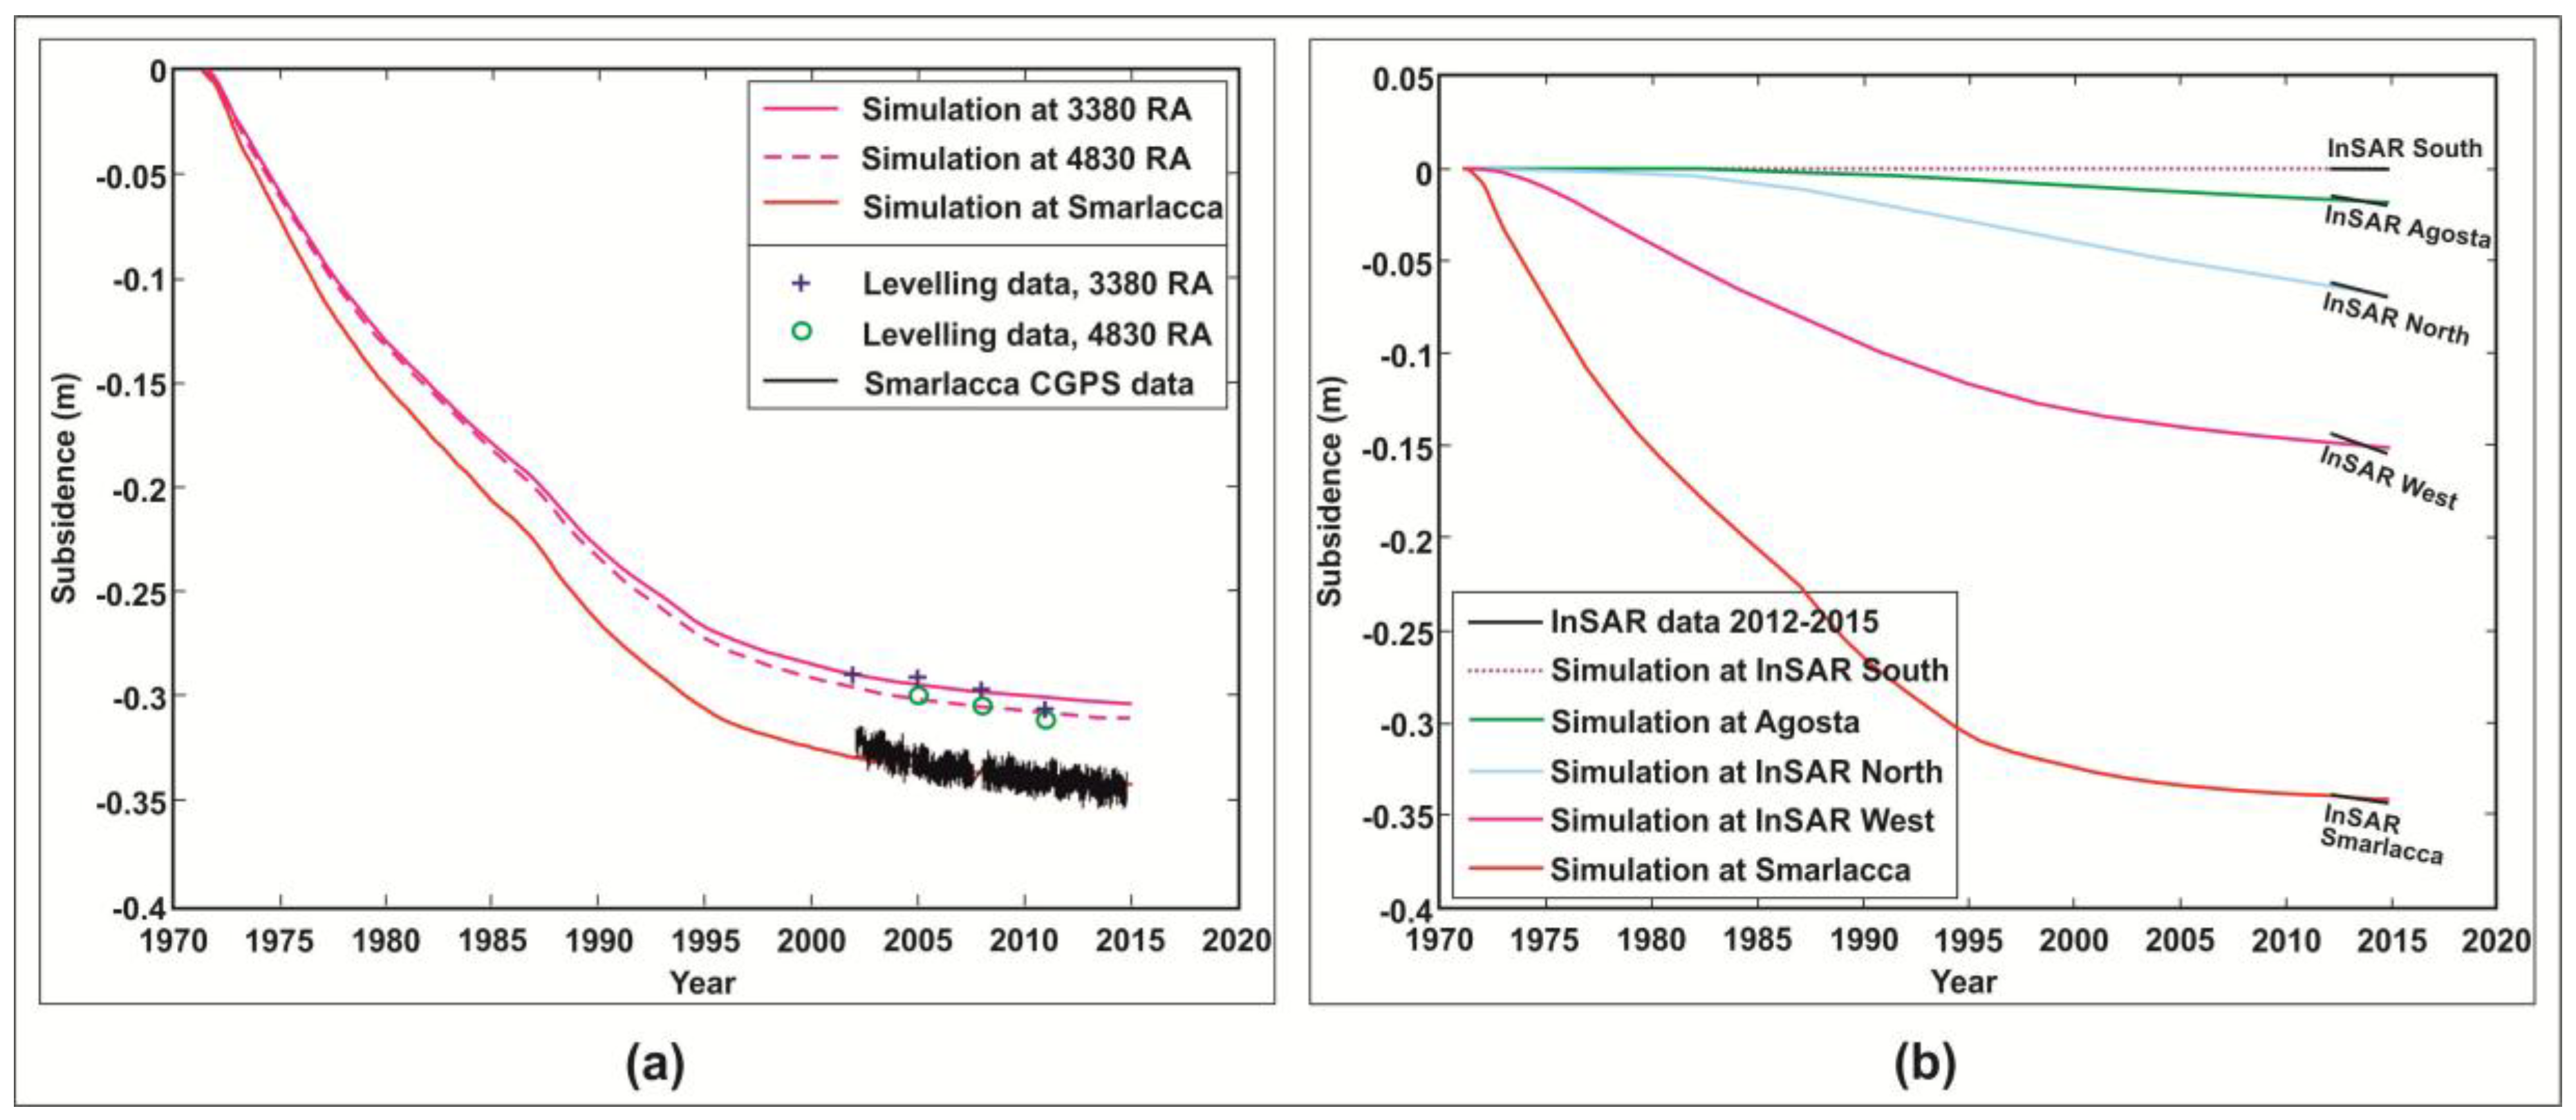
Therefore, according to these results, Eni assumed that for the whole area under examination, an average subsidence component not attributable to gas extraction of −5 mm/yr. In the geomechanical model (based on the ISAMGEO simulator cited above), this value was subtracted from the data measured in eight control points (geometric levelling, GPS, and InSAR of Figure 2) in order to obtain the component attributable to gas extraction, after the start of Dosso degli Angeli production. Eni carried out simulations in these control points to verify the goodness of the model (Figure 8). For each control point, this Figure shows the simulation curves computed for the time span 1972–2015 and the measured velocities from: (a) the 2002–2011 levelling data and the 2002–2015 Smarlacca GPS data, and (b) the 2012–2015 InSAR data.
The simulation until 2060 of subsidence induced by the production of Agosta and Dosso degli Angeli fields is reported in Table 3. Two scenarios are reported for Agosta, based on two different compressibility indexes (estimated by Eni at regional level). The simulation assumes the start of production in 2017.
Table 4 shows the results (in cm) of the simulation (average and upper scenario) at the Agosta CGPS station after subtracting the influence of Dosso degli Angeli field. Therefore, according to the Eni’s simulation, at Agosta and for the worst scenario, 17 cm of anthropogenic lowering are to be expected in 2030, to which further 6.5 cm (5 mm/yr × 13 years) will occur because of natural subsidence.
The scenario in Table 3 and Table 4 is not in agreement with the subsidence data collected by ARPAE, in particular with the estimation of the current ground motion, i.e., that before begin of production at Agosta field. ARPAE, in the Final Report on the survey of subsidence for the years 2006–2011 [58], indeed states that “in more than 60% of the territory of the province of Ferrara there is a decrease in the lowering, which averages around 2 mm/yr. Basically all the territory is free from significant land subsidence. Approaching the Po Delta, as expected, there is a slight accentuation of the phenomenon of a few mm/yr”. In fact, according to the vertical velocity map [58], in the Agosta area the subsidence rate is estimated to be around 0 mm/yr. ARPAE achieved this result through the analysis of SqueeSAR RADARSAT Asc data for the period 2006–2011. The Region territory was divided in 6 sub regions (sites) for processing. For the site “Comacchio” (that included the study area), the SqueeSAR vertical mean velocities (54,192 points) displayed standard deviations within 1.4 mm/yr, with an average value of 0.85 mm/yr. The SqueeSAR velocities were calibrated with the CGPS network of Emilia Romagna Region (Figure 5), consisting of 17 permanent stations. The latter belong to three different geodetic infrastructures: Three stations to the worldwide network International GNSS Service (IGS) and the European EUREF network; four stations to the Rete Integrata Nazionale GPS (RING) network managed by INGV; ten stations to the Fondazione dei Geometri dell’Emilia Romagna (FoGER) Surveyors Foundation network. ARPAE used these stations to define the datum for the interferometric analysis.
ARPAE used six of these permanent stations (PIAC, GUAS, REGG, ITIM, CODI, and ITRN of Figure 5) for the calibration of the interferometric data. Around each GPS station, SqueeSAR scatterers were selected and the average of their velocities, weighted on the basis of their coherence, was computed. Then, the differences with the GPS data (datum) were calculated. These differences were minimized by means of a calibration procedure that consisted in removing a low frequency velocity component, mainly due to orbital errors (from a geometric point of view, a plan was determined and applied). In this way, the average ground motion velocities of SqueeSAR data were referred to the absolute reference system made up of CGPS stations. Successively, the vertical component velocities of a further ten GPS stations were used as checkpoints with respect to the calibrated velocities: The average post-calibration residual was −0.36 mm/yr, with a standard deviation of 1.39 mm/yr [58].
A similar procedure was applied considering only the scatterers closest to each GPS station. The average distance between a GPS station and the nearest scatterer was 10.6 m and the average difference between the GPS and SqueeSAR velocities −0.6 mm/yr, with a standard deviation of 1.17 mm/yr.
The obtained values can be considered satisfactory for the validation of the methodology. The standard deviation of SAR velocities is almost the same of residuals with respect to GPS velocities and the GPS data generally show standard deviations much lower than 1 mm/yr. Therefore, ARPAE considered it adequate to attribute to the whole analysis a cautionary uncertainty threshold of 2 mm/yr. Consequently, ARPAE chose to draw the isokinetic curves in its Regional vertical velocity map with intervals of 2.5 mm/yr [58].
Statistical procedures were also applied for the removal of outliers with anomalous velocities, indicative of phenomena other than land subsidence (sinking of individual structures, settlements of recent infrastructures, etc.). At the end of such an accurate process, the average rate of lowering estimated by ARPAE for the period 2006–2011 in the area of Dosso degli Angeli is about −2 mm/yr [58], different from that estimated by the proponent of about −6 mm/yr in a radius of 150 m from the Smarlacca CGPS [55]. Finally, in the Agosta area, the ARPAE map of vertical velocities for the period 2006–2011 shows values within ±2.5 mm/yr (Figure 4c).
Recently, ARPAE has published a new survey of subsidence in the Emilia-Romagna plain based on 2011–2016 interferometric data. Compared to the previous survey (2006–2011), 79% of the regional territory does not show significant trend variations, while 18% shows a tendency to further reduce its lowering rate [61]. In the Agosta area, the limited part of the territory that had in 2006–2011 velocities in the range 0 to +2.5 mm/yr, shows now again slightly negative velocities (Figure 6b).
4. Discussion
Taking into account that the advanced InSAR technique has an intrinsic millimetric measurement error [27,62,63], the differences of a few mm/yr in the evaluations of land subsidence currently affecting the Agosta and Dosso degli Angeli areas carried out by both ARPAE and Eni, by applying different methods at different working scales, can be considered a satisfactory result. Nevertheless, in the cases of exploitation of oil and gas fields, as the one presented here, a difference of a few millimeters can lead to underestimating or overestimating the impact of the mining activity, which generally lasts for decades, in terms of induced subsidence. In the case of Agosta, the estimate made by Eni that the amount of subsidence is not imputable to gas extraction equals −5 mm/yr implies that, after the 13 years of foreseen production, 6.5 cm of lowering will have to be attributed to causes different from mining activity. In the process that led the oil company to estimate the value of −5 mm/yr, a decisive role played the calibration carried out using the Smarlacca CGPS station, located about 15 km from the Agosta site and not included in the network of 17 CGPS stations used instead in the calibration process performed by ARPAE. Moreover, Eni assumed the average rate of −5 mm/yr as valid for the whole area of investigation, despite the intrinsic variability of the territory and the difference of 1.5 mm/yr shown by the 2012–2015 calibrated SqueeSAR data at Agosta (−4 ± 1.5 mm/yr) and at Dosso degli Angeli (−5.5 ± 1.5 mm/yr) [55] (likely due to the actual impact of the ongoing Dosso degli Angeli field production [50]). Since this assumption influences the validation of the proposed geomechanical model, probably it would have been more appropriate to assume a different value for each control point located as in Figure 2. It is also worth noting that the possible contribution of the seasonal fluctuation of gas production was not addressed in the data analysis.
The Emilia Romagna Region evaluated unfavorably in the project, following the concern, among others, of the Land Reclamation Authority, the Po Delta Park, and the Municipality of Comacchio about the possible negative impacts on the hydrodynamic setting of the Comacchio Valleys, the hydraulic and road infrastructure, the coastline setting, the biological ecosystems, and the salinization of aquifers [64]. The hydraulic management of the drainage channels and the risk of flooding were the most relevant issues arisen, but also the challenging protection of the fragile natural habitats within the Po Delta Park and the Ferrara land reclamation area, often below the current sea level.
The Emilia Romagna Region stated that the uncertainties in the comparison of the subsidence estimates provided by Eni with those carried out by ARPAE do not allow for properly assessing the actual impacts. This conclusion mostly centered on the consideration that the Eni’s result crucially depend on the calibration based on the Smarlacca GPS station. The use of a single GPS station in a territory characterized by a strong intrinsic variability (in terms of stratigraphy, hydrogeology, compressibility, etc.) may have led to the significant difference with respect to the ARPAE assessment. Indeed, if more GPS stations would be considered in such a vast and heterogeneous territory, the obtained results could be different.
Therefore, the divergent (albeit by a few mm/yr) ground motion estimates produced by Eni and ARPAE, although both formally correct, are not comparable, having followed different procedures and, in particular, having been calibrated with different methods. This indetermination opens the door to practical issues and possible legal consequences.
While recognizing that the possibility of measuring ground displacements with different monitoring techniques and networks makes it possible to carry out independent assessments useful for possible cross-checks, it is clear that there is a need to have a sufficiently dense and validated nationwide reference network for the calibration of InSAR data, along with the aim of optimizing the management costs. The availability of almost continuous radar images, in particular, from the Sentinel-1A and 1B satellites of the Copernicus Programme (the European Union’s Earth Observation Programme; https://www.copernicus.eu), has made this necessity even more evident.
A dense GNSS permanent national network connected to the EUREF Permanent Network (EPN) [65,66] would be ideal for this purpose. In Italy, Istituto Geografico Militare Italiano (IGMI) defined, in 2009, a permanent GNSS network within the EPN project, known as the “Rete Dinamica Nazionale” (National Dynamic Network) and composed of 100 tracking stations (with a spacing between 100 and 150 km) located in and around national borders [67]. The number of stations was then increased up to 135 [68] but currently only 78 are still operating [69]. In addition, there are also several other GNSS networks, each of which alone does not adequately cover so far the national territory: the RING, owned by Istituto Nazionale di Geofisica e Vulcanologia (INGV), and the Geodetical Data Archive Facility (GeoDAF), owned by Agenzia Spaziale Italiana (ASI), are just two examples of systems managed by public research institutes. Other networks are managed by universities and other public bodies, in particular the Regions, and even by private companies. According to [70] the permanent GNSS stations currently distributed on the national territory are almost 800 (784 according to [39]), but many more may have escaped cataloging. Therefore, the overall number of already functioning and potentially networkable stations is relevant, even if their spatial distribution on the territory is not homogeneous and a number of them may not meet the basic technical requirements, especially on monumentation, as defined in specific guidelines (e.g., [71]).
Recently, the European Commission, in the framework of the Copernicus Programme 2018, financed the preparatory activities for the implementation of the Ground Motion Spatial Database of Europe [72], a service aimed at providing reliable and timely information regarding natural and anthropogenic ground motion phenomena in Europe. It would represent an economy of scale, ensuring that the data is processed once, reducing time, costs and achieving a coordination of results. The objective is to detect ground displacements (including land subsidence) with millimetric accuracy, by applying the SAR technology taking advantage of the images continuously acquired by the ESA Sentinel-1 satellites. Ground motion service is one of the products to be implemented by the European Environment Agency (EEA), which is entrusted with the coordination of the Services Copernicus Land Monitoring [73] and In Situ Component [74].
The EEA, through the intermediation of ISPRA (Italian Institute for environment protection and research) in its role of coordinator of a National Board of Geological Services, is exploring the availability of regional bodies to make their in-situ networks exploitable for the validation and the calibration of the ground motion data.
Similarly, at national level, the implementation of a Ground Motion service, based on interferometric data and designed as a Mirror Copernicus Downstream Service, is one of the expected products of the Italian Space Economy Strategic Plan [75,76]. An experience already realized in Italy, oriented to supporting civil protection activities, and which will be taken into account, is that of the Tuscany Region (Central Italy), where the Regional government has set up a continuous monitoring of ground deformation based on Sentinel-1 products. The operational service routinely delivers to the regional authority’s information on persistent anomalies affecting elements at risk. Field investigations are then performed in these areas to determine the severity of the hazard and the level of risk [77]. Therefore, the continuous monitoring of ground deformation at regional or national scales is now possible using Sentinel-1, coupling the short revisiting time, the wide-scale mapping capability, the regularity of acquisitions, the free data access, and the available computing methodologies (e.g., [78,79]). Recently, Norway has launched the first free and open, nationwide ground motion service [80] which is updated yearly. However, the provided data are not everywhere in-situ calibrated, as is also the case for the regional service of Tuscany. Similar initiatives are ongoing in other European countries (see e.g., [81,82]).
ISPRA is involved in the preparatory phase of the Italian Space Economy Strategic Plan and is collecting end user requirements, provided by Regional Authorities (Environmental Agencies and Geological Surveys), in order to structure a service able to meet their needs. The validation by in-situ information and calibration by geodetic networks of the Ground Motion data is a requirement frequently pointed out by the end users.
This topic will be addressed also in the HIKE–Hazard and Impact Knowledge for Europe project [83], one of the 15 projects of the GeoERA–Establishing the European Geological Surveys Research Area to deliver a Geological Service for Europe research programme [84]. The main objective of GeoERA is to contribute to the optimal use and management of the subsurface, while HIKE aims to support research and assessments of induced hazards and impacts that relate to the exploitation of subsurface resources throughout Europe.
5. Conclusions and Prospects
Due to the Agosta field location, next to the Comacchio lagoons and wetlands and the Dosso degli Angeli gas field with its induced ground lowering, one of the most relevant impacts the EIA procedure focused on was land subsidence. The independent assessments carried out by Eni and ARPAE on the current (pre-Agosta production) subsidence diverged only of a few mm/yr, nevertheless sufficient to cause a difference of several centimeters in the estimation of the impact of the production, whose planned duration is at least 13 years. In lowland areas, a lowering rate of this size is worth attention for the consequences that it can induce on both the natural environment and the building and infrastructure assets.
The rare opportunity offered by the Agosta EIA procedure, to compare two separate analyses on the same territory, showed the uncertainties that can occur in ground motion estimates. The two assessments resulted hardly comparable because: (a) different InSAR data stacks, with different acquisition geometries, were analyzed; (b) different interferometric techniques were applied to different time intervals (PSInSAR and SqueeSAR); (c) different reference benchmarks for the InSAR data were used; (d) different CGPS networks were used for calibration, and also different measuring techniques (geometric levelling and GPS) for some periods.
On one hand, the analysis of InSAR data performed by Eni can be considered more complete, having examined both acquisition geometries (ascending and descending), on the other hand, the calibration performed by ARPAE appears more robust, since based on a larger network of CGPS stations (even if none of them located in the studied area).
The difficulty in determining uniquely the actual impact was one of the reasons that moved the Emilia Romagna Region to express a negative evaluation on the project and the EIA Technical Committee of MATTM to bind its approval to a series of prescriptions [85].
Therefore, starting from the specific case of Agosta field, this paper intended to highlight the need to define a standardized methodology for quantitative assessment of natural and anthropogenic land subsidence in gas and oil field areas by means of InSAR and in-situ data, given that their combined use is the most effective tool for ground motion monitoring. The availability of a procedure that defines the minimum requirements to be met would benefit both the proposing companies in presenting the specific studies that accompany the requests for exploitation and the evaluating authorities in reducing the subjectivity of judgment on the presented material. An effort in this direction was already done by the Directorate-General for Safety of Mining and Energy Activities of the Italian Ministry of Economic Development that, in 2014, released the “Addresses and guidelines for monitoring seismicity, ground deformations and pore pressure in subsurface industrial activities” [86], with a chapter dedicated to the ground deformations monitoring. This document already indicates some addresses, but a more stringent methodology should be defined, by a committee of experts, in applying the InSAR technique in areas of underground fluids exploitation. Specific attention should be paid to the calibration with in-situ data, in particular with GNSS.
The ongoing initiatives at European and national level aiming at providing a Copernicus Ground Motion service could offer the opportunity to structure a reliable GNSS network, specifically dedicated to calibrating InSAR data, starting from the large amount of stations already existing in Italy, which would need to be combined and harmonized.
Author Contributions
Conceptualization, V.C. and E.V.; Methodology, V.C.; Software, V.C. and E.V.; Validation: V.C. and E.V.; Formal Analysis, V.C. and E.V.; Investigation. V.C.; Data Curation, V.C. and E.V.; Writing—Original Draft Preparation, V.C.; Writing—Review & Editing, E.V. and V.C.; Visualization, V.C. and E.V.; Supervision, V.C. and E.V.; Project Administration, V.C.; Funding Acquisition, V.C.
Funding
This research received no external funding.
Acknowledgments
The authors wish to thank Gabriele Bitelli and Luca Vittuari for the discussion on the integrated use of GNSS and InSAR data, Stefano Calcaterra and Benedetto Porfidia for the information on the GNSS network in Italy, Paolo Severi for the suggestions on the stratigraphy, Luca Guerrieri for the comments on the InSAR user requirements collected from Regional Authorities and the anonymous reviewers for their helpful comments and suggestions.
Conflicts of Interest
The authors declare no conflict of interest.
References
- Brand, G.B.M.; de Bruijne, A.J.T.; de Min, E.J.; Ringelberg, M.J. Modelling Regional and Local Surface Subsidence Due to Compaction of Unconsolidated Sediments. In Proceedings of the Sixth International Symposium Land Subsidence, Ravenna, Italy, 24–29 September 2000; Carbognin, L., Gambolati, G., Johnson, A.I., Eds.; Volume I and II, pp. 384 and 433. [Google Scholar]
- Prince, K.R.; Sonenshein, R.; Karavitis, G. International land subsidence data base. In Proceedings of the Technical Meeting, US Geological Survey Subsidence Interest Group Conference, Galveston, TX, USA, 27–29 November 2001; Open-File Report 03–308. pp. 147–162. [Google Scholar]
- Hu, R.L.; Yue, Z.Q.; Wang, L.C.; Wang, S.J. Review on current status and challenging issues of land subsidence in China. Eng. Geol. 2004, 76, 65–77. [Google Scholar] [CrossRef]
- Vonhögen, L.M.; Doornenbal, P.J.; De Lange, G.; Fokker, P.A.; Gunnink, J.L. Subsidence in the Holocene delta of The Netherlands. In Proceedings of the EISOLS 2010, Land Subsidence, Associated Hazards and the Role of Natural Resources Development, Querétaro, Mexico, 17–22 October 2010; IAHS Publ. 339. pp. 158–163. [Google Scholar]
- Teatini, P.; Tosi, L.; Strozzi, T. Quantitative evidence that compaction of Holocene sediments drives the present land subsidence of the Po Delta, Italy. J. Geophys. Res. 2011, 116, B08407. [Google Scholar] [CrossRef]
- Ireland, L.; Poland, J.F.; Riley, F.S. Land Subsidence in the San Joaquin Valley, California, as of 1980. U.S. Geological Survey Professional Paper 437-I.; U.S. Government Printing Office: Washington, DC, USA, 1984. [Google Scholar]
- Bell, J.W.; Amelung, F.; Ramelli, A.R.; Blewitt, G. Land Subsidence in Las Vegas, Nevada, 1935–2000: New Geodetic Data Show Evolution, Revised Spatial Patterns, and Reduced Rates. Environ. Eng. Geosci. 2002, 8, 155–174. [Google Scholar] [CrossRef]
- Gambolati, G.; Teatini, P.; Ferronato, M. Anthropogenic Land Subsidence. In Encyclopedia of Hydrological Sciences; Anderson, M.G., McDonnell, J.J., Eds.; Wiley: Hoboken, NJ, USA, 2006. [Google Scholar] [CrossRef]
- Cabral Cano, E.; Dixon, T.H.; Miralles-Wilhelm, F.; Diaz-Molina, O.; Sanchez-Zamora, O.; Carande, R.E. Space geodetic imaging of rapid ground subsidence in Mexico City. Gsa Bull. 2008, 120, 1556–1566. [Google Scholar] [CrossRef]
- Galloway, D.L.; Sneed, M. Analysis and simulation of regional subsidence accompanying groundwater abstraction and compaction of susceptible aquifer systems in the USA. Boletín De La Soc. Geológica Mex. Número Espec. Geoquímica Ambiental. 2013, 65, 123–136. [Google Scholar] [CrossRef]
- Ochoa-Gonzalez, G.H.; Carreon-Freyre, D.; Franceschini, A.; Cerca, M.; Teatini, P. Overexploitation of groundwater resources in the faulted basin of Querétaro, Mexico: A 3D deformation and stress analysis. Eng. Geol. 2018, 245, 192–206. [Google Scholar] [CrossRef]
- Ferretti, A.; Prati, C.; Rocca, F. Nonlinear subsidence rate estimation using permanent scatterers in differential SAR interferometry. IEEE Trans. Geosci. Remote Sens. 2000, 38, 2202–2212. [Google Scholar] [CrossRef]
- Ferretti, A.; Prati, C.; Rocca, F. Permanent scatterers in SAR interferometry. IEEE Trans. Geosci. Remote Sens. 2001, 39, 8–20. [Google Scholar] [CrossRef] [Green Version]
- Berardino, P.; Fornaro, G.; Lanari, R.; Sansosti, E. A new algorithm for surface deformation monitoring based on small baseline differential SAR interferograms. IEEE Trans. Geosci. Remote Sens. 2002, 40, 2375–2383. [Google Scholar] [CrossRef]
- Werner, C.; Wegmuller, U.; Wiesmann, A.; Strozzi, T.; Sensing, G.; Muri, S. Interferometric point target analysis with JERS-1 L-band SAR data. In Proceedings of the IGARSS, Toulouse, France, 21–25 July 2003; pp. 4359–4361. [Google Scholar]
- Hooper, A.; Zebker, H.; Segall, P.; Kampes, B. A new method for measuring deformation on volcanoes and other natural terrains using In-SAR persistent scatterers. Geophys. Res. Lett. 2004, 31, L23611. [Google Scholar] [CrossRef]
- Manunta, M.; Berardino, P.; Sansosti, E.; Lanari, R.; Mora, O.; Mallorqui, J.J. A small baseline approach for investigating deformation on full resolution differential SAR interferograms. IEEE Trans. Geosci. Remote Sens. 2004, 42, 1377–1386. [Google Scholar]
- Crosetto, M.; Crippa, B.; Biescas, E. Early detection and in-depth analysis of deformation phenomena by radar interferometry. Eng. Geol. 2005, 79, 81–91. [Google Scholar] [CrossRef]
- Kampes, B.M. Radar Interferometry: Persistent Scatterer Technique; Springer: New York, NY, USA, 2006. [Google Scholar]
- Lanari, R.; Casu, F.; Manzo, M.; Zeni, G.; Berardino, P.; Manunta, M.; Pepe, A. An overview of the small baseline subset algorithm: A DInSAR technique for surface deformation analysis. Pure Appl. Geophys. 2007, 164, 637–661. [Google Scholar] [CrossRef]
- Hooper, A. A multi-temporal InSAR method incorporating both persistent scatterer and small baseline approaches. Geophys. Res. Lett. 2008, 35, L16302. [Google Scholar] [CrossRef]
- Sansosti, E.; Berardino, P.; Bonano, M.; Calo, F.; Castaldo, R.; Casu, F.; Manunta, M.; Manzo, M.; Pepe, A.; Pepe, S.; et al. How second generation SAR systems are impacting the analysis of ground deformation. Int. J. Appl. Earth Obs. 2014, 28, 1–11. [Google Scholar] [CrossRef] [Green Version]
- Crosetto, M.; Monserrat, O.; Cuevas-González, M.; Devanthéry, N.; Crippa, B. Persistent Scatterer Interferometry: A review. ISPRS J. Photogr. Remote Sens. 2016, 115, 78–89. [Google Scholar] [CrossRef] [Green Version]
- Colesanti, C.; Le Mouelic, S.; Bennani, M.; Raucoules, D.; Carnec, C.; Ferretti, A. Detection of mining related ground instabilities using the Permanent Scatterers technique—A case study in the east of France. Int. J. Remote Sens. 2005, 26, 201–207. [Google Scholar] [CrossRef]
- Comerci, V.; Capelletti, S.; Michetti, A.M.; Rossi, S.; Serva, L.; Vittori, E. Land subsidence and Late Glacial environmental evolution of the Como urban area (Northern Italy). Quat. Int. 2007, 173–174, 67–86. [Google Scholar] [CrossRef]
- Herrera, G.; Tomás, R.; López-Sánchez, J.M.; Delgado, J.; Mallorqui, J.J.; Duque, S.; Mulas, J. Advanced DInSAR analysis on mining areas: La Union case study (Murcia, SE Spain). Eng. Geol. 2007, 90, 148–159. [Google Scholar] [CrossRef] [Green Version]
- Teatini, P.; Strozzi, T.; Tosi, L.; Wegmuller, U.; Werner, C.; Carbognin, L. Assessing short- and long-time displacements in the Venice coastland by synthetic aperture radar interferometric point target analysis. Geophys. Res. 2007, 112, F01012. [Google Scholar] [CrossRef]
- Maron, K.P.; Bourne, S.; Klemm, H.; van den Beukel, A.; McGillivray, P. Insights from monitoring of heavy oil production in Peace River, Canada. In Proceedings of the Abu Dhabi International Petroleum Exhibition and Conference, SPE 118244, Abu Dhabi, United Arab Emirates, 3–6 November 2008. [Google Scholar]
- Stramondo, S.; Bozzano, F.; Marra, F.; Wegmuller, U.; Cinti, F.R.; Moro, M.; Saroli, M. Subsidence induced by urbanization in the city of Rome detected by advanced InSAR. Remote Sens. Environ. 2008, 112, 3160–3172. [Google Scholar] [CrossRef]
- Herrera, G.; Fernandez, J.A.; Tomas, R.; Cooksley, G.; Mulas, J. Advanced interpretation of subsidence in Murcia (SE Spain) using A-DInSAR data—Modelling and validation. Nat. Hazards Earth Syst. Sci. 2009, 9, 647–661. [Google Scholar] [CrossRef]
- Klemm, H.; Quseimi, I.; Novali, F.; Ferretti, A.; Tamburini, A. Monitoring horizontal and vertical surface deformation over a hydrocarbon reservoir by PSInSAR. First Break 2010, 28, 29–37. [Google Scholar] [CrossRef]
- Zhao, Q.; Lin, H.; Gao, W.; Zebker, H.A.; Chen, A.; Yeung, K. InSAR detection of residual settlement of an ocean reclamation engineering project: A case study of Hong Kong International Airport. J. Oceanogr. 2011, 67, 415–426. [Google Scholar] [CrossRef]
- Cigna, F.; Osmanoğlu, B.; Cabral-Cano, E.; Dixon, T.H.; Ávila-Olivera, J.A.; Garduño-Monroy, V.H.; DeMets, C.; Wdowinski, S. Monitoring land subsidence and its induced geological hazard with Synthetic Aperture Radar Interferometry: A case study in Morelia, Mexico. Rem. Sens. Environ. 2012, 117, 146–161. [Google Scholar] [CrossRef]
- Tosi, L.; Teatini, P.; Strozzi, T. Natural versus anthropogenic subsidence of Venice. Sci. Rep. 2013, 3, 2710. [Google Scholar] [CrossRef]
- Comerci, V.; Vittori, E.; Cipolloni, C.; Di Manna, P.; Guerrieri, L.; Nisio, S.; Succhiarelli, C.; Ciuffreda, M.; Bertoletti, E. Geohazards monitoring in Rome from InSAR and in-situ data: Outcomes of the PanGeo Project. Pure Appl. Geophys. 2015, 172, 2997–3028. [Google Scholar] [CrossRef]
- Hung, W.-C.; Hwang, C.; Chen, Y.-A.; Zhang, L.; Chen, K.-H.; Wei, S.-H.; Huang, D.-R.; Lin, S.-H. Land Subsidence in Chiayi, Taiwan, from Compaction Well, Leveling and ALOS/PALSAR: Aquaculture-Induced Relative Sea Level Rise. Remote Sens. 2018, 10, 40. [Google Scholar] [CrossRef]
- Eni S.p.A. Appendice C—Studio e Piano di Monitoraggio Subsidenza. In Studio di impatto ambientale. Istanza di Concessione di Coltivazione Agosta. Messa in produzione del pozzo Agosta 1 Dir. Giugno 2015. SICS-210-APP-C. Available online: http://www.va.minambiente.it/it-IT/Oggetti/Documentazione/1552/2515?Testo=Appendice+C+%E2%80%93+Studio+e+Piano+di+Monitoraggio+Subsidenza.&RaggruppamentoID=&x=17&y=14#form-cercaDocumentazione (accessed on 7 May 2019).
- Ferretti, A.; Fumagalli, A.; Novali, F.; Prati, C.; Rocca, F.; Rucci, A. A New Algorithm for Processing Interferometric Data-Stacks: SqueeSAR. IEEE Trans. Geosci. Remote Sens 2011, 49, 3460–3470. [Google Scholar] [CrossRef]
- Farolfi, G.; Bianchini, S.; Casagli, N. Integration of GNSS and Satellite InSAR Data: Derivation of Fine-Scale Vertical Surface Motion Maps of Po Plain, Northern Apennines, and Southern Alps, Italy. IEEE Trans. Geosci. Remote Sens. 2018, 57, 319–328. [Google Scholar] [CrossRef]
- Bekaert, D.P.S.; Segall, P.; Wright, T.J.; Hooper, A.J. A network inversion filter combining GNSS and InSAR for tectonic slip modeling. J. Geophys. Res. Solid Earth 2016, 121, 2069–2086. [Google Scholar] [CrossRef]
- Komac, M.; Holley, R.; Mahapatra, P.; van der Marel, H.; Bavec, M. Coupling of GPS/GNSS and radar interferometric data for a 3D surface displacement monitoring of landslides. Landslides 2015, 12, 241–257. [Google Scholar] [CrossRef]
- Simonetto, E.; Durand, S.; Burdack, J.; Polidori, L.; Morel, L.; Nicolas-Duroy, J. Combination of INSAR and GNSS measurements for ground displacement monitoring. Procedia Technol. 2014, 16, 192–198. [Google Scholar] [CrossRef]
- Carminati, E.; Doglioni, C.; Scrocca, D. Apennines subduction-related subsidence of Venice (Italy). Geoph. Res. Lett. 2003, 30. [Google Scholar] [CrossRef]
- Fantoni, R.; Franciosi, R. Tectono-sedimentary setting of the Po Plain and Adriatic Foreland. Rend. Lincei-Sci. Fis. Nat. 2010, 21, 197–209. [Google Scholar] [CrossRef]
- Pieri, M.; Groppi, G. Subsurface Geological Structure of the Po Plain; C.N.R.: Rome, Italy, 1981; p. 23. [Google Scholar]
- Cassano, E.; Anelli, L.; Fichera, R.; Cappelli, V. Pianura Padana: Interpretazione integrata di dati geofisici e geologici. In Proceedings of the 73° Congresso Società Geologica Italiana, Roma, Italy, 29 September–4 October 1986. [Google Scholar]
- Martelli, L.; Bonini, M.; Calabrese, L.; Corti, G.; Ercolessi, G.; Molinari, F.C.; Piccardi, L.; Pondrelli, S.; Sani, F.; Severi, P. Note Illustrative della Carta Sismotettonica della Regione Emilia Romagna ed aree limitrofe. In Carta sismotettonica della Regione Emilia-Romagna e aree limitrofe; Regione Emilia Romagna, Ed.; DREAM: Pratovecchio Stia (AR), Italy, 2017; p. 94. Available online: http://mappegis.regione.emilia-romagna.it/gstatico/documenti/sismotett_2016/Nota_Illustrativa.pdf (accessed on 17 May 2019).
- Bondesan, M. Quadro schematico dell’evoluzione geomorfologica olocenica del territorio compreso fra Adria e Ravenna. In Atti della tavola rotonda “Il delta del Po”, Bologna, Italy, 24 November 1982; Acc. Sci. dell’Ist. di Bologna: Bologna, Italy, 1985; pp. 23–36. [Google Scholar]
- Bondesan, M. L’area deltizia padana: Caratteri geografici e geomorfologici. In Il Parco del delta del Po: Studi ed immagini; 21 ff, 2 tabb; Spazio Libri Ed.: Ferrara, Italy, 1990; Volume 1, pp. 9–48. [Google Scholar]
- Simeoni, U.; Tessari, U.; Corbau, C.; Tosatto, O.; Polo, P.; Teatini, P. Impact of land subsidence due to residual gas production on surficial infrastructures: The Dosso degli Angeli field study (Ravenna, Northern Italy). Eng. Geol. 2017, 229. [Google Scholar] [CrossRef]
- Bitelli, G.; Bonsignore, F.; Unguendoli, M. Levelling and GPS networks to monitor ground subsidence in the Southern Po Valley. J. Geodyn. 2000, 30, 355–369. [Google Scholar] [CrossRef]
- Fiaschi, S.; Tessitore, S.; Bonì, R.; Di Martire, D.; Achilli, V.; Borgstrom, S.; Ibrahim, A.; Floris, M.; Meisina, C.; Ramondini, M.; et al. From ERS-1/2 to Sentinel-1: Two decades of subsidence monitored through A-DInSAR techniques in the Ravenna area (Italy). Giscience Rem. Sens. 2016. [Google Scholar] [CrossRef]
- MATTM Environmental Assessments and Authorizations. Available online: http://www.va.minambiente.it/en-GB/Oggetti/Info/1552 (accessed on 7 May 2019).
- Teatini, P.; Ferronato, M.; Gambolati, G.; Bertoni, W.; Gonella, M. A Century of Land Subsidence in Ravenna Italy. Environ. Geol. 2005, 47, 831–846. [Google Scholar] [CrossRef]
- Eni S.p.A. Allegato 6b. Analisi Geodinamica campo di Dosso degli Angeli e Agosta. In Integrazioni allo Studio di Impatto Ambientale. Luglio 2016. Available online: http://www.va.minambiente.it/it-IT/Oggetti/Documentazione/1552/2515?Testo=geodinamica&RaggruppamentoID=&x=11&y=12#form-cercaDocumentazione (accessed on 7 May 2019).
- Regione Emilia Romagna, ARPAE. Progetto integrato per la tutela dell’acquifero, la lotta alla subsidenza e alla erosione costiera. Studio della subsidenza tramite interferometria. Bologna, maggio 2003. Available online: https://www.arpae.it/cms3/documenti/subsidenza/Rel_autbacmarecchi.pdf (accessed on 16 May 2019).
- Regione Emilia Romagna, ARPAE. Rilievo della subsidenza nella Pianura Emiliano-Romagnola. Analisi Interferometrica. Bologna, maggio 2007. Available online: https://ambiente.regione.emilia-romagna.it/it/acque/approfondimenti/documenti/rilievo-della-subsidenza-nella-pianura-emiliano-romagnola (accessed on 16 May 2019).
- Regione Emilia Romagna, ARPAE. Rilievo della subsidenza nella Pianura Emiliano-Romagnola. Relazione Finale. Bologna, ottobre 2012. Available online: https://www.google.com.hk/url?sa=t&rct=j&q=&esrc=s&source=web&cd=1&ved=2ahUKEwilqJ7Ss5_iAhW5KqYKHaM3C2MQFjAAegQIBBAB&url=https%3A%2F%2Fwww.arpae.it%2Fcms3%2Fdocumenti%2Fsubsidenza%2FRelfin_2012.pdf&usg=AOvVaw1J3MerGansNDGDRd5DiCyp (accessed on 16 May 2019).
- Regione Emilia Romagna, ARPA Ingegneria Ambientale. Misura della rete regionale di controllo della subsidenza, misura di linee della rete costiera non comprese nella rete regionale, rilievi batimetrici. Relazione finale. Bologna, ottobre 2001. Available online: https://www.arpae.it/cms3/documenti/subsidenza/Relfin_2001.PDF (accessed on 16 May 2019).
- Bitelli, G.; Bonsignore, F.; Pellegrino, I.; Vittuari, L. Evolution of the techniques for subsidence monitoring at regional scale: The case of Emilia-Romagna region (Italy). Proc. Iahs 2015, 372, 315–321. [Google Scholar] [CrossRef]
- Regione Emilia Romagna, ARPAE. Rilievo della subsidenza nella Pianura Emiliano-Romagnola. Seconda fase. Relazione finale. Bologna, aprile 2018. Available online: https://www.google.com.hk/url?sa=t&rct=j&q=&esrc=s&source=web&cd=1&ved=2ahUKEwiT192PtJ_iAhXKwosBHa86A6MQFjAAegQIAhAB&url=https%3A%2F%2Fambiente.regione.emilia-romagna.it%2Fit%2Facque%2Fapprofondimenti%2Fdocumenti%2Frilievo-della-subsidenza-nella-pianura-emiliano-romagnola%2Fseconda-fase&usg=AOvVaw2J83kjuuI74JEdFMDikbFt (accessed on 16 May 2019).
- Marinkovic, P.; Ketelaar, G.; Van Leijen, F.; Hanssen, R. InSAR quality control: Analysis of five years of corner reflect or time series. In Proceedings of the FRINGE 2007 Workshop, Frascati, Italy, 26–30 November 2007; ESA SP-649. February 2008. [Google Scholar]
- Haghighi, M.; Motagh, M. Sentinel-1 InSAR over Germany: Large-Scale Interferometry, Atmospheric Effects, and Ground Deformation Mapping. ZFV 2017, 142, 245–256. [Google Scholar] [CrossRef]
- Regione Emilia Romagna. Delibera di Giunta Regionale n. 539 del 28/04/2017. Procedura di VIA Ministeriale-Parere in merito alla valutazione di impatto ambientale dell’istanza di concessione di coltivazione Agosta-messa in produzione del pozzo Agosta 1 dir” nel Comune di Comacchio (art. 25, comma 2 del D.lgs. 152/06). Bologna, Italy, 2017. Available online: http://www.va.minambiente.it/it-IT/Oggetti/Documentazione/1552/2515?Testo=66.67.%09Regione+Emilia+Romagna.+Delibera+di+Giunta+Regionale+n.+539+del+28%2F04%2F2017&RaggruppamentoID=&x=19&y=14#form-cercaDocumentazione (accessed on 16 May 2019).
- EUREF Permanent GNSS Network. Available online: http://epncb.eu/ (accessed on 7 May 2019).
- Bruyninx, C.; Araszkiewicz, A.; Brockmann, E.; Kenyeres, A.; Legrand, J.; Liwosz, T.; Mitterschiffthaler, P.; Pacione, R.; Söhne, W.; Völksen, C.; Villiger, A. International GNSS Service 2017 Technical Report; Villiger, A., Dach, R., Eds.; IGS Central Bureau and University of Bern, Bern Open Publishing: Bern, Switzerland, 2018; pp. 105–115. [Google Scholar] [CrossRef]
- Farolfi, G.; Maseroli, R.; Baroni, L.; Cauli, F. Final results of the Italian “Rete Dinamica Nazionale” (RDN) of Istituto Geografico Militare Italiano (IGMI) and its alignment to ETRF2000. In Proceedings of the Symposium EUREF 2009, Firenze, Italy, 27–29 May 2009; pp. 287–320. [Google Scholar]
- Maseroli, R. Evoluzione del Sistema Geodetico di Riferimento in Italia: La RDN2. Boll. Ass. It. Cart. 2015, 153, 19–44. [Google Scholar] [CrossRef]
- Barbarella, M.; Gandolfi, S.; Tavasci, L. Monitoring of the Italian GNSS Geodetic Reference Frame. In Advanced GNSS and 3D Spatial Techniques. New Lecture Notes in Geoinformation and Cartography; Cefalo, R., Zieliński, J., Barbarella, M., Eds.; Springer: Cham, Switzerland, 2018. [Google Scholar]
- Cenni, N.; Belardinelli, M.; Baldi, P.; Loddo, F.; Gandolfi, S.; Poluzzi, L.; Tavasci, L.; Mantovani, E.; Babbucci, D.; Viti, M. The present Italian kinematic pattern from GNSS data. In Proceedings of the 35th National Conference of GNGTS, Lecce, Italy, 22–24 November 2016. [Google Scholar]
- Combrinck, L.; Schmidt, M. Physical Site Specifications: Geodetic Site Monumentation. Position Paper. In Proceedings of the IGS Network Systems Workshop, Annapolis, MD, USA, 2–5 November 1998. [Google Scholar]
- European Commission. Annex to the Commission Implementing Decision on the Adoption of the Work Programme 2018 and on the Financing of the Copernicus Programme; European Commission: Brussels, Belgium, 2018. [Google Scholar]
- EEA and Copernicus. Available online: https://www.eea.europa.eu/about-us/who/copernicus-1 (accessed on 29 March 2019).
- About the Copernicus In Situ Component. Available online: https://insitu.copernicus.eu/about (accessed on 7 May 2019).
- Space Economy. Available online: https://www.sviluppoeconomico.gov.it/index.php/it/impresa/competitivita-e-nuove-imprese/space-economy (accessed on 7 May 2019).
- European Commission. Communication from the Commission to the European Parliament, the Council, the European Economic and Social Committee and the Committee of the Regions; Space Strategy for Europe; European Commission: Brussels, Belgium, 2016; COM(2016) 705 Final. [Google Scholar]
- Raspini, F.; Bianchini, S.; Ciampalini, A.; Del Soldato, M.; Solari, L.; Novali, F.; Del Conte, S.; Rucci, A.; Ferretti, A.; Casagli, N. Continuous, semi-automatic monitoring of ground deformation using Sentinel-1 satellites. Sci. Rep. 2018, 8, 7253. [Google Scholar] [CrossRef]
- De Luca, C.; Zinno, I.; Manunta, M.; Lanari, R.; Casu, F. Large areas surface deformation analysis through a cloud computing P-SBAS approach for massive processing of DInSAR time series. Remote Sens. Environ. 2017, 202, 3–17. [Google Scholar] [CrossRef]
- Polcari, M.; Albano, M.; Montuori, A.; Bignami, C.; Tolomei, C.; Pezzo, G.; Falcone, S.; La Piana, C.; Doumaz, F.; Salvi, S.; et al. InSAR Monitoring of Italian Coastline Revealing Natural and Anthropogenic Ground Deformation Phenomena and Future Perspectives. Sustainability 2018, 10, 3152. [Google Scholar] [CrossRef]
- InSAR Norway. Available online: https://www.ngu.no/en/topic/insar-norway (accessed on 7 May 2019).
- Kalia, A.C.; Frei, M.; Lege, T. A Copernicus downstream-service for the nationwide monitoring of surface displacements in Germany. Remote Sens. Environ. 2017, 202, 234–249. [Google Scholar] [CrossRef]
- Novellino, A.; Cigna, F.; Brahmi, M.; Sowter, A.; Bateson, L.; Marsh, S. Assessing the feasibility of a national InSAR ground deformation map of Great Britain with Sentinel-1. Geosciences 2017, 7, 19. [Google Scholar] [CrossRef]
- HIKE—Hazard and Impact Knowledge for Europe. Available online: http://geoera.eu/projects/hike/ (accessed on 7 May 2019).
- GeoERA—Establishing the European Geological Surveys Research Area to deliver a Geological Service for Europe. Available online: http://geoera.eu/ (accessed on 7 May 2019).
- EIA Opinion. Available online: http://www.va.minambiente.it/en-GB/Oggetti/Documentazione/1552/2515?pagina=2 (accessed on 7 May 2019).
- Indirizzi e linee guida per il monitoraggio della sismicità, delle deformazioni del suolo e delle pressioni di poro nell’ambito delle attività antropiche. Available online: https://unmig.mise.gov.it/images/docs/85_238.pdf (accessed on 7 May 2019).
Figure 1.
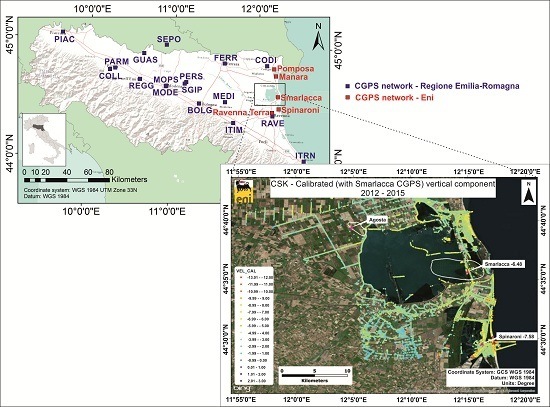
Location of the study area. The red empty polygon inside the zoom box represents the area of the Agosta1 concession while the red areas represent the surface projection of the Agosta and Dosso degli Angeli gas fields. Modified after [37]. Base map source: Esri.
Figure 1.
Location of the study area. The red empty polygon inside the zoom box represents the area of the Agosta1 concession while the red areas represent the surface projection of the Agosta and Dosso degli Angeli gas fields. Modified after [37]. Base map source: Esri.

Figure 2.
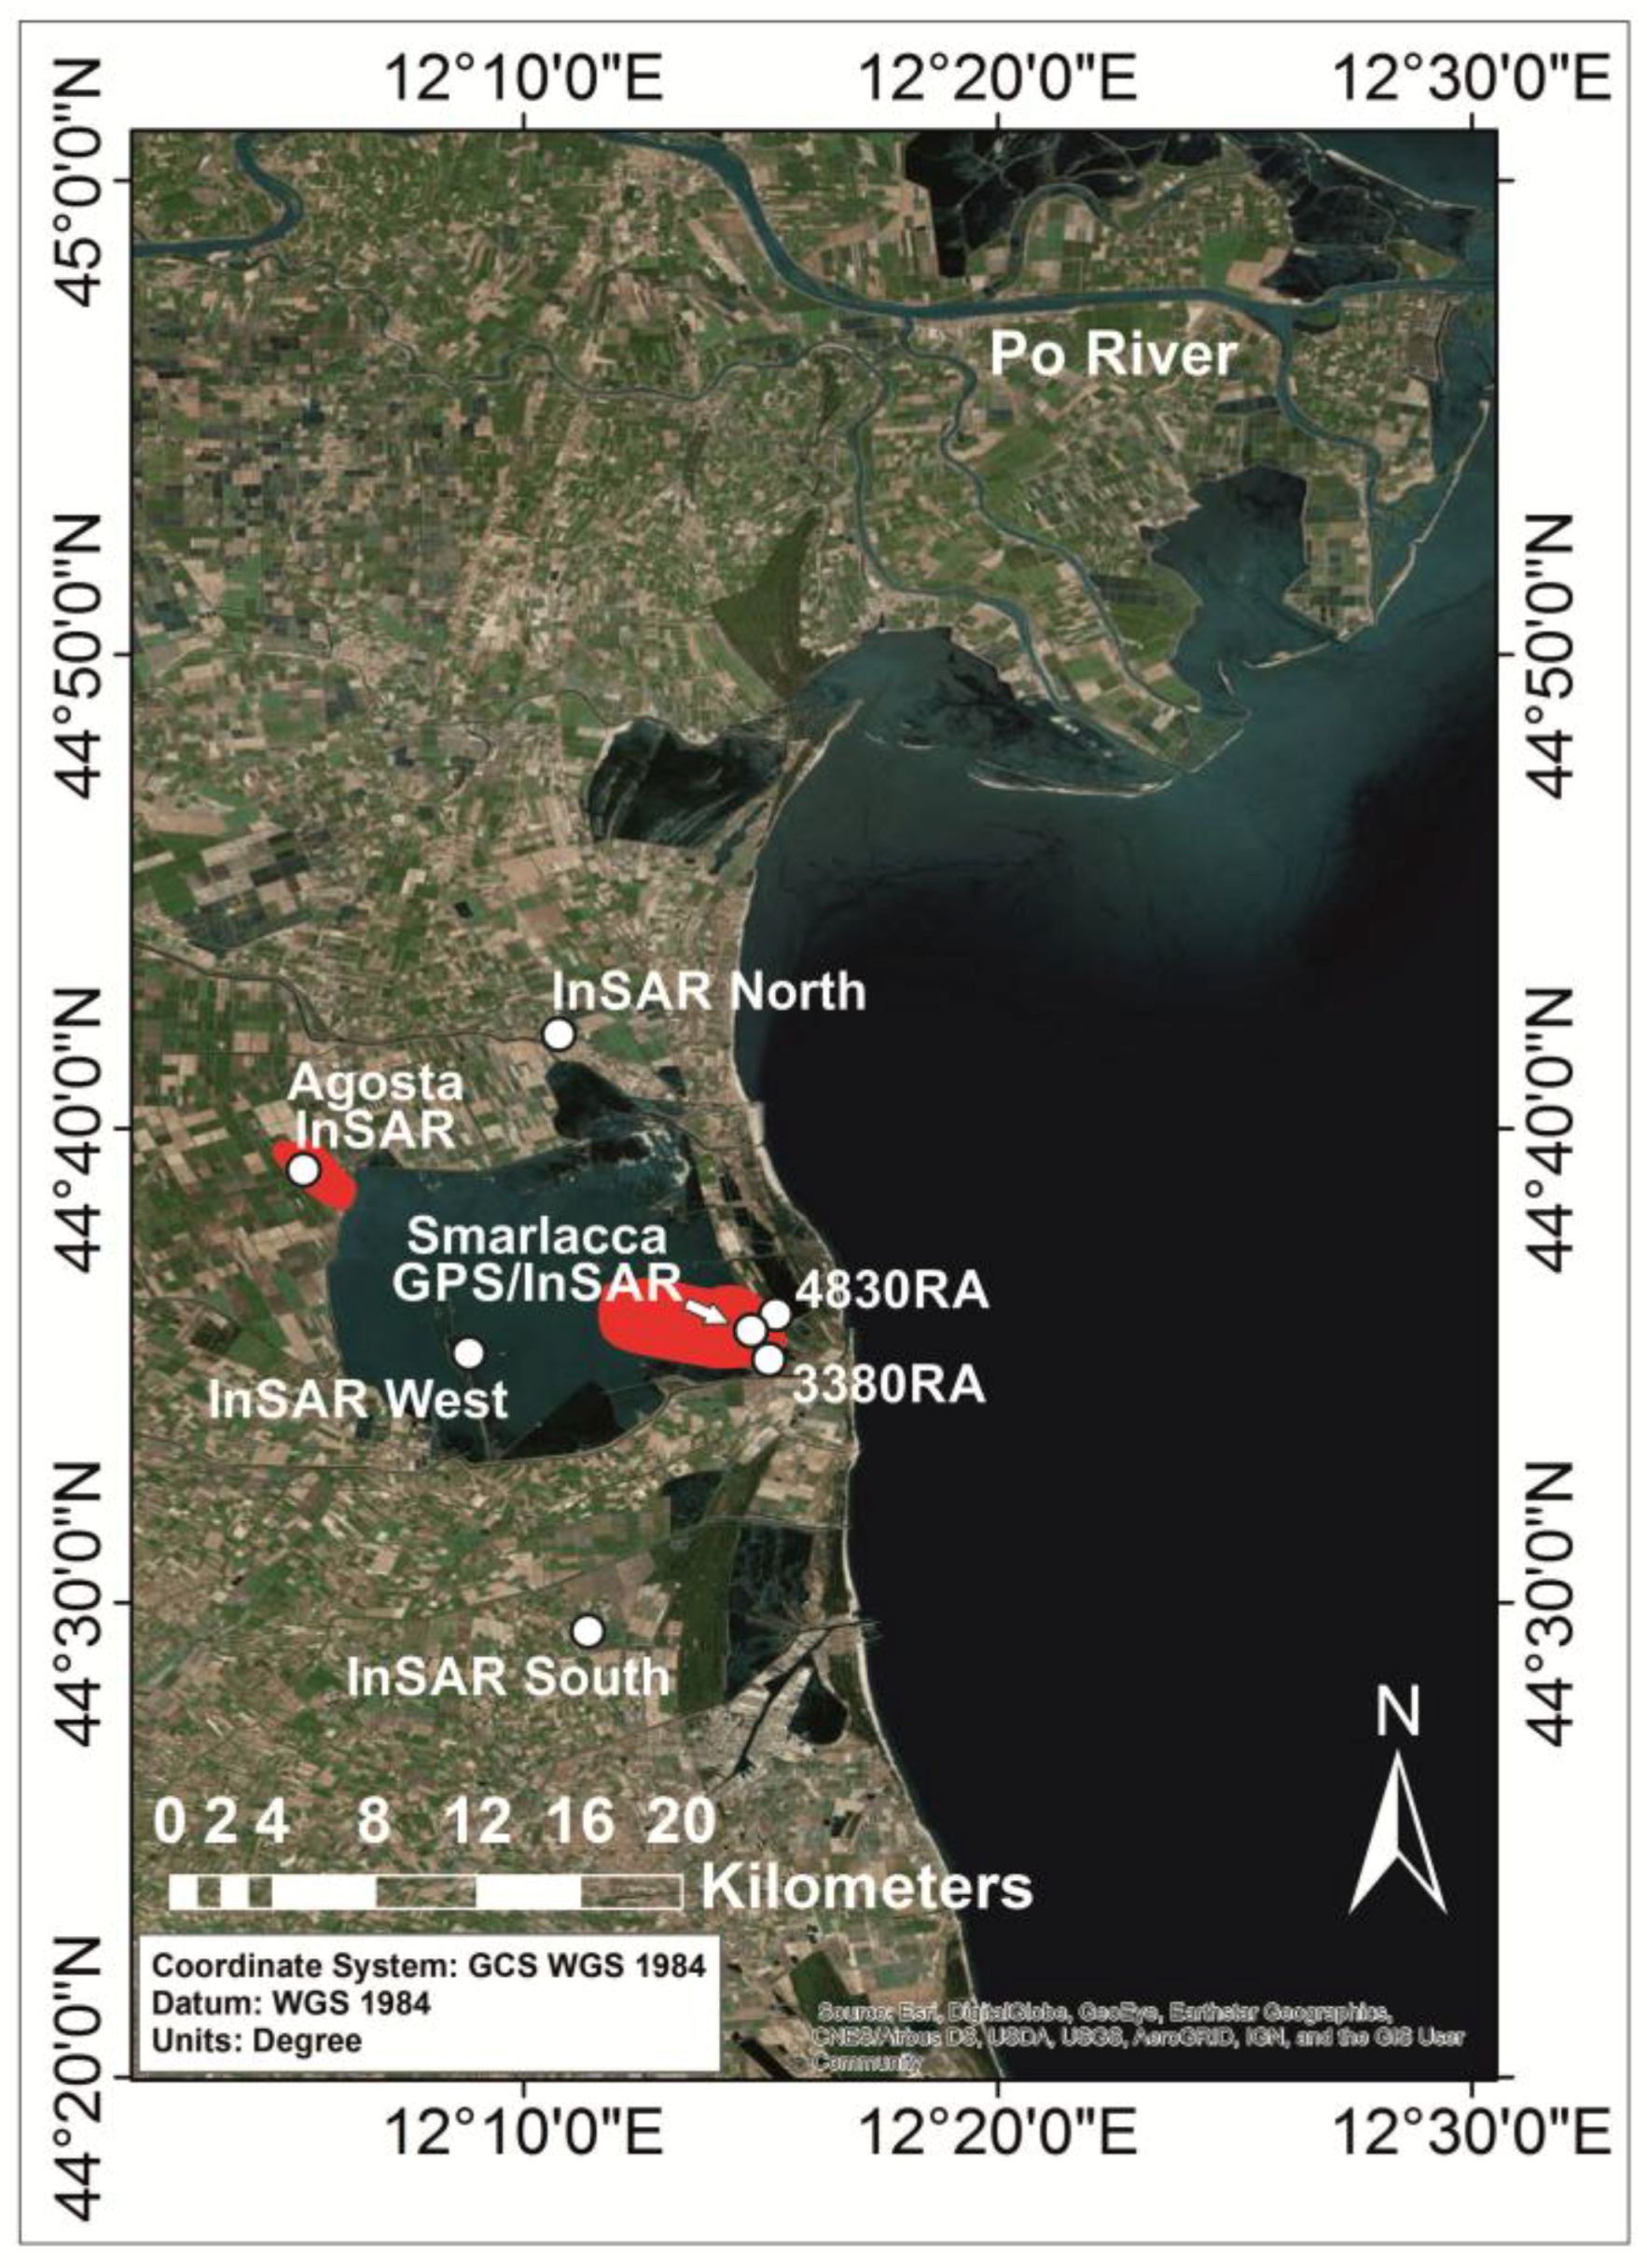
Location of the control points of the simulation: one Continuous Global Positioning System (CGPS) station at Smarlacca (Ravenna province); two geometric levelling benchmarks (3380RA and 4830RA) and five SqueeSAR scatterers (interferometry synthetic aperture radar (InSAR) Nord, Agosta InSAR, InSAR West, InSAR Sud, Smarlacca GPS/InSAR). Red areas represent the surface projection of the Agosta and Dosso degli Angeli fields. Modified after [37]. Base map source: Esri.
Figure 2.
Location of the control points of the simulation: one Continuous Global Positioning System (CGPS) station at Smarlacca (Ravenna province); two geometric levelling benchmarks (3380RA and 4830RA) and five SqueeSAR scatterers (interferometry synthetic aperture radar (InSAR) Nord, Agosta InSAR, InSAR West, InSAR Sud, Smarlacca GPS/InSAR). Red areas represent the surface projection of the Agosta and Dosso degli Angeli fields. Modified after [37]. Base map source: Esri.

Figure 3.
(a) Vertical average annual velocities of ERS 1-2 data (1992–2000); (b) Vertical average annual velocities of RSAT 1 data (2003–2006); (c) Vertical average annual velocities of RSAT 1 data (2006–2011). White polygons represent the surface projection of the Agosta and Dosso degli Angeli fields. Modified after [55].

Figure 4.
Vertical velocity maps interpolated from InSAR data and calibrated by ARPAE (extracted from ARPAE environmental geospatial website: https://arpae.it/cartografia/), related to the time periods: (a) 1992–2000; (b) 2002–2006; (c) 2006–2011. White polygons represent the surface projection of the Agosta and Dosso degli Angeli fields.
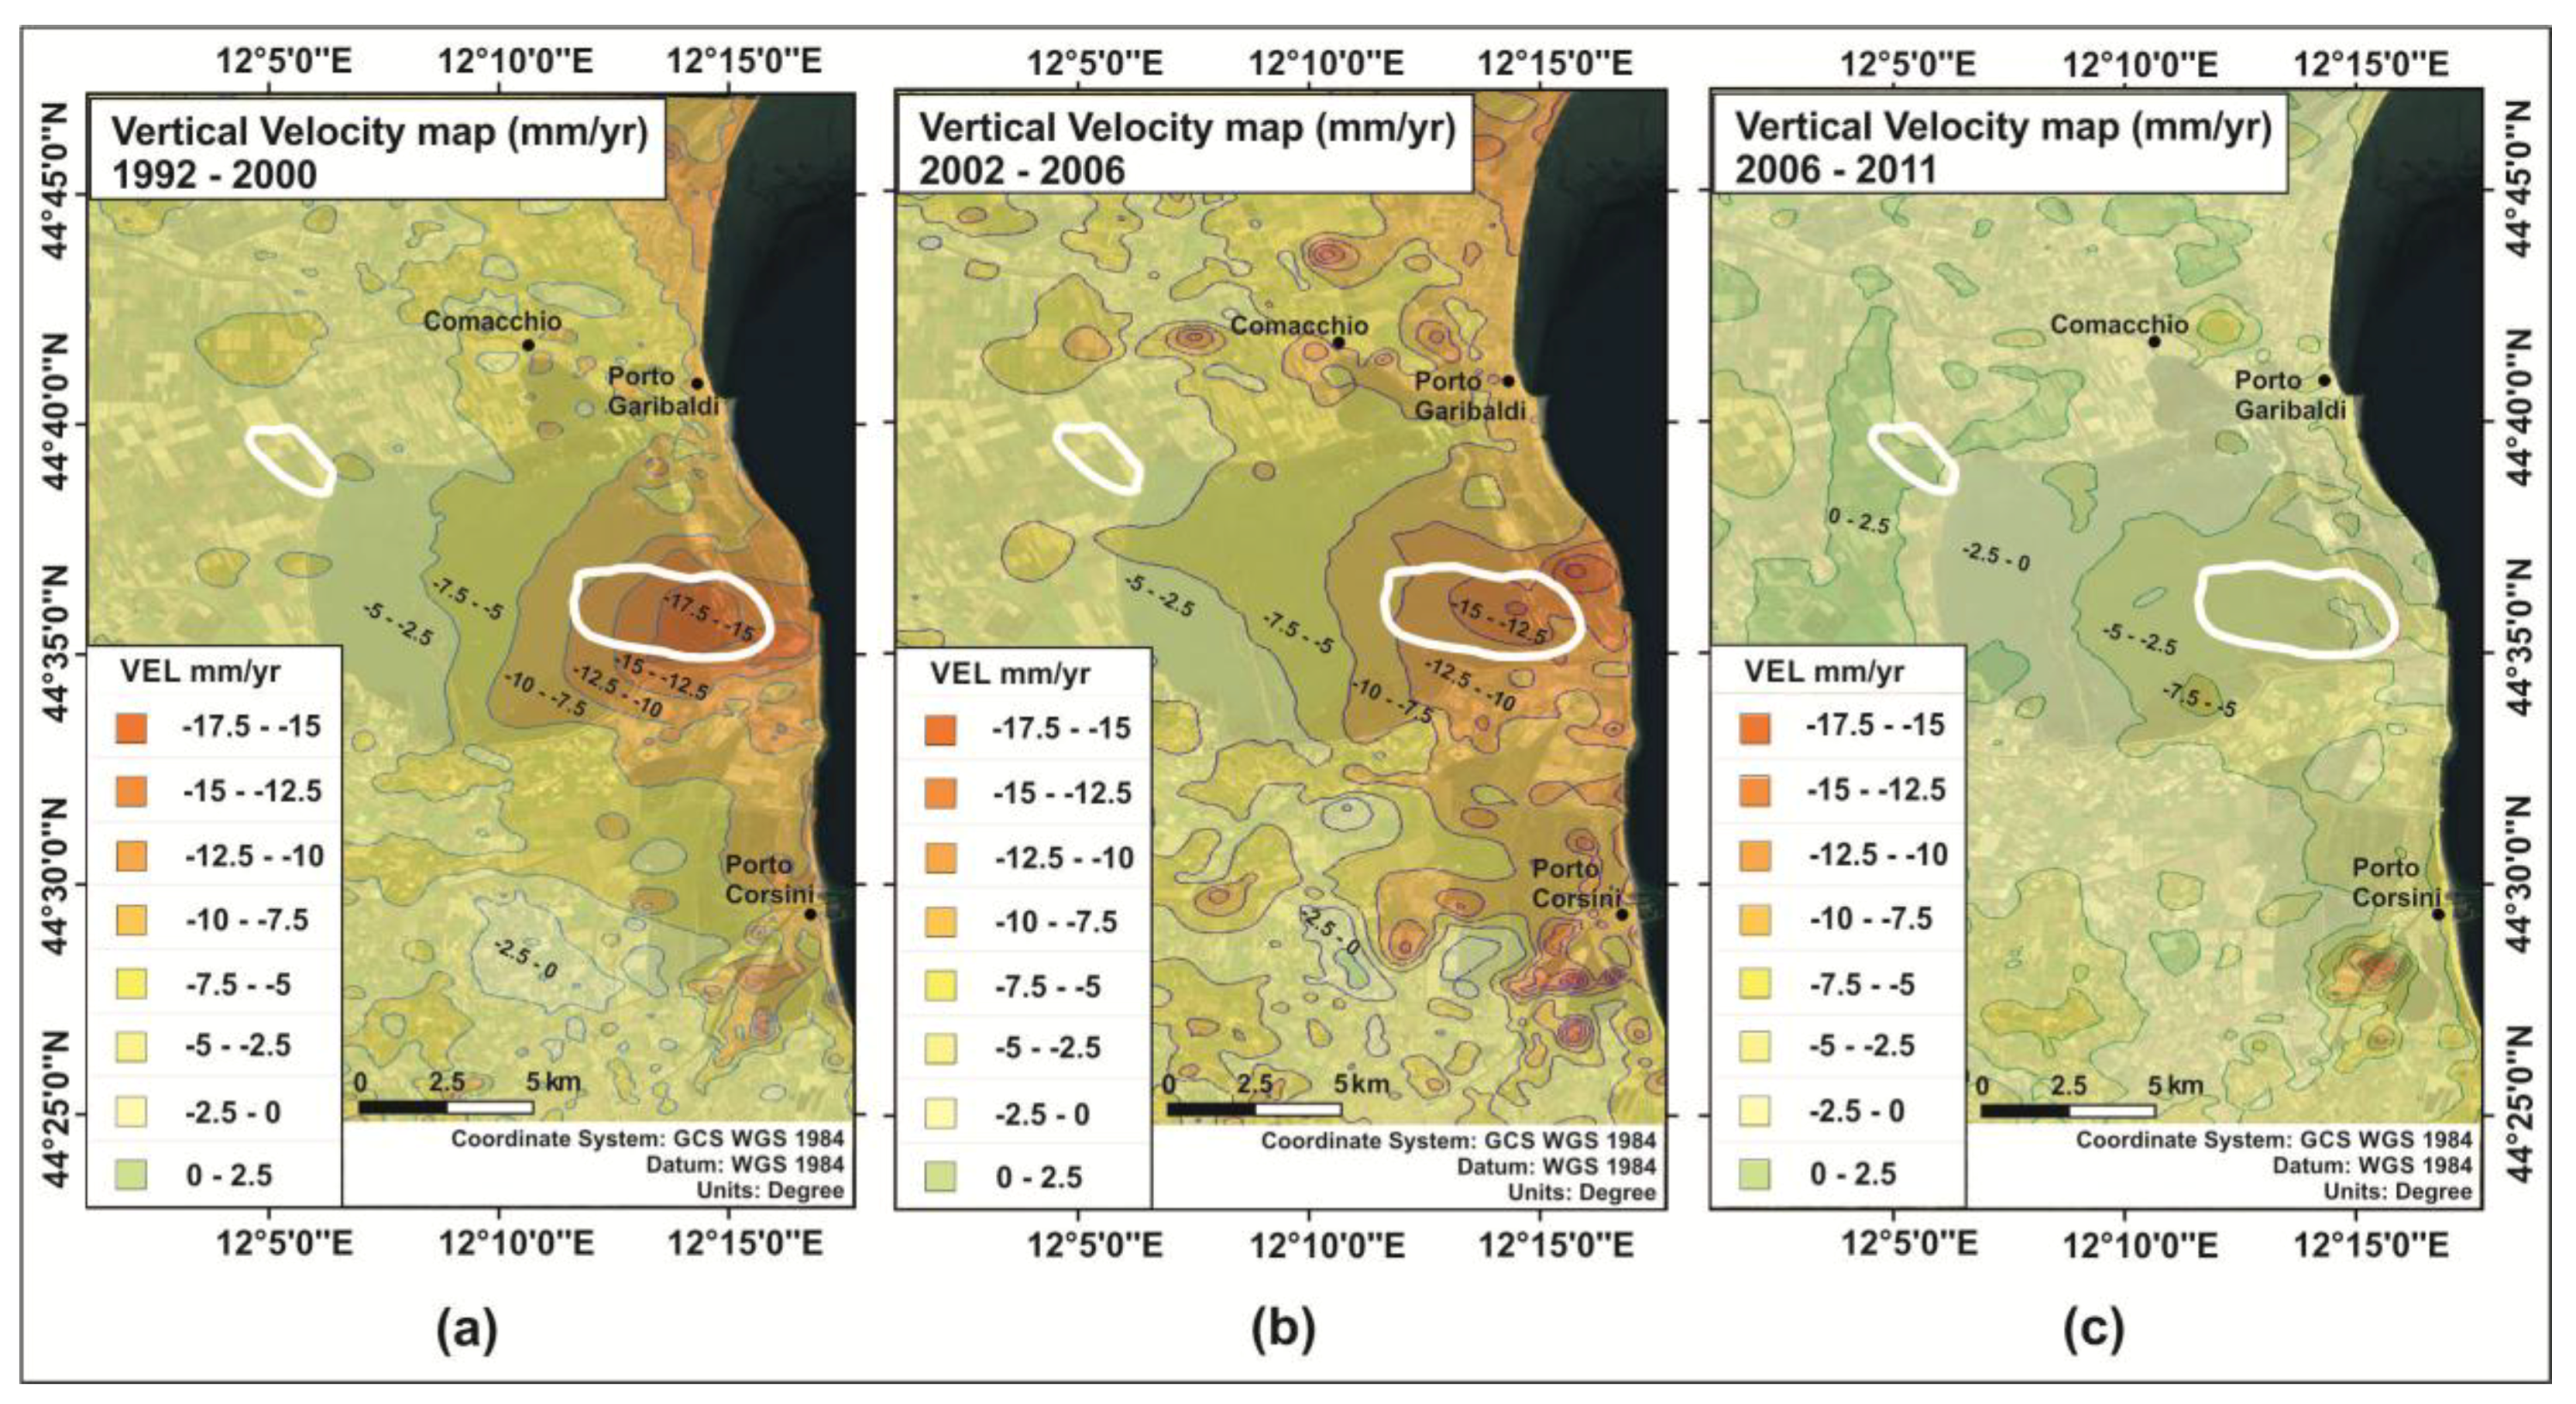
Figure 5.
Location of the five CGPS stations (in green) closest to Agosta managed by Eni S.p.A. (modified after [37]) and of the 17 CGPS stations (in blue) managed by the Emilia Romagna Region. Ten of the latter belong to the Fondazione dei Geometri dell’Emilia Romagna (FoGER) network, four to the Rete Integrata Nazionale GPS (RING) network, and three to the International GNSS Service (IGS)—European Reference Frame (EUREF) network. ARPAE used them to define the datum and to calibrate the 2006–2011 SqueeSAR (RADARSAT) data. Modified after [58].

Figure 6.
(a) COSMO-SkyMed (CSK) vertical velocities calibrated with the Smarlacca CGPS and validated with the Spinaroni CGPS by Eni. The Smarlacca and Spinaroni CGPS velocities (in mm/yr) are also indicated. Modified after [55]; (b) 2011–2016 vertical velocity map interpolated from InSAR data and calibrated by ARPAE (extracted from ARPAE environmental geospatial website: https://arpae.it/cartografia/).

Figure 7.
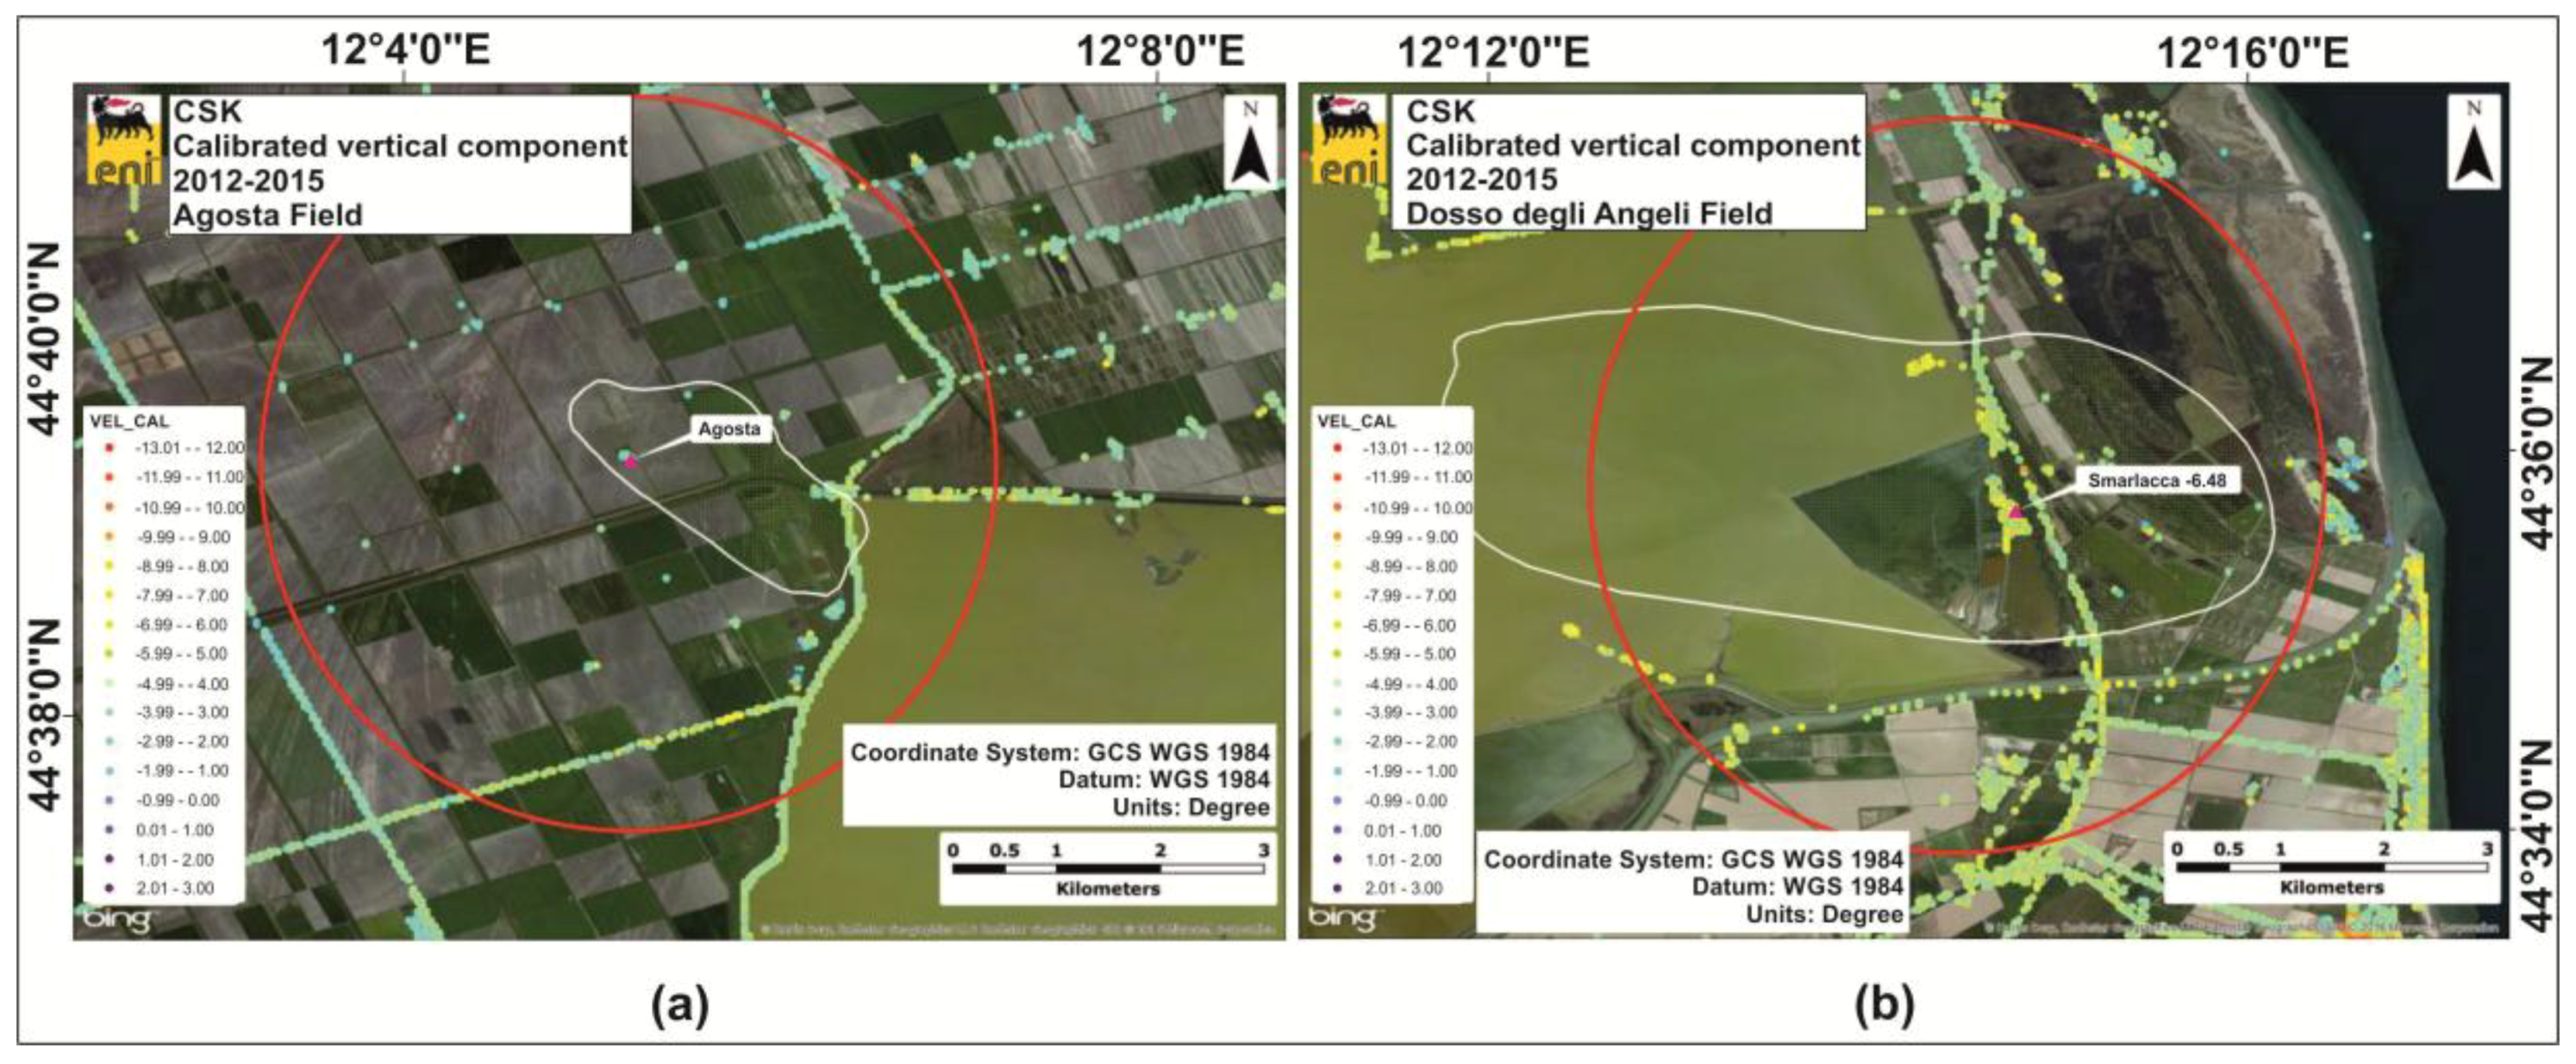
Zoom on the calibrated vertical components analyzed in the area of (a) Agosta field, where the average velocity is −4 ± 1.5 mm/yr, and in the area of (b) Dosso degli Angeli field, where the average velocity is −5.5 ± 1.5 mm/yr. Red circles, with a radius of about 2 km, enclose the points used in the statistical analysis. Modified after [55].
Figure 7.
Zoom on the calibrated vertical components analyzed in the area of (a) Agosta field, where the average velocity is −4 ± 1.5 mm/yr, and in the area of (b) Dosso degli Angeli field, where the average velocity is −5.5 ± 1.5 mm/yr. Red circles, with a radius of about 2 km, enclose the points used in the statistical analysis. Modified after [55].

Figure 8.
Simulation curves (time period 1972–2015) computed by Eni, after subtracting the non-gas components of −5 mm/yr, at the control points of Figure 2, compared with: (a) the 2002-2015 CGPS measurements at the Smarlacca station and the 2002–2011 levelling data at the 3380RA and 4830RA benchmarks (see Figure 2); (b) the 2012-2015 CSK InSAR data (black lines) at the five control points (see Figure 2).


Table 1.
Dataset of synthetic aperture radar (SAR) data analyzed by Eni (After [55]).
Table 1.
Dataset of synthetic aperture radar (SAR) data analyzed by Eni (After [55]).
| Satellite | Geometry | n. Images | n. Scatterers | Period |
|---|---|---|---|---|
| ERS 1-2 | Asc | 40 | 8480 | 03 July 1992–01 January 2001 |
| ERS 1-2 | Desc | 67 | 12,650 | 10 May 1992–13 December 2000 |
| RSAT1 | Asc | 109 | 34,044 | 08 May 2003–16 December 2011 |
| RSAT1 | Desc | 99 | 35,232 | 25 April 2003–27 December 2011 |
Table 2.
Dataset of satellite SAR data analyzed by Agenzia Regionale per la Protezione dell’Ambiente dell’Emilia Romagna (ARPAE).
Table 2.
Dataset of satellite SAR data analyzed by Agenzia Regionale per la Protezione dell’Ambiente dell’Emilia Romagna (ARPAE).
| Satellite | Geometry | n. Images | n. Scatterers | Period |
|---|---|---|---|---|
| ERS 1-2 | Desc | 65 | 14,249 | 10 May 1992–13 December 2000 1 |
| Envisat | Desc | n.d | 34,816 | April 2003–February 2006 2 |
| Envisat | Asc | n.d | 32,782 | June 2003–March 2006 2 |
| RSAT1 | Asc | 67 | 55,024 | 16 January 2006–30 April 2011 3 |
Table 3.
Simulation of the time evolution of total subsidence computed at the GPS stations located on Dosso degli Angeli and Agosta fields. For Agosta are reported the average and the upper scenario, based on different compressibility indexes. After [37].
Table 3.
Simulation of the time evolution of total subsidence computed at the GPS stations located on Dosso degli Angeli and Agosta fields. For Agosta are reported the average and the upper scenario, based on different compressibility indexes. After [37].
| Data | GPS Dosso cm | GPS Average | Agosta Upper |
|---|---|---|---|
| 01 January 1980 | 16 | 0 | 0 |
| 01 January 1990 | 28 | 0 | 0 |
| 01 January 2000 | 34 | 1 | 1 |
| 01 January 2010 | 35 | 2 | 2 |
| 01 January 2015 | 35 | 2 | 2 |
| 01 June 2017 | 36 | 2 | 2 |
| 01 June 2020 | 36 | 5 | 8 |
| 01 June 2027 | 36 | 9 | 17 |
| 01 June 2030 | 36 | 10 | 17 |
| 01 June 2040 | 36 | 10 | 17 |
| 01 June 2050 | 35 | 11 | 17 |
| 01 June 2060 | 34 | 11 | 17 |
Table 4.
Simulation (in cm) of the time evolution of subsidence at the CGPS station of Agosta after subtracting the effects induced by Dosso degli Angeli field. The upper and average scenario are based on different compressibility indexes. After [37].
Table 4.
Simulation (in cm) of the time evolution of subsidence at the CGPS station of Agosta after subtracting the effects induced by Dosso degli Angeli field. The upper and average scenario are based on different compressibility indexes. After [37].
| Data | GPS Average | Agosta Upper |
|---|---|---|
| 01 June 2017 | 0 | 0 |
| 01 June 2020 | 3 | 6 |
| 01 January 2030 | 7 | 15 |
| 01 June 2060 | 7 | 14 |
© 2019 by the authors. Licensee MDPI, Basel, Switzerland. This article is an open access article distributed under the terms and conditions of the Creative Commons Attribution (CC BY) license (http://creativecommons.org/licenses/by/4.0/).
Share and Cite
MDPI and ACS Style
Comerci, V.; Vittori, E. The Need for a Standardized Methodology for Quantitative Assessment of Natural and Anthropogenic Land Subsidence: The Agosta (Italy) Gas Field Case. Remote Sens. 2019, 11, 1178. https://doi.org/10.3390/rs11101178
AMA Style
Comerci V, Vittori E. The Need for a Standardized Methodology for Quantitative Assessment of Natural and Anthropogenic Land Subsidence: The Agosta (Italy) Gas Field Case. Remote Sensing. 2019; 11(10):1178. https://doi.org/10.3390/rs11101178
Chicago/Turabian StyleComerci, Valerio, and Eutizio Vittori. 2019. "The Need for a Standardized Methodology for Quantitative Assessment of Natural and Anthropogenic Land Subsidence: The Agosta (Italy) Gas Field Case" Remote Sensing 11, no. 10: 1178. https://doi.org/10.3390/rs11101178
Note that from the first issue of 2016, this journal uses article numbers instead of page numbers. See further details here.