1. Introduction
Climate services, emerging from a process of transforming climate science into bespoke information products and decision-support for society, have been mainstreamed with significant initiatives at the global scale (e.g., the Global Framework for Climate Services) [
1,
2], regionally in Europe (e.g. Copernicus Climate Change Service (C3S), ClimateKIC, or Climate-Adapt portal), and nationally through the emergence of national climate service centers [
3]. There are various definitions and interpretations for the concept of climate services, and it is not until recently the European Commission established an ad hoc Expert Group, assigning the climate services a broad meaning [
4]: “
the transformation of climate-related data—together with other relevant information—into customised products such as projections, forecasts, information, trends, economic analysis, assessments (including technology assessment), counselling on best practices, development and evaluation of solutions and any other service in relation to climate that may be of use for society at large”. From the definition, the climate services encompass the whole spectrum including climate data, information, and knowledge (e.g., that support adaptation, mitigation, and disaster risk management), as well as the service demand side and the evaluation of the services.
For example, the C3S aims to be an authoritative source of climate information about the past, current and future states of the climate in Europe and worldwide, and targets the commercial use of climate data and derived information products to flourish the market for climate services in Europe [
5]. The target of supporting a European market for climate services is also advocated by the European Commission (EC) (e.g., identified as “flagship initiatives” via Horizon 2020) [
4] and other transnational, national and regional programs [
3]. As one major component of the C3S architecture, the Evaluation and Quality Control (EQC) function assesses the technical and scientific quality of the service including the value to users. The EQC function is the quality assurance tool to evaluate if the data is “climate compliant” or not, and to assess how much extent the tailored climate service meets users’ specific needs (i.e., fitness for purpose). With EQC, it is expected that the climate information is fully traceable, adequately documented and uncertainty quantified (i.e., climate compliant) and can provide sufficient guidance for users to address their specific needs and feedbacks. The EQC function is the key to ensuring the climate information is authoritative, whether produced by C3S or not, and to establish relations of trust between climate information providers and various downstream users. As such, the EQC function contributes to the implementation of a “European Research and Innovation Roadmap for Climate Services”, by addressing its challenges of “Building the Market Framework” and “Enhancing the Quality and Relevance of Climate Services” [
6].
The above two challenges have inspired two main groups of research focuses: (1) the quality assurance of climate data and information products (e.g., QA4ECV [
7], QA4EO [
8], GAIA-CLIM [
9], FIDUCEO [
10], CORE-CLIMAX [
11], C3S EQC projects [
12,
13,
14,
15,
16]); (2) the market value of climate services (EU-MACS [
17,
18], MARCO [
18,
19], EUPORIAS [
20], C3S Sectoral Information System Projects [
21]) (see the
Appendix for a list of key acronyms and abbreviations used in this paper). The prototyped quality assurance (QA) framework for climate data records has been recently developed [
22] and implemented for a selection of 12 Essential Climate Variables (ECVs), with in total 24 products [
23]. Nevertheless, the evaluation of the usability of climate data and information products is not yet comprehensively addressed, which hinders the overall market uptake of climate services [
24,
25]. The market of climate services, although gaining its popularity, remains in its infancy and the associated economic benefits/values to users are either unknown or uncertain [
18], which is mainly due to the lack of exploration into the uncertainty propagation in the so-called value chain of climate services [
26]. While the necessity of evaluating climate services is well recognized, to ensure its success (e.g., useful/usable for decision making at all levels) and continuous evolutions, the effective metrics, methodologies, and associated evaluation framework are still to be further developed and matured [
26,
27].
The value chain of climate services is complicated; the main feature of which can be deemed as a stage-wise process [
28]. A crude distinction is by upstream, midstream and downstream services. Upstream climate services involve the reprocessing and fusion of (different) observational data, as well as development and application of various types of climate models and reanalysis products [
29,
30]. The EQC projects/efforts are currently concentrating on the upstream for the ECV climate data records (CDRs). In the upstream part the role of non-climate data is small (e.g., socio-economic, demography, land cover land use change, etc.), and these non-climate data are still of (geo) physical nature. The users of these climate services are mostly operating in the midstream part (e.g., climate indicators, downscaling to local scale and evaluating impacts, etc.). However, for some sectors, such as electricity supply, it may stretch from the upstream of available climate data and information to the downstream of end-use applications.
In the midstream part, advanced downscaling (i.e., from global to local scale), complex composite (climate) variables, and impact-oriented indicators are developed (e.g., involving more biological data), and also applications and data platforms are developed with particular downstream applications in mind (such as for public health risks and technical infrastructure management). This means that the data products tend to contain more non-climate data, purpose-developed composites, and specific climate data-based indicators. The design of these climate indicators requires knowledge about processes outside climate. The users of these climate services are operating in the midstream and downstream, either as end-users or as end-user-oriented organizations.
In the downstream segment, the significance of non-climate data increases. Furthermore, various end-use segments may not have very formalized risk assessment and decision procedures in place. All in all, this makes a purely quantitative QA application difficult or impossible in this segment. Transparent QA in the preceding stages of climate service value chain can make QA easier at this downstream stage. Nevertheless, the evaluation of the complete chain of climate services needs consideration on aspects (e.g. user-driven, communication, socioeconomic efficiency and social and behavioral sciences) beyond the EQC alone [
27,
31]. Furthermore, other than the assessment of the quality of ECVs, the evaluation of the usability of ECVs should be addressed as well [
32]. In this study, we will focus on the evaluation procedures for ECVs, addressing their technical and scientific quality as well as its usability, and taking into account the current development of climate service initiatives in Europe.
The ECV products are typically derived from Earth Observations (satellite and in-situ) and reanalysis products, including single-product ECVs (i.e., consists of only one single ECV variable), multi-product ECVs (i.e., more than one single ECV variables, for example cloud properties) and thematic products (i.e., physically interlinked ECV variables) [
33,
34]. The generation of ECV CDRs usually needs to combine data from a variety of sources (e.g., space, in-situ and reanalysis) and to go through various steps of a production chain [
29,
35,
36]. The present paper reviews and synthesizes the academic literature on the quality assurance of ECVs, and describes the details on how to evaluate the quality, and usability of ECV products. In the following sections, the overarching structure is firstly introduced for single-product assessment, multi-product inter-comparison, thematic assessment and usability assessment, followed by separate sections of delineating each assessment. More specifically, for usability assessment, a reinsurance example was used to demonstrate how different climate data can lead to different economic values of climate services. The final section provides general conclusions and recommendations.
2. Overarching Structure for the Assessment of Quality and Usability (AQUE) of ECV Products
The Conference of the Parties (COP)-21 Paris Agreement calls to “strengthen scientific knowledge on climate, including research, systematic observation of the climate system and early warning systems, in a manner that informs climate services and supports decision-making” [
37], which assembles the pressing needs of the United Nations Framework Convention on Climate Change (UNFCCC) and the Global Climate Observing System (GCOS) for systematic climate observations. Observations are the basis for detecting climate trends, as well as for the understanding of climate processes (i.e., water, energy and carbon cycles) that enable climate modeling and prediction. Against a backdrop of human-induced climate change, some climate variables shift their probability distributions with increases in the likelihood of “climate extremes” (e.g., heat waves and heavy rainfall events), which can be only reliably detected using observations, and poses additional challenges for monitoring, modeling and predicting the climate system. Improved knowledge of these challenges is a prerequisite for adaptation and mitigation decisions, effective disaster risk reduction, and therefore climate services.
To characterize and trace climate change, GCOS defined the Essential Climate Variables (ECVs) and provided an internationally agreed priority list to guide the sustained observation of the Earth’s climate [
33,
38]. GCOS aims to collect the accurate and homogeneous Climate Data Records (CDRs) over long timescales. It is notable that the observational signals that are important for climate monitoring and the detection of climate variability and change can easily be lost in the “noise” of an evolving observing system. Such “noise” emphasizes the need for a sustainable continuity in an observing system that can be gauged against an invariant reference. To ensure in-place of such observing system, WMO (World Meteorological Organization) developed the GCOS climate monitoring principles for establishing the climatology of traditional meteorological parameters from the ground using standard meteorological stations [
39]. Nevertheless, for global observations of Earth’s climate and of all GCOS ECVs, a multitude of observation systems is required, and both in-situ observations and remote-sensing instruments flown on airborne or satellite platforms are indispensable [
38].
The free and open access to essential climate data and information, including the fully traceable accuracy information of these ECV CDRs, as well as user feedback mechanisms, is critically important for effective climate services. It is only when the fully traceable accuracy information of ECV CDRs meet the end-user defined achievable accuracy requirements, that we can deem the climate services as useful [
26]. To provide a structured and holistic view on what CDRs are currently available/planned, and what the accuracy requirements should be to satisfy climate quality, the joint CEOS /CGMS Working Group on Climate (WGClimate) has established an ECV inventory [
40]. The ECV inventory will subsequently make up the structure of the climate monitoring architecture for space-based observations [
11,
29]. This will be realized through the gap analysis to identify shortfalls and potential improvements for both current and future CDRs. The cyclic gap analysis (see
Figure 1, “Single Product Assessment”) is a sustainable mean to update ECV CDRs to meet GCOS’ evolving observation requirements [
41,
42]. The ECV inventory is essential for realizing the high-quality, reliable and timely climate services.
Nevertheless, the ECV inventory only addresses the single-product ECVs, and is not meant to address specific applications, nor to address the multi-product ECVs and thematic products. It is notable that the ECV inventory was not designed to quantify the confidence in existing data products for specific climate-sensitive societal sectors (e.g., water and food security, water management, and health). Such usability assessment requires the integrated use of climate data and effective user-provider feedback mechanisms. When there are different versions of the same ECV available from various data providers, the situation (for evaluating usability) is more complicated. Furthermore, most ECV products are generated with independent or multiple sources of data (e.g., including in-situ, satellite and model), and use various retrieval algorithms. These data products may also adhere to different definitions and assumptions, which is not standardized among the international communities. All these call for an overarching structure for the assessment of quality and usability of ECV products, across the single-products, multi-products and thematic products. Based on current major initiatives and studies for the development of ECV inventory [
22,
23,
33,
43,
44,
45,
46,
47,
48], our paper synthesizes and proposes the overarching structure as shown in
Figure 1.
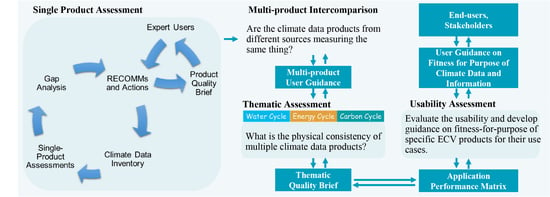
It starts from the
Single Product Assessment, which will be the foundation to recommend inclusion, conditional inclusion or exclusion of ECV products for serving decision making based on the needs of the downstream users. Furthermore, the single product assessment will implement a gap analysis to identify shortfalls and possible recommendations/action plans for improvement, and provide a quality brief for dissemination, including the user feedback mechanism (
Figure 1). It is envisaged that estimates of the single-product ECV may come from several sources, including reanalysis, satellite products, and in-situ datasets, as well as from different international agencies, institutes and research programs. The
Multi-product Inter-comparison is to investigate each source for its strengths, weaknesses, and limitations, and to answer the question: Are the ECV products from multiple sources measuring the same thing? While the original ECVs were designed mainly on the basis of individual usefulness, recent efforts have started to use the ECV CDRs to close budgets of energy, carbon and water cycles, and to study interactions between land, atmosphere, and ocean in a more integrated way [
47,
49,
50]. As such, the
Thematic Assessment is to document the physical consistency of multiple ECV products and to identify gaps in terms of closing the budget of cycles and where ECVs contribute to fundamental understanding of the natural processes.
With the foregoing assessments, the quality information of ECV products (i.e., single-, multi-, and thematic-products) will provide essential meta-information on datasets to inform potential users and enable the comparison of datasets, to evaluate the fitness-for-purpose (F4P) for the envisaged use cases. The Usability Assessment is to detail what the essential metadata is for the end-user, how the prospective end-user can benefit from the metadata, and, given these insights, provide feedbacks to climate services providers on the presentation and validation of metadata, as well as to specify links between quality features of ECV products and the resulting benefit (utility) for the users.
3. Single Product Assessment
The single-product assessments will update the CDI (Climate Data Inventory), with the best available data about the observed climate. The assessment will help the users of climate data to receive clear contextual guidance on the implications of uncertainties in that particular climate data. The single-product assessment has the following logical elements (see
Figure 1): (1) Providing descriptive metadata for the ECV products (i.e., for CDI); (2) Implementing gap analysis on the ECV products to provide recommendations on inclusion, conditional inclusion, or exclusion of the ECV products in the CDI, and proposing any actions needed to implement the recommendation for improvement; (3) Providing high-level qualitative user guidance on strengths, weaknesses, and limitations of the ECV products and providing quantitative results on product uncertainties (i.e., quality brief).
The WGClimate has defined six categories essential to understanding the circumstances under which the ECV CDR was produced, including stewardship, generation process, record characteristics, documentation, accessibility, and applications [
46]. The “record characteristics” serves to understand the specific features of data records (e.g., spatiotemporal extent and resolution, accuracy, sensors, etc.), while the “generation process” and “documentation” will provide information on how traceable the generation process is (i.e., metrological traceability), how adequate the documentation is (i.e., documentary traceability), as well as how the uncertainty is quantified (i.e., validation traceability). As such, the quality assessment in the present paper refers to the categories of “generation process” and “documentation,” while the usability assessment belongs to the categories of “application” (discussed in
Section 6).
3.1. Defining Product Traceability
Traceability in the Earth observation context can be defined as “a property of an often multi-step process whereby the result can be related to its data source(s) (and ideally to international standards) through a documented unbroken chain of operations including calibrations” [
8]. The first level of traceability corresponds to the documentary traceability, which refers to the provision of detailed provenance information or metadata concerning product development [
22]. The metrological traceability extends further to encompass a full analysis of the propagation of uncertainties from end-to-end through the algorithm and validation stages [
22].
The product traceability can be implemented with a top-down approach, which is a forward processing from a producer (or expert-user) point of view on (a) how ECVs have been produced; (b) what are the underlying assumptions; (c) where the input data is coming from. As such, one can trace back the ECV production chain and obtain provenance information of interest [
22]. There is also “backward processing” approach, which can further support and ease this top-down approach and add machine-readability to the ECV products. This “backward processing” will enable collecting agilely the provenance information from scientific reports, peer-review journals and project documentations, and trace back to the origin of the ECV CDR processing chain. This is particularly useful for a non-expert user, for example, who does not necessarily have the exact knowledge on how to do atmospheric corrections.
Figure 2 shows an example of how to collect provenance information from peer-review journal articles and distributed data sources for the global sea-level rise scenarios. From the published paper, with the GCIS (Global Change Information System) information model and corresponding ontology model [
51,
52], the climate data behind the Figure “Global sea-level rise” was traced back to the raw dataset and platforms.
Although the documentary traceability can be assessed with an information model like GCIS, it is still difficult to evaluate the metrological traceability. It is currently feasible for a limited number of space-based atmosphere ECV products to trace back uncertainty metrologically. However, such traceability is not yet feasible in other domains or for in-situ based ECVs [
22,
53,
54]. The main factors causing this difficulty (e.g., not yet applicable to trace all space-based ECV products) include difficulties associated with relating Level 1 satellite data back to SI standards and the complexity of expressing uncertainties through a generalized classification scheme. Also, the production of most of ECVs involves an array of atmospheric or surface correction codes, and there is currently no unified definition of accuracy/stability requirements [
55,
56]. Nevertheless, the gap analysis on these perspectives against the generalized Architecture for Climate Monitoring from Space (ACMS) [
29] will help to identify potential actions needed towards a generalized evaluation of metrological traceability for all space-based ECV products.
3.2. Validation Traceability Quality Indicator (ValQI)
To establish the traceability of a validation process, documenting each step of the validation process is required. According to the analysis of current validation practices in Europe for the space-based, in-situ and reanalysis products, CORE-CLIMAX identified a generic validation strategy [
54] as shown in
Figure 3a. Starting from documenting how the reference dataset is generated, the generic process requires the assessment of the independence level of the reference dataset. With the quality-controlled reference data, the data producer shall implement the self-assessment. For a complete validation process, it is a requirement to check the consistency of the validated CDRs.
Furthermore, it is recommended to apply the independent assessment of the CDR products, as well as the external review of the validation process, to assure the understanding of data quality. It is further required to evaluate the independence level of the independent assessment and the external review (see
Figure 3a). The last step is to sustain the established validation facilities and procedures. This final step means achieving an operational validation level, at which validation activities and data release are regularly/routinely implemented.
The generic validation strategy presented above can be mapped to the CORE-CLIMAX system maturity matrix (SMM) [
11,
57], under the “Formal Validation Report” and “Validation” in the subthemes of “User documentation” and “Uncertainty characterization,” respectively. This mapping indicates the applicability of using the corresponding validation-relevant subthemes of SMM as the quality indicator for validation traceability (i.e., ValQI) for assessing how far the validation process is approaching the “best practice” (
Figure 3b) [
54]. The ValQI can evaluate the maturity of existing validation processes of ECV products, in a way to identify the potentially needed and targeted studies to improve the quality of ECV products.
Figure 3c shows an example of how the ValQI is used to evaluate the validation process of ESA-CCI soil moisture (Phase I). It helps to identify the potential actions needed to further improve the climate quality of the soil moisture products.
5. Thematic Assessments
The advent of climate services will bring greater demands on the breadth and depth of product inter-comparison activities. While the original ECVs were designed mainly on the basis of individual usefulness, recent efforts have started to use the CDR of ECVs to close budgets of energy, carbon and water cycles, and to study interactions between land, atmosphere, and ocean in a more integrated way [
49,
50]. In particular, GCOS IP 2016 sets out the quantitative targets on closing the budgets of these climate cycles [
38]. The examination of the budgets of these cycles will allow us to identify scientific gaps in the fundamental understanding of the natural processes. As such, this understanding will subsequently support improved forecasts of the impacts of climate change. The thematic assessment is to document the physical consistency of multiple ECV products, and thus to evaluate the budgets of the climate cycles.
The specific aim(s) of thematic assessment can involve, and is not limited to, the overarching questions such as: What are the relevant natural processes represented by the ECV products for the thematic assessment? Are the ECV products consistent with each other to enable the natural process representation? What are the limitations of the ECV products for representing the natural process? Are the ECV products consistent with model data so that modeled and observation data can be used directly for model validation and data assimilation?
Before the implementation of thematic assessment, the overview of “ECV product characteristics” (i.e., from multi-product inventory) and “ValQI (Scientific Integrity)” will provide a descriptive comparison of the ECV products for the assessment (see
Table 3 for an example). The characteristic description will provide the first level of information to understand, for example: “Are the ECV products using the common source of background data or not? Are they consistent when spatiotemporally averaged to the same scales? Are they meeting the GCOS requirements?” Furthermore, the ValQI will enable readiness for the scientific integrity of ECV products. Such basic information will facilitate the meaningful interpretation of the assessment results, and will inevitably help users to understand better the thematic assessment results.
6. Usability Assessment
The usability assessment is to evaluate the usability and to develop guidance on fitness-for-purpose of specific ECV products for their use cases. With the preceding assessments, information is produced regarding the quality of delivered ECV products, including information on the observation basis of the original products and its post-processing steps. Together, these should provide essential meta-information on datasets to inform potential users and enable the comparison of datasets, to evaluate the fitness for purpose (F4P) for the envisaged use cases.
Output oriented quality assessment can only be operationalized in a meaningful way if there are links between quality features of the output and the resulting benefit (utility) for the user(s) of the climate services. As such, the contribution of usability assessment is also to detail what the essential metadata is for the end-user, and to understand how the prospective end-user can benefit from the metadata. Furthermore, given these insights, the end-user will provide feedbacks to climate service providers on the presentation and validation of metadata. The use case can describe the value chain from ECVs, through tailored information in local workflows to sector decision-making process (see
Figure 5), which is a “drilling-down” (i.e., more details) of
Figure 4 from midstream to downstream.
Details of the use case include specifying the sector, end user and problem that the user is trying to solve. To detail how uncertainty affects a decision, one will need to simulate how uncertainty properties of delivered series (e.g., climate impact indicators) affect sector decision making, according to the resulting benefits. Based on the quantitative uncertainty of the ECV products, the simulation can be made for a specific sector decision making process and receiver of sector information. Where possible, the results of the simulation need to be discussed with the end-user, and feedback collected to be incorporated into follow-up use cases and overall evaluation of usage information. In the following sub-sections, a reinsurance case study on extreme El Niño events was used to demonstrate the usability assessment.
6.1. Detail Use Case and User Requirements
The first step is to detail the use case, specifying the sector, end-user and the problem that the user is trying to solve. The user requirement details can be pre-collected from existing consolidated requirements on the quality information for the specific sector, and then further updated with the end-user interview.
Table 4 provides the details of the use case for an insurance company in Peru, who requested to quote on a suggested insurance product that would protect them from extreme El Niño events [
64].
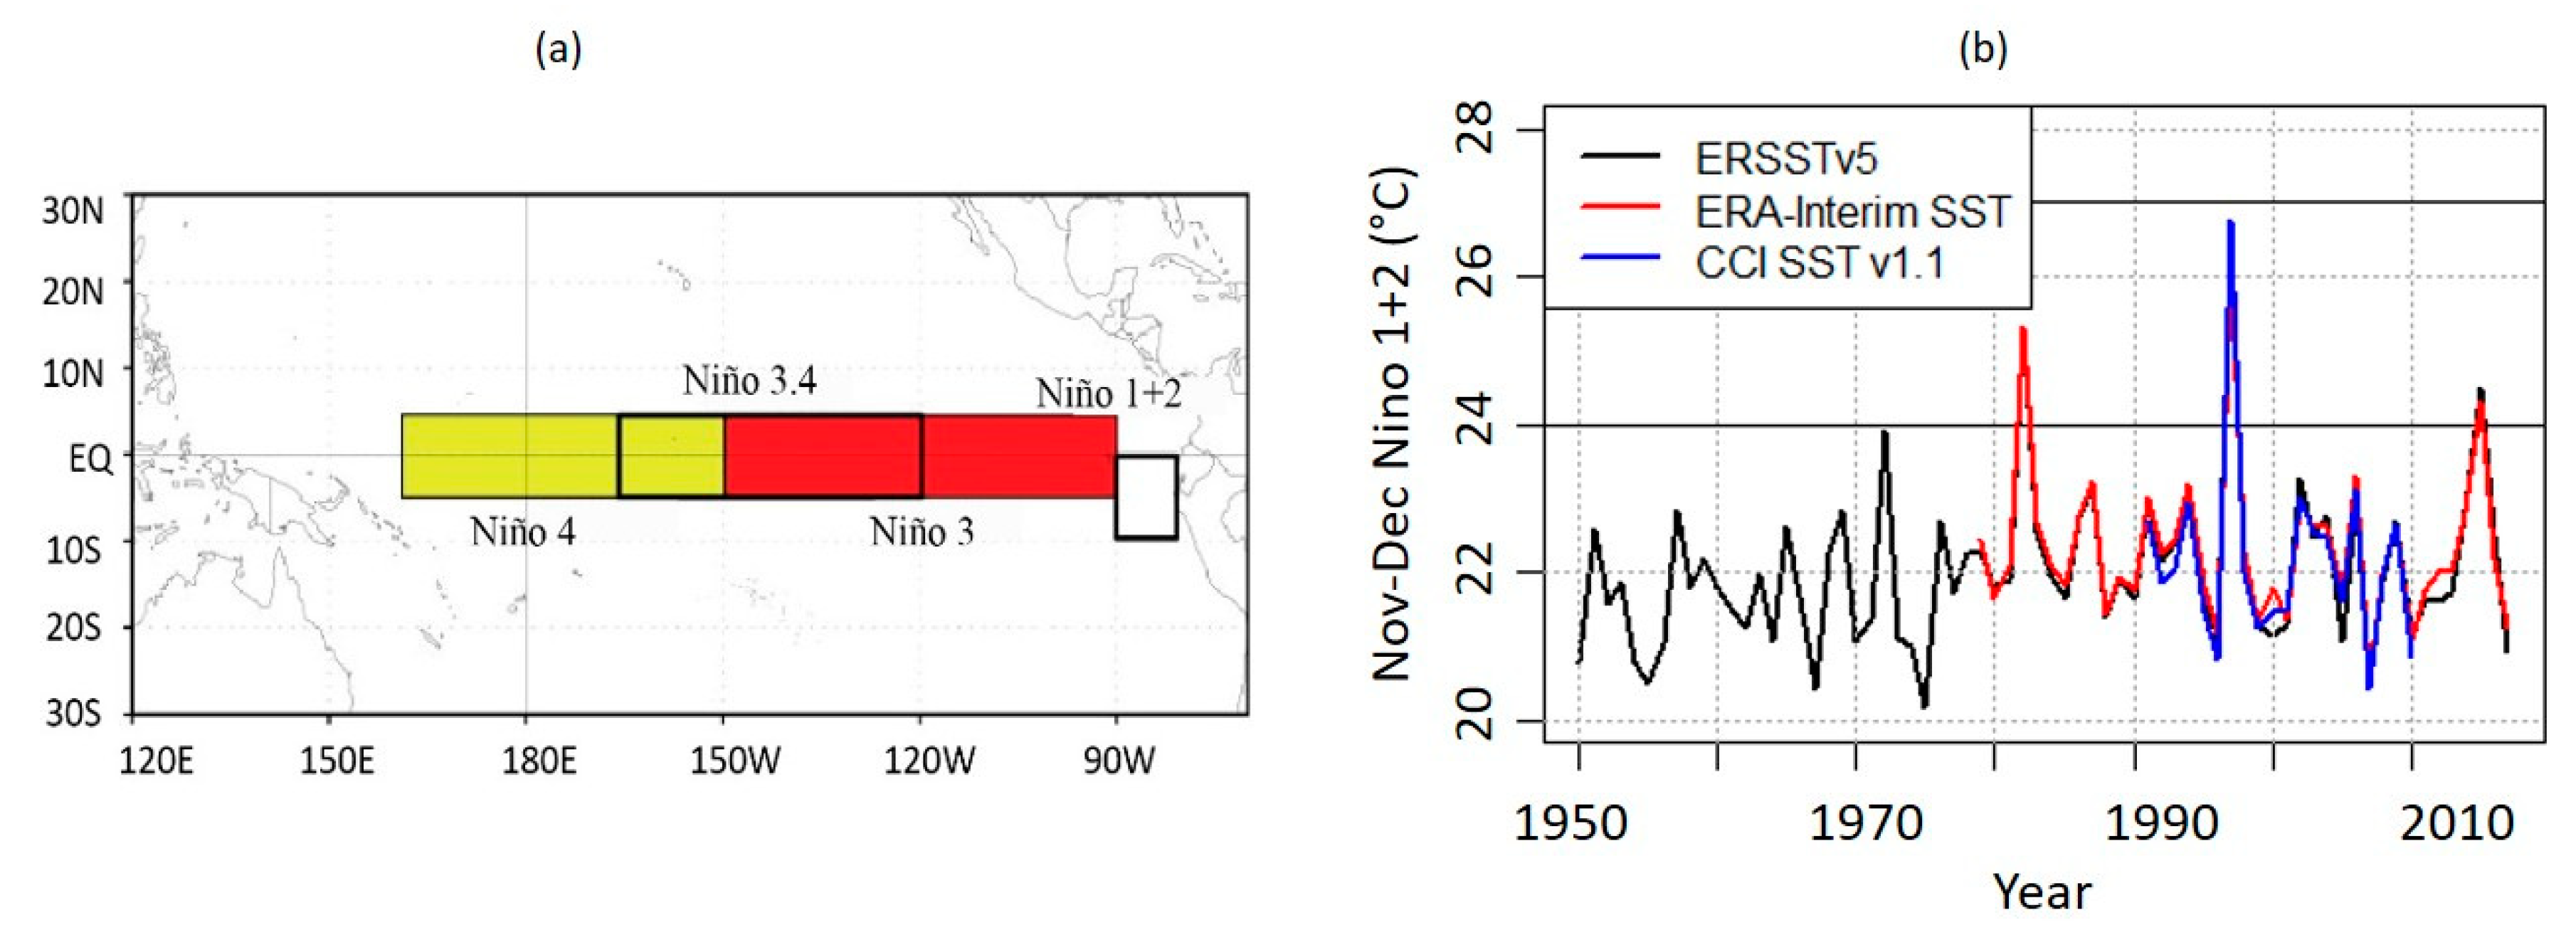
To quantify the severity of EI Niño events, the Niño 1+2 index was chosen, due to its geographical proximity to Peru, this index has a more direct impact on Peru compared to other El Niño indices (see
Figure 6a). The Niño 1+2 values refer to the November-December average of sea surface temperatures in (90–80° W, 0°–10° S). The idea of this insurance product is that when Niño 1+2 exceeds a certain threshold (i.e., entry point), the client receives some payout till reaching a maximum at a higher Niño 1+2 value (i.e., exit point). Payout begins at zero for the entry point Niño 1+2 of 24 °C and increases linearly to the maximum payout (let us assume 50 M USD) for the exit point Niño 1+2 of 27 °C.
6.2. Detail How Uncertainty Affects Decisions
6.2.1. Extreme EI Niño Event: What Is the Price?
Most El Niño-related disruptions in Peru start around January, but the associated elevated sea surface temperatures in the Pacific are already occurring in November–December. The November–December Niño 1+2 value is known the beginning of January each year. This allows the client to receive payout in January when losses start occurring [
65].
The aim of the following exercise is to choose appropriate historical values of the Niño 1+2 index and use them to estimate an annual average payout. Three alternative sources of gridded data were used for the required Niño 1+2 values. These are the Extended Reconstructed Sea Surface Temperature Version 5 [
67], the ERA-Interim reanalysis [
68] and the ESA Sea Surface Temperature Climate Change Initiative (ESA SST CCI) Analysis long term product version 1.1 [
69].
Figure 6b and
Table 5 provides an overview of the three datasets.
For the pricing of the insurance product, the frequency and severity of potential payouts must be calculated. One way to do this is to calculate the losses for the historical events, where Niño 1+2 exceeded the 24 °C threshold. Based on the ERSSTv5 data, there are three such events in 1982, in 1997 and 2015 (
Figure 6b). The 1997 and 2015 events also appear in the other two datasets. The average annual loss calculated from the historical ERSSTv5 data is 1.1 million USD. Using the full length of the ERSSTv5 time series for the calculation of historical losses makes the comparison with CCI SST time series difficult because CCI SST covers a shorter time (1991–2010). Therefore, for ERSSTv5 and ERA-Interim data the average annual loss calculations were carried out for the full available period and the period 1991–2010 (
Table 6).
As an alternative approach to calculating average annual losses, a probability distribution function (namely the Generalized Extreme Value, GEV family of distributions) is fitted to all three datasets using maximum likelihood [
70]. The GEV distribution is the limit distribution of normalized maxima of a sequence of independent and identically distributed random variables. The GEV distribution tends to have large probability density for extreme values. This means that under a GEV assumption, extreme losses are relatively frequent, when compared to a normal distribution. The GEV distribution is a suitable (although not unique) choice for this example, because it is important not to underestimate the frequency and severity of extreme events. The same distribution has been fitted to all data using the same statistical software [
71,
72] to ensure consistency.
To facilitate comparison among the three datasets, the GEV has been fitted to the full ERSSTv5 and ERA-Interim data as well as to the subsets covering the period 1991–2010 only.
Figure 7d shows the exceedance probability function of the GEV distribution fitted to the full ERSSTv5 dataset.
Table 6 shows the annual average loss using the GEV distribution fitted to the full datasets and the data corresponding to the period 1991–2010. Plots a, b, and c of
Figure 7 compare observed and modeled temperatures for the same quantiles. For temperatures up to approximately 23 °C, there is a good match. For temperatures in the range 23 °C–24 °C, modelled temperatures tend to be higher. While for temperatures above 24 °C, modelled temperatures tend to be lower. The comparison between observed and modeled temperatures is particularly difficult for very high temperatures, because sample quantiles of extreme values tend to have large biases [
73].
The historical annual average loss tends to decrease for more extended datasets (
Table 6). The ERSSTv5 has the lowest annual average loss, which is attributed to the long averaging period of 68 years. If we take the period 1991–2010, the differences between the three datasets are smaller but still considerable. The annual average loss based on the GEV model also tends to decrease with increasing averaging period, and it is smaller than the losses calculated from the historical data. An interpretation of the results of the GEV model is that in the long run, less severe El Niño events are expected compared to the El Niño events observed in the recent observation records. It is notable that the GEV model choice is not unique, and it may be possible to fit another distribution function, which would give results closer to the observations.
6.2.2. What Causes the Difference? Which Is the Most Suitable Dataset?
The fact that we get different results using different datasets begs the question: Why are there differences and which dataset is the most suitable? Differences between datasets could be attributed to data uncertainty, or there could be known biases. Both these aspects should be communicated to the end user to help choose a dataset. In this particular application, we are mostly concerned with uncertainty and biases for extreme events.
A further important criterion for the selection of data in addition to accuracy is the length of the available data records. This is because extreme events are rare by definition and therefore a sufficiently long record is required to estimate statistics such as the expected payout frequency and the annual average payout. In other words, a somewhat less accurate but very long dataset may be preferred over a shorter and more accurate one. Details on the uncertainty of the candidate datasets can help reach a decision here as well.
An aspect to consider, especially when it comes to longer data records, is data homogeneity. In the curve fitting process presented above it has been assumed that the statistical properties of all three time series do not change with time. In the time series shown in
Figure 6b all three payouts occur after 1980. This could happen because of chance, it could represent climate change affecting the frequency and severity of El Niño events, or it could represent a data homogeneity issue. Examples of data inhomogeneity include changes in instrumentation or changes in the quality and amount of observations included in data assimilation of reanalysis products [
74]. The data provider can help the data user by providing details on possible data inhomogeneity problems, steps that were taken to resolve them and possible remaining issues. As such, the difference in the average annual loss can be traced back to these different steps used for harmonizing data, which can be further attributed to the uncertainty of data in the upstream of climate services.

 ,
, 


 .
.