Article

Evaluation of Six Satellite-Based Precipitation Products and Their Ability for Capturing Characteristics of Extreme Precipitation Events over a Climate Transition Area in China

1
State Key Laboratory of Water Resources and Hydropower Engineering Science, Wuhan University, Wuhan 430072, China
2
Hubei Provincial Key Laboratory of Water System Science for Sponge City Construction, Wuhan University, Wuhan 430072, China
3
Key Laboratory of Water Cycle and Related Land Surface Processes, Institute of Geographic Sciences and Natural Resources Research, Chinese Academy of Sciences, Beijing 100101, China
4
Jackson School of Geosciences, The University of Texas at Austin, Austin, TX 78713, USA
*
Author to whom correspondence should be addressed.
Remote Sens. 2019, 11(12), 1477; https://doi.org/10.3390/rs11121477
Submission received: 13 March 2019 / Revised: 13 June 2019 / Accepted: 18 June 2019 / Published: 21 June 2019
(This article belongs to the Special Issue Remote Sensing of Hydrological Extremes)

Abstract

:
Extreme precipitation has received much attention because of its implications for hazard assessment and risk management. However, accurate precipitation information for extreme precipitation research from dense rain gauges is still difficult to obtain in developing countries or mountainous regions. Satellite-based precipitation products (SPPs) with high spatial and temporal resolution offer a new way of supplementing data from gauge-based observations. This study aims to evaluate the precision of six SPPs in detail at multiple temporal and spatial scales and explore their ability to capture the characteristics of extreme precipitation from 2009 to 2014 over a semi-arid to semi-humid climate transition area (Wei River basin) in China. The six products are TRMM 3B42RT, TRMM 3B42V7, PERSIANN, PERSIANN CDR, CMORPH RAW, and CRORPH CRT. China gauge-based daily precipitation analysis (CGDPA) provided by the China Meteorological Administration is used as the benchmark reference data. Various statistical evaluation techniques and extreme precipitation indices are used to evaluate and compare the performance of the selected products. The results show that the post real-time products (TRMM 3B42V7, PERSIANN CDR, and CMORPH CRT) agreed better with the reference data than PERSIANN and CMORPH RAW. On a daily scale, TRMM 3B42V7, PERSIANN CDR, and CMORPH CRT displayed similarly good performance. However, at the monthly or annual scale, TRMM 3B42V7 was superior to the other products. With regard to the spatial distribution of precipitation, the datasets performed better over plains and were disappointing over mountainous areas. Additionally, TRMM 3B42V7 provided higher precision and less spatial uncertainty when monitoring extreme precipitation. This study provides a basis for selecting alternative precipitation data for climate transition basins.

Graphical Abstract

1. Introduction

Extreme precipitation refers to when the amount of a precipitation event exceeds a certain threshold [1], resulting in a series of social, environmental, and ecological problems [2,3]. Amplified by the observed climate change, many studies have shown that extreme precipitation events have become more intensive than they were in the past and are likely to further intensify in the future [4,5,6]. This makes improving our understanding of extreme precipitation imperative.
Accurate precipitation products with high spatial and temporal resolution are a prerequisite for extreme precipitation analysis. Precipitation observations usually come from rain gauge stations, weather radar and satellite-based sensors [7]. Gauge stations offer the most direct and accurate point-scale measurements of precipitation [8]. However, point estimates of precipitation are relatively sparse and their coverage is too uneven to obtain accurate spatial and temporal precipitation representations in developing countries or mountainous regions [9,10]. Weather radar offers an alternative method for capturing rainfall data and can overcome the sparsity of the rain gauge network [11]. Unfortunately, the reliability of radar precipitation products is questionable and they suffer from a variety of errors including systematic mean-field and range-dependent errors as well as random errors [12]. Of recent times, a large number of satellite-based precipitation products (SPPs) offering various spatial and temporal resolutions have been developed, providing a new way to detect the distribution of precipitation [13]. SPPs are mainly based on passive microwave (PMW), calibrated infrared (IR), and PMW plus IR observations. IR and PMW sensors are on geostationary Earth orbit satellites and onboard low Earth orbiting satellites, respectively. The accuracy of high temporal resolution precipitation estimates based on IR is generally not good as the link between IR signals and precipitation is indirect; while PMW sensors can provide precipitation estimation with a more direct link to rain and ice particles [14]. The most popular SPPs include the tropical rainfall measuring mission (TRMM) [15], climate prediction center (CPC) morphing technique (CMORPH) [16], precipitation estimation from remotely sensed information using artificial neural networks (PERSIANN) [17], global satellite mapping of precipitation (GSMaP) [18], global precipitation measurement (GPM) [19], naval research laboratory blended satellite (NRL-Blend) high-resolution precipitation product (HRPP) [20], and climate hazards group infrared precipitation with station data (CHIRPS) [21].
TRMM was the first meteorological satellite to focus on the observation of large-scale precipitation in tropical and subtropical regions based on PMW plus IR [15]. Frequently used TRMM data include the near real-time product TRMM 3B42RT and the bias-corrected product TRMM 3B42V7. These data have been used in numerous previous studies, including accuracy evaluation, to drive hydrological models, to support reservoir operations, for water resource management, and so on [8,22,23,24]. Many studies found TRMM suitable for use at a large temporal and spatially regional scale [7,25,26]. Some studies also indicated that TRMM might serve as a good tool for the detection of extreme precipitation [27]. CMORPH uses a flexible method to combine existing PMW-based precipitation estimates and IR data. There are three different CMORPH products: The raw satellite-only precipitation product (CMORPH RAW); the bias-corrected product (CMORPH CRT); and the satellite-gauge blended product (CMORPH BLD) [8]. CMORPH has been used by a number of researchers and the corresponding results suggest that it performs well when depicting spatial precipitation patterns and their temporal variation [8,28]. It has proved especially effective for basin-wide large-scale flood prediction [7]. The PERSIANN products use an artificial neural network (ANN) technique to estimate precipitation. The ANN model is trained using concurrent IR-based precipitation estimates from multiple satellites [17]. Commonly used PERSIANN products include PERSIANN, precipitation estimation from remotely sensed information using artificial neural networks-cloud classification system (PERSIANN CCS) and precipitation estimation from remotely sensed information using artificial neural networks-climate data record (PERSIANN CDR). Some studies have suggested that PERSIANN near real-time products lack accuracy for China [7] and for high-elevation areas [29]. However, one other study found that PERSIANN performed better for Iran than other near-real time datasets [30]. PERSIANN CDR, adjusted through a bias removal procedure using GPCP, is considered to offer high accuracy and it provides a long historical time series [8]. It has been variously used to study historical extreme precipitation [31,32], rainfall frequency analysis [33], hydrological changes [34], and drought [35]. GPM is the satellite precipitation product that followed on from TRMM, extending the range of coverage to the south of the Arctic Circle. GPM is built on previous algorithms from PERSIANN CCS, TMPA, and CMORPH [14]. The most notable feature of GPM is that it is able to detect both light (<0.5 mm·h−1) and solid precipitation, which are important features of the annual precipitation in high latitudes. GPM can be considered a better dataset than TRMM, especially for the mid and higher latitudes and dry climatic regions [26,36]. GSMaP refers to the global satellite mapping of precipitation project that used PMW plus IR [18]. GSMaP focused on capturing the spatial patterns of precipitation, especially in wet periods [37]. The CHIRPS dataset refers to the climate hazards group infra-red precipitation with station data using three types of information: Global climatologies, satellite estimates, and in situ observations [21]. Some studies have suggested that CHIRPS detected changes in extreme precipitation more effectively than TRMM [38]. As a result of the range of SPPs sources and different precipitation retrieval algorithms used, the accuracy of these products has high uncertainty, particularly with regard to spatial and temporal scales and the regions covered. This makes evaluation of SPPs and their ability to capture extreme precipitation a prerequisite before they can be applied to studies of extreme precipitation for specific regions.
Most of the previous studies with SPPs focused on the evaluation of satellite data accuracy and their application. However, relatively few studies have focused on the ability of SPPs to detect extreme precipitation. Previous studies regarding extreme precipitation have mainly focused on using TRMM [27,39,40] and PERSIANN CDR [31,39,41] data and have primarily concentrated on heavy precipitation [39,40]. However, the ability of other precipitation products to detect extreme precipitation (including heavy precipitation that may cause floods and light precipitation that may cause droughts) is not clear, especially in China. The Wei River basin is located in a fragile eco-environment area in northwestern China with broken terrain and low vegetation cover. Inhomogeneous precipitation in this region can easily result in either major droughts or disastrous flooding. Extreme precipitation can also induce soil erosion, debris flow, and landslides [37]. Therefore, there is a pressing need to study the capacity of various SPPs to detect extreme precipitation (including heavy and light precipitation) over the Wei River basin. In this study, we have undertaken a comprehensive evaluation of six SPPs to assess their accuracy at different spatiotemporal scales and their ability to capture the characteristics of extreme precipitation. This study provides a useful guide to the potential use of SPPs for future hazard assessment and risk management in areas undergoing climate transition.
The structure of the paper is as follows: Section 2 introduces the study area, the seven different precipitation datasets, and the methodology we adopted. Section 3 and Section 4 present the evaluation results and discuss their implications, respectively. Our overall conclusions can be found in Section 5.

2. Materials and Methods
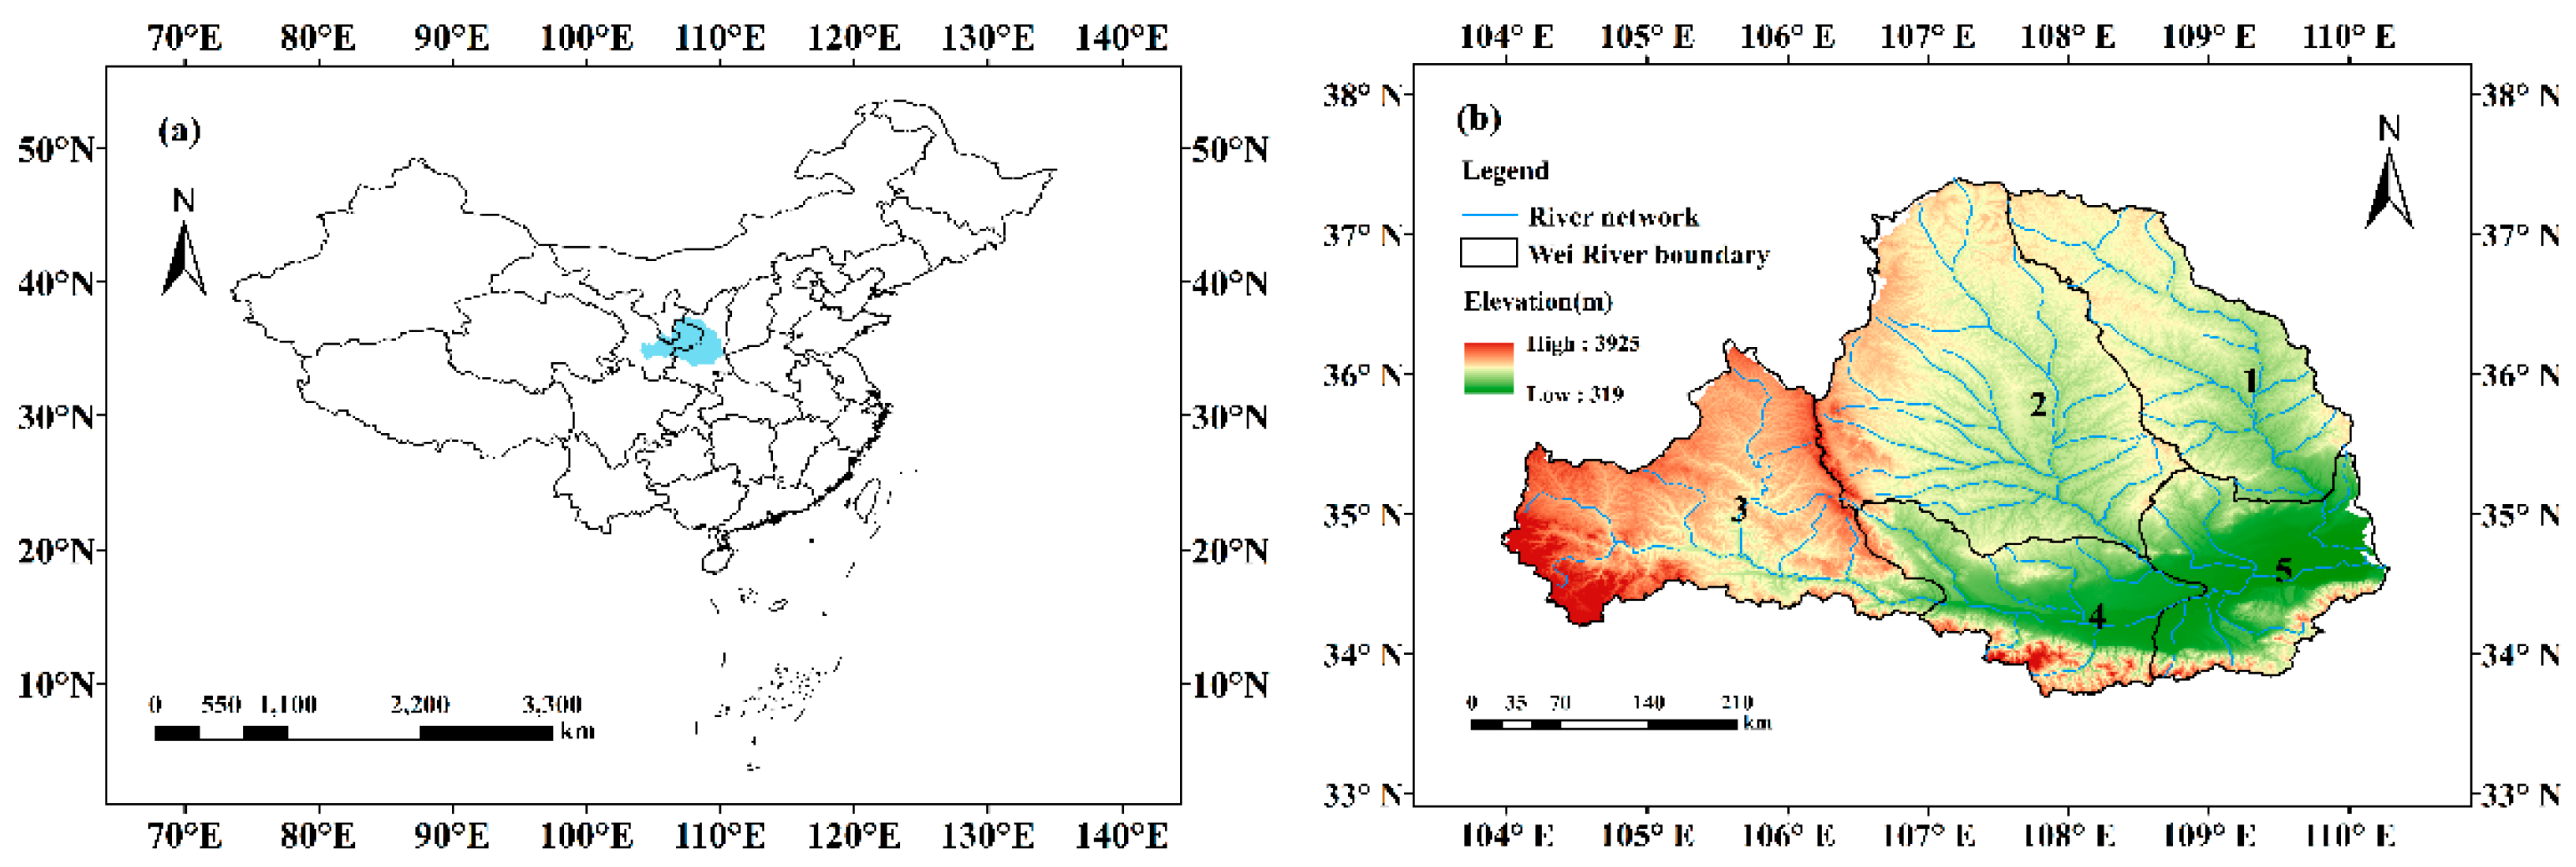
2.1. Study Area

The Wei River (33.40°–37.26°N, 103.57°–110.27°E) is located in the northwest of China, which belongs to a typical semi-arid and semi-humid climate. It rises from Niaoshu Mountain in the Weiyuan country and runs into the Yellow River at Tongguan. There are two large tributaries in the Wei River basin, the Jing River and the Beiluo River. The Wei River basin can be divided into five sub-basins, including the upper, middle, and lower reaches of the main stream of the Wei River and the two tributaries (Figure 1b). The Wei River basin is the largest tributary of the Yellow River, covering a drainage area of about 134,800 km2. The elevation within the Wei River basin ranges from 319 m to 3925 m. It is cold and dry in the winter, when it is influenced by the Mongolia high-pressure system, but hot and rainy in the summer, when it is affected by the West Pacific subtropical high-pressure system [42]. The long-term average annual precipitation is about 545 mm and the mean annual temperature is between 7.8 and 13.5 ℃ [42]. The annual land pan evaporation is approximately 500 mm and the annual potential evapotranspiration ranges from 660 to 1600 mm [43].

2.2. Data

2.2.1. Reference Data

Although gauge stations are sparse in some areas, they are still the most direct way of obtaining accurate measurements at present [8]. We therefore employed the China gauge-based daily precipitation analysis (CGDPA) provided by the China Meteorological Administration as a reference dataset for this study. This dataset interprets information from about 2400 gauge stations across mainland China, using an optimal interpolation method [44]. Research has verified the accuracy of CGDPA products. The study shows that the CGDPA has a smaller bias and root mean square error, and a higher spatial correlation than climate prediction center unified gauge dataset (CPC_UNI). The CGDPA also captures more strong rainfall events while the CPC_UNI and the East Asia gauge analysis (EA_Gauge) tends to smooth the precipitation structure and miss more local strong rainfall events [44]. The high accuracy of the CGDPA can mainly be attributed to the large number of gauges used for interpolation [44]. These data have been widely used as benchmark data [45,46] and as input for hydrological models [47]. This study used the CGDPA data from 2009 to 2014, with a spatial resolution of 0.25° × 0.25° and a daily temporal resolution. The dataset is available from http://data.cma.cn.

2.2.2. SPPs

In this study, six SPPs including TRMM 3B42RT, TRMM 3B42V7, PERSIANN, PERSIANN CDR, CMORPH RAW, and CMORPH CRT were used and compared to the reference dataset. Simple descriptions of these datasets are given below. Further detail can be obtained from the corresponding references. Table 1 summarizes the available periods, spatial and temporal resolution, coverage, category information, and latency for the six datasets.
The TRMM 3B42 product is one of the TRMM datasets that applies the TRMM multi-satellite precipitation analysis (TMPA) algorithm [15]. The TMPA estimates are produced in four stages: (1) The PMW precipitation estimates are calibrated and combined; (2) the IR precipitation estimates are created using the calibrated PMW precipitation; (3) the PMW and IR estimates are combined; and (4) the rain gauge data is incorporated [15]. TRMM 3B42RT is a near real-time product. The latest product version, TRMM 3B42V7, is a post real-time product that combines precipitation estimates from PMW and IR satellites, together with the GPCC monthly gauge analysis. All of the TRMM 3B42 datasets are available from Goddard Earth Sciences Data and Information Services Center (http://mirador.gsfc.nasa.gov). The daily accumulated TRMM 3B42RT product and the TRMM 3B42V7 product with a 0.25° × 0.25° spatial scale are used in this study.
The PERSIANN system uses an ANN method to convert IR information into rain rates [17]. The inputs of ANN model are the gridded satellite IR data, and the model parameters are regularly updated using rainfall estimates from low-orbital satellites. The estimated PERSIANN are further adjusted through a bias removal procedure using the GPCP 2.5° monthly precipitation data to generate PERSIANN CDR. In this study, the daily and 0.25° × 0.25° spatiotemporal scales of the PERSIANN and PERSIANN CDR data were employed (see ftp://persiann.eng.uci.edu/CHRSdata/PERSIANN/daily/).
CMORPH, which stands for the NOAA Climate Prediction Center morphing technique [16], are precipitation estimation products. A flexible method is used to combine existing PMW-based precipitation estimates from multiple low-orbit satellites with IR data from multiple geostationary satellites [16]. The CMORPH CRT product is generated by adjusting the CMORPH RAW product against the CPC unified daily gauge analysis over land and against the pentad GPCP over the sea by drawing upon a probability density function matching bias correction method. The CMORPH datasets are available at ftp://ftp.cpc.ncep.noaa.gov/precip/CMORPH V1.0/. In this study, both the CMORPH RAW and CMORPH CRT datasets were used at a 0.25° daily spatiotemporal resolution.

2.3. Methodology

2.3.1. Statistical Analysis

In this study, seven commonly used statistical metrics were applied to evaluate the accuracy of the six products at different temporal scales (daily, monthly, and annual) and different spatial scales (0.25° × 0.25° grid, sub-basin, and whole basin) in comparison to the reference dataset. The relevant metrics are the correlation coefficient (R); the mean absolute error (MAE); the root mean squared error (RMSE); the relative bias (BIAS); the probability of detection (POD); the false alarm ratio (FAR); and the critical success index (CSI). These metrics were calculated as follows:
R = i = 1 n ( G i G ¯ ) ( P i P ¯ ) i = 1 n ( G i G ¯ ) 2 i = 1 n ( P i P ) 2
M A E = i = 1 n | ( P i G i ) | n
R M S E = i = 1 n ( P i G i ) 2 n
B I A S = i = 1 n P i i = 1 n G i 1
P O D = H H + M
F A R = F H + F
C S I = H H + M + F
where n refers to the number of samples; Gi represents the reference precipitation data; and Pi stands for the precipitation estimates from the evaluated datasets. The threshold for judging whether a precipitation event had occurred was 0.1 mm/day because the minimum precipitation that can be measured in a precipitation gauge station is 0.1 mm [48,49]. H refers to the number of precipitation events detected within both the reference precipitation dataset and the SPPs synchronously; M stands for the number of precipitation events observed within the reference dataset but not detected by the SPPs; and F refers to the number of precipitation events detected by the SPPs that were not observed in the reference dataset.
R describes the degree of correlation between the reference data and the SPPs. The larger R value indicates the larger agreement between the SPPs and the reference data. The MAE and RMSE reflect the average error between the SPP and the reference dataset. The smaller the RMSE and MAE, the smaller the error between the SPPs and the reference data. The BIAS represents the systematic error of the SPPs and its relative degree. A negative (or positive) value means the datasets underestimate (or overestimate) in relation to the reference data. A smaller absolute BIAS value indicates a smaller deviation. The POD describes the proportion of reference precipitation events detected correctly by the evaluated product. The FAR describes the proportion of precipitation events detected by the SPPs that were not observed in the reference precipitation data. The CSI is an index of the overall capacity of the SPPs to correctly capture precipitation events in relation to the reference precipitation data. A high POD and CSI value and a low FAR value are indicative of good SPP performance.

2.3.2. Extreme Precipitation Analysis

In this study, 12 types of extreme precipitation indices, as defined by the expert team on climate change detection and indices, were used to describe the extreme precipitation characteristics in the study area. These indices are widely used around the world [2,50,51]. Their details are provided in Table 2.

3. Results

3.1. Evaluation of the SPPs at Different Temporal Scales

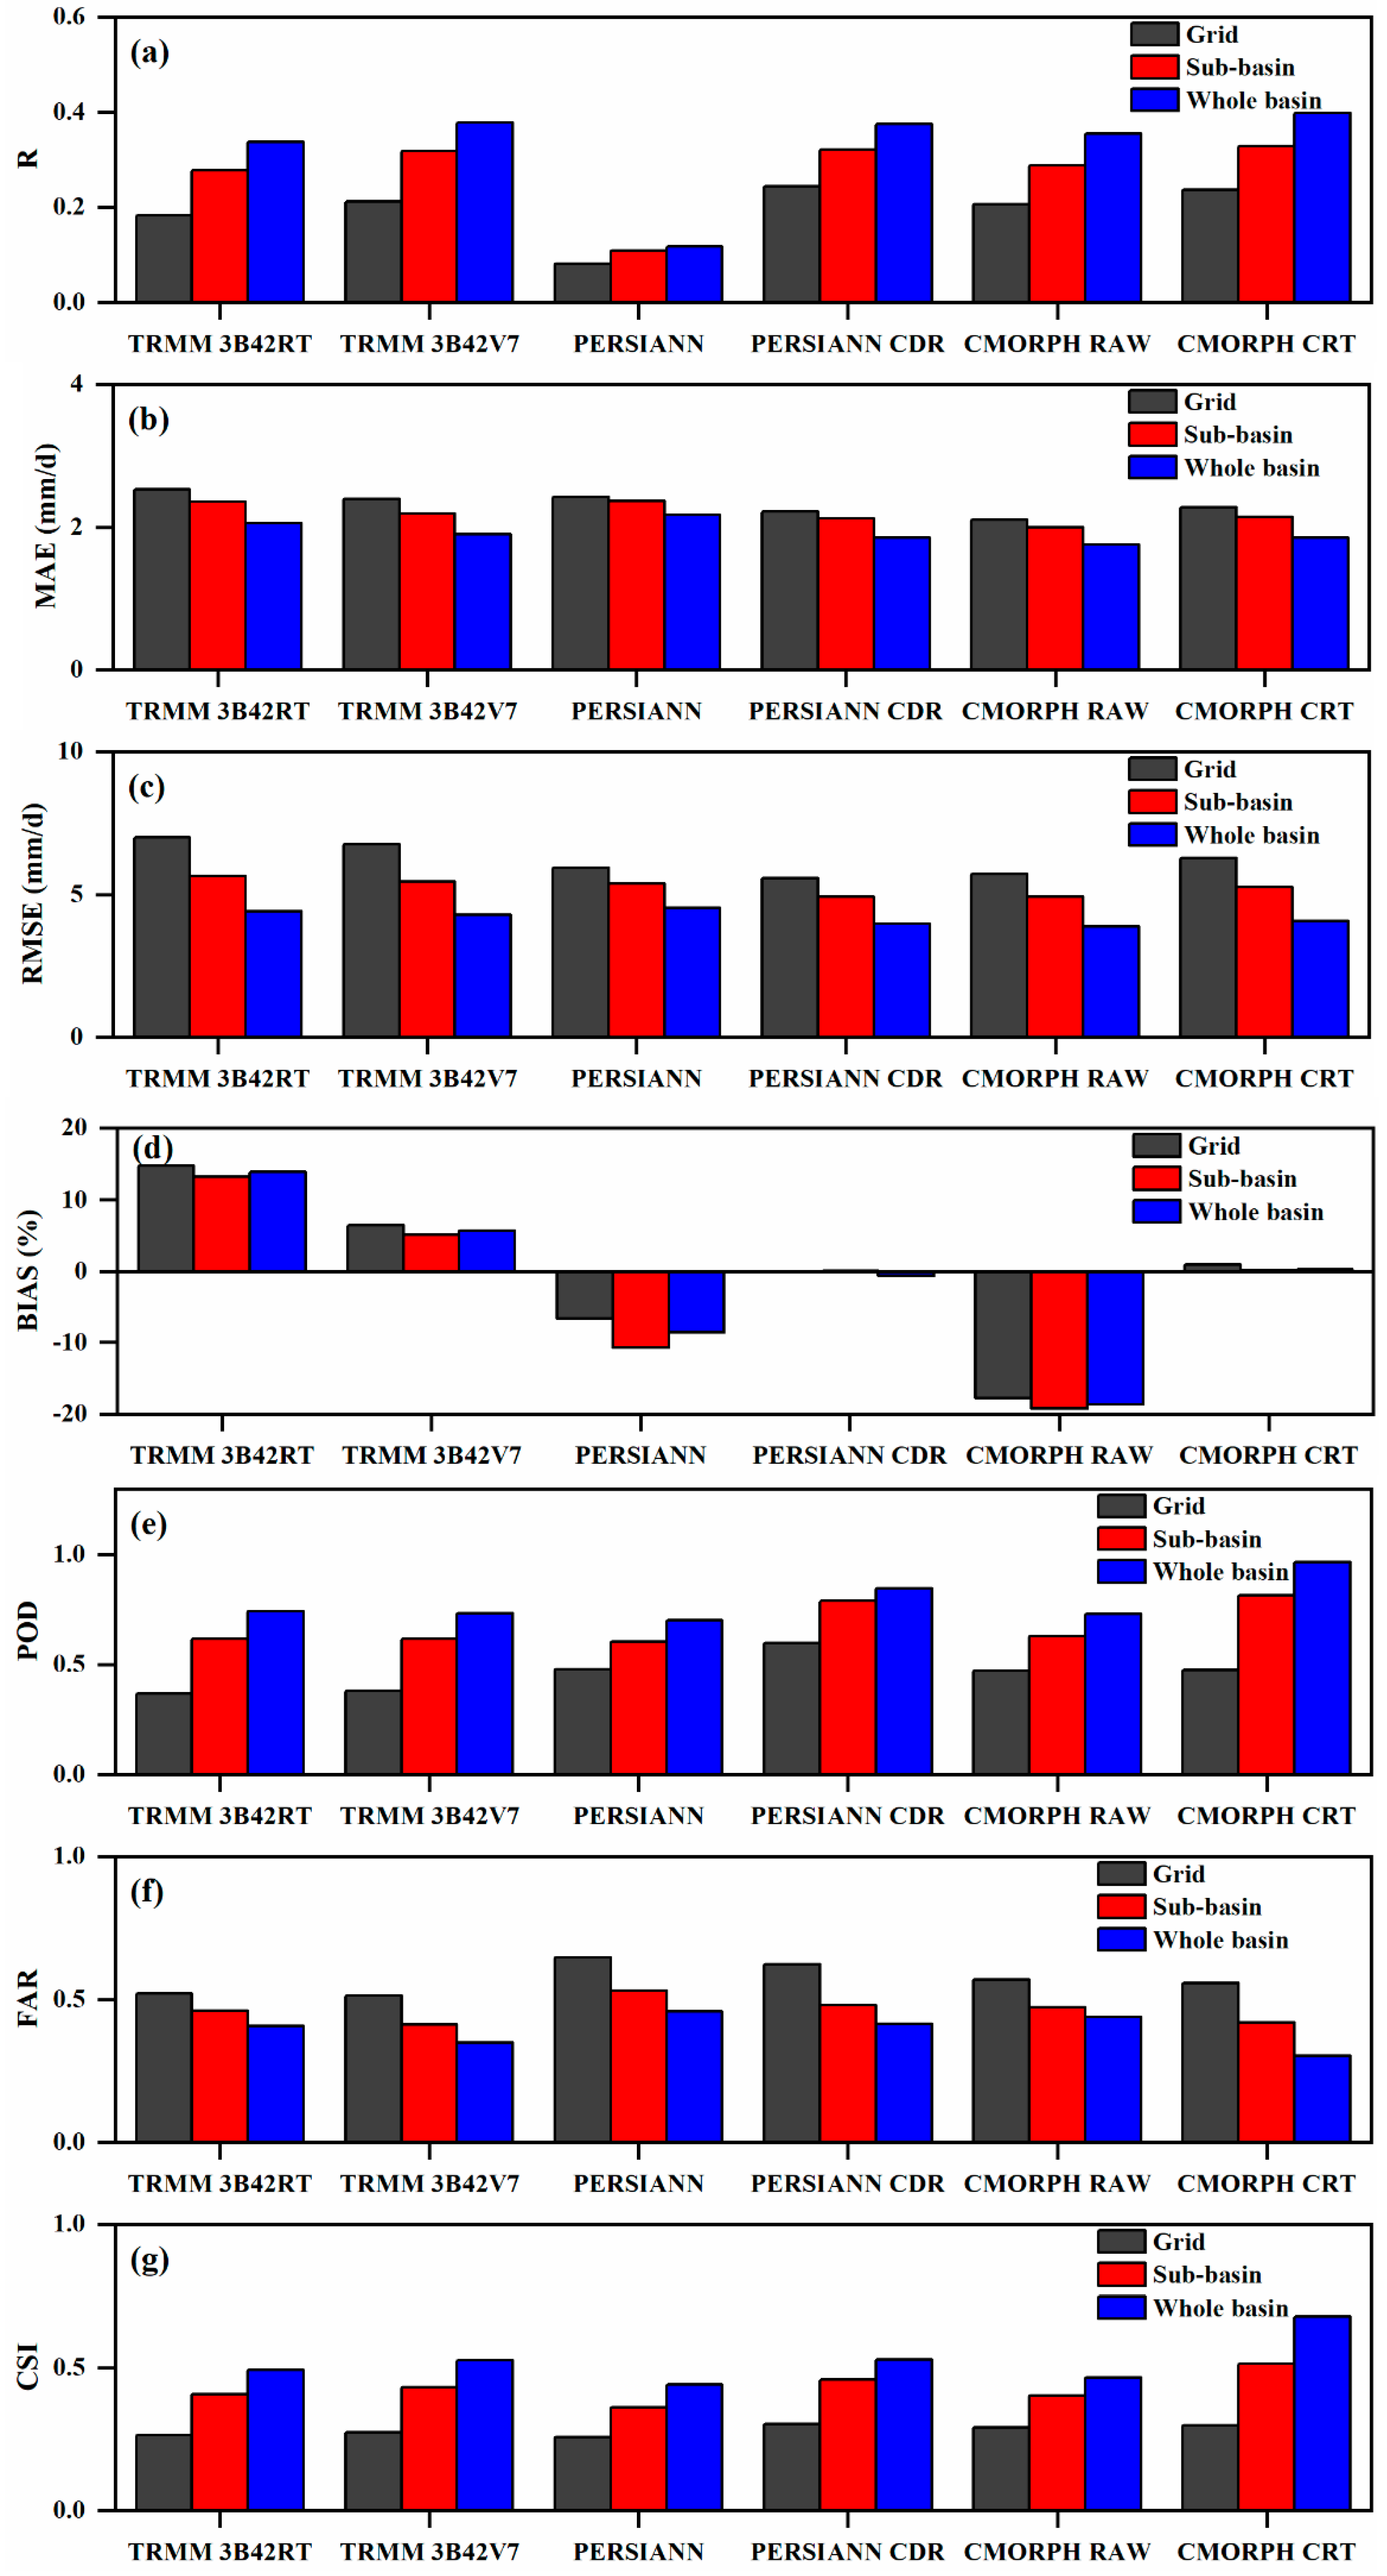
3.1.1. Daily Temporal Scale

Figure 2 shows the statistical results of the six SPPs for daily precipitation at different spatial scales. The post real-time products (TRMM 3B42V7, PERSIANN CDR, and CMORPH CRT) had higher R values than the real-time products, indicating better consistency with reference data. The performance of the different products is similar for the MAE and RMSE results. Two products (TRMM 3B42RT, TRMM 3B42V7) overestimated the precipitation, with a positive BIAS value, while PERSIANN and CMORPH RAW underestimated the precipitation and had a negative BIAS value. It is worth mentioning that CMORPH CRT and PERSIANN CDR had a fairly low BIAS. PERSIANN and CMORPH had relatively high POD and FAR values, while TRMM had relatively low POD and FAR values. The CSI values for all six products were similar. An additional point to note is that, for most indicators (except BIAS), the accuracy of the products improved with an increase of spatial scale.
To further illustrate the spatial variability of the SPPs examined in this study, we also give the spatial distribution of three post real-time products for the three evaluation indices (R, POD, and CSI) at the daily and grid scale in Figure 3 and the other four evaluation indices (BIAS, MAE, RMSE, and FAR) in Figure A1. It can be seen that all of the products achieved a high level of precision in the southern part of the Wei River basin but low precision in the northern part, apart from for the MAE and RMSE values. The MAE and RMSE values are smaller in the northwestern part of the Wei River basin. Making a careful comparison between Figure 3, Figure A1 and Figure 1, it can be seen that the datasets performed better over the plains but had a disappointing performance for more mountainous areas.

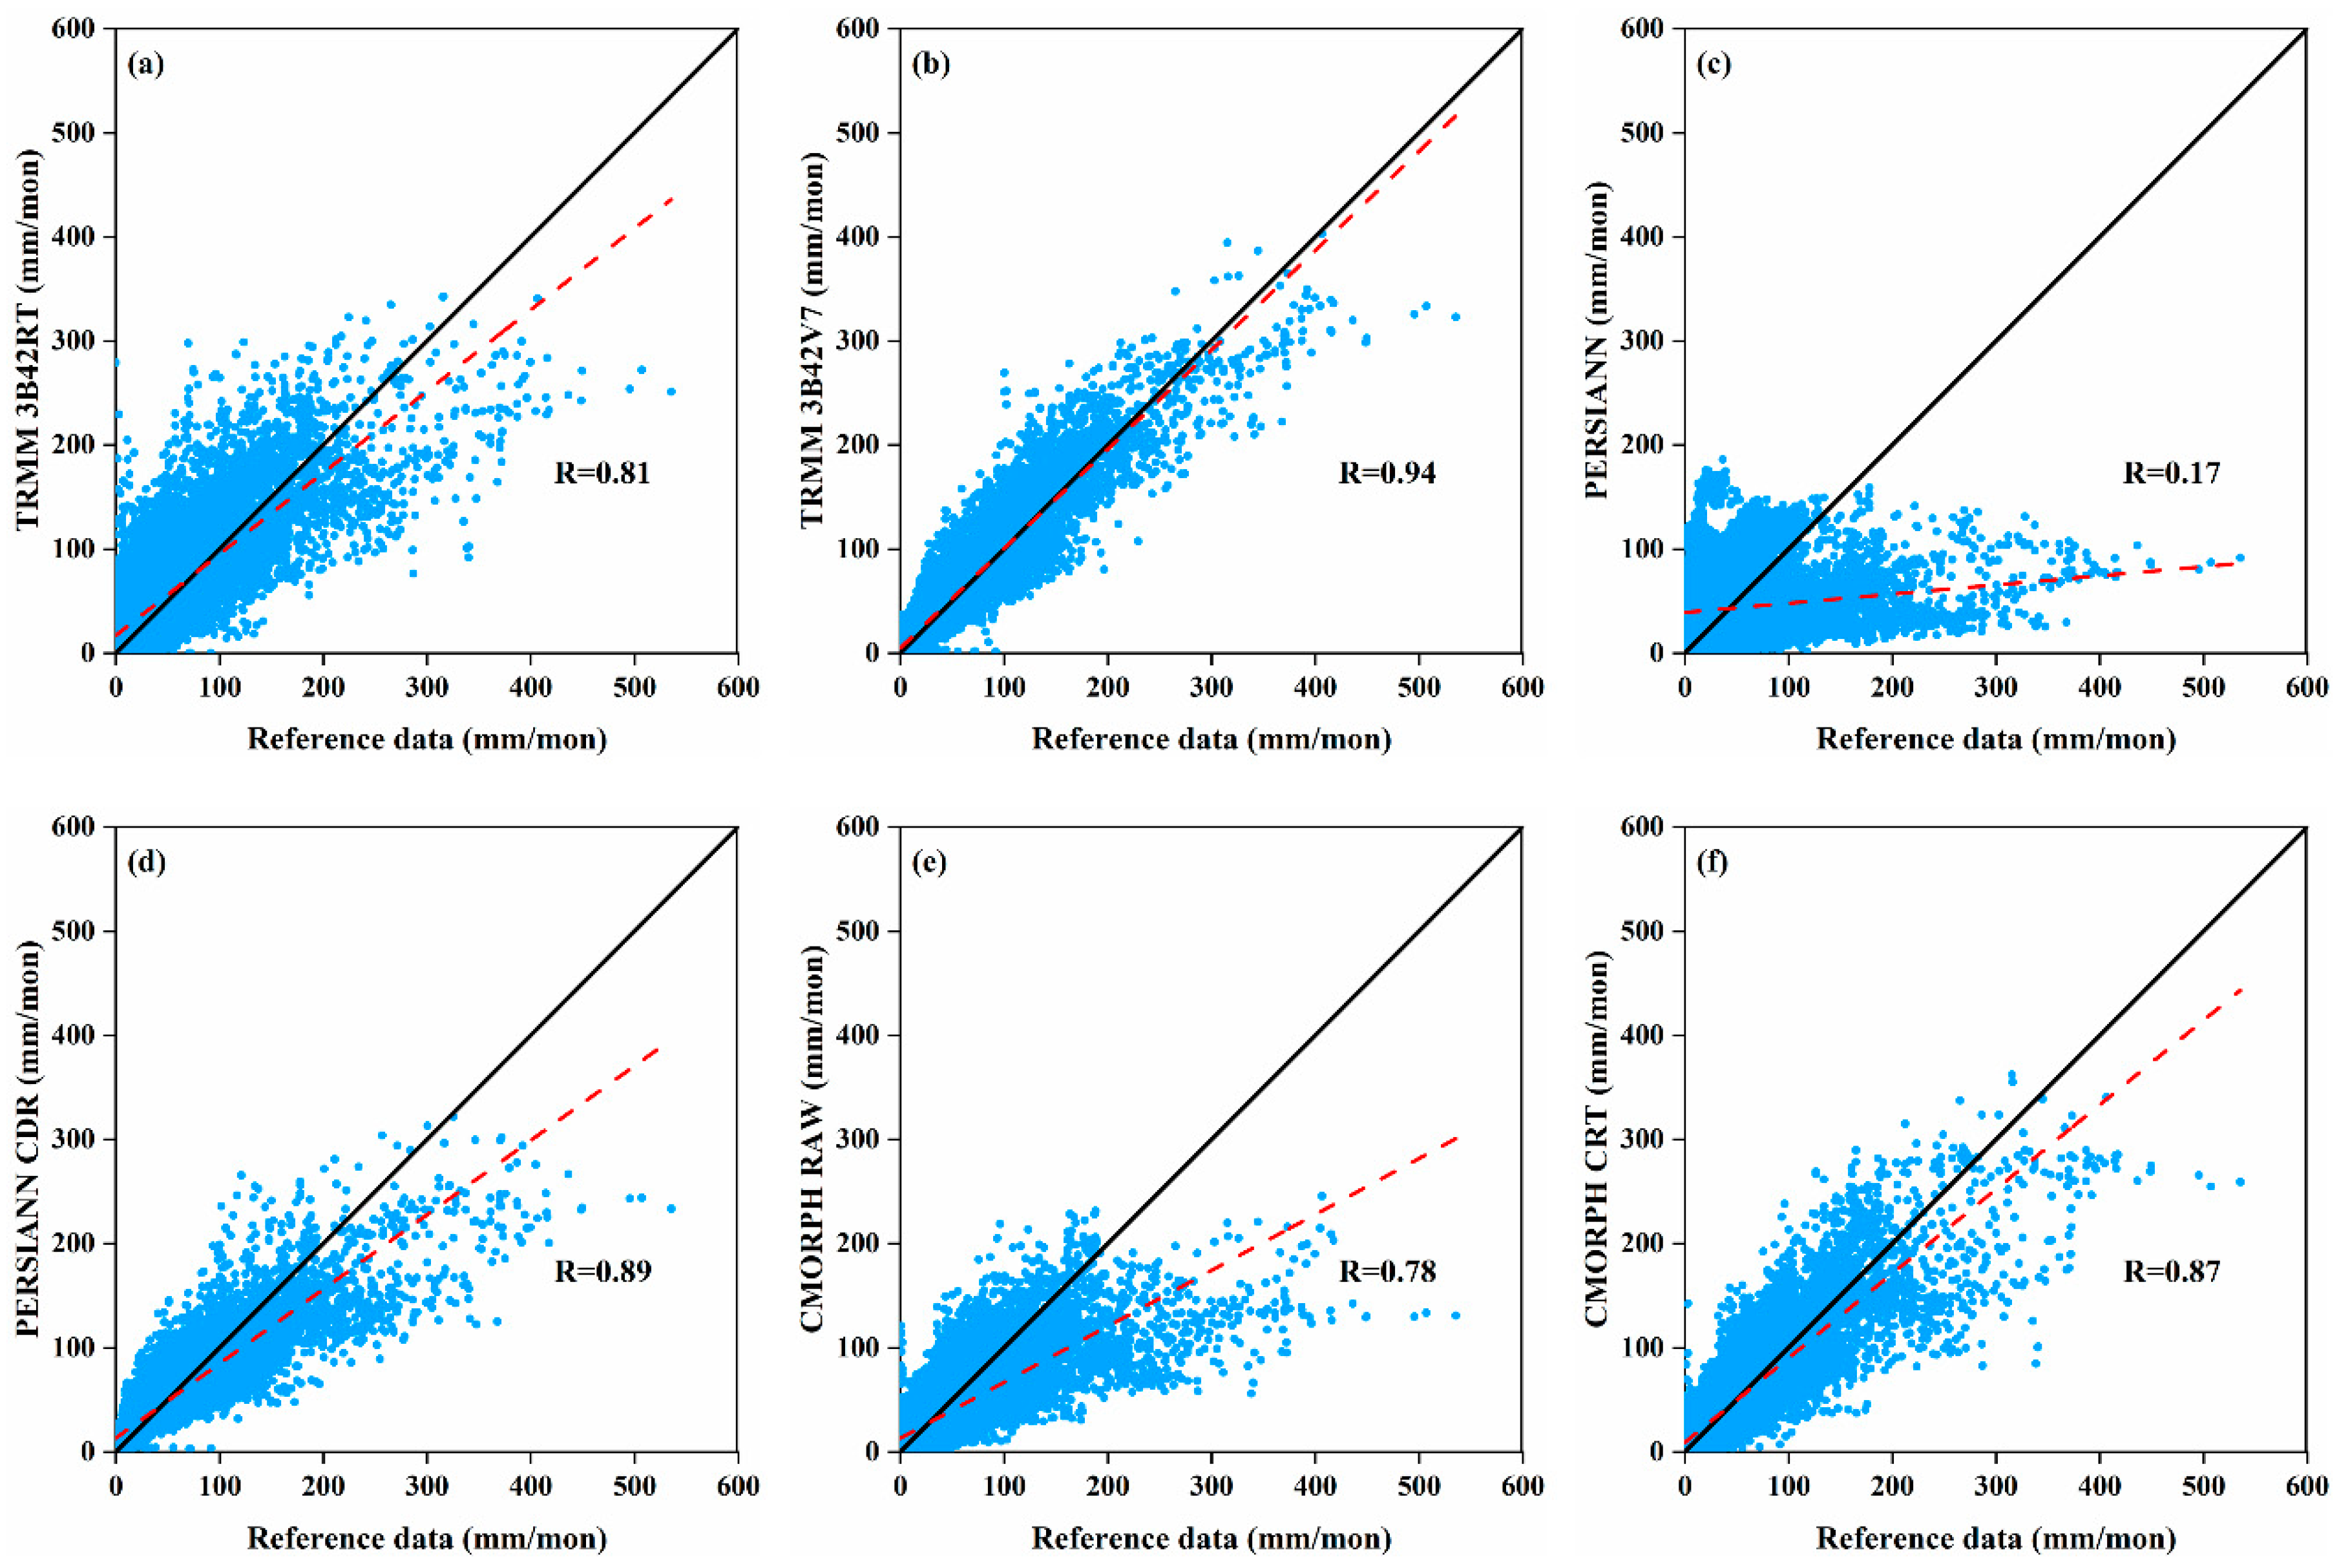
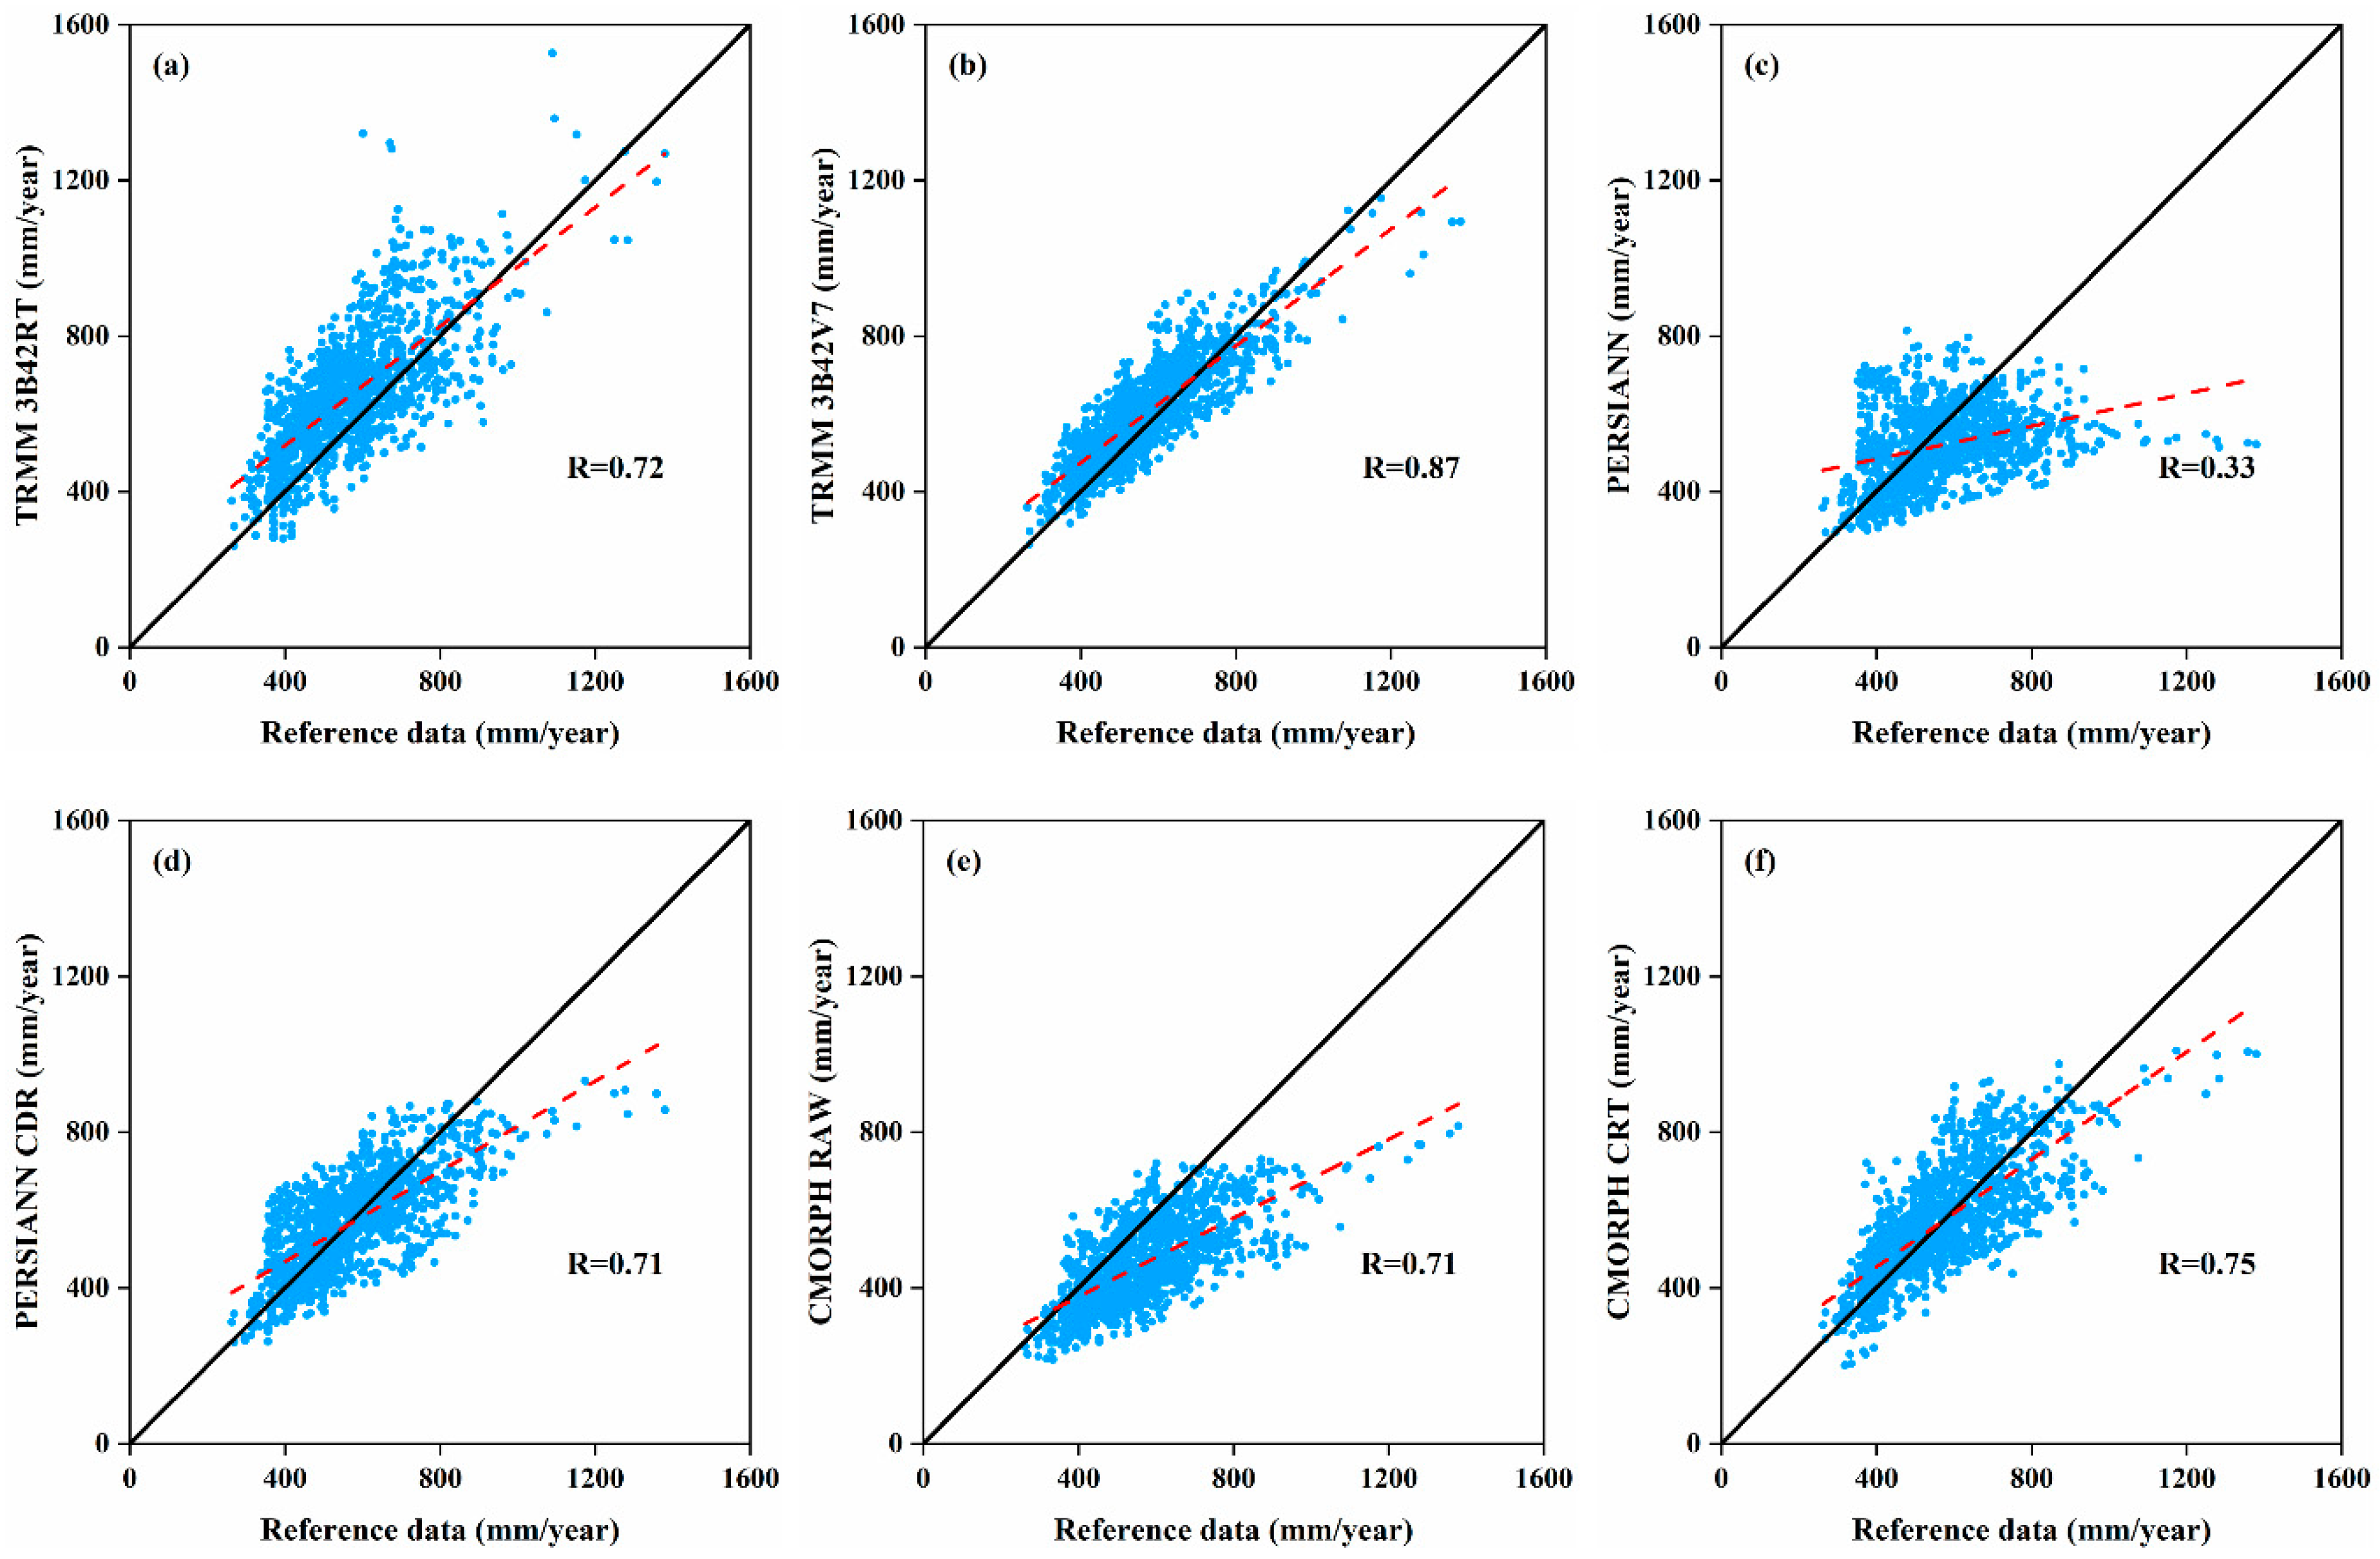
3.1.2. Monthly and Annual Temporal Scale

In order to evaluate the SPPs at a different temporal scale, the daily precipitation data were aggregated to a monthly total precipitation for the reference data and the six SPPs. A similar analysis was conducted to the one undertaken for the results at a daily temporal scale. Note that, at a monthly and annual temporal scale, the POD, FAR, and CSI results are not considered because monthly and annual cumulative precipitation could not reflect whether specific precipitation events had been detected by the SPPs. Note also that the formula for the BIAS result made it proportional across the daily, monthly, and annual temporal scales. Only three metrics R, MAE, and RMSE are therefore presented here (Table 3 and Table 4). The scatter plots for the monthly total precipitation from the reference data and the six SPPs at a grid scale are shown in Figure 4. TRMM 3B42V7 showed the best performance, with the largest R and the smallest MAE and RMSE across all of the different spatial scales, while the PERSIANN products had the lowest accuracy (see Table 3). We found that for the related products, correction using gauge data was effective and improved the accuracy (TRMM 3B42V7 compared with TRMM 3B42RT, PERSIANN CDR compared with PERSIANN, CMOPRH CRT compared with CMORPH RAW).
Figure 5 shows the temporal variation in the monthly precipitation estimates over the whole basin for the reference data and the six SPPs. TRMM 3B42RT, TRMM 3B42V7, PERSIANN CDR, and CMORPH CRT all performed well, but for TRMM 3B42RT, PERSIANN CDR, and CMORPH CRT, the total summer precipitation was underestimated in 2009, 2013, and 2014. CMORPH RAW roughly captured the monthly precipitation process, but it always seriously underestimated the total summer precipitation. PERSIANN barely managed to track the pattern of the reference data at all.
After evaluation at a monthly scale, the monthly precipitation data was further aggregated to an annual precipitation. In Table 4, we only present the evaluation metrics at a grid scale because of the lack of annual data at a sub-basin and whole basin scale. Scatter plots of the precipitation at an annual scale from the reference data vs. the six SPPs are shown in Figure 6. Table 4 summarizes the statistical results. Similar to the monthly scale, TRMM 3B42V7 again performed the best, with the largest R and the smallest MEA and RMSE.

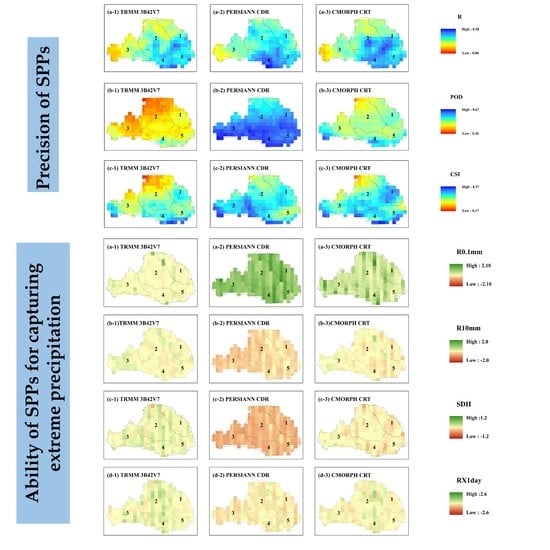
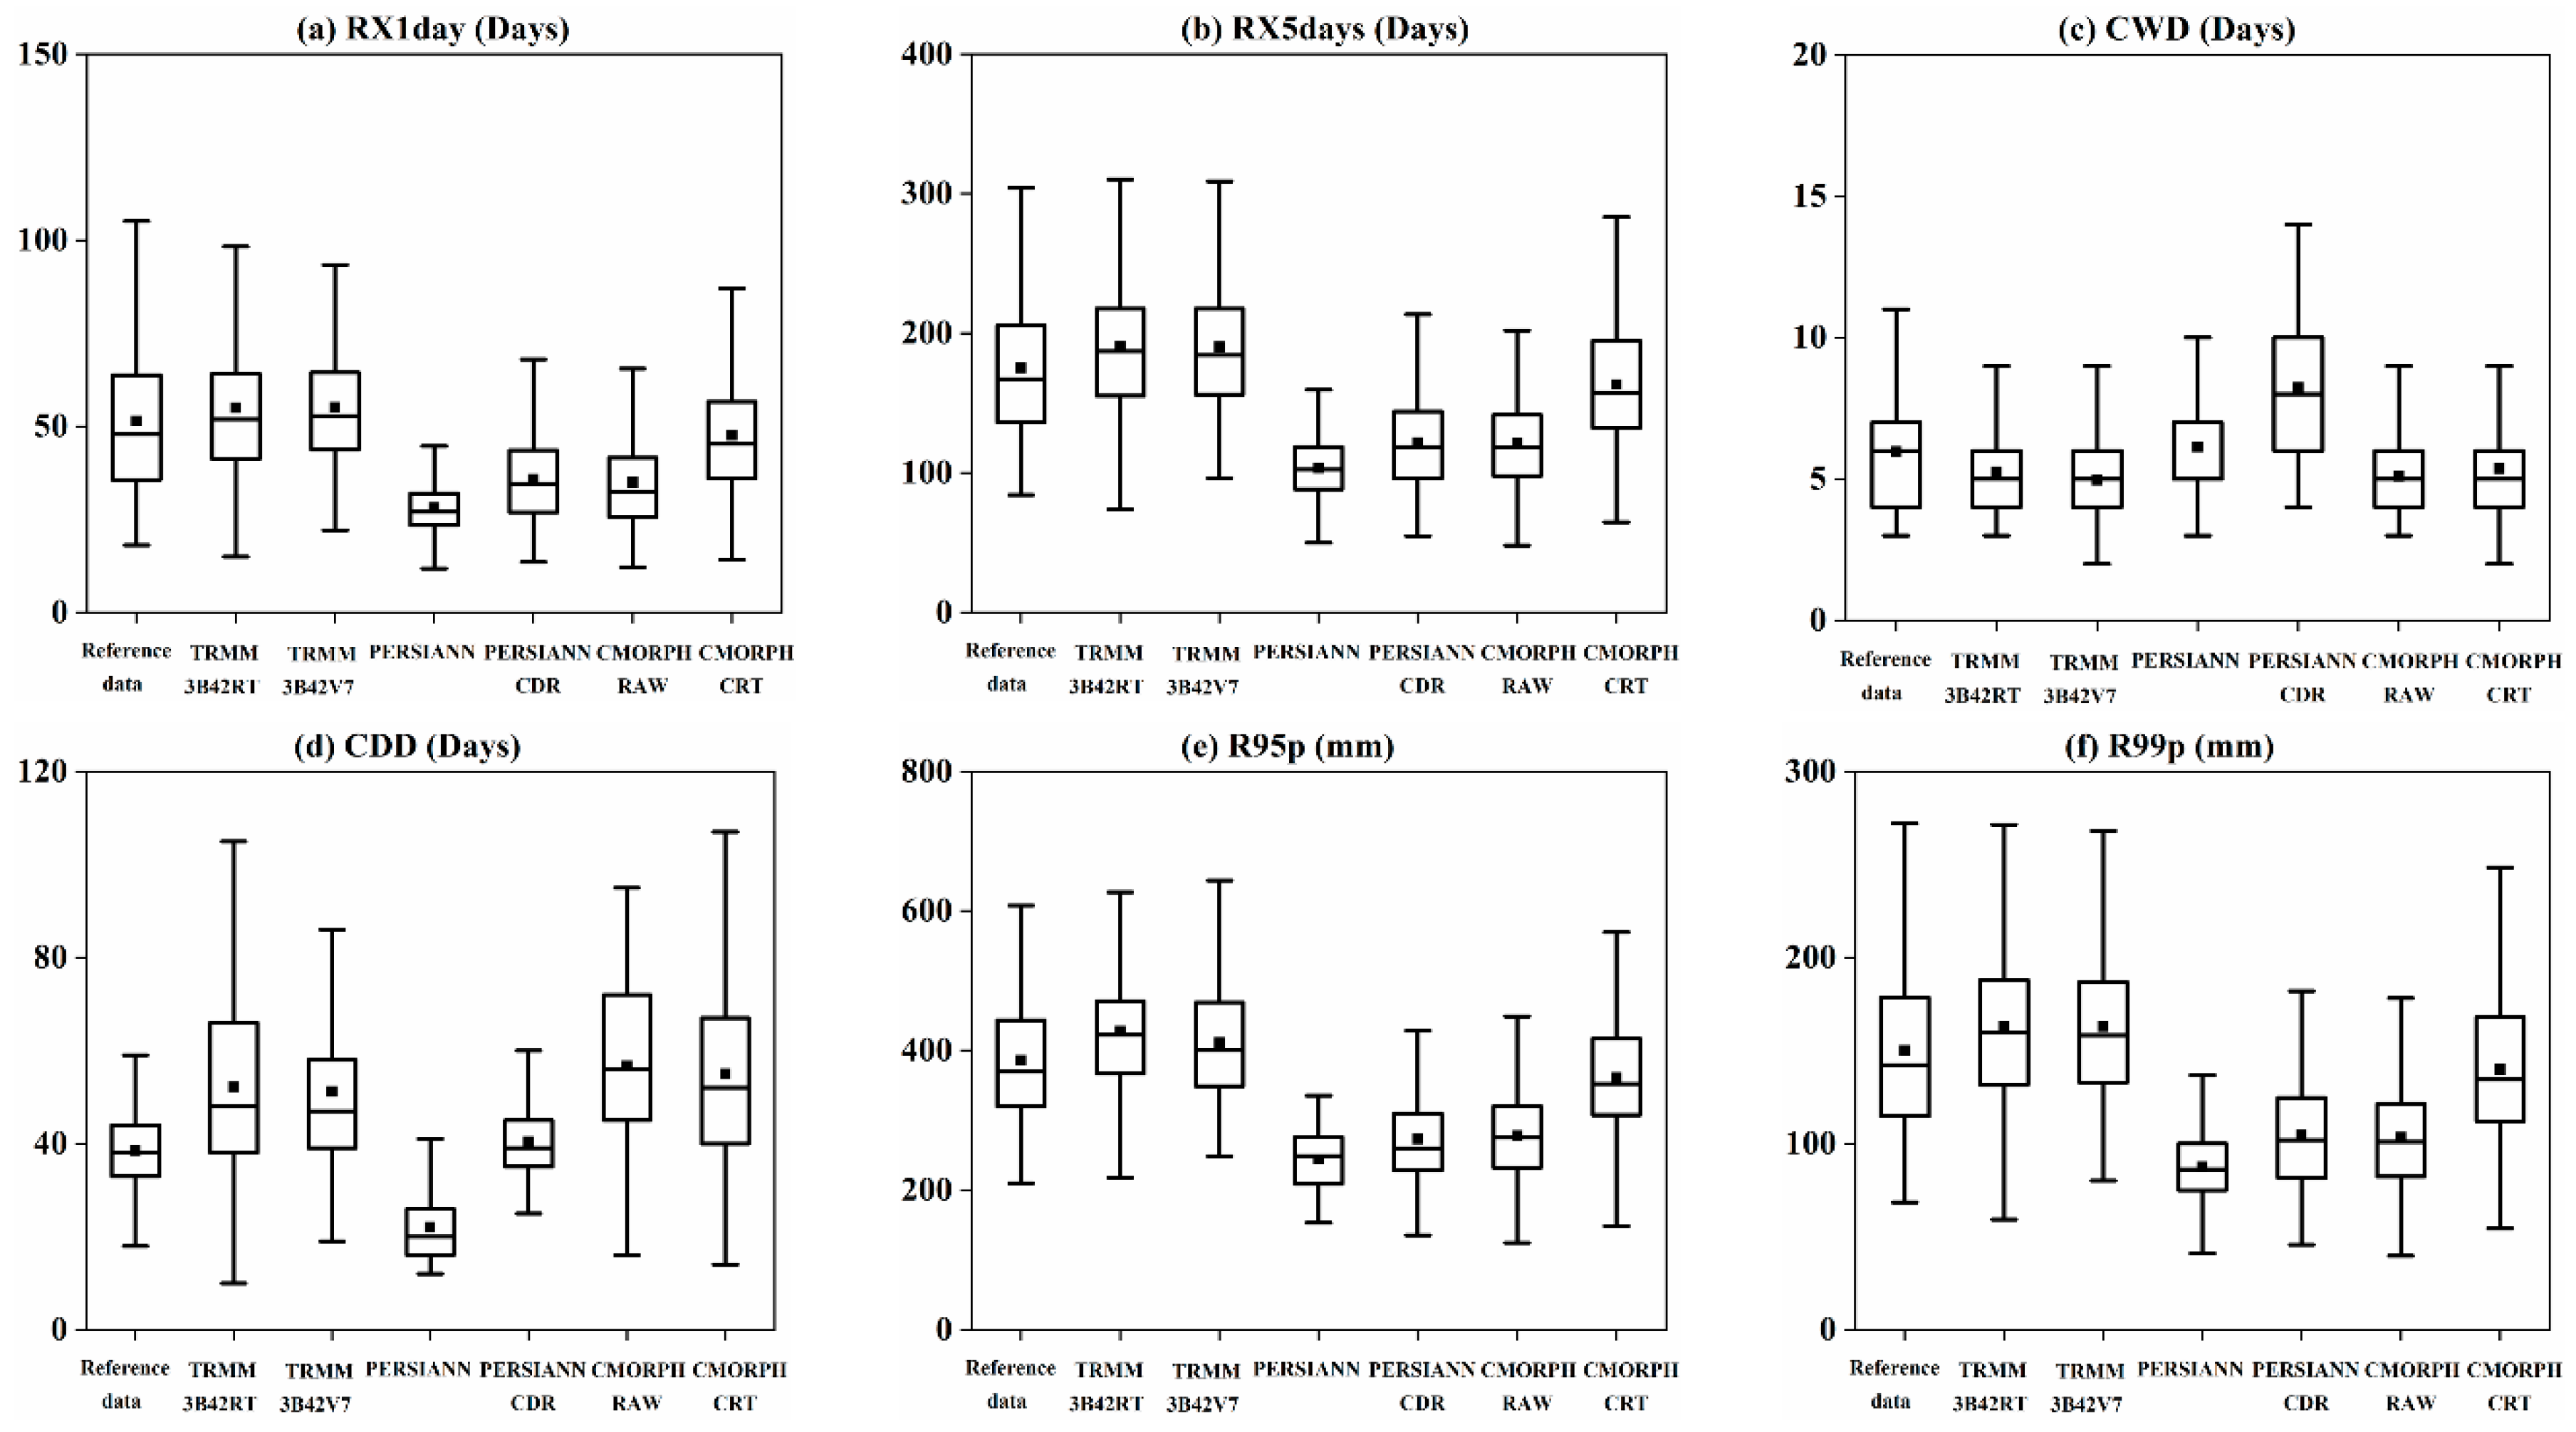
3.2. Evaluation of SPPs to Capture Extreme Precipitation Characteristics

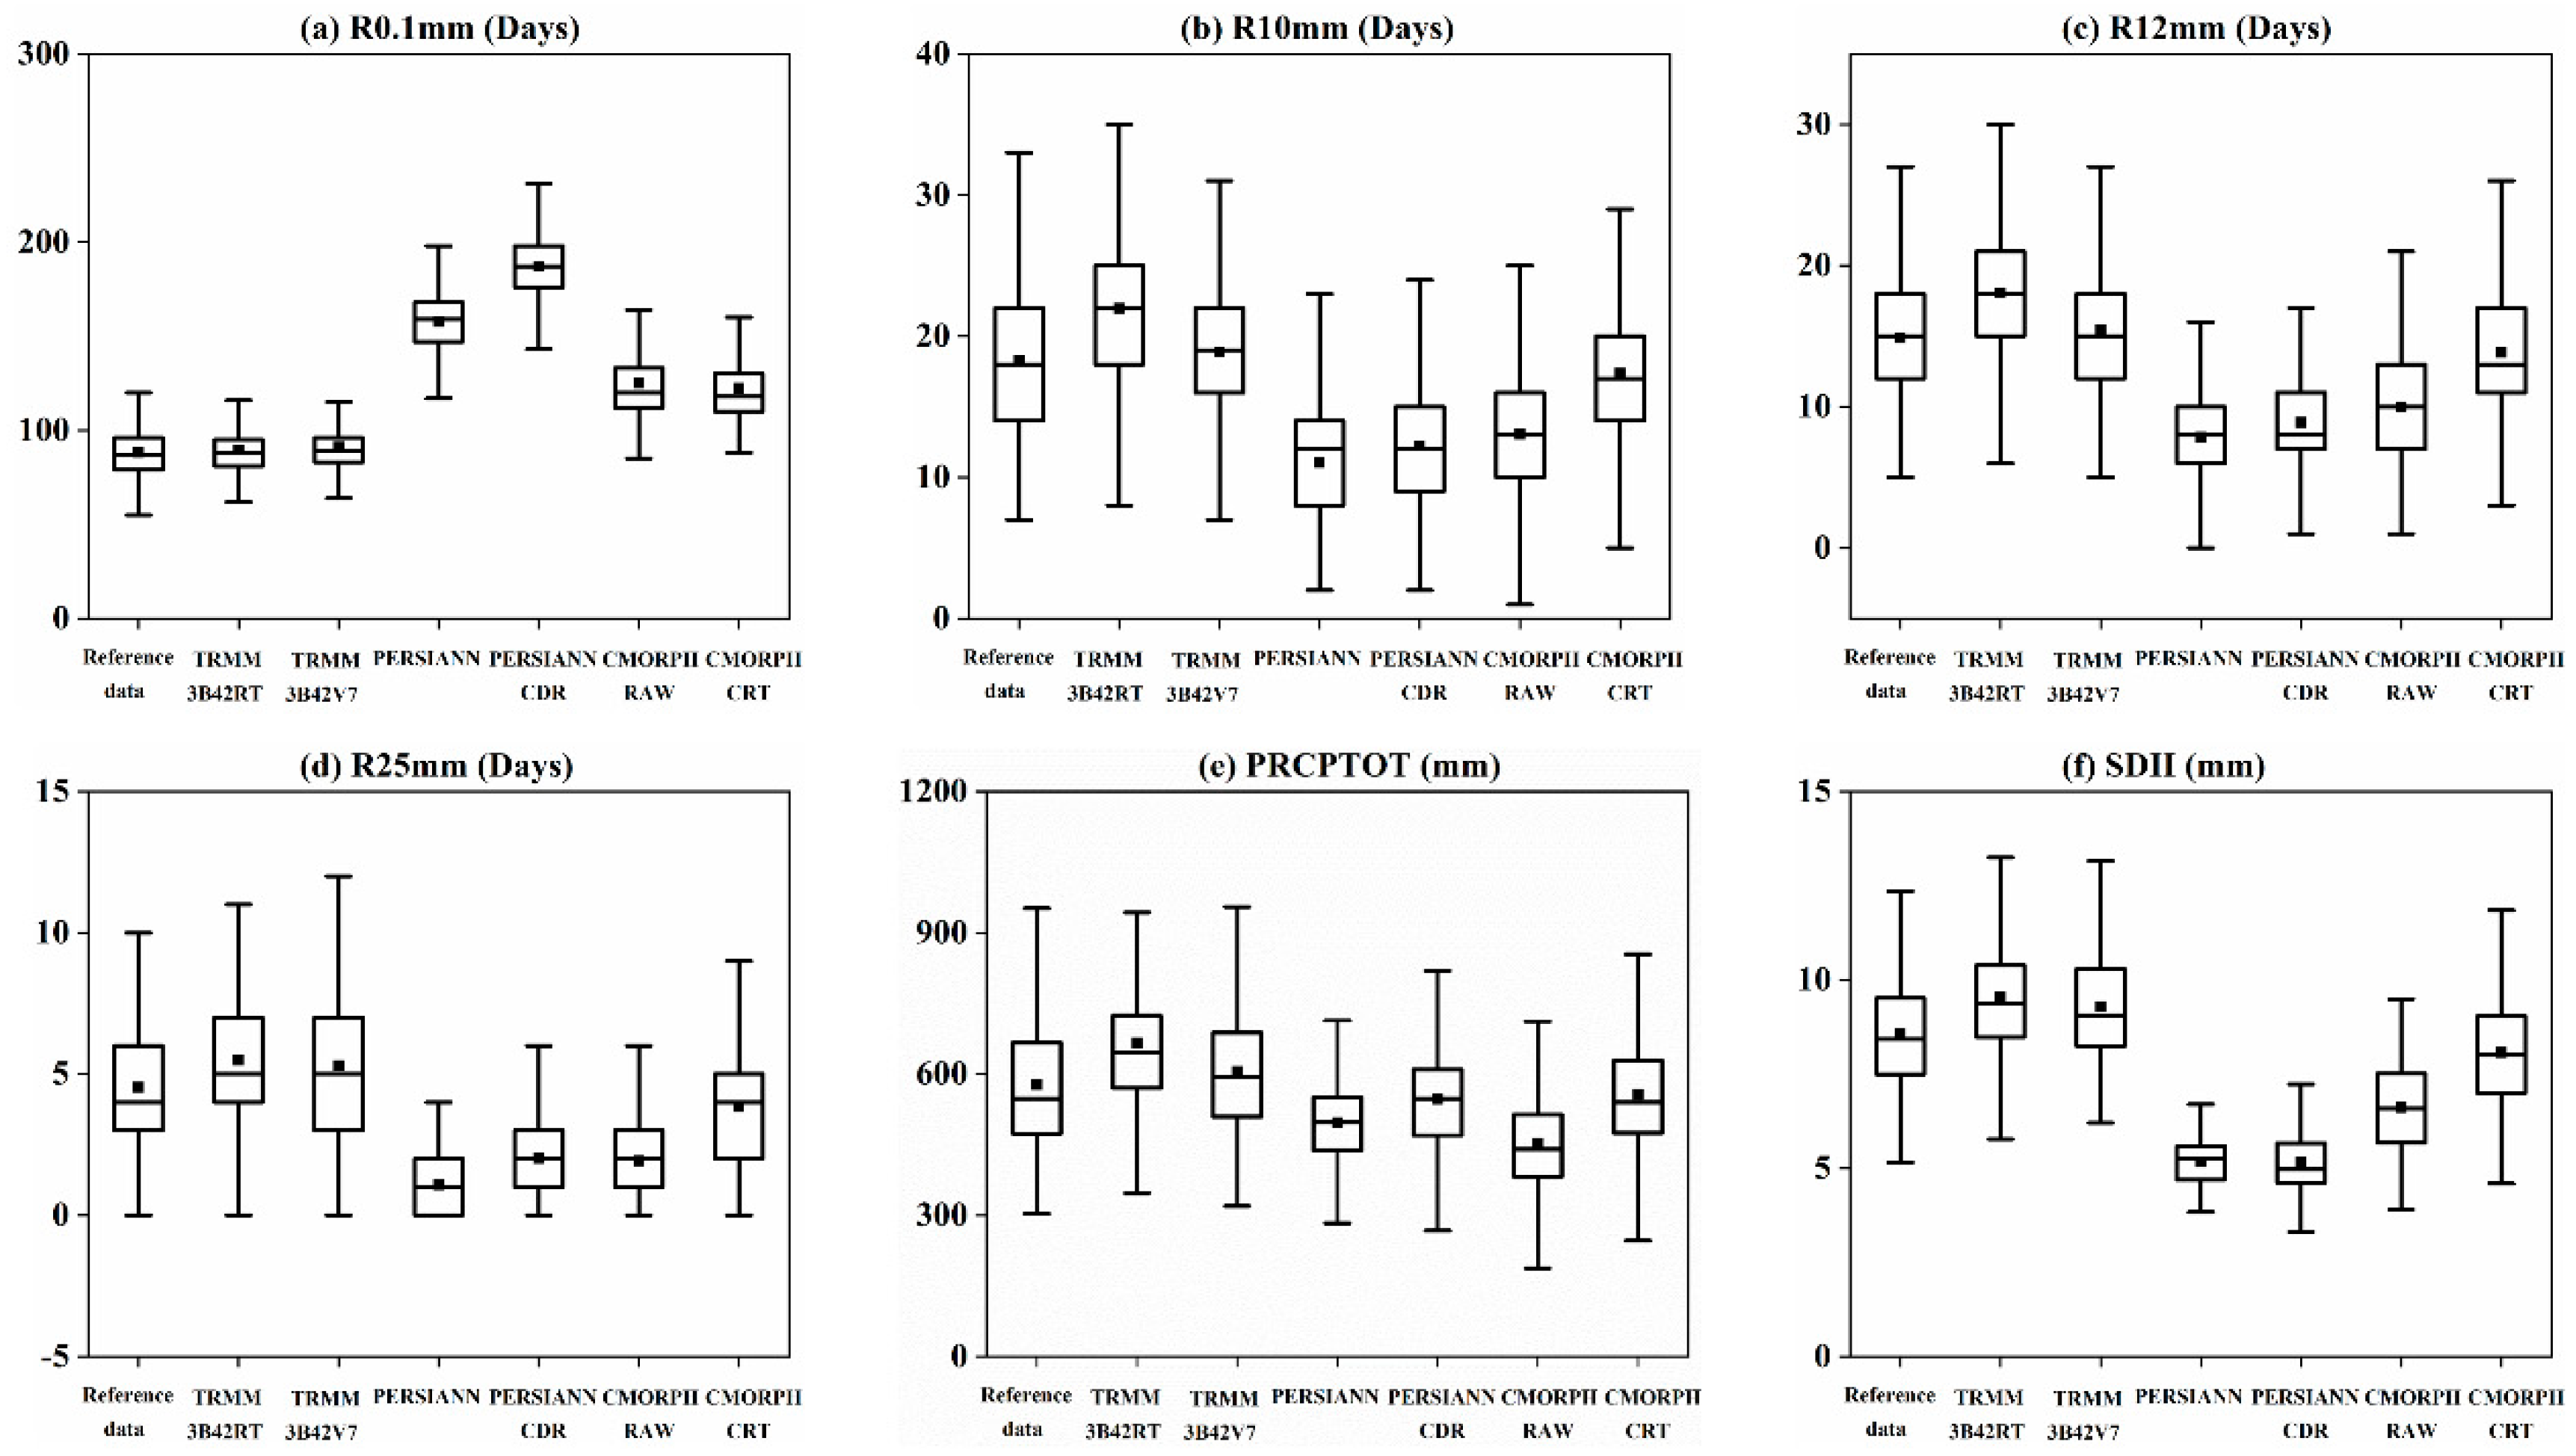
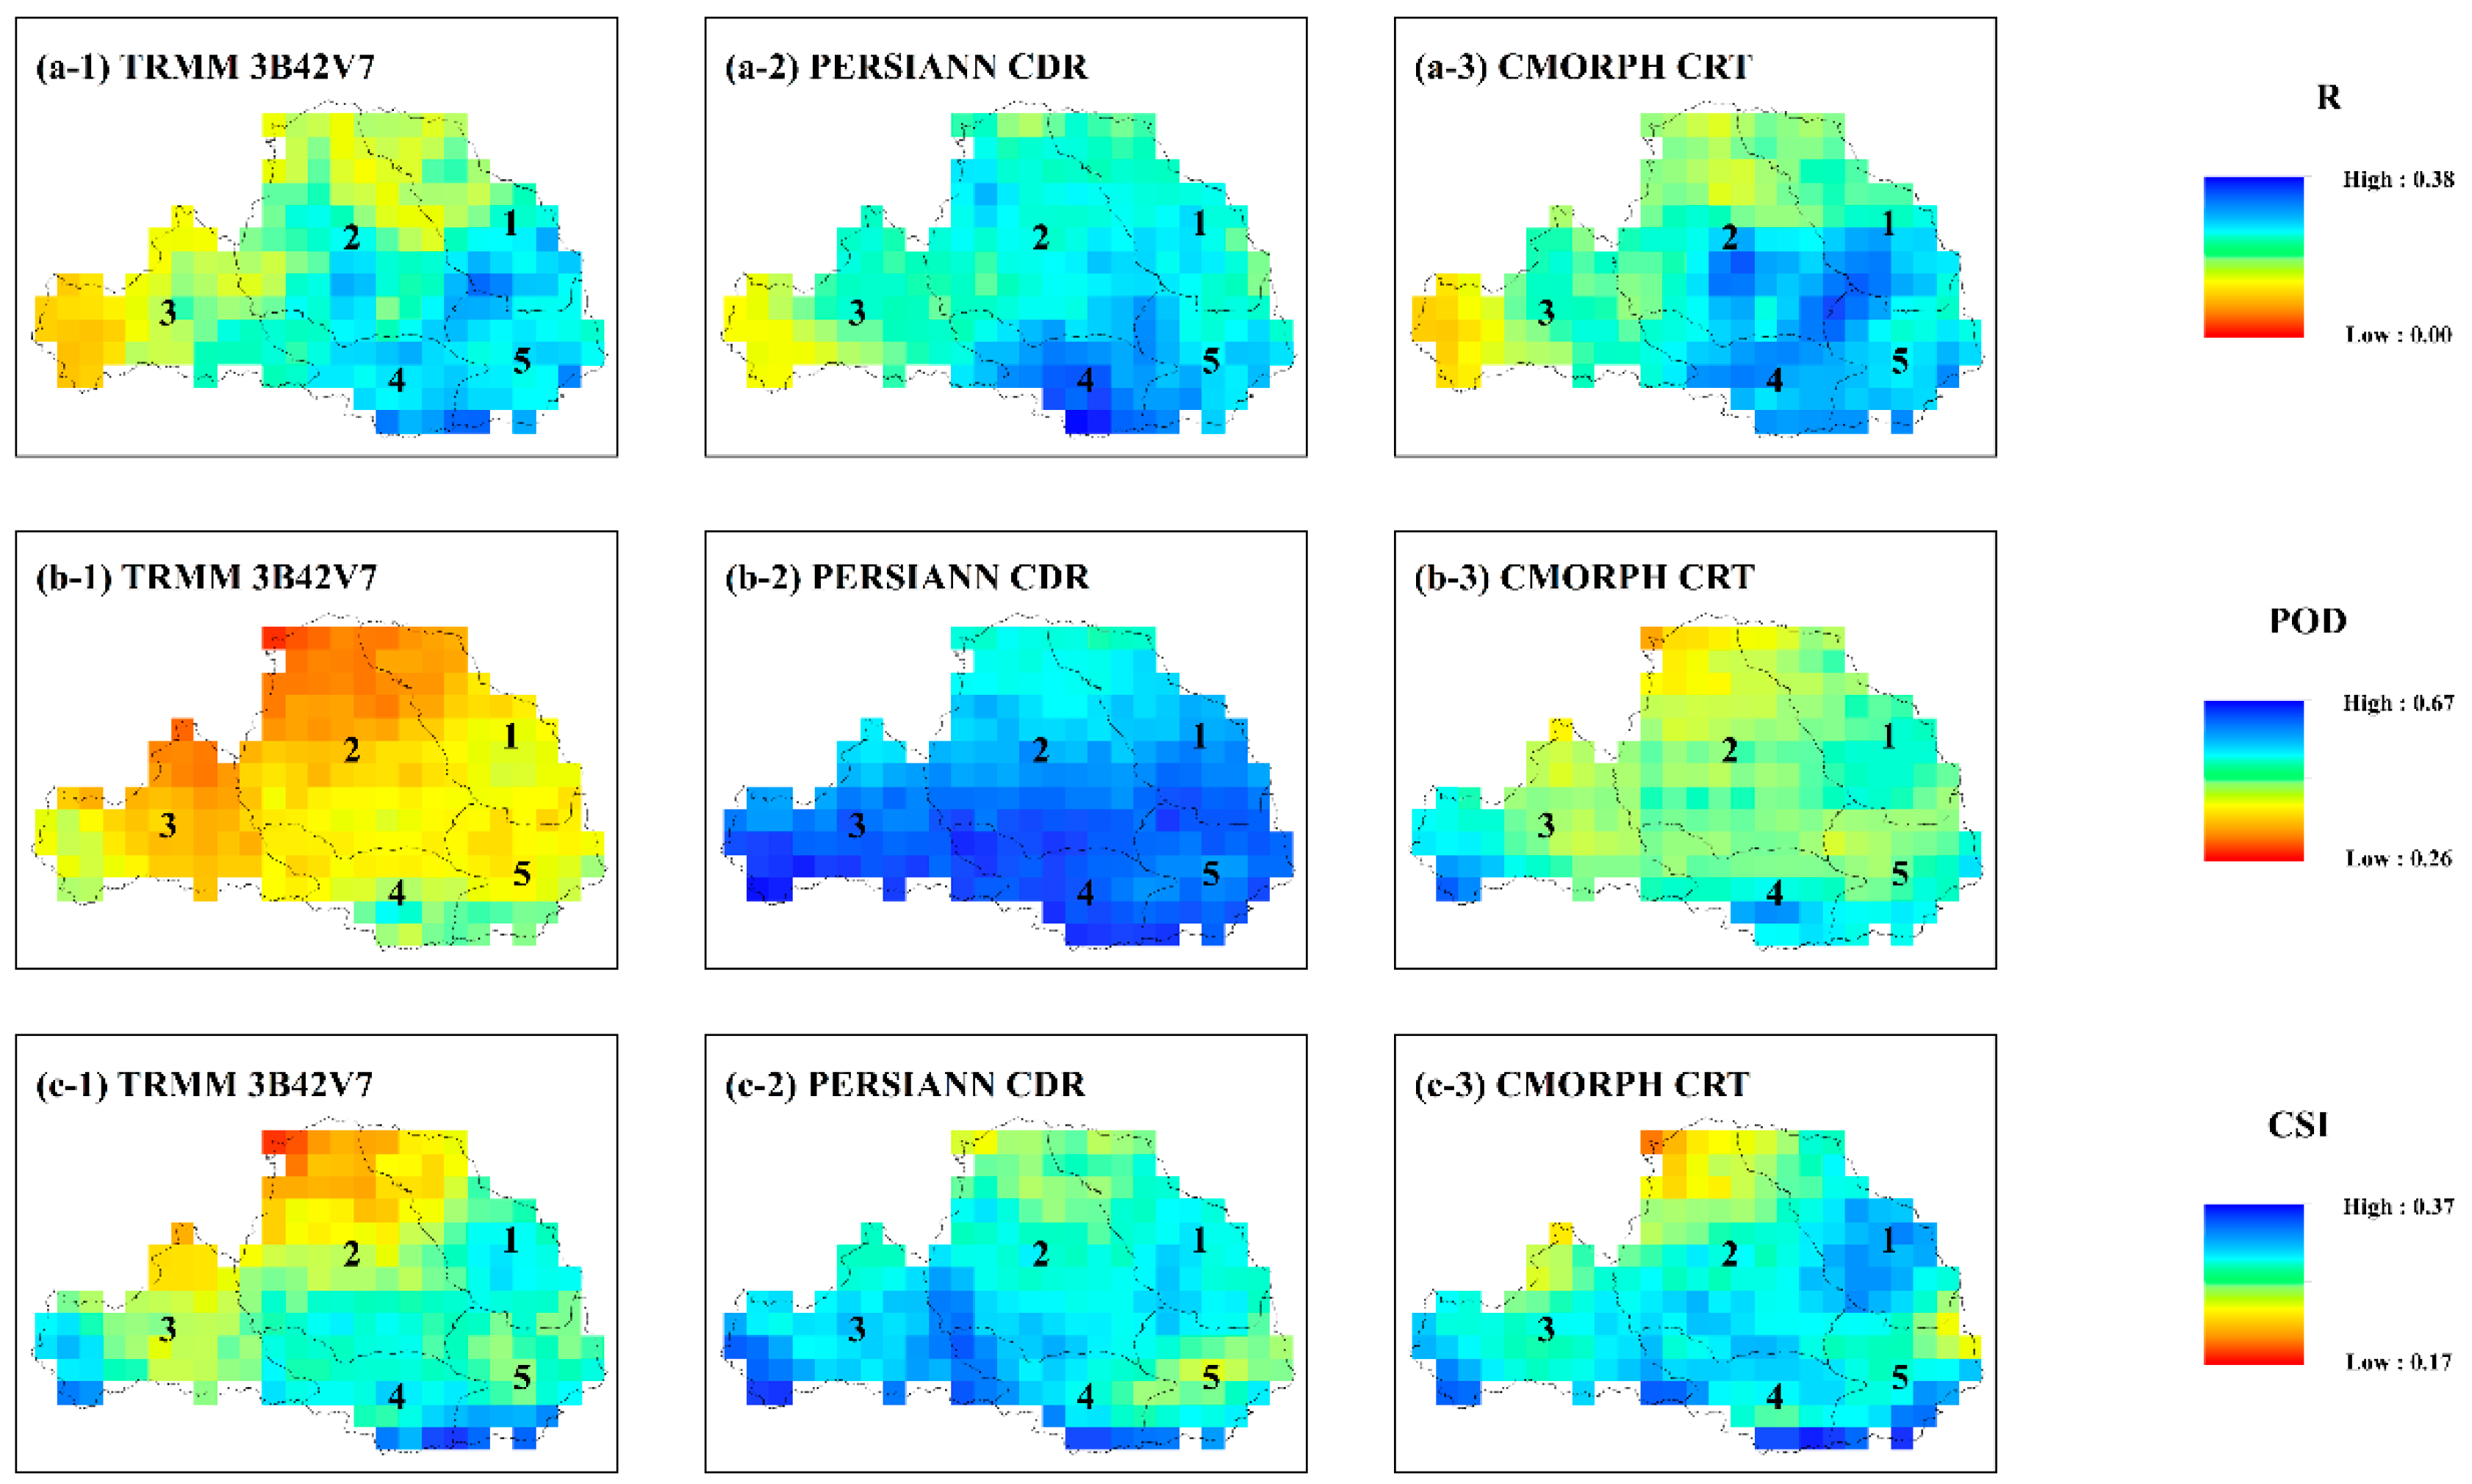
3.2.1. Identification Ability of SPPs for Extreme Precipitation

Table 5 shows the average of the extreme precipitation indices for the reference data and the different SPPs across all grids. It also shows the mean absolute error for the 12 extreme precipitation indices based on the reference data. Figure 7 shows boxplots for the reference data and the six SPPs for the six absolute threshold extreme precipitation indices: R0.1 mm; R10 mm; R12 mm; R25 mm; PRCPTOT, and SDII. It can be seen that all of the SPPs overestimated the R0.1mm value to various degrees. Among all the datasets, the R0.1 mm values for the two types of TRMM product were closest to the value of the reference data, while the R0.1mm values for CMORPH RAW, CMORPH CRT, PERSIANN, and PERSIANN CDR were significantly larger. We also found that the R0.1 mm values for CMORPH RAW, CMORPH CRT, PERSIANN, and PERSIANN CDR had a wide distribution, indicating uncertainty in capturing precipitation days. For the R10mm, R12 mm, and R25mm results, the two types of PERSIANN and the two types of CMORPH underestimated the values instead, especially PERSIANN, PERSIANN CDR, and CMORPH RAW. The two types of TRMM overestimated the values for R10 mm, R12 mm, and R25 mm, but the degree of overestimation for TRMM 3B42V7 was low. Taking the R0.1 mm and R10 mm results together, we can conclude that the two types of CMORPH and the two types of PERSIANN overestimated the number of precipitation days in the year, especially the number of days when the precipitation was less than 10 mm. For the R10 mm, R12 mm, and R25 mm results, we found that TRMM 3B42V7 had the strongest detection ability for moderate precipitation (R10 mm) and erosion precipitation (R12 mm) events. CMORPH CRT also performed well. The two types of PERSIANN products performed poorly, with PERSIANN having the worst detection ability for moderate precipitation (R10 mm), erosion precipitation (R12 mm), and heavy precipitation (R25 mm) events of all. In the case of the PRCPTOT index, TRMM 3B42RT and TRMM 3B42V7 overestimated the total precipitation on wet days, while CMORPH RAW and two types of PERSIANN underestimated it (see Table 5). It should be noted that CMORPH CRT is closest to the reference value. The bias for TRMM 3B42V7 and PERSIANN CDR was also relatively small. For the SDII, TRMM had a larger value than the reference data, while for PERSIANN and CMORPH it was smaller. It should be pointed out that TRMM 3B42V7 and CMORPH CRT were the closest products to the reference data amongst the six products we evaluated.
For the second category of extreme precipitation indices, we looked at the maximum indices of precipitation, with respect to the daily precipitation values (RX1day and RX5day), the duration of rain/no rain periods (consecutive dry days (CDD) and consecutive wet days (CWD)), and the percentile indices (R95p and R99p). For the RX1day and RX5day indices shown in Figure 8 and Table 5, it can be seen that TRMM overestimated the maximum precipitation slightly, while CMORPH and PERSIANN underestimated it. These results were also consistent with the results for the R95p and R99p indices. For the CDD index, most of the datasets overestimated the consecutive dry days except PERSIANN, with PERSIANN CDR again being closest to the reference data. For the CWD index, the performance of the two types of TRMM and the two types of CMORPH products was basically consistent with the reference data, while the two types of PERSIANN slightly underestimated the consecutive wet days, particularly PERSIANN CDR. Upon closer inspection, TRMM 3B42V7 and CMORPH CRT were better able to capture the behavior of extreme precipitation (see the last line of Table 5), which suggests that calibration based on observed data enhances the ability to detect extreme precipitation.

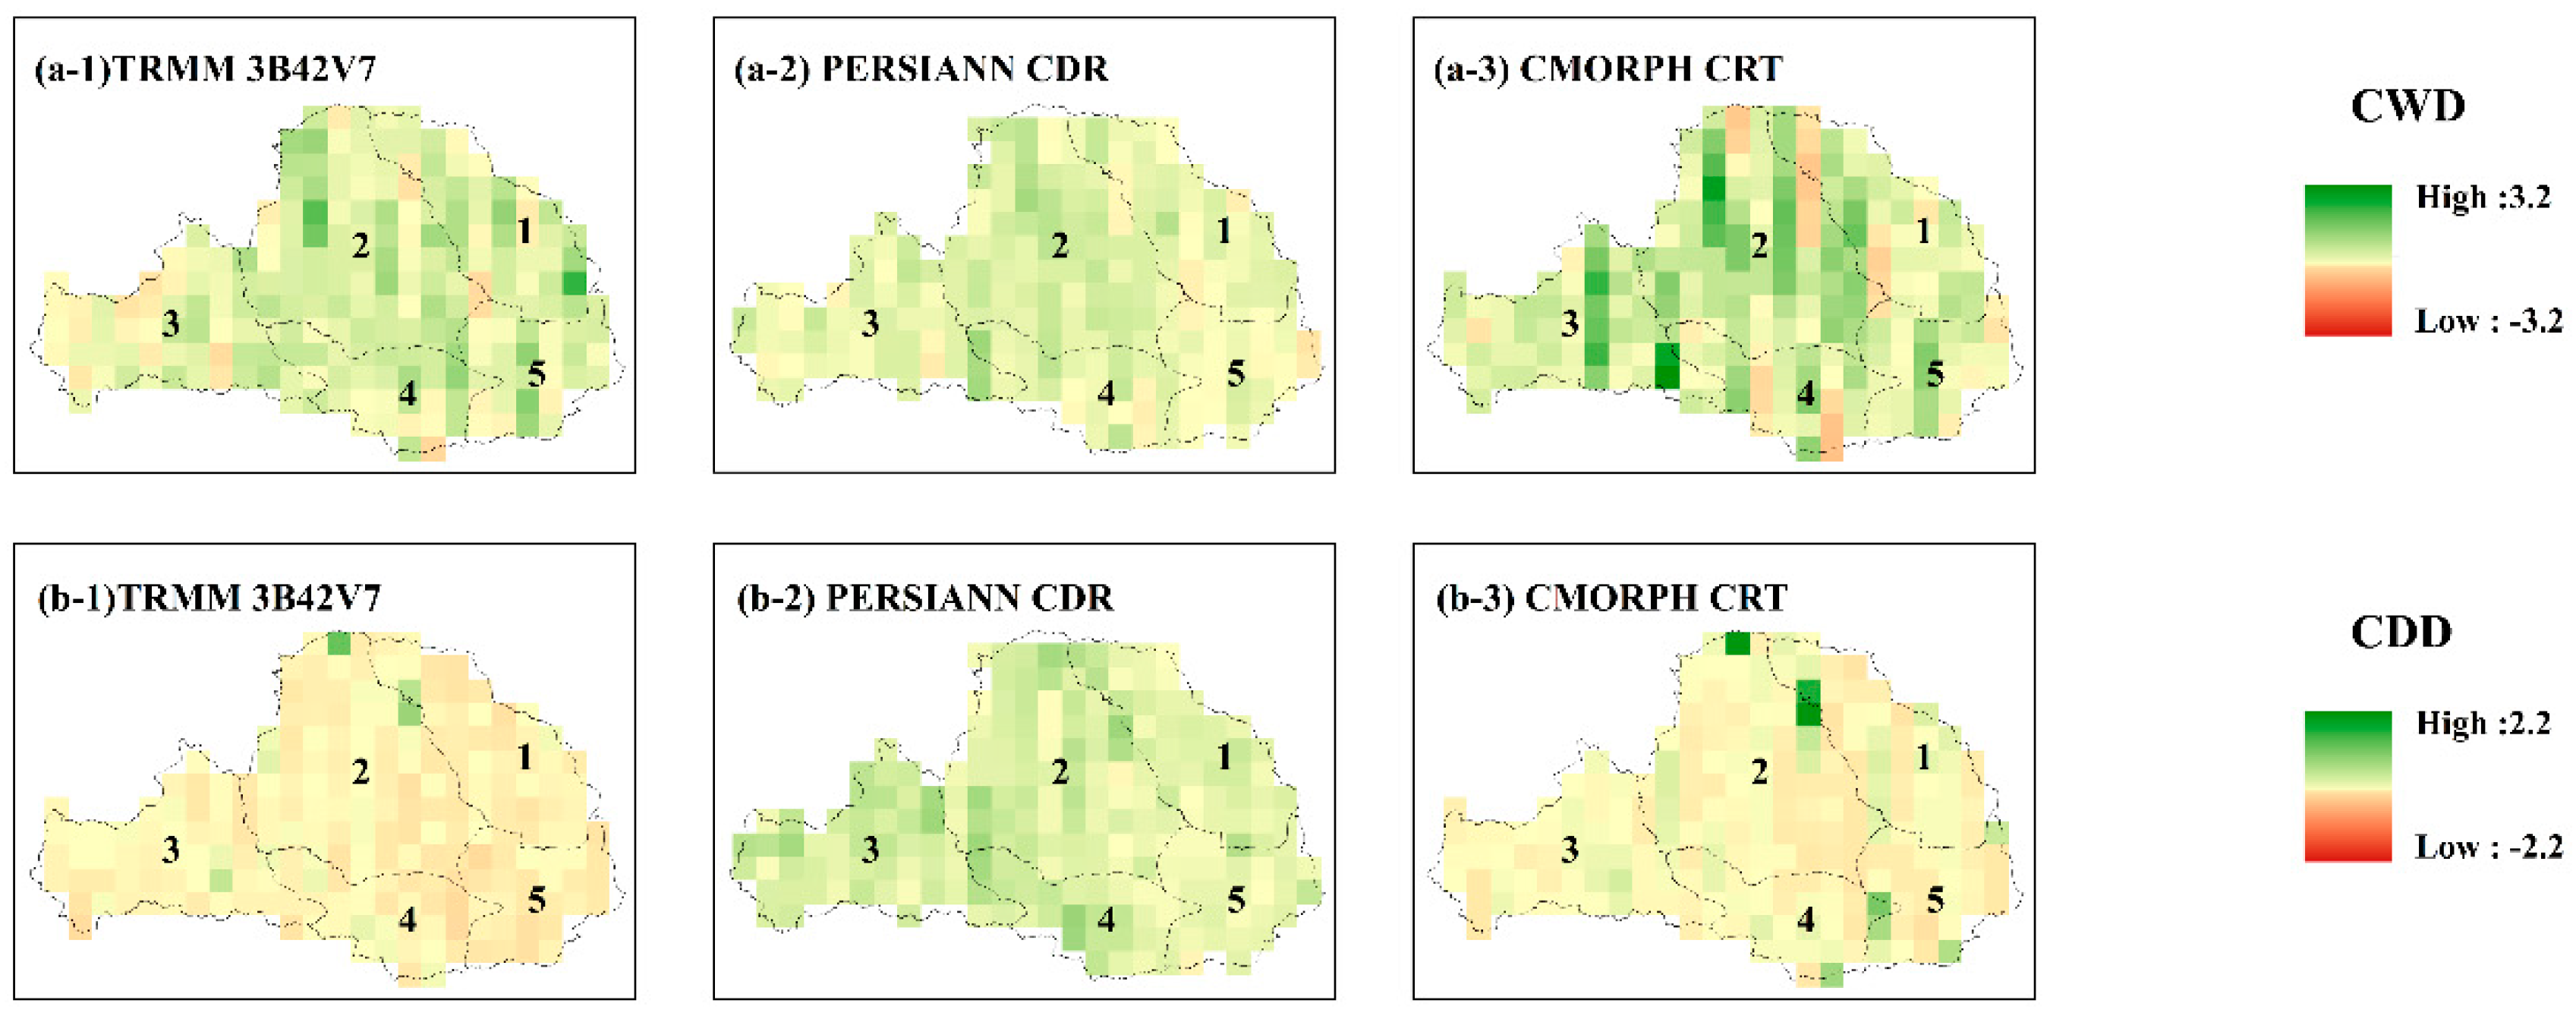
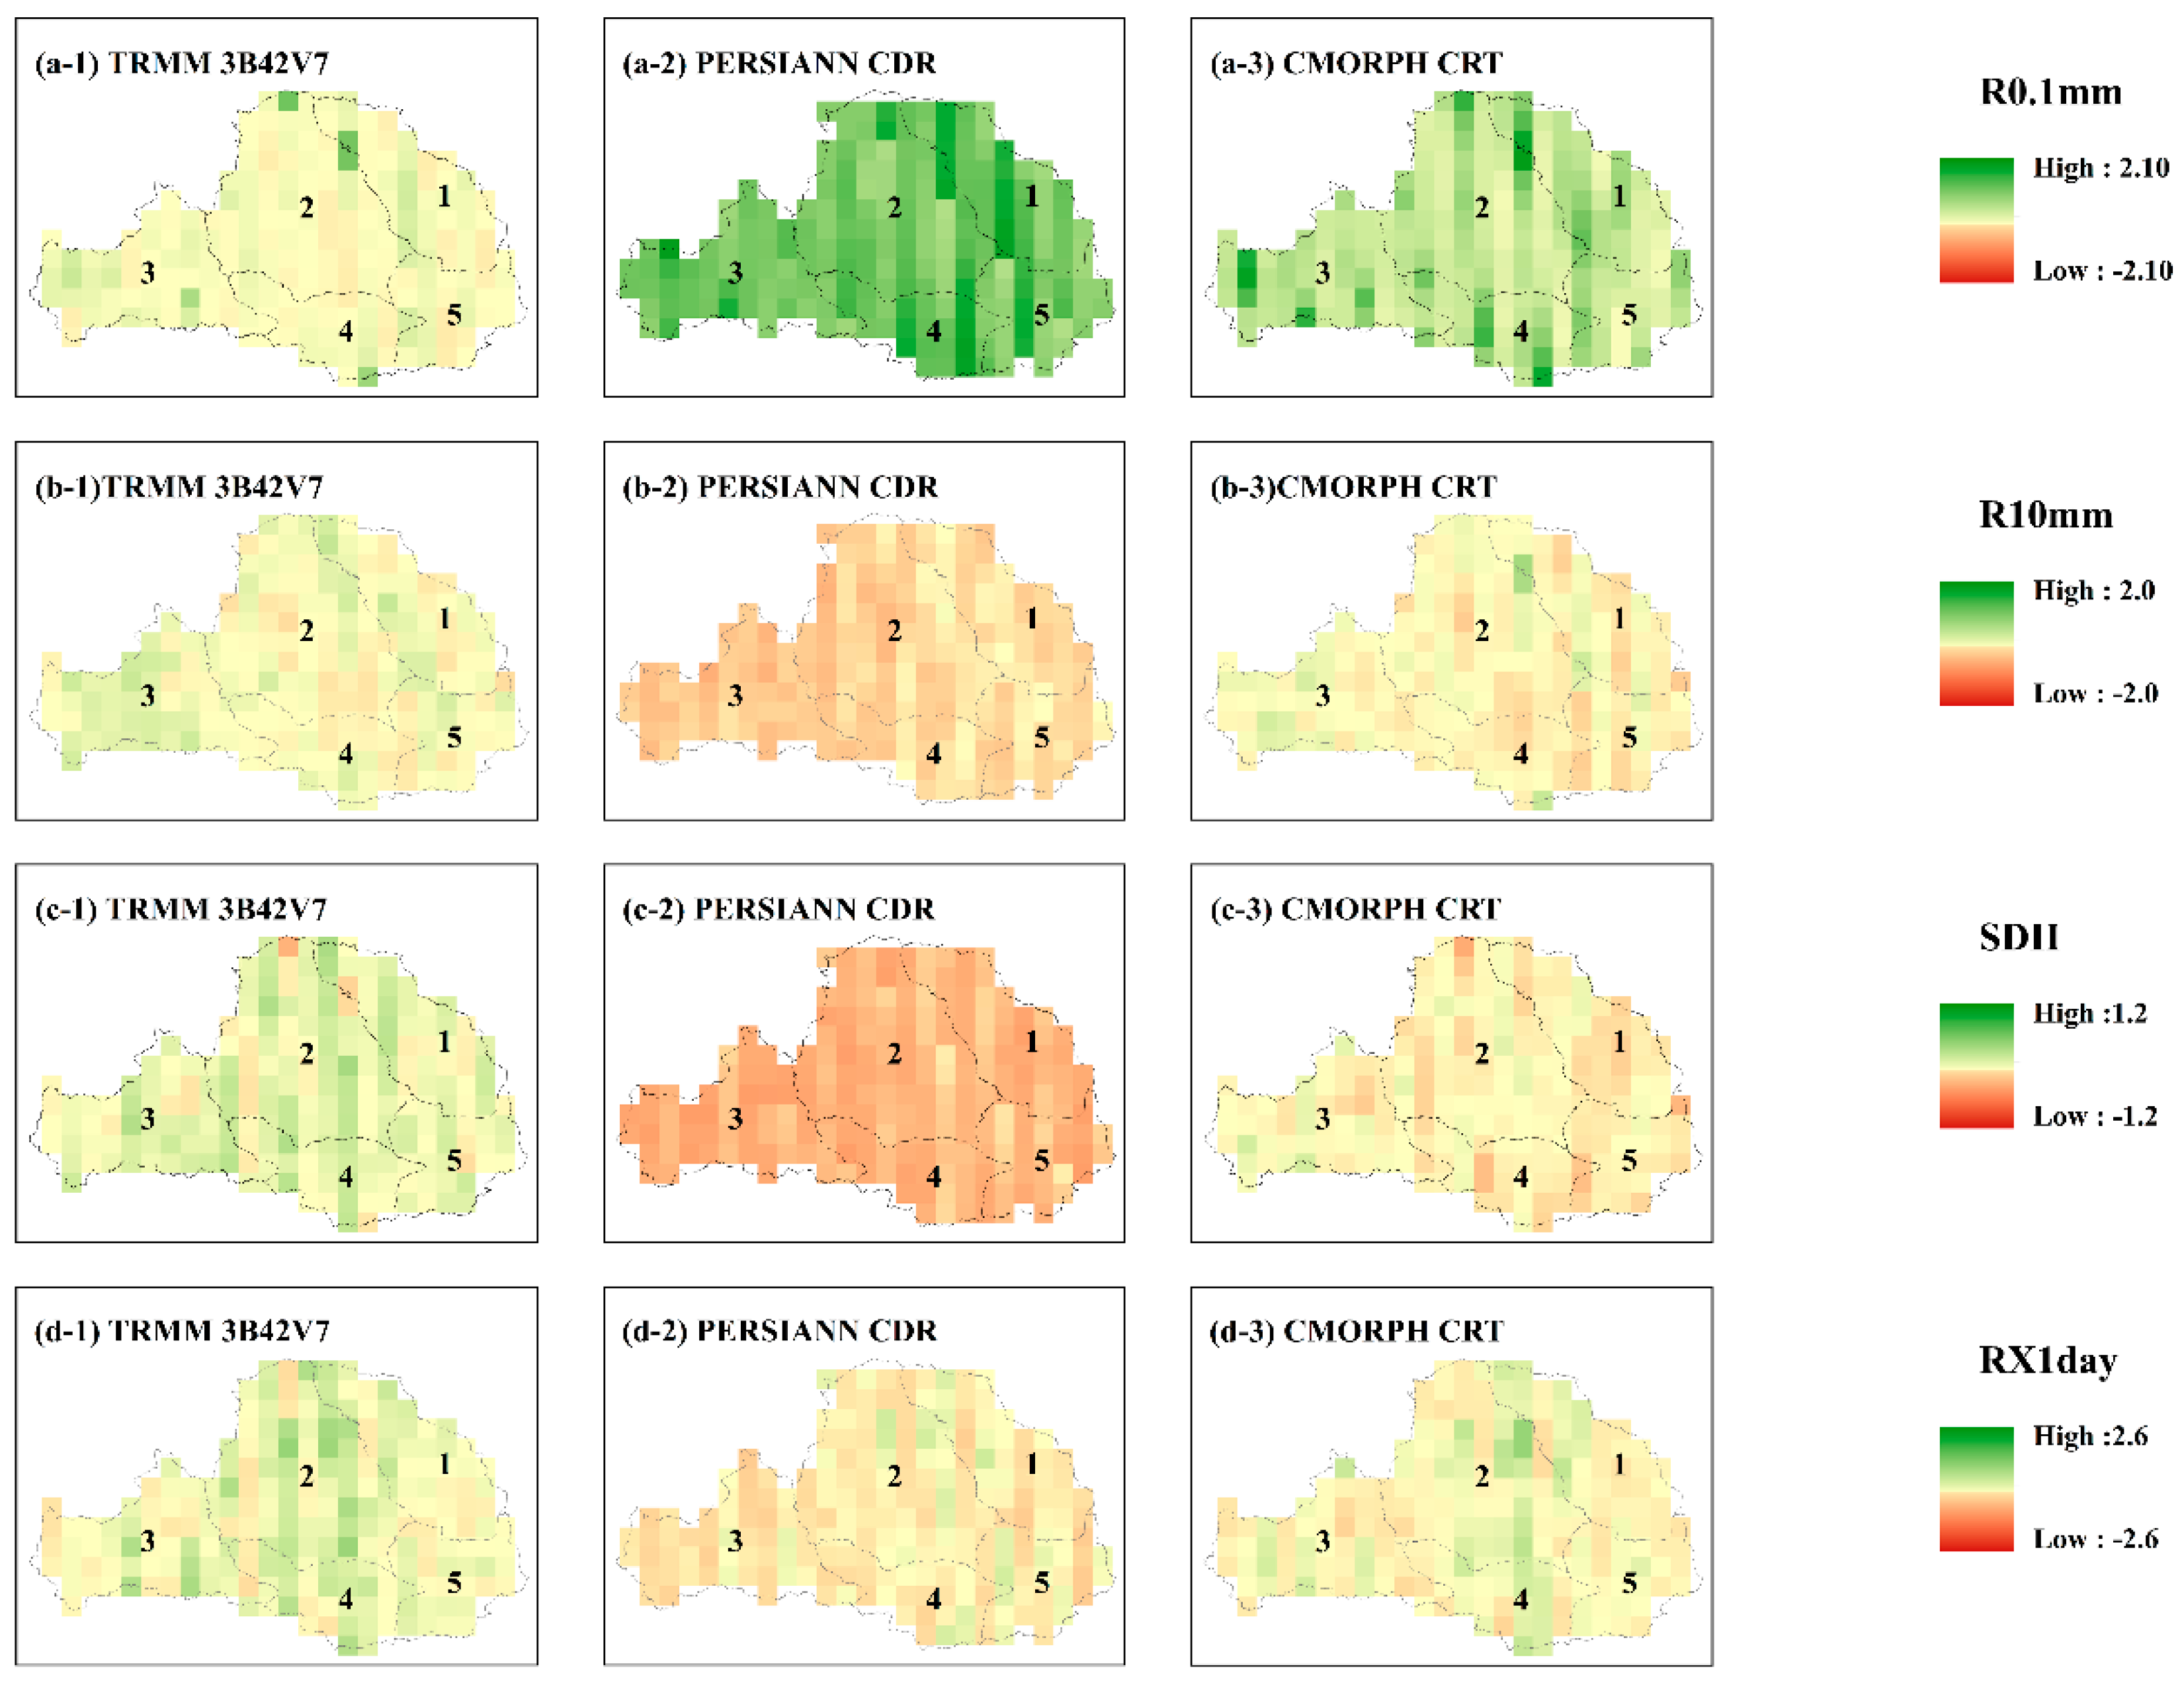
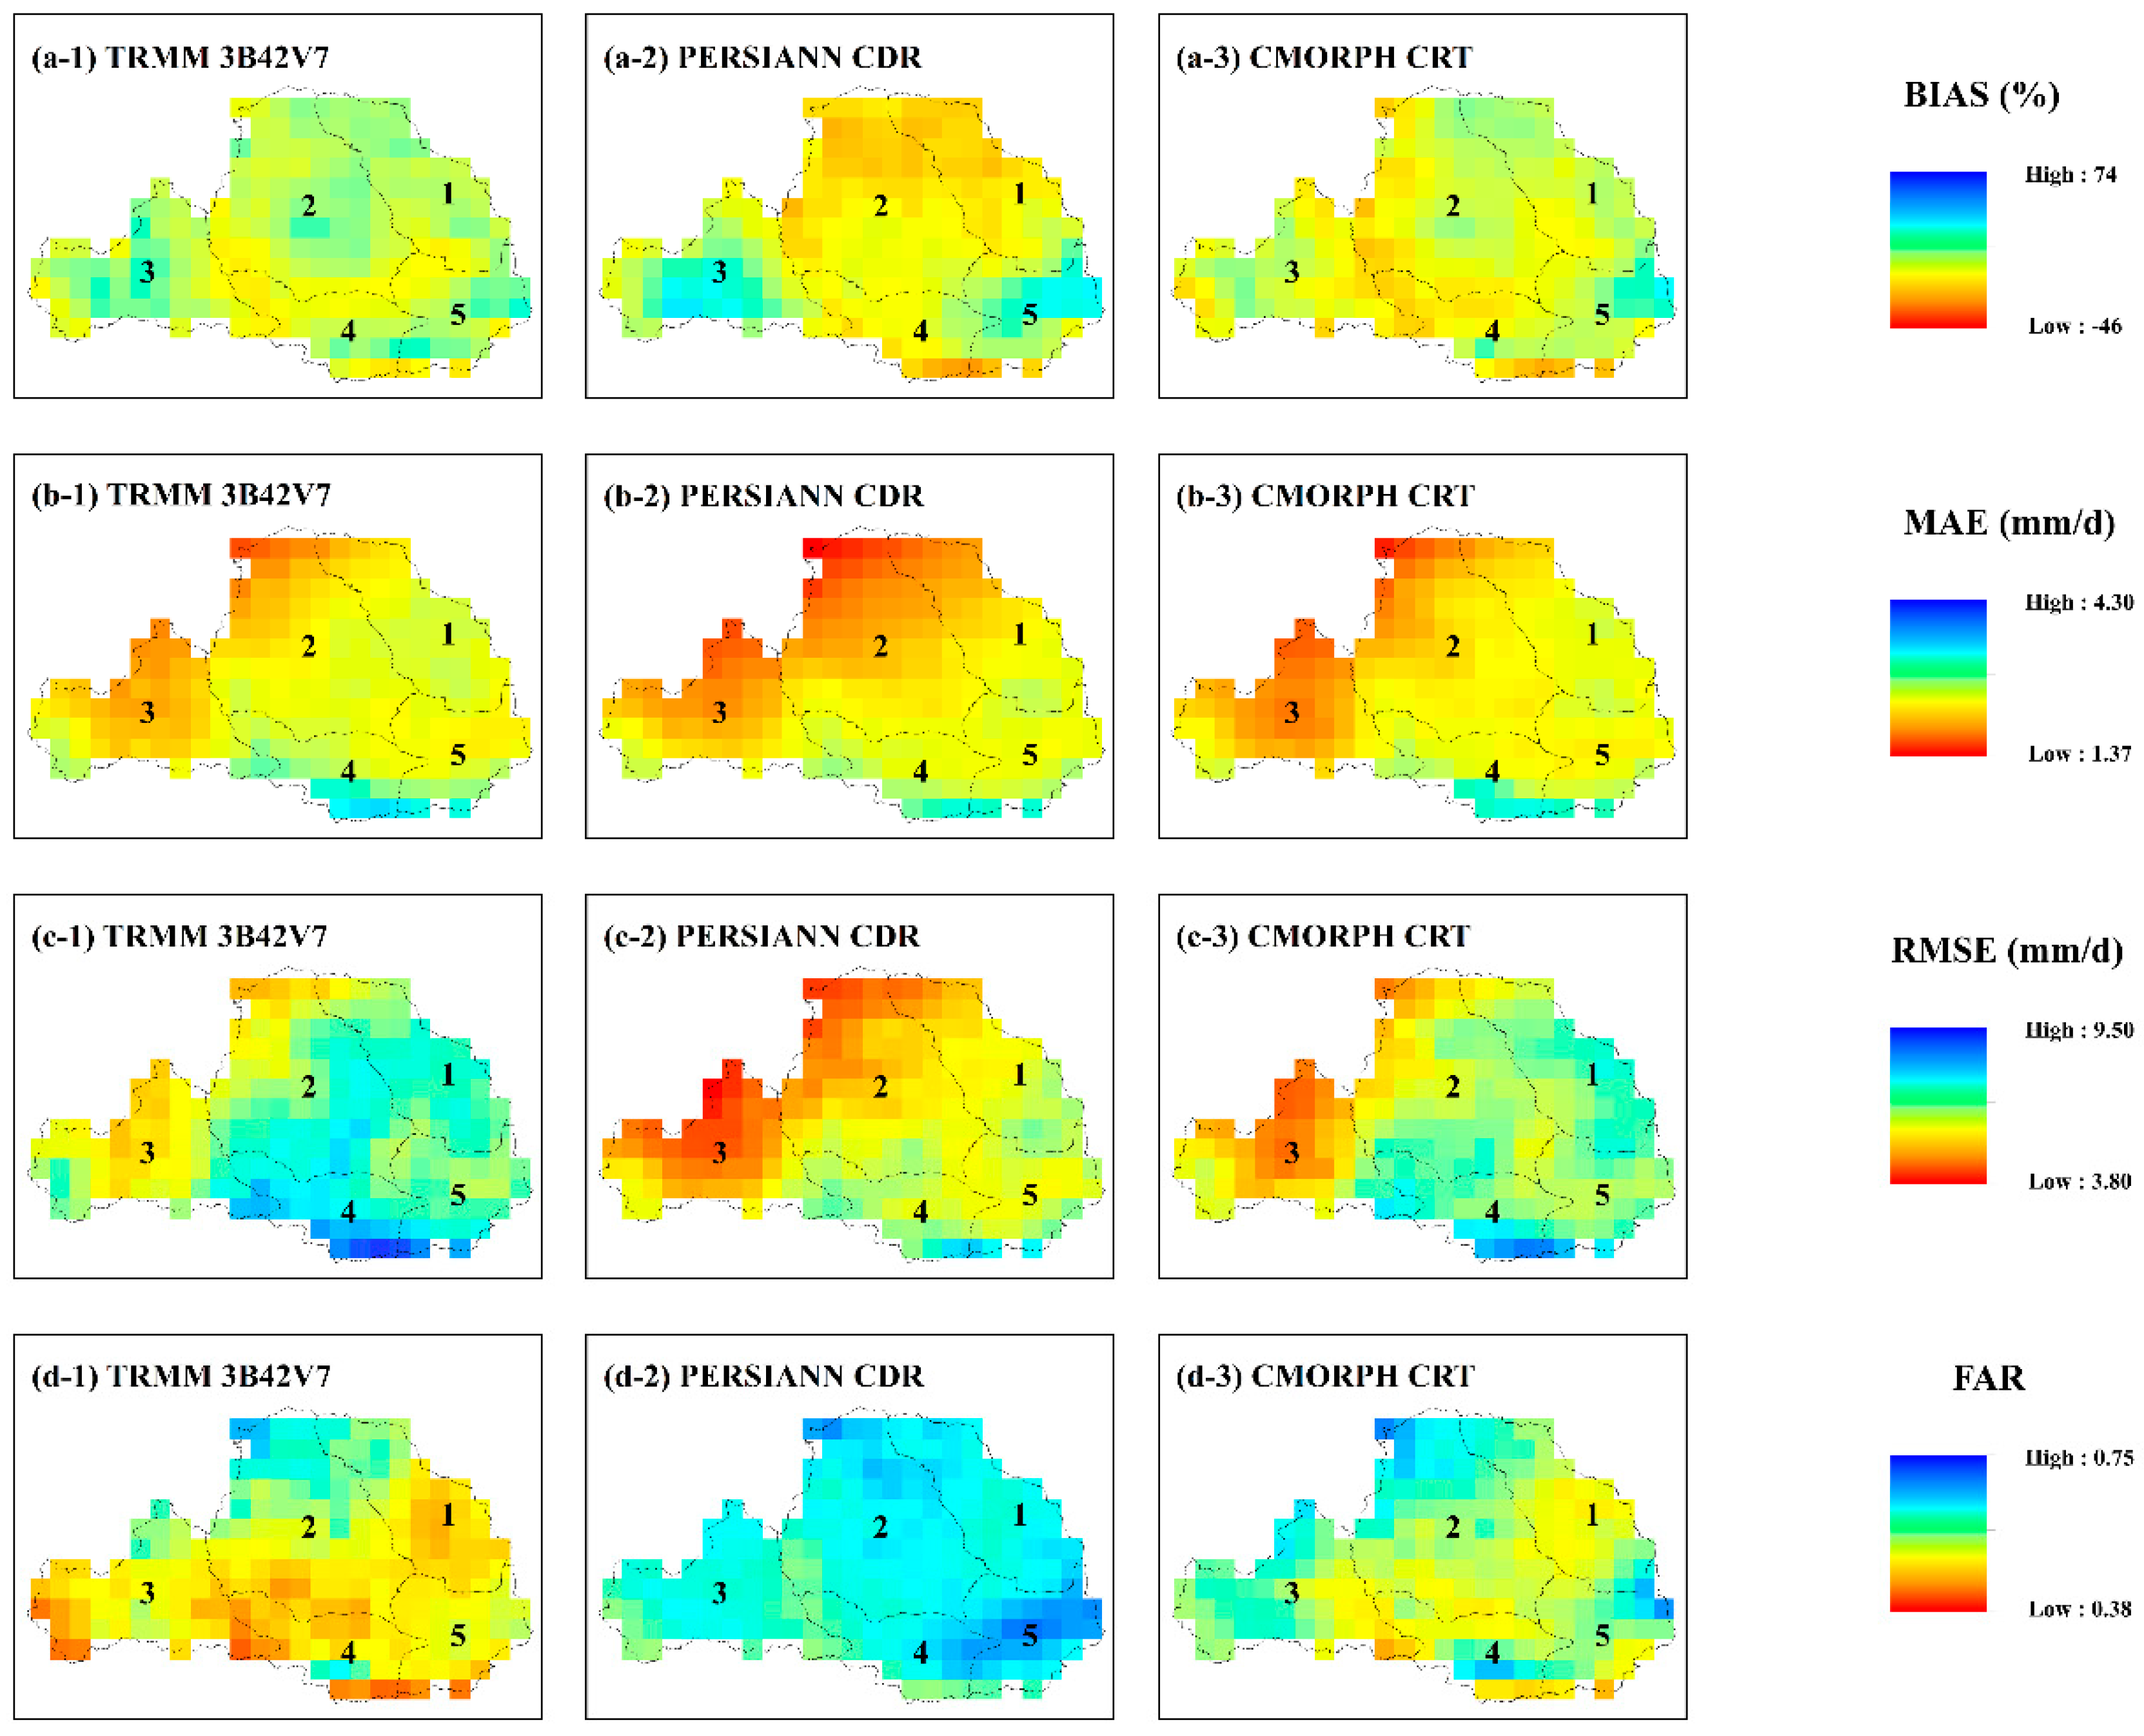
3.2.2. Spatial Analysis of the Capability of SPPs to Capture Extreme Precipitation

After analyzing the average capacity of SPPs to identify extreme precipitation, we look at the spatial distribution patterns for their capture of extreme precipitation events. In view of the results presented above, we chose R0.1 mm, R10 mm, SDII, RX1day, CWD, and CDD for more detailed spatial analysis. Figure 9 shows the spatial distribution of the mean relative error of four indices (R0.1mm, R10mm, SDII and RX1day) for three post real-time products. Figure A2 shows the spatial distribution of the mean relative error of CWD and CDD for three post real-time products. The spatial distribution of the mean relative error of six indices mentioned above for three near real-time products is shown in Figure A3. A positive (negative) mean relative error implies an overestimate (underestimate) with the perfect value being 0.
For R0.1 mm, the overestimation of precipitation days by PERSIANN CDR and two types of CMORPH was noticeably higher than it for TRMM over the whole basin. PERSIANN produced high spatial compilation and overestimated the number of precipitation days (R0.1 mm value) in the western part of the basin and underestimated it in the eastern part of the basin. For R10 mm, the spatial distribution of TRMM 3B42V7 and CMORPH CRT was more uniform, while the other products significantly overestimated or underestimated the moderate precipitation days. For SDII, PERSIANN mainly overestimated the value in the western mountainous area, while CMORPH RAW mainly overestimated the value in the eastern plains. For RX1day, PERSIANN mainly overestimated the value in the western mountains. For most of the indices, any abnormally high values produced by TRMM 3B42RT were corrected by TRMM 3B42V7, with the accuracy of TRMM 3B42RT generally being improved upon. We similarly found that CMORPH CRT improved the accuracy of CMORPH RAW for some indices, including R10 mm, SDII, and RX1day. Comparing the different SPPs in general, TRMM 3B42V7 was better at capturing extreme precipitation characteristics in the Wei River basin than CMORPH CRT and PERSIANN CDR. This is made visible in Figure 9 by the lighter colors over all.
In order to illustrate the spatial distribution information for the mean relative error more clearly, frequency distribution histograms and distribution curves for the mean relative error are presented in Figure 10. As can be seen, the distribution curves for TRMM 3B42V7 for R0.1 mm and R10 mm were more peaked and tighter, with mean values closer to zero. This suggests very small extreme precipitation detection differences across the different grids for these two indices. For SDII and RX1day, the average value of distribution curves for TRMM 3B42V7 and CMORPH CRT were near zero. For CWD, the distribution curves for the two types of TRMM product and two types of CMORPH product were similar, while the curve of PERSIANN CDR had a significant deviation to the right, indicating a large number of overestimates. As for CDD, PERSIANN showed a deviation to the left, while the curves for the other products showed different degrees of right deviation. Overall, for most indicators, the ability of TRMM 3B42V7 to detect extreme precipitation was less uncertain than the other products in spatial terms. CMORPH CRT also performed well, but it overestimated the days of precipitation (R0.1 mm) for many of the grids.

4. Discussion

In this study, we found that the post real-time products (TRMM 3B42V7, CMORPH CRT, and PERSIANN CDR) had a higher precision for the Wei River basin. On a daily scale, TRMM 3B42V7, PERSIANN CDR, and CMORPH CRT had different pros and cons. On a monthly and annual scale, TRMM 3B42V7 performed the best among the six datasets, which coincides with the results for the Yangtze River reported by Li et al. [7]. This can be attributed to the fact that CMORPH CRT uses daily gauge analysis to correct the bias, while TRMM 3B42V7 uses GPCC monthly rain gauge analysis for its corrections. The PERSIANN dataset showed the worst performance for the Wei River basin overall, which is in agreement with other similar studies in the Meichuang basin in China [22]. Li et al. [7] also found a similar result and suspected that it arose from a lack of training of the ANN parameters as PERSIANN was only trained on results from the United States [37]. However, the accuracy of PERSIANN CDR is acceptable, which indicates that it is effective to use measured site data for bias removal procedure. With regard to extreme precipitation detection, the level of agreement between TRMM 3B42V7 and the reference dataset, as measured by the 12 extreme precipitation indices, demonstrated that TRMM 3B42V7 is the most reliable product for capturing extreme precipitation characteristics in the Wei River basin, followed by CMORPH CRT. Additionally, TRMM 3B42V7 showed a more definite capacity to detect extreme precipitation spatially than the other products. However, note that Su et al. [52] indicated that CMORPH CRT had significant advantages over TRMM 3B42V7 for extreme precipitation analysis for the Upper Yellow River because, with its scope for fine time-scale modifications, it was better able to capture heavy precipitation. This difference may be due to the different climate characteristics of the different basins. On the other hand, the poorness of the observational data over the remote areas may have affected the performance of the SPPs.
The Wei River is located in the semi-arid and semi-humid transition zone of China. Compared with other studies that mainly concern heavy precipitation, we have also focused on light precipitation, which may cause drought at the same time. This is mainly reflected in the R0.1 mm, CDD, and CWD indicators. For the R0.1 mm index, four kinds of products (PERSIANN, PERSIANN CDR, CMORPH RAW, CMOPRH CRT) overestimated this index in varying degrees. Especially for PERSIANN CDR, the number of overestimated days was as high as about 100 days. However, PERSIANN CDR had the closest CDD value to the reference data, which suggests that PERSIANN CDR seriously overestimates the precipitation days between 0.1 mm and 1 mm. For the CWD indicator, PERSIANN CDR had the largest deviation (see Figure 10e). Based on the above analysis, we hold the view that using PERSIANN and CMORPH over the Wei River Basin may lead to a too optimistic view regarding the possibilities about drought.
The SPPs were more accurate in the plain areas than in the mountainous areas. Several studies [22,23,29,53] have similarly discovered that the accuracy of SPPs can be affected by topography. There are several possible reasons. First, the precipitation in the mountainous area of the Wei River Basin is mostly orographic rain with a complex convective system, which increases the difficulty of detection for SPPs. The second reason may be, as Hu et al. [23] have suggested, that there is a decrease in the reflective sensitivity of satellite-based sensors when the topography is more complex. Finally, Tan and Duan [54] proposed a possible reason that less GPCC data from complex mountainous terrain were used for the calibration of the TRMM products. A similar situation may have occurred with other post real-time products (CMORPH CRT and PERSIANN CDR) because there are usually fewer observation stations in mountainous areas. The relationship between the precision of SPPs and topography is complex, and the mechanism is not very clear so far. Further research is required.
According to the analysis above, we recommend that both TRMM 3B42V7 and CMORPH CRT may be useful alternatives to gauge data for basins with a similar climate and topography to the Wei River basin. In addition, TRMM 3B42V7 is more suitable for hazard assessment and risk management research than CMORPH CRT, with both PERSIANN and CMORPH potentially underestimating the seriousness of drought situations. When using TRMM products, the continuity of TRMM products should be noted because the instruments on the TRMM satellite ceased operation in April 2015 [36]. As the successor of TRMM, GPM products with a finer spatial and temporal resolution (0.1°and half hour) have attracted wide attention of researchers [36,55]. It may be helpful for monitoring short-duration precipitation in small watersheds [55]. Some studies have found that the ability of GPM to retrieve solid precipitation in high-latitude mountainous areas is also improved [36,54,55]. However, the time series covered by GPM is relatively short (2014–present) and cannot be used for long-term related research. In summary, no product can fully meet the needs of all users. For users of SPPs, it is necessary to select suitable products for different climatic zones and different uses firstly. At the same time, ensemble approaches based on different datasets could effectively improve the accuracy of the products [56]. Thus, a feasible way forward would be to develop and select suitable algorithms that can merge multi-source precipitation products. Some researchers made promising steps in this direction [57,58], though more investigation is needed in the future.

5. Conclusions

In this study, we conducted a comprehensive evaluation of six SPPs including TRMM 3B42RT, TRMM 3B42V7, PERSIANN, PERSIANN CDR, CMORPH RAW, and CMORPH CRT for the Wei River basin in China, using the CGDPA as the reference data. We analyzed the accuracy of the datasets at different temporal scales (daily, monthly, and annual) and at different spatial scales (grid, sub-basin, and whole basin) for the period from 2009 to 2014. We then investigated the ability of the SPPs to detect extreme precipitation.
Our evaluation found that, taking all metrics into account, post real-time products (CMORPH CRT, TRMM 3B42V7, and PERSIANN CDR) are better than near real-time products (CMORPH RAW, TRMM 3B42RT, and PERSIANN), suggesting that combination with measured precipitation data would be effective. On the daily temporal scale, TRMM 3B42V7, CMORPH CRT, and PERSIANN CDR showed a relatively good performance. On the monthly and annual scale, TRMM 3B42V7 offered the highest precision. With regard to the spatial distribution of precipitation, the datasets performed better over plains and were disappointing over mountainous areas. Despite this, TRMM 3B42V7 showed more spatial certainty and more potential than the other datasets for monitoring extreme precipitation. This study provides a basis for the selection of alternative precipitation data for related research in the climate transition basin.

Author Contributions

Conceptualization, J.X. and J.L.; methodology, D.S., J.L., and L.L.; software, J.L.; validation, Q.W. and L.Z; data curation, J.L.; writing—original draft preparation, J.L.; writing—review and editing, D.S. and L.Z.

Funding

This study was supported by the National Key Research and Development Program of China (No. 2016YFC0402709), the National Natural Science Foundation of China (No. 41877159) and the and the Fundamental Research Funds for the Central Universities (grant no. 2042018kf0222).

Acknowledgments

We thank all relevant organizations for providing the precipitation products, namely, the National Meteorological Information Center for CGDPA, the Goddard Earth Sciences Data and Information Services Center for TRMM, the NOAA Climate Prediction Center for CMORPH, and the NOAA NCDC for PERSIANN. Thanks to the Data Sharing Infrastructure of Earth System Sciences (http://www2.geodata.cn/index.html) for offering the GIS data.

Conflicts of Interest

The authors declare no conflict of interest.

Appendix A

Figure A1. The spatial distribution of the four evaluation metrics for the three post real-time products at the daily and grid scale.
Remotesensing 11 01477 g0a1
Figure A2. The spatial distribution of mean relative error of consecutive wet days (CWD) and consecutive wet days (CDD) for the three post real-time products.
Remotesensing 11 01477 g0a2
Figure A3. Spatial distribution of mean relative error of six extreme precipitation indices for the three near real-time products.
Remotesensing 11 01477 g0a3

References

  1. Bell, J.L.; Sloan, L.C.; Snyder, M.A. Regional Changes in Extreme Climatic Events: A Future Climate Scenario. J. Clim. 2004, 17, 81–87. [Google Scholar] [CrossRef]
  2. Zhang, Y.; Xia, J.; She, D. Spatiotemporal variation and statistical characteristic of extreme precipitation in the middle reaches of the Yellow River Basin during 1960–2013. Theor. Appl. Climatol. 2019, 135, 391–408. [Google Scholar] [CrossRef]
  3. She, D.; Shao, Q.; Xia, J.; Taylor, J.A.; Zhang, Y.; Zhang, L.; Zhang, X.; Zou, L. Investigating the variation and non-stationarity in precipitation extremes based on the concept of event-based extreme precipitation. J. Hydrol. 2015, 530, 785–798. [Google Scholar] [CrossRef]
  4. Kunkel, K.E.; Easterling, D.R.; Redmond, K.; Hubbard, K. Temporal variations of extreme precipitation events in the United States: 1895–2000. Geophys. Res. Lett. 2003, 30. [Google Scholar] [CrossRef]
  5. Ali, H.; Mishra, V.; Pai, D.S. Observed and projected urban extreme rainfall events in India. J. Geophys. Res. 2014, 119, 12621–12641. [Google Scholar] [CrossRef]
  6. Mishra, V.; Dominguez, F.; Lettenmaier, D.P. Urban precipitation extremes: How reliable are regional climate models? Geophys. Res. Lett. 2012, 39, 419–420. [Google Scholar] [CrossRef]
  7. Li, Z.; Yang, D.; Hong, Y. Multi-scale evaluation of high-resolution multi-sensor blended global precipitation products over the Yangtze River. J. Hydrol. 2013, 500, 157–169. [Google Scholar] [CrossRef]
  8. Duan, Z.; Liu, J.; Tuo, Y.; Chiogna, G.; Disse, M. Evaluation of eight high spatial resolution gridded precipitation products in Adige Basin (Italy) at multiple temporal and spatial scales. Sci. Total Environ. 2016, 573, 1536–1553. [Google Scholar] [CrossRef] [Green Version]
  9. Javanmard, S.; Yatagai, A.; Nodzu, M.I.; Bodaghjamali, J.; Kawamoto, H. Comparing high-resolution gridded precipitation data with satellite rainfall estimates of TRMM_3B42 over Iran. Adv. Geosci. 2010, 25, 119–125. [Google Scholar] [CrossRef] [Green Version]
  10. Brunetti, M.; Maugeri, M.; Monti, F.; Nannia, T. Temperature and precipitation variability in Italy in the last two centuries from homogenised instrumental time series. Int. J. Climatol. 2006, 26, 345–381. [Google Scholar] [CrossRef]
  11. Chen, X.; Zhang, L.; Gippel, C.J.; Shan, L.; Chen, S.; Yang, W. Uncertainty of Flood Forecasting Based on Radar Rainfall Data Assimilation. Adv. Meteorol. 2016, 2016, 2710457. [Google Scholar] [CrossRef]
  12. Dinku, T.; Anagnostou, E.N.; Borga, M. Improving Radar-Based Estimation of Rainfall over Complex Terrain. J. Appl. Meteor. 2002, 41, 1163–1178. [Google Scholar] [CrossRef]
  13. Xie, P.; Xiong, A.-Y. A conceptual model for constructing high-resolution gauge-satellite merged precipitation analyses. J. Geophys. Res. 2011, 116. [Google Scholar] [CrossRef]
  14. Hong, Y.; Tang, G.; Ma, Y.; Huang, Q.; Han, Z.; Zeng, Z.; Yang, Y.; Wang, C.; Guo, X. Remote Sensing Precipitation: Sensors, Retrievals, Validations, and Applications. In Observation and Measurement; Li, X., Vereecken, H., Eds.; Springer: Berlin/Heidelberg, Germany, 2018; pp. 1–23. ISBN 978-3-662-47871-4. [Google Scholar]
  15. Huffman, G.J.; Adler, R.F.; Bolvin, D.T.; Nelkin, E.J. The TRMM Multi-Satellite Precipitation Analysis (TMPA). In Satellite Rainfall Applications for Surface Hydrology; Springer: Dordrecht, The Netherlands, 2010; pp. 3–22. [Google Scholar]
  16. Joyce, R.J.; Janowiak, J.E.; Arkin, P.A.; Xie, P.P. CMORPH: A method that produces global precipitation estimates from passive microwave and infrared data at high spatial and temporal resolution. J. Hydrometeorol. 2004, 5, 487–503. [Google Scholar] [CrossRef]
  17. Hsu, K.L.; Gao, X.G.; Sorooshian, S.; Gupta, H.V. Precipitation estimation from remotely sensed information using artificial neural networks. J. Appl. Meteorol. 1997, 36, 1176–1190. [Google Scholar] [CrossRef]
  18. Kubota, T.; Ushio, T.; Shige, S.; Kida, S.; Kachi, M.; Okamoto, K. Verification of High-Resolution Satellite-Based Rainfall Estimates around Japan Using a Gauge-Calibrated Ground-Radar Dataset. J. Meteorol. Soc. Jpn. 2009, 87, 203–222. [Google Scholar] [CrossRef]
  19. Hou, A.Y.; Kakar, R.K.; Neeck, S.; Azarbarzin, A.A.; Kummerow, C.D.; Kojima, M.; Oki, R.; Nakamura, K.; Iguchi, T. The Global Precipitation Measurement Mission. Bull. Am. Meteorol. Soc. 2013, 95, 701–722. [Google Scholar] [CrossRef]
  20. Turk, F.J.; Miller, S.D. Toward improved characterization of remotely sensed precipitation regimes with MODIS/AMSR-E blended data techniques. IEEE Trans. Geosci. Remote Sens. 2005, 43, 1059–1069. [Google Scholar] [CrossRef]
  21. Funk, C.; Peterson, P.; Landsfeld, M.; Pedreros, D.; Verdin, J.; Shukla, S.; Husak, G.; Rowland, J.; Harrison, L.; Hoell, A. The climate hazards infrared precipitation with stations—A new environmental record for monitoring extremes. Sci. Data 2015, 2, 150066. [Google Scholar] [CrossRef]
  22. Liu, J.; Duan, Z.; Jiang, J.; Zhu, A.-X. Evaluation of Three Satellite Precipitation Products TRMM 3B42, CMORPH, and PERSIANN over a Subtropical Watershed in China. Adv. Meteorol. 2015, 2015, 151239. [Google Scholar] [CrossRef]
  23. Hu, Q.; Yang, D.; Wang, Y.; Yang, H. Accuracy and spatio-temporal variation of high resolution satellite rainfall estimate over the Ganjiang River Basin. Sci. China Technol. Sci. 2013, 56, 853–865. [Google Scholar] [CrossRef]
  24. Yang, N.; Zhang, K.; Hong, Y.; Zhao, Q.; Huang, Q.; Xu, Y.; Xue, X.; Chen, S. Evaluation of the TRMM multisatellite precipitation analysis and its applicability in supporting reservoir operation and water resources management in Hanjiang basin, China. J. Hydrol. 2017, 549, 313–325. [Google Scholar] [CrossRef]
  25. Ebrahimi, S.; Chen, C.; Chen, Q.; Zhang, Y.; Ma, N.; Zaman, Q. Effects of temporal scales and space mismatches on the TRMM 3B42 v7 precipitation product in a remote mountainous area. Hydrol. Process. 2017, 31, 4315–4327. [Google Scholar] [CrossRef]
  26. Qu, W.; Lu, J.; Pang, Z. Assessment of TRMM Satellite Precipitation Data and Its Impacts on the Water Balance of the Heihe River Basin. In Proceedings of the PIAGENG 2013: Intelligent Information, Control, and Communication Technology for Agricultural Engineering; Tan, H., Ed.; SPIE: Bellingham, WA, USA, 2013; Volume 8762, p. 87620R. [Google Scholar]
  27. Huang, X.; Wang, D.; Liu, Y.; Feng, Z.; Wang, D. Evaluation of extreme precipitation based on satellite retrievals over China. Front. Earth Sci. 2018, 12, 846–861. [Google Scholar] [CrossRef]
  28. Shen, Y.; Xiong, A.; Wang, Y.; Xie, P. Performance of high-resolution satellite precipitation products over China. J. Geophys. Res. 2010, 115. [Google Scholar] [CrossRef]
  29. Hirpa, F.A.; Gebremichael, M.; Hopson, T. Evaluation of High-Resolution Satellite Precipitation Products over Very Complex Terrain in Ethiopia. J. Appl. Meteorol. Climatol. 2010, 49, 1044–1051. [Google Scholar] [CrossRef]
  30. Ghajarnia, N.; Liaghat, A.; Arasteh, P.D. Comparison and evaluation of high resolution precipitation estimation products in Urmia Basin-Iran. Atmos. Res. 2015, 158, 50–65. [Google Scholar] [CrossRef]
  31. Miao, C.; Ashouri, H.; Hsu, K.-L.; Sorooshian, S.; Duan, Q. Evaluation of the PERSIANN-CDR Daily Rainfall Estimates in Capturing the Behavior of Extreme Precipitation Events over China. J. Hydrometeorol. 2015, 16, 1387–1396. [Google Scholar] [CrossRef] [Green Version]
  32. Katiraie-Boroujerdy, P.-S.; Asanjan, A.A.; Hsu, K.-L.; Sorooshian, S. Intercomparison of PERSIANN-CDR and TRMM-3B42V7 precipitation estimates at monthly and daily time scales. Atmos. Res. 2017, 193, 36–49. [Google Scholar] [CrossRef] [Green Version]
  33. Faridzad, M.; Yang, T.; Hsu, K.; Sorooshian, S.; Xiao, C. Rainfall frequency analysis for ungauged regions using remotely sensed precipitation information. J. Hydrol. 2018, 563, 123–142. [Google Scholar] [CrossRef] [Green Version]
  34. Casse, C.; Gosset, M. Analysis of hydrological changes and flood increase in Niamey based on the PERSIANN-CDR satellite rainfall estimate and hydrological simulations over the 1983–2013 period. In Proceedings of the Changes in Flood Risk and Perception in Catchments and Cities; Rogger, M., Aksoy, H., Kooy, M., Schumann, A., Toth, E., Chen, Y., Estupina, V.B., Bloschl, G., Eds.; Copernicus Gesellschaft MBH: Gottingen, Germany, 2015; Volume 370, pp. 117–123. [Google Scholar]
  35. Guo, H.; Bao, A.; Liu, T.; Chen, S.; Ndayisaba, F. Evaluation of PERSIANN-CDR for Meteorological Drought Monitoring over China. Remote Sens. 2016, 8, 379. [Google Scholar] [CrossRef]
  36. Tang, G.; Ma, Y.; Long, D.; Zhong, L.; Hong, Y. Evaluation of GPM Day-1 IMERG and TMPA Version-7 legacy products over Mainland China at multiple spatiotemporal scales. J. Hydrol. 2016, 533, 152–167. [Google Scholar] [CrossRef]
  37. Tian, Y.; Peters-Lidard, C.D.; Adler, R.F.; Kubota, T.; Ushio, T. Evaluation of GSMaP Precipitation Estimates over the Contiguous United States. J. Hydrometeorol. 2010, 11, 566–574. [Google Scholar] [CrossRef]
  38. Tan, M.L.; Ibrahim, A.L.; Duan, Z.; Cracknell, A.P.; Chaplot, V. Evaluation of Six High-Resolution Satellite and Ground-Based Precipitation Products over Malaysia. Remote Sens. 2015, 7, 1504–1528. [Google Scholar] [CrossRef] [Green Version]
  39. Zhu, Q.; Xuan, W.; Liu, L.; Xu, Y.-P. Evaluation and hydrological application of precipitation estimates derived from PERSIANN-CDR, TRMM 3B42V7, and NCEP-CFSR over humid regions in China. Hydrol. Process. 2016, 30, 3061–3083. [Google Scholar] [CrossRef]
  40. Pombo, S.; de Oliveira, R.P. Evaluation of extreme precipitation estimates from TRMM in Angola. J. Hydrol. 2015, 523, 663–679. [Google Scholar] [CrossRef]
  41. Katiraie-Boroujerdy, P.-S.; Ashouri, H.; Hsu, K.; Sorooshian, S. Trends of precipitation extreme indices over a subtropical semi-arid area using PERSIANN-CDR. Theor. Appl. Climatol. 2017, 130, 249–260. [Google Scholar] [CrossRef]
  42. Zuo, D.; Xu, Z.; Wu, W.; Zhao, J.; Zhao, F. Identification of Streamflow Response to Climate Change and Human Activities in the Wei River Basin, China. Water Resour. Manag. 2014, 28, 833–851. [Google Scholar] [CrossRef]
  43. Chang, J.; Wang, Y.; Istanbulluoglu, E.; Bai, T.; Huang, Q.; Yang, D.; Huang, S. Impact of climate change and human activities on runoff in the Weihe River Basin, China. Quat. Int. 2015, 380–381, 169–179. [Google Scholar] [CrossRef]
  44. Shen, Y.; Xiong, A. Validation and comparison of a new gauge-based precipitation analysis over mainland China. Int. J. Climatol. 2016, 36, 252–265. [Google Scholar] [CrossRef]
  45. Sun, R.; Yuan, H.; Liu, X.; Jiang, X. Evaluation of the latest satellite-gauge precipitation products and their hydrologic applications over the Huaihe River basin. J. Hydrol. 2016, 536, 302–319. [Google Scholar] [CrossRef]
  46. Zhao, T.; Yatagai, A. Evaluation of TRMM 3B42 product using a new gauge-based analysis of daily precipitation over China. Int. J. Climatol. 2014, 34, 2749–2762. [Google Scholar] [CrossRef]
  47. Ma, J.; Sun, W.; Yang, G.; Zhang, D. Hydrological Analysis Using Satellite Remote Sensing Big Data and CREST Model. IEEE Access 2018, 6, 9006–9016. [Google Scholar] [CrossRef]
  48. Ebert, E.E.; Janowiak, J.E.; Kidd, C. Comparison of near-real-time precipitation estimates from satellite observations and numerical models. Bull. Am. Meteorol. Soc. 2007, 88, 47–64. [Google Scholar] [CrossRef]
  49. Conti, F.L.; Hsu, K.L.; Noto, L.V.; Sorooshian, S. Evaluation and comparison of satellite precipitation estimates with reference to a local area in the Mediterranean Sea. Atmos. Res. 2014, 138, 189–204. [Google Scholar] [CrossRef] [Green Version]
  50. You, Q.; Kang, S.; Aguilar, E.; Pepin, N.; Fluegel, W.-A.; Yan, Y.; Xu, Y.; Zhang, Y.; Huang, J. Changes in daily climate extremes in China and their connection to the large scale atmospheric circulation during 1961–2003. Clim. Dyn. 2011, 36, 2399–2417. [Google Scholar] [CrossRef]
  51. Sun, W.; Mu, X.; Song, X.; Wu, D.; Cheng, A.; Qiu, B. Changes in extreme temperature and precipitation events in the Loess Plateau (China) during 1960–2013 under global warming. Atmos. Res. 2016, 168, 33–48. [Google Scholar] [CrossRef]
  52. Su, J.; Lue, H.; Wang, J.; Sadeghi, A.M.; Zhu, Y. Evaluating the Applicability of Four Latest Satellite-Gauge Combined Precipitation Estimates for Extreme Precipitation and Streamflow Predictions over the Upper Yellow River Basins in China. Remote Sens. 2017, 9, 1176. [Google Scholar] [CrossRef]
  53. Hong, Y.; Gochis, D.; Cheng, J.-T.; Hsu, K.-L.; Sorooshian, S. Evaluation of PERSIANN-CCS rainfall measurement using the NAME Event Rain Gauge Network. J. Hydrometeorol. 2007, 8, 469–482. [Google Scholar] [CrossRef]
  54. Tan, M.; Duan, Z. Assessment of GPM and TRMM Precipitation Products over Singapore. Remote Sens. 2017, 9, 720. [Google Scholar] [CrossRef]
  55. Chen, C.; Chen, Q.; Duan, Z.; Zhang, J.; Mo, K.; Li, Z.; Tang, G. Multiscale Comparative Evaluation of the GPM IMERG v5 and TRMM 3B42 v7 Precipitation Products from 2015 to 2017 over a Climate Transition Area of China. Remote Sens. 2018, 10, 944. [Google Scholar] [CrossRef]
  56. Raftery, A.E.; Gneiting, T.; Balabdaoui, F.; Polakowski, M. Using Bayesian model averaging to calibrate forecast ensembles. Mon. Weather Rev. 2005, 133, 1155–1174. [Google Scholar] [CrossRef]
  57. Ma, Y.; Hong, Y.; Chen, Y.; Yang, Y.; Tang, G.; Yao, Y.; Long, D.; Li, C.; Han, Z.; Liu, R. Performance of Optimally Merged Multisatellite Precipitation Products Using the Dynamic Bayesian Model Averaging Scheme Over the Tibetan Plateau. J. Geophys. Res. 2018, 123, 814–834. [Google Scholar] [CrossRef]
  58. Beck, H.E.; van Dijk, A.I.J.M.; Levizzani, V.; Schellekens, J.; Miralles, D.G.; Martens, B.; de Roo, A. MSWEP: 3-hourly 0.25 degrees global gridded precipitation (1979–2015) by merging gauge, satellite, and reanalysis data. Hydrol. Earth Syst. Sci. 2017, 21, 589–615. [Google Scholar] [CrossRef]
Figure 1. (a) Geographical location of the study area. (b) Elevation, river network and the sub-basins in the Wei River basin. The whole basin is divided into five sub-basins: 1. The Beiluo River; 2. The Jing River; 3. The upper reach of the Wei River basin; 4. The middle reach of the Wei River basin; and 5. The lower reach of the Wei River basin.
Remotesensing 11 01477 g001
Figure 2. Statistical results of (a) R, (b) MAE, (c) RMSE, (d) BIAS, (e) POD, (f) FAR and (g) CSI of the six SPPs for daily precipitation at different spatial scales.
Remotesensing 11 01477 g002
Figure 3. The spatial distribution of the three evaluation metrics (a-1, a-2, a-3) R, (b-1, b-2, b-3) POD and (c-1, c-2, c-3) CSI for the three post real-time products at the daily and grid scale.
Remotesensing 11 01477 g003
Figure 4. Monthly precipitation scatter plots for the reference data vs. the six SPPs (a) TRMM 3B42RT, (b) TRMM 3B42V7, (c) PERSIANN, (d) PERSIANN CDR, (e) CMORPH RAW and (f) CMORPH CRT at a grid scale.
Remotesensing 11 01477 g004
Figure 5. Temporal distribution of the monthly precipitation estimates over the whole basin.
Remotesensing 11 01477 g005
Figure 6. Annual precipitation scatter plots for the reference data vs. the six SPPs (a) TRMM 3B42RT, (b) TRMM 3B42V7, (c) PERSIANN, (d) PERSIANN CDR, (e) CMORPH RAW and (f) CMORPH CRT at a grid scale.
Remotesensing 11 01477 g006
Figure 7. Boxplots for the six absolute threshold indices (a) R0.1mm, (b) R10mm, (c) R12mm, (d) R25mm, (e) PRCPTOP and (f) SDII for the reference data and the six SPPs. The upper and lower edges of the box mark the upper and lower quartiles (75% and 25%, respectively). The solid line in the box marks the median value. The uppermost and lowermost horizontal lines mark the 1.5I QR outliers. The point marks the average value.
Remotesensing 11 01477 g007
Figure 8. Boxplots for the four maximum indices (a) RX1day, (b) RX5days, (c) CWD and (d) CDD and two percentile indices (e) R95p and (f) R99p for the reference data and the six SPPs.
Remotesensing 11 01477 g008
Figure 9. Spatial distribution of mean relative error of the four extreme precipitation indices (a-1, a-2, a-3) R0.1mm, (b-1, b-2, b-3) R10mm, (c-1, c-2, c-3) SDII and (d-1, d-2, d-3) RX1day for the three post real-time products.
Remotesensing 11 01477 g009
Figure 10. Extreme precipitation index (a) R0.1mm, (b) R10mm, (c) SDII, (d) RX1day, (e) CWD and (f) CDD frequency distribution histograms and distribution curves for the six SPPs.
Remotesensing 11 01477 g010
Table 1. Summary of the six satellite-based precipitation products (SPPs) used in this study.
DatasetPeriodResolutionCoverageCategoryLatency
TRMM 3B42RT1998 to 20150.25°/3h60°N–60°SPMW plus IR, Satellite-only9 hours
TRMM 3B42V71998 to 20150.25°/3h50°N–50°SPMW plus IR, Satellite-gauge10–15 days after the end of each month
PERSIANN2000 to present0.25°/3h60°N–60°SIR, Satellite-only2 days
PERSIANN CDR1983 to present0.25°/3h60°N–60°SPMW plus IR, Satellite-gaugeabout 6 months
CMORPH RAW1998 to present0.25°/3h60°N–60°SPMW plus IR, Satellite-only18 hours
CMORPH CRT1998 to present0.25°/3h60°N–60°SPMW plus IR, Satellite-gaugeabout 5 months
Notes: The latency for post real-time products may be variable due to the availability of its inputs.
Table 2. Detailed information regarding the twelve extreme precipitation indices.
IndexDescriptive NameDefinitionUnits
R0.1mmNumber of precipitation daysAnnual count of days when RR ≥ 0.1 mmday
R10mmNumber of moderate precipitation daysAnnual count of days when RR ≥ 10 mmday
R12mmNumber of erosion precipitation daysAnnual count of days when RR ≥ 12 mmday
R25mmNumber of heavy precipitation daysAnnual count of days when RR ≥ 25 mmday
PRCPTOTWet-day precipitationTotal precipitation on days when RR ≥1 mmmm
SDIISimple daily intensity indexTotal rainfall divided by the number of wet daysmm/day
RX1dayMaximum 1-day precipitationMaximum 1-day rainfall totalmm
RX5dayMaximum 5-day precipitationMaximum 5-day rainfall totalmm
CWDConsecutive wet daysMaximum number of consecutive wet daysday
CDDConsecutive dry daysMaximum number of consecutive dry daysday
R95pVery wet dayTotal rainfall due to events exceeding the 95th percentilemm
R99pExtreme very wet dayTotal rainfall due to events exceeding the 99th percentilemm
Notes: A dry (or wet) day is defined as being where the daily precipitation is lower (or no less) than 1 mm/day, RR refers to the daily amount of precipitation.
Table 3. SPP evaluation results at a monthly scale with different spatial scales.
Spatial ScaleMetricTRMM 3B42RTTRMM 3B42V7PERSIANNPERSIANN CDRCMORPH RAWCMORPH CRT
GridR0.81 0.94 0.17 0.89 0.78 0.87
MAE (mm/d)0.76 0.41 1.39 0.49 0.71 0.57
RMSE (mm/d)1.16 0.66 1.94 0.85 1.20 0.90
Sub-basinR0.85 0.94 0.14 0.90 0.81 0.89
MAE (mm/d)0.66 0.36 1.34 0.44 0.63 0.48
RMSE (mm/d)0.99 0.67 1.85 0.77 1.07 0.80
Whole basinR0.92 0.99 0.14 0.97 0.87 0.96
MAE (mm/d)0.52 0.19 1.33 0.28 0.57 0.34
RMSE (mm/d)0.67 0.29 1.76 0.47 0.93 0.49
Table 4. SPP evaluation results at an annual scale at a grid scale.
MetricTRMM 3B42RTTRMM 3B42V7PERSIANNPERSIANN CDRCMORPH RAWCMORPH CRT
R0.72 0.87 0.33 0.71 0.71 0.75
MAE (mm/d)0.31 0.18 0.31 0.22 0.32 0.22
RMSE (mm/d)0.39 0.22 0.43 0.29 0.41 0.28
Table 5. Comparison of extreme precipitation indices for the reference data and the six SPPs.
MetricReference DataTRMM 3B42RTTRMM 3B42V7PERSIANNPERSIANN CDRCMORPH RAWCMORPH CRT
R0.1 mm(days)88.25 89.66 91.15 157.66 187.05 125.00 122.44
R10 mm(days)18.28 21.98 18.89 11.05 12.22 13.07 17.37
R12 mm(days)14.88 18.05 15.46 7.85 8.89 9.98 13.86
R25 mm(days)4.53 5.49 5.29 1.07 2.01 1.92 3.84
CWD(days)5.96 5.25 4.96 6.13 8.23 5.10 5.38
CDD(days)38.47 52.18 51.22 22.02 40.42 56.70 54.96
PRCPTOT577.80 666.30 604.62 496.77 545.58 452.88 557.01
RX1day(mm)51.46 55.00 55.06 28.20 35.81 34.98 47.58
RX5day(mm)175.26 190.51 190.33 103.32 121.72 121.30 163.49
R95(mm)386.29 427.74 411.56 243.90 273.42 278.04 361.17
R99(mm)149.99 162.94 162.88 87.62 104.47 103.31 139.79
SDII(mm/day)8.57 9.54 9.29 5.16 5.17 6.61 8.07
Mean Absolute Error/15.53 8.58 40.68 31.73 35.07 10.51

