Contrasting Aerosol Optical Characteristics and Source Regions During Summer and Winter Pollution Episodes in Nanjing, China


1
Key Laboratory of Meteorological Disaster, Ministry of Education (KLME)/Joint International Research Laboratory of Climate and Environment Change (ILCEC)/Collaborative Innovation Center on Forecast and Evaluation of Meteorological Disasters (CIC-FEMD)/Key Laboratory for Aerosol-Cloud-Precipitation of China Meteorological Administration, Nanjing University of Information Science and Technology, Nanjing 210044, China
2
Finnish Meteorological Institute (FMI), Climate Research Programme, FI - 00101 Helsinki, Finland
*
Author to whom correspondence should be addressed.
Remote Sens. 2019, 11(14), 1696; https://doi.org/10.3390/rs11141696
Submission received: 17 May 2019
/
Revised: 12 July 2019
/
Accepted: 15 July 2019
/
Published: 17 July 2019
(This article belongs to the Special Issue Remote Sensing of Air Quality)
Abstract
:Two episodes with heavy air pollution in Nanjing, China, one in the summer and another one in the winter of 2017, were selected to study aerosol properties using sun photometer and ground-based measurements, together with source region analysis. The aerosol properties, the meteorological conditions, and the source regions during these two episodes were very different. The episodes were selected based on the air quality index (AQI), which reached a maximum value of 193 during the summer episode (26 May–3 June) and 304 during the winter episode (21–31 December). The particulate matter (PM) concentrations during the winter episode reached maximum values for PM2.5/10 of 254 μg m−3 and 345 μg m−3, much higher than those during the summer (73 and 185 μg m−3). In contrast, the value of aerosol optical depth (AOD) at 500 nm was higher during the summer episode (2.52 ± 0.19) than during that in the winter (1.38 ± 0.18). A high AOD value does not necessarily correspond to a high PM concentration but is also affected by factors, such as wind, Planetary Boundary Layer Height (PBLH), and relative humidity. The mean value of the Ångström Exponent (AE) varied from 0.91–1.42, suggesting that the aerosol is a mixture of invaded dust and black carbon. The absorption was stronger during the summer than during the winter, with a minimum value of the single scattering albedo (SSA) at 440 nm of 0.86 on 28 May. Low values of asymmetry factor (ASY) (0.65 at 440 nm and 0.58 at 1020 nm) suggest a large number of anthropogenic aerosols, which are absorbing fine-mode particles. The Imaginary part of the Refractive Index (IRI) was higher during the summer than during the winter, indicating there was absorbing aerosol during the summer. These differences in aerosol properties during the summer and winter episodes are discussed in terms of meteorological conditions and transport. The extreme values of PM and AOD were reached during both episodes in conditions with stable atmospheric stratification and low surface wind speed, which are conducive for the accumulation of pollutants. Potential source contribution function (PSCF) and concentration weighted trajectory (CWT) analysis show that fine mode absorbing aerosols dominate during the summer season, mainly due to emissions of local and near-by sources. In the winter, part of the air masses was arriving from arid/semi-arid regions (Shaanxi, Ningxia, Gansu, and Inner Mongolia provinces) covering long distances and transporting coarse particles to the study area, which increased the scattering characteristics of aerosols.
1. Introduction
Air quality in China varies throughout the country with local hotspots and high concentrations of aerosols and trace gases in regions with a high degree of industrialization and urbanization and related activities, such as high traffic density, augmented by local geographical and meteorological conditions conducive for the formation of haze [1,2]. The aerosol and trace gas concentrations have been increasing over the years until about 2006 when air pollution control policies were implemented, in China, and the concentrations of SO2 started to decrease in 2007/2008 [3,4]. Aerosol concentrations were observed to decrease from 2011 [5,6], and NO2 decreased from 2014 [7,8]. Nevertheless, episodes of haze formation appear to occur more frequently [9] with changing meteorological conditions as one of the major causes [10]. The total number of aerosol particles produced by combustion of oil, coal, and waste in the atmosphere has changed significantly [11]. Major factors contributing to aerosol loading during heavy pollution episodes include direct emissions [12], such as from combustion processes, traffic, straw burning, and dust storms, and the formation of aerosol particles from precursor gases. The concentrations may be further augmented due to aerosol dynamical processes and meteorological influences. Physical, chemical, and optical properties of aerosol particles are modified by hygroscopic growth [13].
As a consequence of these processes, the aerosol environment is extraordinarily complex, especially in urban agglomerations and megacities [14,15,16,17,18]. The optical properties, concentrations, chemical composition, and size distributions of aerosol particles can be measured in detail with a variety of different instruments. However, such instruments can only be deployed at fixed locations, which are representative of a certain area. Gaps between these local observations can be filled by mobile monitoring facilities, such as vehicles or aircraft, which, however, cannot provide continuous measurements. Therefore, aerosol observations on regional or global scales mainly rely on the use of satellites. Satellite observations provide column-integrated data on several aerosol properties, the quality of which varies with the instrument characteristics and the algorithm used for their retrieval [19], for large areas with a repeat cycle of up to daily for instruments with a wide enough swath. However, they are not as detailed and accurate as local observations using in situ measurements or surface-based remote sensing instruments [20,21]. The measurements from ground-based remote sensing networks, such as the global Aerosol Robotic Network (AERONET) [22], the China Aerosol Remote Sensing Network (CARSNET) [23,24], or Sun–Sky Radiometer Observation Network (SONET) [25] can be used to calculate the column aerosol optical depth (AOD), Angstrom Exponent (AE), single scattering albedo (SSA), asymmetry factor (ASY), the Real and Imaginary parts of the Refractive Index (RRI and IRI), and volume size distribution (VSD). In addition, the Campaign on Atmospheric Aerosol Research network of China (CARE-China) network provides physical, chemical, and optical properties of aerosol particles using both hand-held sun photometer data and in situ measurements [26].
In addition to aerosols, also trace gases (O3, NO2, SO2, CO) have an adverse effect on air quality. Thus, the air quality index (AQI) was launched by the Ministry of Environmental Protection of China in 2012 to quantify air quality for the purpose of air pollution monitoring and evaluation [27,28]. Following the new ambient air quality standard (GB3095-2012), AQI is a dimensionless index, which includes six components: SO2, NO2, O3, PM2.5, PM10, and CO (http://www.mee.gov.cn/). The higher the AQI value, the more serious the effect of air pollution, which not only affects people’s outdoor activities but also endangers human health [29]. Both the intensity of air pollution and the number of pollution days (days with AQI > 100) exhibit clearly increasing trends due to both local aerosol emissions and long-range transport of particulates from remote sources [30,31,32]. To improve air quality, in particular, our understanding of the effects of aerosols on climate and climate change, the aerosol optical properties (which are related to aerosol emissions), particle size distributions, vertical profiles, chemical composition, and mixing state need to be determined. In particular, contributions of different sources to the AQI need to be identified for the implementation of legislation for effective emission reduction. In the current study, AQI is mainly used to identify air pollution episodes.
East China is one of the regions in China with ongoing urbanization where air pollution and the variety of aerosols contributing to air pollution are manifold and increasing [31,33,34,35,36,37,38,39]. Concentrations of atmospheric pollutants have varied considerably during the past decades [40]. Therefore, it is of great importance to study the relative contributions from different emission sources in support of developing regulations to improve air quality in this region. This can be achieved by the analysis of local aerosol measurements in relation to different emission sources and transport pathways. As an example, in this study, we used aerosol measurements in Nanjing in the Yangtze River Delta (YRD), eastern China, to determine the source regions and their contributions to air pollution for two episodes, one in the summer and another one in the winter. We used sun photometer data from which aerosol optical and physical properties were retrieved, together with aerosol mass concentrations PM2.5 and PM10 from a local network. PM2.5/10 is the dry mass of particulate matter, i.e., aerosol particles, sampled with an in situ diameter smaller than 2.5 or 10 µm, respectively, which are brought in an environment at low relative humidity before their mass is determined.
The transport of aerosol particles from remote sources, enhancing pollution levels in urban areas, is usually studied by the use of backward air mass trajectories, describing the pathways of incoming air masses and, thus, identifying the potential location of the emission source regions and their strengths [41]. Through backward trajectory analysis, we can distinguish when crop straw burning or transportation from remote sources dominate the aerosol concentrations. In this study, the relative influences of emission sources located upwind of the receptor sites on the local concentrations have been analyzed using the Potential Source Contribution Function (PSCF) model. In order to successfully identify the source strengths, also the Concentration Weighted Trajectory (CWT) model has been used. The methods are described in Section 2, and the results are discussed in Section 3.
2. Methodology
2.1. Overview of the Study Area
The study is based on observations in Nanjing, the capital of the Jiangsu Province, located in the northwestern part of the YRD to the west of the East China Sea (Figure 1). The main site is located at the Nanjing University of Information Science and Technology (NUIST), situated to the NW of Nanjing, as shown in the inset of Figure 1. Measurements of aerosol optical and physical properties at NUIST are influenced by local sources, such as emissions from the Nanjing urban area, including urban-industrial pollution sources within a 12 km radius and several major roads with associated vehicle emissions. The measurements in Nanjing are also influenced by aerosol particles and trace gases emitted by remote sources and transported to Nanjing by the wind. The prevailing wind direction (WD) during the summer is southeasterly, i.e., from the Pacific Ocean, and, in the winter, it is from the northwest transporting air masses from mainland China and the desert areas in the NW.
2.2. Observational Data
The automatic sun/sky radiometer (CE-318) manufactured by CIMEL Electronique is located on the roof of a tall building in the NUIST campus (118.72°E, 32.21°N), at an altitude of 62 m above the surface. The direct solar radiance observations at wavelengths from the ultraviolet to the near-infrared (340, 380, 440, 500, 675, 870, 940, and 1020 nm) are used to retrieve the AOD, AE, and precipitable water vapor (PWV) with a 1.2° full field-of-view. The sky radiance observations at wavelengths of 440, 675, 870, and 1020 nm are used to retrieve the SSA, ASY, RRI, IRI, and VSD. Yearly calibrations of the instruments ensure the accuracy of the measurements [22]. Detailed information on the sun photometer characteristics, operational procedures, data processing, and retrieval method are available from the AERONET website (https://aeronet.gsfc.nasa.gov/); detail on the NUIST sun photometer procedures and a data overview is provided by Wang et al. [43]. The time periods studied were two episodes, one in the summer and one in the winter of 2017, selected from the observations, as described in Section 3.1.
Hourly averaged meteorological parameters are derived from a World Wide Web-based meteorological variables for a geographical region (http://wunderground.com). The AQI data used in this paper were derived from local measurements in the Nanjing urban area at the nine national control monitoring stations in Nanjing, the locations of which are shown in the inset of Figure 1 (see Table 1 for their geographical coordinates). These stations are part of the China Environmental Monitoring Station “national urban air quality real-time publishing platform” (http://beijingair.sinaapp.com, in Chinese) and include 6 major atmospheric pollutants: CO, NO2, O3, PM10, PM2.5, and SO2.
2.3. Air Mass Trajectory Model
The sources of the aerosols measured in Nanjing were identified by using statistical analysis of air mass back trajectories combined with long-term ambient air pollution measurements. Air mass back trajectories were computed using the HYSPLIT (Hybrid Single Particle Lagrangian Integrated Trajectory) model with the TrajStat software package (http://meteothink.org/products/trajstat.html) [42]. TrajStat is based on the geographic information system (GIS), to cluster the trajectories and compute the potential source contribution function (PSCF) and concentration weighted trajectory (CWT) analyses.
Backward air mass trajectories at the 950 mbar level were calculated with the HYSPLIT model [44] over a period of 72 h, for Nanjing as receptor site. The PSCF values for the grid cells in the study domain are calculated by counting the trajectory segment endpoints that terminate within each cell [45]. The number of endpoints that fall in the ijth cell is designated nij. The number of endpoints for the same cell having arrival times at the sampling site corresponding to PM concentrations higher than an arbitrarily set criterion is defined to be mij. The PSCF value for the ijth cell is then defined as
A limitation of the PSCF method is that grid cells can have the same PSCF value when sample concentrations are either only slightly higher or extremely higher than the criterion. In the CWT method [46,47], each grid cell is assigned a weighted concentration by averaging the sample concentrations that have associated trajectories that crossed that grid cell:
where Cij is the average weighted concentration in the ijth cell, l is the index of the trajectory, M is the total number of trajectories, Cl is the concentration observed on arrival of trajectory l, and τijl is the time spent in the ijth cell by trajectory l. A high value for Cij implies that air parcels traveling over the ijth cell would be, on average, associated with high concentrations at the receptor site. The arbitrary weighting function described above was also used in the CWT analyses to reduce the effect of the small values of nij.
3. Results and Discussion
3.1. Data Overview and Characteristics of Selected Pollution Episodes
PM2.5/10 is a parameter contributing to the degree of air pollution. The variation of the monthly averaged AQI, the concentrations of PM2.5/10, and the proportion of PM2.5 to PM10 (in %) during 2017 (calculated from daily values) are shown in Figure 2. The PM2.5/10 concentrations plotted in Figure 2 are averages over all nine stations. The results show that the average concentrations of PM2.5/10 are highest in December (77/131 μg m−3) and lowest in August (16/40 μg m−3). This applies to both PM2.5 and PM10, but also the relative contribution of PM2.5 to PM10 changes, from about 60% in the winter months to about 40% in July and August. In contrast, the AQI is highest in the late spring/early summer with values exceeding 100 in May and June, when the PM2.5/10 concentrations are actually decreasing. It is noted that PM2.5/10 concentrations are included in the AQI and, hence, the high AQI in spring and summer is due to the contributions from contaminants other than aerosols. Air quality is divided into no pollution (No-Po), slight pollution (Sl-Po), moderate pollution (Mo-Po), and severe pollution (Se-Po), and their corresponding PM2.5 mass concentration ranges are 0–35 μg m−3, 35–115 μg m−3, 115–150 μg m−3, and >150 μg m−3, respectively [48]. Based on the AQI, two pollution episodes (Mo-Po or Se-Po) were selected for analysis of the source regions and their contributions to the air pollution in Nanjing. The first episode was a summer period, i.e., 26 May–3 June, and the other one was the period 21–31 December (winter), both in 2017. Below, these periods are simply indicated as “summer” and “winter”. In view of the different behavior of the AQI and the PM concentrations in summer and winter, as well as the different meteorological situations as reflected by the governing wind directions (see below for a discussion of the meteorological situation during both episodes), in this paper, we have focused on the aerosol characteristics during each episode. The different behavior of AQI and PM indicates different sources and dispersion characteristics, and also reflects differences in residence time of trace gases and aerosols.
The average concentrations of PM2.5 and PM10 at each of the nine national control monitoring stations in Nanjing during the summer and winter episodes are presented in Table 1. Pukou Station is located in the New Industrial Zone north of the Yangtze River, while most of the other eight stations are located in urban areas. The aerosol optical properties were obtained from measurements at NUIST, not far from Pukou and in a similar atmospheric environment as the Pukou Station. The PM2.5 and PM10 data showed large differences between summer and winter, in particular, for PM2.5 with winter concentrations more than a factor of two larger than in the summer. In contrast, for PM10, the ratio between summer and winter was overall smaller than 2. The concentrations varied somewhat between locations, but the differences were within one standard deviation. The variations between these locations might be due to local emissions, on top of the high concentrations over the whole area. The PM2.5/PM10 ratio could provide the fraction contribution of different physicochemical particles. A high PM2.5/PM10 ratio is attributed to the dominance of fine particles from primary and secondary anthropogenic sources. The lower ratio indicates considerable involvement of coarse particles, which are mainly produced from natural processes. The PM2.5/PM10 ratio at the Pukou station was slightly smaller (0.5 ± 0.1) in the winter than in the summer (0.6 ± 0.2), although the difference is statistically not significant (see standard deviation).
3.1.1. Characteristics of Meteorological Conditions During Pollution Episodes
Daily values of the AQI for the two study periods in May/June and in December 2017, averaged over all sites used in this study, are shown in Figure 3 together with visibility (V), temperature (T), relative humidity (RH), wind speed (WS), and direction (WD) measured in Nanjing. Visibility in the YRD region has decreased at a rate of 2.4 km decade−1 [49]. The data in Figure 3 show that visibility is inversely proportional to AQI, which is due to the aerosol component of the AQI and associated particle scattering and absorption. For the current study, two episodes with severe pollution were selected with low visibility and high AQI, as indicated in Figure 3. The summer episode is the period from 26 May to 2 June, and the winter episode is 21–30 December. The maximum AQI values during these two pollution episodes were 193 and 304; air temperature, relative humidity, WD, and wind speed (WS) were also different during these two periods. This is consistent with the results of Yu et al. [36,50]. We also note that the average temperature during the pollution episodes was higher than that before and after the episode. The average temperatures during the two pollution episodes were 28.5 °C and 6.2 °C, respectively.
Calm weather with low wind conditions is not conducive for the horizontal transport of atmospheric constituents near the surface, which, thus, accumulate in the area and their concentrations increase. This is illustrated in Figure 4, where the PM concentrations measured at the Pouku site (#1157) are plotted as a function of wind speed and wind direction. Figure 4 shows wind roses where the concentric circles indicate wind speed in ms−1 and the PM concentrations in µg m−3 are color-coded following the scheme at the right of each figure. The Pukou site, situated West of Nanjing at about 25 km from the city center, is shown here because it is nearest to NUIST where the meteorological parameters were obtained. The black contours show the frequency of occurrence (in %) of the wind directions, which were very different during the two study periods. During the summer episode, the majority of the wind directions were between east and south, with only a small fraction including a westerly component. Wind speeds from prevailing wind directions were between 0.6 to 3.5 m s−1 when the PM2.5 concentration was more than 70 μg m−3. The highest wind speed of 5 m s−1 occurred in the episode when the wind direction was East-North-East (ENE). PM10 concentrations were highest (ca. 185 μg m−3) during that wind direction with a wind speed of about 4 m s−1, possibly due to local generation. However, the data in Figure 4a, c show contributions from remote sources in the east and northeast, which could be sea spray aerosol, i.e., hygroscopic particles, which may attain larger sizes than locally produced anthropogenic aerosol particles. This suggestion is supported by the shape of the particle size distributions, as discussed below. For PM2.5, the maximum concentrations of ca. 73 μg m−3 occurred during easterly wind directions and low wind speed (ca. 2 m s−1), indicating the influence of anthropogenic particles generated in Nanjing city center (cf. the map in Figure 1). Elevated PM2.5 concentrations were also observed during East-North-East and East-South-East (ESE) winds and could be generated by local industries along the Yangtze River. Wind from the north and northwest hardly occurred during this episode, and PM2.5 concentrations were the lowest observed in these cases.
In contrast, during the winter episode, the dominating wind directions were from the west and northwest (NW) with a maximum wind speed of 5.5 m s−1 from the West-North-West (WNW). However, the frequency of occurrence of easterly and south-easterly winds was similar to that from westerly directions, but with lower wind speeds. The PM concentrations during the winter episode were much higher than those during the summer, with a maximum of 254 μg m−3 for PM2.5 and 345 μg m−3 for PM10. The PM2.5 and PM10 distributions on the windroses were very similar, with highest concentrations during wind directions from the west and WNW, and much lower concentrations during easterly winds. It is noted that these lowest concentrations are higher than those observed during the summer in the same wind direction and may indicate local production and accumulation during the winter conditions. The much higher concentrations during westerly and WNW winds indicate transport from remote sources.
3.1.2. Characteristics of Meteorological Conditions During Pollution Episodes
As shown in the data overview in Figure 3 and Figure 4, the high pollution episodes occur during specific meteorological situations with low wind speed. During the period from May 29 to June 3, the cold vortex in the high latitude region splits up and falls south of the low pressure, and the center of the cold low lies in the northeast of China and the Sea of Japan. During this period, Nanjing was always in front of the trough of low pressure. It is gradually controlled by a straight latitude westerly wind, which is not conducive to the southward movement of cold air. The surface weather situation shows that the Nanjing area was mainly controlled by high pressure, which was a tendency for the pressure field to change to col pressure field. The wind speed in the barometric field was small, the wind direction was variable, and the pressure was stable. The stable atmospheric stratification and the low wind speed at the surface prohibit the transport of pollutants in the area, thus, leading to accumulation of their concentrations and the formation of haze.
The Eurasian mid-high latitudes were characterized by a straight zonal and meridional circulation in late December. A relatively straight zonal circulation appeared in Nanjing. The surface of the central and eastern part of China was controlled by the anticyclone uniform pressure field, the air pressure gradient was weak, and the wind speed was low. The circulation situation was conducive to the occurrence and maintenance of fog and haze. Steady circumfluence and warm advection before the ridge warmed the middle atmosphere and, hence, made the haze event last a long time over a large region.
3.2. Aerosol Optical Properties During the High Pollution Episodes Retrieved from Sun Photometer Data
Aerosol optical properties were retrieved from the spectral AOD measured with the sun photometer at NUIST. These data describe column-integrated aerosol properties (i.e., integrated over the whole atmospheric column), as opposed to complementary ground-based in situ measurements, which describe local aerosol properties near the surface. Another difference between AOD and PM2.5 is that the latter is measured at low relative humidity, i.e., after evaporation of aerosol water and, thus, in a dry state, whereas AOD is measured in situ and, thus, includes effects of aerosol water on the size distribution and optical properties. Furthermore, the aerosol mass is determined by specific weight and aerosol optical properties by the complex refractive index of the particles. Therefore, the AOD/PM2.5 relation is not unique and varies with parameters, such as the Planetary Boundary Layer Height (PBLH), RH, wind speed, etc. [51]. The higher PBLH in summer is favorable for more efficient transport and mixing of particles to a higher elevation, which generally results in a lower surface PM concentration as compared to winter (see Figure 5e,f).
Time series of the daily averaged AOD (at 500 nm) and AE (at 440–870 nm) during the two study periods are shown in Figure 5a,b. During the summer episode, the AOD initially decreased until 29 May after which it increased to the maximum value for that episode of 2.52 ± 0.19, on 2 June. AE decreased initially to a minimum value of 0.95 ± 0.13 and then increased gradually to a maximum value of 1.40 ± 0.03. These observations indicate the possible influence of dust aerosols. Fine particles dominated and had strong absorption characteristics during the other days of the summer pollution episodes. From the potential source identification of Section 3.3, causes for the increase of AOD values and also AE can be inferred.
During the high AOD episodes in the YRD region in the winter, the occurrence of fog and haze is common. During the winter pollution episode studied here, the maximum AOD value was 1.38 ± 0.18, and, on the same day, AE reached a minimum of 0.91 ± 0.03. Eck et al. [52] and Holben et al. [53] reported that an AE larger than one indicates the dominance of fine mode aerosol particles, whereas, for AE smaller than one, coarse mode particles dominate. Accordingly, the decrease of the AE during the winter episode indicates the increase of the contribution of coarse mode aerosol particles to the AOD. These coarse mode particles may have been transported from elsewhere.
Bibi et al. [54] summarized the threshold values of aerosol properties for different types of aerosol, with 0.4 > AE > 0.01 for dust aerosol, and 1.7 > AE > 0.7 for biomass burning and urban/industrial aerosol. This indicates the presence of “Mixed Aerosol” in the two severe pollution episodes, following the nomenclature of Giles et al. [55].
The relative contributions of fine and coarse mode aerosol particles to the aerosol content is illustrated from the shape of the VSDs retrieved from the sun photometer observations. The daily averaged aerosol VSDs in Figure 5c,d clearly show the bi-modal lognormal volume distributions, except for 2 June when AOD was extremely high (2.52 ± 0.19). On that day, the volume spectrum showed a VSD with a single mode peaking at a radius of around 0.34 μm. The fine mode peaks on other days occurred at radii between 0.15 μm and 0.26 μm with the highest volumetric concentration of about 0.13 μm3μm−2 during summer. The coarse mode peaks at radii between 3.86 (on 29 May during the summer episode) and 2.94 (on 31 December, i.e., during the winter episode). Overall, the fine and coarse mode maximum volume concentrations are similar, but differences occur from day to day. In particular, during the winter episode, the fine mode amplitudes vary by about a factor of three and more for the coarse mode fraction. The meteorological data in Figure 3 showed that RH was about 60% during the beginning of the episode, but increased on 28 December to more than 80%. As a result, the aerosol particles took up water vapor, i.e., their size increased, and the VSD shifted to larger particles as is clearly visible in, especially, the fine mode radius and in both the fine and coarse mode amplitudes. The change in RH might be due to a shift in wind direction from easterly to north-westerly. NW winds also occurred earlier during the winter episode, and the difference in wind direction was clearly reflected in the VSDs, with a group with low fine mode fraction during northwesterly winds (on 21, 22, and 25 December). During these days, the coarse mode amplitude is higher than that of the fine mode fraction, with a variation by about a factor of two. On the other days, the difference between coarse and fine mode amplitudes is smaller due to an increase of the fine mode amplitude by about a factor of three, accompanied by a small increase in mode size. These differences are caused by different sources contributing to the aerosols measured at the NUIST sun photometer site: RH is similar during most of the days except at the end, as discussed above, and also PBLH does not vary overall, although the extremes vary by about a factor of two.
Comparison of the VSDs during the summer and winter episodes shows that there were substantial differences. The large differences in coarse and fine mode amplitudes observed during the winter episode did not occur during the summer. Furthermore, the fine mode sizes were slightly larger than during the winter (both a bit smaller than 0.2 µm), and, similarly, the coarse mode sizes were also slightly larger, i.e., slightly larger than 4 µm during summer and slightly smaller than 4 µm during winter. This difference might be due to contributions from hygroscopic sea spray aerosol advected from the ocean during easterly winds, i.e., more susceptible to hygroscopic growth. Furthermore, the fine mode amplitude in summer was overall larger than during winter, but the coarse mode amplitude was larger during winter. These observations are supported by the observed summer/winter differences in PM concentrations, where it should be kept in mind that the VSDs are retrieved from in situ column observations and PM are directly measured dry mass concentrations. The PBLH in Figure 5e,f showed that, in the summer, the PBLH was a factor of 2–3 higher than in winter, and, hence, the concentrations are expected to be higher in the winter than in the summer (for similar emissions). All these differences clearly show the dissimilarity in the conditions during both episodes and render it hard to quantitatively compare the observations. Yet, in a qualitative sense, the differences are plausibly explained from the environmental conditions.
The SSA provides information on the scattering and absorption characteristics of the ambient aerosol, and its value may range from 0 (completely absorbing) to one (completely scattering) [56]. The SSA of dust aerosols increases with the increase of wavelength, while the organic carbon decreases with the increase of wavelength [57]. Figure 6a shows the spectral variation of total SSA for selected days during the heavy pollution episodes. The spectral variation of total SSA decreased with increasing wavelength during summer, and the same trend was observed for the fine mode fraction (see Figure 6b). In contrast, during the winter, the SSA values were higher and increased with wavelength for both fine (Figure 6b) and coarse mode (Figure 6c) aerosol. The absorption was stronger during the summer than in the winter, with a minimum value of the SSA at 440 nm of 0.86 on 28 May.
The ASY parameter is a measure for the angular distribution of light scattering by particles and is a crucial factor used for aerosol radiative forcing estimation. Figure 6e shows that ASY for fine mode aerosol consistently decreases with wavelength. However, for coarse mode (Figure 6f), ASY at shorter wavelengths (visible region) decreased with increasing wavelength while at longer wavelengths, it slightly increased with wavelength. For a particular AOD, the ASY of fine particles is smaller than that of coarse particles [58]. Low values of the ASY parameter (0.65 at 440 nm and 0.58 at 1020 nm) suggest a large number of anthropogenic aerosols, which are absorbing fine-mode particles.
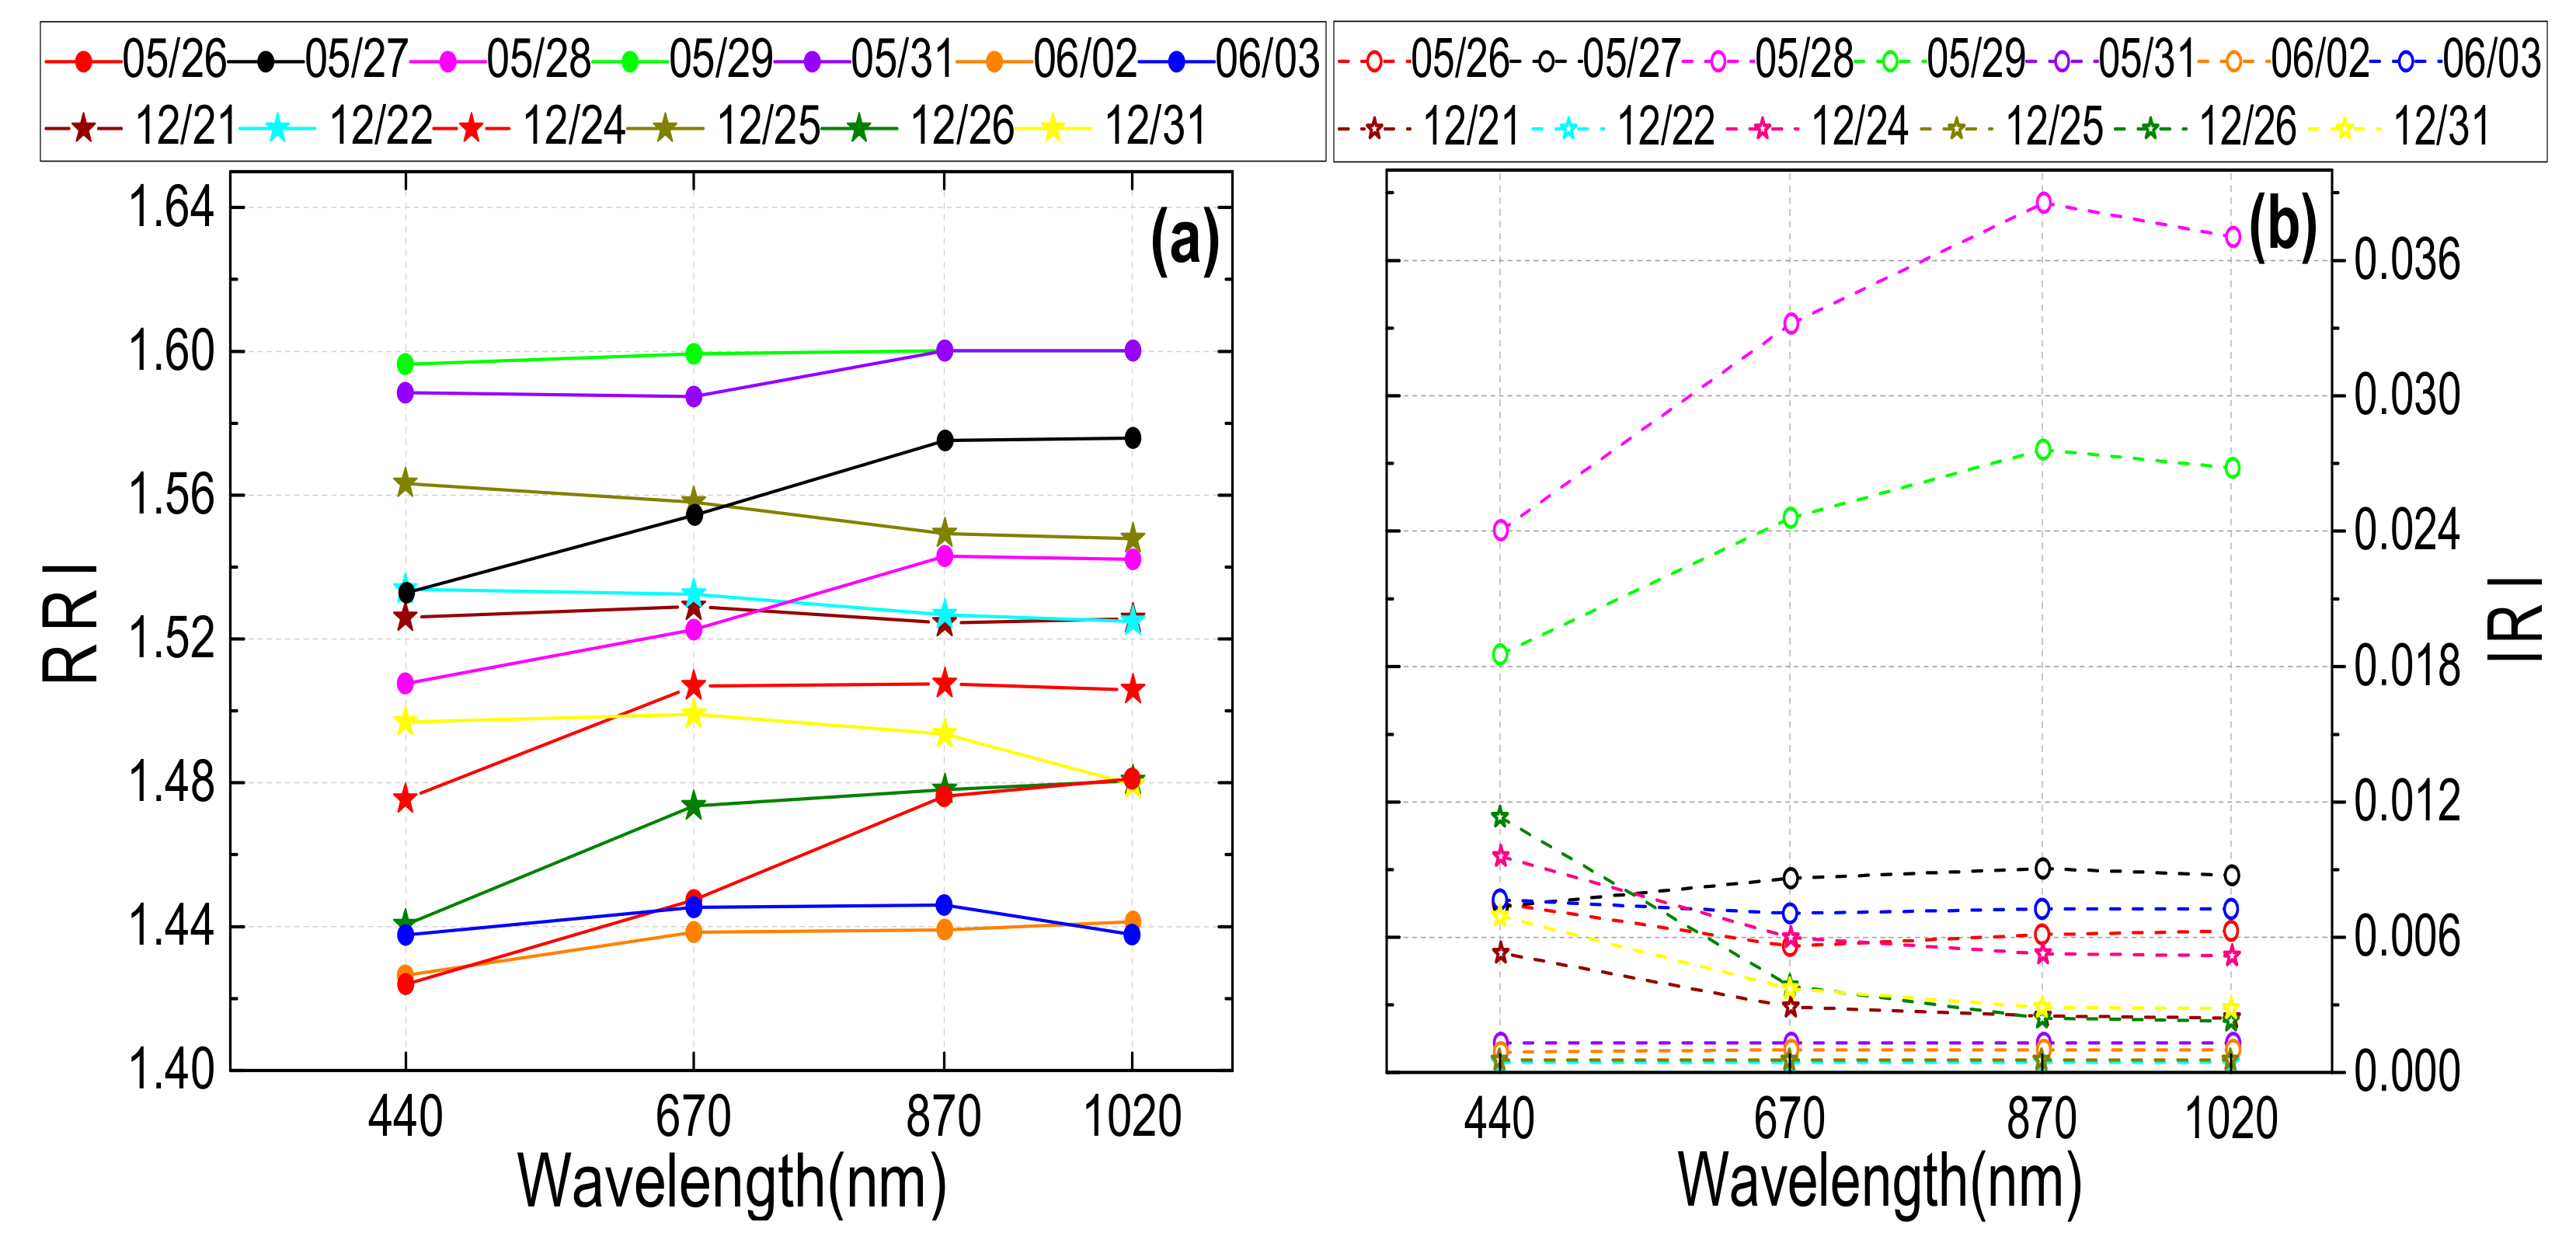
The aerosol refractive index, i.e., the real (RRI) and imaginary (IRI) parts describe the scattering and absorption properties, respectively, depending on the chemical composition of the aerosol particles. Figure 7a,b shows the spectral variations of RRI and IRI over Nanjing for specific days for which SSA was retrieved from the sun photometer measurements (i.e., requiring AOD values of 0.4 or higher) [59]. The average values of the RRI ranged from 1.42(05/26)–1.60(05/29) for short wavelength (440 nm) and 1.44(06/03)–1.60(05/31) for long wavelength (1020 nm), respectively. The IRI variation with wavelength is opposite to the spectral variation of SSA. The value of IRI varied between 0.0005–0.024 at 440 nm to 0.0011–0.038 at 1020 nm. Therefore, from the spectral properties of IRI, we can find that higher values of IRI indicate stronger absorption during summer episode, likely from biomass burning activities, whereas lower values indicate the presence of scattering aerosols [25].
3.3. Potential Source Identification
Aerosols are produced by local emissions and atmospheric process, while also long-distance transport of atmospheric constituents originating from other regions is an important factor in the variation of aerosol concentrations in Nanjing. Therefore, PSCF and CWT are used to calculate and analyze the potential source areas and their contribution to PM concentrations and their variation in different seasons in the northern suburbs of Nanjing. In this study, the criterion of PM2.5 was set to 75 μg m−3 and PM10 was set to 100 μg m−3 for the polluted concentration, which is based on the national secondary standard as the threshold value. Using 500 m as the mean height of the atmospheric boundary layer in the study area, TrajStat was used to simulate the 72-h backward trajectory of air masses arriving at the receptor point at NUIST. The results in Figure 8 show the different air mass origins and air flow patterns of the air masses arriving in Nanjing in summer and winter. The concentration-weighted air mass trajectories (CWT) in Figure 9 show that the source areas and their contributions to PM2.5/10 are different during heavy pollution episodes in summer and winter.
For the summer pollution episode (see Figure 8a,b), a large number of air mass trajectories originated over the ocean, but their contribution to PM2.5/10 was small (<0.2). The potential source areas, including the Yangtze River Delta region, the northern part of Zhejiang province, the central and southern part of Anhui province, and the junction of Anhui, Hubei, and Jiangxi province, were most likely leading to the high PM2.5/10 concentrations in Nanjing. According to the CWT analyses (see Figure 9a,b), the relative contributions of each potential source to the highest concentration values exceeded 70–90 μg m−3. In contrast, for the winter pollution episode, the cells with high PSCF values were located mainly in the Jiangsu province, Anhui province, northern part of Zhejiang province, and the northwestern part of Shandong and Henan province (see Figure 8c,d). The contributions to the PM2.5 and PM10 mass concentrations in Nanjing were about 80 μg m−3 and 150 μg m−3 (see Figure 9c,d). At the same time, the larger concentrations were distributed in some parts of Shaanxi, Ningxia, Gansu, and Inner Mongolia.
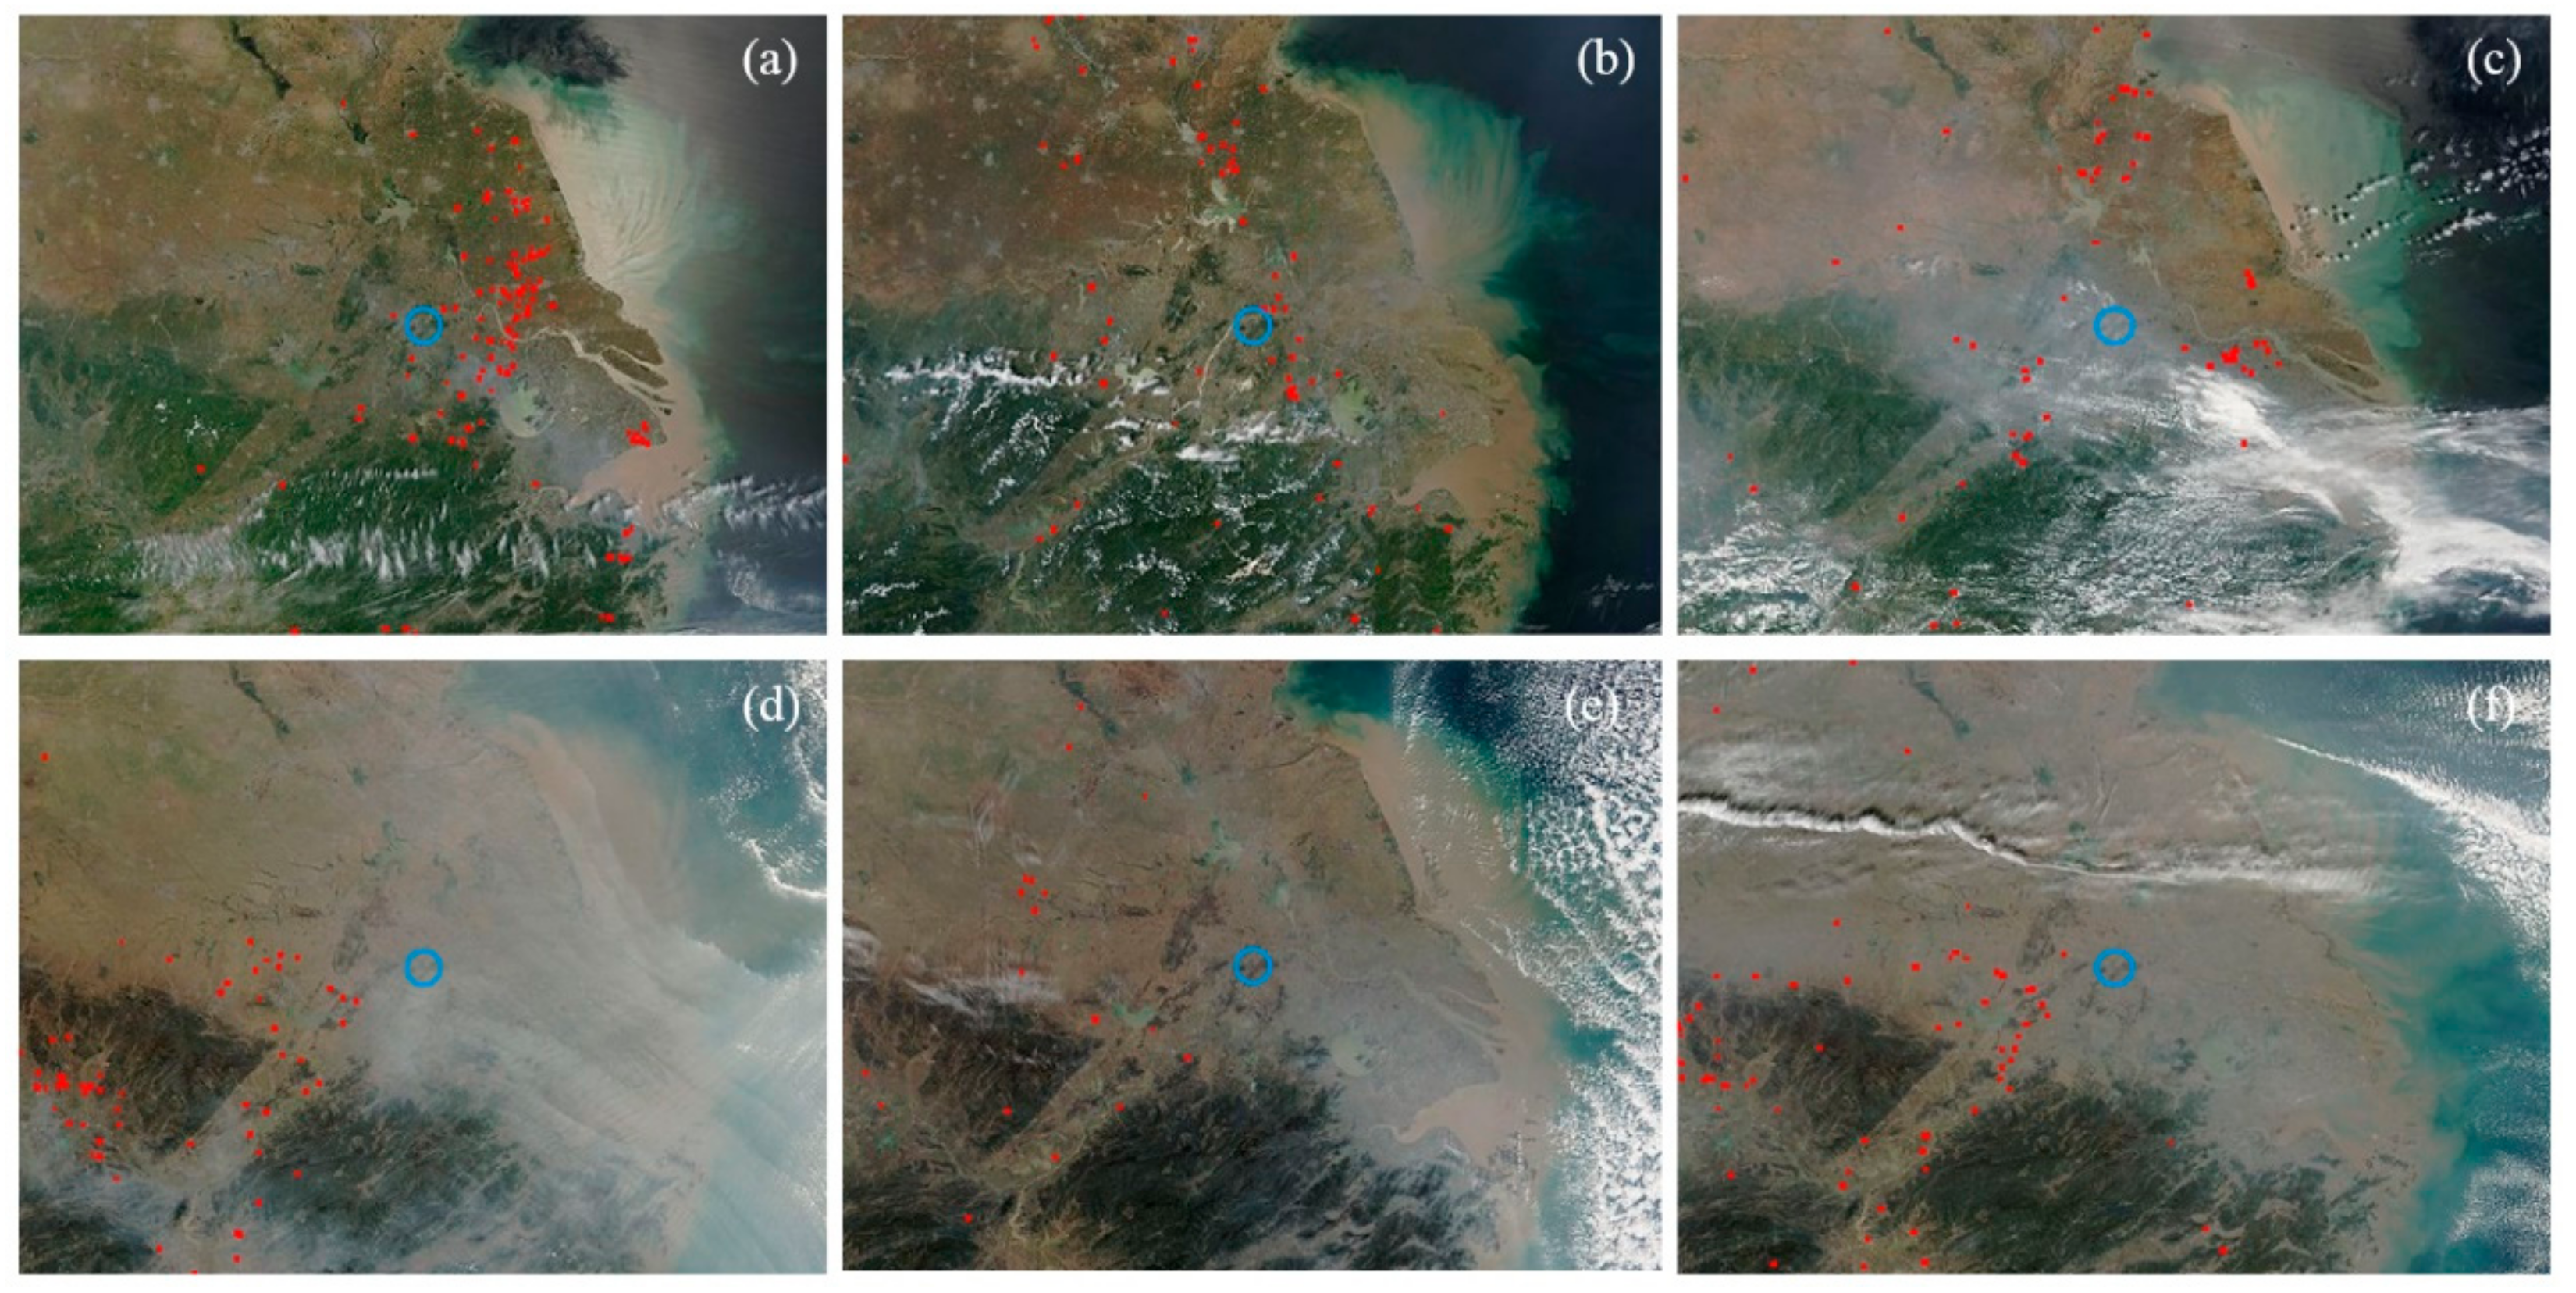
Comparison with Moderate Resolution Imaging Spectroradiometer (MODIS) fire count data (http://rapidfire.sci.gsfc.nasa.gov/realtime/) shows that the distribution of fire spots changed with the seasons. The combination of biomass burning (red marker) area and visible fog plume resulted in a decrease of visibility over Nanjing during the summer episode. In addition to the presence of pollutants due to agricultural fires around Nanjing, a large number of pollutants emitted by heating and combustion boilers in winter diffused with cold air, which are the possible reasons for the high aerosol concentrations (see Figure 10). Under the influence of weather systems in different seasons, the sources and the processes leading to high pollution events are also different. The hotspots are most likely the source of absorbing aerosol, which contributed to the haze significantly.
4. Conclusions
Aerosol optical characteristics and sources during two typical severe weather processes in Nanjing in 2017, one during the summer and the other one during the winter, were compared and analyzed. The two pollution periods were dominated by fine mode particles, but there was a strong difference in the contributions from remote sources. It is known that the aerosol is influenced by urban pollution, seasonal biomass mass burning, and transport of aerosols from northwestern China [60]. During the summer episode, the source regions were localized around Nanjing, whereas, during the winter pollution episodes, long-range transport of pollutants from the northwest contributed substantially. Major conclusions from this study are summarized below.
The maximum AQI values during these two pollution episodes were 193 and 304. Based on the statistics of average concentrations corresponding to PM2.5/10, PM2.5 concentrations were more than a factor of two larger in the winter than in the summer. But for PM10, the ratio between summer and winter concentrations was overall smaller than two. The diurnal variation of the meteorological conditions showed that the average temperature during the pollution episodes was higher than that before and after the episode. During the summer, eastern and southeastern wind directions dominated, with maximum PM2.5/10 mass concentrations of 73 μg m−3 and 119 μg m−3, respectively. In contrast, during the winter, the dominating wind direction was from the northwest. The concentrations of particulate matter were much higher than those during the summer, with a maximum of 254 μg m−3 for PM2.5 and 345 μg m−3 for PM10. The stable atmospheric stratification and the low wind speed near the surface, which prohibit the diffusion of pollutants, made the haze event in the study area last a long time.
Pollution events with elevated AOD were observed in both summer and winter, and the AOD showed an increasing trend. The VSD was a bimodal lognormal distribution with a substantial contribution of fine mode aerosols during summer. On 2 June, the peak of VSD reached 0.338 μm3μm−2. In the winter, the peak maxima of coarse mode particles were higher than those of the fine mode. In this winter episode, SSA smoothly increased with increasing wavelength, whereas, during the summer episode, the SSA decreased abruptly with increasing wavelength. For fine mode, an abrupt decrease in ASY with increasing wavelength was observed. For the coarse mode, ASY decreased with increasing wavelength at shorter wavelengths (440–870 nm) and slightly increased at longer wavelengths (1020 nm). RRI was independent of wavelength for wavelengths between 440 and 870 nm and then increased at 1020 nm in most cases. IRI was found to increase with increasing wavelength in summer, whereas, during the winter episode, it decreased with wavelength at a shorter wavelength, but, at the wavelength of 1020 nm, the variation was less pronounced.
Based on PSCF and CWT analyses, most of the pollutants originated from local sources. During the summer, the trajectories were mostly of local origin carrying fine particles, with less contribution from coarse particles originating over northwest China. However, during the winter, some of the air masses were arriving from arid/semi-arid regions (Shaanxi, Ningxia, Gansu, and Inner Mongolia provinces) covering long distances and transporting coarse particles to the study area. Finally, only by determining the chemical composition in aerosol samples, we could fully verify the exact pollutant emission sources affecting the observation site.
Author Contributions
Conceptualization, J.W. and G.d.L.; methodology, S.N.; software, J.W.; validation, J.W., G.d.L., and S.N.; formal analysis, J.W. and G.d.L.; investigation, H.K.; resources, H.K.; data curation, J.W.; writing—original draft preparation, J.W.; writing—review and editing, G.d.L.
Funding
This research was funded by National Natural Science Foundation of China (grant number 41705009 and 41605091) and the National Key Research and Development Program of China (grant number 2018YFC1507905 and 2016YFC0202403).
Acknowledgments
The authors are grateful to Wang Yaqiang for an open source software MeteoInfo (http://meteothink.org/index.html). We also acknowledge the PIs and all members for maintaining the sites of NUIST.
Conflicts of Interest
The authors declare no conflict of interest.
References
- Huang, R.; Zhang, Y.; Bozzetti, C.; Ho, K.; Cao, J.; Han, Y.; Daellenbach, K.R.; Slowik, J.G.; Platt, S.M.; Canonaco, F.; et al. High secondary aerosol contribution to particulate pollution during haze events in China. Nature 2014, 514, 218–222. [Google Scholar] [CrossRef] [PubMed] [Green Version]
- Zhang, Q.; Streets, D.G.; Carmichael, G.R.; He, K.B.; Huo, H.; Kannari, A.; Klimont, Z.; Park, I.S.; Reddy, S.; Fu, J.S.; et al. Asian emissions in 2006 for the NASA INTEX-B mission. Atmos. Chem. Phys. 2009, 9, 5131–5153. [Google Scholar] [CrossRef] [Green Version]
- Krotkov, N.A.; McLinden, C.A.; Li, C.; Lamsal, L.N.; Celarier, E.A.; Marchenko, S.V.; Swartz, W.H.; Bucsela, E.J.; Joiner, J.; Duncan, B.N.; et al. Aura OMI observations of regional SO2 and NO2 pollution changes from 2005 to 2015. Atmos. Chem. Phys. 2016, 16, 4605–4629. [Google Scholar] [CrossRef]
- Van der A, R.J.; Eskes, H.J.; Boersma, K.F.; van Noije, T.P.C.; Van Roozendael, M.; De Smedt, I.; Peters, D.H.M.U.; Meijer, E.W. Trends, seasonal variability and dominant NOx source derived from a ten year record of NO2 measured from space. J. Geophys. Res. Atmos. 2008, 113, 12. [Google Scholar] [CrossRef]
- De Leeuw, G.; Sogacheva, L.; Rodriguez, E.; Kourtidis, K.; Georgoulias, A.K.; Alexandri, G.; Amiridis, V.; Proestakis, E.; Marinou, E.; Xue, Y.; et al. Two decades of satellite observations of AOD over mainland China using ATSR-2, AATSR and MODIS/Terra: Data set evaluation and large-scale patterns. Atmos. Chem. Phys. 2018, 18, 1573–1592. [Google Scholar] [CrossRef]
- Sogacheva, L.; Rodriguez, E.; Kolmonen, P.; Virtanen, T.H.; Saponaro, G.; de Leeuw, G.; Georgoulias, A.K.; Alexandri, G.; Kourtidis, K.; van der A, R.J. Spatial and seasonal variations of aerosols over China from two decades of multi-satellite observations-Part 2: AOD time series for 1995–2017 combined from ATSR ADV and MODIS C6.1 and AOD tendency estimations. Atmos. Chem. Phys. 2018, 18, 16631–16652. [Google Scholar] [CrossRef]
- Liu, F.; Beirle, S.; Zhang, Q.; van der A, R.J.; Zheng, B.; Tong, D.; He, K. NOx emission trends over Chinese cities estimated from OMI observations during 2005 to 2015. Atmos. Chem. Phys. 2017, 17, 9261–9275. [Google Scholar] [CrossRef] [PubMed]
- Ronald, J.V.D.A.; Mijling, B.; Ding, J.; Koukouli, M.E.; Liu, F.; Li, Q.; Mao, H.; Theys, N. Cleaning up the air: Effectiveness of air quality policy for SO2 and NOx emissions in China. Atmos. Chem. Phys. 2017, 17, 1775–1789. [Google Scholar]
- Yang, Y.; Liao, H.; Lou, S. Increase in winter haze over eastern China in recent decades: Roles of variations in meteorological parameters and anthropogenic emissions. J. Geophys. Res. Atmos. 2016, 121, 13050–13065. [Google Scholar] [CrossRef]
- Cai, W.; Li, K.; Liao, H.; Wang, H.; Wu, L. Weather conditions conducive to Beijing severe haze more frequent under climate change. Nat. Clim. Chang. 2017, 7, 257. [Google Scholar] [CrossRef]
- Butt, E.W.; Rap, A.; Schmidt, A.; Scott, C.E.; Pringle, K.J.; Reddington, C.L.; Richards, N.A.D.; Woodhouse, M.T.; Ramirez-Villegas, J.; Yang, H.; et al. The impact of residential combustion emissions on atmospheric aerosol, human health, and climate. Atmos. Chem. Phys. 2016, 16, 873–905. [Google Scholar] [CrossRef] [Green Version]
- Wang, J.; Christopher, S.A.; Nair, U.S.; Reid, J.S.; Prins, E.M.; Szykman, J.; Hand, J.L. Mesoscale modeling of Central American smoke transport to the United States: 1. “Top-down” assessment of emission strength and diurnal variation impacts. J. Geophys. Res. Atmos. 2006, 111, 21. [Google Scholar] [CrossRef]
- Eichler, H.; Cheng, Y.F.; Birmili, W.; Nowak, A.; Wiedensohler, A.; Brueggemann, E.; Gnauk, T.; Herrmann, H.; Althausen, D.; Ansmann, A.; et al. Hygroscopic properties and extinction of aerosol particles at ambient relative humidity in South-Eastern China. Atmos. Environ. 2008, 42, 6321–6334. [Google Scholar] [CrossRef]
- Chan, C.K.; Yao, X. Air pollution in mega cities in China. Atmos. Environ. 2008, 42, 1–42. [Google Scholar] [CrossRef]
- Che, H.; Xia, X.; Zhu, J.; Wang, H.; Wang, Y.; Sun, J.; Zhang, X.; Shi, G. Aerosol optical properties under the condition of heavy haze over an urban site of Beijing, China. Environ. Sci. Pollut. Res. 2015, 22, 1043–1053. [Google Scholar] [CrossRef] [PubMed]
- Chen, J.; Xin, J.; An, J.; Wang, Y.; Liu, Z.; Chao, N.; Meng, Z. Observation of aerosol optical properties and particulate pollution at background station in the Pearl River Delta region. Atmos. Res. 2014, 143, 216–227. [Google Scholar] [CrossRef]
- Wang, Y.Q.; Zhang, X.Y.; Arimoto, R. The contribution from distant dust sources to the atmospheric particulate matter loadings at XiAn, China during spring. Sci. Total Environ. 2006, 368, 875–883. [Google Scholar] [CrossRef]
- Yu, X.; Shen, L.; Xiao, S.; Ma, J.; Lü, R.; Zhu, B.; Hu, J.; Chen, K.; Zhu, J. Chemical and Optical Properties of Atmospheric Aerosols during the Polluted Periods in a Megacity in the Yangtze River Delta, China. Aerosol Air Qual. Res. 2019, 19, 103–117. [Google Scholar] [CrossRef] [Green Version]
- De Leeuw, G.; Holzer-Popp, T.; Bevan, S.; Davies, W.H.; Descloitres, J.; Grainger, R.G.; Griesfeller, J.; Heckel, A.; Kinne, S.; Klueser, L.; et al. Evaluation of seven European aerosol optical depth retrieval algorithms for climate analysis. Remote. Sens. Environ. 2015, 162, 295–315. [Google Scholar] [CrossRef] [Green Version]
- De Leeuw, G.; Kokhanovsky, A.A.; Cermak, J. Remote sensing of aerosols and clouds: Techniques and applications (editorial to special issue in Atmospheric Research). Atmos. Res. 2012, 113, 40–42. [Google Scholar] [CrossRef]
- Xu, X.; Qiu, J.; Xia, X.; Sun, L.; Min, M. Characteristics of atmospheric aerosol optical depth variation in China during 1993–2012. Atmos. Environ. 2015, 119, 82–94. [Google Scholar] [CrossRef]
- Holben, B.N.; Eck, T.F.; Slutsker, I.; Tanré, D.; Buis, J.P.; Setzer, A.; Vermote, E.; Reagan, J.A.; Kaufman, Y.J.; Nakajima, T.; et al. AERONET—A Federated Instrument Network and Data Archive for Aerosol Characterization. Remote. Sens. Environ. 1998, 66, 1–16. [Google Scholar] [CrossRef]
- Che, H.; Zhang, X.Y.; Xia, X.; Goloub, P.; Holben, B.; Zhao, H.; Wang, Y.; Zhang, X.C.; Wang, H.; Blarel, L.; et al. Ground-based aerosol climatology of China: Aerosol optical depths from the China Aerosol Remote Sensing Network (CARSNET) 2002–2013. Atmos. Chem. Phys. 2015, 15, 7619–7652. [Google Scholar] [CrossRef]
- Xia, X.; Che, H.; Zhu, J.; Chen, H.; Cong, Z.; Deng, X.; Fan, X.; Fu, Y.; Goloub, P.; Jiang, H.; et al. Ground-based remote sensing of aerosol climatology in China: Aerosol optical properties, direct radiative effect and its parameterization. Atmos. Environ. 2016, 124, 243–251. [Google Scholar] [CrossRef]
- Li, Z.Q.; Xu, H.; Li, K.T.; Li, D.H.; Xie, Y.S.; Li, L.; Zhang, Y.; Gu, X.F.; Zhao, W.; Tian, Q.J.; et al. Comprehensive Study of Optical, Physical, Chemical, and Radiative Properties of Total Columnar Atmospheric Aerosols Over China An Overview of Sun-Sky Radiometer Observation Network (Sonet) Measurements. Bull. Am. Meteorol. Soc. 2018, 99, 739–755. [Google Scholar] [CrossRef]
- Xin, J.; Wang, Y.; Pan, Y.; Ji, D.; Liu, Z.; Wen, T.; Wang, Y.; Li, X.; Sun, Y.; Sun, J.; et al. The Campaign on Atmospheric Aerosol Research Network of China Care-China. Bull. Am. Meteorol. Soc. 2015, 96, 1137–1155. [Google Scholar] [CrossRef]
- Chen, W.; Wang, F.; Xiao, G.; Wu, K.; Zhang, S. Air Quality of Beijing and Impacts of the New Ambient Air Quality Standard. Atmosphere 2015, 6, 1243–1258. [Google Scholar] [CrossRef] [Green Version]
- Plaia, A.; Di Salvo, F.; Ruggieri, M.; Agro, G. A Multisite-Multipollutant Air Quality Index. Atmos. Environ. 2013, 70, 387–391. [Google Scholar] [CrossRef]
- Zheng, S.; Cao, C.; Singh, R.P. Comparison of ground based indices (API and AQI) with satellite based aerosol products. Sci. Total Environ. 2014, 488, 400–414. [Google Scholar] [CrossRef]
- Li, S.; Wang, T.; Xie, M.; Han, Y.; Zhuang, B. Observed aerosol optical depth and angstrom exponent in urban area of Nanjing, China. Atmos. Environ. 2015, 123, 350–356. [Google Scholar] [CrossRef]
- Sun, H.; Pan, Z.; Liu, X. Numerical simulation of spatial-temporal distribution of dust aerosol and its direct radiative effects on East Asian climate. J. Geophys. Res. Atmos. 2012, 117, 14. [Google Scholar] [CrossRef]
- Wang, T.J.; Zhuang, B.L.; Li, S.; Liu, J.; Xie, M.; Yin, C.Q.; Zhang, Y.; Yuan, C.; Zhu, J.L.; Ji, L.Q.; et al. The interactions between anthropogenic aerosols and the East Asian summer monsoon using RegCCMS. J. Geophys. Res. Atmos. 2015, 120, 5602–5621. [Google Scholar] [CrossRef]
- Zhang, L.; Sun, J.Y.; Shen, X.J.; Zhang, Y.M.; Che, H.; Ma, Q.L.; Zhang, Y.W.; Zhang, X.Y.; Ogren, J.A. Observations of relative humidity effects on aerosol light scattering in the Yangtze River Delta of China. Atmos. Chem. Phys. 2015, 15, 8439–8454. [Google Scholar] [CrossRef] [Green Version]
- Kang, N.; Kumar, K.R.; Hu, K.; Yu, X.; Yin, Y. Long-term (2002–2014) evolution and trend in Collection 5.1 Level-2 aerosol products derived from the MODIS and MISR sensors over the Chinese Yangtze River Delta. Atmos. Res. 2016, 181, 29–43. [Google Scholar] [CrossRef]
- Qi, B.; Hu, D.; Che, H.; Du, R.; Wu, Y.; Xia, X.; Zha, B.; Liu, J.; Niu, Y.; Wang, H.; et al. Seasonal Variation of Aerosol Optical Properties in an Urban Site of the Yangtze Delta Region of China. Aerosol Air Qual. Res. 2016, 16, 2884–2896. [Google Scholar] [CrossRef] [Green Version]
- Yu, X.; Ma, J.; Kumar, K.R.; Zhu, B.; An, J.; He, J.; Li, M. Measurement and analysis of surface aerosol optical properties over urban Nanjing in the Chinese Yangtze River Delta. Sci. Total Environ. 2016, 542, 277–291. [Google Scholar] [CrossRef] [PubMed]
- Lü, R.; Yu, X.; Jia, H.; Xiao, S. Aerosol optical properties and direct radiative forcing at Taihu. Appl. Opt. 2017, 56, 7002. [Google Scholar] [CrossRef]
- Yang, Y.; Xu, X.; Zhang, Y.; Zheng, S.; Wang, L.; Liu, D.; Gustave, W.; Jiang, L.; Hua, Y.; Du, S.; et al. Seasonal size distribution and mixing state of black carbon aerosols in a polluted urban environment of the Yangtze River Delta region, China. Sci. Total Environ. 2019, 654, 300–310. [Google Scholar] [CrossRef]
- Sun, E.; Xu, X.; Che, H.; Tang, Z.; Gui, K.; An, L.; Lu, C.; Shi, G. Variation in MERRA-2 aerosol optical depth and absorption aerosol optical depth over China from 1980 to 2017. J. Atmos. Sol.-Terr. Phys. 2019, 186, 8–19. [Google Scholar] [CrossRef]
- Kang, H.; Zhu, B.; van der A, R.J.; Zhu, C.; de Leeuw, G.; Hou, X.; Gao, J. Natural and anthropogenic contributions to long-term variations of SO2, NO2, CO, and AOD over East China. Atmos. Res. 2019, 215, 284–293. [Google Scholar] [CrossRef]
- Viana, M.; Pey, J.; Querol, X.; Alastuey, A.; de Leeuw, F.; Luekewille, A. Natural sources of atmospheric aerosols influencing air quality across Europe. Sci. Total Environ. 2014, 472, 825–833. [Google Scholar] [CrossRef] [PubMed]
- Wang, Y.Q.; Zhang, X.Y.; Draxler, R.R. TrajStat: GIS-based software that uses various trajectory statistical analysis methods to identify potential sources from long-term air pollution measurement data. Environ. Model. Softw. 2009, 24, 938–939. [Google Scholar] [CrossRef]
- Wang, J.; Niu, S.; Xu, D. Light-absorbing aerosol properties retrieved from the sunphotometer observation over the Yangtze River Delta, China. Appl. Opt. 2018, 57, 992–1004. [Google Scholar] [CrossRef] [PubMed]
- Stein, A.F.; Draxler, R.R.; Rolph, G.D.; Stunder, B.J.B.; Cohen, M.D.; Ngan, F. Noaa’s Hysplit Atmospheric Transport and Dispersion Modeling System. Bull. Am. Meteorol. Soc. 2015, 96, 2059–2077. [Google Scholar] [CrossRef]
- Ashbaugh, L.L.; Malm, W.C.; Sadeh, W.Z. A residence time probability analysis of sulfur concentrations at grand Canyon National Park. Atmos. Environ. (1967) 1985, 19, 1263–1270. [Google Scholar] [CrossRef]
- Zheng, Y.; Che, H.; Yang, L.; Chen, J.; Wang, Y.; Xia, X.; Zhao, H.; Wang, H.; Wang, D.; Gui, K.; et al. Optical and radiative properties of aerosols during a severe haze episode over the North China Plain in December 2016. J. Meteorol. Res. 2017, 31, 1045–1061. [Google Scholar] [CrossRef]
- Hsu, Y.; Holsen, T.M.; Hopke, P.K. Comparison of hybrid receptor models to locate PCB sources in Chicago. Atmos. Environ. 2003, 37, 545–562. [Google Scholar] [CrossRef]
- Li, H.; Ma, Y.; Duan, F.; He, K.; Zhu, L.; Huang, T.; Kimoto, T.; Ma, X.; Ma, T.; Xu, L.; et al. Typical winter haze pollution in Zibo, an industrial city in China: Characteristics, secondary formation, and regional contribution. Environ. Pollut. 2017, 229, 339–349. [Google Scholar] [CrossRef]
- Gao, L.; Jia, G.; Zhang, R.; Che, H.; Fu, C.; Wang, T.; Zhang, M.; Jiang, H.; Van, P. Visual Range Trends in the Yangtze River Delta Region of China, 1981–2005. J. Air Waste Manag. Assoc. 2011, 61, 843–849. [Google Scholar] [CrossRef]
- Zhang, Z.; Shen, Y.; Li, Y.; Zhu, B.; Yu, X. Analysis of extinction properties as a function of relative humidity using a kappa-EC-Mie model in Nanjing. Atmos. Chem. Phys. 2017, 17, 4147–4157. [Google Scholar] [CrossRef]
- Li, W.; Liu, X.; Zhang, Y.; Sun, K.; Wu, Y.; Xue, R.; Zeng, L.; Qu, Y.; An, J. Characteristics and formation mechanism of regional haze episodes in the Pearl River Delta of China. J. Environ. Sci. 2018, 63, 236–249. [Google Scholar] [CrossRef]
- Eck, T.F.; Holben, B.N.; Reid, J.S.; Dubovik, O.; Smirnov, A.; O’Neill, N.T.; Slutsker, I.; Kinne, S. Wavelength dependence of the optical depth of biomass burning, urban, and desert dust aerosols. J. Geophys. Res. Atmos. 1999, 104, 31333–31349. [Google Scholar] [CrossRef]
- Holben, B.N.; Tanré, D.; Smirnov, A.; Eck, T.F.; Slutsker, I.; Abuhassan, N.; Newcomb, W.W.; Schafer, J.S.; Chatenet, B.; Lavenu, F.; et al. An emerging ground-based aerosol climatology: Aerosol optical depth from AERONET. J. Geophys. Res. Atmos. 2001, 106, 12067–12097. [Google Scholar] [CrossRef]
- Bibi, S.; Bibi, H.; Alam, K. In-depth discrimination of aerosol types using multiple clustering techniques over four locations in Indo-Gangetic plains. Atmos. Res. 2016, 181, 106–114. [Google Scholar] [CrossRef]
- Giles, D.M.; Holben, B.N.; Eck, T.F.; Sinyuk, A.; Smirnov, A.; Slutsker, I.; Dickerson, R.R.; Thompson, A.M.; Schafer, J.S. An analysis of AERONET aerosol absorption properties and classifications representative of aerosol source regions: Aerosol absorption and classifications. J. Geophys. Res. Atmos. 2012, 117. [Google Scholar] [CrossRef]
- Li, J.; Carlson, B.E.; Lacis, A.A. Using single-scattering albedo spectral curvature to characterize East Asian aerosol mixtures: Single scattering albedo curvature. J. Geophys. Res. Atmos. 2015, 120, 2037–2052. [Google Scholar] [CrossRef]
- Li, Z.; Gu, X.; Wang, L.; Li, D.; Xia, Y.; Li, K.; Dubovik, O.; Schuster, G.; Goloub, P.; Zhang, Y.; et al. Aerosol physical and chemical properties retrieved from ground-based remote sensing measurements during heavy haze days in Beijing winter. Atmos. Chem. Phys. 2013, 13, 10171–10183. [Google Scholar] [CrossRef] [Green Version]
- Bi, J.; Huang, Z.; Huang, J.; Fu, Q.; Wang, X.; Shi, J.; Zhang, W.; Zhang, B. Toward characterization of the aerosol optical properties over Loess Plateau of Northwestern China. J. Quant. Spectrosc. Radiat. Transf. 2011, 112, 346–360. [Google Scholar] [CrossRef]
- Holben, B.N. Aeronet’s Version 2.0 quality assurance criteria. In SPIE—The International Society for Optical Engineering; International Society for Optics and Photonics: Bellingham, WA, USA, 2006; Volume 6408. [Google Scholar]
- Kumar, K.R.; Kang, N.; Yin, Y. Classification of key aerosol types and their frequency distributions based on satellite remote sensing data at an industrially polluted city in the Yangtze River Delta, China. Int. J. Climatol. 2018, 38, 320–336. [Google Scholar] [CrossRef]
Figure 1.
Location of Nanjing in the Jiangsu Province overlaid on a map created with the Global Relief Model. The zoom on the right shows the city of Nanjing along the Yangtze River, the location of NUIST and the sun photometer to the northwest (NW) of the city. The numbers in the Nanjing city map indicate the nine national control monitoring stations in Nanjing in 2017 (see text for more detail). The map is plotted using the 1 arc-minute global relief model of Earth’s surface that integrates land topography and ocean bathymetry (ETOPO1) Global Relief Model developed by the National Geophysical Data Center (NGDC), an office of the USA National Oceanic and Atmospheric Administration (NOAA) (see https://www.ngdc.noaa.gov/mgg/global/global.html for more detail on ETOPO1). The image is opened in MeteoInfo software [42] and geographically matched.

Figure 2.
Variation of monthly averaged AQI (air quality index), concentrations of particulate matter (PM)2.5/10, and the ratio between PM2.5 and PM10 (in %) during 2017. The data shown are an average over the data collected at the nine national control monitoring stations in the city of Nanjing shown in Figure 1.
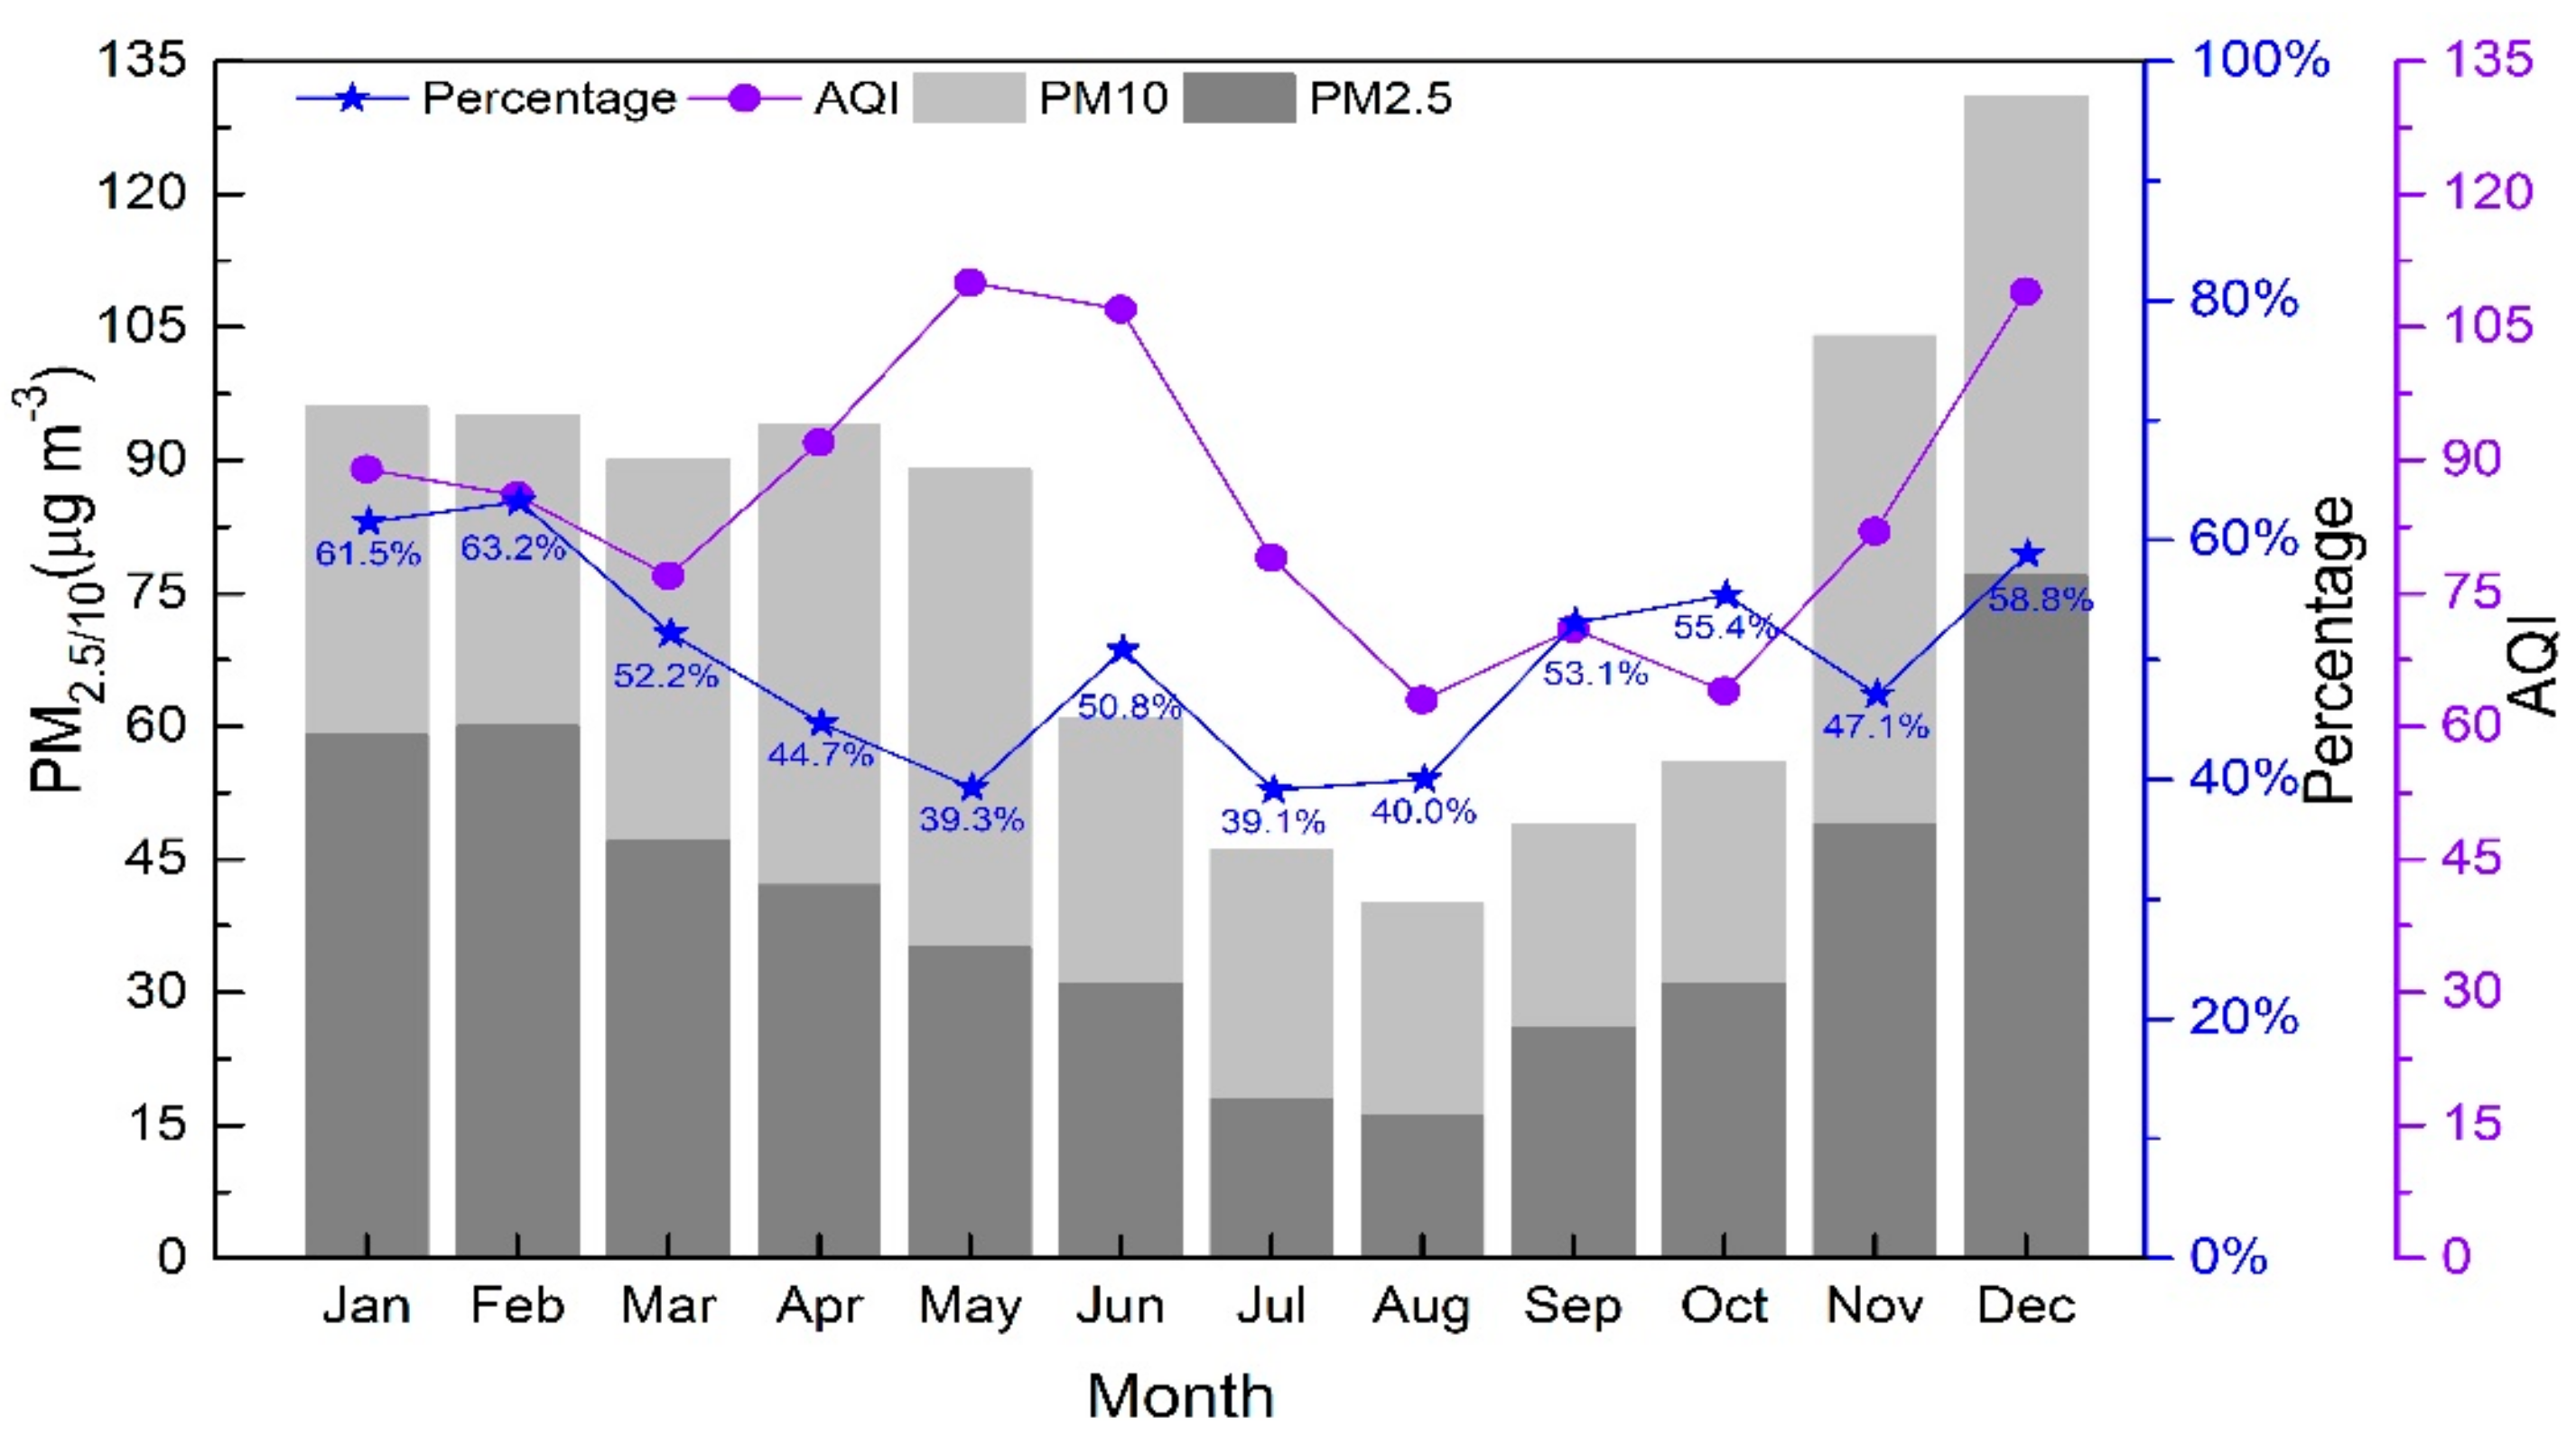
Figure 3.
Daily variation of (a) AQI (air quality index), (b) visibility (V), (c) temperature (T), (d) RH (relative humidity), (e) WD (wind direction), (f) WS (wind speed) during the summer and winter pollution episodes, and the weeks preceding these.
Figure 3.
Daily variation of (a) AQI (air quality index), (b) visibility (V), (c) temperature (T), (d) RH (relative humidity), (e) WD (wind direction), (f) WS (wind speed) during the summer and winter pollution episodes, and the weeks preceding these.
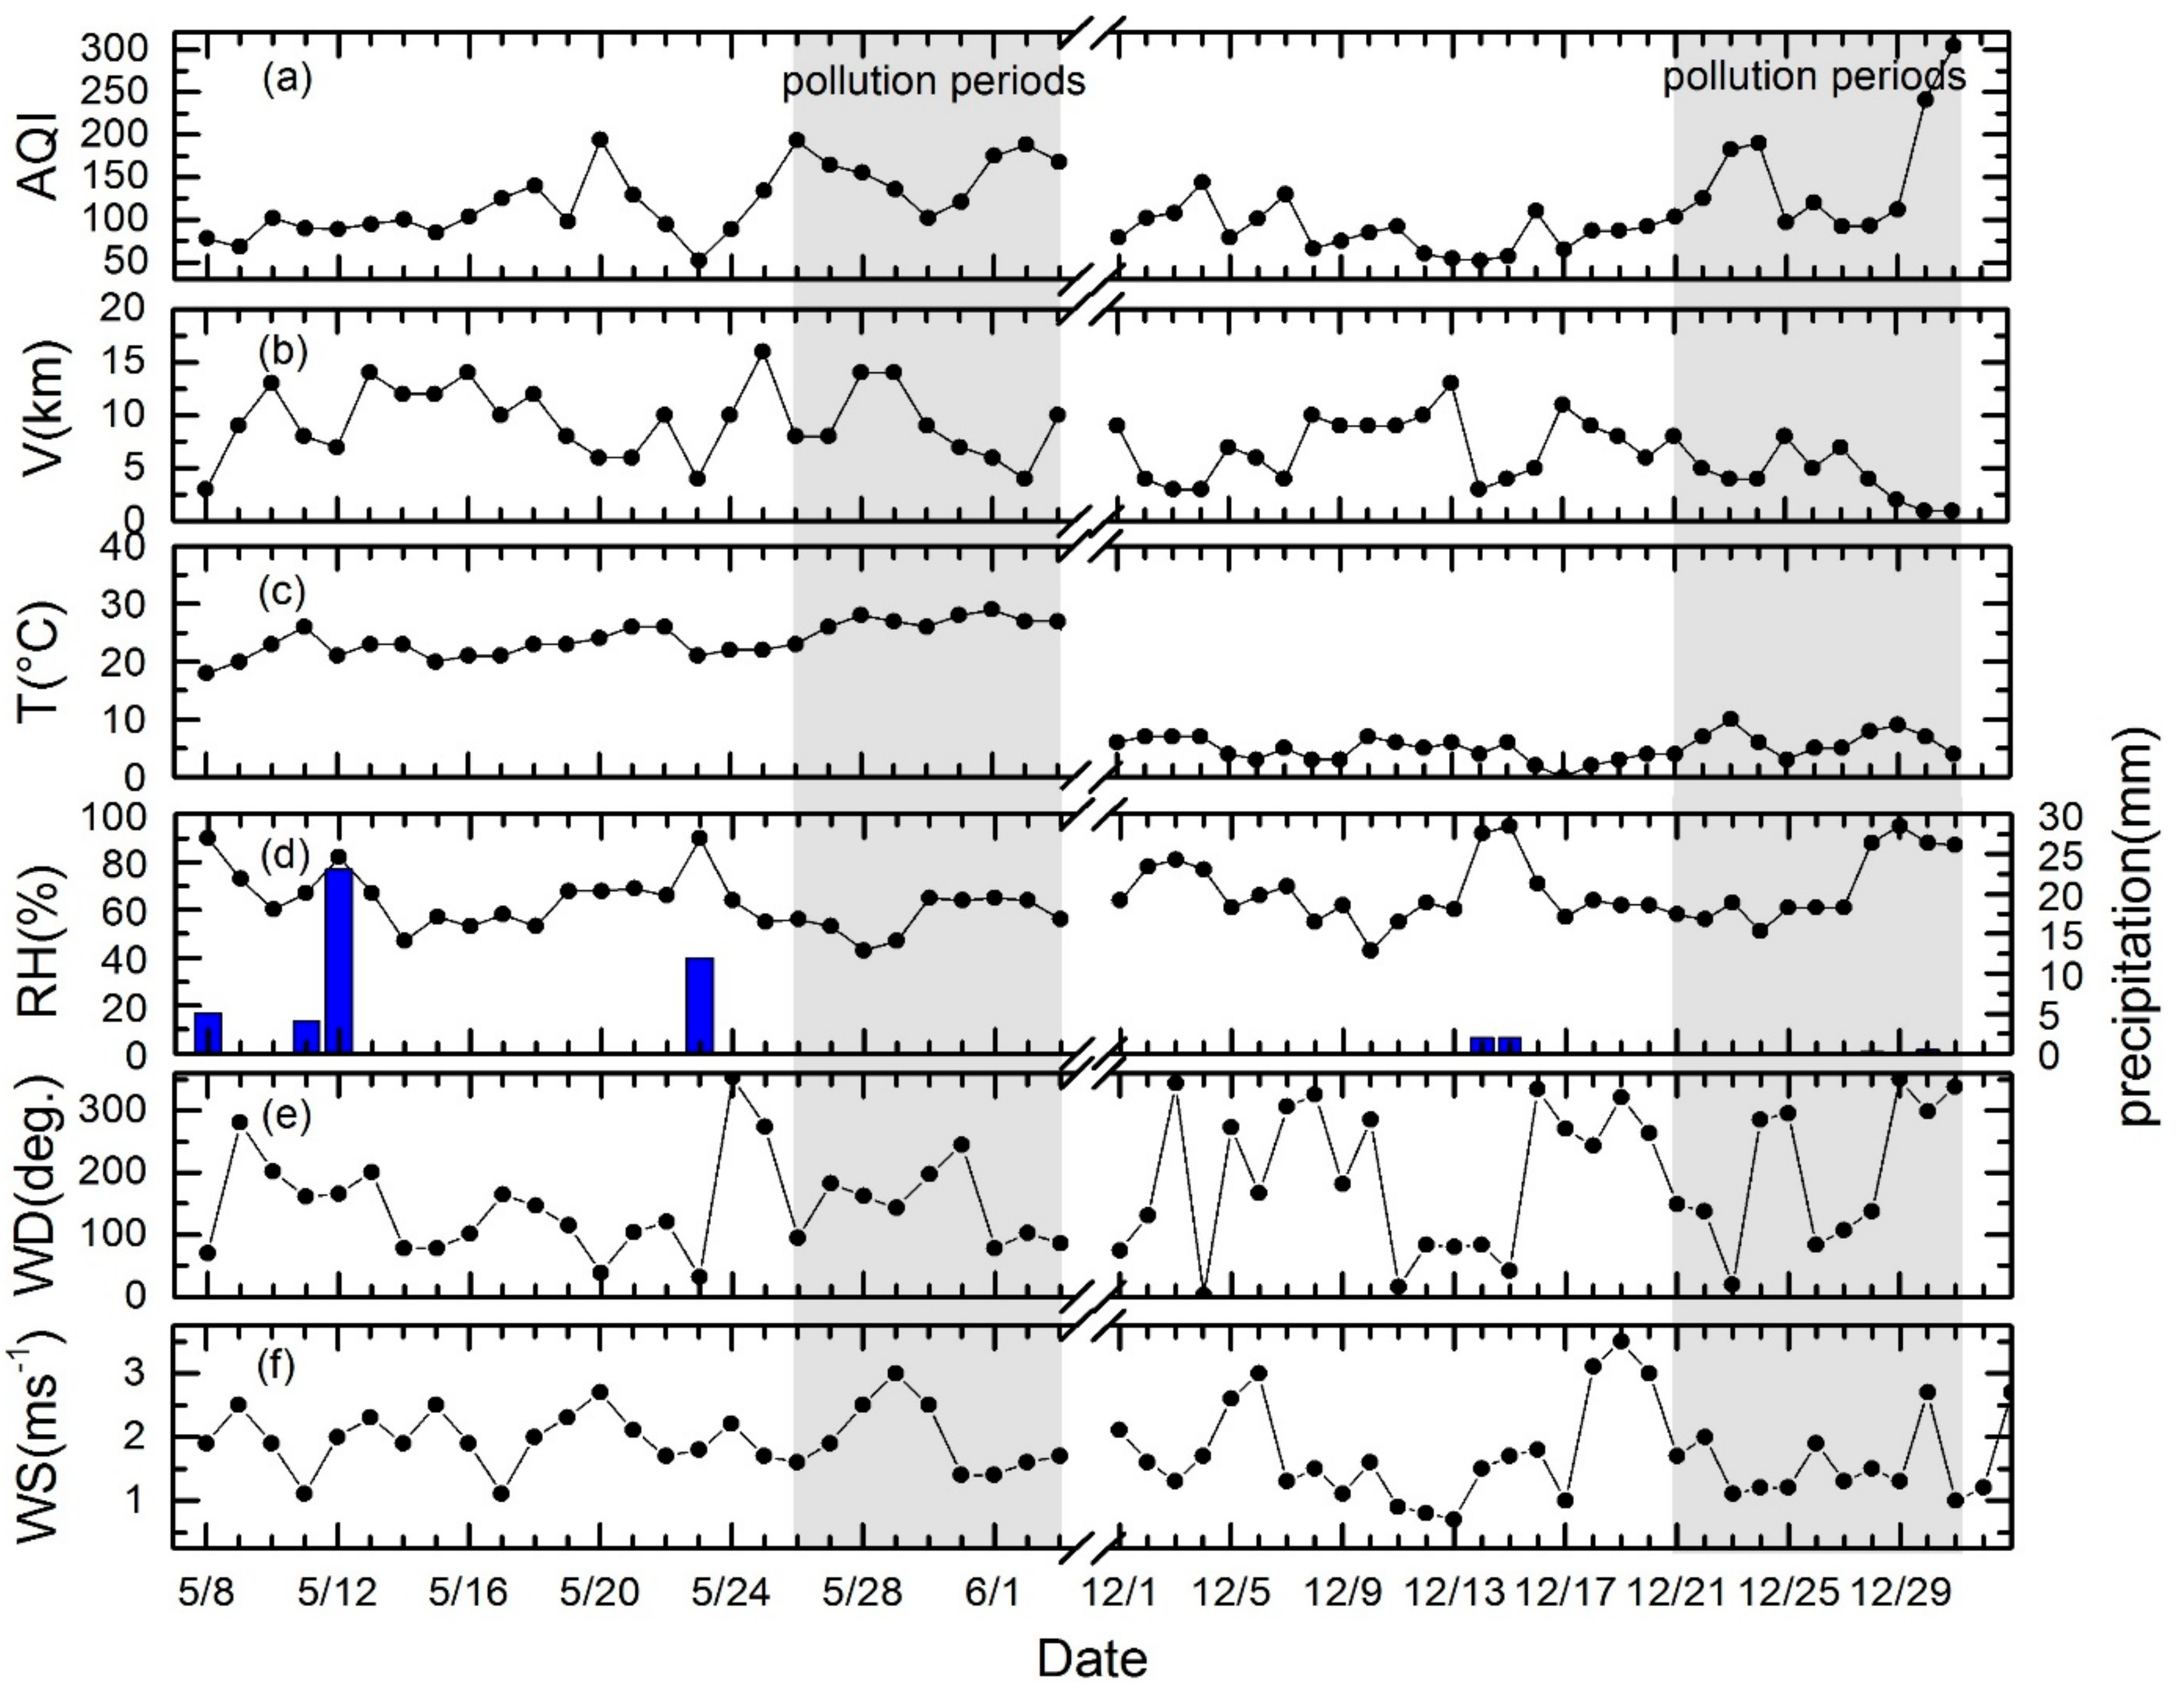
Figure 4.
Concentration contours of PM2.5/10 (in μg m−3) overlaid on wind roses for PM2.5 during summer (a) and winter (c) episodes, and similarly for PM10 during summer (b) and winter (d) episodes. PM2.5/10 concentrations (in μg m−3) are color-coded following the color scale to the right of each wind rose. The overlying thick black lines indicate wind direction frequency (%). The wind speed (in ms−1) scale is provided to the left of each figure.
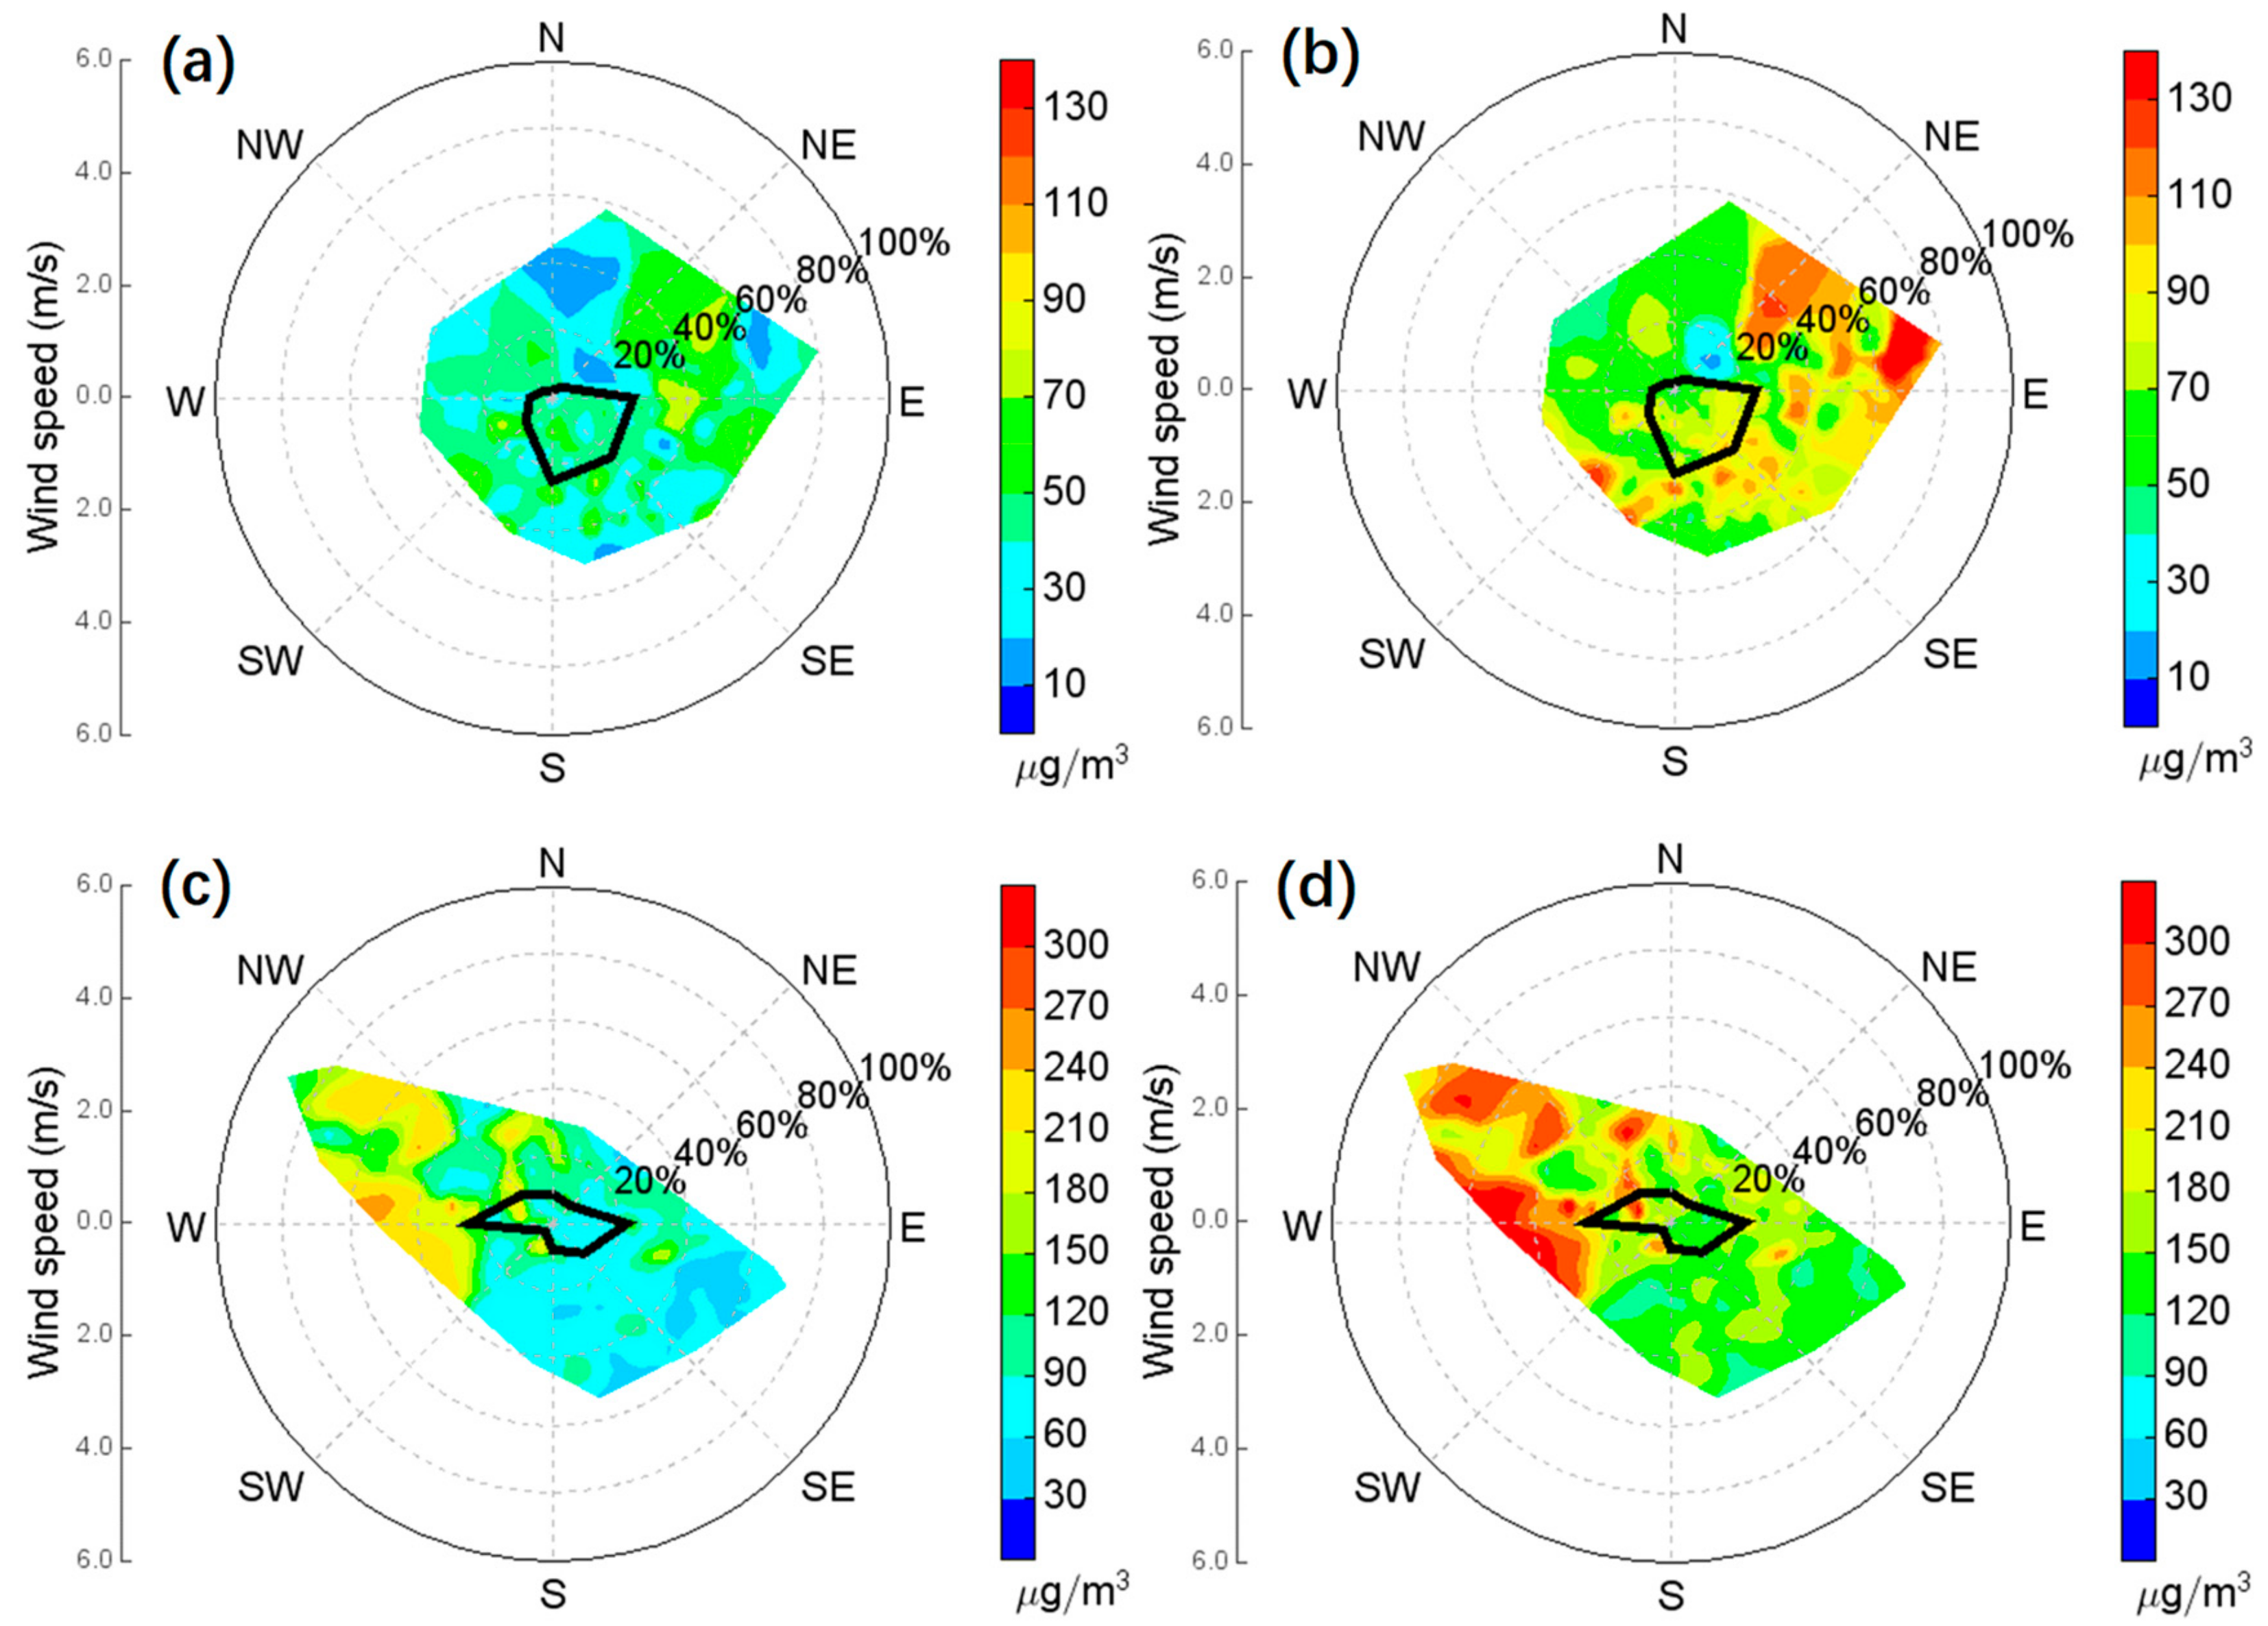
Figure 5.
Daily averaged (a,b) AOD (aerosol optical depth) at 500 nm (AOD500 nm) and AE (Angstrom Exponent) at 440–870 nm (AE440–870 nm), (c,d) VSD (volume size distribution), (e,f) PBLH (planetary boundary layer height) during the two pollution episodes. PBLH was provided from the National Center for Environmental Prediction’s 1°-grid-spacing operational Global Forecast System Final Analyses.

Figure 6.
Spectral variation of SSA (single scattering albedo) and ASY (asymmetry factor) during the two pollution episodes (a,d) total mode, (b,e) fine mode, (c,f) coarse mode.
Figure 6.
Spectral variation of SSA (single scattering albedo) and ASY (asymmetry factor) during the two pollution episodes (a,d) total mode, (b,e) fine mode, (c,f) coarse mode.

Figure 7.
The Spectral profile of (a) RRI (real part of the refractive index) and (b) IRI (imaginary part of the refractive index) during the two pollution episodes.
Figure 7.
The Spectral profile of (a) RRI (real part of the refractive index) and (b) IRI (imaginary part of the refractive index) during the two pollution episodes.

Figure 8.
Potential source contribution function (PSCF) maps for particulate matter, PM2.5 (a) summer, (c) winter and PM10 (b) summer, (d) winter.
Figure 8.
Potential source contribution function (PSCF) maps for particulate matter, PM2.5 (a) summer, (c) winter and PM10 (b) summer, (d) winter.

Figure 9.
Concentration-weighted trajectory (CWT) method analysis maps for particulate matter, PM2.5 (a) summer, (c) winter and PM10 (b) summer, (d) winter.
Figure 9.
Concentration-weighted trajectory (CWT) method analysis maps for particulate matter, PM2.5 (a) summer, (c) winter and PM10 (b) summer, (d) winter.
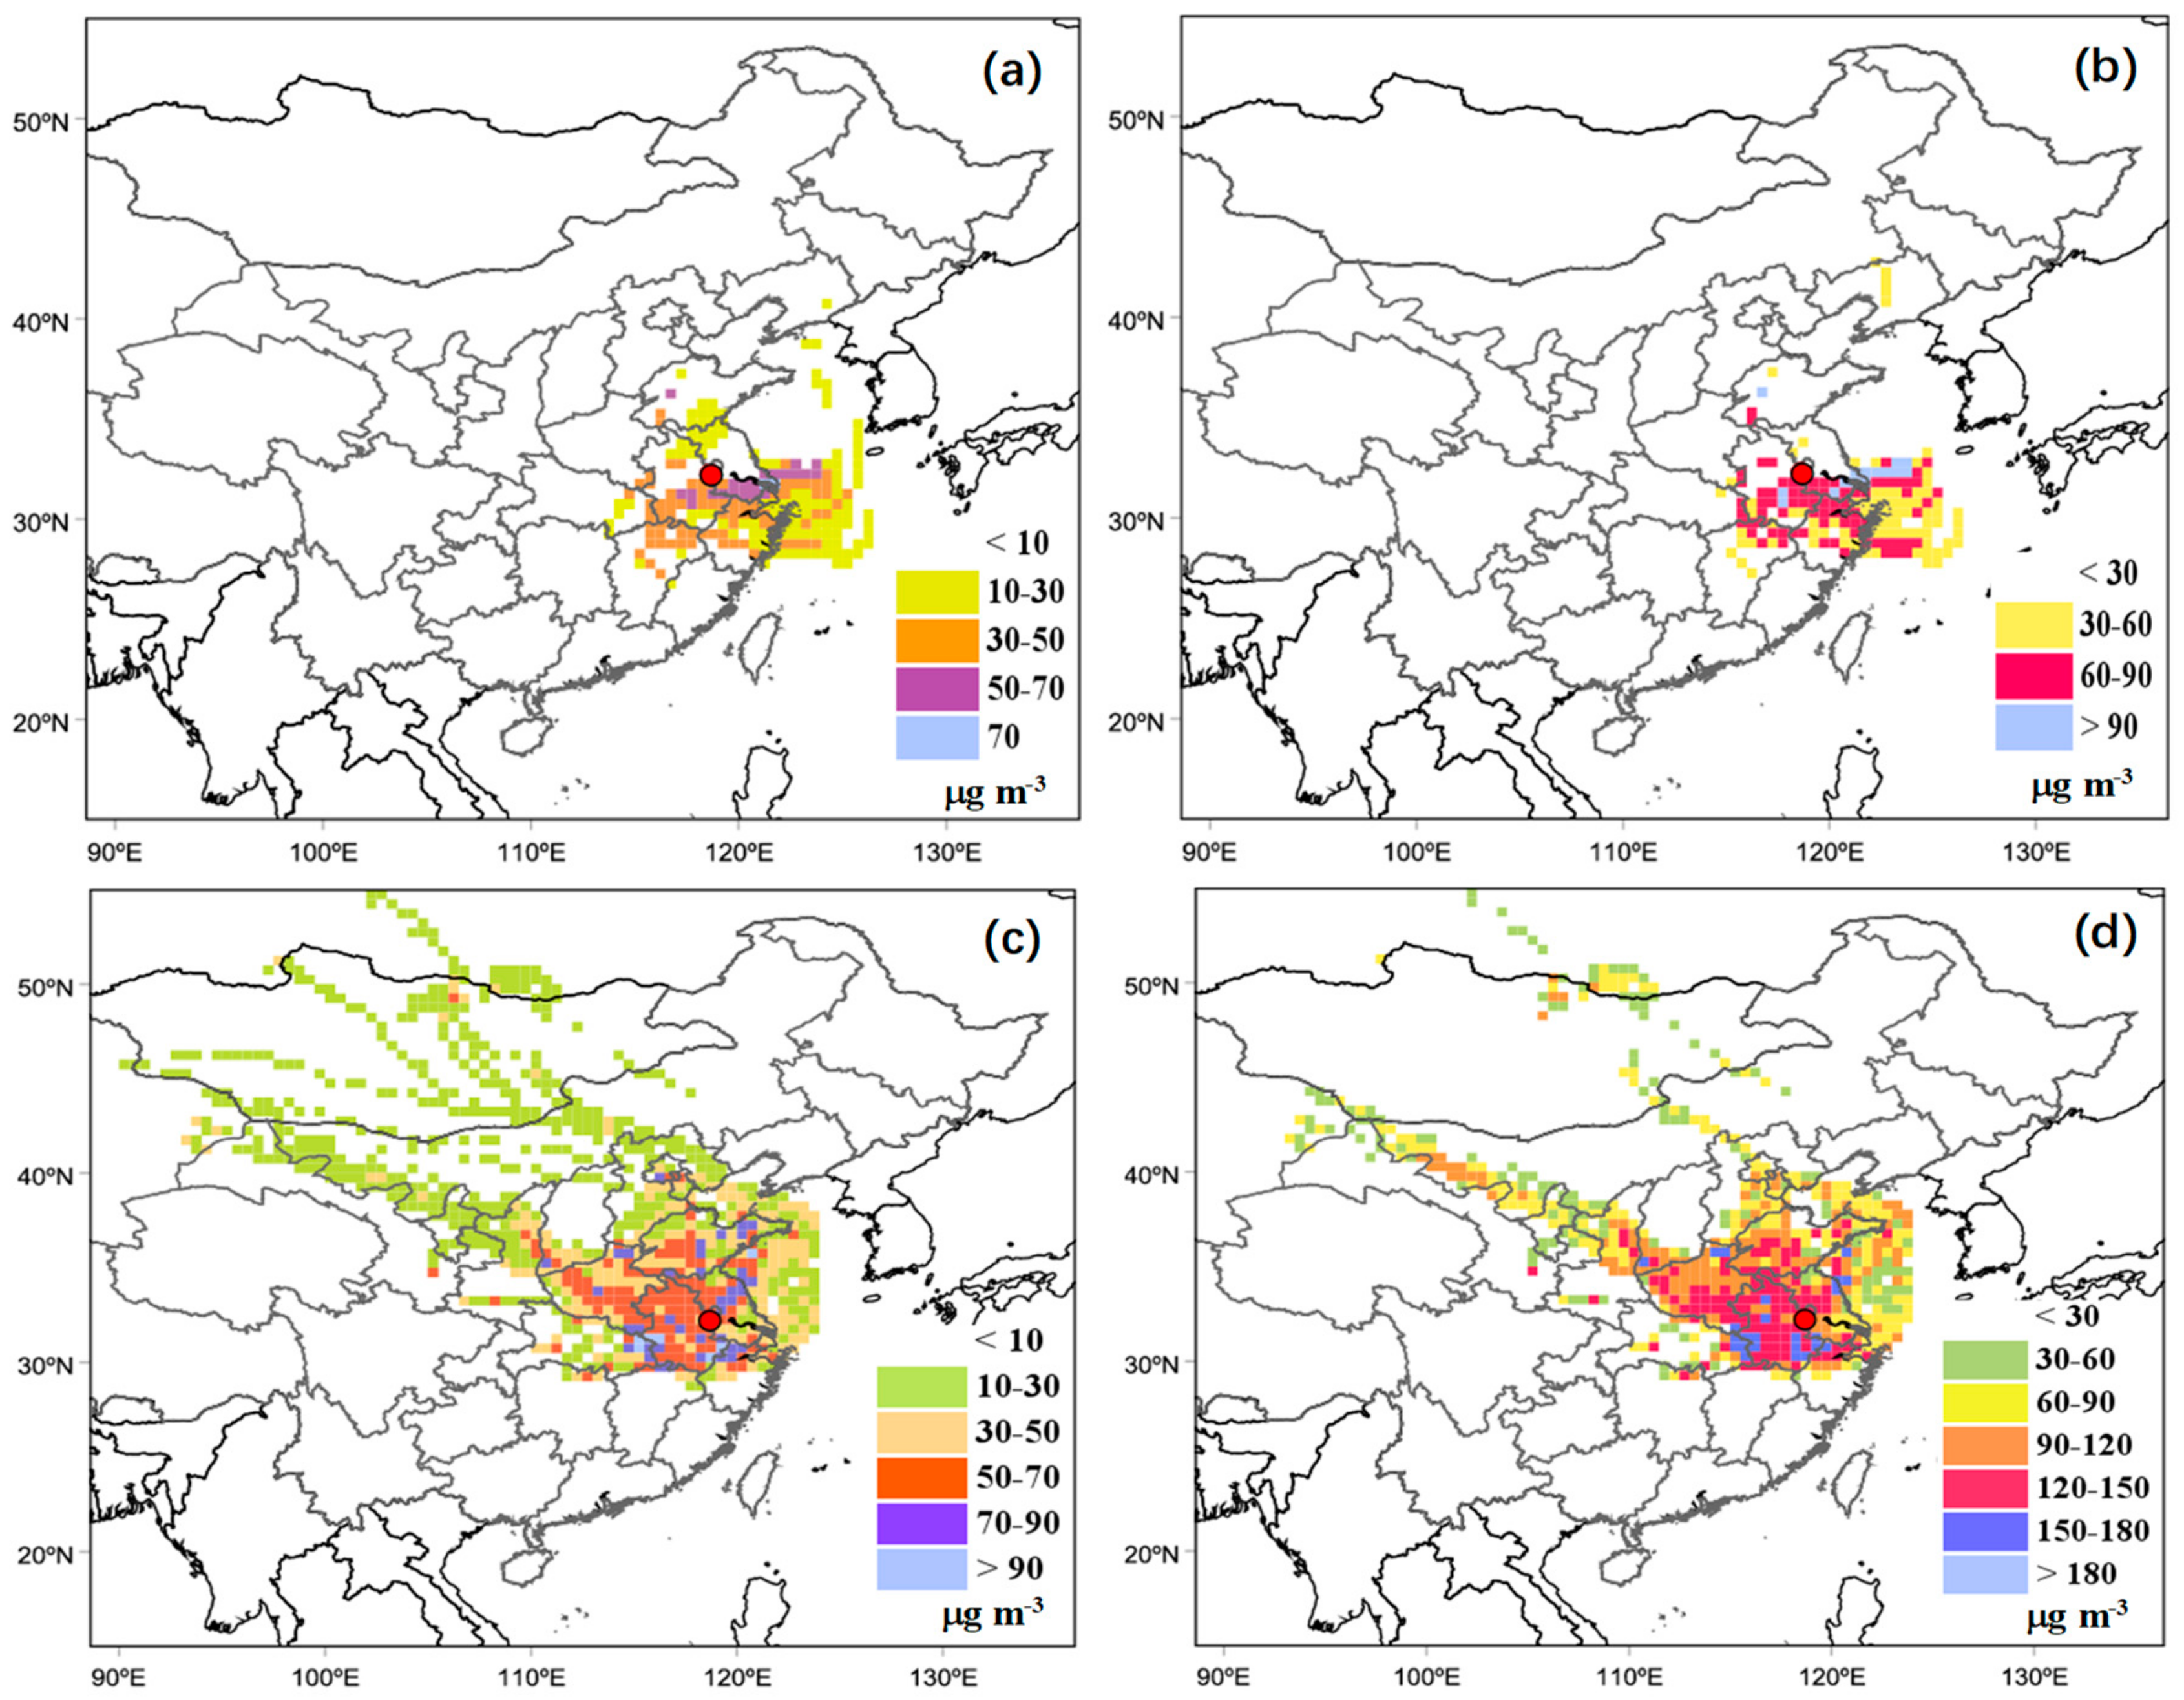
Figure 10.
True color images derived from MODIS 2 km fires counts (a) 20170526.terra, (b) 20170527.aqua, (c) 20170602.terra, (d) 20171224.aqua, (e) 20171225.terra, and (f) 20171226.aqua.
Figure 10.
True color images derived from MODIS 2 km fires counts (a) 20170526.terra, (b) 20170527.aqua, (c) 20170602.terra, (d) 20171224.aqua, (e) 20171225.terra, and (f) 20171226.aqua.


Table 1.
Average concentrations of particulate matter (PM)2.5, PM10, and PM2.5/PM10 ratio at the nine sites in Nanjing during the summer and winter pollution episodes in 2017, as defined in the text.
Table 1.
Average concentrations of particulate matter (PM)2.5, PM10, and PM2.5/PM10 ratio at the nine sites in Nanjing during the summer and winter pollution episodes in 2017, as defined in the text.
| Station Number# | Station Name | Latitude (°E) | Longitude (°N) | PM2.5(μg m−3) | PM10(μg m−3) | PM2.5/PM10 | |||
|---|---|---|---|---|---|---|---|---|---|
| Summer | Winter | Summer | Winter | Summer | Winter | ||||
| 1151 | Maigaoqiao | 118.803 | 32.1083 | 48.4 ± 20.5 | 113.8 ± 75.8 | 118.3 ± 34.8 | 195.6 ± 89.8 | 0.4 ± 0.1 | 0.5 ± 0.1 |
| 1152 | Caochangmen | 118.749 | 32.0572 | 39.7 ± 18.9 | 105.2 ± 76.0 | 91.4 ± 30.3 | 176.2 ± 83.8 | 0.4 ± 0.1 | 0.6 ± 0.2 |
| 1153 | Shanxilu | 118.778 | 32.0723 | 50.0 ± 22.0 | 109.7 ± 75.9 | 111.8 ± 41.1 | 193.8 ± 91.9 | 0.4 ± 0.1 | 0.5 ± 0.1 |
| 1154 | Zhonghuamen | 118.777 | 32.0144 | 52.9±22.9 | 107.3 ± 71.4 | 92.4 ± 28.7 | 174.8 ± 82.2 | 0.6 ± 0.2 | 0.6 ± 0.1 |
| 1155 | Ruijinlu | 118.803 | 32.0314 | 53.1 ± 20.0 | 128.8 ± 80.2 | 98.0 ± 26.8 | 182.9 ± 86.5 | 0.5 ± 0.1 | 0.7 ± 0.2 |
| 1156 | Xuanwuhu | 118.795 | 32.0775 | 36.2 ± 17.2 | 123.4 ± 81.1 | 89.1 ± 28.4 | 173.3 ± 85.4 | 0.4 ± 0.1 | 0.6 ± 0.2 |
| 1157 | Pukou | 118.626 | 32.0878 | 44.1 ± 20.1 | 103.8 ± 68.4 | 79.6 ± 29.9 | 189.2 ± 83.3 | 0.6 ± 0.2 | 0.5 ± 0.1 |
| 1158 | Aotizhongxin | 118.737 | 32.0092 | 55.5 ± 21.3 | 124.0 ± 73.6 | 115.7 ± 33.1 | 165.8 ± 72.2 | 0.5 ± 0.1 | 0.7 ± 0.2 |
| 1159 | Xianlin | 118.907 | 32.105 | 55.7 ± 23.6 | 106.2 ± 71.7 | 109.4 ± 37.8 | 190.1 ± 93.2 | 0.5 ± 0.1 | 0.5 ± 0.1 |
© 2019 by the authors. Licensee MDPI, Basel, Switzerland. This article is an open access article distributed under the terms and conditions of the Creative Commons Attribution (CC BY) license (http://creativecommons.org/licenses/by/4.0/).
Share and Cite
MDPI and ACS Style
Wang, J.; de Leeuw, G.; Niu, S.; Kang, H. Contrasting Aerosol Optical Characteristics and Source Regions During Summer and Winter Pollution Episodes in Nanjing, China. Remote Sens. 2019, 11, 1696. https://doi.org/10.3390/rs11141696
AMA Style
Wang J, de Leeuw G, Niu S, Kang H. Contrasting Aerosol Optical Characteristics and Source Regions During Summer and Winter Pollution Episodes in Nanjing, China. Remote Sensing. 2019; 11(14):1696. https://doi.org/10.3390/rs11141696
Chicago/Turabian StyleWang, Jing, Gerrit de Leeuw, Shengjie Niu, and Hanqing Kang. 2019. "Contrasting Aerosol Optical Characteristics and Source Regions During Summer and Winter Pollution Episodes in Nanjing, China" Remote Sensing 11, no. 14: 1696. https://doi.org/10.3390/rs11141696
Note that from the first issue of 2016, this journal uses article numbers instead of page numbers. See further details here.