Article

Assessing the Remotely Sensed Evaporative Drought Index for Drought Monitoring over Northeast China

1
State Key Laboratory of Remote Sensing Science, Faculty of Geographical Science, Beijing Normal University, Beijing 100875, China
2
Faculty of Geo-Information and Earth Observation (ITC), University of Twente, Enschede 7500 AE, The Netherlands
*
Author to whom correspondence should be addressed.
Remote Sens. 2019, 11(17), 1960; https://doi.org/10.3390/rs11171960
Submission received: 30 July 2019 / Accepted: 13 August 2019 / Published: 21 August 2019
(This article belongs to the Special Issue Remote Sensing of Drought Monitoring)

Abstract

:
Many existing satellite evapotranspiration (ET)-based drought indices have characterized regional drought condition successfully, but the relatively short time span of ET products limits their use in long-term climatological drought assessment. In this study, we assess Evaporative Drought Index (EDI) as a drought monitoring indicator over Northeast China through a retrospective comparison with drought-related indicators. After verifying its utility for detecting documented regional drought events and impacts of drought on crop production, we apply it to improve our understanding of the variation in dryness over Northeast China from 1982 to 2015. Our results illustrate that EDI is generally effective for characterizing terrestrial moisture condition and its standardized formula, namely, Standardized Evaporative Drought Index (sEDI) corresponds well with historical drought events and inter-annual grain crop yields over Northeast China. Although the calculation of sEDI does not directly incorporate precipitation and soil moisture, statistical analyses indicate sEDI can detect drought in accordance with the Standardized Precipitation Index (SPI) and Palmer Drought Severity Index (PDSI), with the highest correlations found in the west part of Northeast China (R < −0.7). Further analysis illustrates sEDI is more related to commonly-used drought metrics over areas with short canopy vegetation (R < −0.5) than woodland (R < −0.2), which suggests precipitation may not be a good representative of drought condition over areas with deep-rooted vegetation. Then, we find 56.5% of Northeast China shows an upward dry trend from 1982 to 2015, which mainly concentrates in the west part of the study area. Conversely, 14.4% of Northeast China shows a significant wetted trend and most of them locate at cropland areas, due to the improved water management. This study suggests that EDI is a feasible method to monitor spatially distributed drought condition and can provide unique drought information not reflected by rainfall deficits, which also can be used to evaluate traditional precipitation-based indicators.

Graphical Abstract

1. Introduction

Drought is a recurring phenomenon of prolonged absence or marked deficiency of precipitation and possibly occurs in any precipitation or temperature regime [1]. As a consequence of climate change, the occurrence of extreme drought events became more frequent all over the world [2,3]. Extensive severe drought episodes have significant impacts on the water cycle and natural ecosystem, especially for developing economics, and have caused up to 30% losses from all disasters, ranking first among all the natural hazards [4]. As a main region for commercial grain and economic crop, Northeast China has experienced substantially frequent and severe drought hazards in recent decades, which pose an enormous threat to national food security [5]. The special geographical position (climatic transition zones between the semi-arid and humid region) and the diversity of biomass of Northeast China make it more complex for operational drought monitoring. Given that frequent drought episodes seriously affect local agricultural production and water supply over Northeast China [6,7], it is urgent to develop an effective drought indicator that incorporates operational drought monitoring and spatially distributed information dissemination to assist decision-makers for drought planning and mitigation.
Drought is difficult to directly measure or define, but alternatively, drought indicators combining drought-related environmental variables can characterize the severity and duration of drought [8]. Early drought indicators require local observations of precipitation through rain gauge networks [9]. Based on ground-based point observations, the Palmer Drought Severity Index (PDSI) [10] and Standardized Precipitation Index (SPI) [11] have successfully validated the significant increment in drought severity over Northeast China in past decades [12,13]. It is emphasized that, in areas with sparse observations (e.g., the north part of Northeast China), traditional metrological methods are not sufficient to capture the detailed spatial pattern of drought conditions at a regional scale [14]. Currently, remote sensing provides continuous and consistent observations related to surface moisture status and these satellite-derived products have led to new developments in drought monitoring [15,16]. In comparison with traditional metrological drought indices, drought indices using thermal or optical satellite data convey spatially explicit information and allow for the acquisition of near real-time surface dryness condition [17]. For example, Qi et al. [18], based on Moderate Resolution Imaging Spectroradiometer (MODIS), Normalized Difference Vegetation Index (NDVI), and Land Surface Temperature (LST) data, successfully prove the utility of Temperature Vegetation Dryness Index (TVDI) in Northeast China. However, their operational applications still have been constrained by some problems including the missing data due to cloud contamination and the varying time lag between drought occurrences and vegetation response [19,20].
When drought occurs, evapotranspiration (ET), a key component of the water and energy exchange between the atmosphere and land surface, will fall far below potential evapotranspiration (PET), which opens a new avenue for operational drought monitoring [21]. Compared with former approaches, drought monitoring based on ET is a more direct and cost-effective approach to describe both water availability and water consumption rate. In past decades, several drought indices using ET or PET have been developed such as Crop Water Stress Index (CWSI) [22], Water Deficit Index (WDI) [23], Evaporative Wet Index (EWI) [24], ALEXI-based Evaporative Stress Index (ESI) [25], and Drought Severity Index (DSI) [26]. However, the application of these ET-based indicators for characterizing surface moisture condition was limited by the relatively short time span of ET estimates used [27,28]. Given that drought is always defined as dimensionless values, a relatively long-term dataset (generally 30 years of records are required) is necessary to facilitate retrospective analysis of drought monitoring [29]. Therefore, a series of evaluation work for ET-based drought monitoring indicators need to be explored within the long-term historical context.
Evaporative Drought Index (EDI), as a satellite drought monitoring indicator, has minimal ground data requirements and no need for local calibration [30,31,32]. Although its sensitivity to land surface moisture stress has been demonstrated at continental or global scales [33,34], to our knowledge, there is a lack of similar studies that assess its utility for long-term climatological drought monitoring, particularly for Northeast China with high latitude and distinct monsoon climate. Most currently, a satellite-derived ET dataset of Northeast China during 1982–2015 is generated by a modified satellite-based Priestley-Taylor (MS-PT) algorithm [35,36]. In comparison with MODIS ET products, it provides more reliable ET estimations over Northeast China with larger correlation coefficients and smaller root mean square error. Based on the long-term and continuous ET estimates and Penman–Monteith PET method suggested by Food and Agriculture Organization (FAO), a spatially distributed EDI dataset of Northeast China (1982–2015) is available at monthly temporal and 0.1° spatial resolution. In consideration of the heterogeneity of terrestrial ecosystems and the limitations of traditional drought monitoring methods, we take a standardization calculation to EDI and using its standardized formula, namely, Standardized Evaporative Drought Index (sEDI) to monitor drought variation over Northeast China.
In this study, we evaluate the capability of EDI for characterizing regional moisture status and, based on multiyear EDI results, we derive its anomaly, namely, sEDI to detect documented regional drought events and the impacts of drought on crop production over Northeast China through a retrospective comparison with drought-related indicators. Then, we analyze the long-term annual and seasonal variation of land surface dryness conditions over Northeast China in the period of 1982–2015.

2. Materials and Methods

2.1. Study Area

Northeast China (38°42′–53°55′N, 115°32′–135°09′E) comprises Heilongjiang, Jilin, Liaoning, and some areas of the Inner Mongolia Autonomous Region, including Hulun Buir, Xingan Meng, Tongliao, and Chifeng (Figure 1) [37]. The main land use type of this region includes woodland (41.50%), dry land (27.78%), grassland (18.53%), and paddy (3.62%) [38]. Due to the relatively high latitude, the annual average temperature of this region is about 1.9–5.3 °C [39]. The main climatic type of this region is temperate monsoon climate and the precipitation has large seasonal variability that approximately three quarter of it falls in the period of June to September [40]. According to statistical data, the corn acreage of this region accounts for 26.3% of the total corn area in China and accounts for 29.4% of Chinese total corn grain production, benefiting from the fertile soil and dense distribution of river [41]. However, due to the uncontrolled human exploitation and the uneven spatiotemporal distribution of precipitation, Northeast China is one of the most susceptive areas to climate change in the country [42]. It has been reported that since the 1950s, the mean temperature of this region has increased at a rate of 0.34 °C per decade, which is much higher than the average increasing trend of temperature over the country [43,44]. On the other hand, influenced by significant fluctuation of annual precipitation, there was an obvious increment in severe dryness event over Northeast China during 1951–2002 [45].

2.2. Data and Preprocessing

2.2.1. Remote Sensing Data

The primary remote sensing data of this paper is Global Inventory Modeling and Mapping Studies (GIMMS) NDVI3g.v1 data (1982–2015) generated from the Advanced Very High Resolution Radiometer (AVHRR), which is available from National Oceanic and Atmospheric Administration (NOAA) [46]. This product provides global bimonthly NDVI at 8 km spatial resolution and the vegetation information of Northeast China can be obtained from it, which is resampled to 0.1° using linear interpolation and clipped to the extent of Northeast China. On the other hand, the MODIS land cover type product (MCD12C1) was used to characterize the study region, which is available from the National Aeronautics and Space Administration (NASA) Land Processes Distributed Active Archive Center (LP DAAC) [47].

2.2.2. Meteorological Reanalysis Data

The gridded China Meteorological Forcing Dataset (CMFD), developed by Cold and Arid Regions Science Data center at Lanzhou, was employed as ET and PET model input [48]. This dataset contains near-surface air temperature (T), air pressure (Pa), wind speed (WS), specific humidity (SH), precipitation (P), and downward shortwave radiation (Rs) in the period of 1982–2015, with a temporal resolution of 3 h and a spatial resolution of 0.1°. A previous study illustrated that, compared with other reanalysis and satellite products, CMFD provides more accurate meteorological parameters over China [49]. In our study, we derive the daily meteorological information of Northeast China from this dataset and use it as the main input data for both ET and PET.

2.2.3. Gridded Drought/Soil Moisture Data

To evaluate the performance of EDI, several drought-related gridded datasets were used in this study. The Climate Prediction Center Soil Moisture Dataset provided by National Centers for Environmental Prediction consists of a file containing global monthly averaged soil moisture at 0.5° (1948–2015) [50,51]. The 0.5° PDSI dataset was provided by Zhao and Running, which contains monthly PDSI from 1979 to 2013 [52,53]. The monthly Research Data Archive (RDA) analysis SPI dataset for the period of 1949–2012 was downloaded from National Center for Atmospheric Research, with a 3 month and 1° scale [54]. In this study, we used these gridded datasets to evaluate the ability of EDI for drought monitoring and both temporal composite and spatial aggregation methods were applied to match with the spatial resolution of EDI.

2.2.4. Statistics of Crop Yields

Province-level crop yield dataset for Heilongjiang, Jilin, and Liaoning from 1982 to 2015 were obtained from Crop and Disaster Databases of Ministry of Agriculture and Rural Affairs of the Peoples Republic of China (available online: http://zdscxx.moa.gov.cn/). This dataset contains planted area (ha), production (t), and yield (t/ha) for grain crop, which updates annually for all provinces in China. To remove influences from technological advances, land management, or genetic improvements in cultivars, detrended yields were computed at province level as departures from a linear regression in time.

2.3. Methods

2.3.1. EDI Description and Standardized Calculation

The ratio of ET to PET is commonly used as an indicator of terrestrial water availability and associated wetness or dryness condition. Given the fact that, when water is limited, actual ET will be less than the PET, EDI is designed by 1 minus the ratio of ET to PET [30].
EDI = 1 E T P E T .
EDI is sensitive to moisture stress and the value of it ranges from 0 to 1. Higher EDI means more severe water stress and lower EDI means less water stress.
To highlight the drought severity over different areas with different perennial moisture status for continuous years, we introduce a standardization process to EDI and derive EDI anomaly, namely, the Standardized Evaporative Drought Index (sEDI). The sEDI takes into account the regional normal climatic variability and can quantify the wetness or dryness of a region in a given monthly or yearly period:
sEDI = E D I E D I ¯ σ E D I ,
where E D I ¯ denotes the temporal average EDI at a 3 month scale and σEDI is the temporal standard deviation of EDI. Higher sEDI means severe drought compared to local normal dryness condition and lower sEDI indicates less or no drought occurred at this moment.

2.3.2. Estimation of ET and PET

ET is a significant factor for the terrestrial drought status and gives important water stress information about soil, plants, and atmosphere. Traditional ET estimation models require numerous physical input parameters, which are not easy to acquire and leads to accumulated error [55]. A simple process-based Priestley–Taylor (PT) ET method developed for China, merely needs four surface parameters including surface net radiation, vegetation indices, air temperature, and diurnal air temperature range, without decreasing the accuracy of ET estimations [35,56]. Validation results show that, compared with MODIS ET products, this method provides a more favorable agreement with the ground-measured data over Northeast China [36]. This method can be expressed as:
ET = E T s + E T c + E T w s + E T i c ,
E T s = ( 1 f w e t ) f s m α Δ Δ + γ ( R n s G ) ,
E T c = ( 1 f w e t ) f c f T α Δ Δ + γ R n v ,
E T w s = f w e t α Δ Δ + γ ( R n s G ) ,
E T i c = f w e t α Δ Δ + γ R n v ,
where α is the PT coefficient of 1.26, ETS is the unsaturated soil evaporation, ETc is the canopy transpiration, ETws is the saturated wet soil surface evaporation, and ETic is the canopy interception evaporation. Moreover, fwet is the wet surface fraction (fsm4), fsm can be derived from Apparent Thermal Inertia (ATI), namely, fsm = (1/DT) DT/DTmax, DT is the diurnal air temperature range (DTmax = 40 °C), fT represents plant temperature constraint (exp(− (Tmax − Topt)/Topt)2), Topt is an optimum temperature (25 °C). Rn is the net radiation, G is the soil heat flux, Rns is the surface net radiation to the soil (Rns = Rn(1 − fc)), Rnv represents the surface net radiation to the vegetation (Rnv = Rnfc), fc is the vegetation cover fraction (fc = (NDVI − NDVImin)/(NDVImax − NDVImin)), NDVImin and NDVImax are the minimum and maximum NDVI during the study period, which are set as invariant constants 0.05 and 0.95, respectively [57]. The detailed calculation can be found in Yao et al. [35] and Zhang et al. [36].
PET is not only the ideal evaporation rate of capturing response to forcing variables when soil moisture is not limited, but also an important factor related to dry and wet conditions [58]. The FAO Penman–Monteith method has been regarded as a standard method to estimate PET worldwide and can be described as:
PET = 0.408 Δ ( R n G ) + γ ( 900 T a i r + 273 ) W S ( e s e ) ) Δ + γ ( 1 + 0.34 W S ) ,
where WS is the wind speed, es is the saturated vapor pressure, and e refers to air water vapor pressure. For consistent inter-comparisons, ET and PET results were then converted from daily data to monthly/annual data using a time weighting method.

2.3.3. Comparison Drought Metrics

The PDSI is based on a two-layer bucket water balance model and measures the moisture anomaly using long-term historical precipitation and mean temperature data [59]. This drought index considers both water supply and demand, which is one of the most widely used indicators today [60]. The main calculation of PDSI can be described as:
P D S I i = 0.897 P D S I i 1 + Z i 3 ,
Z = d k ,
d = P P ^ ,
P ^ = α P E T + β P R + γ P R O ξ P L ,
where i represents the i th month of a dry spell, Z is the anomaly of soil moisture, k, α, β, γ, and ζ are ratios of long-term mean quantities, d is the difference for each month between the actual precipitation (P) and the “CAFEC” (Climatically Appropriate For Existing Conditions) precipitation, PET is potential evapotranspiration, PR is potential recharge, PRO is potential runoff, and PL is potential loss.
The SPI transforms a long span of precipitation observations into a standard normal distribution and has multiple simultaneous timescales, which is a marked advantage compared with PDSI [61]. The SPI was calculated by fitting precipitation data to an incomplete gamma probability density function and standardizing the transformed data so that they are normally distributed with a mean of zero and a variance equal to one. The detailed calculation can be found in McKee et al. [11].

2.3.4. Statistical Comparisons

Using this anomaly dataset, we assess the temporal and spatial similarity between EDI and drought indices to determine dryness condition and to visualize drought patterns using Pearson’s Correlation Coefficient, namely Equation (9). The Pearson’s Correlation Coefficient between EDI and other indices was calculated to determine the relevance of sEDI.
R = i = 1 n ( x i x ¯ ) ( y i y ¯ ) i = 1 n ( x i x ¯ ) 2 i = 1 n ( y i y ¯ ) 2 ,
where x represents the EDI, y represents related drought indices, and n is the number of samples. The flowchart of procedure used in this study can be seen in Figure 2.

3. Results

3.1. Drought Index Intercomparisons

3.1.1. Climatological Characteristics

Maps (monthly and the main growth period of vegetation) of Soil Moisture (SoilM), ET, EDI, SPI, and PDSI for the 2000–2010 period are shown in Figure 3, selected to exemplify a range in time scales and modeling approaches. As presented in SoilM normal fields, the spatial distribution of soil moisture over Northeast China has a typical declining trend from southeastern coastal areas to inland northwest, which is relevant to the east-to-west decreasing rainfall gradient. Similarly, except for the summer (June, July, and August), ET normal maps have the same distribution characteristics as soil moisture maps, demonstrating the tight relationship between ET and soil moisture availability. As strong rainfall and high temperature significantly enhance surface evaporation, the spatial distribution of ET is different from soil moisture in summer months. By contrast, in other seasons when the surface water supply mainly originates from soil moisture, the gap between ET and soil moisture subsequently narrows.
EDI normal maps generally show a consistent spatial pattern with SPI and PDSI normal maps in Figure 3. All maps of drought-related indices demonstrate that the west part of Northeast China is the drought-prone area, which is consistent with previous research [5]. However, owing to different consideration factors, spatial patterns of EDI are not identical to precipitation-based drought index fields. For example, the water status of the northeast part of the study region is identified as dryness in SPI normal maps, but this dry patch is judged as wetness by EDI and PDSI. That is because precipitation is the sole input parameter for SPI, which ignores other water sources from surface rivers and agricultural irrigation. Notably, limited by relatively low temperature, EDI classifies most regions of Northeast China as dryness in spring (April and May), which is different from precipitation-based indicators. Without the consideration of surface moisture condition in different seasons, the magnitude of EDI is variable for a given month [26], which highlights the importance of the standardization process to EDI.
As shown in Figure 4, the standard deviation of these five indices from 2000 to 2010 conveys additional information about relative index behavior and their responsiveness to climatic drivers. From the fields of soil moisture, we can notice that soil moisture varied most in the east part of Northeast China. Due to the fierce transpiration of forest in summer (June, July, and August), the actual ET is most variable in woodland areas. However, compared with precipitation-based indices, EDI shows low variability in woodland, where surface vegetation has access to shallow or deep groundwater. Only in areas where land use type is cropland, EDI varied strongly. This feature also can be seen in PDSI deviation fields. In contrast, due to the fluctuation of precipitation, the variability of SPI is similar over most areas of Northeast China.

3.1.2. Evaluation of The sEDI For Detecting Historical Drought Events

As shown in Table 1, the major drought events during 2004–2010 are recorded by the China Meteorological Disaster Yearbook and China Statistic Yearbook [62,63]. Considering different regions have distinctive dryness conditions, we derived EDI anomaly, namely, sEDI from multiyear data to eliminate the identical features over a long period of time. Our results demonstrate through a comparison with soil moisture anomaly, SPI, and PDSI, sEDI can effectively track documented droughts over Northeast China.
For the first case, the China Meteorological Disaster Yearbook states that millions of hectares of arable land over Northeast China suffered from drought in the first half of 2004, which was mainly distributed in western Heilongjiang, western Jilin, and Northern Liaoning. As shown in Figure 5, the sEDI maps note how this region suffered an extreme drought condition during wheat main growing season (marked as dash line). SPI and PDSI fields show a consistent spatial pattern, but the soil moisture anomaly has a slow reaction and fails to capture this drought episode immediately. Moreover, recorded by China Meteorological Disaster Yearbook, the monthly temperature of Heilongjiang was higher than the normal condition by 2.1 °C in April of 2006 and the monthly precipitation was the second least for the same period since 1951. Our results illustrate drought hotspots over central and western parts of Heilongjiang are well localized in the sEDI maps in the spring of 2006, which is consistent with SPI and PDSI (see Figure 6). Another typical severe drought hit Northeast China in early 2008, when seasonal rainfall fell to its minimum since 1951 [64]. As shown in Figure 7, our results verify the sustained shortage of water supply over Northeast China by all drought indicators.
For short-term drought events, the dryness condition patterns of Northeast China (September in 2010) are shown in Figure 8. A previous study suggests that precipitation deficits for a month can have a large effect on the PDSI values for several previous month and consequently, the time lag may limit its application for short-term drought monitoring [65]. Our results demonstrate the time lag of short-term drought episode exists in PDSI fields. In contrast, sEDI reasonably tracks the process that the drought situation turned to normal conditions after the drought event, which is consistent with SPI.

3.1.3. Evaluation of The sEDI For Detecting the Impacts of Drought on Crop Yields

Agriculture is the major sector to be affected by drought, and the variability of major grain crops production can be used to evaluate the impacts of drought on agricultural ecosystems. As shown in Figure 9a, our results illustrate province-level grain crop yields show an upward trend in the period of 1982–2012 over Northeast China, which can be attributed to improved agronomic management, such as use of fertilizer, irrigation, and weed, pest, and disease control. To eliminate influences from these factors and identify a meaningful relationship between grain crop yields and drought indices, the detrended grain crop yield data and district-averaged drought indices including sEDI, PDSI, and SPI were generated for each province.
In this study, three indicators generally capture the impacts of drought on crop production, but their correlations to detrended crop yields vary across different provinces. In Figure 9b, time series of sEDI has better inter-annual yield correlations (−0.47) than PDSI (0.4) and SPI (0.21) over Heilongjiang. It is noted that higher value of PDSI and SPI means more lower drought severity, whereby the correlation between drought severity and detrended crop yields is positive. Similarly, sEDI and PDSI are better correlated with province-scale crop yields than SPI over Jilin (Figure 9c). That is because without the consideration of irrigation water for irrigated crops, SPI provides weaker correlations to crop yields. However, less correspondence is observed between the three indicators and grain crop yields in Liaoning. This is due in part to the fact that Liaoning is located at southeastern coastal areas with more precipitation, where water supply is not the primary control factor for crop production.

3.1.4. Statistical Intercomparisons

To assess the similarity among indicators in their ability to rank drought severity, we firstly examined the temporal correlation between annual sEDI and other relevant indices during 1982–2012, which can be seen from Figure 10. Using the time series of different data, the linear correlation was calculated for every point across the Northeast China. Plots of correlations with SoilM and P indicate that sEDI effectively integrates moisture conditions and precipitation over grassland and cropland of Northeast China. However, for forest areas, sEDI is more related to SoilM than P.
In comparison with sEDI, PDSI time series has the best temporal correlation than other indices and the coefficients value of most areas range from −0.3 to −0.7. Notably, relatively higher correlation coefficients (R < −0.6) were obtained in the west part of Northeast China. That is because this region has moisture-limiting conditions, where ET is more sensitive to changing subsurface moisture conditions than other areas [66]. Given the fact that PDSI has better performance in arid and semi-arid regions [67], sEDI should be indicative of drought in the west part of Northeast China. Reduced correspondence appeared along the Changbai mountain (the central of Heilongjiang and Jilin), where there is densely vegetated land. Recent research demonstrates that the mountain ecosystems are likely to be linked to complex climate-land interactions, which increases difficulties in drought monitoring [68]. The map of correlations between SPI and sEDI has a similar distribution feature over Northeast China, but the similarity is weaker than PDSI over northern woodland. That is in part because without the consideration of surface moisture, the performance of SPI has large uncertainty over forest areas [69].
Further investigation illustrates the correlation computed between sEDI and selected index at pixel levels (Figure 11). In comparison with SPI, PDSI has relatively better correlations with sEDI anomalies, which highlights the importance of other influencing factors like temperature and soil moisture. On the other hand, the highest correlations between sEDI and PDSI were obtained in 2007, when there was a severe drought at the end of this year. Similarly, indices also show strong correlations in 2004, 2006, and 2010, which indicates the spatial patterns of sEDI closely resemble other indices during a relatively dry period.
In general, through the statistical intercomparisons with precipitation, soil moisture, SPI, and PDSI, the good correlations of sEDI exhibited a strong validation for accepting it as an available indicator for drought monitoring in Northeast China.

3.2. Spatiotemporal Variation of Dryness Conditions in Northeast China

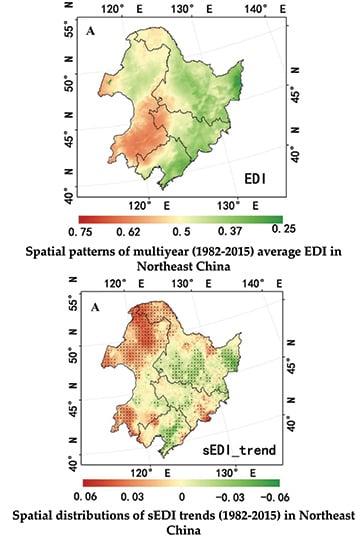
3.2.1. Mean Spatial Pattern of EDI in Northeast China

Figure 12A presents the spatial pattern of EDI over Northeast China from 1982 to 2015, which shows an apparent east-west difference. The high value in EDI reflects a dry condition and the low value represents a wet spell. Our results illustrate the areas with high ensemble average are mainly concentrated in the southwest part of study region, including southern Inner Mongolia, northern Liaoning, and western Jilin, thereby contributing to the intensity of the drought. In comparison with the distribution of precipitation and soil moisture (Figure 12B,C), obviously, this region is also characterized as short of water supply. Due to the defective coordination of heat, water, and soil resources, the surface status of dryness poses enormous threat to local ecosystem and agricultural production. Another region under a severe dry state is the northwest part of study area, namely, Hulun Buir Grassland. Previous research demonstrated that due to the scarce and unevenly distributed rainfall, drought climate, and artificial factors like overgrazing cause severe desertification of Hulun Buir Grassland [70]. By contrast, the east part of Northeast China was detected as humid or no dryness by EDI and the largest portion of it is represented by woodland. Affected by the East Asian monsoon, this area is characterized by a relatively abundant precipitation and the deep-rooted vegetation can reach groundwater when drought occurs.

3.2.2. Characteristics of sEDI Variation in Northeast China

Figure 13A presents the spatial distribution of sEDI trends over Northeast China from 1982 to 2015. Our results illustrate that 56.5% of areas of Northeast China became drier during 1982–2015 and 29.6% of areas show a significant increasing trend of sEDI (p < 0.05). Increased drought has mainly occurred in Inner Mongolia, except for the middle part of this province. As shown in Figure 13a, Inner Mongolia had experienced a continuously increasing drought before 2007 and the severity of drought reach its maximum in 2007, which is consistent with the finding of Liu et al. [71]. Although the drought episodes deceased in the period of 2007–2012, serious drought conditions occurred again over Inner Mongolia after 2012. In comparison with the trend of P and SoilM (Figure 13B,C), we find that in the northwest regions of Inner Mongolia, namely Hulun Buir Grassland, drier climate and the grassland destruction caused the increased drought [72]. For the north part of Da Hinggan Mountains located at northern Inner Mongolia and northern Heilongjiang, although few portions received more precipitation, the uneven distribution of precipitation and increasing water consumption contributed to the positive trend of drought. Moreover, southern Inner Mongolia and eastern Jilin were affected by a drying trend, coinciding with decreasing rainfall and decreasing soil moisture, respectively.
On the other hand, approximately 40% of pixels of Northeast China are detected as becoming wetter and only 14.4% areas show a significant wetted trend (p < 0.05). According to the map of land use type (Figure 1), the negative pixels mainly distributed in the cropland areas, including Sanjiang Plain (northeastern Heilongjiang), Songnen Plain (southwestern Heilongjiang), and Liaohe Plain (central Liaoning). Liu et al. [73] suggest that the transformation from dry lands to paddy fields and the reclaimed cropland from grassland were the main land-use changes from 1980s to 2010 over Northeast China. As seen from Figure 12A, in spite of some fluctuations, the drought severity of Heilongjiang and Liaoning generally decreased throughout the period, which demonstrates the effect of improved agriculture management. Compared with the spatially variation of precipitation and soil moisture, we can notice the negative sEDI pixels correspond well with the positive value of soil moisture trend.
Considering that most drought episodes only lasted one or two seasons, we further analyzed the seasonal drought trend variation of Northeast China from 1982 to 2015. As shown in Figure 14, the distribution of drought trend has obvious seasonal characteristics. Upward trend of drought is the most obvious in summer over most area of Northeast China, especially for Inner Mongolia, a water-limited region (Figure 14b). In contrast, except for the north part of Northeast China, the severity of drought significantly decreases over Northeast China in winter (Figure 14d). That is because Northeast China is located in a high-latitude region, the warming trend in winter is a positive factor for the relief of drought. In spring, areas with positive trend of dryness mainly concentrate in the north and south part of Inner Mongolia (Figure 14a). The severity of drought remains stable or decreased over other areas of Northeast China in spring, which is similar to autumn (Figure 14c).
Overall, calculated by sEDI, the severity of drought shows an upward trend for more than half area of Northeast China from 1982 to 2015, including the northwest part of study region, southern Inner Mongolia, and eastern Jilin. In contrast, driving by the land use change, the agricultural area is generally becoming wetter during the time period, such as the Sanjiang Plain, Songnen Plain, and Liaohe Plain. On the other hand, the drought trends differ a lot among four seasons during the period of 1982–2015 and the dryness degree of Northeast China significantly increases in summer and decreases in winter, respectively.

4. Discussion

The EDI reflects both energy flux information for sensitivity to soil moisture stress and the climatic demand in relation to the soil water supply, which is a feasible approach for drought disaster detection and long-term climatological drought assessment in Northeast China. Especially for region with minimal ground-based meteorological infrastructure, the EDI can effectively characterize spatially terrestrial water status and act as a supplement to precipitation-based indicators.
EDI can provide near-real-time and spatially distributed drought information, which is still challenging for drought indices based on ground observation networks [9]. It is noted that the characterization of surface normal dryness condition by EDI needs long-term terrestrial parameter datasets including net radiation, temperature, and vegetation conditions, which highlight the importance of data continuity [74]. Although the number of satellite sensors and types of remote sensing observations have increased substantially, most of the relevant satellite sensors are designed for less than a decade of operation [29], such as Geostationary Operational Environmental Satellites (GOES) and Gravity Recovery and Climate Experiment (GRACE). Therefore, to solve the difference in spatial resolution and time span of satellite dataset, more investments in data continuity are necessary for the development of a long-term climatological dataset and the analyses of EDI against extensive historic climate records in the future.
Although numerous satellite-based ET methods have been developed using different forcing datasets, the accuracy of ET estimation still limits the application of EDI [21]. In consideration of the heterogeneity of land surface and the diversity of ecosystem, ET methods that run uniformly across the globe contain inherent uncertainties, thereby causing large biases in drought monitoring from ET over different areas [75]. For example, the MOD16 algorithm has gained enormous popularity worldwide, but still has 10–30% uncertainties in ET measurements varying across different land use types, especially for croplands [76,77]. In our study, we selected the MS-PT algorithm to generate ET estimations of Northeast China, which was constructed for the mainland of China. Although compared with MODIS products, this method produces improved ET estimates, its accuracy does suffer from AVHRR instrument limitations, incomplete cloud clearing, and the noise from sampling issues [78,79,80].
Due to its complexity, drought validation currently remains a challenging issue [1]. Previous studies evaluate the capability of emerging remotely sensed indicators by its relation to standard drought metrics or documented regional drought events [26,81]. However, the validation process based on a single variable (or indicator) may not be sufficient because drought phenomena are related to multiple variables. In our study, the capacity of EDI for drought monitoring was evaluated by the comparison with precipitation, soil moisture, SPI, and PDSI. Although EDI generally agree well with these indices over most areas of Northeast China, low correlations are found in woodland areas, where roots of vegetation can reach groundwater when drought occurs, and dryland areas, where active water management can cause abrupt variation in surface dryness, such as irrigation [73]. That is because drought information not reflected in precipitation deficits causes these discrepancies [82]. Therefore, surface drought-related data such as standard drought indices, components of surface water resource and so on, cannot be entirely regard as a metric of absolute truth in drought mapping, which need further exploration. On the other hand, there are also some studies incorporating crop yield data to validate the capability of newly developed drought indicators for agricultural monitoring [24,83,84]. Compared with inter-annual grain crop yields, our results illustrate sEDI is generally effective at detecting the impacts of drought on agriculture. Nevertheless, crop yields achieved results from a combination of potential factors (carbon dioxide, radiation, temperature, and crop characteristics), limiting factors (water, nutrients, socio-economic), and reducing factors (weeds, pests, diseases, and pollutants) [85]. Therefore, accurately extracting the impact of drought on crop yields need further exploration.

5. Conclusions

In this paper, we assessed the utility of a satellite-based indicator, EDI for long-term climatological drought monitoring over Northeast China. EDI is derived by a process-based ET model (MS-PT) and FAO Penman–Monteith method, which has minimal ground data requirements and no need for local calibration. To reduce the impacts of the perennial moisture status for different areas, we introduced a standardization process to EDI and its anomaly, sEDI, can be comparable to other commonly used drought indices. Our results illustrate that EDI can be effective for detecting water stress and corresponds well with standard drought indices, such as SPI and PDSI. Then, we applied EDI to improve our understanding of the spatiotemporal variation of dryness conditions over Northeast China. The main conclusions from the study are summarized below.
(1) Our results illustrate that despite different spatial resolution, spatial distributions of EDI were found to correspond well with patterns of drought-related indices, particularly in arid and semi-arid regions over Northeast China. Moreover, EDI gives additional information about actual water stress that is not easily derived from precipitation-based indices and can be effective for quantifying dryness conditions when water management factors or other non-precipitation water inputs varied.
(2) For historical drought episodes study, the standard value of EDI, namely sEDI, showed a coherent behavior to identify areas under water stress conditions, with a good correspondence with soil moisture and precipitation-based indices. Meanwhile, owing to water supply from irrigation, sEDI is more effective at detecting the impacts of drought on crop production, compared with SPI.
(3) By statistical spatial and temporal intercomparisons, sEDI shows generally good agreement with drought-related indices. The highest temporal correlation coefficients (R < −0.7) were obtained in the west part of Northeast China with semi-arid climate and sEDI is more related to commonly used drought metrics over grassland (R < −0.5) than woodland (R < −0.2), which suggests precipitation is not a good representative of drought conditions over areas with deep-rooted vegetation. Generally, though the calculation of sEDI does not directly incorporate precipitation and soil moisture, sEDI has the ability to characterize these two drought relevant parameters.
(4) The general dryness distribution of Northeast China shows a distinct east-west difference and the northwest part is drier than other areas. We also found 56.5% of areas of Northeast China show upward dryness trends and increased drought has occurred mainly in north and south parts of Inner Mongolia, which coincides with the negative trend of soil moisture and the decreasing rainfall, respectively. In contrast, only 14.4% of areas of Northeast China became wetter and the drought severity of eastern cropland region has decreased over the past three decades. Moreover, seasonal drought trends have different features during the period of 1982–2015, and the dryness degree of Northeast China significantly increased in summer and decreased in winter, respectively.

Author Contributions

Conceptualization, L.Z. and Y.Y.; Methodology, X.B.; Software, K.J.; Validation, X.Z., X.X. and B.J.; Formal analysis, K.S.; Investigation, J.X.; Resources B.J.; Data curation X.C.; Writing—original draft preparation, L.Z.; Writing—review and editing, L.Z. and Y.Y.; Visualization, X.B.; Supervision, Y.Y.; Project administration, Y.Y.; Funding acquisition, Y.Y.

Funding

This work was partially supported by the National Key Research and Development Program of China (No. 2016YFA0600102) and the Natural Science Fund of China (No. 41671331). This work was also supported by China Scholarship Council under Grant 201806040217 and Natural Resources Department of ITC, University of Twente, Netherlands.

Acknowledgments

The authors would like to thank Jie He, Kun Yang from Cold and Arid Regions Science Data Center at Lanzhou (http://westdc.westgis.ac.cn/) for providing China Meteorological Forcing Dataset. GIMMIS NDVI products were obtained from National Oceanic and Atmospheric Administration (NOAA) (http://islscp2.sesda.com/ISLSCP21/data). MODIS, NDVI, and ET products were obtained online (http://reverb.echo.nasa.gov/reverb). Climate Prediction Center soil moisture dataset were obtained online (http://www.esrl.noaa.gov/psd/). This work was partially supported by the National Key Research and Development Program of China (No. 2016YFA0600102) and the Natural Science Fund of China (No. 41671331). We also acknowledge the support of China Scholarship Council under Grant 201806040217 and Natural Resources Department of ITC, University of Twente, Netherlands.

Conflicts of Interest

The authors declare no conflict of interest.

References

  1. Mishra, A.K.; Singh, V.P. Drought modeling—A review. J. Hydrol. 2011, 403, 157–175. [Google Scholar] [CrossRef]
  2. Dai, A.; Trenberth, K.E.; Qian, T. A Global Data Set of Palmer Drought Severity Index for 1870–2002: Relationship with Soil Moisture and Effects of Surface Warming. J. Hydrometeorol. 2009, 5, 1117–1130. [Google Scholar] [CrossRef]
  3. Trenberth, K.E.; Dai, A.; Schrier, G.V.D.; Jones, P.D.; Barichivich, J.; Briffa, K.R.; Sheffield, J. Global warming and changes in drought. Nat. Clim. Chang. 2014, 4, 17–22. [Google Scholar] [CrossRef]
  4. Godfray, H.C.J.; Beddington, J.R.; Crute, I.R.; Haddad, L.; Lawrence, D.; Muir, J.F.; Pretty, J.; Robinson, S.; Thomas, S.M.; Toulmin, C. Food Security: The Challenge of Feeding 9 Billion People. Science 2010, 327, 812. [Google Scholar] [CrossRef]
  5. He, B.; Lü, A.; Wu, J.; Lin, Z.; Ming, L. Drought hazard assessment and spatial characteristics analysis in China. J. Geogr. Sci. 2011, 21, 235–249. [Google Scholar] [CrossRef]
  6. Dong, G.; Guo, J.; Chen, J.; Sun, G.; Gao, S.; Hu, L.; Wang, Y. Effects of spring drought on carbon sequestration, evapotranspiration and water use efficiency in the songnen meadow steppe in northeast China. Ecohydrology 2011, 4, 211–224. [Google Scholar] [CrossRef]
  7. Yu, X.; He, X.; Zheng, H.; Guo, R.; Ren, Z.; Zhang, D.; Lin, J. Spatial and temporal analysis of drought risk during the crop-growing season over northeast China. Nat. Hazards 2014, 71, 275–289. [Google Scholar] [CrossRef]
  8. Heim, R.R., Jr. A Review of Twentieth-Century Drought Indices Used in the United States. Bull. Am. Meteorol. Soc. 2002, 83, 1149–1165. [Google Scholar] [CrossRef]
  9. Hao, Z.; Yuan, X.; Xia, Y.; Hao, F.; Singh, V.P. An overview of drought monitoring and prediction systems at regional and global scales. Bull. Am. Meteorol. Soc. 2017, 98, 1879–1896. [Google Scholar] [CrossRef]
  10. Palmer, W.C. Keeping Track of Crop Moisture Conditions, Nationwide: The New Crop Moisture Index. Weatherwise 1968, 21, 156–161. [Google Scholar] [CrossRef]
  11. Mckee, T.B.; Doesken, N.J.; Kleist, J. The relationship of drought frequency and duration to time scales. In Proceedings of the Eighth Conference on Applied Climatology, Boston, MA, USA, 17 January 1993; pp. 179–183. [Google Scholar]
  12. Zhai, J.Q.; Su, B.; Krysanova, V.; Vetter, T.; Chao, G.; Tong, J. Spatial variation and trends in PDSI and SPI indices and their relation to streamflow in 10 large regions of China. J. Clim. 2010, 23, 649–663. [Google Scholar] [CrossRef]
  13. Li, B.; Liang, Z.; Yu, Z.; Acharya, K. Evaluation of drought and wetness episodes in a cold region (Northeast China) since 1898 with different drought indices. Nat. Hazards 2014, 71, 2063–2085. [Google Scholar] [CrossRef]
  14. Wu, H.; Hayes, M.J.; Wilhite, D.A.; Svoboda, M.D. The effect of the length of record on the standardized precipitation index calculation. Int. J. Climatol. 2005, 25, 505–520. [Google Scholar] [CrossRef] [Green Version]
  15. Kogan, F.N. Droughts of the Late 1980s in the United States as Derived from NOAA Polar-Orbiting Satellite Data. Bull. Am. Meteorol. Soc. 1995, 76, 655–668. [Google Scholar] [CrossRef] [Green Version]
  16. Zhang, X.; Chen, N.; Li, J.; Chen, Z.; Niyogi, D. Multi-sensor integrated framework and index for agricultural drought monitoring. Remote Sens. Environ. 2017, 188, 141–163. [Google Scholar] [CrossRef] [Green Version]
  17. Rhee, J.Y.; Im, J.H.; Carbone, G.J. Monitoring agricultural drought for arid and humid regions using multi-sensor remote sensing data. Remote Sens. Environ. 2010, 114, 2875–2887. [Google Scholar] [CrossRef]
  18. Qi, S.; Li, G.; Wang, C. Study on monitoring drought in China with MODIS product. Adv. Water Sci. 2005, 16, 56–61. [Google Scholar]
  19. Ji, L.; Peters, A.J. Assessing vegetation response to drought in the northern Great Plains using vegetation and drought indices. Remote Sens. Environ. 2003, 87, 85–98. [Google Scholar] [CrossRef]
  20. Zhang, A.; Jia, G. Monitoring meteorological drought in semiarid regions using multi-sensor microwave remote sensing data. Remote Sens. Environ. 2013, 134, 12–23. [Google Scholar] [CrossRef]
  21. Wang, K.; Dickinson, R.E. A review of global terrestrial evapotranspiration: Observation, modeling, climatology, and climatic variability. Rev. Geophys. 2012, 50. [Google Scholar] [CrossRef]
  22. Idso, S.B.; Reginato, R.J.; Jackson, R.D. Measuring yield-reducing plant water potential depressions in wheat by infrared thermometry. Irrig. Sci. 1981, 2, 205–212. [Google Scholar] [CrossRef]
  23. Moran, M.S.; Clarke, T.R.; Inoue, Y.; Vidal, A. Estimating crop water deficit using the relation between surface-air temperature and spectral vegetation index. Remote Sens. Environ. 1994, 49, 246–263. [Google Scholar] [CrossRef]
  24. Zhang, J.; Mu, Q.; Huang, J. Assessing the remotely sensed Drought Severity Index for agricultural drought monitoring and impact analysis in North China. Ecol. Indic. 2016, 63, 296–309. [Google Scholar] [CrossRef]
  25. Anderson, M.C.; Hain, C.; Wardlow, B.; Pimstein, A.; Mecikalski, J.; Kustas, W. A thermal-based evaporative stress index for monitoring surface moisture depletion. Remote Sens. Drought Innov. Monit. Approaches 2012, 145–167. Available online: https://books.google.com.hk/books?hl=zh-CN&lr=&id=n1gqnmglvLoC&oi=fnd&pg=PA145&dq=A+thermal-based+evaporative+stress+index+for+monitoring+surface+moisture+depletion&ots=YCNl9xCiux&sig=tj-OllGPwMqO7rhMQkqWtS55aqg&redir_esc=y&hl=zh-CN&sourceid=cndr#v=onepage&q=A%20thermal-based%20evaporative%20stress%20index%20for%20monitoring%20surface%20moisture%20depletion&f=false (accessed on 30 July 2019).
  26. Mu, Q.; Zhao, M.; Kimball, J.S.; Mcdowell, N.G.; Running, S.W. A Remotely Sensed Global Terrestrial Drought Severity Index. Bull. Am. Meteorol. Soc. 2013, 94, 83–98. [Google Scholar] [CrossRef] [Green Version]
  27. Anderson, M.C.; Hain, C.; Otkin, J.; Zhan, X.; Mo, K.; Svoboda, M.; Wardlow, B.; Pimstein, A. An Intercomparison of Drought Indicators Based on Thermal Remote Sensing and NLDAS-2 Simulations with U.S. Drought Monitor Classifications. J. Hydrometeorol. 2013, 14, 1035–1056. [Google Scholar] [CrossRef]
  28. Sepulcre-Canto, G.; Vogt, J.; Arboleda, A.; Antofie, T. Assessment of the EUMETSAT LSA-SAF evapotranspiration product for drought monitoring in Europe. Int. J. Appl. Earth Obs. Geoinf. 2014, 30, 190–202. [Google Scholar] [CrossRef]
  29. Aghakouchak, A.; Farahmand, A.; Melton, F.S.; Teixeira, J.; Anderson, M.C.; Wardlow, B.D.; Hain, C.R. Remote sensing of drought: Progress, challenges and opportunities. Rev. Geophys. 2015, 53, 452–480. [Google Scholar] [Green Version]
  30. Yao, Y.; Liang, S.; Qin, Q.; Wang, K. Monitoring Drought over the Conterminous United States Using MODIS and NCEP Reanalysis-2 Data. J. Appl. Meteorol. Climatol. 2010, 49, 1665–1680. [Google Scholar] [CrossRef]
  31. Shao, X.; Yao, F.; Zhang, J.; Li, X. Analysis of Drought in North China Based on Evapotranspiration Drought Index. Meteorol. Mon. 2013, 39, 1154–1162. [Google Scholar]
  32. Zhao, H.; Xu, Z.; Zhao, J.; Huang, W. A drought rarity and evapotranspiration-based index as a suitable agricultural drought indicator. Ecol. Indic. 2017, 82, 530–538. [Google Scholar] [CrossRef]
  33. Yao, Y.; Liang, S.; Qin, Q.; Wang, K.; Zhao, S. Monitoring global land surface drought based on a hybrid evapotranspiration model. Int. J. Appl. Earth Obs. Geoinf. 2011, 13, 447–457. [Google Scholar] [CrossRef]
  34. Yao, Y.; Qin, Q.; Fadhil, A.M.; Li, Y.; Zhao, S.; Liu, S.; Sui, X.; Dong, H. Evaluation of EDI derived from the exponential evapotranspiration model for monitoring China’s surface drought. Environ. Earth Sci. 2011, 63, 425–436. [Google Scholar] [CrossRef]
  35. Yao, Y.; Liang, S.; Cheng, J.; Liu, S.; Fisher, J.B.; Zhang, X.; Jia, K.; Zhao, X.; Qin, Q.; Zhao, B. MODIS-driven estimation of terrestrial latent heat flux in China based on a modified Priestley–Taylor algorithm. Agric. For. Meteorol. 2013, 171, 187–202. [Google Scholar] [CrossRef]
  36. Zhang, L.; Yao, Y.; Wang, Z.; Jia, K.; Zhang, X.; Zhang, Y.; Wang, X.; Xu, J.; Chen, X. Satellite-derived spatiotemporal variations in evapotranspiration over northeast China during 1982–2010. Remote Sens. 2017, 9, 1140. [Google Scholar] [CrossRef]
  37. Gao, J.; Liu, Y.; Chen, Y. Land cover changes during agrarian restructuring in Northeast China. Appl. Geogr. 2006, 26, 312–322. [Google Scholar] [CrossRef]
  38. Lu, H.; Mo, X.; Meng, D. Analyzing Spatiotemporal Patterns of Meteorological Drought and Its Responses to Climate Change across Northeast China. Sci. Geogr. Sin. 2015, 35, 1051–1059. [Google Scholar]
  39. Sun, F.; Yang, X.; Lu, S. The contrast analysis on the average and extremum temperature trend in Northeast China. Sci. Meteorol. Sin. 2006, 26, 157–163. [Google Scholar]
  40. Tang, Y.; Wang, H.; Yan, D.; Wang, S. Research on the Spatial-Temporal Differentiation of Precipitation in Northeast China in Recent 50 Years. Sci. Geogr. Sin. 2005, 2, 007. [Google Scholar]
  41. Guo, S.; Ma, S.; Chen, Y. The Situation and Comparative Advantage and Problems and Countermeasures of Grain Product of the Three Provinces in East-north Areas. Chin. Agric. Sci. Bull. 2006, 22, 488–493. [Google Scholar]
  42. Jin, Z.; Zhu, D. Impacts of changes in climate and its variability on food production in Northeast China. Acta Agron. Sin. 2008, 34, 1588–1597. [Google Scholar] [CrossRef]
  43. Tang, G.L.; Ren, G.Y. Reanalysis of Surface Air Temperature Change of the Last 100 Years over China. Clim. Environ. Res. 2005, 10, 791–798. [Google Scholar]
  44. Qian, W.; Zhu, Y. Climate Change in China from 1880 to 1998 and its Impact on the Environmental Condition. Clim. Chang. 2004, 50, 419–444. [Google Scholar] [CrossRef]
  45. Sun, F.; Wu, Z.; Yang, S. Temporal and spatial variations of extreme precipitation and dryness events in Northeast China in last 50 years. Chin. J. Ecol. 2006, 25, 779–784. [Google Scholar]
  46. National Oceanic and Atmospheric Administration, AVHRR. Available online: http://islscp2.sesda.com/ISLSCP21/data (accessed on 15 December 2017).
  47. National Aeronautics and Space Administration, LP DAAC. Available online: http://reverb.echo.nasa.gov/reverb (accessed on 16 October 2016).
  48. He, J.; Yang, K. China Meteorological Forcing Dataset; Cold and Arid Regions Science Data Center: Lanzhou, China, 2011; Available online: http://westdc.westgis.ac.cn/data/7a35329c-c53f-4267-aa07-e0037d913a21 (accessed on 23 May 2017).
  49. Yang, K.; Jie, H.; Tang, W.; Qin, J.; Cheng, C.C.K. On downward shortwave and longwave radiations over high altitude regions: Observation and modeling in the Tibetan Plateau. Agric. For. Meteorol. 2010, 150, 38–46. [Google Scholar] [CrossRef]
  50. Fan, Y.; Dool, H.V.D. Climate Prediction Center global monthly soil moisture data set at 0.5 resolution for 1948 to present. J. Geophys. Res. Atmos. 2004, 109. [Google Scholar] [CrossRef]
  51. CPC Soil Moisture Data. NOAA/OAR/ESRL PSD, Boulder, CO, USA. Available online: https://www.esrl.noaa.gov/psd/ (accessed on 14 May 2017).
  52. Zhao, M.; Running, S.W. Drought-induced reduction in global terrestrial net primary production from 2000 through 2009. Science 2010, 329, 940. [Google Scholar] [CrossRef] [PubMed]
  53. Palmer Drought Severity Index. Zhao and Running. 2009. Available online: ftp://ftp.ntsg.umt.edu/pub/NPP Science 2010/PDSI/ (accessed on 20 October 2016).
  54. Standardized Precipitation Index (SPI) for Global Land Surface (1949–2012). National Center for Atmospheric Research, University Corporation for Atmospheric Research. Available online: https://rda.ucar.edu/datasets/ds298.0/ (accessed on 17 July 2017).
  55. Kalma, J.D.; Mcvicar, T.R.; Mccabe, M.F. Estimating Land Surface Evaporation: A Review of Methods Using Remotely Sensed Surface Temperature Data. Surv. Geophys. 2008, 29, 421–469. [Google Scholar]
  56. Priestley, C.H.B.; Taylor, R. On the assessment of surface heat flux and evaporation using large-scale parameters. Mon. Weather Rev. 1972, 100, 81–92. [Google Scholar] [CrossRef]
  57. Zhang, K.; Kimball, J.S.; Mu, Q.; Jones, L.A.; Goetz, S.J.; Running, S.W. Satellite based analysis of northern ET trends and associated changes in the regional water balance from 1983 to 2005. J. Hydrol. 2009, 379, 92–110. [Google Scholar] [CrossRef]
  58. Yao, Y.; Zhao, S.; Zhang, Y.; Jia, K.; Liu, M. Spatial and Decadal Variations in Potential Evapotranspiration of China Based on Reanalysis Datasets during 1982–2010. Atmosphere 2014, 5, 737–754. [Google Scholar] [CrossRef]
  59. Wayne, C.P. Meteorological drought. US Weather Bur. Res. Pap. 1965, 45, 58. [Google Scholar]
  60. Keyantash, J.; Dracup, J.A. The Quantification of Drought: An Evaluation of Drought Indices. Bull. Am. Meteorol. Soc. 2002, 83, 1167–1180. [Google Scholar] [CrossRef]
  61. Guttman, N.B. Comparing the palmer drought index and the standardized precipitation index 1. Jawra J. Am. Water Resour. Assoc. 1998, 34, 113–121. [Google Scholar] [CrossRef]
  62. Song, L. China Meteorological Disaster Yearbook (2014); China Meteorological Administration: Beijing, China, 2015. [Google Scholar]
  63. Ma, J. China Statistical Data. National Bureau of statistics of China. Available online: http://data.stats.gov.cn/easyquery.htm?cn=E0103&zb=A0D0Q%AE=23000-0&sj=2014: 2014 (accessed on 20 April 2019).
  64. Sun, Q.; Liu, J. Temporal-spatial change of temperature and precipitation based on CAST in northeast China. J. Meteorol. Environ. 2014, 30, 59–65. [Google Scholar]
  65. Alley, W.M. The Palmer Drought Severity Index: Limitations and Assumptions. J. Clim. Appl. Meteorol. 1984, 23, 1100–1109. [Google Scholar] [CrossRef] [Green Version]
  66. Karnieli, A.; Panov, N.; Goldberg, A.; Agam, N.; Anderson, M.; Pinker, R.T.; Imhoff, M.L.; Gutman, G.G. Use of NDVI and land surface temperature for drought assessment: Merits and limitations. J. Clim. 2010, 23, 618–633. [Google Scholar] [CrossRef]
  67. Lloyd-Hughes, B.; Saunders, M.A. A drought climatology for Europe. Int. J. Climatol. 2010, 22, 1571–1592. [Google Scholar] [CrossRef]
  68. Elhag, K.; Zhang, W. Monitoring and Assessment of Drought Focused on Its Impact on Sorghum Yield over Sudan by Using Meteorological Drought Indices for the Period 2001–2011. Remote Sens. 2018, 10, 1231. [Google Scholar] [CrossRef]
  69. Wu, H.; Svoboda, M.D.; Hayes, M.J.; Wilhite, D.A.; Wen, F. Appropriate application of the standardized precipitation index in arid locations and dry seasons. Int. J. Climatol. 2010, 27, 65–79. [Google Scholar] [CrossRef]
  70. Zhao, H. Analysis on formation cause and prevention countermeasure of desertification and degeneration of Hulunbeier grassland. Pratac. Sci. 2007, 6. [Google Scholar] [CrossRef]
  71. Liu, S.; Kang, W.; Wang, T. Drought variability in Inner Mongolia of northern China during 1960–2013 based on standardized precipitation evapotranspiration index. Environ. Earth Sci. 2016, 75, 1–14. [Google Scholar] [CrossRef]
  72. Zhang, F.; Zhang, P.; Zhang, R. Analysis of drought and meteorological disasters in Hulun Buir Grassland. Fortune World 2012, 14. [Google Scholar] [CrossRef]
  73. Liu, J.; Kuang, W.; Zhang, Z.; Xu, X.; Qin, Y.; Jia, N.; Zhou, W. Spatiotemporal characteristics, patterns, and causes of land-use changes in China since the late 1980s. J. Geogr. Sci. 2014, 24, 195–210. [Google Scholar] [CrossRef]
  74. AghaKouchak, A.; Nakhjiri, N. A near real-time satellite-based global drought climate data record. Environ. Res. Lett. 2012, 7, 044037. [Google Scholar] [CrossRef] [Green Version]
  75. Biggs, T.; Petropoulos, G.; Velpuri, N.; Marshall, M. Remote sensing of actual evapotranspiration form Croplands. In Remote Sensing Handbook: Remote Sensing of Water Resources, Disasters, and Urban Studies; CRC Press: Boca Raton, FL, USA, 2015; pp. 59–99. [Google Scholar]
  76. Mu, Q.; Zhao, M.; Running, S.W. Improvements to a MODIS global terrestrial evapotranspiration algorithm. Remote Sens. Environ. 2011, 115, 1781–1800. [Google Scholar] [CrossRef]
  77. Velpuri, N.M.; Senay, G.B.; Singh, R.K.; Bohms, S.; Verdin, J.P. A comprehensive evaluation of two MODIS evapotranspiration products over the conterminous United States: Using point and gridded FLUXNET and water balance ET. Remote Sens. Environ. 2013, 139, 35–49. [Google Scholar] [CrossRef]
  78. Yao, Y.; Liang, S.; Li, X.; Chen, J.; Wang, K.; Jia, K.; Cheng, J.; Jiang, B.; Fisher, J.B.; Mu, Q. A satellite-based hybrid algorithm to determine the Priestley Taylor parameter for global terrestrial latent heat flux estimation across multiple biomes. Remote Sens. Environ. 2015, 165, 216–233. [Google Scholar] [CrossRef]
  79. Simoniello, T.; Cuomo, V.; Lanfredi, M.; Lasaponara, R.; Macchiato, M. On the relevance of accurate correction and validation procedures in the analysis of AVHRR-NDVI time series for long-term monitoring. J. Geophys. Res. Atmos. 2004, 109. [Google Scholar] [CrossRef] [Green Version]
  80. Pinzon, J.; Tucker, C. A non-stationary 1981–2012 AVHRR NDVI3g time series. Remote Sens. 2014, 6, 6929–6960. [Google Scholar] [CrossRef]
  81. Anderson, M.C.; Hain, C.; Wardlow, B.; Pimstein, A.; Mecikalski, J.R.; Kustas, W.P. Evaluation of Drought Indices Based on Thermal Remote Sensing of Evapotranspiration over the Continental United States. J. Clim. 2011, 24, 2025–2044. [Google Scholar] [CrossRef]
  82. Vicenteserrano, S.M.; Beguería, S.; Lópezmoreno, J.I. A Multiscalar Drought Index Sensitive to Global Warming: The Standardized Precipitation Evapotranspiration Index. J. Clim. 2010, 23, 1696–1718. [Google Scholar] [CrossRef] [Green Version]
  83. Anderson, M.C.; Zolin, C.A.; Sentelhas, P.C.; Hain, C.R.; Semmens, K.; Yilmaz, M.T.; Gao, F.; Otkin, J.A.; Tetrault, R. The Evaporative Stress Index as an indicator of agricultural drought in Brazil: An assessment based on crop yield impacts. Remote Sens. Environ. 2016, 174, 82–99. [Google Scholar] [CrossRef]
  84. Shen, G.; Zheng, H.; Lei, Z. Applicability analysis of SPEI for drought research in Northeast China. Acta Ecol. Sin. 2017, 37. [Google Scholar] [CrossRef]
  85. van Ittersum, M.K.; Leffelaar, P.A.; Van Keulen, H.; Kropff, M.J.; Bastiaans, L.; Goudriaan, J. On approaches and applications of the Wageningen crop models. Eur. J. Agron. 2003, 18, 201–234. [Google Scholar] [CrossRef]
Figure 1. Map of the land cover type and the distribution of river in Northeast China.
Remotesensing 11 01960 g001
Figure 2. Flowchart of procedure used in this study.
Remotesensing 11 01960 g002
Figure 3. Monthly and seasonally composited (26-week) maps of normal conditions for the Soil Moisture (SoilM) (mm), evapotranspiration (ET) (mm/month), Evaporative Drought Index (EDI) (-), Standardized Precipitation Index (SPI) (-), and Palmer Drought Severity Index (PDSI) (-). Green indicates wetter conditions and red indicates drier conditions.
Remotesensing 11 01960 g003
Figure 4. Monthly and seasonally composited (26-week) maps of the temporal standard deviation. Red indicates lower variability.
Remotesensing 11 01960 g004
Figure 5. Seasonal standardized anomalies in SoilM, EDI, SPI, and PDSI from December 2003 to August 2004, where DJF means Dec, Jan, and Feb; MAM means Mar, Apr, and May; JJA means Jun, Jul, and Aug; SON means Sep, Oct, and Nov. Green indicates wetness and red indicates dryness. The dashed line refers approximately to a recorded dry patch.
Remotesensing 11 01960 g005
Figure 6. Seasonal standardized anomalies in SoilM, EDI, SPI, and PDSI from December 2005 to August 2006. Green indicates wetness and red indicates dryness. The dashed line refers approximately to a recorded dry patch.
Remotesensing 11 01960 g006
Figure 7. Seasonal standardized anomalies in SoilM, EDI, SPI, and PDSI from September 2007 to May 2008. Green indicates wetness and red indicates dryness. Drought was recorded in the whole Northeast China from December, 2007 to March, 2008.
Remotesensing 11 01960 g007
Figure 8. Monthly standardized anomalies in SoilM, EDI, SPI, and PDSI from August to October in 2010. Green indicates wetness and red indicates dryness. The dashed line refers approximately to a recorded dry patch.
Remotesensing 11 01960 g008
Figure 9. Time series of grain crop yields and drought indices at province level: (a) original value of grain crop yields for Heilongjiang, Jilin, and Liaoning; time series of detrended crop yields and drought indices for (b) Heilongjiang; (c) Jilin; (d) Liaoning.
Remotesensing 11 01960 g009
Figure 10. (Left) Coefficient of temporal correlation between annual maps of Standardized Evaporative Drought Index (sEDI) and other drought indices for 1982–2012. Green indicates strong negative correlation and red indicates weak correlation. (Right) Coefficient of temporal correlation between annual maps of sEDI and other drought indices for three main landscapes: grassland, cropland, and forest. Boxplot depicts median, 25% to 75% range (box) and 10% to 90% range (whiskers).
Remotesensing 11 01960 g010
Figure 11. Coefficient of spatial correlation between monthly maps of EDI and other drought indices for 1982–2012. Boxplot depicts median, 25% to 75% range (box) and 10% to 90% range (whiskers).
Remotesensing 11 01960 g011
Figure 12. The annual average spatial pattern of EDI, precipitation (P), and SoilM during 1982–2015 in Northeast China: (A) green indicates wetness and red indicates dryness; (B) the P distribution is in units of mm; (C) the SoilM distribution is in units of mm.
Remotesensing 11 01960 g012aRemotesensing 11 01960 g012b
Figure 13. (left) Spatial patterns of multiyear trend of sEDI, P, and SoilM during 1982–2015 in Northeast China: (A) green indicates wetter and red indicates dryer; (B) the P_trend pattern is in units of mm/year; (C) the SoilM_trend pattern is in units of mm/year. The black solid dots refer to grids with 95% confidence. (right) The variation of average trend of (a) sEDI, (b) P, and (c) SoilM for different regions: the whole Northeast China (NE), Heilongjiang (HLJ), Jilin (JL), Liaoning (LN), and Part of Inner Mongolia (IM).
Remotesensing 11 01960 g013
Figure 14. The seasonal trend of sEDI during 1982–2015 in Northeast China for (a) MAM; (b) JJA; (c) SON; (d) DJF. Green indicates wetter and red indicates dryer.
Remotesensing 11 01960 g014
Table 1. Record of the Drought Events in 2004–2010 by China Meteorological Disaster Yearbook.
TimeDurationSiteHazard Intensity
March to June, 2004Four monthsWestern Heilongjiang
Western Jilin
Northwestern Liaoning
Severe drought
April to May, 2006Two monthsCentral and Western HeilongjiangModerate to Severe drought
January to March, 2008Three monthsThe Whole Northeast ChinaSevere drought
September, 2010One monthSouthwestern Heilongjiang
Western Jilin
Moderate to Severe drought

