Integrated Hyperspectral and Geochemical Study of Sediment-Hosted Disseminated Gold at the Goldstrike District, Utah


1
Department of Earth and Atmospheric Sciences, University of Houston, Houston, TX 77204, USA
2
Pilot Goldstrike Inc., 1031 Railroad St Suite 110, Elko, NV 89801, USA
*
Author to whom correspondence should be addressed.
Remote Sens. 2019, 11(17), 1987; https://doi.org/10.3390/rs11171987
Submission received: 30 July 2019
/
Revised: 20 August 2019
/
Accepted: 20 August 2019
/
Published: 23 August 2019
(This article belongs to the Special Issue Multispectral and Hyperspectral Remote Sensing Data for Mineral Exploration and Environmental Monitoring of Mined Areas)
Abstract
:The Goldstrike district in southwest Utah is similar to Carlin-type gold deposits in Nevada that are characterized by sediment-hosted disseminated gold. Suitable structural and stratigraphic conditions facilitated precipitation of gold in arsenian pyrite grains from ascending gold-bearing fluids. This study used ground-based hyperspectral imaging to study a core drilled in the Goldstrike district covering the basal Claron Formation and Callville Limestone. Spectral modeling of absorptions at 2340, 2200, and 500 nm allowed the extraction of calcite, clay minerals, and ferric iron abundances and identification of lithology. This study integrated remote sensing and geochemistry data and identified an optimum stratigraphic combination of limestone above and siliciclastic rocks below in the basal Claron Formation, as well as decarbonatization, argillization, and pyrite oxidation in the Callville Limestone, that are related with gold mineralization. This study shows an example of utilizing ground-based hyperspectral imaging in geological characterization, which can be broadly applied in the determination of mining interests and classification of ore grades. The utilization of this new terrestrial remote sensing technique has great potentials in resource exploration and exploitation.
1. Introduction
The Great Basin of western North America has produced a significant amount of gold, making the United States one of the largest gold producers in the world [1]. Among the gold mines, the most famous ones are of the Carlin-type, carbonate rock-hosted disseminated gold deposits that formed in the Eocene Epoch [1,2]. Since the discoveries of Nevada Carlin-type gold deposits, similar sediment-hosted gold has been searched for around the world [3,4,5,6] and in nearby states [7,8,9]. The Goldstrike district is a gold deposit in southwest Utah similar to Carlin-type deposits [10,11]. The modern production of disseminated gold in Goldstrike was active from 1988 to 1996 producing 209,835 ounces of gold and 197,654 ounces of silver, which ceased because of falling gold price, increasing strip ratios, production costs, and safety concerns [12]. The remaining gold is currently being explored by Pilot Goldstrike Inc., Elko, USA [11].
The exploration and mining of precious metals have been a challenge because of the high expense of drilling, geochemical analyses, and metallurgy tests. On the other hand, hyperspectral imaging as a non-destructive, low cost, and large areal coverage, remote sensing technique, can provide high-resolution mineralogical analyses and is becoming popular in geologic studies [13,14,15,16]. To test the applicability of hyperspectral imaging in mineral exploration, this study combines hyperspectral imaging with fire assay metallurgy and inductively coupled plasma mass spectrometry (ICP-MS) geochemistry data in the study of gold mineralization in a drilled core from the Goldstrike district. The identification of an optimum stratigraphic combination and the rock alterations related to gold precipitation using hyperspectral imaging demonstrate applications of this state-of-art technique in the mining industry.
Geological Settings
The Goldstrike district locates in the Bull Valley Mountains, Washington County, southwest Utah (Figure 1). This area is on the eastern edge of the Great Basin [17,18]. The oldest structures found in the Goldstrike region are the southeastward thrust faults related with the Late Cretaceous Sevier orogenic event, which emplaced Paleozoic strata over the Mesozoic rocks on the Colorado Plateau, as well as several coeval asymmetrical folds [17]. Unconformably above the Paleozoic and Mesozoic rocks lies Tertiary siliciclastic and volcanic ash-flow tuff rocks. A major basin and range faulting event and localized drag folding trending east-northeast and west-northwest most likely formed in the Miocene following the tuff deposits [17]. These created high-angle faults with normal and strike-slip displacements, which then created the Goldstrike graben trending east–west and the Arsenic Gulch graben trending northwest–southeast [17]. Gold deposits were mostly found near the high-angle faults bounding the Goldstrike graben (Figure 1) and along the Covington Hill fault [11,12].
The stratigraphy of the Goldstrike district is shown in Figure 2. This district is underlain by a series of Tertiary ash-flow tuffs, limestone, sandstone, and conglomerate, and Mississippian through Permian carbonate and clastic sediments interbeds [10,11]. Late Cenozoic rocks include an undifferentiated tuff and andesite on top and the Quichapa ash-flow sheets. Below them are the early Cenozoic Isom limestones and tuff, the Needles Range Tuff, and the Claron Formation, which consists of an upper limestone, a middle Red Beds member of shale, siltstone, mudstone, sandstone, conglomerate, and limestone, and then the basal Claron sandstone and conglomeratic sandstone [20]. Triassic and Jurassic sediments are not widely exposed in the area, which consist of the Grapevine Wash Conglomerate and Navajo Sandstone. Paleozoic rocks include the Queantoweap—Coconino Sandstone, Pakoon Dolomite, Callville Limestone, Chainman Shale and Scotty Wash Quartzite, Redwall Limestone, and Muddy Peak Dolomite [10,11,19]. Gold mineralization in the Goldstrike district is hosted primarily in sandstone and conglomeratic sandstone of the basal Claron Formation, and in favorable carbonate rocks that underlie the unconformity including the Callville Limestone and the middle unit of the Pakoon Dolomite [10,11]. Karst cavities, collapse breccias, high-angle faults, and anticlinal folds are the main structural controls of mineralization [11,17].
2. Materials and Methods
This study focused on a core drilled by Pilot Goldstrike Inc. at easting 244,910.51 m, northing 4,141,510.69 m (UTM Zone 12N), on an azimuth of 275° and a dip of −65°. Drilling retrieved core from apparent depths of 24 to 448 ft. (7.3 to 136.6 m), which was 8.5 cm in diameter. The core was split into halves, and one half was again split into two ¼ samples. Half of the core was sent for metallurgical test, one ¼ cut was sent for inductively coupled plasma mass spectrometry (ICP-MS) measurements, and the other ¼ cut was segmented into mostly 5 ft. (1.5 m) long sections and imaged by ground-based hyperspectral cameras (Figure 3A). The imaged core sections spanned 273 to 448 ft. (83.2 to 136.6 m), in which the core sections from 288 to 293 and 418 to 423 ft. (87.8 to 89.3 and 127.4 to 128.9 m) were duplicated for quality control of metallurgy and geochemical tests and were not scanned.
2.1. Hyperspectral Imaging
Hyperspectral imaging is a remote sensing technique that collects the reflected light spectrum from material surfaces. The reflectance curve contains physical and chemical properties of the material since chemical bonds absorb light at specific wavelengths [21]. Ground-based hyperspectral imaging has been widely used in geologic characterizations [15,22,23,24,25,26,27,28], in which variations of the sub-centimeter or sub-millimeter scale can be resolved. This study used hyperspectral imaging to identify mineralogy as well as to extract relative abundances of the minerals.
The core samples were placed in fifteen core boxes and scanned with a Specim dual-camera system (Spectral Imaging Ltd., Oulu, Finland). Each scan imaged three core boxes that were placed on a table, and the table was held at around 20° towards the cameras by two people while scanning (Figure 3B). The hyperspectral camera system consisted of a visible and near-infrared (VNIR) camera over the spectral range of 394–1008 nm at a spectral resolution of 2.8 nm, and a short wave infrared (SWIR) camera over the spectral range of 896–2504 nm at a spectral resolution of 10 nm, and both cameras were push-broom scanners (Figure 3D). The cameras were mounted with roughly a −10° tilt towards samples on the two arms of a pan and tilt rotating head (FLIR Systems, USA) on top of a tripod, and the rotating head rotated on a horizontal plane so that the push broom cameras swept the core samples. The cameras were about 1.3 to 2.0 m away from the samples, and the spatial resolutions were 1.7 to 2.6 mm for VNIR (with four times of spatial binning) and 1.7 to 2.7 mm for SWIR. Dark current images were taken with lens caps covering lenses, these represented random background noises from the electronics and internal temperature. Due to the inevitable shaking by people holding the inclined table, the hyperspectral imagery is distorted in the across-track direction. The two cameras have different scanning angles on the two sides of the rotating head, thus produces different geometries in imagery (Figure 4). No efforts were made to correct the geometric distortions since geometry was not the focus of the study.
The dark current images were subtracted from the image spectra, and the results were converted into at-sensor reflectance using a flat field calibration with a white diffuse reflectance standard. Image stripes were corrected by comparing reflectance values of bad pixels with adjacent pixels. Assuming the noise were spatially related, the images were processed with forward and inverse minimum noise fraction [29] to smooth the spectra and to maximize the signal-to-noise ratio. After smoothing, the five scans were mosaicked together for more straightforward data processing. Regions of interest were manually created on the images for core samples, the other pixels, including core boxes, depth markers, and the white reference panel were masked out (Figure 4). Minerals were identified by comparing pixel spectra with the U.S. Geological Survey spectral library [30]. The spectra of identified mineral absorption features were continuum removed to isolate the non-selective scattering and spectrally inactive mineral effects [31,32]. These absorption features were then modeled with the modified Gaussian model [33] to extract the absorption depth as well as the absorption wavelength. This model is a deconvolution method that models electronic transition bands in reflectance spectra, enables the isolation of absorptions from the continuum and distinct absorption from overlapping wavelengths [33,34]. The absorption depth is a proxy of the mineral abundance [31,35], and the absorption wavelength helps to differentiate similar minerals and to imply mineral chemistry in solid solutions [36,37]. All these image processing steps were performed by Matlab 2016a (MathWorks, Natick, USA) and ENVI 5.5 (Harris Geospatial, Boulder, USA).
The reflected spectrum hosts several distinctive absorption features, including the overtones of C–O stretch and O–H stretch, combinations of O–H stretch and metal-OH bend vibrations, as well as crystal fields transitions of metal elements, these absorption features enables identification of many minerals [38,39,40]. Common carbonate and phyllosilicate minerals in sedimentary rocks (Figure 5A) show an Al–OH absorption near 2.2 µm, and a CO32− absorption near 2.34 µm [39,40]. Common ferric iron oxide and hydroxide minerals (Figure 5B) show absorption features near 0.5 and 0.66 µm [41]. There is another ferric iron absorption near 0.9 µm [41]. However, the bands with long wavelengths (>800 nm) of the VNIR camera had low signal-to-noise ratios, so the absorption feature near 900 nm was not studied. In this study, we examined 50 spectral bands (2109 to 2416 nm) in the SWIR spectrum to look for two absorption bands near 2200 nm and 2340 nm, and examined 118 spectral bands (400 to 736 nm) in the VNIR spectrum to look for the absorption bands near 500 nm and 660 nm. For each core sample section, an average value of absorption depth was calculated for all pixels of the section, and this average absorption depth was compared with geochemical measurements.
2.2. Geochemistry
The dry samples were crushed to 70% less than 2 mm particle size and then riffle-split. A 250 g sub-sample was pulverized to 85% less than 75 µm with ring-mill. Of the pulps 30 g was analyzed for gold by fire assay atomic absorption. After aqua regia digestion, another 1 g sub-sample of the pulps was analyzed by ICP-MS.
Multivariate principal component analyses (PCA) [42,43] were performed on the element concentration data and hyperspectral data to show the variability of different elements and affinity of elements. Eigenvectors of element concentrations (vectors showing correlation coefficients) and principal component scores of samples (points showing the linear combinations of eigenvectors) are plotted in bi-plots; the closer the vectors or dots are to each other, the closer affinity or similarity they have.
3. Results
3.1. Hyperspectral Imaging
An average was calculated for all the spectral bands and all the core sample pixels with the same lithology (Figure 6; for lithology classification see the text in this section); the mean spectral reflectance curves show the major spectral characteristics of core samples. The mean spectral reflectance curves in the SWIR spectrum (Figure 6A,C) show two strong absorption features at 2340 nm and 2200 nm. The depths of these absorption features were automatically modeled, which represent the relative abundances of calcite and clay minerals, respectively. Possible interference of chlorite with calcite because of chlorite’s absorption near 2340 nm was ruled out due to the lack of absorption from chlorite near 2250 nm (Figure 6A,C). The distinctive duplet absorptions of kaolinite at 2165 nm and 2200 nm were also not observed (Figure 6A,C). As a result, the clay minerals should be illitic or smectitic. Illite and smectite have similar overlapping Al–OH absorption with each other; this study does not attempt to distinguish between the two species. With the presence of abundant calcite, detection of possible interference of the Mg–OH absorption near 2300 nm was not possible because this weak absorption would be masked out by the strong asymmetric absorption of CO32− represented by two Gaussians at 2340 and 2300 nm in the modified Gaussian model. The Mg–OH feature only interferes with the Gaussian at 2300 nm and does not affect the abundance quantification based on the Gaussian at 2340 nm. All three mean spectral reflectance curves in the VNIR spectrum (Figure 6B,D) displayed the strong ferric iron absorption near 500 nm without an obvious absorption near 670 nm. The lack of the absorption feature near 670 nm indicated the presence of secondary oxidized ferric iron in ferrihydrite and the lack of primary ferric iron in cementing goethite and hematite [44]. The absorption depth at 500 nm was modeled to represent the relative abundance of the ferric iron.
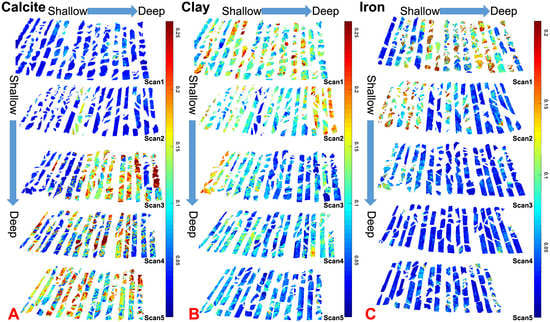
It is shown that the upper sections were mostly deficient in calcite and the lower sections were rich in calcite (Figure 7A). Compared with the stratigraphic column and the drilling records, these sections were most probably the siliciclastic sediments of the basal Claron Formation on the top and the underlying Callville Limestone on the bottom. The unconformity separating them was probably near the third core column from the left side of Scan3 (Figure 7A).
Above the unconformity, the calcite abundance in the basal Claron Formation is generally very low, except for a section of high calcite content in the fifth and sixth core column from the left side of Scan2 (Figure 7A). Calcite abundance is variable in Callville Limestone, including some spots of high calcite concentrations in sections of mostly low calcite content. Clay mineral abundances are significantly higher and display more variability in the basal Claron Formation than in the Callville Limestone (Figure 7B). Within the siliciclastic sections of the basal Claron Formation, the samples with medium calcite content usually are higher in clay contents. In contrast, within the sections of higher calcite abundance in the Callville Limestone, the clay content is lower. The carbonate-rich section in the basal Claron Formation also shows lower clay content than the siliciclastic sections. Ferric iron abundance is generally higher in the basal Claron Formation than in the Callville Limestone (Figure 7C). Most of the core samples above the section of high calcite content in Scan 2 (Figure 7B) display much higher ferric iron content than other samples (Figure 7C), which is consistent with the red-yellow colors in the VNIR true-color image (Figure 4A). Some core samples in the Callville Limestone display higher ferric iron content.
3.2. Geochemistry
Fire assay metallurgy measured gold concentrations for the core sections, and fifty-one (51) element concentrations were measured with ICP-MS (see Table S1 in supplemental data). Gold (Au) concentrations reported from ICP-MS had fewer significant digits than measurements by the fire assay, so the values from the fire assay were used in the analyses. Concentrations of boron (B), germanium (Ge), indium (In), niobium (Nb), rhenium (Re), tantalum (Ta), and titanium (Ti) were often below the detection limit and were therefore not reported.
Forty-four (44) element measurements from fifty core sections from 213 to 448 ft. (64.9 to 136.6 m) were analyzed by PCA (Figure 8). Silver (Ag), tellurium (Te), and lead (Pb) showed closest affinities to Au; sulfur (S), mercury (Hg), thallium (Tl), arsenic (As), bismuth (Bi), antimony (Sb), selenium (Se), and iron (Fe) were also close to Au. Major elements like calcium (Ca), magnesium (Mg), aluminum (Al), and phosphorus (P) showed little or no affinity to Au; transition metals like copper (Cu), molybdenum (Mo), and zinc (Zn) that often co-occurred with Au in porphyry mines did not show characteristic affinity with Au.
4. Discussion
4.1. Gold Mineralization in Carlin-Type Deposits
Carlin-type gold deposits form several spatial trends spanning the central Great Basin, northern Nevada, and central Nevada, and are characterized by concentrations of very finely micrometer to sub-micrometer sized disseminated arsenian pyrite grains found in structurally controlled, silty, carbonaceous, and calcareous rocks [1]. Regionally, after the flattening of the subducting Farallon plate under the North America plate around 65 Ma [45], extension prevailed in the Great Basin, and the rollback or delamination of the slab renewed magmatism in Eocene and Oligocene that swept the Great Basin southwestward from northern Nevada and Idaho to southern Nevada, southwest Utah, and north Arizona [2,46]. The dehydration of the slab, upwelling of asthenosphere, and the extensional environment enabled formation of hydrous, S- and Au-bearing, high-K, calc-alkaline magma with elevated Au/Cu ratio [47,48], which then released CO2-, H2S-, and Au-bearing aqueous fluid at a significantly deeper depth (about 10 km) than typical porphyry Cu–Au and associated deposits [2,49]. The fluid ascended along high-angle faults, and released vapor with high S/Fe ratios, which was trapped in permeable and reactive rocks by impermeable rocks, and precipitated gold in micro-sized arsenian pyrite grains, forming typical Carlin-type gold deposits. The Goldstrike district in southwest Utah is near the southeastward extension of the 25 million years magmatic front [2] with an active tectonic setting and high angle faults (Figure 1). Therefore gold mineralization may result from similar geologic processes to the Carlin-type deposits.
The host rock alteration of Carlin-type deposits is typically manifested by decarbonatization, argillization, silicification and/or jasperoid, fine-grained disseminated sulfide minerals and oxidation of sulfide minerals, remobilization and/or addition of carbon, and late-stage barite and/or calcite veining, with incipient collapse brecciation that enhances the migration of mineralization fluids [1,11]. Carlin-type deposits are typically stratiform, with mineralization localized with specific favorable stratigraphic units.
4.2. Stratigraphic Control
Gold concentrations measured with fire assay metallurgy were used to colorize outlines of scanned core sections and then compared with the mapped calcite and clay abundances (Figure 7) to infer the influences or patterns of mineralogy on gold mineralization. Gold concentrations are not homogeneous throughout whole core sections. Therefore necessary signals may be missed from sampling. However, geochemical analyses cannot sample small enough areas to be comparable to the resolution of hyperspectral imaging. Nevertheless, gold concentration data can show the general variations of the Au-bearing fluid flow patterns.
Gold mineralization is significantly influenced by stratigraphic and structural control in Carlin-type deposits. As shown in Figure 1 the oblique core in this study cut across a fault, which may have facilitated fluid flow. Rocks of low porosity and permeability act as aquitards to prevent fluid from ascending and the Au-bearing fluids react with the permeable rocks below aquitards to precipitate disseminated gold. The calcite-rich section in Scan2, the basal Claron Formation is such an aquitard due to its lower permeability compared with siliciclastic rocks below. Gold concentrations in the calcite-rich section were very low, then very high in the section below that, and decreasing downward (Figure 9B). Those samples with medium calcite content also showed relatively low gold concentrations. The combination of low permeability carbonate aquitard and high permeability siliciclastic rocks below in Carlin-type deposits were similar to the seal and reservoir rocks in conventional oil and gas industry. Exploration can be focused on such stratigraphic combinations near high-angle faults.
4.3. Mineralogical Alterations
Macroscopic rock alterations that are reported to be related to gold mineralization in the Goldstrike district as well as in the Carlin-type deposits include silicification, decarbonatization, argillization, and pyrite oxidation [1,11]. Quartz, chert, and amorphous silica are all not spectrally active in the visible to the short-wave infrared spectrum, only in the thermal infrared, so could not be studied by the hyperspectral cameras used in this study. Decarbonatization stands for the removal of carbonate, so the decline or diminishment of CO32− absorption near 2340 nm represents decarbonatization. Argillization stands for the addition of argillic minerals (most commonly illite and kaolinite), so the increase or appearance of Al–OH absorption near 2200 nm represents argillic alteration. These argillic minerals may come from alterations of felsic minerals or the ore fluids. The basal Claron Formation is sandstone or conglomerate sandstone, which may have argillaceous material, but without a lateral comparison with unaltered strata, it is hard to confirm the argillic alteration in a single core. More cores or outcrops may be helpful. However, the authors only had limited access. On the other hand, Callville Limestone rarely has argillaceous components [50,51], and the detection of Al–OH absorption is interpreted to represent argillic alteration. Pyrite and arsenian pyrite in the strata can be oxidized into ferric iron minerals after mineralization, which is especially common in pyrite-rich silty limestones or limey siltstones [1], so the detection of ferric iron absorption near 500 nm may represent pyrite oxidation.
Much of the scanned Callville Limestone has undergone various degrees of decarbonatization. Patches of high calcite content surrounded by areas of lower calcite content can be seen below the unconformity in Scan3, are prevalent in Scan4, and in some columns in Scan5. Some sections have gone through strong decarbonatization removing all the calcite. Decarbonatization may reflect more active gold mineralization, as the gold concentrations are relatively higher in these sections (Figure 9B). Some of the scanned Callville Limestone has also undergone various degrees of argillization. Samples of medium clay contents can be seen in Figure 9C, with argillization corresponding to more active gold mineralization and relatively higher gold concentrations (Figure 9D). Some samples in Callville Limestone showed higher ferric iron (Figure 9E), which might correlate with pyrite oxidation after mineralization with higher gold concentrations (Figure 9F).
These interpretations were supported by PCA of absorption depths together with element concentrations (Figure 10). Due to the significant differences in lithology and alteration patterns, measurements of seventeen (17) siliciclastic and seventeen carbonate rock sections (including the carbonate aquitard section in the basal Claron Formation) were processed separately. The average pixel value of absorption depths and 12 selected elements were analyzed by PCA since only seventeen sections were available. Analyses in siliciclastic rocks showed that calcite, clay, and ferric iron depths all had minimal affinities with gold (Figure 10A; See Table S2 in supplemental data). This confirmed that decarbonatization and argillization in siliciclastic rocks could not be easily mapped from a single core and correlate with gold mineralization. However, stratigraphic control by different lithologies played a major role (Figure 9). It was also shown that calcite and clay absorption depths were close to each other, supporting the observation that samples with medium calcite content usually were higher in clay contents. On the other hand, analyses in carbonate rocks showed that both clay and ferric iron depths had close affinities to silver and a little less affinity to gold, while calcite depth showed very limited affinity to gold, silver, and clay depth (Figure 10B) (See Table S4 in supplemental data). These facts confirmed that decarbonatization, argillization, and pyrite oxidation in carbonate rocks could be mapped from core samples, and correlated with gold mineralization. The identification of these mineralogical alterations could be used as a classifier for ore grades; intense alterations might correlate with higher grades, and weak alterations correlate with lower grades.
Besides the macroscopic alterations, some trace elements like As, Hg, and Sb are associated with gold mineralization, and they form sulfide minerals like orpiment, realgar, cinnabar, and stibnite. These minerals appeared in trace amount, and no investigation was performed on these minerals.
4.4. Implications
This study showed an example of using hyperspectral imaging to identify the optimum stratigraphic combination of limestone above and siliciclastic rocks below, as well as mineralogical alterations including decarbonatization, argillization, and pyrite oxidation that are related to gold mineralization. Such mineralogical information may shed light on the geologic mechanism of mineralization, and help in the determination of mining interests with similar stratigraphic and structural conditions, as well as help in the classification of ore grades based on the alteration patterns. Without expenses in chemical consumables and procedure, most of the costs of hyperspectral imaging are for personnel. As a result, hyperspectral imaging may be a cost-effective alternative or complementary method for geochemical methods [52,53]. Besides, the sub-centimeter spatial resolution and detailed mineralogical identification/semi-quantification from hyperspectral imaging are superior to lithologic logging that accompanies exploration drilling. Ground-based hyperspectral imaging, as a new direction in earth sciences, provides high spatial and spectral resolution measurements, fast data collection, sizeable areal coverage, and easy data processing. We envision more studies with hyperspectral imaging in various fields of earth sciences.
5. Conclusions
Hyperspectral imaging was used to scan a core covering the basal Claron Formation and Callville Limestone in the Goldstrike district, southwest Utah, which is believed to be similar to Carlin-type gold deposits in Nevada with sediment-hosted disseminated gold. This study used spectral modeling to identify and semi-quantify calcite, clay minerals, and ferric iron. Variations in mineralogy are used to identify lithology, as well as decarbonatization, argillization, and pyrite oxidation alterations within the core samples. Compared with metallurgy and ICP-MS geochemical data of the core, this study confirmed the correlation between stratigraphic control as well as mineralogical alterations with gold mineralization. Although the silicification and formation of jasperoids are essential indicators of gold mineralization, silica is not spectrally active in the reflected spectrum and cannot be studied by hyperspectral imaging. This state-of-art technology has excellent potentials in broader applications in the mining industry.
Supplementary Materials
The following are available online at https://www.mdpi.com/2072-4292/11/17/1987/s1, Table S1: Element concentrations from fire assay metallurgy and ICP-MS; Table S2: Correlation matrix of absorption depths and element concentrations in siliciclastic rocks; Table S3: Eigenvalues of the correlation matrix of absorption depths and element concentrations in siliciclastic rocks; Table S4: Correlation matrix of absorption depths and element concentrations in carbonate rocks; Table S5: Eigenvalues of the correlation matrix of absorption depths and element concentrations in carbonate rocks.
Author Contributions
Conceptualization, L.S. and S.K.; data curation, L.S.; formal analysis, L.S.; methodology, L.S.; resources, P.S.; writing—original draft preparation, L.S.; writing—review and editing, S.K.
Funding
This research received no external funding.
Acknowledgments
We are thankful to Pilot Goldstrike Inc. for their help and the permission to publish this paper. We thank three anonymous reviewers for their helpful suggestions and academic editor Amin Beiranvand Pour for his kind support. We also appreciate the help of Diana Krupnik and Macey Crockett in fieldwork.
Conflicts of Interest
The authors declare no conflict of interest.
References
- Cline, J.S.; Hofstra, A.H.; Muntean, J.L.; Tosdal, R.M.; Hickey, K.A. Carlin-type gold deposits in Nevada: Critical geologic characteristics and viable models. Econ. Geol. 100th Anniv. Vol. 2005, 451–484. [Google Scholar] [CrossRef]
- Muntean, J.L.; Cline, J.S.; Simon, A.C.; Longo, A.A. Magmatic-hydrothermal origin of Nevada’s Carlin-type gold deposits. Nat. Geosci. 2011, 4, 122–127. [Google Scholar] [CrossRef]
- Gu, X. Turbidite-Hosted Micro-Disseminated Gold Deposits; Chengdu University of Science and Technology Press: Chengdu, China, 1996. [Google Scholar]
- Ashley, R.P.; Cunningham, C.G.; Bostick, N.H.; Dean, W.E.; Chou, I.M. Geology and geochemistry of three sedimentary-rock-hosted disseminated gold deposits in Guizhou Province, People’s Republic of China. Ore Geol. Rev. 1991, 6, 133–151. [Google Scholar] [CrossRef]
- Xia, Y.; Su, W.; Zhang, X.; Liu, J. Geochemistry and metallogenic model of carlin-type gold deposits in southwest Guizhou province, China. In Geochemistry-Earth’s System Processes; Panagiotaras, D., Ed.; InTech: Rijeka, Croatia, 2012; pp. 127–156. [Google Scholar]
- Percival, T.J.; Radtke, A.S. Sedimentary-rock-hosted disseminated gold mineralization in the Alsar district, Macedonia. Can. Mineral. 1994, 32, 649–665. [Google Scholar]
- Staude, J.M.G. Epithermal Mineralization in The Sierra Madre Occidental, and the Metallogeny of Northwestern Mexico. Ph.D. Thesis, University of Arizona, Tucson, AZ, USA, 1995. [Google Scholar]
- Krahulec, K. Sedimentary rock-hosted gold and silver deposits of the Northeastern Basin and Range, Utah. Gt. Basin Evolut. Metallog. Geol. Soc. Nev. Symp. 2010, 1, 31–62. [Google Scholar]
- Emsbo, P.; Hutchinson, R.W.; Hofstra, A.H.; Volk, J.A.; Bettles, K.H.; Baschuk, G.J.; Johnson, C.A. Syngenetic au on the carlin trend: Implications for carlin-type deposits. Geology 1999, 27, 59–62. [Google Scholar] [CrossRef]
- Willden, R.; Adair, D.H. Gold deposits at Goldstrike, Utah. In Thrusting and Extensional Structures and Mineralization in the Beaver Dam Mountains, Southwestern Utah; Griffen, D.T., Phillips, W.R., Eds.; Utah Geological Association: Salt Lake City, UT, USA, 1986; pp. 137–147. [Google Scholar]
- Gustin, M.M.; Smith, M.T. Technical Report on the Goldstrike Project, Washington County, Utah, U.S.A.; Technical Report No.; Mine Development Associates: Reno, NV, USA, 2016; pp. 1–106. [Google Scholar]
- Willden, R. Goldstrike mining district, Washington County, Utah. In Mining Districts of Utah; Bon, R.L., Gloyn, R.W., Park, G.M., Eds.; Utah Geological Association: Salt Lake City, UT, USA, 2006; pp. 458–476. [Google Scholar]
- Dalm, M.; Buxton, M.W.N.; van Ruitenbeek, F.J.A. Discriminating ore and waste in a porphyry copper deposit using short-wavelength infrared (SWIR) hyperspectral imagery. Miner. Eng. 2017, 105, 10–18. [Google Scholar] [CrossRef]
- Gallie, E.A.; McArdle, S.; Rivard, B.; Francis, H. Estimating sulphide ore grade in broken rock using visible/infrared hyperspectral reflectance spectra. Int. J. Remote Sens. 2002, 23, 2229–2246. [Google Scholar] [CrossRef]
- Kruse, F.A.; Bedell, R.L.; Taranik, J.V.; Peppin, W.A.; Weatherbee, O.; Calvin, W.M. Mapping alteration minerals at prospect, outcrop and drill core scales using imaging spectrometry. Int. J. Remote Sens. 2012, 33, 1780–1798. [Google Scholar] [CrossRef]
- Riaza, A.; Müller, A. Hyperspectral remote sensing monitoring of pyrite mine wastes: A record of climate variability (Pyrite Belt, Spain). Environ. Earth Sci. 2010, 61, 575–594. [Google Scholar] [CrossRef]
- Adair, D.H. Structural Setting of the Goldstrike District, Washington County, Utah. In Thrusting and Extentional Structures and Mineralization in the Beaver Dam Mountains, Southwest Utah; Griffen, D.T., Phillips, W.R., Eds.; 1986; Volume 15, pp. 129–135. Available online: http://archives.datapages.com/data/uga/data/057/057001/129_ugs570129.htm (accessed on 22 August 2019).
- Christiansen, R.L.; Yeats, R.S.; Graham, S.A.; Niem, W.A.; Niem, A.R.; Snavely, P.D., Jr. Post-Laramide geology of the US Cordilleran region. In The Cordilleran Orogen, Conterminous US: Geology of North America 3; Burchfiel, B.C., Lipman, P.W., Zoback, M.L., Eds.; Geological Society of America: Boulder, CO, USA, 1992; pp. 261–406. [Google Scholar]
- Rowley, P.D.; Anderson, R.E.; Hacker, D.B.; Boswell, J.T.; Maxwell, D.J.; Cox, D.P.; Willden, R.; Adair, D.H. Interim Geologic Map of the Goldstrike Quadrangle and the East Part of the Docs Pass Quadrangle. Washington County, Utah; Utah Geological Survey Open-File Report 510; Utah Geological Survey: Salt Lake City, Utah, 2007. [Google Scholar]
- Ott, A.L. Detailed Stratigraphy and Stable Isotope Analysis of the Claron Formation, Bryce Canyon National Park, Southwestern Utah. Master’s Thesis, Washington State University, Pullman, WA, USA, 1999. [Google Scholar]
- Clark, R.N.; Swayze, G.A.; Livo, K.E.; Kokaly, R.F.; Sutley, S.J.; Dalton, J.B.; McDougal, R.R.; Gent, C.A. Imaging spectroscopy: Earth and planetary remote sensing with the USGS Tetracorder and expert systems. J. Geophys. Res. Planets 2003, 108, 5131. [Google Scholar] [CrossRef]
- Alonso de Linaje, V.; Khan, S.D.; Bhattacharya, J. Study of carbonate concretions using imaging spectroscopy in the Frontier Formation, Wyoming. Int. J. Appl. Earth Obs. Geoinf. 2018, 66, 82–92. [Google Scholar] [CrossRef]
- Entezari, I.; Rivard, B.; Geramian, M.; Lipsett, M.G. Predicting the abundance of clays and quartz in oil sands using hyperspectral measurements. Int. J. Appl. Earth Obs. Geoinf. 2017, 59, 1–8. [Google Scholar] [CrossRef]
- Khan, S.D.; Okyay, U.; Ahmad, L.; Shah, M.T. Characterization of gold mineralization in northern Pakistan using imaging spectroscopy. Photogramm. Eng. Remote Sens. 2018, 84, 425–434. [Google Scholar] [CrossRef]
- Krupnik, D.; Khan, S.; Okyay, U.; Hartzell, P.; Zhou, H.W. Study of Upper Albian rudist buildups in the Edwards Formation using ground-based hyperspectral imaging and terrestrial laser scanning. Sediment. Geol. 2016, 345, 154–167. [Google Scholar] [CrossRef] [Green Version]
- Okyay, U.; Khan, S.D.; Lakshmikantha, M.R.; Sarmiento, S. Ground-based hyperspectral image analysis of the Lower Mississippian (Osagean) reeds spring formation rocks in southwestern Missouri. Remote Sens. 2016, 8, 1–21. [Google Scholar] [CrossRef]
- Sun, L.; Khan, S.D.; Sarmiento, S.; Lakshmikantha, M.R.; Zhou, H. Ground-based hyperspectral imaging and terrestrial laser scanning for fracture characterization in the Mississippian Boone Formation. Int. J. Appl. Earth Obs. Geoinf. 2017, 63, 222–233. [Google Scholar] [CrossRef]
- Sun, L.; Khan, S.; Godet, A. Integrated ground-based hyperspectral imaging and geochemical study of the Eagle Ford Group in West Texas. Sediment. Geol. 2018, 363, 34–47. [Google Scholar] [CrossRef]
- Green, A.A.; Berman, M.; Switzer, P.; Graig, M.D. A transformation for ordering multispectral data in term of image quality with implications for noise removal. IEEE Trans. Geosci. Remote Sens. 1988, 26, 65–74. [Google Scholar] [CrossRef]
- Clark, R.N.; Swayze, G.A.; Wise, R.; Livo, K.E.; Hoefen, T.M.; Kokaly, R.F.; Sutley, S.J. USGS Digital Spectral Library Splib06a; Digital Data Series 231; US Geological Survey: Reston, VA, USA, 2007.
- Clark, R.N.; Roush, T.L. Reflectance spectroscopy: Quantitative analysis techniques for remote sensing applications. J. Geophys. Res. Solid Earth 1984, 89, 6329–6340. [Google Scholar] [CrossRef]
- Mustard, J.F.; Sunshine, J. Spectral analysis for earth science: Investigations using remote sensing data. In Remote Sensing for the Earth Sciences: Manual of Remote Sensing; Rencz, A.N., Ed.; John Wiley & Sons, Inc.: New York, NY, USA, 1999; pp. 251–307. [Google Scholar]
- Sunshine, J.M.; Pieters, C.M.; Pratt, S.F. Deconvolution of minerals absorption bands: An improved approach. J. Geophys. Res 1990, 95, 6955–6966. [Google Scholar] [CrossRef]
- Asadzadeh, S.; de Souza Filho, C.R. Spectral remote sensing for onshore seepage characterization: A critical overview. Earth Sci. Rev. 2017, 168, 48–72. [Google Scholar] [CrossRef] [Green Version]
- Hunt, G.R. Near-infrared (1.3–2.4 μm) spectra of alteration minerals–Potential for use in remote sensing. Geophysics 1979, 44, 1974–1986. [Google Scholar] [CrossRef]
- Cloutis, E.A.; Gaffey, M.J.; Jackowski, T.L.; Reed, K.L. Calibrations of phase abundance, composition, and particle size distribution for olivine-orthopyroxene mixtures from reflectance spectra. J. Geophys. Res. 1986, 91, 11641–11653. [Google Scholar] [CrossRef]
- Gaffey, S.J. Spectral reflectance of carbonate minerals in the visible and near infrared (0.35–2.55 μm): Anhydrous carbonate minerals. J. Geophys. 1987, 92, 1429–1440. [Google Scholar] [CrossRef]
- Hunt, G.R.; Salisbury, J.W. Visible and near infrared spectra of minerals and rocks. II. Carbonates. Mod. Geol. 1971, 2, 23–30. [Google Scholar]
- Hunt, G.R.; Salisbury, J.W. Visible and near-infrared spectra of minerals and rocks: I silicate minerals. Mod. Geol. 1970, 1, 283–300. [Google Scholar]
- Clark, R.N.; King, T.V.V.; Klejwa, M.; Swayze, G.; Vergo, N. High spectral resolution reflectance spectroscopy of minerals. J. Geophys. Res 1990, 95, 12653–12680. [Google Scholar] [CrossRef] [Green Version]
- Morris, R.V.; Lauer, H.V.; Lawson, C.A.; Gibson, E.K.; Nace, G.A.; Stewart, C. Spectral and other physicochemical properties of submicron powders of hematite (alpha-Fe2o3), maghemite (gamma-Fe2o3), magnetite (Fe3o4), goethite (alpha-Feooh) and lepidocrocite (gamma-Feooh). J. Geophys. Res 1985, 90, 3126–3144. [Google Scholar] [CrossRef]
- Pearson, K. Principal components analysis. Lond. Edinb. Dublin Philos. Mag. J. Sci. 1901, 6, 559. [Google Scholar] [CrossRef]
- Wold, S.; Esbensen, K.; Geladi, P. Principal component analysis. Chemom. Intell. Lab. Syst. 1987, 2, 37–52. [Google Scholar] [CrossRef]
- Sun, L.; Khan, S. Ground-based hyperspectral remote sensing of hydrocarbon-induced rock alterations at cement, Oklahoma. Mar. Pet. Geol. 2016, 77, 1243–1253. [Google Scholar] [CrossRef]
- Coney, P.J.; Reynolds, S.J. Cordilleran Benioff zones. Nature 1977, 270, 403–406. [Google Scholar] [CrossRef]
- Humphreys, E.D. Post-Laramide removal of the Farallon slab, western United States. Geology 1995, 23, 987–990. [Google Scholar] [CrossRef]
- Richards, J.P. Postsubduction porphyry Cu-Au and epithermal Au deposits: Products of remelting of subduction-modified lithosphere. Geology 2009, 37, 247–250. [Google Scholar] [CrossRef]
- Gans, P.B.; Mahood, G.A.; Schermer, E. Synextensional Magmatism in the Basin and Range Province: A Case Study from the Eastern Great Basin; Geological Society of America: Boulder, CO, USA, 1989. [Google Scholar]
- Williams-Jones, A.E.; Heinrich, C.A. Vapor transport of metals and the formation of magmatic-hydrothermal ore deposits. Econ. Geol. 2005, 100, 1287–1312. [Google Scholar] [CrossRef]
- Rice, J.A. Stratigraphy, Diagenesis, and Provenance of Upper Paleozoic Eolian Limestones, Western Grand Canyon and Southern Nevada. Ph.D. Thesis, University of Nebraska-Lincoln, Lincoln, NE, USA, May, 1990. [Google Scholar]
- Wardlaw, B.R. The Pennsylvanian Callville Limestone of Beaver County, southwestern Utah. In Paleozoic Paleogeography of the West-Central United States: Rocky Mountain Paleogeography Symposium 1; Fouch, T.D., Magathan, E.R., Eds.; Rocky Mountain Section SEPM: Denver, CO, USA, 1980; pp. 175–179. [Google Scholar]
- Choe, E.; van der Meer, F.; van Ruitenbeek, F.; van der Werff, H.; de Smith, B.; Kim, K.W. Mapping of heavy metal pollution in stream sediments using combined geochemistry, field spectroscopy, and hyperspectral remote sensing: A case study of the Rodalquilar mining area, SE Spain. Remote Sens. Environ. 2008, 112, 3222–3233. [Google Scholar] [CrossRef]
- Hong-yan, R.E.N.; Da-fang, Z.; Singh, A.N.; Jian-jun, P.A.N.; Dong-sheng, Q.I.U. Estimation of As and Cu contamination in agricultural soils around a mining area by reflectance spectroscopy: A case study. Pedosphere 2009, 19, 719–726. [Google Scholar]
Figure 1.
(A) Geologic map of the Hamburg pit and nearby area; (B) location of the Goldstrike district and Washington County, Utah in the basin and range setting of eastern Great Basin (red); and (C) location of the Goldstrike district (red) in Washington County, Utah. The core location is shown with a large green circle in (A), and the map view trajectory of the retrieved core samples is shown with small green dots, pit outlines and names are shown in red. Mapped geologic units in (A) are: Tql = Leach Canyon Formation; Tin = Isom Formation and Wah Wah Springs Formation; Tcu = Claron Formation upper unit; Tcm = Claron Formation middle unit; Tcl = Claron Formation lower unit; Pq = Queantoweap Sandstone; Pp = Pakoon Formation; IPc = Callville Limestone; Msc = Scotty Wash Quartzite and Chainman Shale; Mr = Redwall Limestone. Original geologic map in (A) retrieved from Rowley et al. [19], the original scale of the map is 1:24,000. The magenta lines in (B) represent the mid-Tertiary magmatic fronts that swept the Great Basin from northeast to southwest (from Muntean et al. [2]), the ages of the magmatic fronts are also labeled. The black rectangle in (C) shows the extent of the map area in (A) within the Goldstrike District.

Figure 2.
Stratigraphic column of the Goldstrike area, modified from Rowley et al. [19].
Figure 2.
Stratigraphic column of the Goldstrike area, modified from Rowley et al. [19].
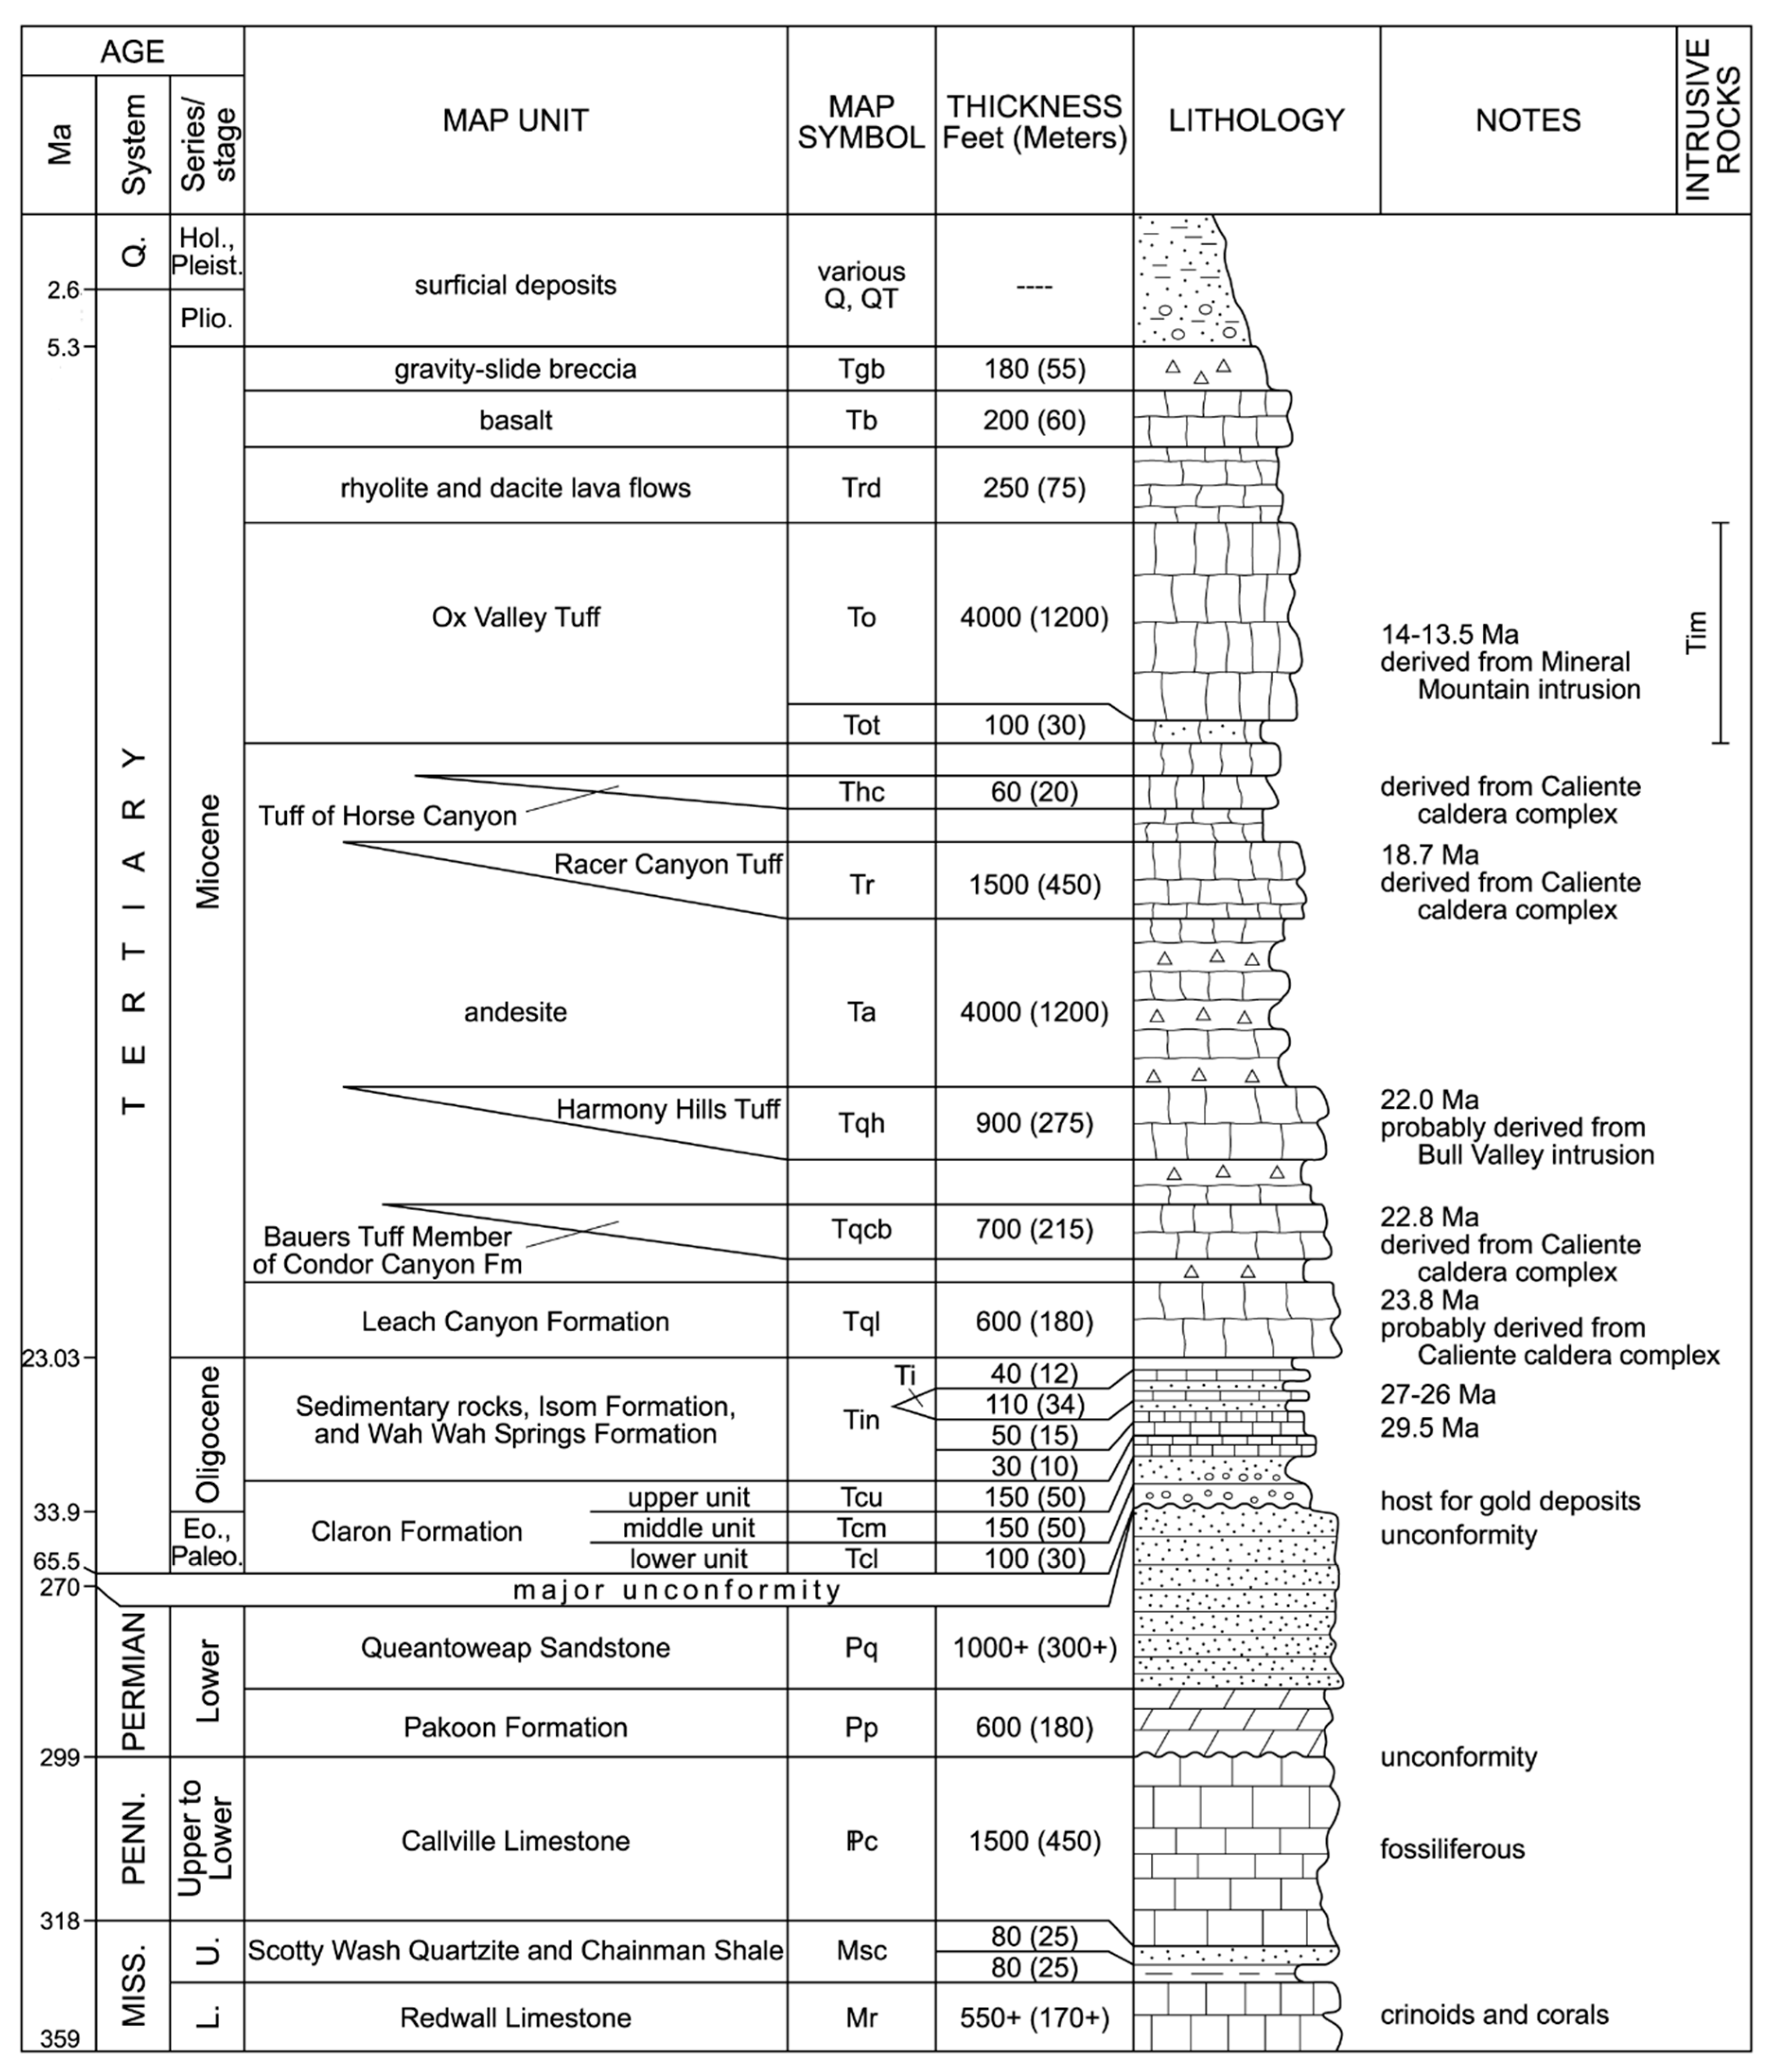
Figure 3.
(A) A core box with five 3-ft-long columns containing core samples, with depth markers separating core sections; (B) each hyperspectral scan covers three core boxes, a white reference panel is included for calibration; (C) metallurgy and geochemical results are labeled for each core section; and (D) field setup of hyperspectral cameras mounted on a pan and tilt rotating head (FLIR Systems, Wilsonville, USA) to scan core samples.

Figure 4.
(A) True-color image of the core samples; and (B) false-color composite of bands 206-217-228 in the short wave infrared (SWIR) data of the core samples. Pixels other than the core samples have been masked out. The RGB bands in (B) have wavelengths of 2203, 2271, and 2340 nm, respectively. The red lines show the interpreted unconformity between the basal Claron Formation and the underlying Callville Limestone.
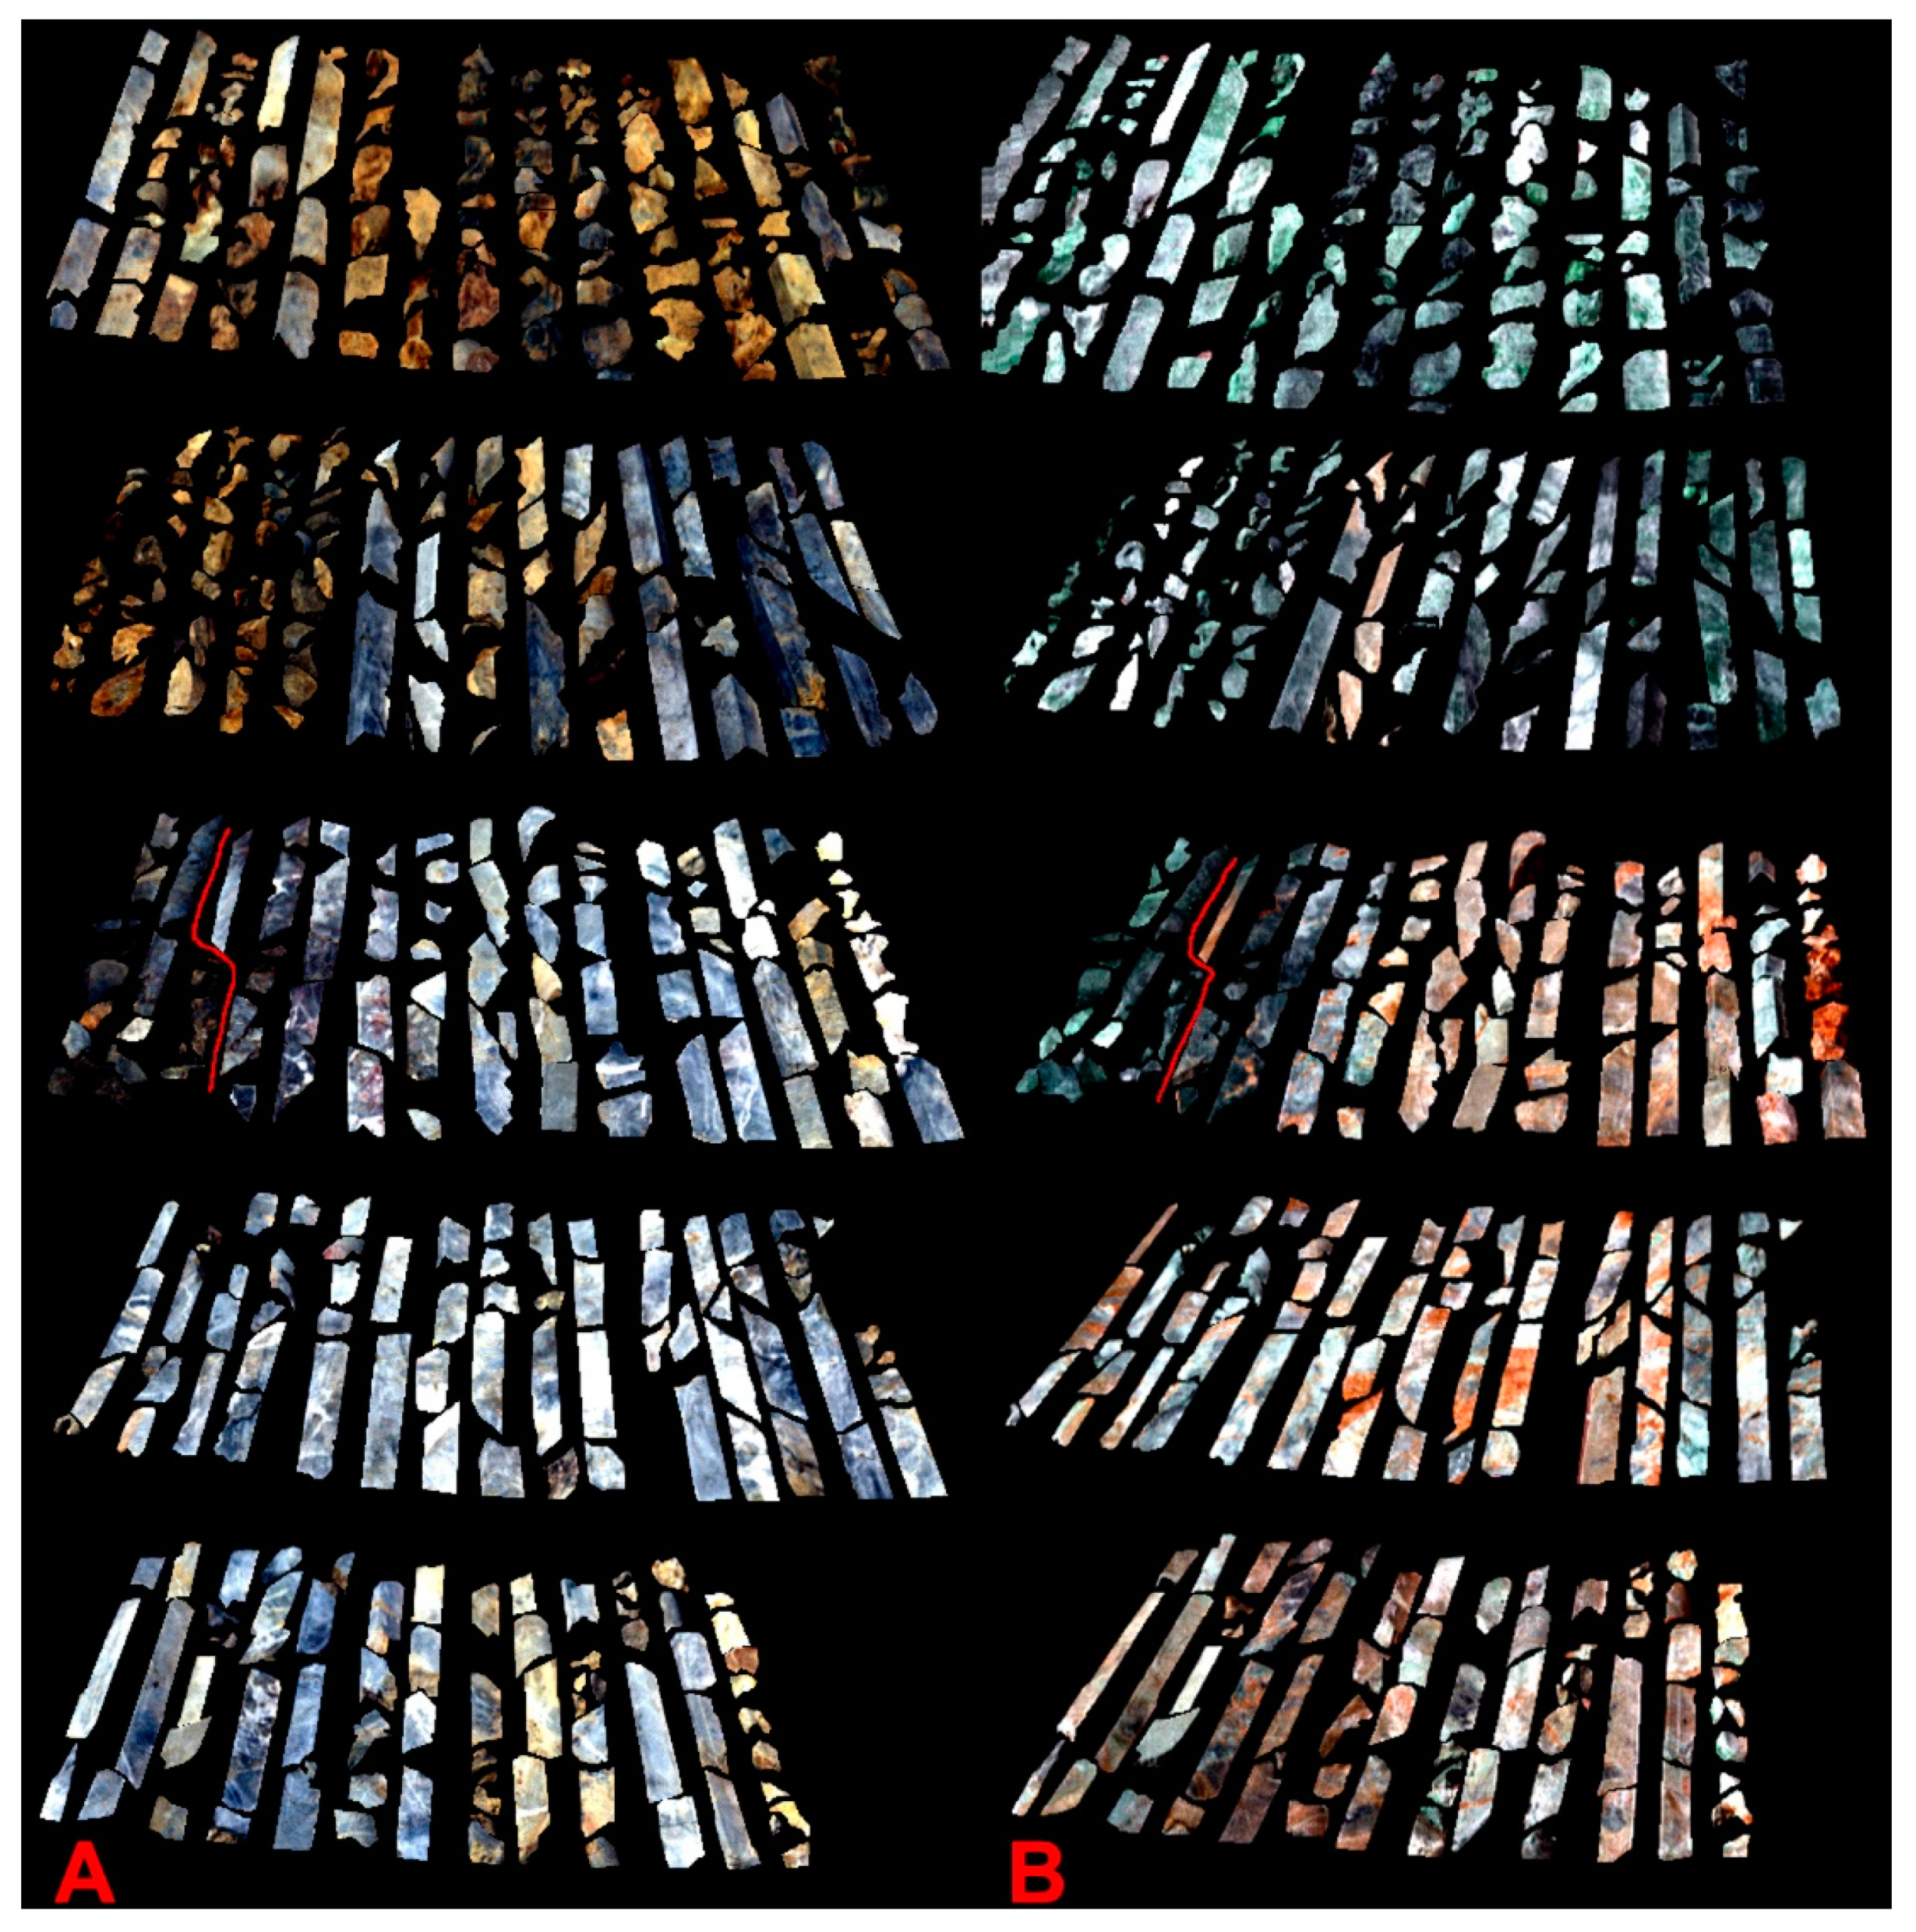
Figure 5.
(A) Continuum removed spectra of common carbonate and phyllosilicate minerals in sedimentary rocks, and (B) continuum removed spectra of common ferric iron oxide and hydroxides, data from Clark et al. [30].
Figure 5.
(A) Continuum removed spectra of common carbonate and phyllosilicate minerals in sedimentary rocks, and (B) continuum removed spectra of common ferric iron oxide and hydroxides, data from Clark et al. [30].
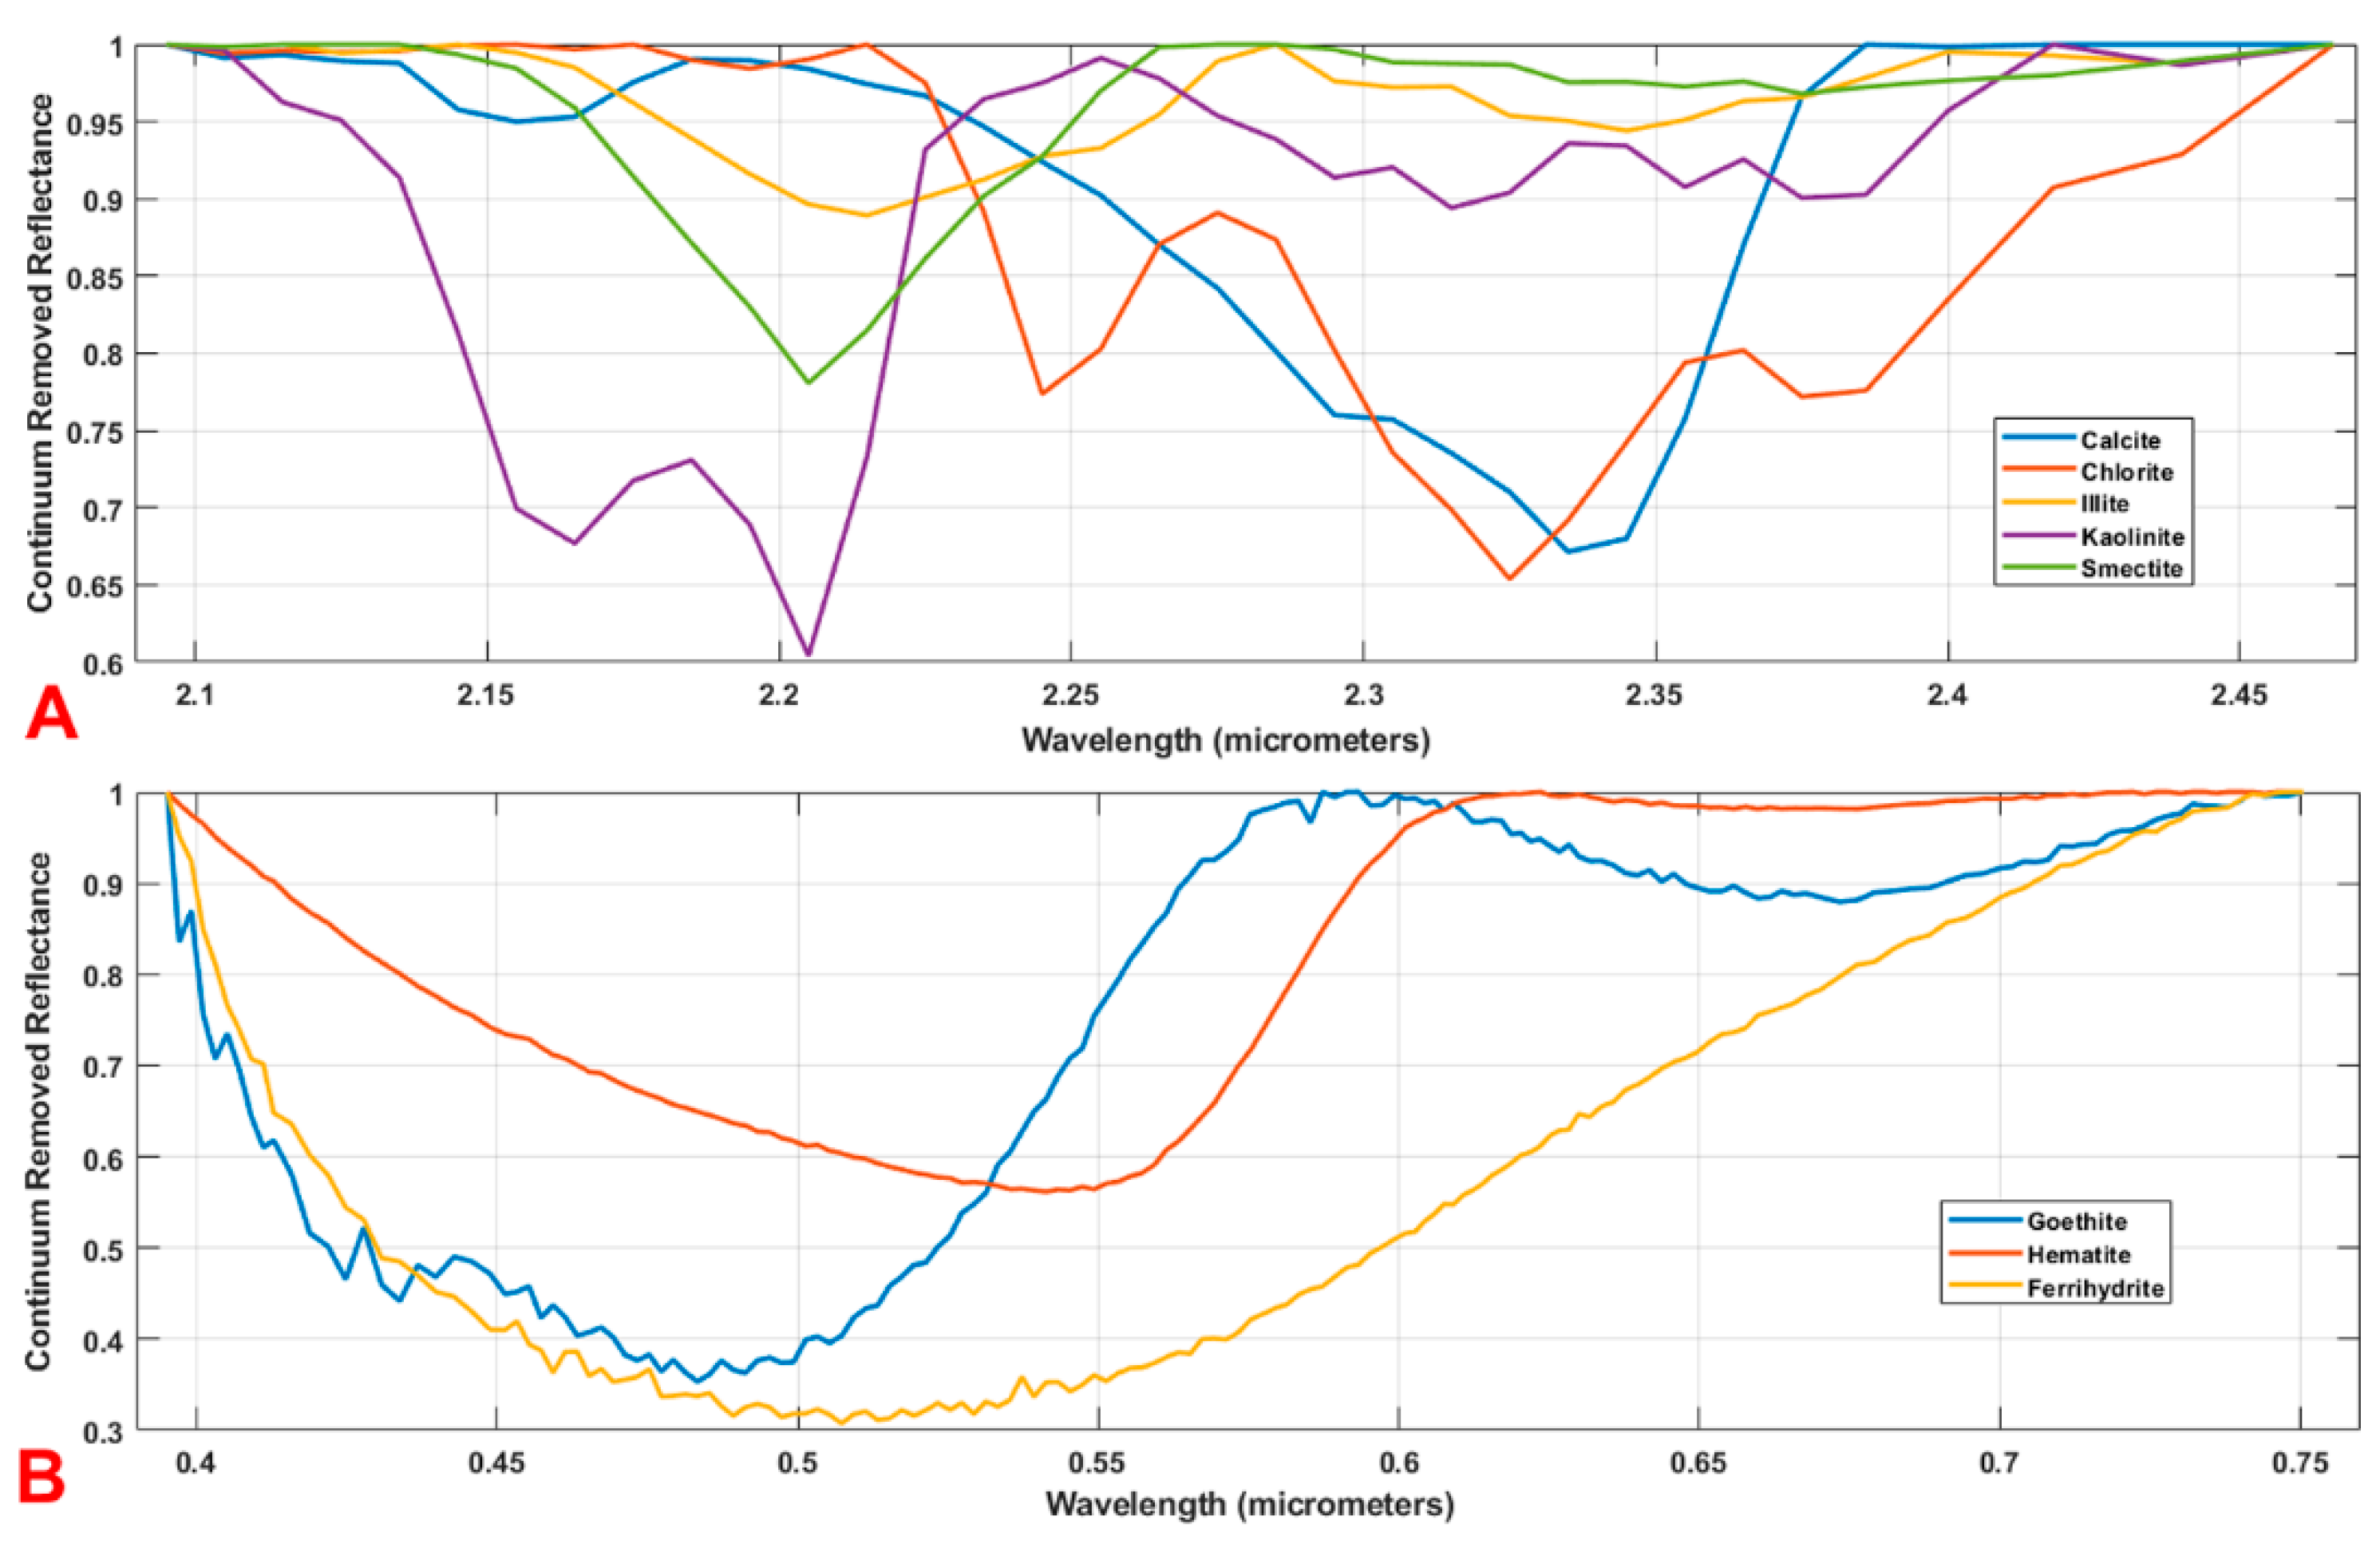
Figure 6.
(A) Mean spectral reflectance curves of scanned core samples in the SWIR spectrum; (B) mean spectral reflectance curves of scanned core samples in the visible and near-infrared (VNIR) spectrum; (C) mean continuum removed reflectance curves of scanned core samples in the SWIR spectrum; and (D) mean continuum removed reflectance curves of scanned core samples in the VNIR spectrum. Some siliciclastic rocks showed strong red-yellow colors with abundant ferric iron, these rocks were plotted separately in the VNIR spectra (B,D).

Figure 7.
(A) Depths of continuum removed absorption features at 2340 nm representing calcite abundance; (B) depths of continuum removed absorption feature at 2200 nm representing clay mineral abundances; and (C) depths of continuum removed absorption feature at 500 nm representing ferric iron abundances. Red to yellow colors mean higher abundances, and blue to green colors mean lower abundances. Five scans were mosaicked together, core samples were shallower on the left and up, and deeper on the right and down. The red line in (A) shows the interpreted unconformity between the basal Claron Formation and the underlying Callville Limestone. The identified aquitard and samples with medium calcite content in the basal Claron Formation, and patches of decarbonatization in the Callville Limestone are labeled in (A); some argillization samples with medium clay contents are circled in (B); and some carbonate samples with relatively higher contents of pyrite oxidized into ferric iron are circled in (C).
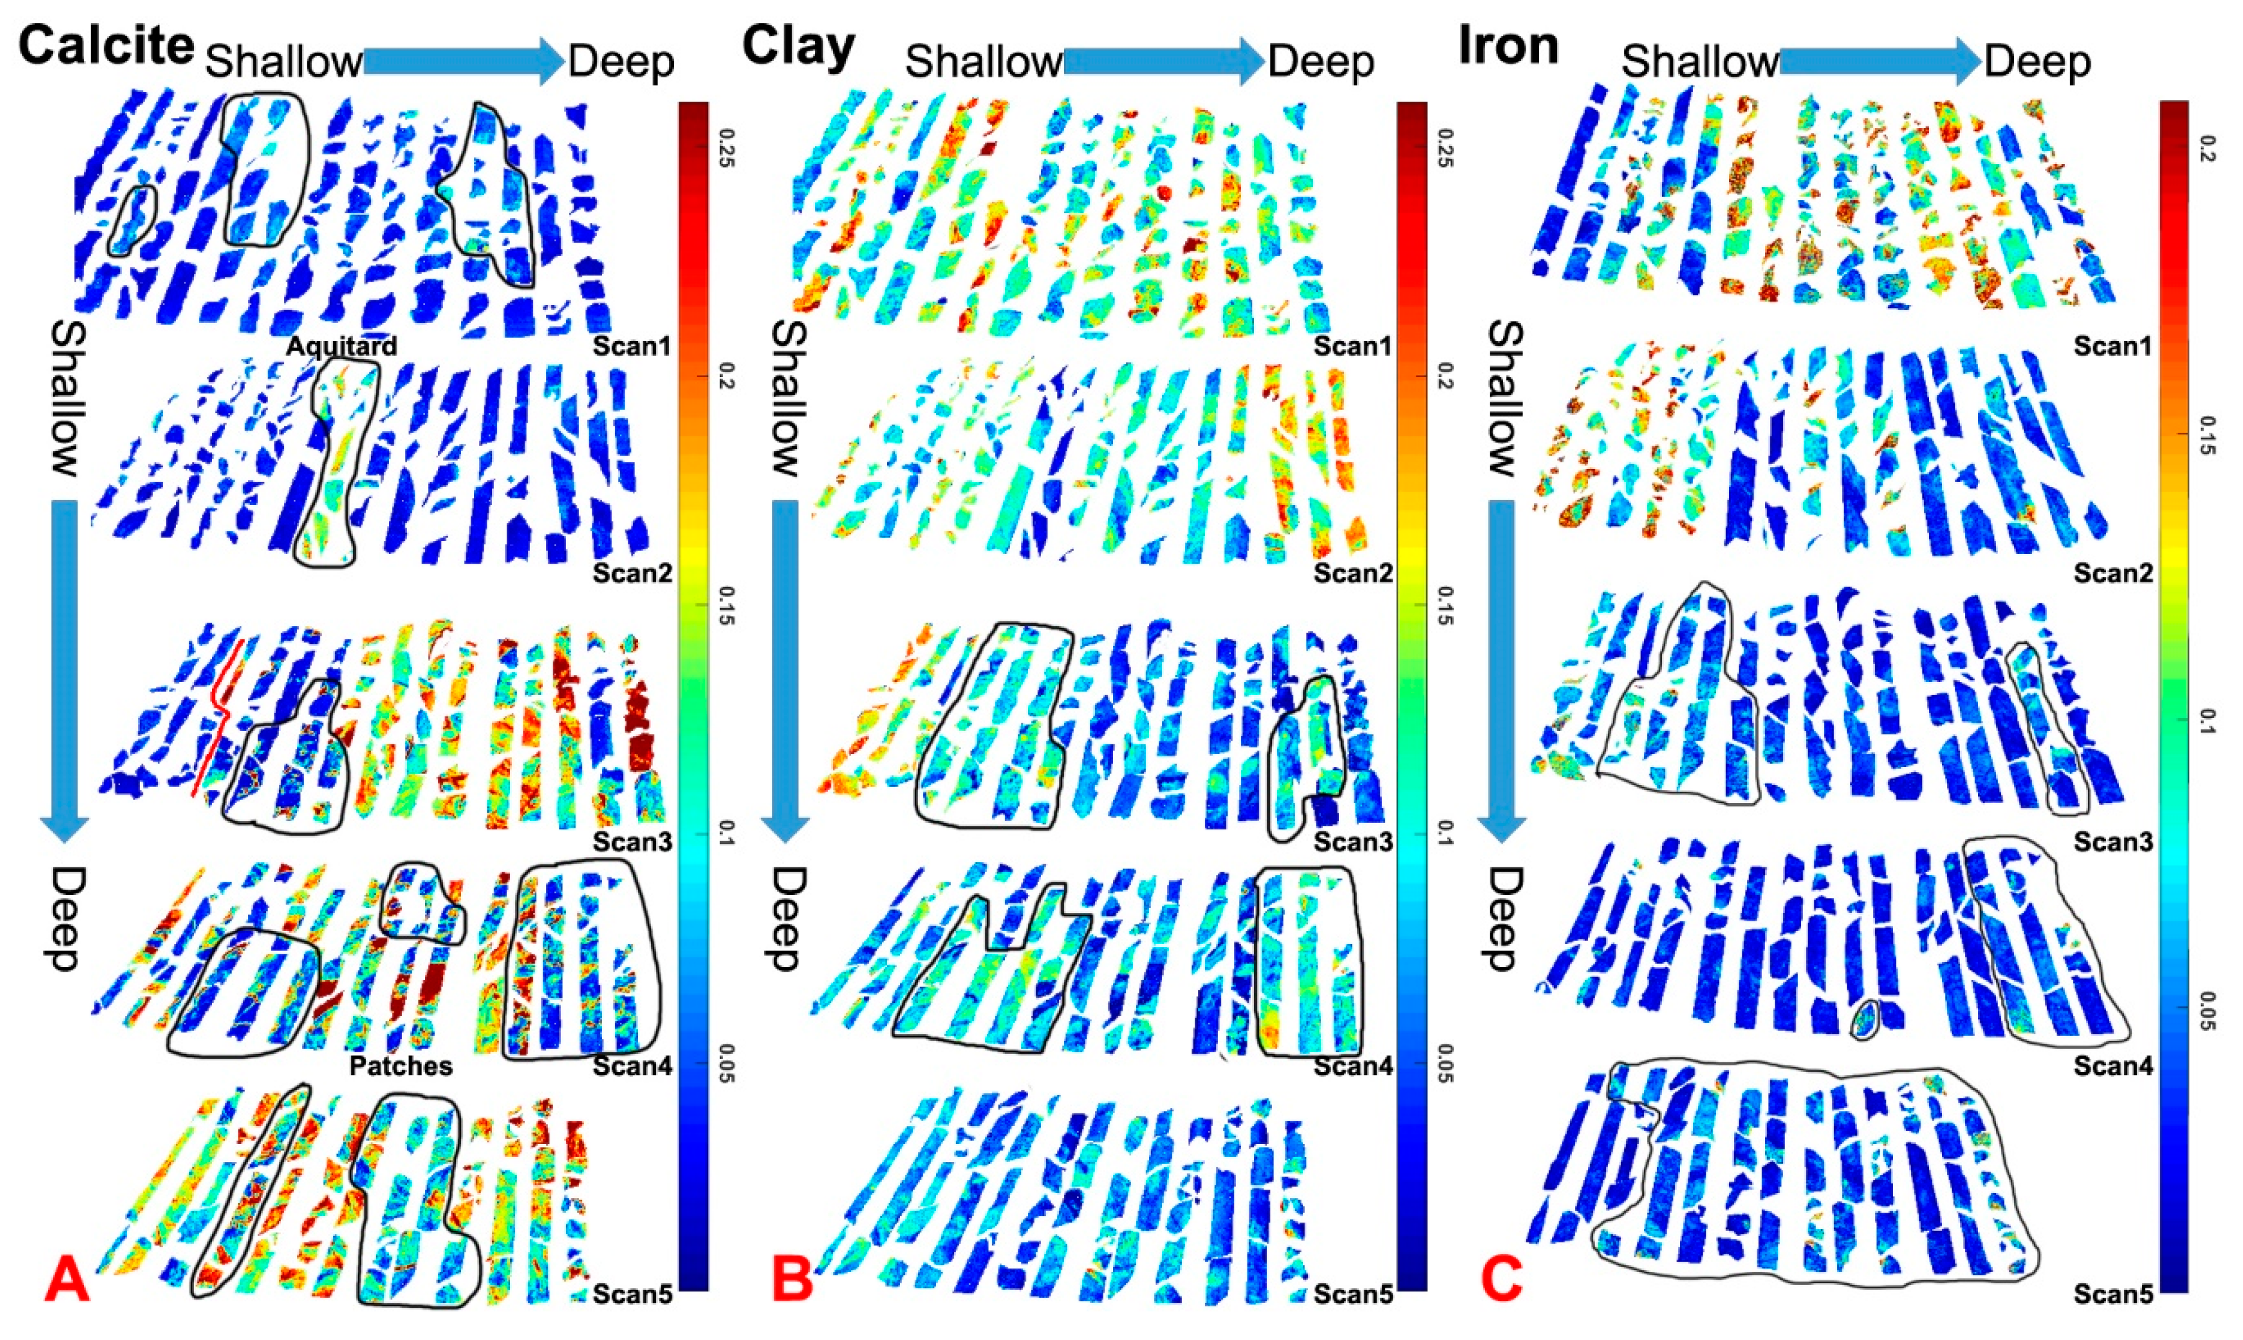
Figure 8.
Bi-plot of principal components from the geochemical analyses. Blue vectors show loadings (correlation coefficients) of element concentrations, and red dots show sample scores (linear combinations of eigenvectors). The lengths of element vectors were magnified 30 times to increase legibility.
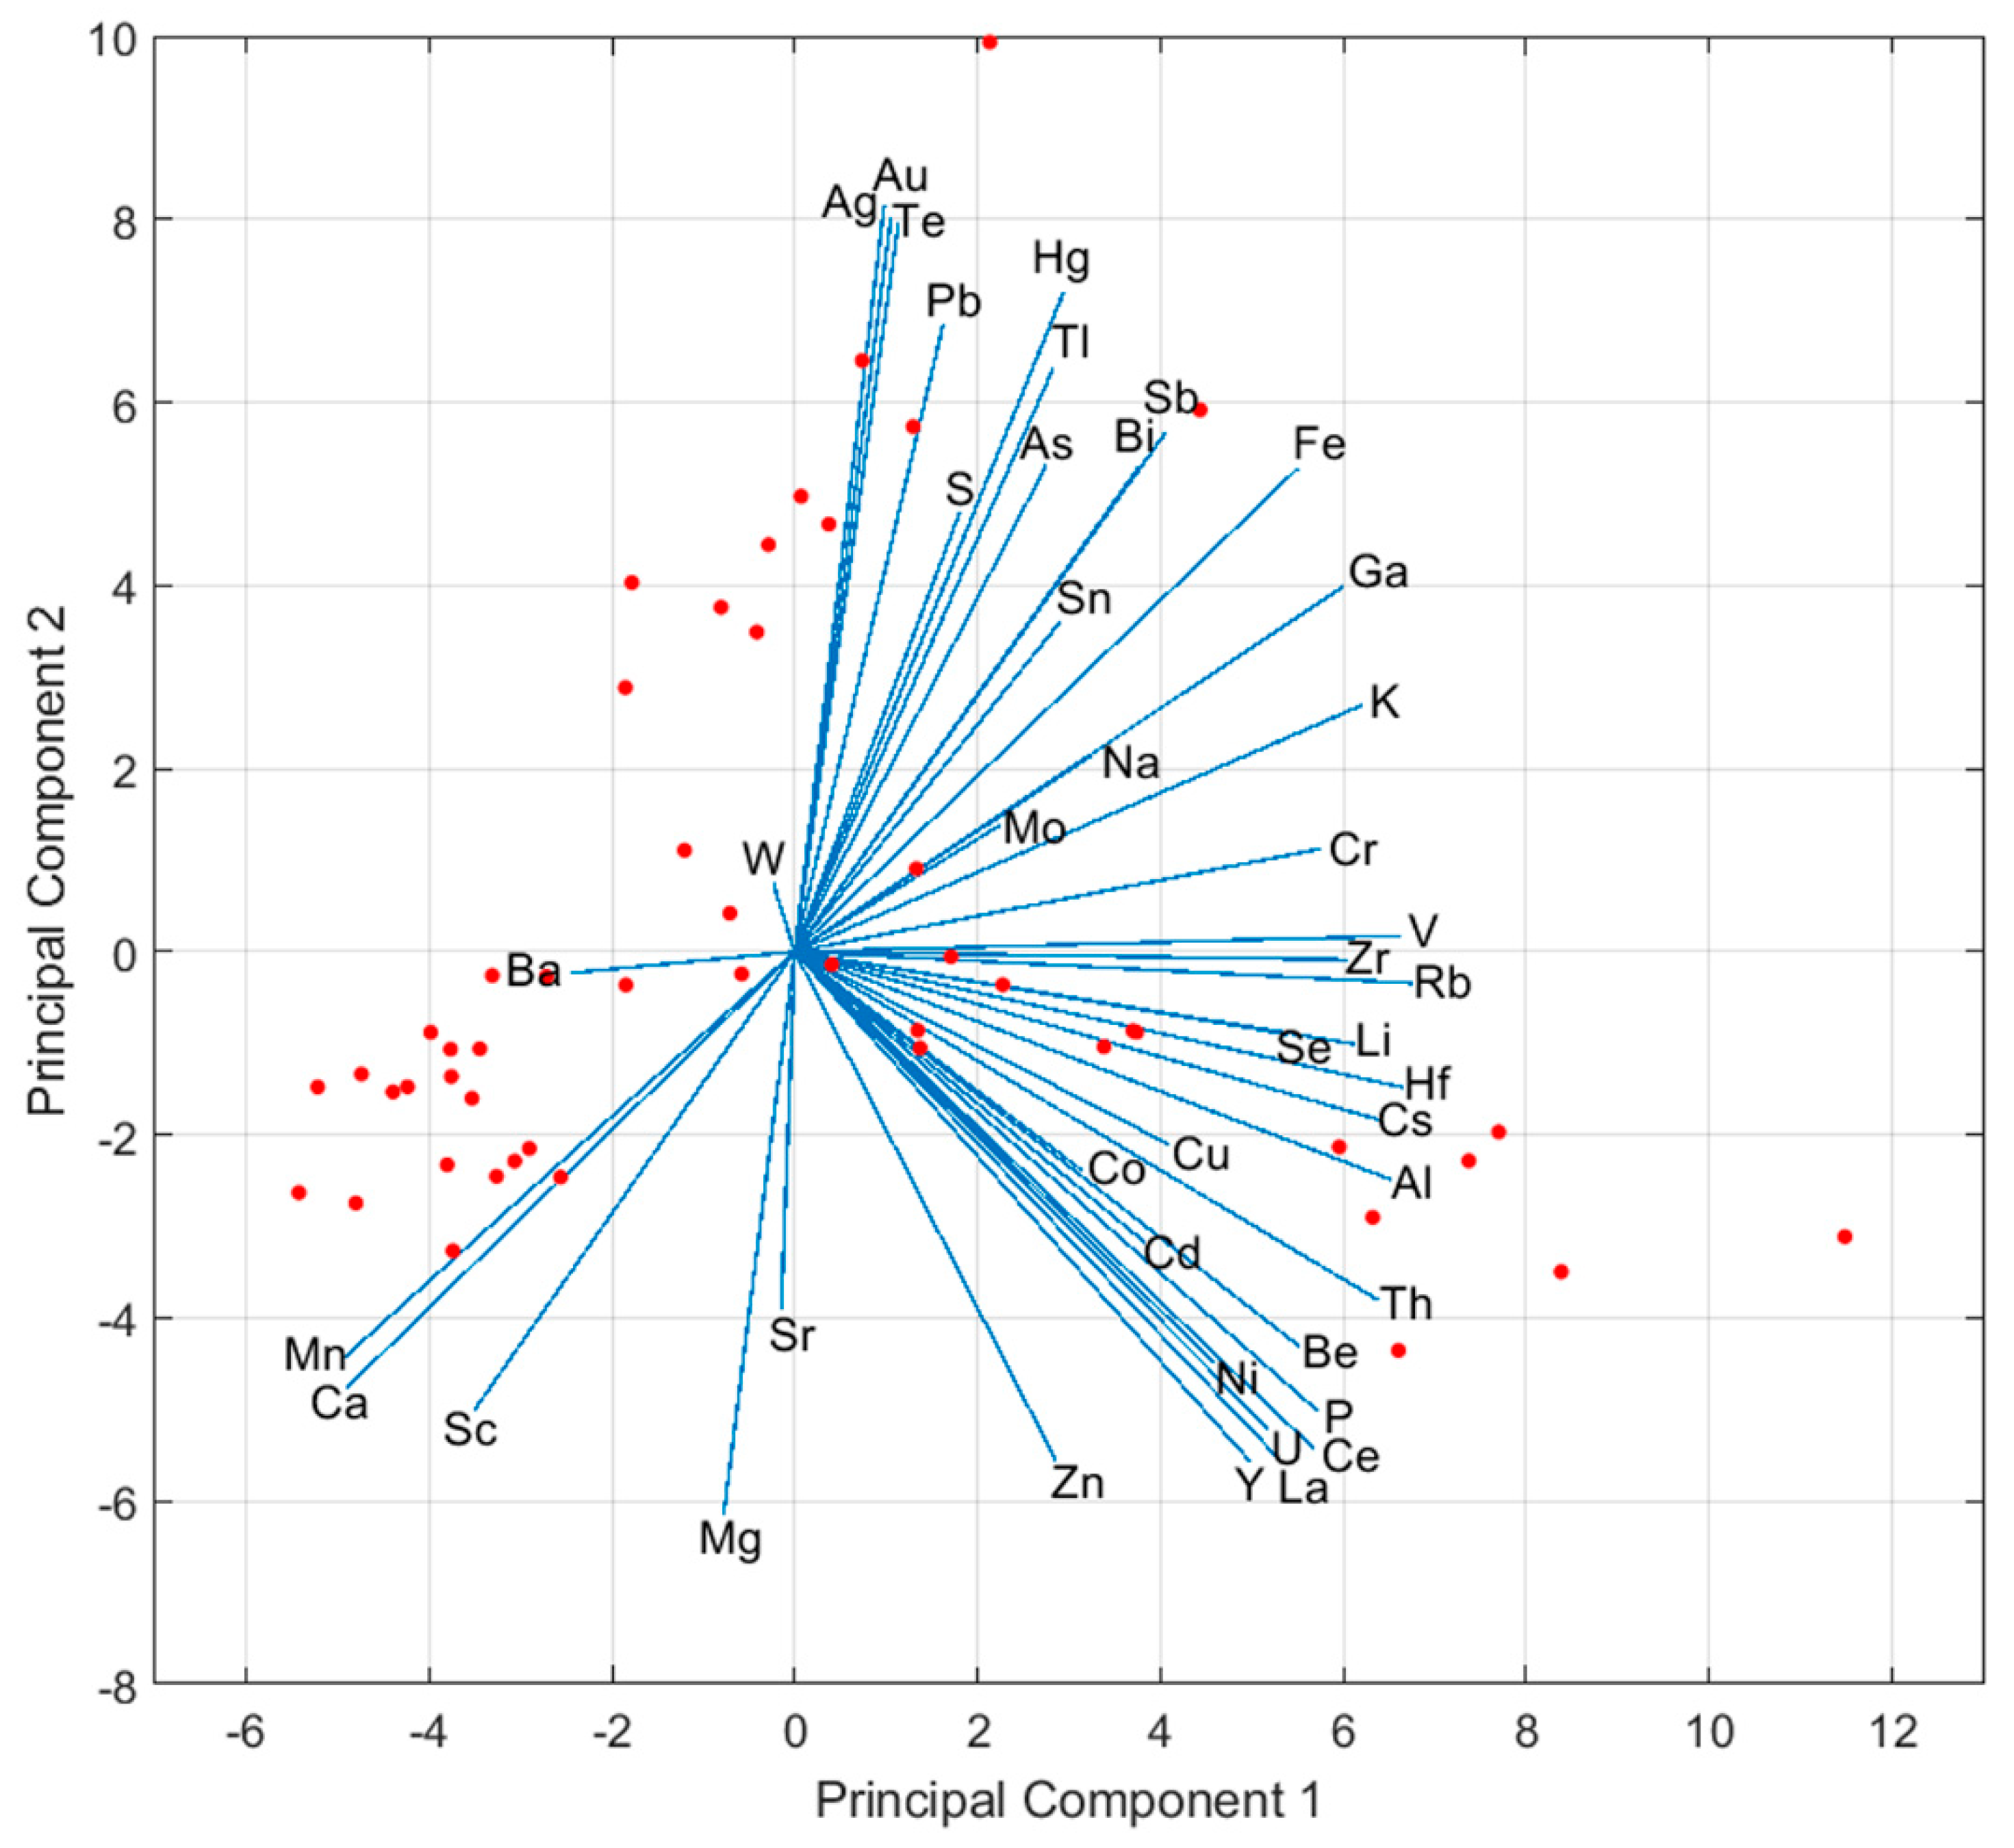
Figure 9.
(A) Depths of continuum removed absorption features at 2340 nm representing calcite abundance; (B) core samples colorized by gold concentrations from fire assay metallurgy; (C) depths of continuum removed absorption features at 2200 nm representing clay mineral abundances; (D) core samples colorized by gold concentrations from fire assay metallurgy; (E) depths of continuum removed absorption feature at 500 nm representing ferric iron abundance; and (F) core samples colorized by gold concentrations from fire assay metallurgy. Identified aquitard, samples with medium calcite content, some argillization samples with medium clay contents, patches of decarbonatization, and some carbonate samples with relatively higher contents of pyrite oxidized into ferric iron are labeled.
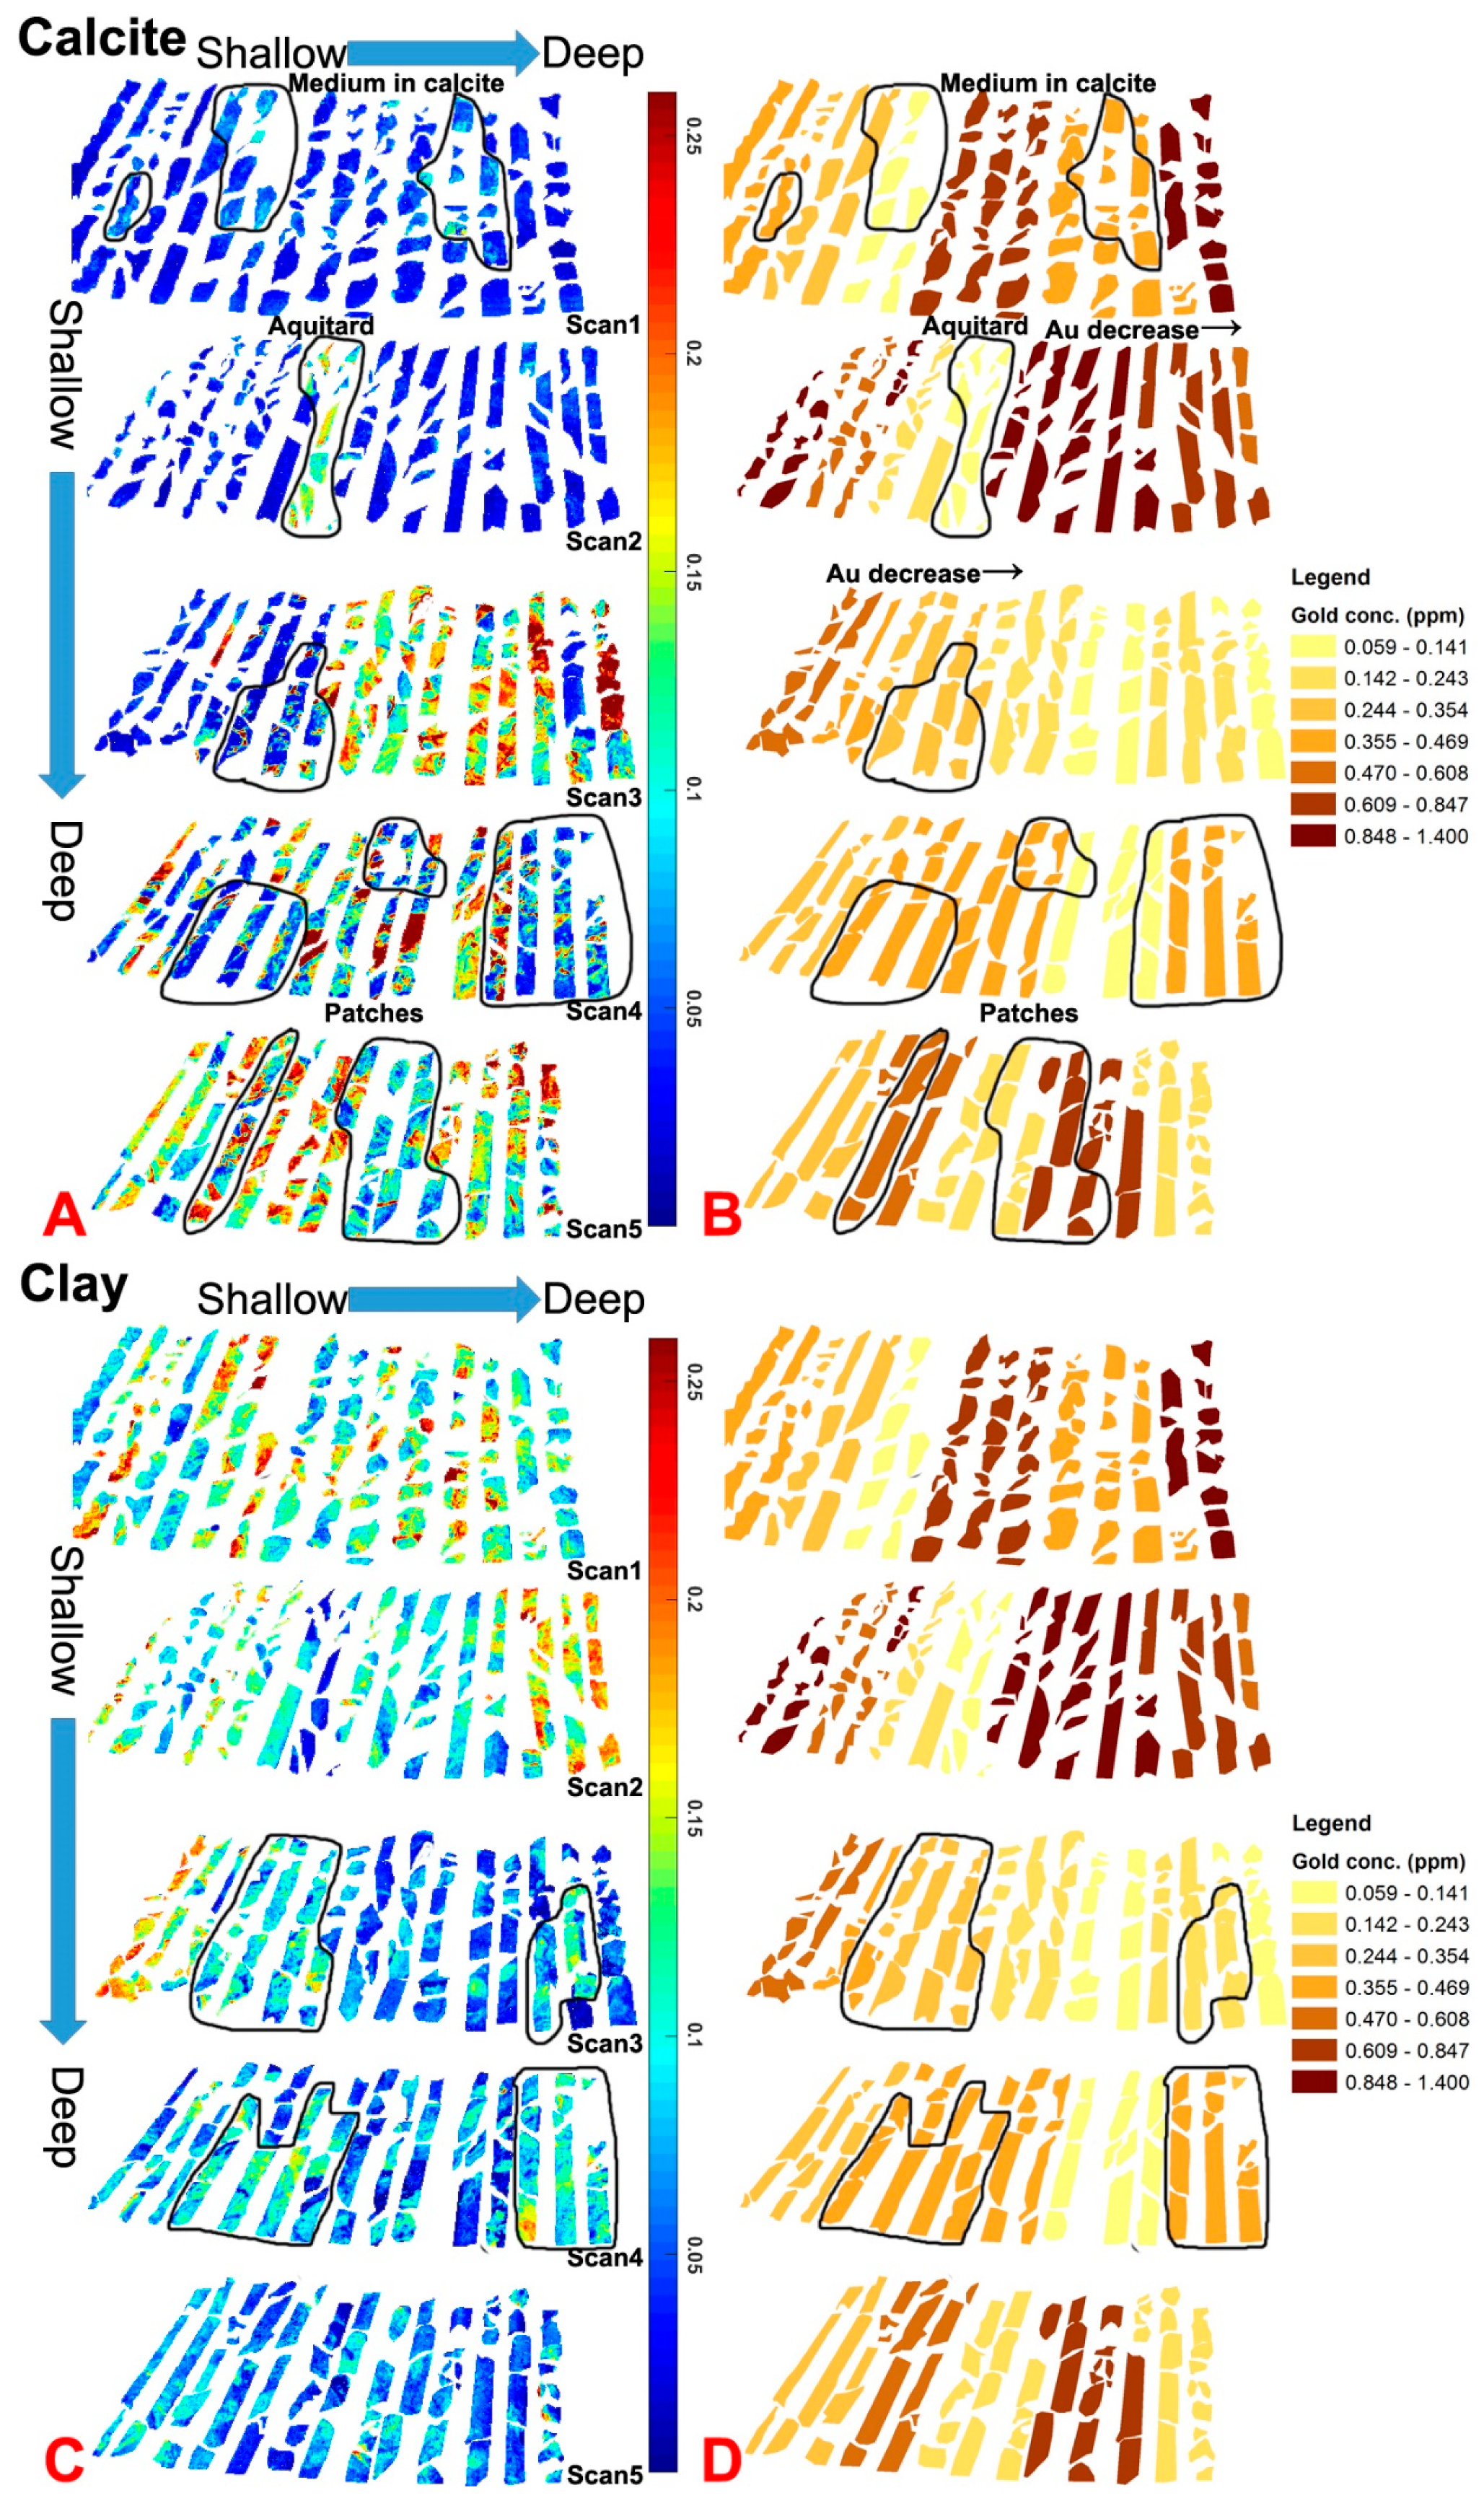

Figure 10.
(A) Bi-plot of the principal components from average absorption depths and selected elements in the siliciclastic rocks of the basal Claron Formation; and (B) bi-plot of principal components from average absorption depths and selected elements in the carbonate rocks of the Callville Limestone as well as the carbonate section in the basal Claron Formation. Vectors show loadings of elements and absorption depths, and dots show sample scores. The lengths of element vectors were magnified ten times to increase legibility.

© 2019 by the authors. Licensee MDPI, Basel, Switzerland. This article is an open access article distributed under the terms and conditions of the Creative Commons Attribution (CC BY) license (http://creativecommons.org/licenses/by/4.0/).
Share and Cite
MDPI and ACS Style
Sun, L.; Khan, S.; Shabestari, P. Integrated Hyperspectral and Geochemical Study of Sediment-Hosted Disseminated Gold at the Goldstrike District, Utah. Remote Sens. 2019, 11, 1987. https://doi.org/10.3390/rs11171987
AMA Style
Sun L, Khan S, Shabestari P. Integrated Hyperspectral and Geochemical Study of Sediment-Hosted Disseminated Gold at the Goldstrike District, Utah. Remote Sensing. 2019; 11(17):1987. https://doi.org/10.3390/rs11171987
Chicago/Turabian StyleSun, Lei, Shuhab Khan, and Peter Shabestari. 2019. "Integrated Hyperspectral and Geochemical Study of Sediment-Hosted Disseminated Gold at the Goldstrike District, Utah" Remote Sensing 11, no. 17: 1987. https://doi.org/10.3390/rs11171987
Note that from the first issue of 2016, this journal uses article numbers instead of page numbers. See further details here.