Article

Characterization and Trends of Fine Particulate Matter (PM2.5) Fire Emissions in the Brazilian Cerrado during 2002–2017

by
Guilherme Augusto Verola Mataveli
1,*,
Maria Elisa Siqueira Silva
1,
Daniela de Azeredo França
2,†,
Nathaniel Alan Brunsell
3,
Gabriel de Oliveira
3,
Francielle da Silva Cardozo
4,
Gabriel Bertani
2 and
Gabriel Pereira
1,4
1
Department of Geography, University of São Paulo (USP), São Paulo 05508-000, Brazil
2
Remote Sensing Division, National Institute for Space Research (INPE), São José dos Campos 12227-010, Brazil
3
Department of Geography and Atmospheric Science, University of Kansas (KU), Lawrence, KS 64045, USA
4
Department of Geosciences, Federal University of São João del-Rei (UFSJ), São João del-Rei 36307-352, Brazil
*
Author to whom correspondence should be addressed.
now at: National Center for Early Warning and Monitoring of Natural Disasters (CEMADEN), São José dos Campos 12247-016, Brazil.
Remote Sens. 2019, 11(19), 2254; https://doi.org/10.3390/rs11192254
Submission received: 13 June 2019 / Revised: 15 August 2019 / Accepted: 20 August 2019 / Published: 27 September 2019
(This article belongs to the Special Issue Remote Sensing of Biomass Burning)

Abstract

:
Fire occurrence is a major disturbance in the Brazilian Cerrado, which is driven by both natural and anthropogenic activities. Despite increasing efforts for monitoring the Cerrado, a biome-scale study for quantifying and understanding the variability of fire emissions is still needed. We aimed at characterizing and finding trends in Particulate Matter with diameter less than 2.5 µm (PM2.5) fire emissions in the Brazilian Cerrado using the PREP-CHEM-SRC emissions preprocessing tool and Moderate Resolution Imaging Spectroradiometer (MODIS) active fires datasets for the 2002–2017 period. Our results showed that, on average, the Cerrado emitted 1.08 Tg year−1 of PM2.5 associated with fires, accounting for 25% and 15% of the PM2.5 fire emissions in Brazil and South America, respectively. Most of the PM2.5 fire emissions were concentrated in the end of the dry season (August, 0.224 Tg month−1 and September, 0.386 Tg month−1) and in the transitional month (October, 0.210 Tg month−1). Annually, 66% of the total emissions occurred over the savanna land cover; however, active fires that were detected in the evergreen broadleaf land cover tended to emit more than active fires occurring in the savanna land cover. Spatially, each 0.1° grid cell emitted, on average, 0.5 Mg km−2 year−1 of PM2.5 associated with fires, but the values can reach to 16.6 Mg km−2 year−1 in a single cell. Higher estimates of PM2.5 emissions associated with fires were mostly concentrated in the northern region, which is the current agricultural expansion frontier in this biome. When considering the entire Cerrado, we found an annual decreasing trend representing -1.78% of the annual average PM2.5 emitted from fires during the period analyzed, however, the grid cell analysis found annual trends representing ± 35% of the annual average PM2.5 fire emissions.

Graphical Abstract

1. Introduction

Biomass burning is known as one of the most important sources of emission of gases and aerosols into the atmosphere [1,2]. Global carbon fire emissions are estimated to be 2.2 Pg C year−1 [3] and, therefore, impact the composition of the atmosphere [4,5]. In addition, fire emissions can impact air quality [6,7], human health [8,9], clouds, precipitation and the hydrological cycle [10,11,12], radiative forcings [13], and surface heat, moisture, and carbon fluxes [14].
Even with the wide variation of aerosols and trace gases components from one burning event to another, fire emissions primarily consist of carbon dioxide (CO2, 71.4%), water (H2O, 21%), and carbon monoxide (CO, 5.5%) [15]. PM2.5 that are emitted from fires are also important, which, despite only composing approximately 0.5% of the total fire emission components, are associated with deoxyribonucleic acid (DNA) damage and cell death in human lung cells [9] and estimated to be responsible for 339,000 deaths annually when considering global wild and prescribed forest fires, tropical deforestation fires, peat fires, agricultural burning, and grass fires [8].
Globally, 84% of carbon fire emissions occur in the tropics [3]. Human activity is considered to be a major fire-driver in the tropics [11,16], where fires are used for shifting land cover and agricultural purposes, such as eliminating crop residues or pasture management [17]. Moreover, climate variability is an important fire-driver in tropics [16], where the risk of fire occurrence is expected to increase due to climate warming [18].
In the Brazilian Cerrado, there is the combination of fires originating from both natural causes and human activities, especially associated with the major agricultural expansion occurring in this biome since the 1970s [19]. There has been an increased international effort for monitoring and studying the Cerrado [20], where the researchers have analyzed the spatial distribution and variability of active fires and burned area, as well as their correlation with climate-related fire drivers [21,22,23,24,25]. However, there are no studies that aimed to characterize and quantify fire emissions occurring in the Cerrado at a biome-scale or aimed to understand their variability and contribution nationally and in the South-American continent. The need for this characterization and quantification is also necessary when we consider recent studies regarding fire trends. Studies have shown a global decrease in burned area and active fires [26,27,28] and in global fire emissions [27,29]; however, analysis at the local scale (grid cells) may have distinct patterns from global-scale studies. For example, [26] found a global decline in burned area, but some regions, including areas of the Cerrado, showed increasing trends in the burned area during the 1997–2015 period. The work of [29] also pointed out that trends in fire emissions are spatially heterogeneous and regional trends may not conform to global trends. It could even be possible to observe trends in opposite directions when considering active fires and the burned area and fire emissions in the Cerrado, since the recent drier conditions in the tropics are causing the tendency of more intense and larger fires, that is, the overall number of fires might be decreasing but emissions may be increasing [30].
When considering the large spatial extent of the Cerrado and the difficulties in conducting field campaigns, orbital remote sensing is the most efficient approach for studying wildfires in this biome and it has been used in several studies [21,22,23,24,25,31,32]. To estimate fire emissions based on satellites measurements, there are methods that are based on burned area or fire radiative power (FRP), a measurement of the rate that energy is emitted as electromagnetic radiation during the combustion process [33]. FRP is proportional to the rate of burning biomass and, when integrated over time, is proportional to the biomass consumed [33]. Comparative studies have shown that estimates that were obtained while using the FRP approach are better correlated with reference data consisting on aboveground live biomass data and burned area inventories than estimates obtained while using the burned area approach [34], and that the FRP approach eliminates many difficulties that are involved with parametrization when using the burned area, since parameters, such as fuel load and burning efficiency, have a direct influence on the observed energy radiated by fires and, therefore, are not required to be separately considered [34,35,36].
The active fire products that are derived from the Moderate Resolution Imaging Spectroradiometer (MODIS) sensors [37] can be used to obtain emission fields from fires at a biome-scale when input into the preprocessor of trace gases and aerosols PREP-CHEM-SRC [38]. Since the first version released in 2011 [39], PREP-CHEM-SRC has been consistently improved to better estimate emissions, for example, the most recent version of the tool (PREP-CHEM-SRC 1.8.3) enables estimating fire emissions based on the FRP approach through the subroutine Brazilian Biomass Burning Emission Model with Fire Radiative Power (3BEM_FRP) [36]. An advantage of using this tool in studies that were conducted in South America is the updated parametrization for this continent in the recently released version, which includes new emission factors, new coefficients of emission, and new land use and land cover (LULC) maps [40]. Such improvements are expected to better represent South-American fire emissions. Estimates that are obtained from previous versions of PREP-CHEM-SRC usually underestimated fire emissions in South America and in the Cerrado [36], however, the new parametrization of PREP-CHEM-SRC 1.8.3 increased South American fire emissions by an average of 60% [40].
Based on the considerations above, our objective was to characterize and to compare the biome-scale and local-scale trends in PM2.5 fire emissions in the highly heterogeneous Brazilian Cerrado for the 2002–2017 period while using MODIS active fires data (MOD14 and MYD14 products) as inputs into the 3BEM_FRP subroutine implemented in PREP-CHEM-SRC 1.8.3.

2. Materials and Methods

2.1. Fire Occurrence in the Study Area

The Cerrado, one of the six Brazilian biomes [41], is distributed over approximately 22% of the Brazilian territory and 11% of the South-American continent (Figure 1), covering an area of more than two-million km2.
The Cerrado is characterized by a dry season that usually occurs from May to September and most of its vegetation consists of an inflammable grassy layer [19]. According to [19], in addition to the natural occurrence of fires in the Cerrado, human-induced fires were widespread in the past by many indigenous groups for land management and hunting, and, nowadays, human activity became the major source of fires in this biome, being primarily used for suppressing natural vegetation and changing land cover, shifting cultivation, and other agriculturally-related purposes. The lack of monitoring and a well-established fire management policy also contribute to the high occurrence of fires in the Cerrado [42].
As described in the previous section, several studies have used remote sensing data to analyze fire occurrence and spatial patterns in this biome. Studies that were conducted in the present decade have shown that the Cerrado represents more than 70% of the estimated burned area in the Brazilian territory and, consequently, the Cerrado has more burned area than the Amazon biome, despite the Amazon biome being twice as large as the Cerrado biome [21,25].

2.2. MODIS Data

The MODIS active fire products were used as inputs to estimate fire emissions in the Cerrado. The Terra (MOD14) and Aqua (MYD14) products detect active fires globally with a spatial resolution of 1 km and, among other variables, estimate FRP for each active fire detected [37]. In addition to the active fire products, we used the MODIS LULC product (MCD12Q1) collection 5.1 for analyzing PM2.5 fire emissions in the distinct land covers of the Cerrado, since this is the LULC data that are used in PREP-CHEM-SRC 1.8.This product is a global annual LULC data at 500 meters spatial resolution [43]. In this work, we have used the MCD12Q1 layer that follows the IGBP global vegetation classification scheme, which divides LULC into 17 distinct land cover classes, as shown in Figure 1.

2.3. PREP-CHEM-SRC

Emission fields from distinct sources, e.g., fires, anthropogenic, biogenic, and volcanoes, can be estimated while using the emission preprocessor PREP-CHEM-SRC with flexible spatial resolutions and projections [38]. This enables the characterization and use of emission fields from PREP-CHEM-SRC as the inputs in models, such as the Coupled Aerosol and Tracer Transport model to the Brazilian developments on the Regional Atmospheric Modeling System (CATT-BRAMS, [38]) and the Weather Research Forecasting model coupled with Chemistry (WRF-Chem, [44]), for assessing the impact of emissions on climatological variables and air quality.
When considering the source fires in PREP-CHEM-SRC, emissions can be estimated based on the burned area approach (3BEM subroutine) or the FRP approach (3BEM_FRP subroutine). PREP-CHEM-SRC 1.8.3 (available at http://brams.cptec.inpe.br/downloads/) has many improvements when compared to previous versions of the tool. For the source fires, such improvements consisted of new annual LULC maps that are based on the MCD12Q1 collection 5.1 product and new emission factors. While still considering the source fires, the new version of the 3BEM_FRP subroutine includes the fire diurnal cycle (estimate of the average fire duration in the distinct land covers of the South-American biomes used when the number of fire detections is low) [40] and new coefficients of emission derived from the Fire Energetics and Emissions Research (FEER) product [45]. Despite being developed for South America, PREP-CHEM-SRC 1.8.3 was parameterized and it is already operational for North America in the National Oceanic and Atmospheric Administration’s (NOAA) High-Resolution Rapid Refresh (HRRR) system (https://rapidrefresh.noaa.gov/hrrr/HRRRsmoke/).
The 3BEM_FRP subroutine that was implemented in PREP-CHEM-SRC 1.8.3 performs a clustering process that combines the FRP from the active fires detected by different sensors and minimizes the impact of the MODIS bow-tie effect [36]. Firstly, 3BEM_FRP excludes active fires that were detected outside the South America domain and, for MODIS active fires products, those with a confidence level below 50% [36]. After that, the size of the matrix that merges the FRP from the remaining active fires is defined and a convolution mask (η(ϒ,κ)) of size M x N (rows x columns), running over the grid with FRP aerial density values (FRPad, in MW m−2, estimated by weighting the FRP values by pixel area) that were estimated by different satellites ξ(long, lat), results in the grid containing all clustered FRP values for a given time (FRPgrid, in MW m−2) [36]:
F R P g r i d ( l o n , l a t , t ) = γ = α α κ = β β η ( γ , κ ) ξ ( l o n g + γ , l a t + κ , t )
where the clustered grid is defined to all points where the mask of size M × N completely overlaps the image (lon ϵ [α, M −α], lat ϵ [β, N −β]); when using geostationary-orbiting active fires data if the time interval between the detection of two active fires is greater than four hours, 3BEM_FRP assumes that the detections are from two distinct fires and the integration process restarts, while only using polar-orbiting active fires data, such as MOD14 and MYD14, t is extracted from the fire diurnal cycle [40]. The fire diurnal cycle for South America was obtained while using the Wildfire Automated Biomass Burning Algorithm (WFABBA) product and estimated the fire duration for different LULC within the South American biomes in order to provide information whenever FRP is insufficient to extract the diurnal cycle of fires; there are more than 200 distinct fire diurnal cycles for South America [40]. 3BEM_FRP associates the LULC (based on the MCD12Q1 product collection 5.1) for each grid cell, as described in [40]. For the years after 2013, the same MCD12Q1 data for 2013 was used, since this is the most recent LULC data available in collection 5.1.
Based on the clustered FRP and the time step, fire radiative energy (FRE, in MJ m−2), which is defined as the radiative energy emitted during the entire combustion process [33], is estimated, according to [36]:
F R E g r i d ( l o n , l a t ) = i = 1 n ( F R P i + F R P i + 1 ) · ( t i + 1 + t i ) 2
where t is the time of FRP acquisitions and n represents the nth sample. In the 3BEM_FRP subroutine implemented in PREP-CHEM-SRC 1.8.3, when only using polar-orbiting active fires data the total time of a fire is considered to be the average of the fire diurnal cycle associated to the LULC [40]. Finally, the mass of a given chemical species (M[ε], in kg m−2) is estimated according [40] utilizing the relationship between FREgrid, the coefficient of emission (Ce, coefficient that directly relates radiative energy from a fire to its smoke aerosol emission (kg MJ−1) derived from the FEER product [45]), and the relationship between the emission factor for a given species (in this case, the PM2.5, EF[PM2.5], in g emitted per kg burned) and the emission factor for the total particulate matter (EF[TPM], also derived from [45], in g emitted per kg burned):
M [ ε ] = F R E g r i d ( l o n , l a t ) · C e · E F [ P M 2.5 ] E F [ T P M ]

2.4. Global Biomass Burning Inventories

When considering the improvements that were implemented in PREP-CHEM-SRC 1.8.3 and that there are no studies aimed at characterizing fire emissions or comparing distinct biomass burning inventories in the Cerrado, we compared the results that were obtained using PREP-CHEM-SRC 1.8.3 with three global fire emissions inventories based on the FRP approach, the Global Fire Assimilation System (GFAS, [46]), the Quick Fire Emissions Dataset (QFED, [47]), and the FEER inventory [45], and with the global fire emissions inventory based on burned area Global Fire Emissions Database (GFED, [3]). We have used the most recent version of all datasets in this study, GFASv1.3 (available at http://eccad.sedoo.fr/eccad_extract_interface/JSF/page_extract_ok.jsf), QFEDv2.5r1 (available at http://ftp.as.harvard.edu/gcgrid/data/ExtData/HEMCO/QFED/v2018-07/), FEERv1.0-G1.2 (available at https://feer.gsfc.nasa.gov/data/emissions/), and GFED4.1s (available at https://www.globalfiredata.org/data.html). Despite differences regarding how each dataset estimates the emissions (see the Discussion section), all FRP-based datasets use MODIS active fires data as inputs and are provided on a daily basis with spatial resolution of 0.1°. The bottom-up inventory GFED4.1s also uses MODIS active fire products as inputs and it is provided daily with a spatial resolution of 0.25°.

2.5. Data Processing

PM2.5 estimates for the 2002–2017 period were obtained with PREP-CHEM-SRC 1.8.3 while using fires as the only source of emission and MOD14/MYD14 collection 6 products as inputs in 3BEM_FRP. Estimates were generated at a spatial resolution of 0.1°, the same spatial resolution as the global FRP-based inventories described above. The outputs of PREP-CHEM-SRC 1.8.3 consisted of the daily emission from several species that are associated with fires, which are described in [39], for the South-American continent. Annual total PM2.5 fire emissions, as well as monthly averages, were then calculated for the 2002–2017 period. These were estimated for the Cerrado biome and the entire Brazilian territory according to the delimitation that was proposed by [41], with an aim to analyze the intra and inter-annual variation of the emissions in this biome and the contribution of the Cerrado nationally and for the South-American continent. Regarding the comparison of the estimates with GFASv1.3, QFEDv2.5r1, FEERv1.0-G1.2, and GFED4.1s, we calculated the annual total emission of PM2.5 for all inventories and the estimated annual values for the Cerrado domain, also according to the delimitation of [41]. We calculated the annual average emission of PM2.5 associated with fires that were obtained from PREP-CHEM-SRC 1.8.3 in this biome for the 2002–2017 period to assess the spatial distribution of PM2.5 derived from fire emissions in the Cerrado.
We also analyzed the relationship between PM2.5 fire emissions and land cover in this biome. To this end, we resampled the LULC data for the Cerrado delimitation to the spatial resolution of the PREP-CHEM-SRC 1.8.3 outputs; the degraded land cover was defined as the mode of the land cover from the original MCD12Q1 data (500 meters) at coarser resolution (0.1°). Subsequently, we analyzed the annual total emissions associated with the respective LULC data, again highlighting that emissions for the years 2014, 2015, 2016, and 2017 were associated with the 2013 LULC data. Following this, we calculated the total emission of PM2.5 associated with fires per land cover and quantified the average PM2.5 emitted by an active fire detected in the major land covers of the Cerrado.
For each grid cell, we calculated the trends while considering the annual total emission of PM2.5 associated with fires in the Cerrado during the 16-year period in 2002–2017 using a bootstrap analysis with 10,000 iterations. This resulted in a spatial map of the temporal trend in annual PM2.5 fire emissions. If we consider a simple linear regression, the trends may substantially change or even have an opposite direction that is dependent upon different starting years. With the bootstrap approach, this issue does not occur, since the data are resampled with replacement, therefore the bootstrap analysis allows for the estimation of confidence intervals around observed linear regression trend values [48]. Here, we have considered the slope as the average slope from the 10,000 bootstrap iterations. We have also calculated the values of the 10th and 90th percentiles and tested if the average slope resulting from the bootstrap was inserted within this confidence interval, as in the study of [49].

3. Results

Figure 2 shows the annual total emission of PM2.5 associated with fires in the Cerrado biome, Brazil, and in South America during the 2002–2017 period. On average, the Cerrado emitted 1.08 Tg year−1 of PM2.5 associated with fires, accounting for 25% and 15% of the PM2.5 fire emissions that were estimated in Brazil and in South America, respectively. Annual PM2.5 fire emissions in the Cerrado ranged from 0.41 Tg (2009) to 2.04 Tg (2010). The average value of 1.08 Tg year−1 makes the Cerrado the second highest biome in Brazil in terms of emission of PM2.5 associated with fires, with an annual average lower than only the Amazon biome, which emits 2.68 Tg year−1, as shown in Table 1.
In contrast to the wetter year of 2009, the year 2010 was a dry one in the Cerrado, when this biome was responsible for 59% and 23% of the PM2.5 fire emissions that were estimated in Brazil and South America, respectively (Figure 2). This illustrates the importance of the meteorological conditions for the occurrence of fires and associated fire emissions in the Cerrado. On average, 70% of the PM2.5 fire emissions were concentrated in the dry season (May to September); however, in 2010, 85% of them occurred during the dry season (Figure 3a). Intra-annually, most of the PM2.5 fire emissions were concentrated in the end of the dry season (August and September, with an average of 0.224 and 0.386 Tg month−1, respectively), while the transition between the seasons also presented a high average (October, with 0.210 Tg month−1), as shown in Figure 3b.
When comparing the annual total emission of PM2.5 associated with fires in the Cerrado biome obtained using PREP-CHEM-SRC 1.8.3 with the estimates of the QFEDv2.5r1, GFASv1.3, FEERv1.0-G1.2, and GFED4.1s global inventories for the Cerrado, we can see very similar inter-annual variability between them (Figure 4a) and that there is a strong linear correlation between the annual total emission of PM2.5 that is associated with fires estimates (Figure 4b). However, the magnitude of the annual total values was highly variable. While PREP-CHEM-SRC 1.8.3 estimated an average emission of PM2.5 associated with fires in the Cerrado of 1.08 Tg year−1, GFASv1.3 (available for the 2003–2016 period) resulted in an estimate of 0.9 Tg year−1, QFEDv2.5r1 (available for the 2002–2017 period) estimated 2.3 Tg year−1, FEERv1.0-G1.2 (available from 2003 to September/2015) estimated 1.63 Tg year−1, and GFED4.1s (available for the 2002–2017 period; 2017 estimates are preliminary) estimated 1.13 Tg year−1. Therefore, the PREP-CHEM-SRC 1.8.3 annual average PM2.5 that was emitted from fires in the Cerrado was 19% higher than the average annual estimate from GFASv1.3, and 112%, 51%, and 5% lower than the annual average estimate from QFEDv2.5r1, FEERv1.0-G1.2, and GFED4.1s, respectively.
The MCD12Q1 collection 5.1 dataset showed that six land cover categories accounted for approximately 97% of the Cerrado during the 2002–2013 period: savannas, woody savannas, cropland/natural vegetation mosaic, croplands, evergreen broadleaf forest, and grasslands. The savanna land cover contributed with 66% of the total PM2.5 emissions that are associated with fires in the Cerrado obtained with PREP-CHEM-SRC 1.8.3, an average of more than 0.7 Tg year−1 (Figure 5a). Woody savannas and evergreen broadleaf forest land covers accounted for 9% and 7.3% of the total PM2.5 fire emissions in the Cerrado, respectively. The predominance of the emissions in the savanna land cover was expected, since 67% of the Cerrado is composed of this land cover category.
Active fires occurring in the evergreen broadleaf land cover emitted, on average, more PM2.5 than active fires occurring in the savanna land cover (0.0000116 Tg per active fire and 0.0000069 Tg per active fire, respectively) or any other land cover of the Cerrado (Figure 5b). MODIS sensors detected 2,333,853 active fires in the Cerrado during the 2002–2017 period, with 70% of them occurring in the savanna land cover (see Table S1 in the Supplementary Materials).
On average, each 0.1° grid cell of the Cerrado emitted 0.5 Mg km−2 year−1 of PM2.5 that is associated with fires during the 2002–2017 period (Figure 6); however, a single grid cell reached an average of up to 16.6 Mg km−2 year−1. These higher estimates were mostly concentrated in the northern region of this biome, which is the current agricultural expansion frontier in the Cerrado [50], and they are highlighted in the Maranhão state (MA in Figure 6). The transitional areas between the Cerrado and Amazon biomes, where LULC changes are common, also showed high estimates, especially in the Maranhão, Tocantins, and Mato Grosso states (MA, TO, and MT in Figure 6).
When considering the entire Cerrado, the resulting average slope from the 10,000 bootstrap iterations for the annual total emission of PM2.5 associated with fires estimated while using PREP-CHEM-SRC 1.8.3 during the 2002–2017 period found a decreasing trend of −19,267 Mg year−1. This value is within the 10th and 90th percentiles (−39,221 Mg year−1 and 5690 Mg year−1, respectively) and it corresponds to −1.78% of the average emission of 1.08 Tg year−1. Trends per grid cell in the Cerrado ranged from −1.49 Mg km−2 year−1 to 1.17 Mg km−2 year−1, with all of the grid cells trend values being inserted within the 10th and 90th percentiles (see Figure S1 and Table S2 in the Supplementary Materials). These values represent that the trend with respect to the average PM2.5 fire emissions for the 2002–2017 period ranged ±35% (Figure 7). 58.5% of the grid cells presenting non-zero emission during the 2002–2017 period showed a negative trend, while 41.5% of them showed a positive trend.

4. Discussion

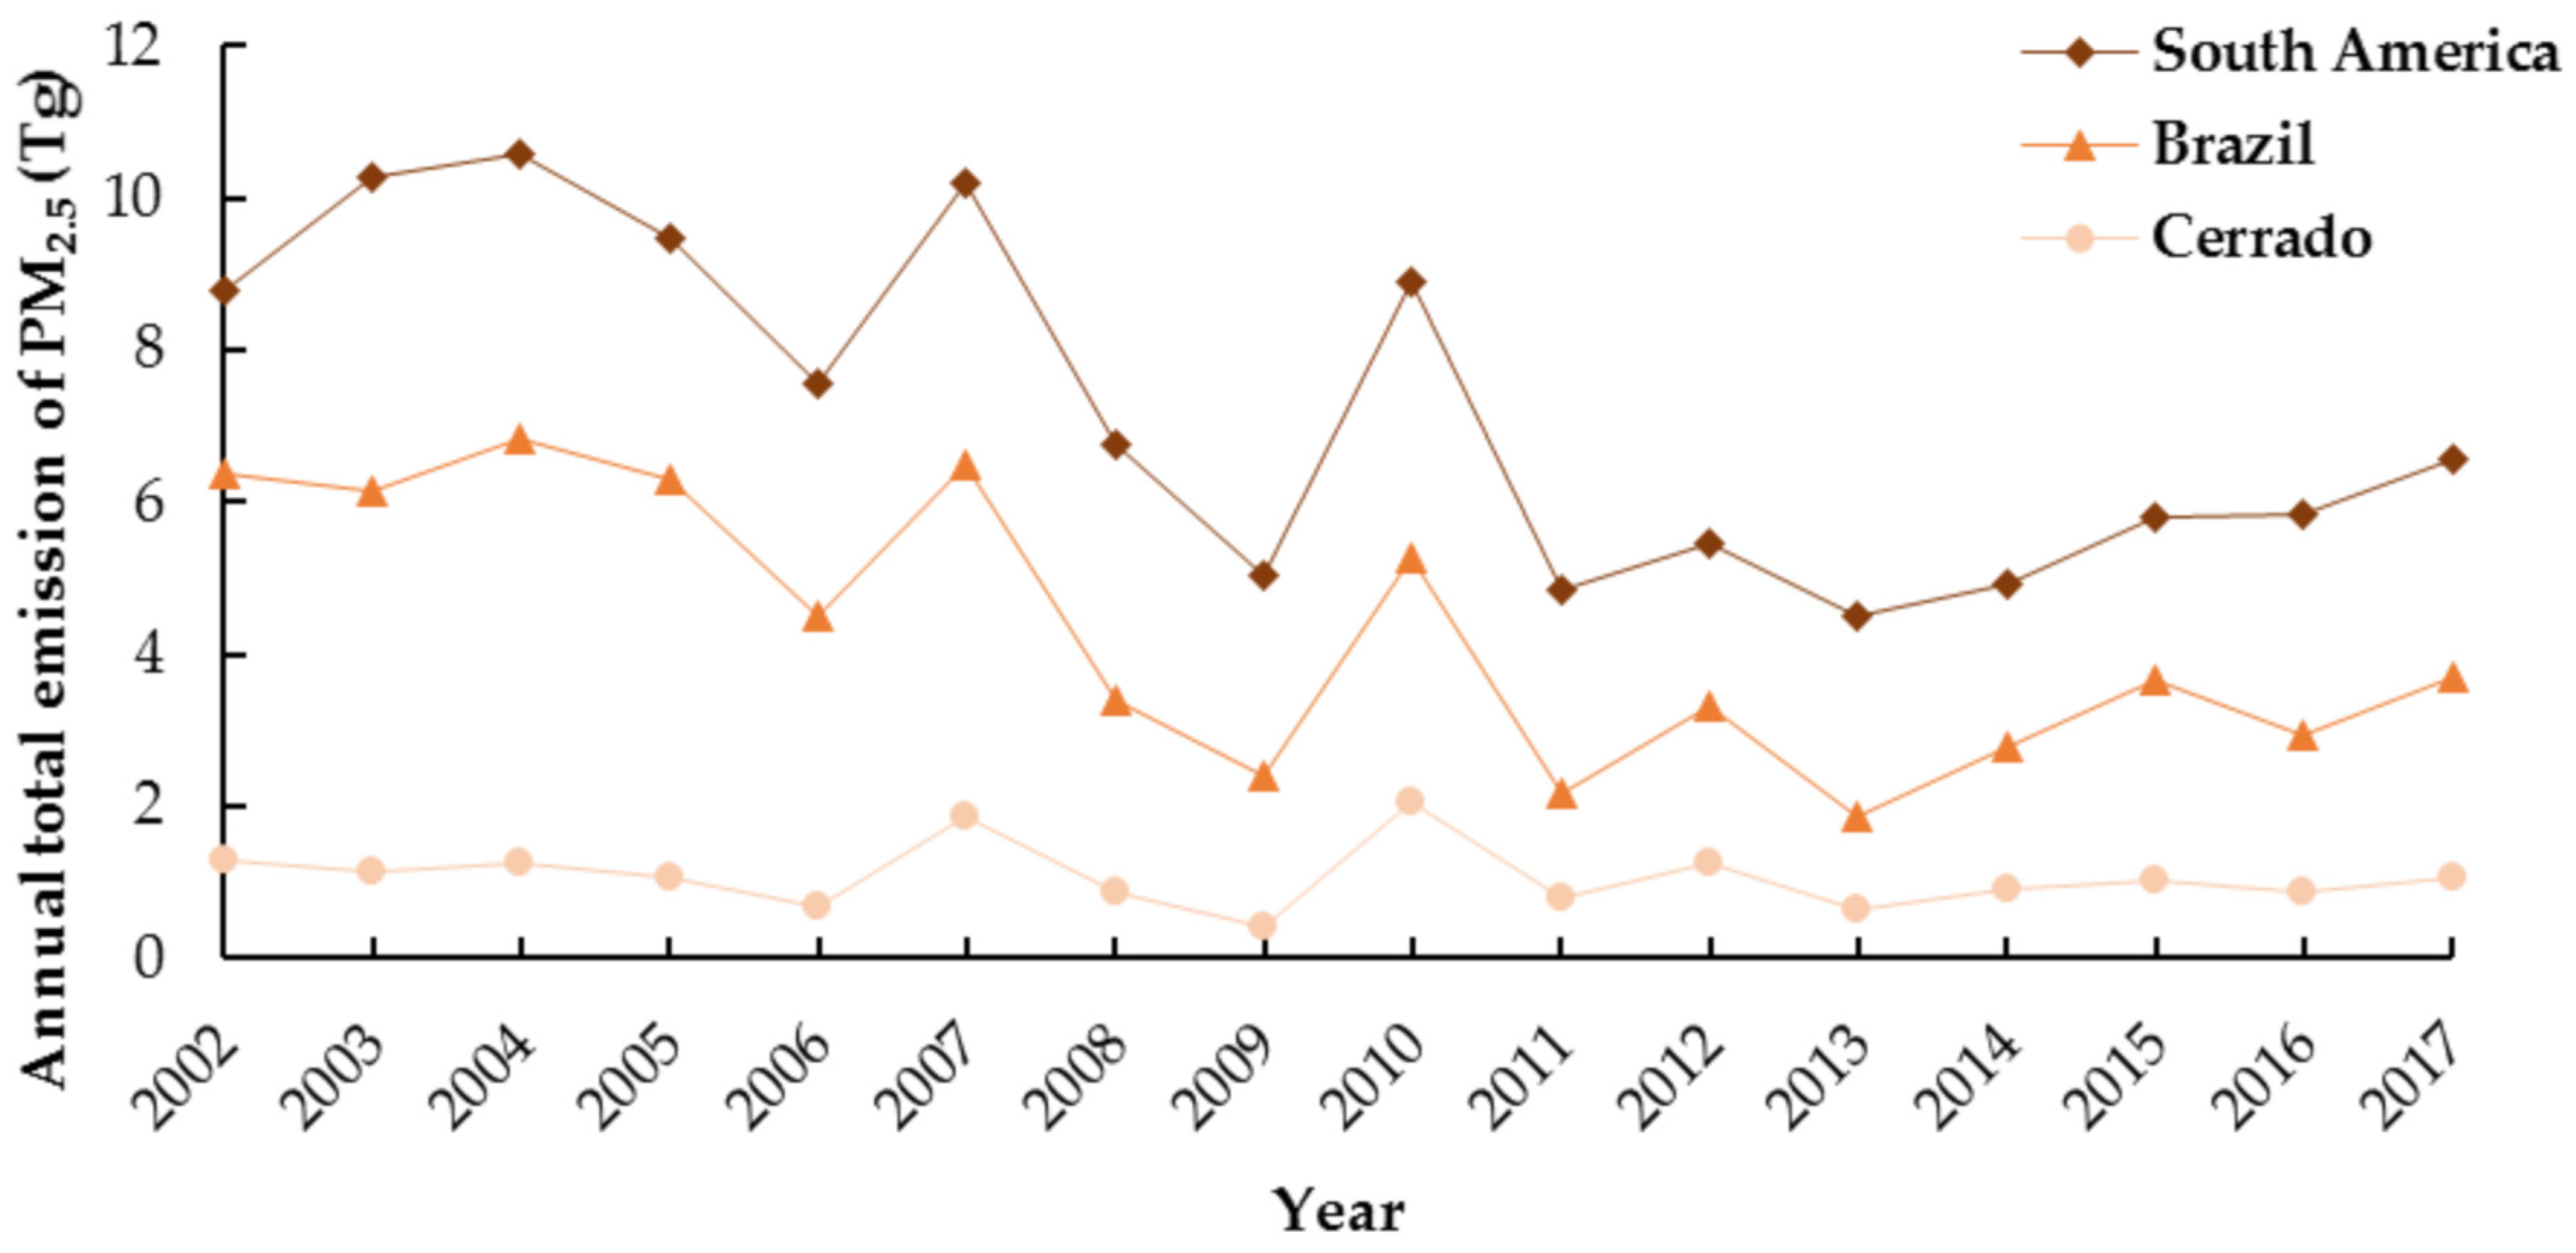
4.1. Characterization of PM2.5 Fire Emissions in the Cerrado

Regarding the inter-annual variability of PM2.5 fire emissions, we found that the pattern for South America (Figure 2) is very similar to the one that was found by [51] for CO during the 2006–2010 period, with highest values for 2007 and 2010, and lowest in 2009. The work of [51] associated the pattern that was found for South America mostly with climate conditions, such as drought, however, the authors highlighted that social-economic factors and the associated deforestation may also act as drivers of CO fire emissions in this continent. Brazilian emissions corresponded to 59% of the South American emissions during the 2002–2017 period, similar to the result of [40], who found that, during the 2003–2015 period, 60% of the PM2.5 fire emissions occurring in South America were originated in the Brazilian territory.
The biome-scale characterization of PM2.5 emissions associated with fires in the Cerrado shows an inter-annual pattern that is similar to the ones found for South America and Brazil. However, it is possible to observe that 2004 presented the highest annual total emissions in South America and Brazil, but not in the Cerrado. In this year, when precipitation was below average for South America and Brazil, there was average precipitation in this biome [25]. When considering the 2002–2015 time series, 2007, 2010, and 2012 were the years with less precipitation in the Cerrado [25], and they corresponded with the highest annual total emissions of PM2.5 associated with fires, especially 2010, since the average precipitation for the dry season of this year in the Cerrado was 32% below the dry season average precipitation and, consequently, caused an increased number of active fires and the associated emissions. The total of PM2.5 fire emissions in the Cerrado during September 2010 (0.79 Tg) was higher than the total emissions for the entire years of 2006, 2009, and 2013. The year 2017 emitted 1.05 Tg of PM2.5 associated with fires, which is below the annual average emission for the 2002–2017 period in the Cerrado (1.08 Tg year−1); however, megafires were detected in this biome. According to [52], 78% of the Chapada dos Veadeiros National Park and 85% of the Serra do Tombador National Reserve (504 km2 and 74 km2, respectively) were burned in 2017. On the other hand, other protected areas that have been promoting integrated fire management (IFM) techniques since 2014 exhibited no megafires, suggesting that such techniques may change the fire regime in the Cerrado. The work of [53] also found similar results, IFM techniques applied in three protected areas of the Cerrado led to reductions between 40% and 57% in late-dry season fires. This implies that managing the occurrence of fires instead of forbidding them completely may be the best option for this biome.
Intra-annually, the higher PM2.5 emissions that are associated with fires in the Cerrado were concentrated in August and September (Figure 3b) and they are related to the end of the dry season, when the accumulated months of low precipitation enhance the probability of fires. During October, the beginning of the rainy season for most of the Cerrado, the relatively high average of 0.210 Tg month−1 is mostly associated with the transition between the seasons, when the vegetation is stressed due to the dry months and there is a high occurrence of fires related to lightning [54]. The high average of PM2.5 fire emissions in October may also be related to the meridional extension of the Cerrado and the influence of distinct regional precipitation phenomena, which may displace the dry season ahead in the year [25,55]. On the other hand, we must also consider the anthropogenic role in the seasonality of fires in the Cerrado, even when considering that climate seasonality is a crucial predictor of fire activity [56], which may impact the fire regime, as discussed above.

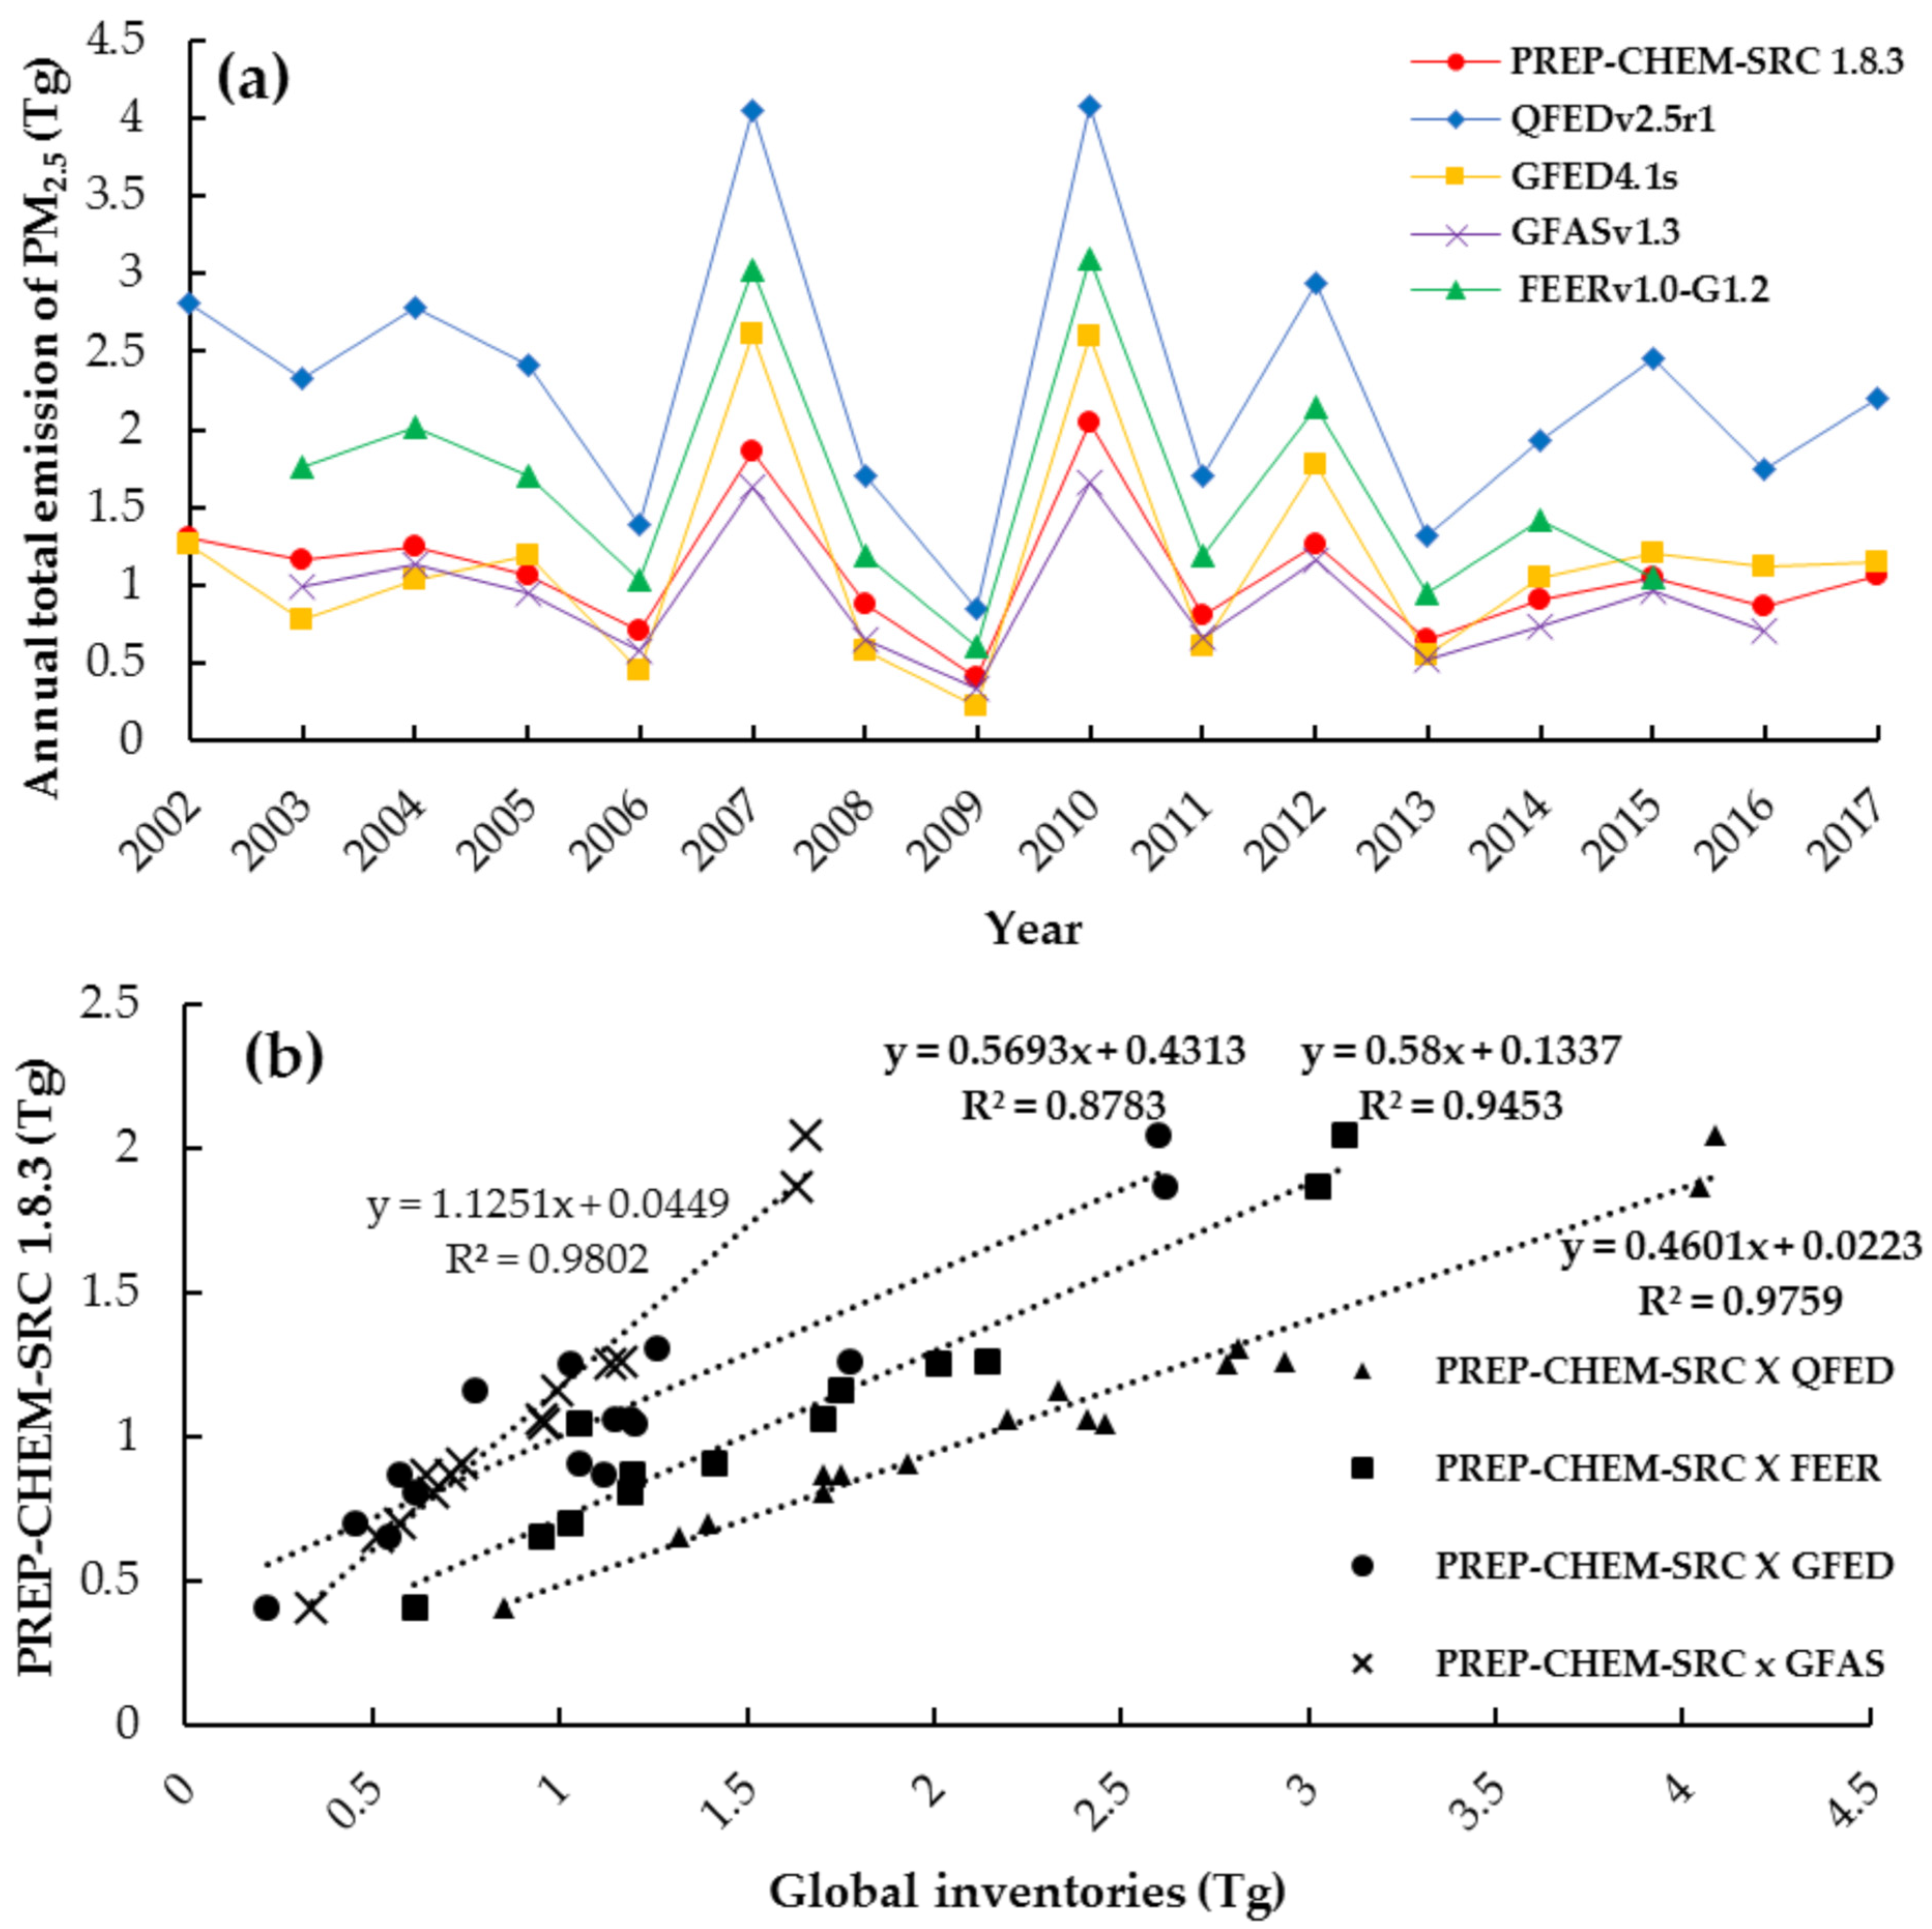
4.2. Comparison of PREP-CHEM-SRC 1.8.3 Estimates with the Global Inventories

When comparing PM2.5 fire emissions that were estimated using PREP-CHEM-SRC 1.8.3 for the Cerrado with the global inventories, we observe closer inter-annual variability with QFEDv2.5r1, GFASv1.3, and FEERv1.0-G1.2 than with GFED4.1s, as shown in Figure 4. The GFED4.1s inventory has also shown a distinct pattern, emitting more PM2.5 in 2004 than in 2005, as opposed to all other inventories, and always emitted more than PREP-CHEM-SRC 1.8.3 after 2013. In comparison with PREP-CHEM-SRC 1.8.3, GFED4.1s also emitted more PM2.5 associated with fires in the three years presenting higher emission in the Cerrado (2007, 2010, and 2012). Such a result may be related to the fact that the burned area approach is better at capturing larger fires, more frequent during these years, and the significant uncertainty in the derived FRP values of intense fires, also more frequent during these years, as will be discussed below. It should also be mentioned that there are differences in the emission factors, in the coefficients of emission, and in the LULC data and the degradation process of this LULC data used in each inventory analyzed, in addition to how emissions are estimated, especially when comparing PREP-CHEM-SRC 1.8.3 to QFEDv2.5r1 and FEERv1.0-G1.2, since these two global inventories use MODIS aerosol optical depth (AOD) to constrain the estimate of emissions. The work of [46] performed simulations of the atmospheric aerosol distribution for cases with and without the assimilation of MODIS AOD and found that the global estimates of PM associated with fires must be increased by a factor of 2-4 in order to reproduce the distribution of black carbon and organic matter. PREP-CHEM-SRC 1.8.3, GFASv1.3, and GFED4.1s do not use MODIS AOD to constrain the estimate of the emissions. Moreover, QFEDv2.5r1 aggregates the land cover categories from IGBP into only three land cover categories (tropical forest, extra-tropical forest, and savanna and grassland) [47], as opposed to PREP-CHEM-SRC 1.8.3 and the other global inventories (see Table S3 in the Supplementary Materials), and the scaling of aerosol global emissions for the three land cover categories might result in regional biases.
It should also be noted that remote sensors have several difficulties in estimating FRP associated to the active fires detected that can potentially impact the final estimate of fire emissions that were obtained from PREP-CHEM-SRC 1.8.3, GFASv1.3, QFEDv2.5r1, and FEERv1.0-G1.2: (i) fires typically are not occurring over the entire area of a pixel, therefore smaller size fires are more difficult to be detected at coarser spatial resolutions, which suggests that a certain proportion of the smallest or less intense fires are not detected by the sensor; (ii) non detection of fires due to cloud cover and thick smoke; and, (iii) the reduced sensitivity of MODIS fire detection at off-nadir viewing angles [33,57,58]. Therefore, future efforts should assess the estimates of fire emissions that were obtained with PREP-CHEM-SRC 1.8.3, GFASv1.3, FEERv1.0-G1.2, QFEDv2.5r1, and GFED4.1s in the Cerrado in order to establish which one presents the best performance. This assessment can be achieved, for example, by comparing these estimates with measurements that were obtained during observational experiments, e.g., the South American Biomass Burning Analysis (SAMBBA) experiment, which was considered as reference data in the works of [36,59].

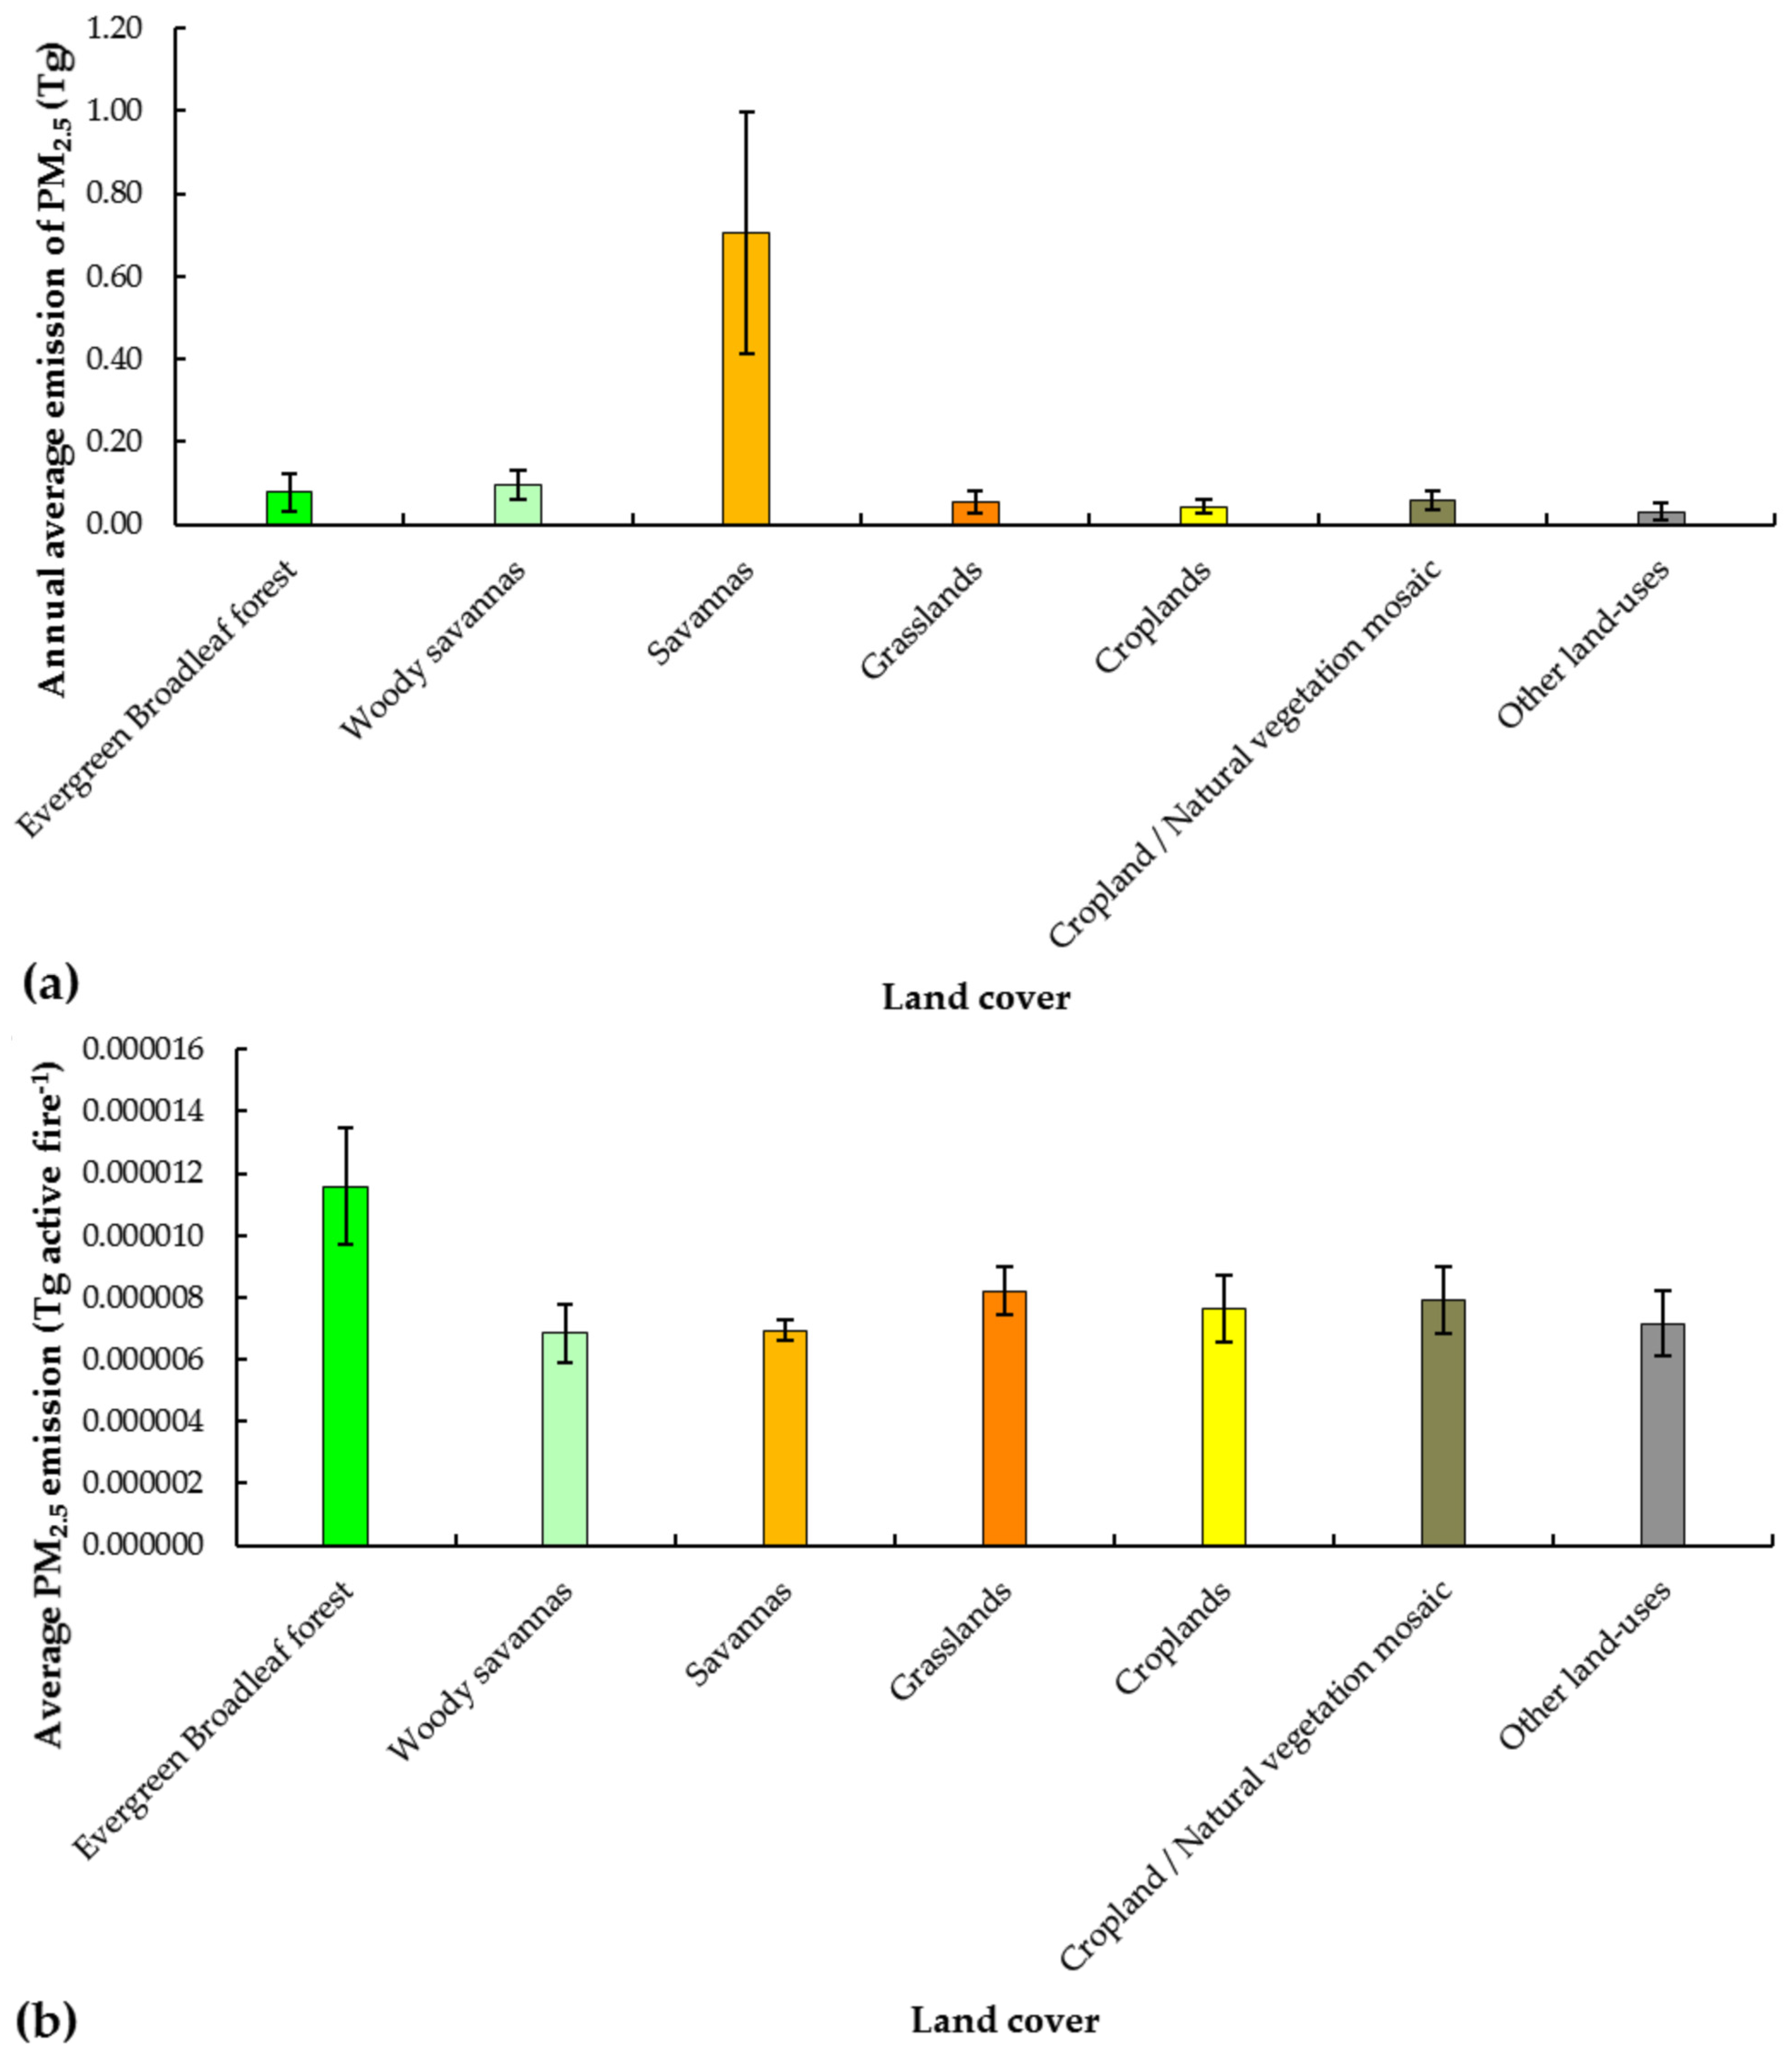
4.3. PM2.5 Fire Emissions and Land Cover

Higher emissions of PM2.5 associated with fires were found in the Amazon biome, even though the Cerrado consists of most of the burned area in the Brazilian territory [21]. This can be related to the fact that the vegetation of the Amazon mostly consists of evergreen broadleaf forest land cover, which tends to emit more per active fire than the predominant land cover of the Cerrado biome (Figure 5b). These differences in the emissions that are associated with the different land covers are also observed from the emission factors, where the PM2.5 emission factor for tropical forest is commonly higher than the emission factor for savannas. In PREP-CHEM-SRC 1.8.3, the emission factor of PM2.5 that is used for fires occurring in the evergreen broadleaf forest land cover, which is aggregated into the tropical forest land cover, is 9.4 g of PM2.5 per kg of dry matter, while the emission factor for the savanna land cover is 4.0 g of PM2.5 per kg of dry matter (see Table S3 in the Supplementary Materials). One of the main improvements of PREP-CHEM-SRC 1.8.3 when compared to the previous versions of the tool is related to the revised and updated emission factors and the new coefficients of emission.
The quality of the land cover maps should also be considered as a potential source of uncertainty. Previous versions of PREP-CHEM-SRC used a single land cover map that is based on Advanced Very High Resolution Radiometer (AVHRR) data from the year 2000; therefore, the new annual LULC data were an important improvement when considering the intense LULC change processes occurring across the entire South America continent. However, in the Cerrado, the MCD12Q1 collection 5.1 product estimated that more than 65% of this biome was composed of savannas in 2013, while the [60] mapping for the same year based on Landsat images found that approximately 55% of this biome was covered by natural areas, which comprises all savanna and forest formations. Therefore, the quality of the LULC data and the degradation process that is necessary to match the spatial resolution of the land cover with the emissions may have influenced the results found here, especially the ones that are observed in Figure 5. Moreover, fire location is also a potential source of errors on fire emissions estimate, since emission factors are based on the land cover. For example, when using MODIS data, [61] estimated that fire location errors have a net bias of 3% to 19% in fire emissions that occur in the Amazon basin.
As suggestions for the future versions of PREP-CHEM-SRC, we recommend the implementation of the recently released new version of the MCD12Q1 product (MCD12Q1 collection 6), which is expected to be more accurate than the version that is available in collection 5.1 and presents annual LULC data for the 2001–2016 period. For example, the original MCD12Q1 product from collection 5.1 estimated that 67.3% of the Cerrado was composed of savannas and 4% of grasslands in 2013, while the MCD12Q1 product from collection 6 estimated for the same year that 41% of the Cerrado was composed of savannas and 38% corresponds to the grasslands land cover (see Figure S2 in the Supplementary Materials). The errors that are introduced by the degradation process could be minimized if the PREP-CHEM-SRC outputs were generated at a finer spatial resolution; however, the impact of the spatial resolution on the emissions estimate should be assessed, since the FRP estimated for each active fire detected is clustered, according to Equations (1) and (2). Therefore, a finer spatial resolution will have less active fires to be clustered for each grid cell and it may impact the final estimate of the emissions. Finally, the impact of the time interval that is defined in Equation 1 is also a potential source of uncertainty, since a shorter time interval would make all active fires individual fires while a longer one would include many active fires into a single burning event. The power law FRE estimation method proposed by [62] could be an interesting update in future versions of 3BEM_FRP.

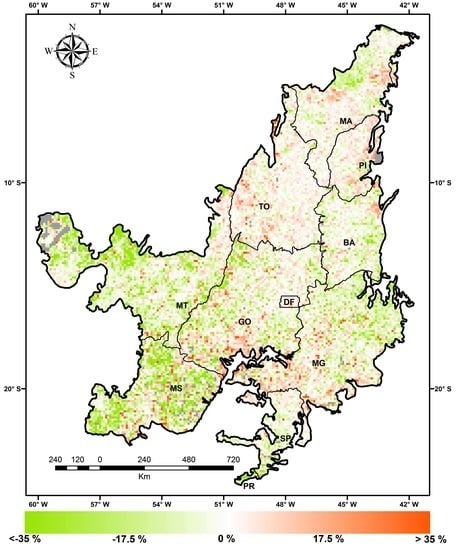
4.4. Spatial Distribution and Trends in PM2.5 Fire Emissions

Spatially, the higher annual average of PM2.5 emission that is associated with fires was concentrated in the northern area of this biome and was related to the expansion of the agricultural frontier in the Cerrado. The expansion of agricultural crops, especially soybean, which has been expanding over the northern states of the Cerrado since the early 2000s [63], leads to the conversion of the natural vegetation into croplands with the use of fire to shift the land cover. According to [60], in 2013 the Maranhão, Tocantins, Piauí, and Bahia states (MA, TO, PI, and BA in Figure 6, respectively) presented the highest proportion of natural remnants in the Cerrado. On the other hand, a recently released study [64] showed that, during the 2001–2018 period, 17.24%, 16.19%, 16.16%, and 19.37% of the Cerrado area belonging, respectively, to the MA, TO, PI, and BA states were converted from natural land covers to other land covers, which implies that these four states lost proportionally more natural areas in the period. The Cerrado of the Mato Grosso state (MT in Figure 6), which also showed high annual averages of PM2.5 emissions that are associated with fires, lost 12.73% of natural areas in the 2001–2018 period [64]. One of the main causes of this conversion is the Soy Moratorium, an agreement signed by the major soybean traders for not purchasing soy grown in areas of the Brazilian Amazon deforested after July 2006. This has led to the expansion of soy plantations over the Cerrado, especially in the MATOPIBA region (boundary of the MA, TO, PI, and BA states), where nearly 40% of the total soy expansion during the 2007–2013 period occurred over natural areas [65]. It should also be noted that the high annual average of PM2.5 fire emissions in the border between the Cerrado and Amazon biomes (western areas of the MT, TO, and MA states in Figure 6) is related to the frequent occurrence of the evergreen broadleaf land cover, which, as described above, tends to emit more PM2.5 than the savanna land cover. These grid cells of higher annual average emission also presented a higher standard deviation (up to 17.38 Mg km−2 year−1) and most of them presented non-zero PM2.5 fire emission in at least 14 of the 16 years analyzed (see Figure S3 in the Supplementary Materials). When considering the entire Cerrado, 69.3% of the grid cells presented non-zero emission in ten or more years, while 31% of them presented non-zero emission in fifteen or sixteen years.
As opposed to the northern region of this biome, the southern region presented lower annual averages, which is explained by the fact that the expansion of agriculture and associated settlements in the Cerrado began in the 1970s over the southern states; therefore, the use of fire to convert the natural land cover in this region of the Cerrado is unusual nowadays. Fire occurrence in the southern portion of this biome is primarily related to agricultural purposes, such as pest control. Consequently, the annual averages in this portion of the biome did not show high standard deviations and most of the grid cells presented up to eight years of non-zero PM2.5 fire emissions (see Figure S3b in the Supplementary Materials). The exception in the southern Cerrado is the state of São Paulo (SP in Figure 6), especially the northern portions of the state, where most of the sugarcane cultivation areas in Brazil concentrate [66] and where the higher annual averages of PM2.5 are related to pre-harvest burning.
The grid cell analysis of the trends found positive or negative local trends across this biome despite the negative trend in PM2.5 fire emissions for the entire Cerrado. Such results agree with [26], who observed regions with positive trends in burned area despite the global decline in burned area and highlighted the need for spatial analysis in fire trends studies. The works of [27,29] associated the decrease in global fire emissions with the fragmentation of the landscape and LULC changes, fire suppression, and increases in population density. Another factor that may impact the estimate and the presence of negative trends in fire emissions is the smaller fire size that is caused by the fragmentation of the landscape, which imposes difficulties for fire detection by the MODIS sensors in many areas of the globe, such as the Cerrado [23]. Still, the decreasing rate of deforestation in the Cerrado as a whole since 2004 [64] was expected to directly contribute to the negative trend in PM2.5 fire emissions for the entire biome. In agreement with the decrease in the deforestation rate, [31] found that in areas of well-established crop production of the Cerrado the conversion of areas into cropland declined during the 2003–2013 period. It should also be mentioned the potential of the previously mentioned IFM techniques in reducing fire emissions that occur in the Cerrado as a whole, since, according to [67], such techniques may potentially reduce fire emissions in South America by 15%.
Locally, we can see increasing or decreasing trends of up to ±35% with respect to the average PM2.5 fire emissions in the Cerrado (Figure 7). This is in agreement with [29], who found that fire emission trends are spatially heterogeneous. Such trends in the Cerrado are related to when the land cover was shifted: areas where the LULC changes are older showed no variation or decreasing trends, while the recently converted areas showed increasing trends. The states of MA, TO, and PI, which showed larger positive trends (red grid cells in Figure 7), presented stable or increasing deforestation rates after 2009 [64]. We can also see positive trends in the Minas Gerais and Goiás states (MG and GO in Figure 7), located in the southern region of this biome. Such increases in these areas may be related to the low number of non-zero fire years (see Figure S3b in the Supplementary Materials), which directly influence the estimated trends. Additionally, the occurrence of sparse data, that is, grid cells where there were only a couple years with non-zero fire emissions, should be minimized if a coarser spatial resolution was used, such as in the studies of [27,29]. Finally, the relatively short time series when compared to other studies that have analyzed the trends in fire emissions (16 years, while the studies of [27,29] used a time series of 163 years and 310 years, respectively) may also influence the estimated trends.
The comparison of trends in PM2.5 fire emissions obtained while using PREP-CHEM-SRC 1.8.3 (Figure 7 and Figure S1) with the trends that were obtained from the global inventories is shown in Figures S4 to S8, and in Table S2 in the Supplementary Materials. All of the grid cells trend values for all global inventories were also inserted within the 10th and 90th percentiles. We can see a variation in the highest and lowest values of annual trends, which agrees with the difference in the magnitude of the inventories (see Figure 4). The distinct time period that PREP-CHEM-SRC 1.8.3 and the global inventories provide estimates may also impact the results presented in Table S2. Nevertheless, the proportion of positive and negative trends found for all global inventories analyzed and the spatial distribution of the trends agreed with PREP-CHEM-SRC 1.8.3, even when considering the different spatial resolution and methods to estimate the emissions of GFED4.1s. Such results also show that PREP-CHEM-SRC 1.8.3 is in agreement with the global inventories, despite the differences in the magnitude between them. Finally, it should be mentioned that the trend analysis applied makes a linear assumption and produces conservative estimates. Monotonic but non-linear trends may not be captured by the analysis.

5. Conclusions

We used MODIS active fires data as inputs in the 3BEM_FRP subroutine implemented PREP-CHEM-SRC 1.8.3 with an aim of characterizing and comparing biome-scale and local-scale trends in PM2.5 emissions that are associated with fires in the heterogeneous Brazilian Cerrado. Such a framework was able to characterize and define distinct patterns in the Cerrado and, therefore, may be applied in other study areas.
Regarding the annual averages and trends, values considering the entire Cerrado may hide some finer scale patterns. We have shown that the annual average PM2.5 that is associated with fires and the average slope from the 10,000 bootstrap iterations with respect to the average PM2.5 fire emissions for the 2002–2017 varied widely across this biome. Therefore, the spatial analysis seems to be the most appropriate method for analyzing trends in this biome. Such analysis may even be used to support policy makers imposing burning restrictions in defined areas that are showing increasing trends, aiming for the reduction of emissions and their impacts on climate and human health.
The variation of the emissions with land cover emphasizes the need for coefficients of emission that are specific to the distinct land covers as well as updated emission factors to better represent the magnitude and variability of the emissions. The implementation of such improvements in PREP-CHEM-SRC 1.8.3 represent an important upgrade in the tool. Nevertheless, future efforts should be carried out for assessing the gains of the many improvements implemented in the latest version of the tool when compared to older versions, as well as assessing the results that were obtained using version 1.8.3 with global inventories, since the magnitude of the estimates varies widely between them.
The three years with higher annual total of PM2.5 fire emissions in this biome were characterized, according to the literature, by low precipitation, therefore drier conditions seem to enhance the probability of fire occurrence and associated emissions. Still, the recently applied IFM techniques in many protected areas of the Cerrado might potentially change the fire regime in this biome. Recent studies have shown that the burned area is reduced when using such techniques, whereby establishing a fire regime that is suitable for the ecosystem allows for the understanding that fires may have a positive or negative impact, depending on how they are implemented, and also help combating the idea that the total absence of fires is the best option for the functioning of the Cerrado biome. Therefore, there is also a need for quantifying the impact of IFM on the emissions that are associated with fires and the mitigation opportunity that they provide.

Supplementary Materials

The following are available online at https://www.mdpi.com/2072-4292/11/19/2254/s1, Figure S1: (a) Average slope from the 10,000 bootstrap iterations, (b) Value of the 10th percentile, and (c) Value of the 90th percentile based on PREP-CHEM-SRC 1.8.3 annual PM2.5 fire emission estimates for the Cerrado biome considering the 2002-2017 period. Gray pixels presented zero PM2.5 emission associated with fires during the entire 2002-2017 period, Figure S2: Comparison of the Cerrado land use and land cover (LULC) maps for the year 2013 from (a) MCD12Q1 collection 5.1 and (b) MCD12Q1 collection 6. Both maps follow the International Geosphere-Biosphere Program (IGBP) classification scheme, Figure S3: (a) Standard deviation of the annual average PM2.5 associated with fires in the Cerrado biome and (b) Number of years presenting non-zero PM2.5 fire emissions in the Cerrado biome. Estimates were obtained using PREP-CHEM-SRC 1.8.3 and considered the 2002-2017 period. Gray pixels presented zero PM2.5 emission associated with fires during the entire 2002-2017 period, Figure S4: (a) Average slope from the 10,000 bootstrap iterations, (b) Value of the 10th percentile, and (c) Value of the 90th percentile based on FEERv1.0-G1.2 annual PM2.5 fire emission estimates for the Cerrado biome considering the 2003-September/2015 period. Gray pixels presented zero PM2.5 emission associated with fires during the entire 2003-September/2015 period, Figure S5: (a) Average slope from the 10,000 bootstrap iterations, (b) Value of the 10th percentile, and (c) Value of the 90th percentile based on QFEDv2.5r1 annual PM2.5 fire emission estimates for the Cerrado biome considering the 2002-2017 period. Gray pixels presented zero PM2.5 emission associated with fires during the entire 2002-2017 period, Figure S6: (a) Average slope from the 10,000 bootstrap iterations, (b) Value of the 10th percentile, and (c) Value of the 90th percentile based on GFASv1.3 annual PM2.5 fire emission estimates for the Cerrado biome considering the 2003-2016 period. Gray pixels presented zero PM2.5 emission associated with fires during the entire 2003-2016 period, Figure S7: (a) Average slope from the 10,000 bootstrap iterations, (b) Value of the 10th percentile, and (c) Value of the 90th percentile based on GFED4.1s annual PM2.5 fire emission estimates for the Cerrado biome considering the 2002-2017 period (2017 estimates are preliminary). Gray pixels presented zero PM2.5 emission associated with fires during the entire 2002-2017 period (2017 estimates are preliminary), Figure S8: Annual trend (%) calculated as the average slope from the 10,000 bootstrap iterations with respect to the average PM2.5 fire emissions in the Cerrado biome based on (a) FEERv.1.0-G1.2 (2003-September/2015 period), (b) QFEDv2.5r1 (2002-2017 period), (c) GFASv1.3 (2003-2016 period), and (d) GFED4.1s (2002-2017 period; 2017 estimates are preliminary) estimates. Gray pixels presented zero PM2.5 emission associated with fires, Table S1: Total of PM2.5 emitted and active fires per land cover, average PM2.5 emitted and standard deviation per land cover for the Cerrado considering the 2002-2017 period. Estimates were obtained using PREP-CHEM-SRC 1.8.3, Table S2: Lowest and highest values of PM2.5 fire emissions annual trends, and percentage of positive trends and negative trends in the Cerrado biome for PREP-CHEM-SRC 1.8.3 (2002-2017 period), FEERv1.0-G1.2 (2003-September/2015 period), QFEDv2.5r1 (2002-2017 period), GFASv1.3 (2003-2016 period), and GFED4.1s (2002-2017 period; 2017 estimates are preliminary) estimates. Trends were calculated as the average slope from the bootstrap 10,000 iterations, Table S3: Fine particulate matter (PM2.5) emission factors used in the previous versions of PREP-CHEM-SRC, PREP-CHEM-SRC 1.8.3, GFAS, QFED, FEER, and GFED.

Author Contributions

G.A.V.M., G.P., and M.E.S.S. designed the research. G.A.V.M., G.P., and G.B. processed the data. Results were analyzed, and the manuscript was written and prepared by G.A.V.M., G.P., M.E.S.S., D.d.A.F., N.A.B., G.d.O., and F.d.S.C.

Funding

This research was funded by National Counsel of Technological and Scientific Development (CNPq) grant numbers 162898/2015-0, 441934/2018-8, and 370366/2019-0, São Paulo Research Foundation (FAPESP) grant numbers 2017/09308-9, 2015/01389-4, 2016/10137-1, and 2017/21164-2, and Coordination for the Improvement of Higher Education Personnel (CAPES) grant number 6123/2015-05.

Conflicts of Interest

The authors declare no conflict of interest.

References

  1. Forster, P.; Ramaswamy, V.; Artaxo, P.; Berntsen, T.; Betts, R.; Fahey, D.; Haywood, J.; Lean, J.; Lowe, D.; Myhre, G.; et al. Changes in Atmospheric Constituents and in Radiative Forcing. In Climate Change 2007: The Physical Science Basis; Miller, H.L., Ed.; Cambridge University Press: Cambridge, UK, 2007. [Google Scholar]
  2. Van der Werf, G.R.; Randerson, J.T.; Giglio, L.; Collatz, G.J.; Mu, M.; Kasibhatla, P.S.; Morton, D.C.; DeFries, R.S.; Jin, Y.; van Leeuwen, T.T. Global fire emissions and the contribution of deforestation, savanna, forest, agricultural, and peat fires (1997–2009). Atmos. Chem. Phys. 2010, 10, 11707–11735. [Google Scholar] [CrossRef]
  3. Van der Werf, G.R.; Randerson, J.T.; Giglio, L.; van Leeuwen, T.T.; Chen, Y.; Rogers, B.M.; Mu, M.; van Marle, M.J.E.; Morton, D.C.; Collatz, G.J.; et al. Global fire emissions estimates during 1997–2016. Earth Syst. Sci. Data 2017, 9, 697–720. [Google Scholar] [CrossRef]
  4. Freitas, S.R.; Longo, K.M.; Silva Dias, M.A.F.; Chatfield, R.; Silva Dias, P.; Artaxo, P.; Andreae, M.O.; Grell, G.; Rodrigues, L.F.; Fazenda, A.; et al. The Coupled Aerosol and Tracer Transport model to the Brazilian developments on the Regional Atmospheric Modeling System (CATT-BRAMS)—Part 1: Model description and evaluation. Atmos. Chem. Phys. 2009, 9, 2843–2861. [Google Scholar] [CrossRef]
  5. Bossioli, E.; Tombrou, M.; Kalogiros, J.; Allan, J.; Bacak, A.; Bezantakos, S.; Biskos, G.; Coe, H.; Jones, B.T.; Kouvarakis, G.; et al. Atmospheric composition in the Eastern Mediterranean: Influence of biomass burning during summertime using the WRF-Chem model. Atmos. Environ. 2016, 132, 317–331. [Google Scholar] [CrossRef]
  6. Longo, K.M.; Freitas, S.R.; Andreae, M.O.; Setzer, A.; Prins, E.; Artaxo, P. The Coupled Aerosol and Tracer Transport model to the Brazilian developments on the Regional Atmospheric Modeling System (CATT-BRAMS)—Part 2: Model sensitivity to the biomass burning inventories. Atmos. Chem. Phys. 2010, 10, 5785–5795. [Google Scholar] [CrossRef]
  7. Chen, J.; Li, C.; Ristovski, Z.; Milic, A.; Gu, Y.; Islam, M.S.; Wang, S.; Hao, J.; Zhang, H.; He, C.; et al. A review of biomass burning: Emissions and impacts on air quality, health and climate in China. Sci. Total Environ. 2017, 579, 1000–1034. [Google Scholar] [CrossRef] [PubMed]
  8. Johnston, F.H.; Henderson, S.B.; Chen, Y.; Randerson, J.T.; Marlier, M.; Defries, R.S.; Kinney, P.; Bowman, D.M.; Brauer, M. Estimated global mortality attributable to smoke from landscape fires. Environ. Health Perspect. 2012, 120, 695–701. [Google Scholar] [CrossRef] [PubMed]
  9. De Oliveira Alves, N.; Vessoni, A.T.; Quinet, A.; Fortunato, R.S.; Kajitani, G.S.; Peixoto, M.S.; Hacon, S.S.; Artaxo, P.; Saldiva, P.; Menck, C.F.M.; et al. Biomass burning in the Amazon region causes DNA damage and cell death in human lung cells. Sci. Rep. 2017, 7, 10937. [Google Scholar] [CrossRef] [PubMed]
  10. Wu, L.; Su, H.; Jiang, J.H. Regional simulations of deep convection and biomass burning over South America: Biomass burning aerosol effects on clouds and precipitation. J. Geophys. Res. 2011, 116. [Google Scholar] [CrossRef]
  11. Ichoku, C.; Ellison, L.T.; Willmot, K.E.; Matsui, T.; Dezfuli, A.K.; Gatebe, C.K.; Wang, J.; Wilcox, E.M.; Lee, J.; Adegoke, J.; et al. Biomass burning, land-cover change, and the hydrological cycle in Northern sub-Saharan Africa. Environ. Res. Lett. 2016, 11, 095005. [Google Scholar] [CrossRef] [Green Version]
  12. De Sales, F.; Okin, G.S.; Xue, Y.; Dintwe, K. On the effects of wildfires on precipitation in Southern Africa. Clim. Dyn. 2018, 52, 951–967. [Google Scholar] [CrossRef] [Green Version]
  13. Lin, C.Y.; Zhao, C.; Liu, X.; Lin, N.H.; Chen, W.N. Modelling of long-range transport of Southeast Asia biomass burning aerosols to Taiwan and their radiative forcings over East Asia. Tellus B Chem. Phys. Meteorol. 2014, 66, 23733. [Google Scholar] [CrossRef]
  14. Beringer, J.; Hutley, L.B.; Tapper, N.J.; Coutts, A.; Kerley, A.; O’Grady, A.P. Fire impacts on surface heat, moisture and carbon fluxes from a tropical savanna in northern Australia. Int. J. Wildland Fire 2003, 12, 333–340. [Google Scholar] [CrossRef]
  15. National Research Council Committee on Air Quality Management in the United States. Air Quality Management in the United States; National Academies Press: Washington, DC, USA, 2004. [Google Scholar]
  16. Van der Werf, G.R.; Randerson, J.T.; Giglio, L.; Gobron, N.; Dolman, A.J. Climate controls on the variability of fires in the tropics and subtropics. Glob. Biogeochem. Cycles 2008, 22. [Google Scholar] [CrossRef] [Green Version]
  17. Archibald, S.; Staver, A.C.; Levin, S.A. Evolution of human-driven fire regimes in Africa. Proc. Natl. Acad. Sci. USA 2012, 109, 847–852. [Google Scholar] [CrossRef] [PubMed]
  18. Knorr, W.; Jiang, L.; Arneth, A. Climate, CO2 and human population impacts on global wildfire emissions. Biogeosciences 2016, 13, 267–282. [Google Scholar] [CrossRef]
  19. Pivello, V.R. The Use of Fire in the Cerrado and Amazonian Rainforests of Brazil: Past and Present. Fire Ecol. 2011, 7, 24–39. [Google Scholar] [CrossRef]
  20. Arruda, F.V.D.; Sousa, D.G.D.; Teresa, F.B.; Prado, V.H.M.D.; Cunha, H.F.D.; Izzo, T.J. Trends and gaps of the scientific literature about the effects of fire on Brazilian Cerrado. Biota Neotrop. 2018, 18. [Google Scholar] [CrossRef]
  21. Moreira de Araújo, F.; Ferreira, L.G.; Arantes, A.E. Distribution Patterns of Burned Areas in the Brazilian Biomes: An Analysis Based on Satellite Data for the 2002–2010 Period. Remote Sens. 2012, 4, 1929–1946. [Google Scholar] [CrossRef]
  22. Libonati, R.; DaCamara, C.; Setzer, A.; Morelli, F.; Melchiori, A. An Algorithm for Burned Area Detection in the Brazilian Cerrado Using 4 µm MODIS Imagery. Remote Sens. 2015, 7, 15782–15803. [Google Scholar] [CrossRef]
  23. Araújo, F.M.D.; Ferreira, L.G. Satellite-based automated burned area detection: A performance assessment of the MODIS MCD45A1 in the Brazilian savanna. Int. J. Appl. Earth Obs. 2015, 36, 94–102. [Google Scholar] [CrossRef]
  24. Nogueira, J.; Rambal, S.; Barbosa, J.; Mouillot, F. Spatial Pattern of the Seasonal Drought/Burned Area Relationship across Brazilian Biomes: Sensitivity to Drought Metrics and Global Remote-Sensing Fire Products. Climate 2017, 5, 42. [Google Scholar] [CrossRef]
  25. Mataveli, G.A.V.; Silva, M.E.S.; Pereira, G.; da Silva Cardozo, F.; Kawakubo, F.S.; Bertani, G.; Costa, J.C.; de Cássia Ramos, R.; da Silva, V.V. Satellite observations for describing fire patterns and climate-related fire drivers in the Brazilian savannas. Nat. Hazards Earth Sys. 2018, 18, 125–144. [Google Scholar] [CrossRef] [Green Version]
  26. Andela, N.; Morton, D.C.; Giglio, L.; Chen, Y.; van der Werf, G.R.; Kasibhatla, P.S.; DeFries, R.S.; Collatz, G.J.; Hantson, S.; Kloster, S.; et al. A human-driven decline in global burned area. Science 2017, 356, 1356–1362. [Google Scholar] [CrossRef] [PubMed] [Green Version]
  27. Arora, V.K.; Melton, J.R. Reduction in global area burned and wildfire emissions since 1930s enhances carbon uptake by land. Nat. Commun. 2018, 9, 1326. [Google Scholar] [CrossRef] [PubMed]
  28. Earl, N.; Simmonds, I. Spatial and Temporal Variability and Trends in 2001-2016 Global Fire Activity. J. Geophys. Res. Atmos. 2018, 123, 2524–2536. [Google Scholar] [CrossRef]
  29. Ward, D.S.; Shevliakova, E.; Malyshev, S.; Rabin, S. Trends and Variability of Global Fire Emissions Due To Historical Anthropogenic Activities. Glob. Biogeochem. Cycles 2018, 32, 122–142. [Google Scholar] [CrossRef]
  30. Hantson, S.; Scheffer, M.; Pueyo, S.; Xu, C.; Lasslop, G.; van Nes, E.H.; Holmgren, M.; Mendelsohn, J. Rare, Intense, Big fires dominate the global tropics under drier conditions. Sci. Rep. 2017, 7, 14374. [Google Scholar] [CrossRef]
  31. Noojipady, P.; Morton, C.D.; Macedo, N.M.; Victoria, C.D.; Huang, C.; Gibbs, K.H.; Bolfe, L.E. Forest carbon emissions from cropland expansion in the Brazilian Cerrado biome. Environ. Res. Lett. 2017, 12, 025004. [Google Scholar] [CrossRef]
  32. Pereira, A.; Pereira, J.; Libonati, R.; Oom, D.; Setzer, A.; Morelli, F.; Machado-Silva, F.; de Carvalho, L. Burned Area Mapping in the Brazilian Savanna Using a One-Class Support Vector Machine Trained by Active Fires. Remote Sens. 2017, 9, 1161. [Google Scholar] [CrossRef]
  33. Wooster, M.J.; Roberts, G.; Perry, G.L.W.; Kaufman, Y.J. Retrieval of biomass combustion rates and totals from fire radiative power observations: FRP derivation and calibration relationships between biomass consumption and fire radiative energy release. J. Geophys. Res. 2005, 110. [Google Scholar] [CrossRef]
  34. Cardozo, F.S.; Pereira, G.; Mataveli, G.A.V.; Shimabukuro, Y.E.; Moraes, E.C. Avaliação dos modelos de emissão 3BEM e 3BEM_FRP no estado de Rondônia. Rev. Bras. Cart. 2015, 67, 1247–1264. [Google Scholar]
  35. Roberts, G.; Wooster, M.J.; Perry, G.L.W.; Drake, N.; Rebelo, L.M.; Dipotso, F. Retrieval of biomass combustion rates and totals from fire radiative power observations: Application to southern Africa using geostationary SEVIRI imagery. J. Geophys. Res. 2005, 110. [Google Scholar] [CrossRef] [Green Version]
  36. Pereira, G.; Siqueira, R.; Rosário, N.E.; Longo, K.L.; Freitas, S.R.; Cardozo, F.S.; Kaiser, J.W.; Wooster, M.J. Assessment of fire emission inventories during the South American Biomass Burning Analysis (SAMBBA) experiment. Atmos. Chem. Phys. 2016, 16, 6961–6975. [Google Scholar] [CrossRef] [Green Version]
  37. Giglio, L.; Schroeder, W.; Justice, C.O. The collection 6 MODIS active fire detection algorithm and fire products. Remote Sens. Environ. 2016, 178, 31–41. [Google Scholar] [CrossRef] [PubMed] [Green Version]
  38. Freitas, S.R.; Panetta, J.; Longo, K.M.; Rodrigues, L.F.; Moreira, D.S.; Rosário, N.E.; Silva Dias, P.L.; Silva Dias, M.A.F.; Souza, E.P.; Freitas, E.D.; et al. The Brazilian developments on the Regional Atmospheric Modeling System (BRAMS 5.2): An integrated environmental model tuned for tropical areas. Geosci. Model Dev. 2017, 10, 189–222. [Google Scholar] [CrossRef]
  39. Freitas, S.R.; Longo, K.M.; Alonso, M.F.; Pirre, M.; Marecal, V.; Grell, G.; Stockler, R.; Mello, R.F.; Sánchez Gácita, M. PREP-CHEM-SRC—1.0: A preprocessor of trace gas and aerosol emission fields for regional and global atmospheric chemistry models. Geosci. Model Dev. 2011, 4, 419–433. [Google Scholar] [CrossRef]
  40. Santos, P.R. Desenvolvimento e Implementação do Ciclo Diurno da Queima de Biomassa no PREP-CHEM-SRC: Análise dos Inventários de Emissões de Aerossóis na América do Sul. Master’s Thesis, National Institute for Space Research, São José dos Campos, Brazil, 2018. [Google Scholar]
  41. IBGE. Brazilian Biomes. Available online: https://downloads.ibge.gov.br/downloads_geociencias.htm (accessed on 8 January 2019).
  42. Durigan, G.; Ratter, J.A.; James, J. The need for a consistent fire policy for Cerrado conservation. J. Appl. Ecol. 2016, 53, 11–15. [Google Scholar] [CrossRef]
  43. Friedl, M.A.; Sulla-Menashe, D.; Tan, B.; Schneider, A.; Ramankutty, N.; Sibley, A.; Huang, X. MODIS Collection 5 global land cover: Algorithm refinements and characterization of new datasets. Remote Sens. Environ. 2010, 114, 168–182. [Google Scholar] [CrossRef]
  44. Grell, G.A.; Peckham, S.E.; Schmitz, R.; McKeen, S.A.; Frost, G.; Skamarock, W.C.; Eder, B. Fully coupled “online” chemistry within the WRF model. Atmos. Environ. 2005, 39, 6957–6975. [Google Scholar] [CrossRef]
  45. Ichoku, C.; Ellison, L. Global top-down smoke-aerosol emissions estimation using satellite fire radiative power measurements. Atmos. Chem. Phys. 2014, 14, 6643–6667. [Google Scholar] [CrossRef] [Green Version]
  46. Kaiser, J.W.; Heil, A.; Andreae, M.O.; Benedetti, A.; Chubarova, N.; Jones, L.; Morcrette, J.J.; Razinger, M.; Schultz, M.G.; Suttie, M.; et al. Biomass burning emissions estimated with a global fire assimilation system based on observed fire radiative power. Biogeosciences 2012, 9, 527–554. [Google Scholar] [CrossRef] [Green Version]
  47. Darmenov, A.S.; da Silva, A.M. The Quick Fire Emissions Dataset (QFED): Documentation of Versions 2.1, 2.2 and 2.4; National Aeronautics and Space Administration: Washington, DC, USA, 2015; p. 212.
  48. Wilks, D.S. Statistical Methods in the Atmospheric Sciences, 2nd ed.; Elservier: Oxford, UK, 2006. [Google Scholar]
  49. Austin, K.G.; Schwantes, A.; Gu, Y.; Kasibhatla, P.S. What causes deforestation in Indonesia? Environ. Res. Lett. 2019, 14, 024007. [Google Scholar] [CrossRef]
  50. Fearnside, P.M. Soybean cultivation as a threat to the environment in Brazil. Environ. Conserv. 2002, 28. [Google Scholar] [CrossRef]
  51. Hooghiemstra, P.B.; Krol, M.C.; van Leeuwen, T.T.; van der Werf, G.R.; Novelli, P.C.; Deeter, M.N.; Aben, I.; Röckmann, T. Interannual variability of carbon monoxide emission estimates over South America from 2006 to 2010. J. Geophys. Res. Atmos. 2012, 117. [Google Scholar] [CrossRef] [Green Version]
  52. Fidelis, A.; Alvarado, S.; Barradas, A.; Pivello, V. The Year 2017: Megafires and Management in the Cerrado. Fire 2018, 1, 49. [Google Scholar] [CrossRef]
  53. Schmidt, I.B.; Moura, L.C.; Ferreira, M.C.; Eloy, L.; Sampaio, A.B.; Dias, P.A.; Berlinck, C.N.; Zenni, R. Fire management in the Brazilian savanna: First steps and the way forward. J. Appl. Ecol. 2018, 55, 2094–2101. [Google Scholar] [CrossRef] [Green Version]
  54. Ramos-Neto, M.B.; Pivello, V.R. Lightning fires in a brazilian savanna national park: Rethinking management strategies. Environ. Manag. 2000, 26, 675–684. [Google Scholar] [CrossRef]
  55. Kayano, M.T.; Andreoli, R.V. Clima da região Nordeste do Brasil. In Tempo e Clima no Brasil; Cavalcanti, I.A.F., Ferreira, N.J., Silva, M.G.A.J., Dias, M.A.F.S., Eds.; Oficina de Textos: São Paulo, Brazil, 2009; Volume 1, pp. 213–233. [Google Scholar]
  56. Saha, M.V.; Scanlon, T.M.; D’Odorico, P. Climate seasonality as an essential predictor of global fire activity. Glob. Ecol. Biogeogr. 2018, 28, 198–210. [Google Scholar] [CrossRef]
  57. Ichoku, C.; Kahn, R.; Chin, M. Satellite contributions to the quantitative characterization of biomass burning for climate modeling. Atmos. Res. 2012, 111, 1–28. [Google Scholar] [CrossRef] [Green Version]
  58. Wang, J.; Yue, Y.; Wang, Y.; Ichoku, C.; Ellison, L.; Zeng, J. Mitigating Satellite-Based Fire Sampling Limitations in Deriving Biomass Burning Emission Rates: Application to WRF-Chem Model Over the Northern sub-Saharan African Region. J. Geophys. Res. Atmos. 2018, 123, 507–528. [Google Scholar] [CrossRef]
  59. Darbyshire, E.; Morgan, W.T.; Allan, J.D.; Liu, D.; Flynn, M.J.; Dorsey, J.R.; O’shea, S.J.; Lowe, D.; Szpek, K.; Marenco, F.; et al. The vertical distribution of biomass burning pollution over tropical South America from aircraft in situ measurements during SAMBBA. Atmos. Chem. Phys. Discuss. 2018, 1–26. [Google Scholar] [CrossRef]
  60. INPE. TerraClass Cerrado Project: Mapping Land-Use and Land-Cover in the Cerrado. Available online: http://www.dpi.inpe.br/tccerrado/ (accessed on 8 January 2019).
  61. Hyer, E.J.; Reid, J.S. Baseline uncertainties in biomass burning emission models resulting from spatial error in satellite active fire location data. Geophys. Res. Lett. 2009, 36. [Google Scholar] [CrossRef]
  62. Kumar, S.S.; Roy, D.P.; Boschetti, L.; Kremens, R. Exploiting the power law distribution properties of satellite fire radiative power retrievals: A method to estimate fire radiative energy and biomass burned from sparse satellite observations. J. Geophys. Res. 2011, 116. [Google Scholar] [CrossRef] [Green Version]
  63. Spera, S.A.; Galford, G.L.; Coe, M.T.; Macedo, M.N.; Mustard, J.F. Land-use change affects water recycling in Brazil’s last agricultural frontier. Glob. Chang. Biol. 2016, 22, 3405–3413. [Google Scholar] [CrossRef] [PubMed]
  64. INPE. Cerrado Monitoring Project. Available online: http://www.obt.inpe.br/cerrado/ (accessed on 8 January 2019).
  65. Gibbs, H.K.; Rausch, L.; Munger, J.; Schelly, I.; Morton, D.C.; Noojipady, P.; Soares-Filho, B.; Barreto, P.; Micol, L.; Walker, N.F. Environment and development. Brazil’s Soy Moratorium. Science 2015, 347, 377–378. [Google Scholar] [CrossRef] [PubMed]
  66. Rudorff, B.F.T.; Aguiar, D.A.; Silva, W.F.; Sugawara, L.M.; Adami, M.; Moreira, M.A. Studies on the Rapid Expansion of Sugarcane for Ethanol Production in São Paulo State (Brazil) Using Landsat Data. Remote Sens. 2010, 2, 1057–1076. [Google Scholar] [CrossRef]
  67. Lipsett-Moore, G.J.; Wolff, N.H.; Game, E.T. Emissions mitigation opportunities for savanna countries from early dry season fire management. Nat. Commun. 2018, 9, 2247. [Google Scholar] [CrossRef] [Green Version]
Figure 1. Location of the Cerrado biome in South America (left panel) and in the Brazilian territory (right panel). In the left panel, A represents the Amazon biome, B the Cerrado biome, C the Caatinga biome, D the Atlantic Rainforest biome, E the Pampa biome, and F the Pantanal biome [41]. Base map is Moderate Resolution Imaging Spectroradiometer (MODIS) MCD12Q1 product collection 5.1 for the year 2013 following the International Geosphere-Biosphere Program (IGBP) land cover classification scheme.
Remotesensing 11 02254 g001
Figure 2. Annual total emission of PM2.5 associated with fires in South America, Brazil, and in the Cerrado biome during the 2002–2017 period. Estimates were obtained using PREP-CHEM-SRC 1.8.3.
Remotesensing 11 02254 g002
Figure 3. (a) Percentage of PM2.5 fire emissions in the dry (May to September) and rainy (October to April) seasons of the Cerrado during the 2002–2017 period and (b) Monthly average emission of PM2.5 associated with fires in the Cerrado. Estimates were obtained while using PREP-CHEM-SRC 1.8.3.
Remotesensing 11 02254 g003
Figure 4. (a) Annual total emission of PM2.5 associated with fires in the Cerrado biome estimated from PREP-CHEM-SRC 1.8.3 (2002–2017 period), GFASv1.3 (2003–2016 period), QFEDv2.5r1 (2002–2017 period), FEERv1.0-G1.2 (2003-September/2015 period), and GFED4.1s (2002–2017 period; 2017 estimates are preliminary) and (b) Scatterplot between PREP-CHEM-SRC 1.8.3 annual estimates and the annual estimates of the global inventories.
Remotesensing 11 02254 g004
Figure 5. (a) Annual average emission of PM2.5 associated with fires in the major land cover categories of the Cerrado biome and (b) Annual average emission of PM2.5 associated with fires per active fire detected in the major land cover categories of the Cerrado. Estimates were obtained using PREP-CHEM-SRC 1.8.3 and considered the 2002–2017 period. Error bars represent the standard deviation.
Remotesensing 11 02254 g005
Figure 6. Spatial distribution of the annual average PM2.5 associated with fires in the Cerrado biome during the 2002–2017 period based on PREP-CHEM-SRC 1.8.3 estimates. Gray pixels presented zero PM2.5 emission associated with fires during the entire 2002–2017 period.
Remotesensing 11 02254 g006
Figure 7. Annual trend (%) calculated as the average slope from the 10,000 bootstrap iterations with respect to the average PM2.5 fire emissions in the Cerrado biome. Annual trend is based on PREP-CHEM-SRC 1.8.3 estimates when considering the 2002–2017 period. Gray pixels presented zero PM2.5 emission associated with fires during the entire 2002–2017 period.
Remotesensing 11 02254 g007
Table 1. Annual average emission of PM2.5 associated with fires in the Brazilian biomes for the 2002–2017 period. Estimates were obtained using PREP-CHEM-SRC 1.8.3.
BiomeArea (km2)Brazilian Territory (%)Average Emission (Tg year−1)National Percentage (%)
Amazon4,230,490502.6862.76
Cerrado2,047,146241.0825.27
Atlantic Rainforest1,059,027120.255.95
Caatinga825,750100.153.47
Pantanal151,18620.102.27
Pampa178,24320.010.28

