Article

Assessment of IMERG-V06 Precipitation Product over Different Hydro-Climatic Regimes in the Tianshan Mountains, North-Western China

1
State Key Laboratory of Cryospheric Science, Northwest Institute of Eco-Environment and Resources, Chinese Academy of Sciences, Lanzhou 730000, China
2
University of Chinese Academy of Sciences, Beijing 100049, China
3
Centre of Excellence in Water Resources Engineering, University of Engineering and Technology, Lahore 54890, Pakistan
4
Department of Irrigation and Drainage, University of Agriculture, Faisalabad 38000, Pakistan
5
Environmental Protection Agency, Lahore 54000, Punjab, Pakistan
*
Author to whom correspondence should be addressed.
Remote Sens. 2019, 11(19), 2314; https://doi.org/10.3390/rs11192314
Submission received: 24 August 2019 / Revised: 25 September 2019 / Accepted: 1 October 2019 / Published: 4 October 2019

Abstract

:
This study presents an assessment of the version-6 (V06) of the Integrated Multi-satellitE Retrievals for Global Precipitation Measurement (IMERG) product from June 2014 to December 2017 over different hydro-climatic regimes in the Tianshan Mountains. The performance of IMERG-V06 was compared with IMERG-V05 and the Tropical Rainfall Measuring Mission (TRMM) 3B42V7 precipitation products. The precipitation products were assessed against gauge-based daily and monthly precipitation observations over the entire spatial domain and five hydro-climatologically distinct sub-regions. Results showed that: (1) The spatiotemporal variability of average daily precipitation over the study domain was well represented by all products. (2) All products showed better correlations with the monthly gauge-based observations than the daily data. Compared to 3B42V7, both IMERG products presented a better agreement with gauge-based observations. (3) The estimation skills of all precipitation products showed significant spatial variations. Overall performance of all precipitation products was better in the Eastern region compared to the Middle and Western regions. (4) Satellite products were able to detect tiny precipitation events, but they were uncertain in capturing light and moderate precipitation events. (5) No significant improvements in the precipitation estimation skill of IMERG-V06 were found as compared to IMERG-V05. We deduce that the IMERG-V06 precipitation detection capability could not outperform the efficiency of IMERG-V05. This comparative evaluation of the research products of Global Precipitation Measurement (GPM) and TRMM products in the Tianshan Mountains is useful for data users and algorithm developers.

1. Introduction

Precipitation plays a key role in the hydrological cycle, and the acquisition of accurate and reliable precipitation data is pre-requisite for many hydrological, climatological, meteorological, ecological, and environmental applications. Traditionally, rain gauges are regarded as the most reliable and direct source of precipitation information [1]. However, in many physically inaccessible and developing areas, rain gauges are usually unavailable or sparse, causing uncertainties in the delineation of the spatial distribution of precipitation [2,3]. Furthermore, heterogeneity, wind-induced errors, and missing values in the gauge-based observations hamper their use for several applications [4]. These limitations of gauge-based observations are also true for the Tianshan Mountains in Central Asia [5]. Thus, it is essential to discover other suitable proxies of precipitation data. The satellite-based precipitation products (SPPs) are able to overcome the limitation of data sparsity by providing uninterrupted precipitation estimates at fine spatiotemporal resolutions [6,7].
Currently, several SPPs are available for research and scientific applications [8,9]. Generally, these products provide precipitation estimates from the infrared (IR) or passive microwave (MW) fields [10], or by merging both of these fields [11,12]. Satellite-based precipitation estimation algorithms are designed to retrieve the amount of precipitation from the cloud top temperature and atmospheric water content data from the IR sensors mounted on satellites in geosynchronous orbit (GEO) [9]. Similarly, satellite-based precipitation retrieval algorithms are able to estimate precipitation rates from the cloud profiles and atmospheric constituent information from the passive MW sensors mounted on the satellite in low Earth orbit (LEO) [13]. The estimates obtained from IR sensors (with fine spatiotemporal coverage) and MW sensors (higher precision and good relationship with rainfall) are often merged to provide better information of precipitation occurrence [14]. Many satellite-based products have been introduced by merging IR and MW data, such as the Global Satellite Mapping of Precipitation (GSMaP) [15], Tropical Rainfall Measurement Mission (TRMM) Multi-Satellite Precipitation Analysis (TMPA) [9], the Climate Prediction Center Morphing Technique (CMORPH) [16], and Precipitation Estimation from Remotely Sensed Information using Artificial Neural Network (PERSIANN) [17]. Among all of these products, the TRMM-based precipitation estimates have been widely utilized for different applications in tropical and sub-tropical regions [18,19,20,21]. The TRMM, developed by the National Aeronautics and Space Agency (NASA) and the Japan Aerospace and Exploration Agency (JAXA), has been providing uninterrupted precipitation estimates since 1997. To directly estimate the precipitation quantity from space, a space-borne precipitation radar (PR) was incorporated in the TRMM. This project provides precipitation estimates over a spatial domain of 50° N to 50° S at fine spatial (0.25° × 0.25°) and temporal (3 h) resolutions. The precipitation estimates from TRMM have been assessed against in situ gauge-based observations in different topographic, hydrological, and climatic regimes, and have been recommended for hydrological simulations [18,22,23,24], agriculture [25], flood monitoring [26], drought analysis [21], and soil moisture estimation [27].
After the success of the TRMM project, the core satellite for the Global Precipitation Measurement (GPM) Mission was launched by NASA and JAXA in February 2014. With the aim of providing more precise and reliable precipitation estimates at fine spatiotemporal resolutions, the dual-frequency precipitation radar (DPR), the first of its kind, was incorporated in the GPM core observatory. This mission is providing Integrated Multi-satellitE Retrievals for GPM (IMERG) precipitation estimates at 30-min time intervals and 0.1° grid-scale [28]. The algorithm of IMERG provides precipitation estimates after integrating, interpolating, and intercalibrating IR and MW information obtained from the algorithms of TRMM, PERSIANN, and CMORPH. The GPM-based precipitation estimates are available at Early-run, Late-run, and Final-run levels. Among these runs, only Final-run estimates are adjusted using monthly precipitation data of the Global Precipitation Climatology Centre (GPCC). The first research version (V03) of precipitation estimates from IMERG was released in early 2014. The advantages and disadvantages of IMERG-V03 were widely investigated in different topographical, hydrological, and climatic conditions worldwide [29,30,31,32]. After improving the algorithm, a new version (V04) of IMERG was released in March 2017. Likewise IMERG-V03, the precision and error characteristics of IMERG-V04 were also investigated worldwide [11,33,34,35,36]. Considering the reported performance of IMERG-V04 in different climatic and topographic conditions, the precipitation retrieval algorithm was modified again, and the new version (V05) of IMERG was introduced in November 2017. Several studies have documented the performance of the IMERG-V05 product worldwide [37,38,39,40,41]. After enhancing the precipitation retrieval algorithm, NASA Goddard Space Flight Center (GSFC) released the latest version (V06) of IMERG in March 2019. The main aim of the enhancements in the algorithms of IMERG products is to provide the most suitable alternative to ground-based stations.
Although several previous studies have reported the performance of satellite-based precipitation products (including GPM- and TRMM-based products) in central Asia [41,42,43,44], the error characteristics and enhancements in the latest version of IMERG-V06 have not yet been reported. Comparative evaluations of this newly released precipitation product in different topographic conditions and climatic systems are very important for further enhancements in algorithms, and for hydrological, meteorological, agricultural, environmental, and ecological studies.
In this study, advantages and error characteristics of the recently released IMERG-V06 product were assessed and compared with the IMERG-V05 and 3B42V7 products in the Tianshan Mountains range, North-Western China. The satellite-based precipitation products were evaluated with reference to the in situ gauge-based daily and monthly precipitation data over the entire spatial domain and five sub-regions for the period from June 2014 to December 2017. This is the first study aiming to provide information about the error characteristics of IMERG-V06 in the Tianshan Mountains. The IMERG-V05 and 3B42V7 products were assessed to provide a clear perspective of the advantages and disadvantages of the latest version of IMERG.

2. Materials and Methods
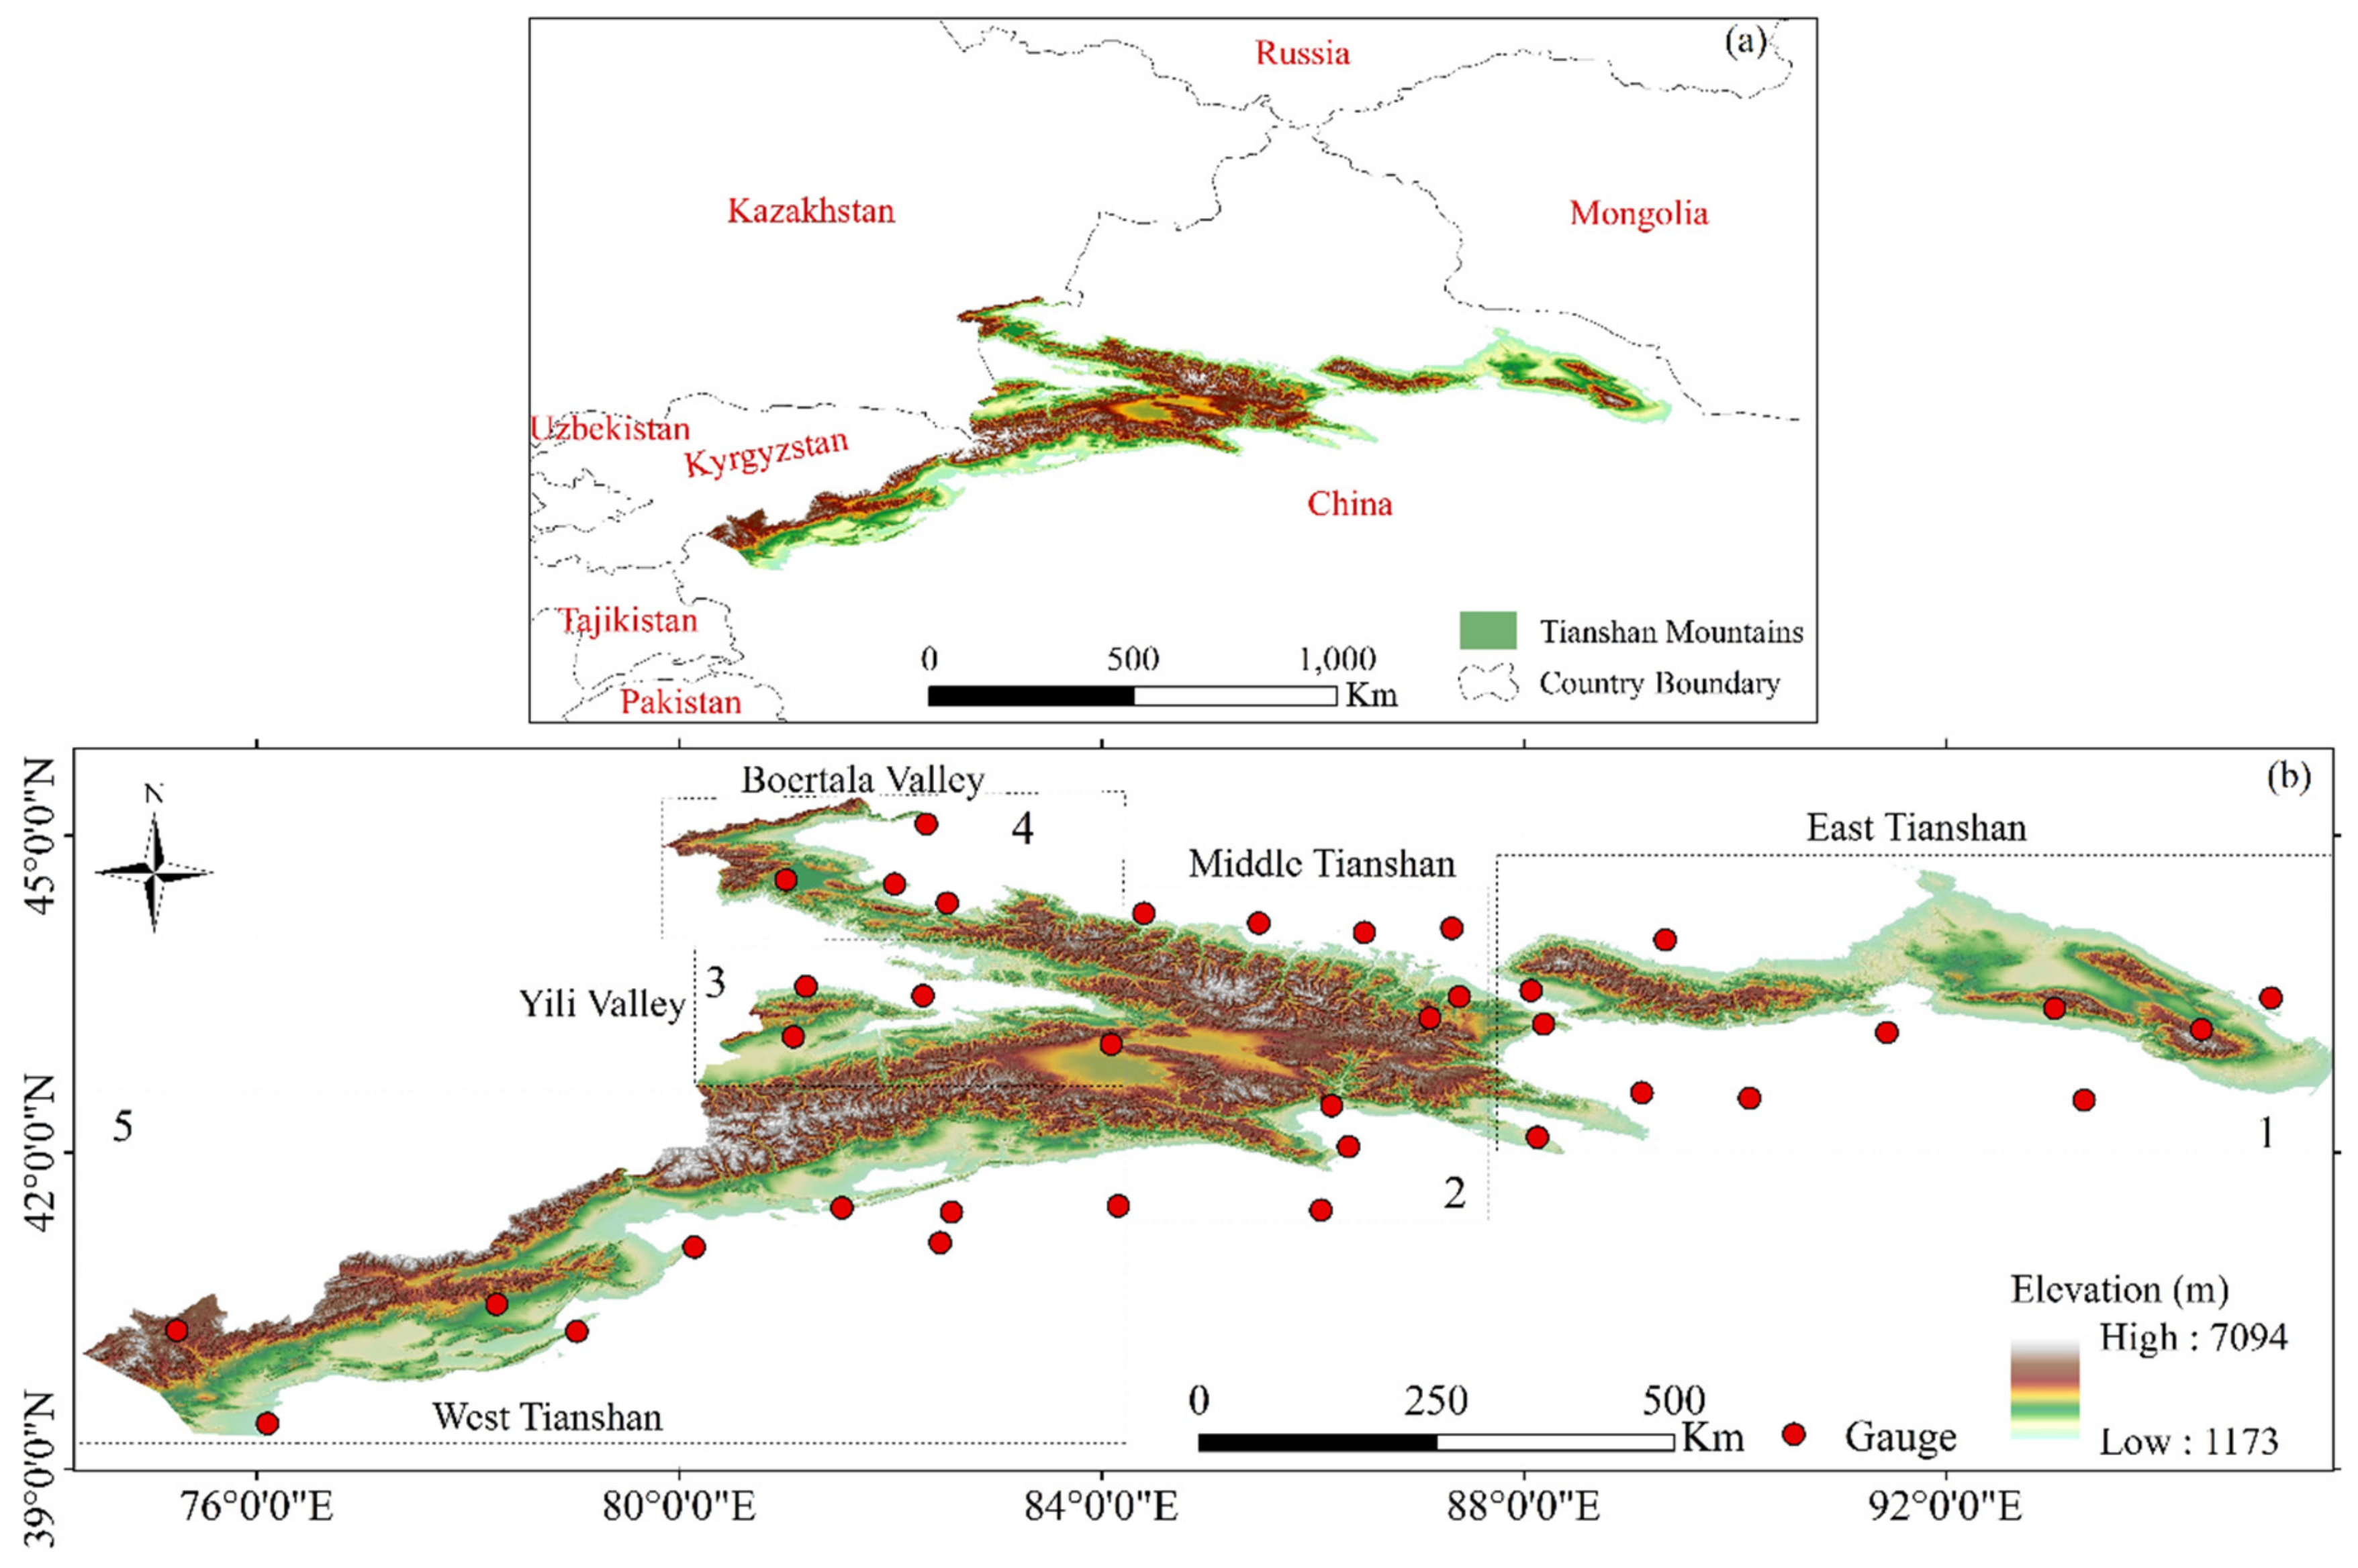
2.1. Study Area

The performance of three SPPs was assessed over the Tianshan Mountains (Figure 1), the largest mountain system in central Asia. These mountains are located on the northwestern periphery of China [45], and their estimated area is about 800,000 km2 [5]. The total stretch (from east to west) of the Tianshan Mountains is about 2000 km, and about 1700 km is in China [46]. This region has a very complex topography; the elevation varies from 7094 to 1173 m with a west to east gradient. The orientation and altitude of these mountains have a substantial influence on the patterns of regional weather and spatiotemporal distribution of precipitation [5]. These mountains experience a continental arid climate because they are at the furthest distance from the oceans (compared to the other large mountain systems in the world) [45]. These mountains contain several intermountainous river basins, glaciers, desert oases, and valleys [45,47]. The westerly circulation system and regional orographic lifting are the main sources of precipitation. Precipitation varies greatly with space and time (Figure 2), with more precipitation in summer and less precipitation in winter. Considering the accessibility of gauge-based precipitation data, only the Chinese part of these mountains (between latitudes 39°–46° N and longitudes 74°–96° E) (Figure 1) was selected for the assessment of SPPs. On the basis of distinct hydroclimatic conditions, these mountains can be divided into five sub-regions: East Tianshan (1), Middle Tianshan (2), Yili Valley (3), Boertala Valley (4), and West Tianshan (5). The sub-regional boundaries (as shown in Figure 1) were delineated by following Xu et al. [5]. The general characteristics of considered sub-regions are presented in Table 1. The Yili Valley experienced the highest average annual precipitation, while the lowest average precipitation was observed in the West Tianshan region (Figure 2). In the study domain, June was the month of highest precipitation while February was the month of lowest precipitation.

2.2. Datasets

The daily precipitation records of 37 in situ gauges were obtained from the China Meteorological Administration (CMA). The geographical locations of considered gauging stations are presented in Figure 1. The Chinese National Meteorological Information Centre had ensured the high quality of daily time-series data of the selected gauging stations. Moreover, many recent hydrological and climatological studies have successfully utilized the precipitation data of the considered gauging stations [5,41,44,48]. Considering the availability and quality of the gauge-based observations, this study was designed for the period from June 2014 to December 2017.
The TRMM-based precipitation estimates at 0.25° × 0.25° spatial and 3-h temporal resolutions were acquired from the website of NASA (http://disc2.nascom.nasa.gov/tovas/). The GPM-based half-hourly estimates at 0.1° × 0.1° grid-scale were downloaded from the website (http://pmm.nasa.gov/data-access/downloads/gms). The daily precipitation estimates of both IMERG products were obtained by accumulating half-hourly estimates, whereas the daily TRMM-based precipitation estimates were obtained by accumulating the three-hourly estimates. The GPM- and TRMM-based precipitation products are accessible at UTC 0, whereas gauge-based observations in the Tianshan Mountains are available at UTC 8. Considering the different reporting times of the gauge- and satellite-based data, we followed Cai et al. [49] to convert the satellite-based estimates to UTC 8.

2.3. Methods

The quality of three SPPs (IMERG-V05, IMERG-V06, and 3B42V7) was assessed against gauge-based daily and monthly observations in the Tianshan Mountains. The SPPs were evaluated at the point-to-pixel, sub-regional, and regional scales for the period from June 2014 to December 2017. For the analysis, only those grids of IMERG-V05, IMERG-V06, and 3B42V7 products containing the in situ gauging stations were selected, following Wang et al. [40].
The statistical measures used to assess the performance of SPPs were the correlation coefficient (CC), root mean square error (RMSE), BIAS, relative Bias (rBias), probability of detection (POD), false alarm ratio (FAR), success ratio (SR), and critical success index (CSI). Previously, several researchers have computed these measures to assess the performance of satellite-based products in different regions of the world [3,11,42,50,51,52,53,54]. The ability of SPPs to track the spatial and temporal variabilities of precipitation over the study domain was also analyzed. Maps of the spatial distribution of gauge-based and remotely sensed precipitation data were developed to analyze the ability of SPPs to represent the spatial variation of observed precipitation. The time series of gauge-based and satellite-based average daily precipitation were compared to analyze the ability of SPPs to monitor the temporal variability of observed precipitation.
The CC (dimensionless) was computed to analyze the linear consistency between the satellite-based and gauge-based (reference) precipitation data. The BIAS was estimated to measure the dissimilarity (in mm), overestimation or underestimation, between the reference and satellite-based estimates. The rBias was estimated to quantify the relative difference (%) between reference and satellite-based data. The RMSE was estimated to know the average magnitude of error (in mm) in the estimates of SPPs.
The CC, BIAS, rBias, and RMSE were estimated using the following equations:
C C = i = 1 n ( R i S ¯ ) ( S i S ¯ ) i = 1 n ( R i R ¯ ) 2 × i = 1 n ( S i S ¯ ) 2 ,
B I A S = i = 1 n ( S i R i ) n ,
r B i a s = i = 1 n ( S i R i ) i = 1 n R i × 100 ,
R M S E = 1 n i = 1 n ( S i R i ) 2 ,
where R i indicates the reference precipitation; R ¯ shows the average of the reference precipitation; S i represents the satellite precipitation; S ¯ shows the average of satellite precipitation; and n represents the total number of observations from the gauges/satellite-based products.
A satellite-based product is regarded as perfect if the BIAS and RMSE are zero, and the CC is 1. Previous studies [54,55] have defined the threshold values of rBIAS and CC for the acceptable performance of precipitation products. According to those studies, the performance of a precipitation product is satisfactory if the estimated value of rBias is within the range of −10% to 10% and CC is higher than 0.7. The positive/negative values of BIAS represent the overestimation/underestimation of precipitation magnitude.
The probability density function (PDF) of daily precipitation events recorded by the reference gauges and three satellite products (3B42V7, IMERG-V05, and IMERG-V06) was assessed at different thresholds. In this study, the thresholds of daily precipitation rates were selected by following the guidelines of the World Meteorological Organization (WMO). The PDFs were evaluated for the entire study domain and for the five sub-regions.
The POD was estimated to analyze the fraction of precipitation events that were accurately reported by the satellite product to the total events recorded by the gauging station. The FAR was computed to describe the ratio of precipitation events that were falsely reported by the product to the total number of events reported by that product. The CSI was estimated to know the ratio of precipitation events that were accurately reported by the product to the total number of recorded and reported events. A high value of POD indicates a better detection skill of a precipitation product, a high value of FAR indicates a high ratio of falsely detected events, and a high value of CSI indicates a high ratio of accurately detected events. In this analysis, the threshold value for the estimation of POD, FAR, and CSI was selected as 1 mm/day, following [18,39].
The mathematical expressions for POD, FAR, and CSI are presented below:
P O D = H H + M ,
F A R = F H + F ,
C S I = H H + F + M .
In these equations, H indicates the total number of events when a precipitation product was successful in capturing the occurrence of precipitation recorded by the reference station; F is the total number of events that were falsely represented by the precipitation product; and M represents the total number of events that were missed by the precipitation product. The perfect values for both POD and CSI are unity, while the perfect value for FAR is zero.
Moreover, Taylor diagrams were used to provide a concise summary of the performances of the SPPs with reference to the gauge-based data. These mathematical diagrams are able to display the relative skill of SPPs by exploiting the relationship between CC and normalized RMSE and standard deviation (SD) [56]. In these fan-shaped diagrams, the angular coordinates represent the CC values, concentric semi-circles indicate the RMSE values, and radical coordinates show the values of SD. In these diagrams, a lesser distance between the reference point and satellite point represents a better performance of that product. The performance of a satellite-based precipitation product was considered satisfactory if its CC value was higher than 0.70 and its value of normalized RMSE was lower than 0.50 [57].

3. Results

3.1. Ability of Satellite Products to Represent. the Spatiotemporal Variability of Precipitation

Figure 3 demonstrates the comparison of the spatial variation of average daily precipitation obtained from the in situ gauging stations and three SPPs over the entire study domain from June 2014 to December 2017. A strong influence of local topographic transitions on the magnitude of daily precipitation was found. The spatial distribution of average daily precipitation from all data sources (gauge-based and satellite-based) showed higher magnitudes of precipitation over relatively high altitudes. The magnitude of daily precipitation was less over the intermountainous areas. Compared to other sub-regions of the Tianshan Mountains, the average daily precipitation was highest in the Yili Valley (1.25 mm/day). The southern fringe of the study domain had lower precipitation. Gauge-based records showed a gradual decrease in the average daily precipitation amounts from the northwest to the southeast. Similar distributions of average daily precipitation in the Tianshan Mountains were found in a previous study [41]. Generally, all SPPs were able to capture the spatial distribution of precipitation, albeit SPPs showed considerable overestimation/underestimation of precipitation amounts at different stations.
Figure 4 shows the comparison of temporal variations of average daily precipitation obtained from the in situ gauging stations and three SPPs in the study domain. The time series of average daily precipitation was estimated by taking an average of daily data from the gauges, IMERG-V05, IMERG-V06, and 3B42V7 for the period from June 2014 to December 2017. Previously, Palomino-Angel et al. [10] used the same method to compare the reference and satellite-based mean daily precipitation over northwestern South America. Visual inspection of the results suggests that all SPPs were generally able to reproduce the temporal variation of observed precipitation. However, two months (July and September) of high-intensity precipitation were identified; these months were captured well by all SPPs. However, observed daily precipitation data (from gauges) varied more than the estimated precipitation data (from SPPs). Gauge-based daily precipitation varied between 0.00 and 5.95 mm/day, with an average of 0.65 mm/day. In comparison, the precipitation estimates from the SPPs varied between 0.00 and 4.08 mm/day (average daily = 0.67 mm/day) for IMERG-V05, between 0.00 and 4.03 mm/day (average daily = 0.64) for IMERG-V06, and between 0.00 and 4.95 mm/day (average daily = 0.61 mm/day) for 3B42V7.

3.2. Performance of Satellite Products at Monthly Scale

Figure 5 provides a summary of the performances of three SPPs over the entire Tianshan Mountains domain and its five sub-regions in the form of Taylor diagrams. Generally, the degree of correspondence between the monthly precipitation data from the gauging stations and three precipitation products (IMERG-V05, IMERG-V06, and 3B42V7) was better over the entire study domain, Eastern Tianshan, and Western Tianshan with CC > 0.90 and normalized RMSE < 0.50. In contrast, the performance of all SPPs was poor over the Boertala Valley with CC < 0.80 and normalized RMSE > 0.50. Compared to the 3B42V7 data, the precipitation estimates from both IMERG products (IMERG-V05 and IMERG-V06) showed good agreement with the reference data over the Middle Tianshan and Yili Valley. Overall, the GPM-based products showed clear improvements in CC and considerable reduction in RMSE compared to the TRMM-based product (3B42V7). Comparison of the accuracies of both IMERG products over the studied region revealed that the improvement in precipitation estimation skill of IMERG-V06 was not considerable compared to the IMERG-V05.
Figure 6 displays the relative biases (%) computed for three SPPs against in situ monthly data over the entire study domain and considered sub-regions. Considerable inconsistencies in the performance (in terms of relative bias) of SPPs were found in different sub-regions. All SPPs were able to provide reliable estimates of precipitation over the entire domain and Eastern Tianshan with rBias lower than 10%. Conversely, all SPPs failed to provide reliable estimates of precipitation over the Boertala and Yili Valleys, with rBias higher than 10%. Both IMERG products performed poorly over Western Tianshan with rBias (higher than 10%), whereas the performance of 3B42V7 was not acceptable over the Middle Tianshan due to the considerable underestimation of precipitation amount.
Figure 7 shows the variations in the values of CC, RMSE, and BIAS computed for the IMERG-V05, IMERG-V06, and 3B42V7 products at monthly scale in the entire study domain and sub-regions. Compared to the TRMM-based product, both IMERG products showed considerable improvements in CC and RMSE, but improvements in BIAS were not evident. Generally, the box lengths of CC for the 3B42V7 product were greater than the lengths for both IMERG products for the entire spatial domain (Figure 7a), which indicated that the agreement of reference data with the 3B42V7 data was not consistent. The box lengths of CC for IMERG-V06 were shorter than other products for the entire domain, Eastern Tianshan, Middle Tianshan, and Yili Valley, which indicated relatively higher consistency and linear correlation of IMERG-V06 data with the reference data. In terms of variation in the estimation of precipitation amounts, the 3B42V7 performed better than both IMERG products over the entire domain, Middle Tianshan, and Yili Valley, as witnessed by shorter box lengths of BIAS for 3B42V7 in those regions (Figure 7b). In terms of RMSE, the performance of the latest version of IMERG (IMERG-V06) was slightly better than IMERG-V05 and 3B42V7 products (Figure 7c).
Figure 8 shows the comparisons of CC, BIAS, and RMSE calculated at each gauging station for three SPPs at a monthly scale. Compared to the 3B42V7 data, the correlations between the gauge-based observations and precipitation estimates from both IMERG products were generally higher at most of the stations. Generally, values of CC were lower over the southern fringe of the Eastern Tianshan and the northern fringe of Middle Tianshan (Figure 8a–c), where average precipitation was comparatively low. Comparisons of both versions of IMERG showed no significant improvement in CC of version 6 as compared to that of version 5. Spatial distribution of the values of BIAS of three SPPs indicated that all products were less biased with the reference data over the southern fringe of the Tianshan Mountains. Most of the negative values of BIAS were found in the Boertala Valley. Generally, both IMERG products were more biased compared to the 3B42V7 product (Figure 8d–f). Likewise CC, no considerable enhancement in the BIAS of IMERG-V06 was witnessed as compared to the IMERG-V05 product. Compared to the 3V42V7 product, IMERG products generally showed slightly smaller values of RMSE (Figure 8g–i).

3.3. Performance of Precipitation Products at Daily Scale

The accuracies of three SPPs were evaluated at daily scale with reference to the gauge-based data in the Tianshan Mountains. Figure 9 shows the relative agreements of IMERG-V05, IMERG-V06, and 3B42V7 products with the daily reference data for the entire spatial domain and for five sub-regions. For all considered regions, the degree of correspondence between the reference and IMERG-based products was higher than that for the 3B42V7 product. The values of CC for the 3B42V7 product were lower than 0.70 for all spatial domains, which advocated that the daily estimates from the 3B42V7 were less consistent. Higher values of RMSE (>0.70) for the 3B42V7 product also revealed its poor performance for all considered regions. The CC values for both IMERG products were similar for all regions, which indicated that the improvement in CC from IMERG-V05 to IMERG-V06 was not considerable. Likewise CC, no significant improvement in RMSE from IMERG-V05 to IMERG-V06 was noticed. The daily precipitation estimates from all SPPs showed relatively worse agreements with the reference data for the Western Tianshan and Boertala Valley, as indicated by lower values of CC (<0.70) and higher values of RMSE (>0.75).
Figure 10 displays the spatial variations in the CC, RMSE, and BIAS calculated for the daily precipitation estimates from IMERG-V05, IMERG-V06, and 3B42V7 over the entire spatial domain and five sub-regions. It shows that both IMERG products performed better than the 3B42V7 product in terms of CC and RMSE, while enhancements in BIAS from TRMM to GPM were not evident for the Tianshan Mountains. Comparisons of the boxplots of CC showed that the precipitation estimate from both IMERG products had relatively better consistency and higher linear correlations with the gauge-based data, which indicated a clear improvement in CC from TRMM- to GPM-based daily precipitation estimates. Comparison of the boxplots of BIAS shows that both IMERG products had higher uncertainties in the estimations of accurate daily precipitation amounts as compared to the 3B42V7 product, except for the Boertala Valley. Comparisons of the boxplots of performance measures for both IMERG products revealed that the improvements in CC, BIAS, and RMSE from IMERG-V05 to IMERG-V06 were not evident at the daily scale.

3.4. Spatial Distribution of Key Quality Measures

Figure 11 presents the spatial variation of BIAS, CC, and RMSE for the IMERG-V05, IMERG-V06, and 3B42V7 products at a daily scale over the Tianshan Mountains. The inverse-distance weighting (IDW) technique was used to interpolate the results of key quality measures at the locations of reference gauges. Substantial spatial variations in the values of all measures were found in the different spatial domains. Generally, all SPPs showed a considerable underestimation of precipitation amounts in the Yili Valley, Middle Tianshan, and in the western fringe of the East Tianshan (Figure 11a–c). The spatial patterns of BIAS for all SPPs were similar in the East Tianshan, Middle Tianshan, and Yili Valley. The 3B42V7 product showed considerable overestimation over the western fringe of the Boertala Valley, while both IMERG products overestimated the precipitation over the central parts of Western Tianshan. The spatial patterns of BIAS for both IMERG products were generally similar in the entire study domain. The spatial patterns of CC for all SPPs were comparable in the entire study domain (Figure 11d–f), albeit the consistency of 3B42V7 product in terms of CC was poorer than both IMERG products. All SPPs exhibited relatively higher CC in the Yili Valley, Middle Tianshan, and East Tianshan. The precipitation estimates from all SPPs exhibited poor agreement with the reference data in the West Tianshan and Boertala Valley. The spatial variations in the values of RMSE for all products were consistent with the spatial patterns of their BIAS values in the study domain. Analysis of the spatial variation of the evaluation measures indicated significant enhancements in the precipitation estimates of IMERG products as compared to the 3B42V7 product, but the advantages in the precipitation retrievals from the latest product of IMERG-V06 compared to its predecessor IMERG-V05 were not evident.
The skill of SPPs in capturing the occurrence of precipitation events was illustrated in terms of POD, CSI, SR (1-FAR), and BIAS. We used the Roebber performance diagram (known as a performance diagram) to represent the geometric relationship between these four quality measures. Many researchers have utilized this diagram to elaborate the performance of remotely sensed precipitation estimates in different regions, such as Pakistan [11], Egypt [2], and Brazil [58,59]. In a performance diagram, if the values of POD, SR, CSI, and BIAS for an SPP are closer to unity, then the performance of that SPP is considered as reliable. Figure 12 shows the relative abilities of IMERG-V05, IMERG-V06, and 3B42V7 products against daily reference data in the entire study domain and considered sub-regions. In all spatial domains, both IMERG products showed better performance than the 3B42V7 product, as indicated by relatively closer positions of IMERG-V05 and IMERG-V06 to the reference point. The enhancement in precipitation detection skills of the IMERG products was mainly due to the increase of POD and SR. All SPPs were able to detect the occurrence of precipitation events in the entire study domain. Conversely, the performance of all SPPs was poor in the Boertala Valley, albeit their POD values were greater than 0.70. Interestingly, as with other quality measures, no considerable enhancements in the quality measures (POD, SR (1-FAR), CSI, and BIAS) for IMERG-V06 were noticed as compared to the values of these measures for IMERG-V05 for all spatial domains.

3.5. Analysis of Probability Density Function

Figure 13 displays the probability density function (PDF) of daily precipitation events recorded by in situ gauging stations and three SPPs in the entire study domain and considered sub-regions for the period from June 2014 to December 2017. Results indicated that the frequency of tiny precipitation events (≤1 mm/day) was significantly higher than other precipitation intensity events in the Tianshan Mountains. The proportion of tiny precipitation events observed by rain gauges was 82.22% of total precipitation events in the Tianshan Mountains (Figure 13a). The frequency of the occurrence of the light precipitation events (1–2 mm/day) was sharply decreased to 9.85% of total events. The frequency of moderate (2–10 mm/day) precipitation events observed by rain gauges was 7.93%. No heavy precipitation events (>10 mm/day) over the entire study region were recorded by gauging stations. The performances of all SPPs in capturing the occurrence of precipitation events at different intensities were comparable for the entire study domain, Eastern Tianshan, Middle Tianshan, and Western Tianshan. Generally, all SPPs were able to detect the tiny precipitation events over all considered spatial domains, except for the Boertala Valley, where all SPPs underestimated the occurrence of tiny precipitation events by 14.23 %, 12.32%, and 27.46% for IMERG-V05, IMERG-V06, and 3B42V7, respectively. The frequencies of light precipitation events over the entire domain detected by the IMERG-V05, IMERG-V06, and 3B42V7 products were 13.05%, 12.81%, and 13.37%, respectively, which revealed that the occurrence of the light precipitation was slightly overestimated by all of the SPPs. The skill of all SPPs in representing the light precipitation over the Eastern Tianshan was very poor, as witnessed by considerable overestimations by all products (Figure 13b). The performances of all SPPs in capturing precipitation events at different intensities over the Boertala Valley were very poor. Over the Yili Valley, 3B42V7 performed better than both IMERG products (Figure 13f).

4. Discussion

Previously, several studies have reported the performance of TRMM- and GPM-based precipitation products in different topographic and climatic conditions [7,11,31,34,51,59,60,61,62]. Most of these studies concluded that the accuracy of precipitation retrieval algorithms used in the GPM and TRMM was strongly associated with the regional climatic system and topography. For example, Kim et al. [62] compared the error characteristics of 3B42V7 and IMERG-V03 products over different topographic conditions in East Asia and found that the accuracy of both products was strongly affected by the regional topography. Anjum et al. [11] reported that the performance of the IMERG-V04 product was better than the 3B42V7 for a complex terrain—the Himalayan Range of Pakistan. Wang et al. [39] compared the performance of IMERG-V05 and 3B42V7 products in the northeastern region of Tibetan Plateau of China and found that both regional climatic system and topography influenced the performance of both products.
In the present study, we evaluated the performance of the latest version 6 (V06) of the GPM-based Final Run precipitation product (IMERG-V06) and compared it with its predecessor IMERG-V05 and the TRMM-based research product (3B42V7) in the Tianshan Mountains of China. All SPPs were assessed against 37 in situ gauging stations at different spatial (point-to-pixel, sub-regional, and regional) and temporal (daily and monthly) scales for the period from June 2014 to December 2017. Our findings revealed evidence of the significant influence of the regional topographic and climatic conditions on the relative performance of the GPM and TRMM products, which were consistent with previous assessments of these products in mountainous regions [11,34,39]. All SPPs were able to track the spatial variation of observed precipitation. Compared to the 3B42V7 product, the correlation between the precipitation estimates retrieved from the IMERG products and the gauge-based observations were higher at most of the observation stations. However, both IMERG products showed the best values of CC at the stations over the relatively lower altitudes where the 3B42V7 product displayed good values of CC with the reference data. The spatial distribution of BIAS values revealed that both IMERG products were more biased with the reference data over the high altitudes as compared to the 3V42V7 product. Similar performance of IMERG and 3B42V7 products over the mountainous domain of Hexi region was reported by Wang et al. [39]. Compared to the daily and monthly estimates of 3B42V7, both IMERG products exhibited considerable enhancements in CC, RMSE, POD, and CSI. Such enhancements in GPM-based products were also reported in Singapore [35], Pakistan [11], Myanmar [40], Brazil [51], and China [39]. Improvements in the key performance measures of both IMERG products might be associated with improvements in the spatiotemporal resolution. Although both IMERG products showed better agreement with the gauge-based observations as compared to the 3B42V7 product, both IMERGs were relatively more biased than the 3B42V7 product. Similar behavior of IMERG and 3B42V7 products in the mountainous regions was previously reported in many studies [11,39]. The performance of both IMERG products in terms of precipitation detection skill was better than that of the 3B42V7. The retrieval algorithms of both IMERG products are able to report precipitation estimates at a 30-min time interval with a better skill in capturing short-duration precipitation events, while precipitation retrieval algorithms of TRMM precipitation products are able to provide precipitation information at a 3-h time interval. The retrieval of precipitation information at shorter time interval is very useful in the representation of tiny (0–1 mm/day) and light (1–2 mm/day) events that are common in the North-Western mountainous regions of China. Due to a comparatively coarser data retrieval period, the TRMM-based precipitation retrieval algorithms are unable to represent some of the short-duration precipitation events, which caused a comparatively poor performance of the 3B42V7 product.
All SPPs showed better performance at a monthly scale as compared to a daily scale. A possible explanation of this finding is the correction of TRMM- and GPM-based products with reference to the monthly precipitation records of the GPCC. Comparisons of the results of all performance measures for the Final Run products of IMERG version 6 (V06) and for its predecessor version 5 revealed that the performance of both products was comparable. Although several major improvements (a new morphing scheme, refinement in the CMORPH-Kalman filter, and improvements in the calibration) has been incorporated in the retrieval algorithm of IMERG-V06, no significant enhancements in the precipitation estimates retrieved from IMERG-V06 were found compared to the IMERG-V05 in the high mountains covered with snow/ice. The comparable performances of IMERG-V06 and IMERG-V05 over the Tianshan Mountains might be due to the dominant performance of IR datasets in both versions over the snow/ice dominated regions [63].

5. Conclusions

This study presented the performance of daily and monthly precipitation estimates retrieved from the most recent Final Run product of IMERG-V06 with reference to the in situ gauge-based precipitation records over the Chinese Tianshan Mountains in Central Asia. For comparison, the performance of IMERG-V05 and 3B42V7 precipitation products were also assessed at the same spatiotemporal scales for the period from June 2014 to December 2017. The main findings of this study are as follows:
  • All SPPs (3B42V7, IMERG-V05, and IMERG-V06) were well trained to capture the spatiotemporal variability of daily precipitation over the Tianshan Mountains, which indicated that these products could be used for understanding the precipitation variability over the Tianshan Mountains.
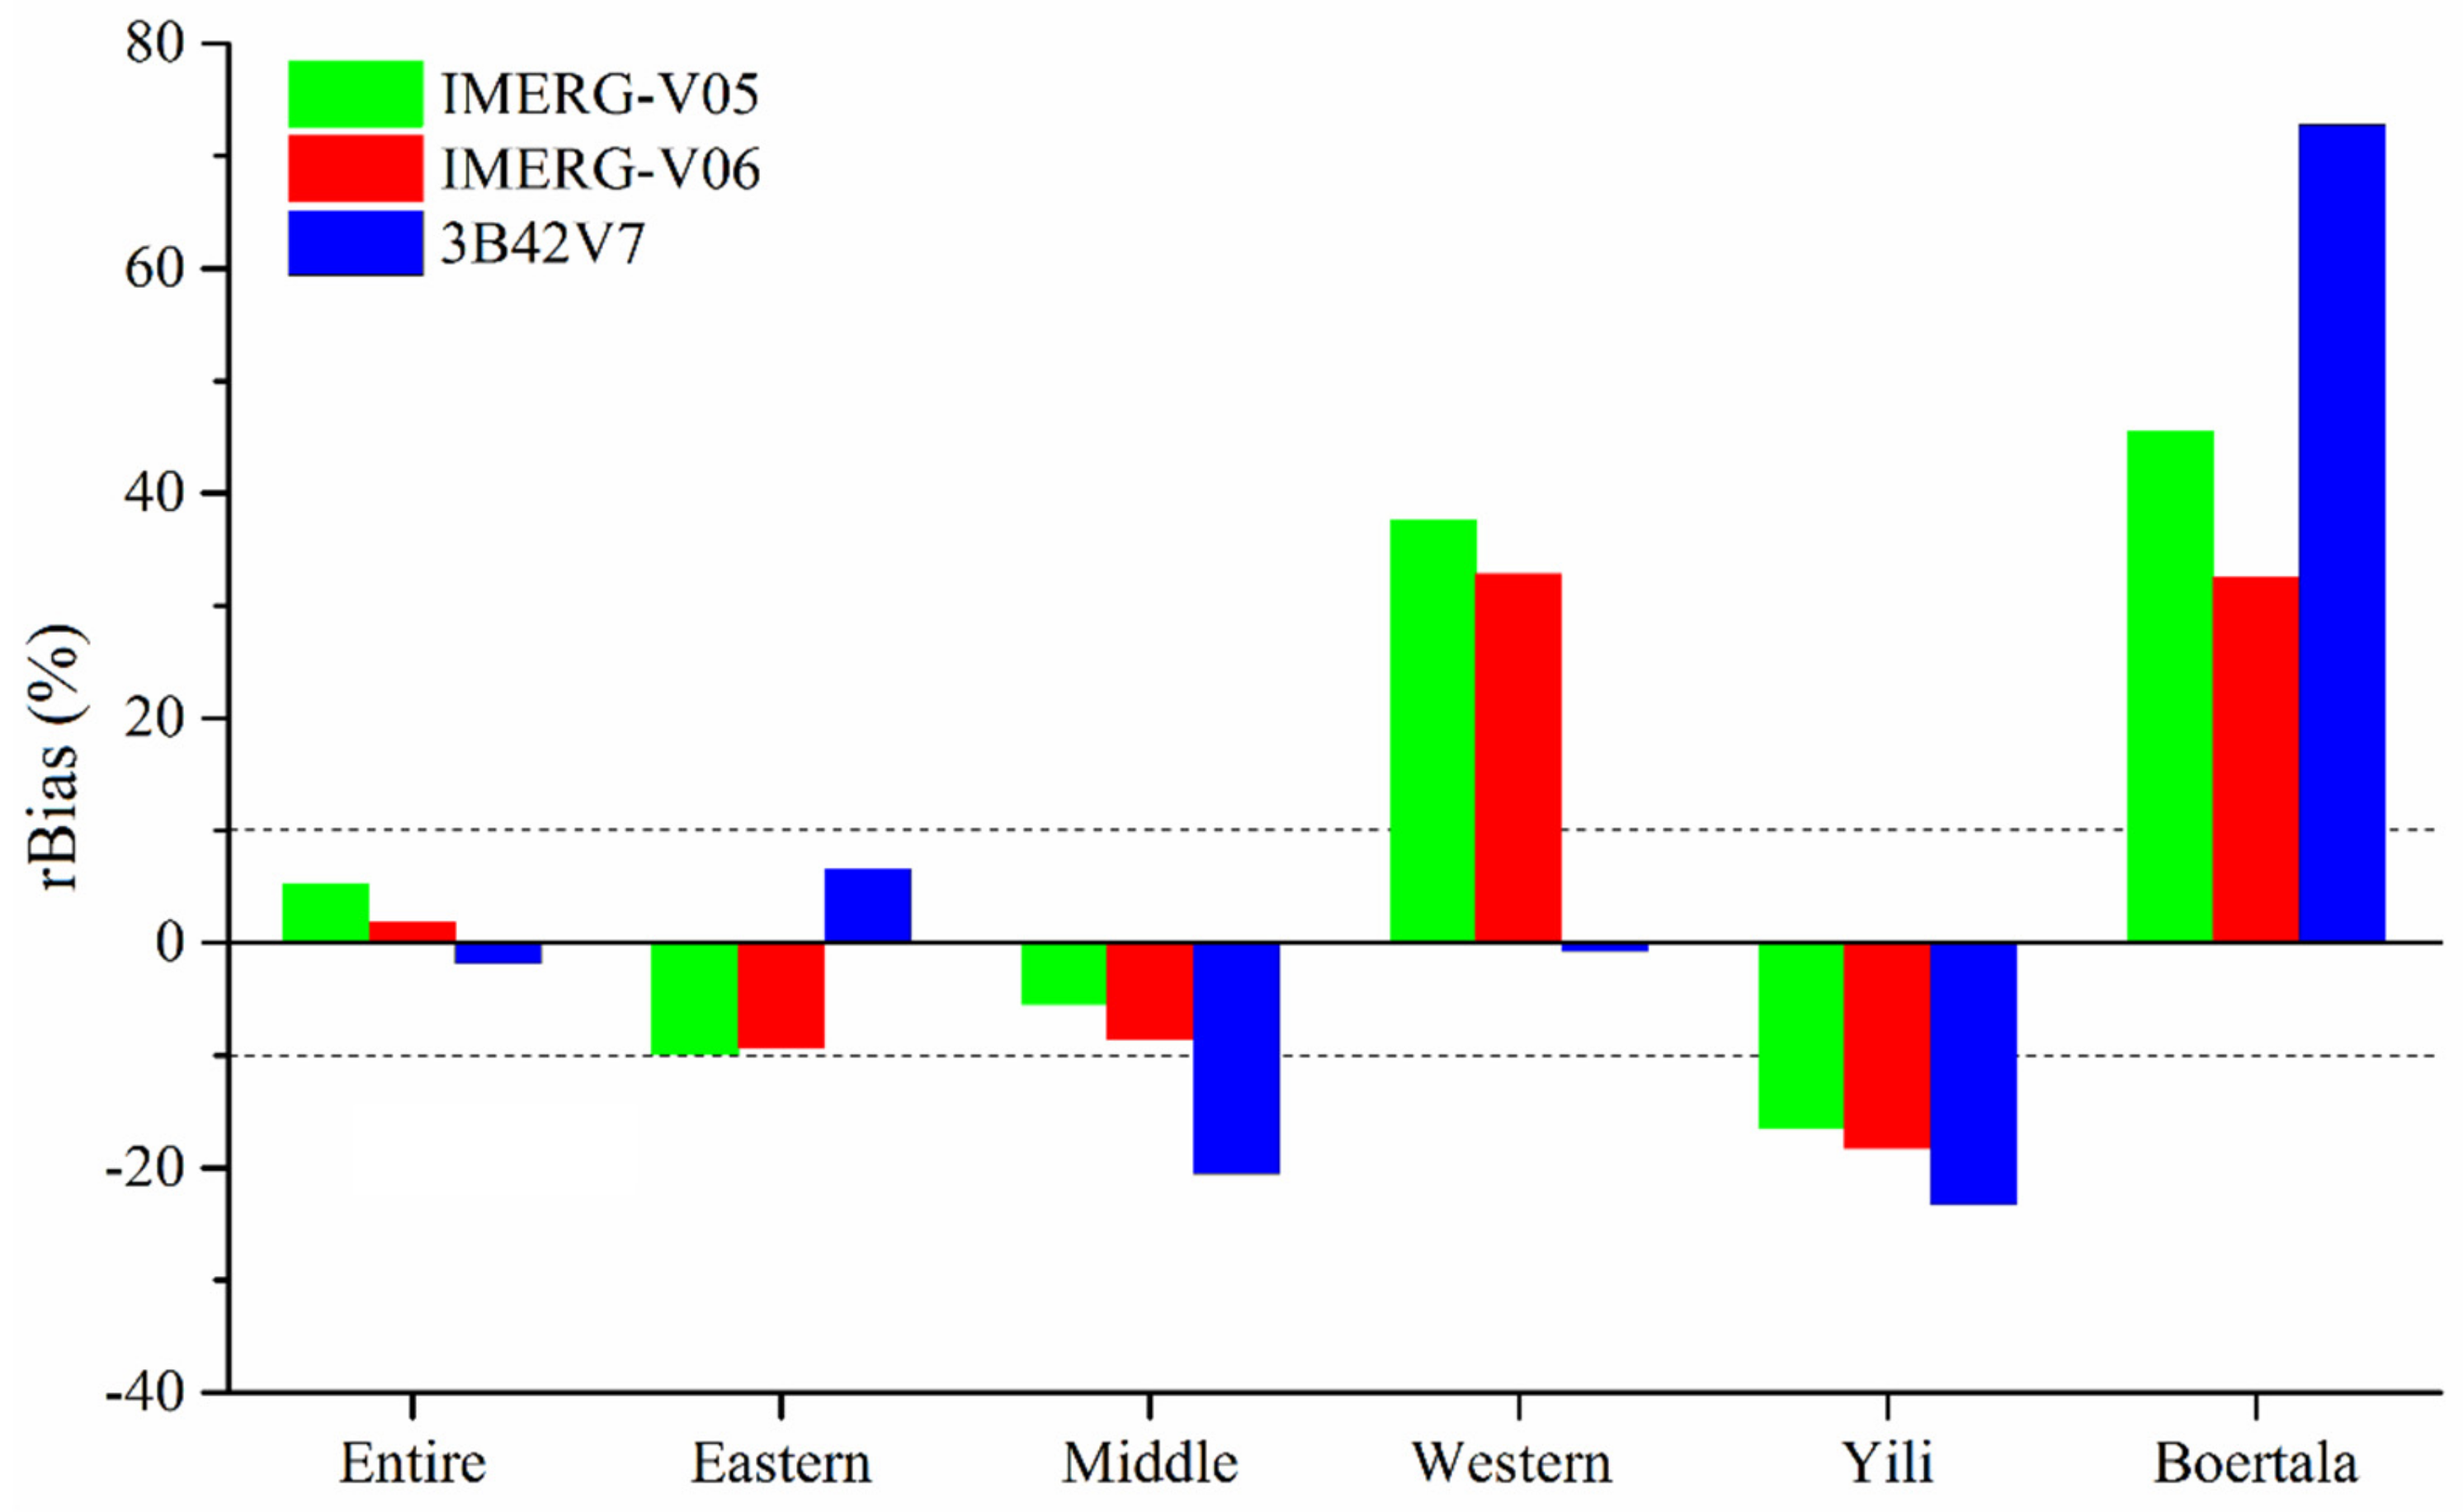
  • All SPPs showed better performance on a monthly scale as compared to a daily scale for all spatial domains. The overall best performance of monthly precipitation estimates from all satellite products was obtained for the entire study domain and East Tianshan, with CC values higher than 0.90, normalized RMSE values lower than 0.50, and rBias values between 10% and −10%.
  • Compared to the daily and monthly precipitation estimates from the 3B42V7 product, the estimates from both IMERG products presented overall better agreement with the reference data at both temporal scales. Both IMERG products showed significant superiority in terms of CC and RMSE; however, enhancement in the BIAS (rBias) of both IMERG products was not evident as compared to the 3B42V7 product.
  • The performance of all SPPs was significantly influenced by the spatial scale. All SPPs showed comparatively better performance for the large spatial domains (i.e., entire Tianshan, East Tianshan, and West Tianshan) as compared to the small-scale regions (i.e., Middle Tianshan, Boertala Valley, and Yili Valley). Thus, application of the precipitation data obtained from the IMERG-V05, IMERG-V06, and 3B42V7 products in small-scale regions (e.g., watersheds) can cause uncertainties in the hydrometeorological simulations.
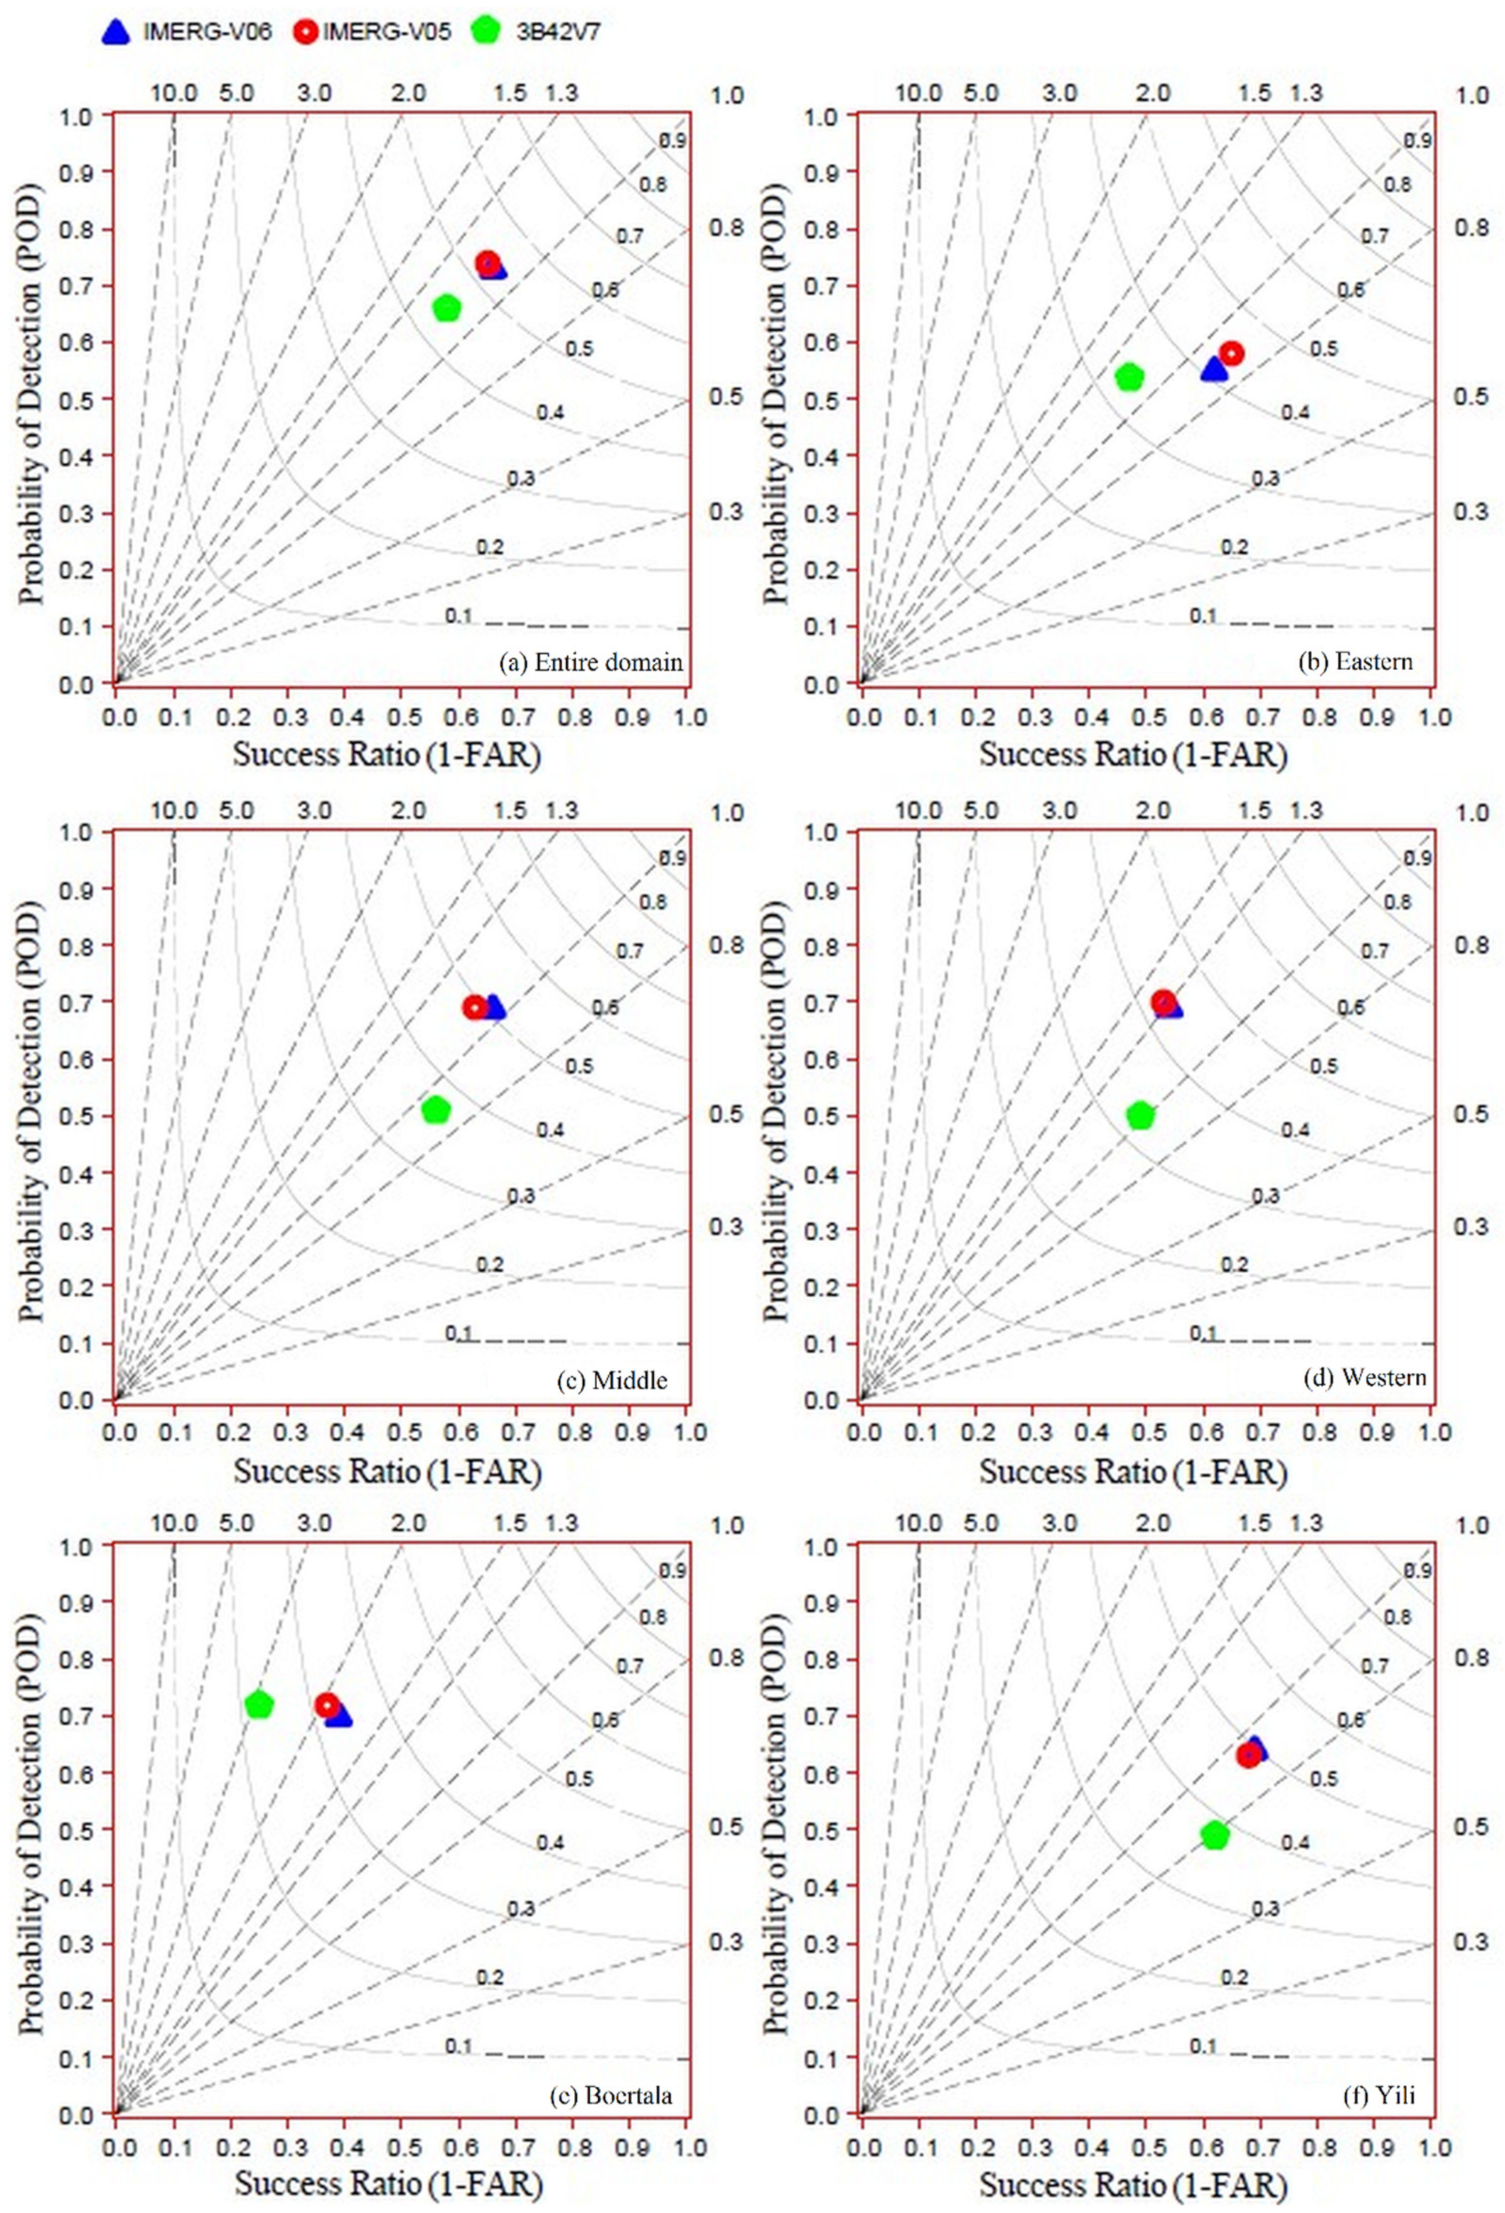
  • The precipitation detection skill of all SPPs was region dependent. All SPPs showed good values of POD (> 0.65), SR (> 0.55), and CSI (> 0.45) for the entire spatial domain. Generally, the precipitation detection skill of IMERG-V05 and IMERG-V06 was better than that of the 3B42V7 product.
  • The proportions of tiny (0–1 mm/day), light (1–2 mm/day), moderate (2–10 mm/day), and heavy (>10 mm/day) precipitation events recorded by the gauging stations in the Tianshan Mountains were 82.2%, 9.9%, 7.9%, and 0.0 %, respectively. The performance of all SPPs in capturing the tiny precipitation events over the Tianshan Mountains was reliable, but all SPPs overestimated the light precipitation events. The performance of the 3B42V7 product in capturing the moderate precipitation events was relatively better than that of both IMERG products.
  • Comparison of the performance of both IMERG products revealed that the transition from the IMERG-V05 to IMERG-V06 constituted no significant enhancement in the estimation of precipitation over the Tianshan Mountains.
The findings of this preliminary evaluation of the latest Final Run product of GPM revealed that the IMERG-V06 failed to outperform its predecessor IMERG-V05 in the Tianshan Mountains, albeit IMERG products outperformed the 3B42V7 product. It was deduced that the spatial scale, regional climatic system, and topography had strong influences on the accuracy of the SPPs. Although the values of CC were higher and RMSEs were lower, both IMERG products were uncertain in providing accurate daily and monthly precipitation amounts in three western parts (Boertala Valley, Yili Valley, and West Tianshan) of the Tianshan Mountains. We recommend the use of precipitation estimates from IMERG-V05, IMER-V06, and 3B42V7 products for understanding the precipitation trends for the entire Tianshan region and East Tianshan. Nevertheless, caution should be taken when utilizing precipitation data of both IMERG products for hydrological and related applications in the western parts (Boertala Valley, Yili Valley, and West Tianshan) of the study domain.

Author Contributions

Conceptualization, M.N.A., Y.D., and D.S.; Data curation, M.N.A., Y.D., D.S., H.H., and M.Y.; Formal analysis, M.N.A. and M.Y.; Funding acquisition, Y.D. and D.S.; Investigation, M.N.A.; Methodology, M.N.A. and Y.D.; Project administration, M.N.A., I.A., Y.D., and D.S.; Resources, Y.D., D.S., and H.H.; Software, M.N.A., I.A., M.Z., and M.W.I.; Supervision, M.N.A., Y.D., D.S., and K.S.; Validation, I.A., M.Z., K.S., M.W.I., and M.Y.; Visualization, Y.D., D.S., M.Z., M.W.I., K.S., H.H., and M.Y.; Writing—original draft, M.N.A.; Writing—review & editing, M.N.A., I.A., Y.D., D.S., M.Z., M.W.I., and K.S.

Funding

This study was funded by The Ministry of Science and Technology (Grant # 2018YFE010010002 & 2018FY100502), the International Partnership Program of Chinese Academy of Sciences (Grant # SKLCS-ZZ-2019 & 131C11KYSB20160061), and the National Natural Science Foundation of China (Grant # 41730751, 41950410575 & 41671066).

Acknowledgments

We are thankful to the China Meteorological Administration (CMA), NASA, and JAXA for providing precipitation data.

Conflicts of Interest

The authors declare no conflicts of interest.

References

  1. Qin, Y.; Chen, Z.; Shen, Y.; Zhang, S.; Shi, R. Evaluation of satellite rainfall estimates over the Chinese Mainland. Remote Sens. 2014, 6, 11649–11672. [Google Scholar] [CrossRef]
  2. Nashwan, M.S.; Shahid, S.; Wang, X. Assessment of Satellite-Based Precipitation Measurement Products over the Hot Desert Climate of Egypt. Remote Sens. 2019, 11, 555. [Google Scholar] [CrossRef]
  3. Chen, C.; Chen, Q.; Duan, Z.; Zhang, J.; Mo, K.; Li, Z.; Tang, G. Multiscale comparative evaluation of the GPM IMERG v5 and TRMM 3B42 v7 precipitation products from 2015 to 2017 over a climate transition area of China. Remote Sens. 2018, 10, 944. [Google Scholar] [CrossRef]
  4. Porcù, F.; Milani, L.; Petracca, M. On the uncertainties in validating satellite instantaneous rainfall estimates with raingauge operational network. Atmos. Res. 2014, 144, 73–81. [Google Scholar] [CrossRef]
  5. Xu, M.; Kang, S.; Wu, H.; Yuan, X. Detection of spatio-temporal variability of air temperature and precipitation based on long-term meteorological station observations over Tianshan Mountains, Central Asia. Atmos. Res. 2018, 203, 141–163. [Google Scholar] [CrossRef]
  6. Gebere, S.B.; Alamirew, T.; Merkel, B.J.; Melesse, A.M. Performance of high resolution satellite rainfall products over data scarce parts of eastern ethiopia. Remote Sens. 2015, 7, 11639–11663. [Google Scholar] [CrossRef]
  7. Anjum, M.N.; Ding, Y.; Shangguan, D.; Tahir, A.A.; Iqbal, M.; Adnan, M. Comparison of two successive versions 6 and 7 of TMPA satellite precipitation products with rain gauge data over Swat Watershed, Hindukush Mountains, Pakistan. Atmos. Sci. Lett. 2016, 17, 270–279. [Google Scholar] [CrossRef] [Green Version]
  8. Beck, H.E.; Pan, M.; Roy, T.; Weedon, G.P.; Pappenberger, F.; Van Dijk, A.I.J.M.; Huffman, G.J.; Adler, R.F.; Wood, E.F. Daily evaluation of 26 precipitation datasets using Stage-IV gauge-radar data for the CONUS. Hydrol. Earth Syst. Sci. 2019, 23, 207–224. [Google Scholar] [CrossRef] [Green Version]
  9. Huffman, G.J.; Bolvin, D.T.; Nelkin, E.J.; Wolff, D.B.; Adler, R.F.; Gu, G.; Hong, Y.; Bowman, K.P.; Stocker, E.F. The TRMM Multisatellite Precipitation Analysis (TMPA): Quasi-Global, Multiyear, Combined-Sensor Precipitation Estimates at Fine Scales. J. Hydrometeorol. 2007, 8, 38–55. [Google Scholar] [CrossRef]
  10. Palomino-Ángel, S.; Anaya-Acevedo, J.A.; Botero, B.A. Evaluation of 3B42V7 and IMERG daily-precipitation products for a very high-precipitation region in northwestern South America. Atmos. Res. 2019, 217, 37–48. [Google Scholar] [CrossRef]
  11. Anjum, M.N.; Ding, Y.; Shangguan, D.; Ahmad, I.; Ijaz, M.W.; Farid, H.U.; Yagoub, Y.E.; Zaman, M.; Adnan, M. Performance evaluation of latest integrated multi-satellite retrievals for Global Precipitation Measurement (IMERG) over the northern highlands of Pakistan. Atmos. Res. 2018, 205, 134–146. [Google Scholar] [CrossRef]
  12. Duan, Z.; Liu, J.; Tuo, Y.; Chiogna, G.; Disse, M. Evaluation of eight high spatial resolution gridded precipitation products in Adige Basin (Italy) at multiple temporal and spatial scales. Sci. Total Environ. 2016, 573, 1536–1553. [Google Scholar] [CrossRef] [PubMed] [Green Version]
  13. Zeng, Q.; Wang, Y.; Chen, L.; Wang, Z.; Zhu, H.; Li, B. Inter-comparison and evaluation of remote sensing precipitation products over China from 2005 to 2013. Remote Sens. 2018, 10, 168. [Google Scholar] [CrossRef]
  14. Sun, Q.; Miao, C.; Duan, Q.; Ashouri, H.; Sorooshian, S.; Hsu, K.L. A Review of Global Precipitation Data Sets: Data Sources, Estimation, and Intercomparisons. Rev. Geophys. 2018, 56, 79–107. [Google Scholar] [CrossRef] [Green Version]
  15. JAXA, J.A.E.A. USER’ S GUIDE FOR Global Satellite Mapping of Precipitation Microwave-IR Combined Product (GSMaP_MVK), Gauge-calibrated Rainfall Product (GSMaP_Gauge) Reanalysis Products (GSMaP_RNL), and Gauge-calibrated Reanalysis Product (GSMaP_Gauge) 2017, 8.
  16. Joyce, R.J.; Janowiak, J.E.; Arkin, P.A.; Xie, P. CMORPH: A Method that Produces Global Precipitation Estimates from Passive Microwave and Infrared Data at High Spatial and Temporal Resolution. J. Hydrometeorol. 2004, 5, 487–503. [Google Scholar] [CrossRef]
  17. Soroosh, S.; Kuo-Lin, H.; Xiaogang, G.; Hoshin, V.G.; Bisher, I.; Braithwaite, D. Evaluation of PERSIANN System Satellite-Based Estimates of Tropical Rainfall. Bull. Am. Meteorol. Soc. 2000, 0477, 2035–2045. [Google Scholar] [CrossRef]
  18. Anjum, M.N.; Ding, Y.; Shangguan, D.; Liu, J.; Ahmad, I.; Ijaz, M.W.; Khan, M.I. Quantification of spatial temporal variability of snow cover and hydro-climatic variables based on multi-source remote sensing data in the Swat watershed, Hindukush Mountains, Pakistan. Meteorol. Atmos. Phys. 2018. [Google Scholar] [CrossRef]
  19. Junior, C.H.L.S.; Almeida, C.T.; Santos, J.R.N.; Anderson, L.O.; Arag, L.E.O.C.; Silva, B. Spatiotemporal Rainfall Trends in the Brazilian Legal Amazon between the Years 1998 and 2015. Water 2015, 10, 1220. [Google Scholar] [CrossRef]
  20. Wang, X.; Xie, H. A review on applications of remote sensing and geographic information systems (GIS) in water resources and flood risk management. Water 2018, 10, 608. [Google Scholar] [CrossRef]
  21. Tan, M.L.; Tan, K.C.; Chua, V.P.; Chan, N.W. Evaluation of TRMM product for monitoring drought in the Kelantan River Basin, Malaysia. Water 2017, 9, 57. [Google Scholar] [CrossRef]
  22. Yuan, F.; Zhang, L.; Wah Win, K.W.; Ren, L.; Zhao, C.; Zhu, Y.; Jiang, S.; Liu, Y. Assessment of GPM and TRMM multi-satellite precipitation products in streamflow simulations in a data sparse mountainous watershed in Myanmar. Remote Sens. 2017, 9, 302. [Google Scholar] [CrossRef]
  23. Xue, X.; Hong, Y.; Limaye, A.S.; Gourley, J.J.; Huffman, G.J.; Khan, S.I.; Dorji, C.; Chen, S. Statistical and hydrological evaluation of TRMM-based Multi-satellite Precipitation Analysis over the Wangchu Basin of Bhutan: Are the latest satellite precipitation products 3B42V7 ready for use in ungauged basins? J. Hydrol. 2013, 499, 91–99. [Google Scholar] [CrossRef]
  24. Xuan, W.; Fu, Q.; Qin, G.; Zhu, C.; Pan, S.; Xu, Y.P. Hydrological simulation and runoff component analysis over a cold mountainous River Basin in Southwest China. Water 2018, 10, 1705. [Google Scholar] [CrossRef]
  25. Ramarohetra, J.; Sultan, B.; Baron, C.; Gaiser, T.; Gosset, M. How satellite rainfall estimate errors may impact rainfed cereal yield simulation in West Africa. Agric. For. Meteorol. 2013, 180, 118–131. [Google Scholar] [CrossRef]
  26. Tekeli, A.E. Exploring Jeddah floods by tropical rainfall measuring mission analysis. Water 2017, 9, 612. [Google Scholar] [CrossRef]
  27. Gupta, M.; Srivastava, P.K.; Islam, T.; Ishak, A.M. Bin Evaluation of TRMM rainfall for soil moisture prediction in a subtropical climate. Environ. Earth Sci. 2014, 71, 4421–4431. [Google Scholar] [CrossRef]
  28. Huffman, G.J.; Bolvin, D.T.; Braithwaite, D.; Hsu, K.; Joyce, R.; Xie, P.; Yoo, S.H. Algorithm Theoretical Basis Document, Version 4.1: NASA Global Precipitation Measurement (GPM) Integrated Multi-satellitE Retrievals for GPM (IMERG); NASA/GSFC: Greenbelt, MD, USA, 2013.
  29. Guo, H.; Chen, S.; Bao, A.; Behrangi, A.; Hong, Y.; Ndayisaba, F.; Hu, J.; Stepanian, P.M. Early assessment of Integrated Multi-satellite Retrievals for Global Precipitation Measurement over China. Atmos. Res. 2016, 176–177, 121–133. [Google Scholar] [CrossRef]
  30. Chen, F.; Li, X. Evaluation of IMERG and TRMM 3B43 monthly precipitation products over mainland China. Remote Sens. 2016, 8, 472. [Google Scholar] [CrossRef]
  31. Sharifi, E.; Steinacker, R.; Saghafian, B. Assessment of GPM-IMERG and other precipitation products against gauge data under different topographic and climatic conditions in Iran: Preliminary results. Remote Sens. 2016, 8, 135. [Google Scholar] [CrossRef]
  32. Gaona, M.F.R.; Overeem, A.; Leijnse, H.; Uijlenhoet, R. First-Year Evaluation of GPM Rainfall over the Netherlands: IMERG Day 1 Final Run (V03D). J. Hydrometeorol. 2016, 17, 2799–2814. [Google Scholar] [CrossRef]
  33. Rios Gaona, M.F.; Villarini, G.; Zhang, W.; Vecchi, G.A. The added value of IMERG in characterizing rainfall in tropical cyclones. Atmos. Res. 2018, 209, 95–102. [Google Scholar] [CrossRef] [Green Version]
  34. Wei, G.; Lü, H.; Crow, T.W.; Zhu, Y.; Wang, J.; Su, J. Evaluation of Satellite-Based Precipitation Products from IMERG V04A and V03D, CMORPH and TMPA with Gauged Rainfall in Three Climatologic Zones in China. Remote Sens. 2017, 10, 30. [Google Scholar] [CrossRef]
  35. Tan, M.; Duan, Z. Assessment of GPM and TRMM Precipitation Products over Singapore. Remote Sens. 2017, 9, 720. [Google Scholar] [CrossRef]
  36. Retalis, A.; Katsanos, D.; Tymvios, F.; Michaelides, S. Validation of the First Years of GPM Operation over Cyprus. Remote Sens. 2018, 10, 1520. [Google Scholar] [CrossRef]
  37. Fang, J.; Yang, W.; Luan, Y.; Du, J.; Lin, A.; Zhao, L. Evaluation of the TRMM 3B42 and GPM IMERG products for extreme precipitation analysis over China. Atmos. Res. 2019, 223, 24–38. [Google Scholar] [CrossRef]
  38. Huang, C.; Hu, J.; Chen, S.; Zhang, A.; Liang, Z.; Tong, X.; Xiao, L.; Min, C.; Zhang, Z. How Well Can IMERG Products Capture Typhoon Extreme Precipitation Events over Southern China? Remote Sens. 2019, 11, 70. [Google Scholar] [CrossRef]
  39. Wang, X.; Ding, Y.; Zhao, C.; Wang, J. Similarities and improvements of GPM IMERG upon TRMM 3B42 precipitation product under complex topographic and climatic conditions over Hexi region, Northeastern Tibetan Plateau. Atmos. Res. 2019, 218, 347–363. [Google Scholar] [CrossRef]
  40. Yuan, F.; Soe, K.; Jiang, S.; Zhao, C.; Liu, Y.; Ren, L.; Zhu, Y.; Zhang, L. Applications of TRMM- and GPM-Era Multiple-Satellite Precipitation Products for Flood Simulations at Sub-Daily Scales in a Sparsely Gauged Watershed in Myanmar. Remote Sens. 2019, 11, 140. [Google Scholar] [CrossRef]
  41. Yang, M.; Li, Z.; Anjum, M.N.; Gao, Y. Performance Evaluation of Version 5 (V05) of Integrated Multi-Satellite Retrievals for Global Precipitation Measurement (IMERG) over the Tianshan Mountains of China. Water 2019, 11, 1139. [Google Scholar] [CrossRef]
  42. Guo, H.; Chen, S.; Bao, A.; Hu, J.; Gebregiorgis, A.S.; Xue, X.; Zhang, X. Inter-comparison of high-resolution satellite precipitation products over Central Asia. Remote Sens. 2015, 7, 7181–7211. [Google Scholar] [CrossRef]
  43. Ji, X.; Chen, Y. Characterizing spatial patterns of precipitation based on corrected TRMM 3 B 43 data over the mid Tianshan Mountains of China. J. Mt. Sci. 2012, 9, 628–645. [Google Scholar] [CrossRef]
  44. Lu, X.; Tang, G.; Wei, M.; Yang, L.; Zhang, Y. Evaluation of multi-satellite precipitation products in Xinjiang, China. Int. J. Remote Sens. 2018, 39, 7437–7462. [Google Scholar] [CrossRef]
  45. Gao, L.; Wei, J.; Wang, L.; Bernhardt, M.; Schulz, K.; Chen, X. A high-resolution air temperature data set for the Chinese Tian Shan in 1979-2016. Earth Syst. Sci. Data 2018, 10, 2097–2114. [Google Scholar] [CrossRef]
  46. Zhang, X.; Li, X.; Li, L.; Zhang, S.; Qin, Q. Environmental factors influencing snowfall and snowfall prediction in the Tianshan Mountains, Northwest China. J. Arid Land 2019, 11, 15–28. [Google Scholar] [CrossRef]
  47. Ding, Y.; Liu, S.; Li, J.; Shangguan, D. The retreat of glaciers in response to recent climate warming in western China. Ann. Glaciol. 2006, 43, 97–105. [Google Scholar] [CrossRef] [Green Version]
  48. Gao, F.; Zhang, Y.; Chen, Q.; Wang, P.; Yang, H.; Yao, Y.; Cai, W. Comparison of two long-term and high-resolution satellite precipitation datasets in Xinjiang, China. Atmos. Res. 2018, 212, 150–157. [Google Scholar] [CrossRef]
  49. Cai, Y.; Jin, C.; Wang, A.; Guan, D.; Wu, J.; Yuan, F.; Xu, L. Comprehensive precipitation evaluation of TRMM 3B42 with dense rain gauge networks in a mid-latitude basin, northeast, China. Theor. Appl. Climatol. 2016, 126, 659–671. [Google Scholar] [CrossRef]
  50. Anjum, M.N.; Ding, Y.; Shangguan, D. Simulation of the projected climate change impacts on the river flow regimes under CMIP5 RCP scenarios in the westerlies dominated belt, northern Pakistan. Atmos. Res. 2019, 227, 233–248. [Google Scholar] [CrossRef]
  51. Salles, L.; Satgé, F.; Roig, H.; Almeida, T.; Olivetti, D. Seasonal Effect on Spatial and Temporal Consistency of the New GPM-Based IMERG-v5 and GSMaP-v7 Seasonal Effect on Spatial and Temporal Consistency of the New GPM-Based IMERG-v5 and GSMaP-v7 Satellite Precipitation Estimates in Brazil’s Central of the New. Water 2019, 11, 668. [Google Scholar] [CrossRef]
  52. Wang, X.; Ding, Y.; Zhao, C.; Wang, J. Validation of TRMM 3B42V7 rainfall product under complex topographic and climatic conditions over Hexi region in the Northwest Arid Region of China. Water 2018, 10, 1106. [Google Scholar] [CrossRef]
  53. Anjum, M.N.; Ding, Y.; Shangguan, D.; Ijaz, M.W.; Zhang, S. Evaluation of High-Resolution Satellite-Based Real-Time and Post-Real-Time Precipitation Estimates during 2010 Extreme Flood Event in Swat River Basin, Hindukush Region. Adv. Meteorol. 2016, 2016. [Google Scholar] [CrossRef]
  54. Condom, T.; Rau, P.; Espinoza, J.C. Correction of TRMM 3B43 monthly precipitation data over the mountainous areas of Peru during the period 1998-2007. Hydrol. Process. 2011, 25, 1924–1933. [Google Scholar] [CrossRef]
  55. Erfanian, A.; Wang, G.; Yu, M.; Anyah, R. Variations in tropical cyclone frequency response to solar and CO2 forcing in aquaplanet simulations. J. Adv. Model. Earth Syst. 2016, 1411–1431. [Google Scholar] [CrossRef]
  56. Taylor, K.E. Summarizing multiple aspects of model performance in a single diagram. J. Geophys. Res. 2001, 106, 7183–7192. [Google Scholar] [CrossRef]
  57. Satgé, F.; Hussain, Y.; Bonnet, M.P.; Hussain, B.M.; Martinez-Carvajal, H.; Akhter, G.; Uagoda, R. Benefits of the successive GPM based Satellite Precipitation Estimates IMERG-V03, -V04, -V05 and GSMaP-V06, -V07 over diverse geomorphic and meteorological regions of Pakistan. Remote Sens. 2018, 10, 1373. [Google Scholar] [CrossRef]
  58. Oliveira, R.; Maggioni, V.; Vila, D.; Porcacchia, L. Using satellite error modeling to improve GPM-Level 3 rainfall estimates over the central Amazon region. Remote Sens. 2018, 10, 336. [Google Scholar] [CrossRef]
  59. Rozante, J.R.; Vila, D.A.; Chiquetto, J.B.; de Fernandes, A.; Alvim, D.S. Evaluation of TRMM/GPM blended daily products over Brazil. Remote Sens. 2018, 10, 882. [Google Scholar] [CrossRef]
  60. Tan, M.L.; Ibrahim, A.L.; Duan, Z.; Cracknell, A.P.; Chaplot, V. Evaluation of six high-resolution satellite and ground-based precipitation products over Malaysia. Remote Sens. 2015, 7, 1504–1528. [Google Scholar] [CrossRef]
  61. Gilewski, P.; Nawalany, M. Inter-comparison of Rain-Gauge, Radar, and Satellite (IMERG GPM) precipitation estimates performance for rainfall-runoff modeling in a mountainous catchment in Poland. Water 2018, 10, 1665. [Google Scholar] [CrossRef]
  62. Kim, K.; Park, J.; Baik, J.; Choi, M. Evaluation of topographical and seasonal feature using GPM IMERG and TRMM 3B42 over Far-East Asia. Atmos. Res. 2017, 187, 95–105. [Google Scholar] [CrossRef]
  63. Huffman, G.J.; Gsfc, N.; Bolvin, D.T.; Braithwaite, D.; Hsu, K.; Joyce, R.; Kidd, C.; Nelkin, E.J.; Sorooshian, S.; Tan, J. Algorithm Theoretical Basis Document (ATBD) Version 06. Natl. Aeronaut. Sp. Adm. 2019, 1–38. Available online: https://pmm.nasa.gov/sites/default/files/document_files/IMERG_ATBD_V06_0.pdf (accessed on 23 September 2019).
Figure 1. (a) Geographical location of the Tianshan Mountains. (b) Extent and topography of the Tianshan Mountains, boundaries of the sub-regions, and locations of the rain gauges.
Remotesensing 11 02314 g001
Figure 2. Average monthly precipitation over the (a) five sub-regions and (b) entire study domain.
Remotesensing 11 02314 g002
Figure 3. Spatial distribution of average daily precipitation obtained from (a) in situ gauges, (b) IMERG-V05, (c) IMERG-V06, and (d) 3B42V7 over the Tianshan Mountains from June 2014 to December 2017.
Remotesensing 11 02314 g003
Figure 4. Comparison of average daily precipitation time series obtained from the reference gauging stations and three precipitation products ((a) IMERG-V06, (b) IMERG-V05, and (c) 3B42V7) over the entire study domain for the period from June 2014 to December 2017.
Remotesensing 11 02314 g004
Figure 5. Taylor diagrams displaying the relative performances of the monthly precipitation estimates from IMERG-V05, IMERG-V06, and 3B42V7 products for the (a) Entire study domain, (b) Eastern Tianshan, (c) Middle Tianshan, (d) Western Tianshan, (e) Boertala Valley, and (f) Yili Valley. The values of root mean square error (RMSE) are represented by concentric semi-circular green lines.
Remotesensing 11 02314 g005
Figure 6. Relative bias (rBias; %) for three satellite-based precipitation products over the considered regions. Dashed lines represent the thresholds (± 10%) of rBias.
Remotesensing 11 02314 g006
Figure 7. Box plots of (a) correlation coefficient (CC), (b) BIAS, and (c) RMSE for monthly precipitation estimates from IMERG-V05, IMERG-V06, and 3B42V7 products over different spatial domains of Tianshan Mountains. The horizontal lines inside the boxes show the median values and small squares indicate the mean values.
Remotesensing 11 02314 g007
Figure 8. Spatial distribution of CC (ac), BIAS (df), and RMSE (gi) computed for the IMERG-V05, IMERG-V06, and 3B42V7 products at a monthly scale.
Remotesensing 11 02314 g008
Figure 9. Performances of precipitation estimates retrieved from IMERG-V05, IMERG-V06, and 3B42V7 with reference to the daily ground-based measurements for the (a) Entire domain, (b) Eastern Tianshan, (c) Middle Tianshan, (d) Western Tianshan, (e) Boertala Valley, and (f) Yili Valley presented in the form of Taylor diagrams. The concentric semi-circles in green lines show the values of RMSE.
Remotesensing 11 02314 g009
Figure 10. Boxplots of (a) CC, (b) BIAS, and (c) RMSE for three SPPs at daily scale over the entire Tianshan Mountains and considered sub-regions. The horizontal lines inside the boxes show the median values and small squares indicate the mean values.
Remotesensing 11 02314 g010
Figure 11. Spatial distribution of three key performance measures computed for the three SPPs at daily scale: (a) CC, (b) BIAS, and (c) RMSE.
Remotesensing 11 02314 g011
Figure 12. Performance diagrams for the precipitation detection abilities of IMERG-V05, IMERG-V06, and 3B42V7 for the (a) entire study domain, (b) Eastern Tianshan, (c) Middle Tianshan, (d) Western Tianshan, (e) Boertala Valley, and (f) Yili Valley. The straight and curved lines indicate BIAS and critical success index (CSI) values, respectively. The black point represents the perfect scores of all quality measures. FAR: false alarm ratio.
Remotesensing 11 02314 g012
Figure 13. The probability density function (PDF) computed for precipitation data obtained from the in situ gauging stations, IMERG-V05, IMERG-V06, and 3B42V7 at different precipitation intensities in (a) the entire Tianshan Mountains, (b) East Tianshan, (c) Middle Tianshan, (d) West Tianshan, (e) Boertala Valley, and (f) Yili Valley for the period from June 2014 to December 2017.
Remotesensing 11 02314 g013aRemotesensing 11 02314 g013b
Table 1. Characteristics of five sub-regions of the Tianshan Mountains.
SubregionArea (km2)Elevation Range (m)Mean Elevation (m)Gauging Stations
East Tianshan58,850.361203–54262001.6011
Middle Tianshan55,118.301223–51522808.209
Boertala Valley19,062.981173–46852372.304
Yili Valley33,096.751225–45012366.504
West Tianshan87,860.411218–70942542.009

