Article

Spatial Pattern of Soil Erosion Drivers and the Contribution Rate of Human Activities on the Loess Plateau from 2000 to 2015: A Boundary Line from Northeast to Southwest

1
Key Laboratory of Land Surface Patterns and Simulation, Institute of Geographic Science and Natural Resources Research, CAS, No.11, Datun Road, Chaoyang District, Beijing 100101, China
2
University of Chinese Academy of Sciences, No.19, Yuquan Road, Shijingshan District, Beijing 101407, China
*
Author to whom correspondence should be addressed.
Remote Sens. 2019, 11(20), 2429; https://doi.org/10.3390/rs11202429
Submission received: 26 September 2019 / Revised: 17 October 2019 / Accepted: 17 October 2019 / Published: 19 October 2019
(This article belongs to the Section Environmental Remote Sensing)

Abstract

:
The Loess Plateau is one of the most fragile areas in the world, where the problem of soil erosion is particularly prominent. The spatial and temporal variation characteristics and mechanisms of soil erosion in this region have always been hot topics for researchers. In this study, Revised Universal Soil Loss Equation (RUSLE) is used to estimate the soil erosion modulus of the Loess Plateau from 2000 to 2015, the dynamic characteristics of its temporal and spatial variations and driving mechanisms are determined, and meteorological data are combined with remote sensing data to quantitatively calculate the contribution rate of human activities. The results show that from 2000 to 2015, the soil erosion modulus of the Loess Plateau had a downward trend as a whole, with a rate of −0.6408 t/ha/a, but the downward trend gradually slowed down. Precipitation mainly resulted in changes in the soil erosion modulus in the northwestern part of the Loess Plateau, where a significant positive correlation was seen. Meanwhile, the Vegetation Fractional Coverage (VFC) mainly affected the southeastern part, where a significant negative correlation was measured. The human-activity contribution rate was −1.0774 on the Loess Plateau, which means human activities effectively reduced the soil erosion modulus while climate change promoted soil erosion combined with the result of the analysis of variance (ANOVA). “Hilly and gully regions” and “Gully region of Loess Plateau” as the main implementation areas of ecological projects, human activities had contribution rate of 0.5513 and 0.7805 toward the declining of soil erosion, respectively. Interestingly, the spatial differentiation characteristic of the soil erosion driving mechanisms and human contribution rates on the Loess Plateau showed the same boundary line from northeast to southwest, which was well explained by the 400-mm isohyetal line and Hu’s Line. This boundary can guide the geographical layout of the ecological management projects and urban development spaces on the Loess Plateau.

Graphical Abstract

1. Introduction

Soil erosion is the displacement of soil from its formation place caused by external forces such as wind, raindrops, and water scouring, which occur on a point scale [1]. Soil erosion has always been one of the most important issues in ecology and agriculture, especially on the Loess Plateau of China. The “point-edge contact scaffold porous structure” of loess on the Loess Plateau is the primary cause of the loose soil, the development of vertical joints and the strong water permeability therein [2]. Fine-grained materials such as clay, soluble salts, gypsum, and carbonate in the loess consolidate into aggregates when it dries, which imparts it with a relative higher strength; however, it will also disintegrate rapidly after encountering water because of the dissolution and dispersion of minerals, resulting in soil erosion [3,4]. The unique geological environment of the Loess Plateau makes soil erosion extremely prevalent, and it is one of the most vulnerable areas of ecological environment in China [5].
Due to the increase of cultivation areas, the unreasonable use of environmental resources and climate change, soil erosion area on the Loess Plateau has increased in intensity. According to the report of the National Development and Reform Commission (NDRC), People’s Republic of China, the area of the Loess Plateau that is vulnerable to soil erosion is 472,000 km2, accounting for 74.92% of the total. Approximately 91,200 km2 area has a soil erosion modulus over 80 t/ha/a, which is significantly higher than other parts of the world, such as 14.1 t/ha/a in the Mekong River basin [6], 5.5 t/ha/a in cultivated crop lands in Australia [7] and 19–23 t/ha/a in the first land consolidation period in France [8], more than 50% areas of where were under very low and low erosion risk [9], implying that the Loess Plateau has become the most serious area of soil erosion in China, and perhaps even in the world. The resulting land resource degradation and loss [10], frequent flood disasters [11], water pollution [12], etc., have seriously threatened the socio-economic sustainable development of this region and the lower reaches of the Yellow River.
In order to prevent further deterioration by soil erosion on the Loess Plateau, a series of conservation policies and ecological restoration projects have been launched. Since 1986, China has established pilot demonstration areas for the comprehensive control of small watersheds on the Loess Plateau, and summarized the experience and lessons of soil erosion control after more than 30 years of development [13]. Engineering, biological and agricultural technology measures have been combined to form a comprehensive control system in small watersheds, and obtained some good achievements [14]. In addition, China implemented the “Grain for Green Project” in 1999 with the goal of restoring irrational used sloping field above 15° to forests or grasslands [15].
Although there have been considerable qualitative and quantitative research regarding historical changes of soil erosion on the Loess Plateau [15,16], and their driving mechanisms [17,18], the role of human activities and climate change are usually considered separately or qualitatively, and few studies have quantified the contribution rate of human activities. Wei et al. analyzed the small watershed in the Loess Plateau, considered that the Grain for Green Project was the main reason for the decrease in the soil erosion in the Fangta watershed [19]. Sun et al. concluded that through the plant litter created by the Grain for Green Project, the rill erodibility of the 40-year-old black locust stand was reduced by 86.3% [20]. Yu et al. suggested that climate change, especially precipitation has a strong influence on soil erosion in the Loess Plateau [21]. These years, scholars have recognized that the changes in soil erosion on the Loess Plateau are affected by both humans and climate, but how to accurately characterize each role in the process of this joint influence was not considered. Therefore, by calculating the historical dynamic changes of soil erosion modulus on the Loess Plateau during the 21st century, and analyzing its trends and driving mechanisms, in this study we determine the contribution rate of human activities to soil erosion.
The aim of our research is to achieve the following goals: (1) define the process of soil erosion change in the Loess Plateau during 2000–2015, and reveal its mechanism. (2) Explain the role human activity plays in soil erosion changes on the Loess Plateau, and clarify the effectiveness of ecological restoration projects. (3) Propose scientific and effective measures on soil erosion control in the Loess Plateau in the future. Additionally, our aim is to provide new ideas for quantitative research regarding the contribution rate of human activities to soil erosion, and provide theoretical support for the formulation and implementation of ecological protection methods and management measures for the Loess Plateau in the future.

2. Materials and Methods
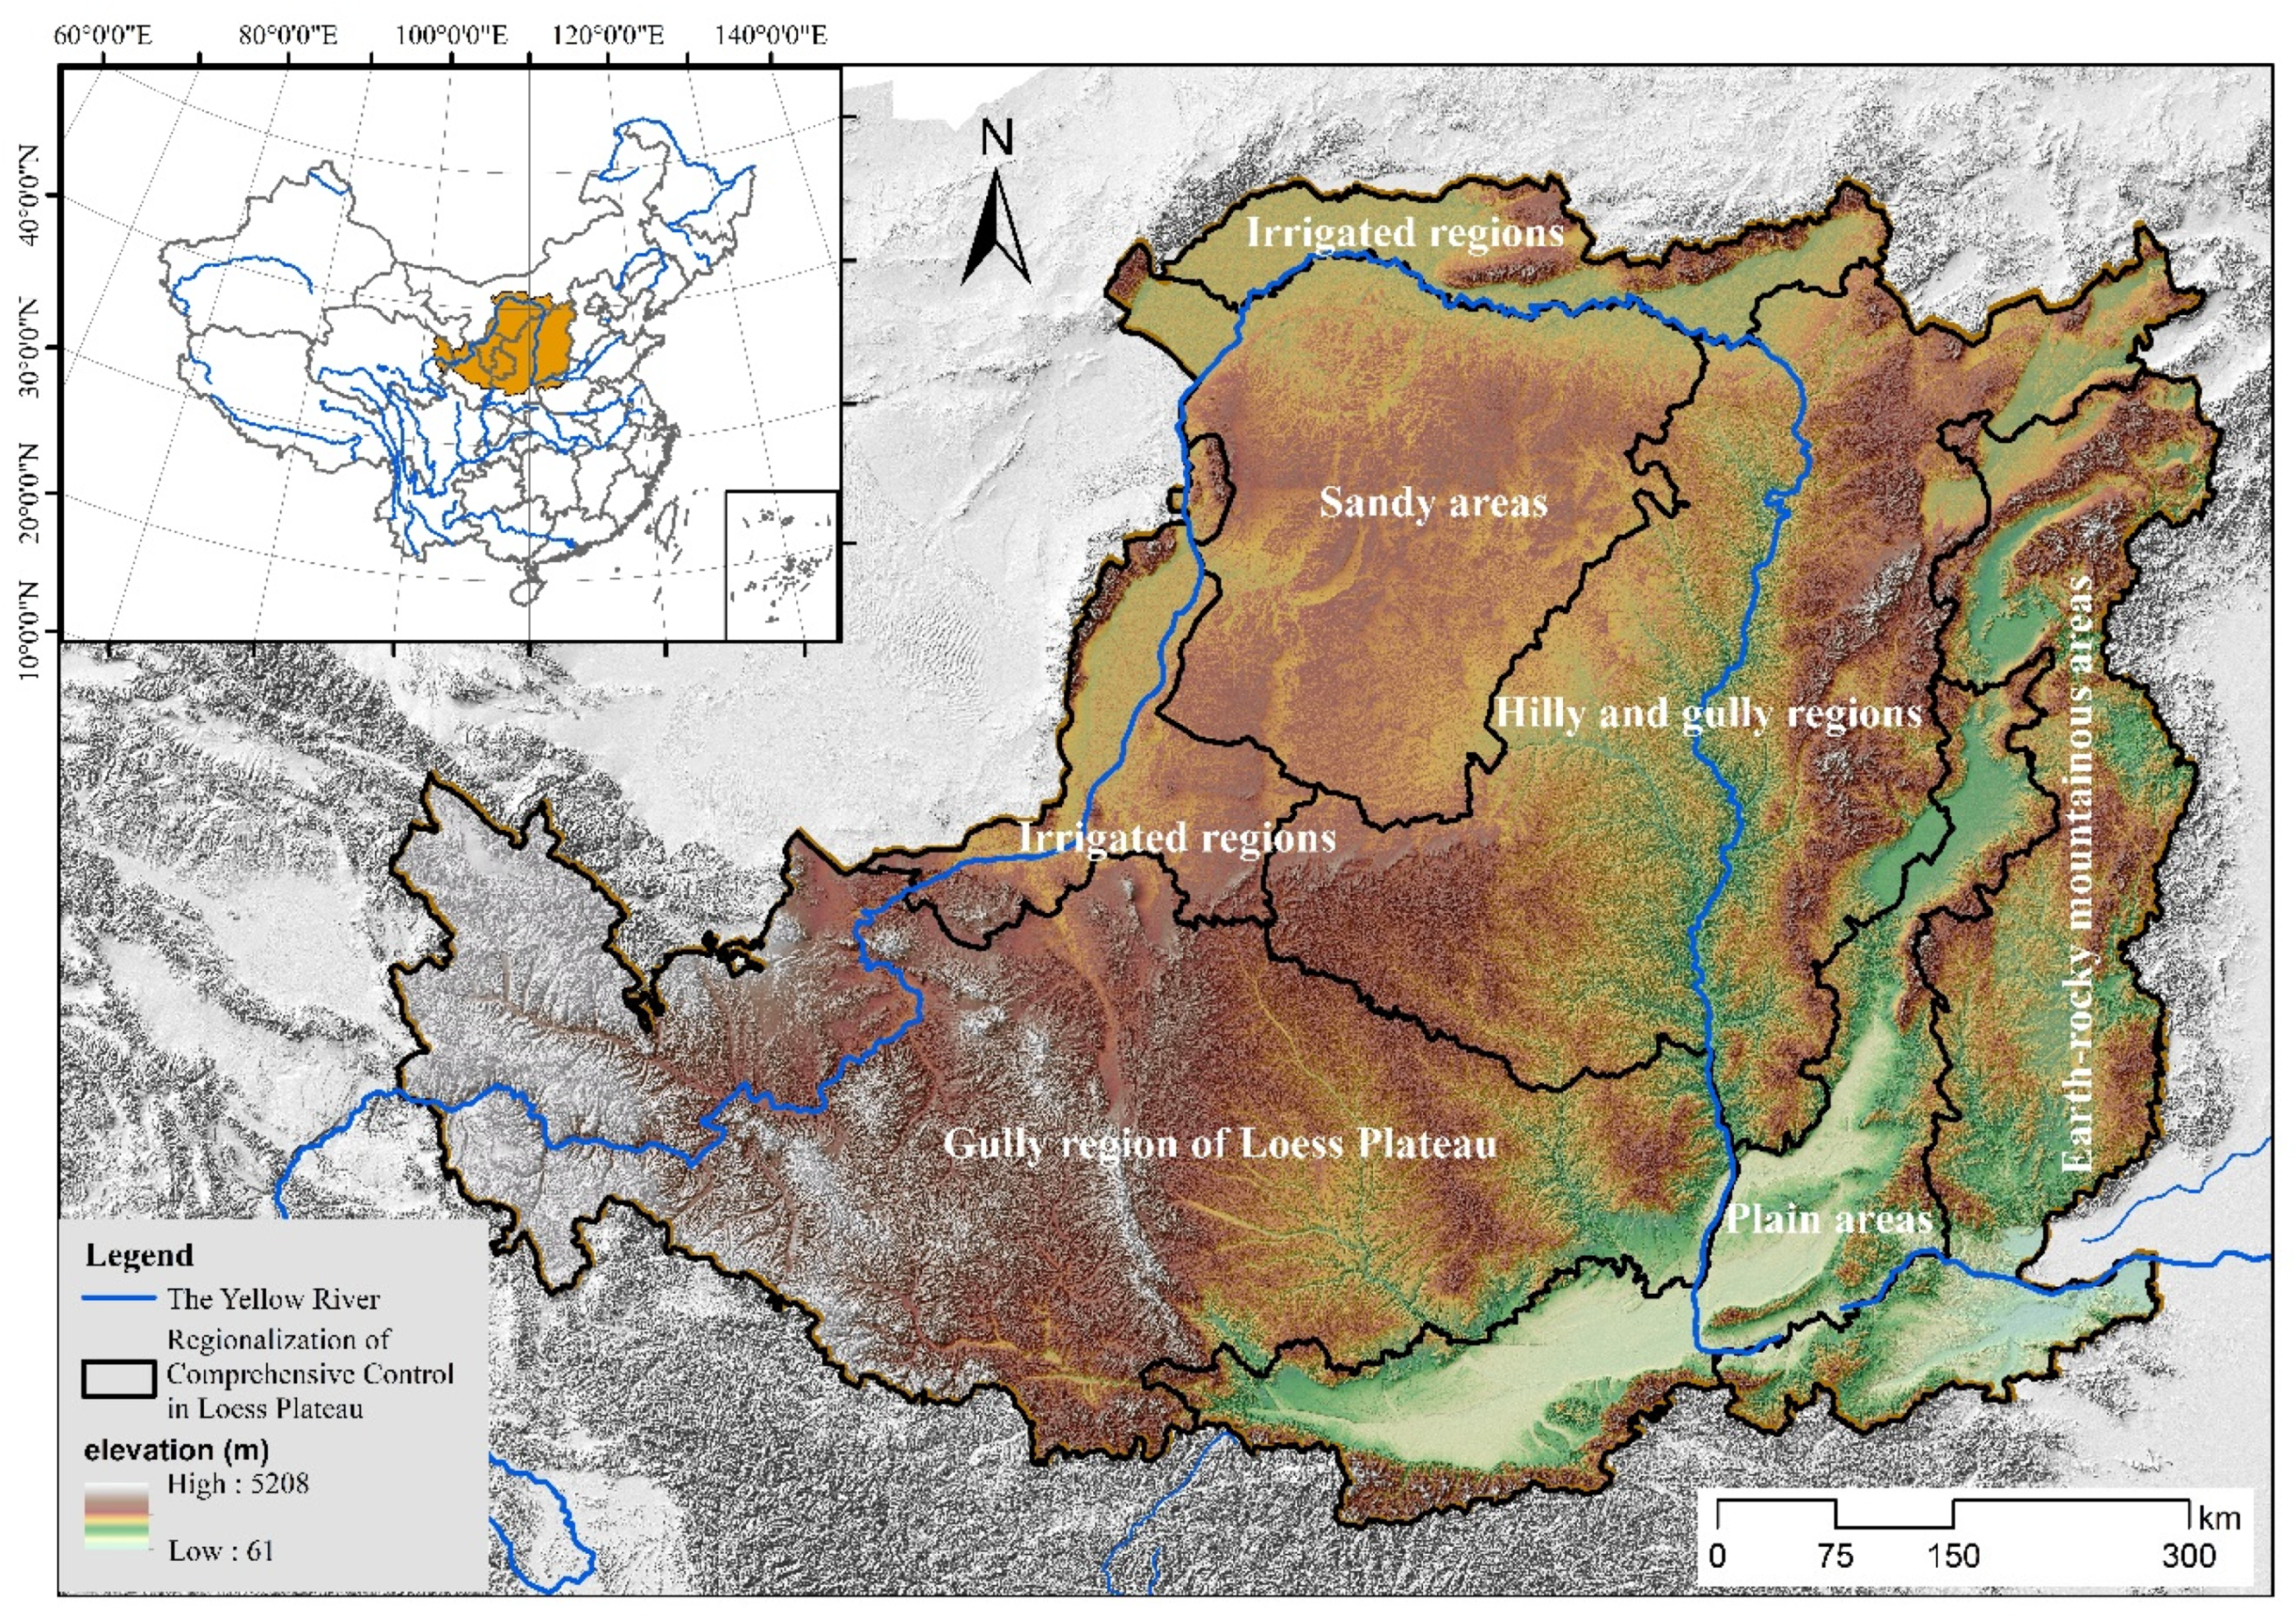
2.1. Study Area

Located in the middle reaches of the Yellow River and the upper reaches of the Haihe River, the Loess Plateau is one of the four main plateaus in China. The Loess Plateau is more than 1,000 km long from east to west and 750 km wide from north to south; spanning seven provinces of China, including the vast areas west of Taihang Mountain, east of Riyue Mountain, north of Qinling Mountains and south of the Great Wall, with a total area of 624,000 km2. The geographical position is between 100°54′–114°33′ E and 33°43′–41°16′ N.
The Loess Plateau is located in a transitional zone consisting of a continental monsoon climate of temperate, arid and semi-arid zones, with cold winters, warm and humid summers, and synchronous rain and heat. The annual average temperature is between 3.6–14.3°C, which is low in the northwest and high in the southeast. The altitude is 10–1400 m, with an average altitude of about 240 m. The average annual precipitation is 150–750 mm, which is mainly concentrated in July, August and September, and accounts for 55–78% of the total annual precipitation. Due to the particularities of its geology, geomorphology, hydrology, soil, climate and vegetation, the Loess Plateau is an area that is very susceptible to serious soil erosion and is one of the most fragile ecological environments in the world as seen in (Figure 1).

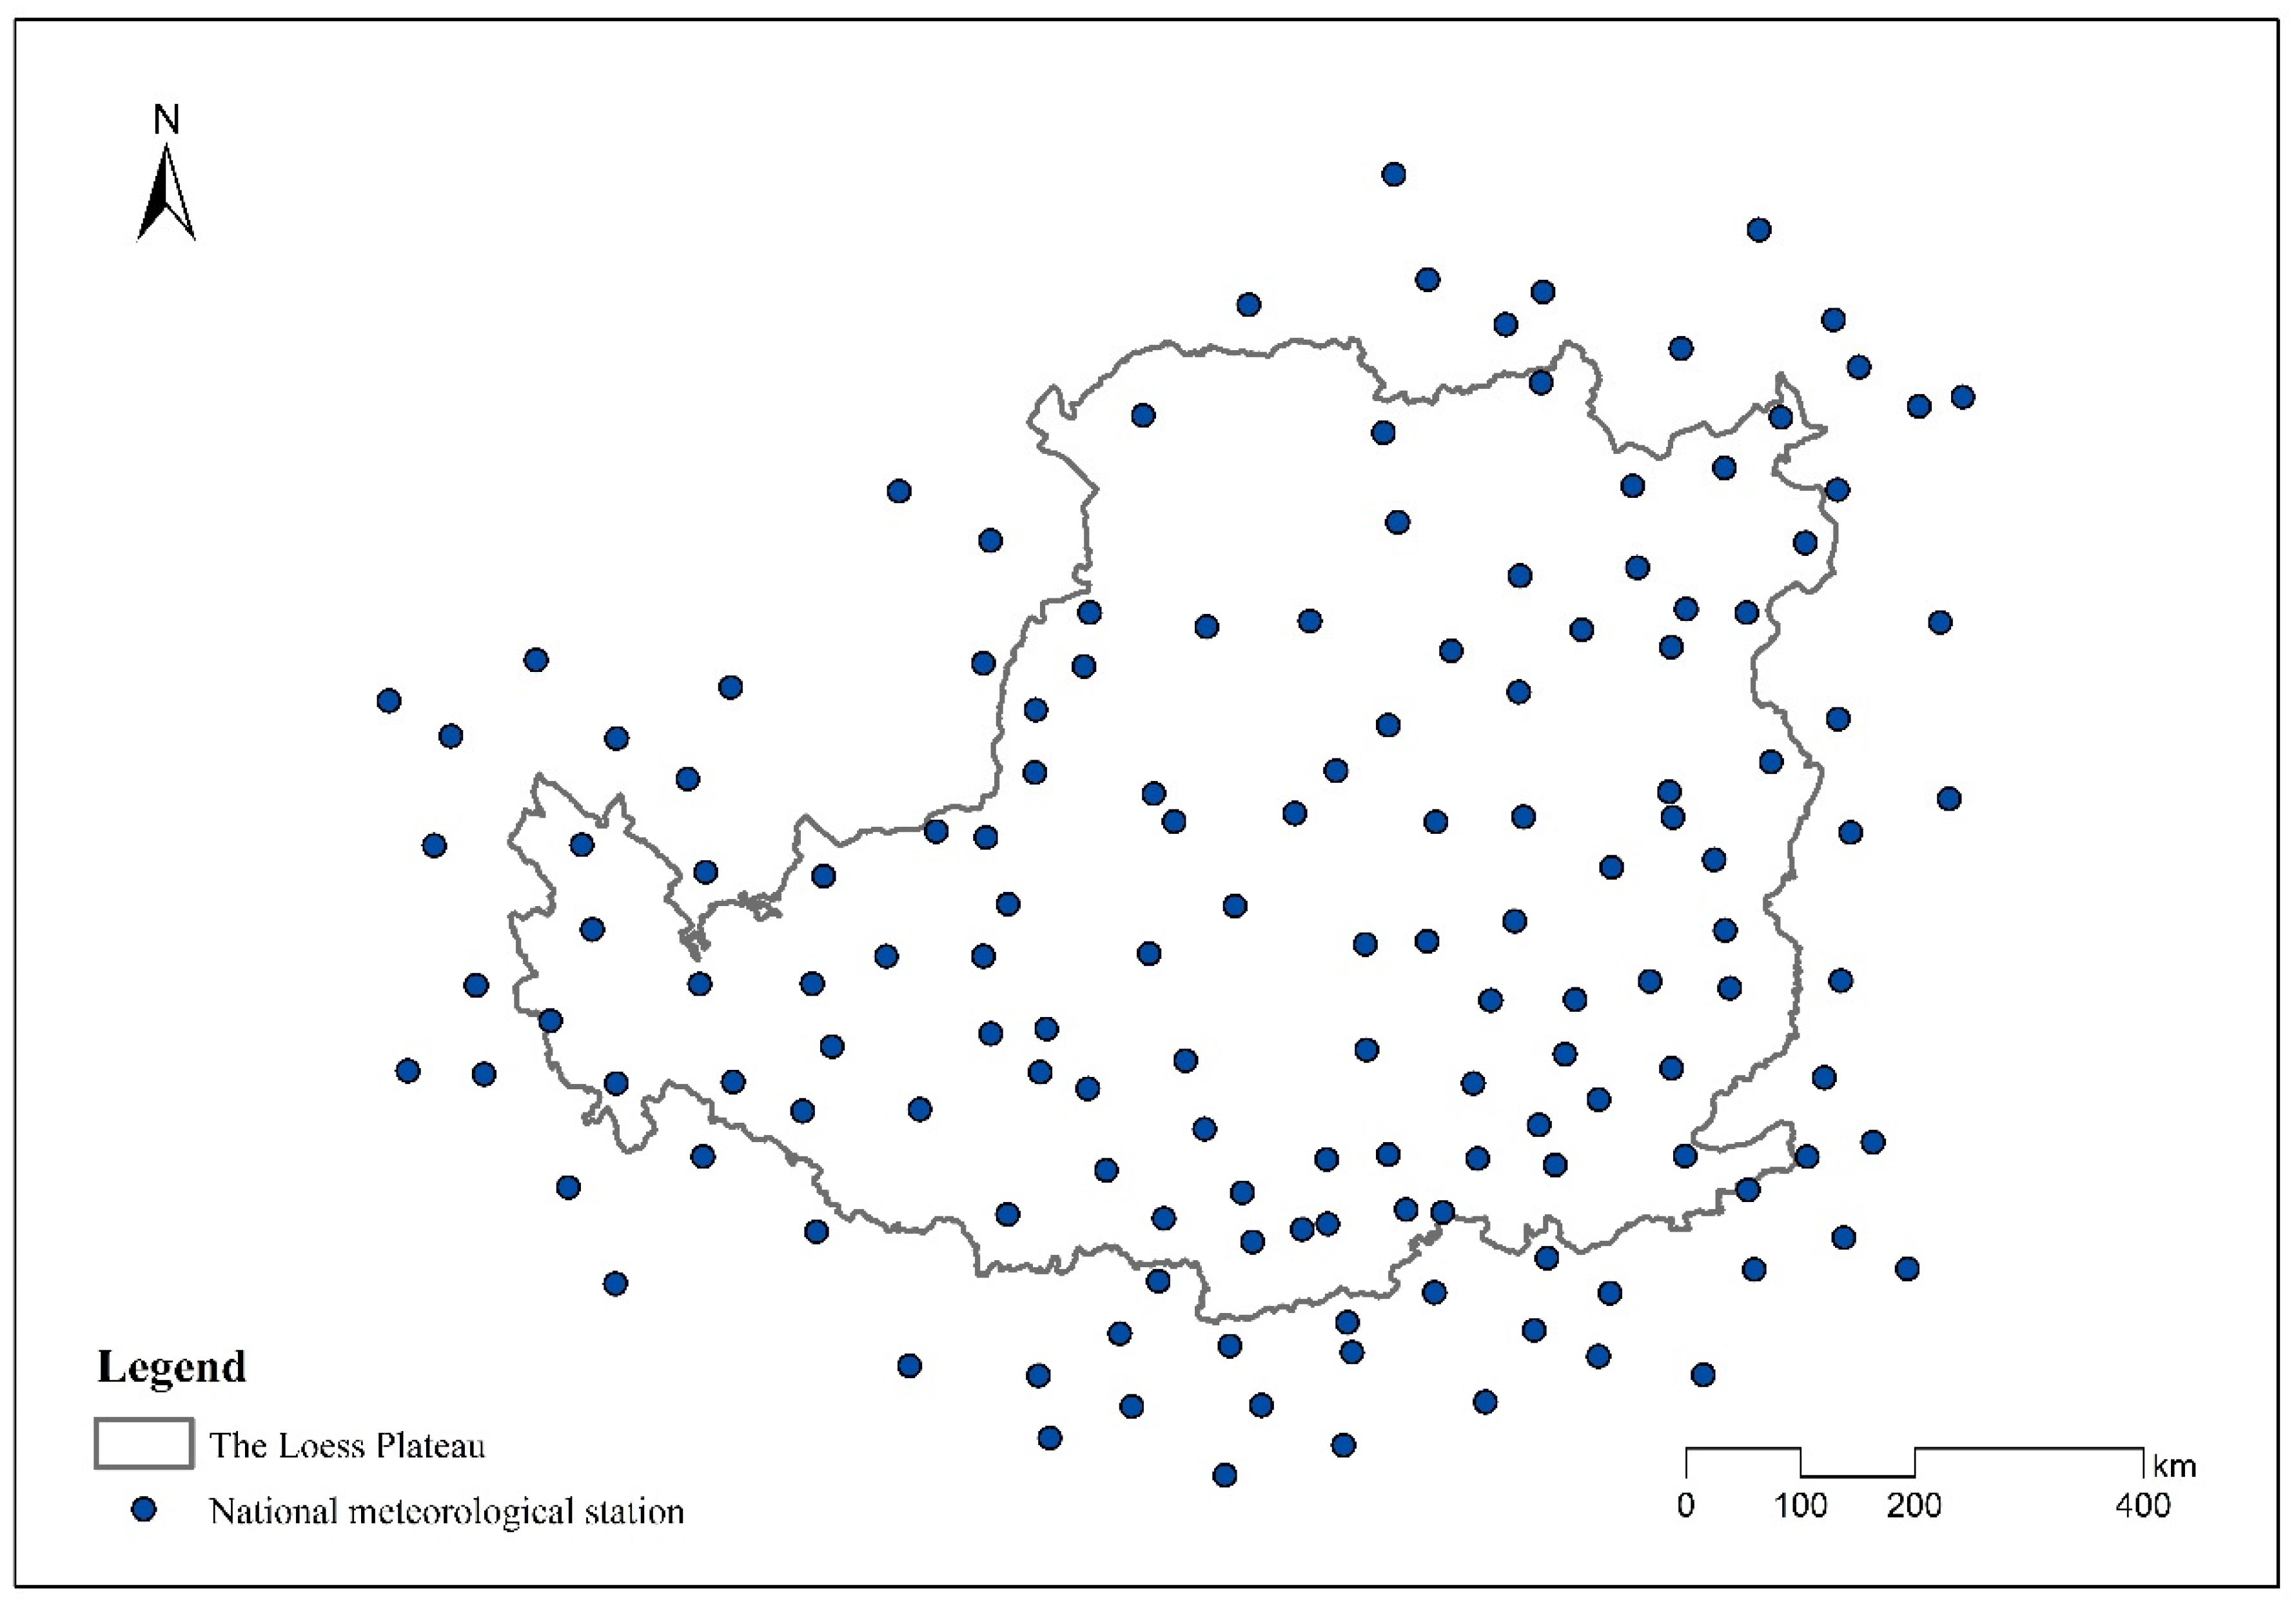
2.2. Data and Materials
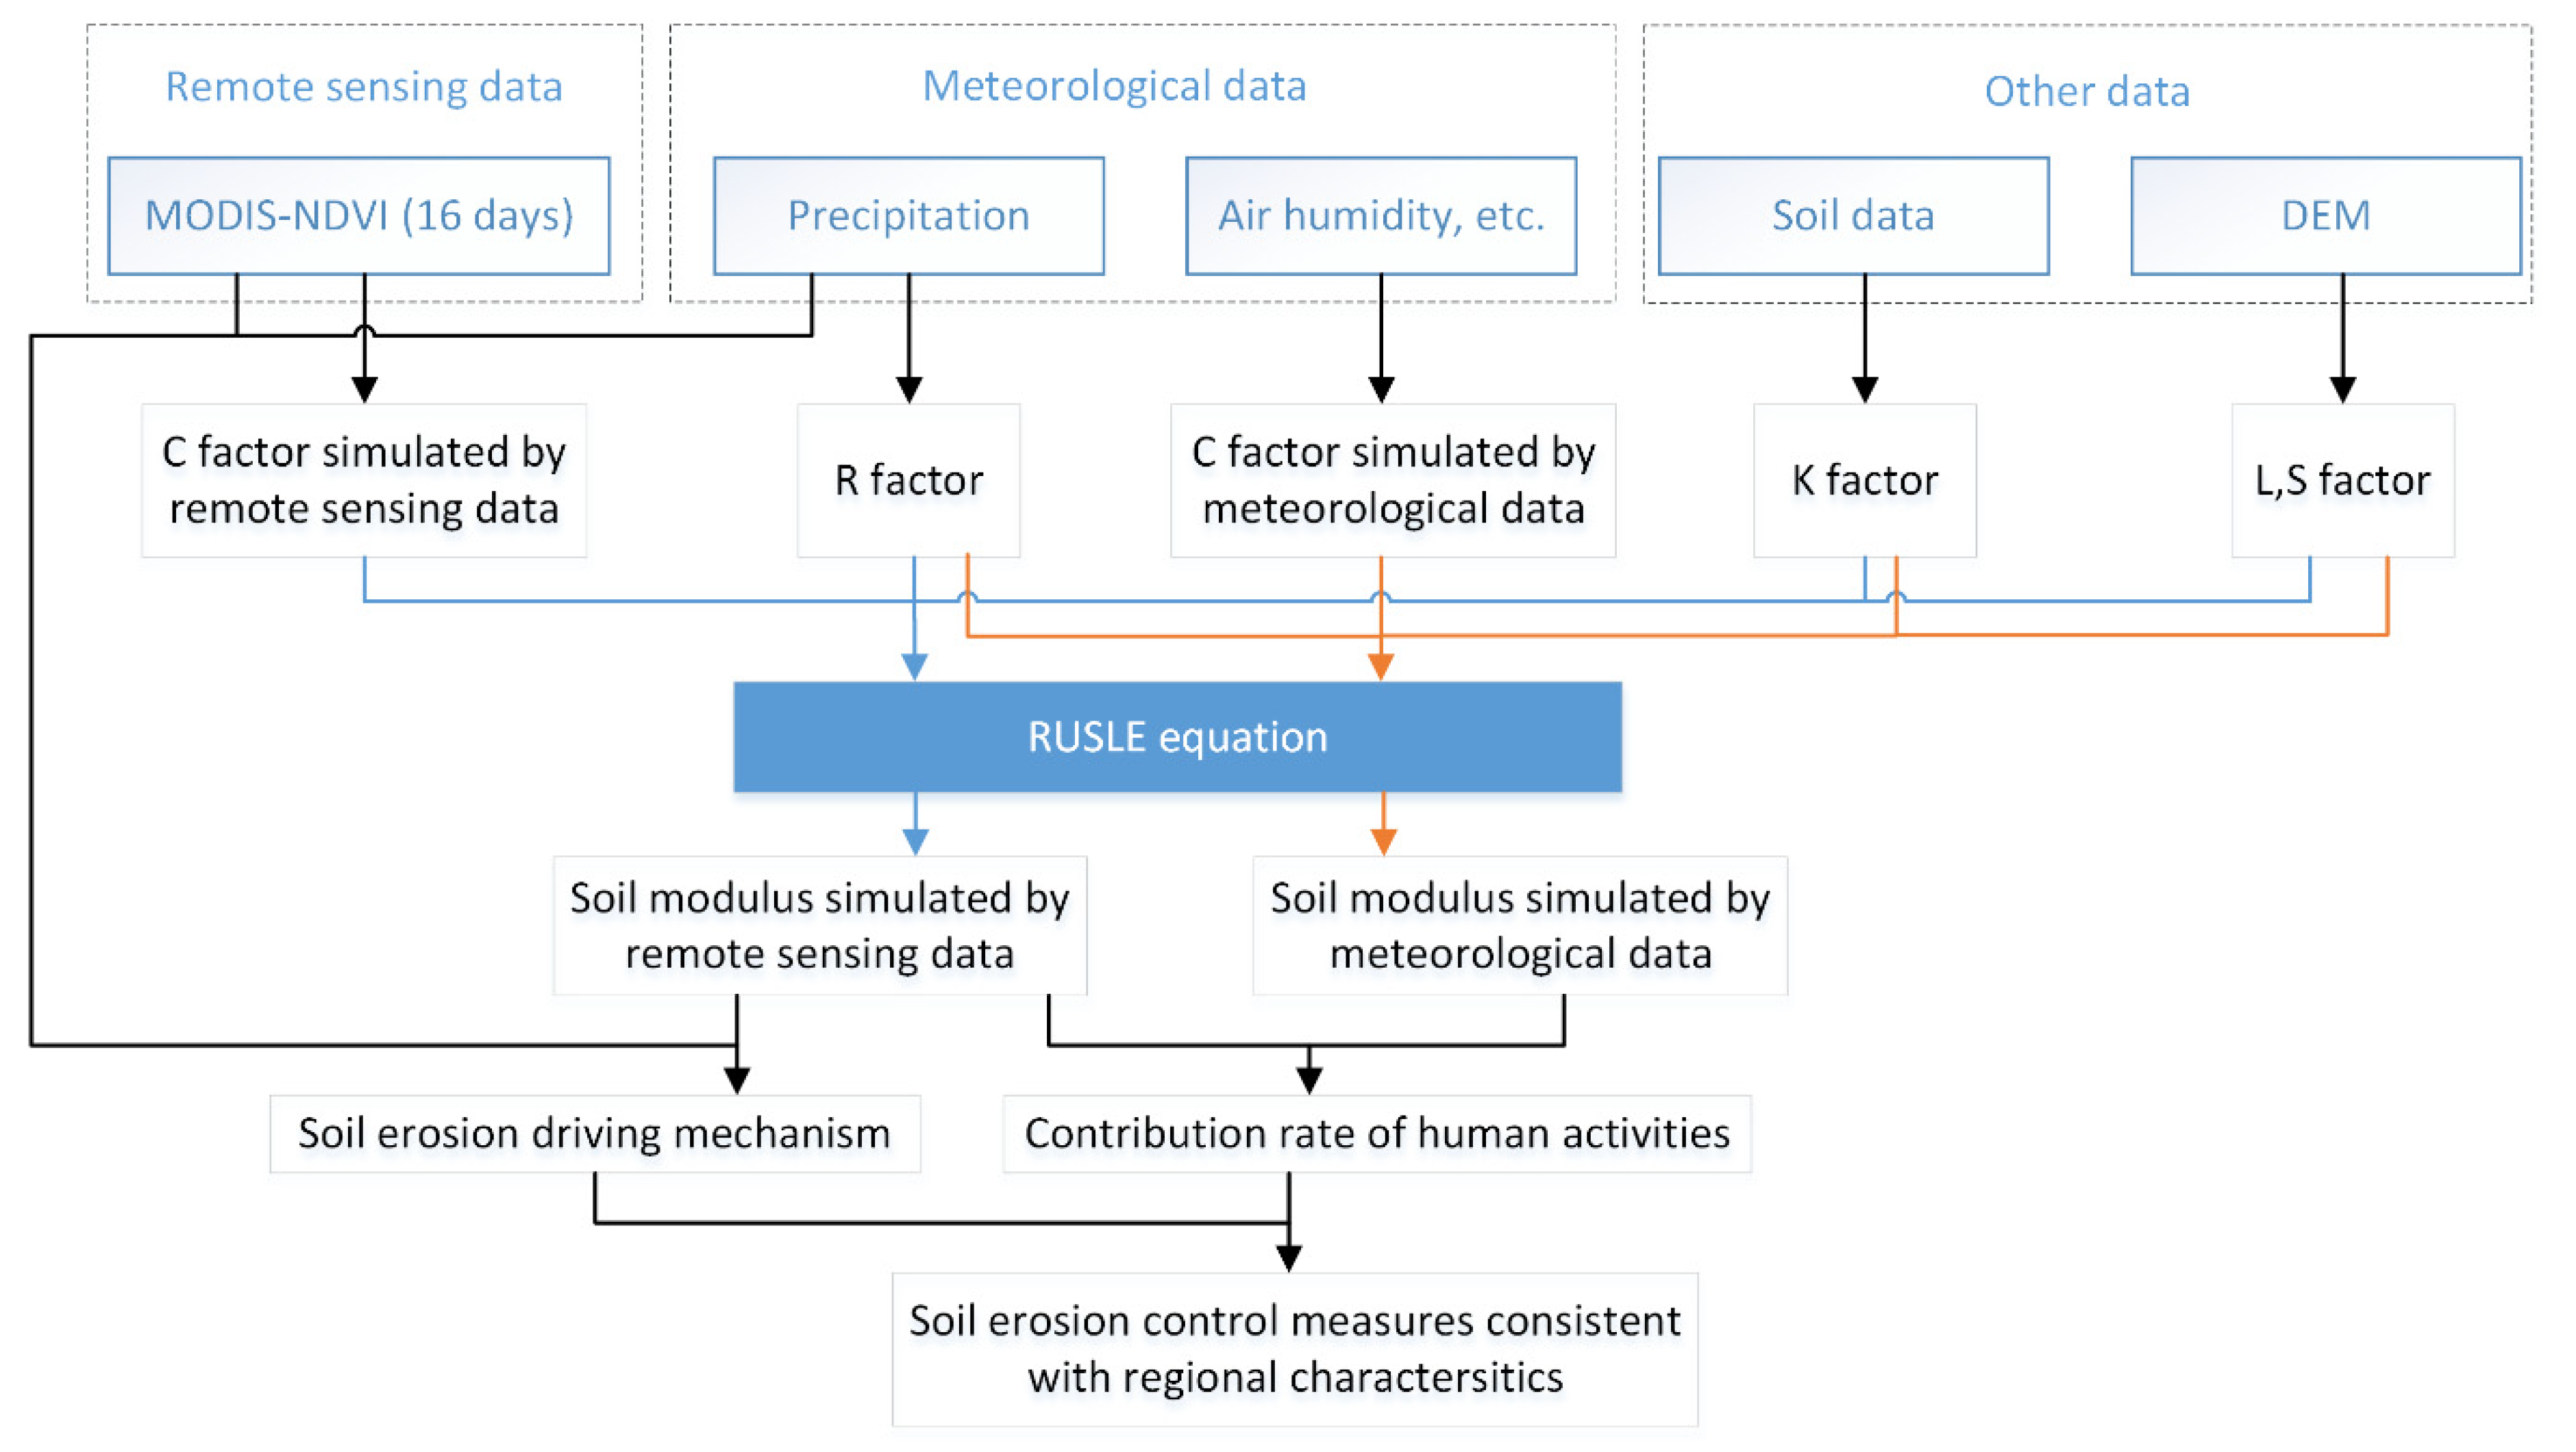
In this study, remote sensing data and meteorological data were combined, and two sets of soil erosion modulus simulation data were created to reveal the driving mechanism and contribution rate of human activities of soil erosion on the Loess Plateau. The specific technical process is shown in Figure 2.
The meteorological data used in our study were obtained from the China Meteorological Science Data Sharing Service Network [22]. Daily data sets of meteorological data from 147 national meteorological stations on the Loess Plateau and its surrounding 150 km range were collected (Figure 3), including the daily maximum temperature, minimum temperature, average temperature, precipitation, average relative humidity. The ANUSPLINE software was used to interpolate the site data to obtain the required spatial data set.
The soil-texture data were derived from the Harmonized World Soil Database version 1.2 (HWSD V1.2), which contains soil, sand, silt, clay and organic carbon content. The soil-types data were derived from China’s 1:1 million soil databases built by the Institute of Soil Science, Chinese Academy of Sciences. The basic mapping units including 12 orders, 61 great groups and 235 subgroups. Two sets of soil data were superimposed using the ArcGIS software to obtain vector data of soil type and texture.
The topographic data were derived from the advanced space borne thermal emission and reflection radiometer-global digital elevation model (ASTER-GDEM), where the slope and length factor data were further calculated by us.
The Normalized Difference Vegetation Index (NDVI) data were derived from MODIS-NDVI, once every 16 days, and the Vegetation Fractional Coverage (VFC) data were further calculated using the ENVI software.

2.3. Methods

2.3.1. Soil Erosion Modulus Simulation

In 1965, Wischmeier and Smith proposed the famous universal soil loss equation (USLE) [23], and then American scientists established the revised universal soil loss equation (RUSLE) in 1997 [24]. With the development of the geographic information system (GIS) and remote-sensing (RS) technology, RUSLE has become the most widely used empirical model for the quantitative assessment of soil erosion at watershed and regional scales [25]. Its basic form is:
A = R × K × L S × C × P ,
where A is the average soil erosion modulus [t/(ha·a)], R is the rainfall erosivity factor [MJ·mm/(ha·h·a)], and K is the soil erodibility factor [t·ha·h/(ha·MJ·mm)], L S is the slope length and slope factor, C is the vegetation cover and management factor, and P is the soil and water conservation measure factor. The latter four factors are all dimensionless.
In this study, we generated 1 × 1 km2 raster data of these factors in ArcGIS, and then obtained soil erosion modulus raster data of 1 × 1 km2 resolution.
(1)
Rainfall Erosivity Factor (R)
The national daily rainfall fitting model proposed by Zhang, Xie & Liu [26] was used to estimate the half-month rainfall erosivity factor in this study. The formula is as follows:
R i = α j = 1 k D j β ,
where R i is the rainfall erosivity value of the ith 16-day period of the year [MJ·mm/(ha·h·a)], D j is the erosive daily rainfall on the j th day of the 16-day period, and k = 16. The daily rainfall is required to be greater than or equal to 12 mm, otherwise it is calculated as 0 mm. The threshold value of 12 mm is consistent with the standard of erosive rainfall in China. α and β are undetermined parameters of the model, which can be calculated as:
α = 21.586 β 7.1891 ,
β = 0.8363 + 18.144 P ¯ d 12 + 24.455 P ¯ y 12 ,
where P ¯ d 12 represents the daily average rainfall of more than 12 mm (including 12 mm), and P ¯ y 12 represents the annual average rainfall of more than 12 mm (including 12 mm).
(2)
Soil Erodibility Factor (K)
In 1990, Williams expressed erosion-productivity impact calculator (EPIC) [27]. In this study, we used the calculation method outlined in the “Ecological protection red line delineation guide” issued by the Ministry of Ecology and Environment of the People’s Republic of China and the National Development and Reform Commission [28], which revised the formula for calculating soil erodibility in EPIC as:
K = ( 0.01383 + 0.51575 K E P I C ) × 0.1317 ,
K E P I C = [ 0.2 + 0.3 e x p ( 0.0256 S A N 1 S I L 100 ) ] × ( S I L C L A + S I L ) 0.3 × [ 1 0.25 C C + e x p ( 3.72 2.95 C ) ] × { 1 0.7 ( 1 S A N / 100 ) ( 1 S A N / 100 ) + e x p [ 5.51 + 22.9 ( 1 S A N / 100 ) ] } ,
where K is the revised soil erodibility factor, KEPIC is the soil erodibility factor before revision, SAN, SIL and CLA are the content of soil sand, silt and clay (%), respectively, and C is the soil organic carbon content (%).
(3)
Slope Length (L) and Slope Factor (S)
Since the slope and slope length factors are closely related to each other, they are usually considered together. In this study we combined the method proposed by McCool et al. [29] and Liu et al. [30]. The calculation formulas are as follows:
L = ( γ 22.13 ) m { m = 0.5 θ 9 % m = 0.4 9 % > θ 3 % m = 0.3 3 % > θ 1 % m = 0.2 1 % > θ ,
β = ( sin θ / 0.896 ) / [ 3 × ( sin θ ) 0.8 + 0.56 ] ,
S = { 10.8 sin θ + 0.03 θ < 9 % 16.8 sin θ 0.5 9 % θ 18 % 21.91 sin θ 0.96 θ > 18 % ,
where L is the slope length factor (dimensionless), γ is the slope length (m), m is a dimensionless constant that depends on the degree of the slope, θ is the slope (%), and S is the slope factor (dimensionless).
(4)
Vegetation Cover and Management Factor (C)
The algorithm established by Cai et al. [31], which is based on a large number of experiments, is widely respected because of its simplicity and accuracy, and it was used to simulate the C factor by VFC in this study:
C = { 1 V F C = 0 0.6508 0.3436 lg V F C 0 < V F C 78.3 % 0 V F C > 78.3 % ,
where C is the vegetation cover and management factor (dimensionless). V F C is calculated using the NDVI as follows [32]:
V F C = ( N D V I N D V I s o i l ) ( N D V I v e g N D V I s o i l ) ,
N D V I s o i l = V F C m a x × N D V I m i n V F C m i n × N D V I m a x V F C m a x V F C m i n ,
N D V I v e g = [ ( 1 V F C m i n ) × N D V I m a x ( 1 V F C m a x ) × N D V I m i n ] V F C m a x V F C m i n ,
where N D V I s o i l is the NDVI value of bare soil pixels, N D V I v e g is the NDVI value of pure vegetation pixels, N D V I m a x and N D V I m i n are the maximum and minimum NDVI values in the region, respectively, and V F C m a x and V F C m i n are the maximum and minimum V F C values in the region, respectively.
When V F C m a x = 100 % , V F C m i n = 0 % , and Equation (11) becomes:
V F C = ( N D V I N D V I m i n ) ( N D V I m a x N D V I m i n ) ,
In the actual calculation process, N D V I m a x and N D V I m i n are the raster values for a cumulative rate of 95% and 5% from small to large in the area, respectively.

2.3.2. Statistical Analysis

In this study, the least squares method was used to linearly fit the multi-year trends of the soil erosion modulus, precipitation and vegetation coverage [33]. The calculation is as follows:
b ^ = i = 1 n x i y i n x ¯ y ¯ i = 1 n x i 2 n x ¯ 2 ,
a ^ = y ¯ b ^ x ¯ ,
where b ^ is the slope of the fitted line, a ^ is the intercept of the fitted line, y consists of variables including the soil erosion modulus, precipitation and VFC in this study, and x is the corresponding year. y ¯ and x ¯ are the n-year average of y and x, y i and x i are the soil erosion modulus, precipitation or VFC of the i th year, and n is the number of years, i.e. the number of samples.
Pearson’s correlation coefficient (r) was used to describe any simple linear correlation that may be present between two variables (e.g., the soil erosion modulus, precipitation and vegetation coverage and the year), and the consistency of the temporal and spatial patterns measured from the time-series data (soil erosion modulus and precipitation, soil erosion modulus and vegetation coverage), which is calculated as follows [34]:
r = i = 1 n ( X i X ¯ ) ( Y i Y ¯ ) i = 1 n ( X i X ¯ ) 2 i = 1 n ( Y i Y ¯ ) 2 ,
The significance level is expressed by the Student’s t-test, where the t-statistic is calculated as follows:
t = r d f 1 1 r 2 ,
d f = n 1 ,
where r is Pearson’s correlation coefficient, X and Y are the two variables described, X ¯ and Y ¯ are the n-year averaged values of X and Y , respectively. X i and Y i represent the value of X and Y in the i th year, respectively, d f is the degrees of freedom, and n is the number of samples. According to the calculated t-statistic, the corresponding P value was obtained by combining the distribution threshold table of t values to determine the significance level between the considered variables (soil erosion modulus and precipitation, soil erosion modulus and vegetation coverage).
In this study we divided the level of significance into three levels. | p | < 0.05 * : significant; | p | < 0.01 * * : very significant; | p | < 0.001 * * * : highly significant.

2.3.3. Soil Erosion Modulus Simulation under Meteorological Conditions

Calculation of the soil erosion modulus under different meteorological conditions was performed using RUSLE, which calculates the potential vegetation coverage factor (C) under meteorological conditions instead of the vegetation coverage factor obtained from RS data.
Calculation of the VFC was based on Equations (11–14), which were employed using the NDVIs. The NDVIs were in turn calculated using the algorithm proposed by Woodward and Smith [35]. The specific formulas are as follows:
N D V I m = 100 × 1 e 0.6 L A I + 38 ,
L A I = P ( D G m a x 1000 + 0.67 ) × 64.8 × t ,
where N D V I m is the potential NDVI simulated by the meteorological data, L A I is the potential leaf area index, P is the monthly precipitation (mm), D is the air humidity, t is the day length (hr), and G m a x is the maximum stomatal conductance (mmol·m−2·s−1), which is calculated using the empirical observations collated by Woodward and Smith [35]. The G m a x value of a cool temperate steppe is 287 mmol·m−2·s−1, while G m a x of a cool temperate moist forest is 300 mmol·m−2·s−1.
The daily length, t, was calculated using the formula proposed by the Food and Agriculture Organization of the United Nations (FAO) [36] as:
t = 24 ω s π ,
ω s = cos 1 ( tan φ tan δ ) ,
δ = 0.409 sin ( 2 π 365 J 1.39 ) ,
where ω s is sunset hour angle (rad), φ is latitude of the meteorological station, δ is the solar decimation (rad), and J is the number of the day in the year between 1 (1st January) and 365 or 366 (31st December).

2.3.4. Determination of the Contribution Rate of Human Activities

By calculating the trend of the soil erosion modulus of the Loess Plateau from 2000 to 2015 under simulated and actual meteorological conditions, the method of obtaining contribution rate of human activities is postulated in this study as follows:
C h = b ^ a b ^ m | b ^ a | ,
where C h is the contribution rate of human activities (dimensionless), where the numerical value indicates the effect of human activities on the change of soil erosion rate and a positive or negative value represents an increase or decrease of the erosion modulus, b ^ a is the change slope of soil erosion modulus in the Loess Plateau under actual conditions [t/(ha·a)], and b ^ m is the slope of the soil erosion modulus on the Loess Plateau simulated by the meteorological data [t/(ha·a)].

3. Results

3.1. Spatial and Temporal Characteristics of Soil Erosion

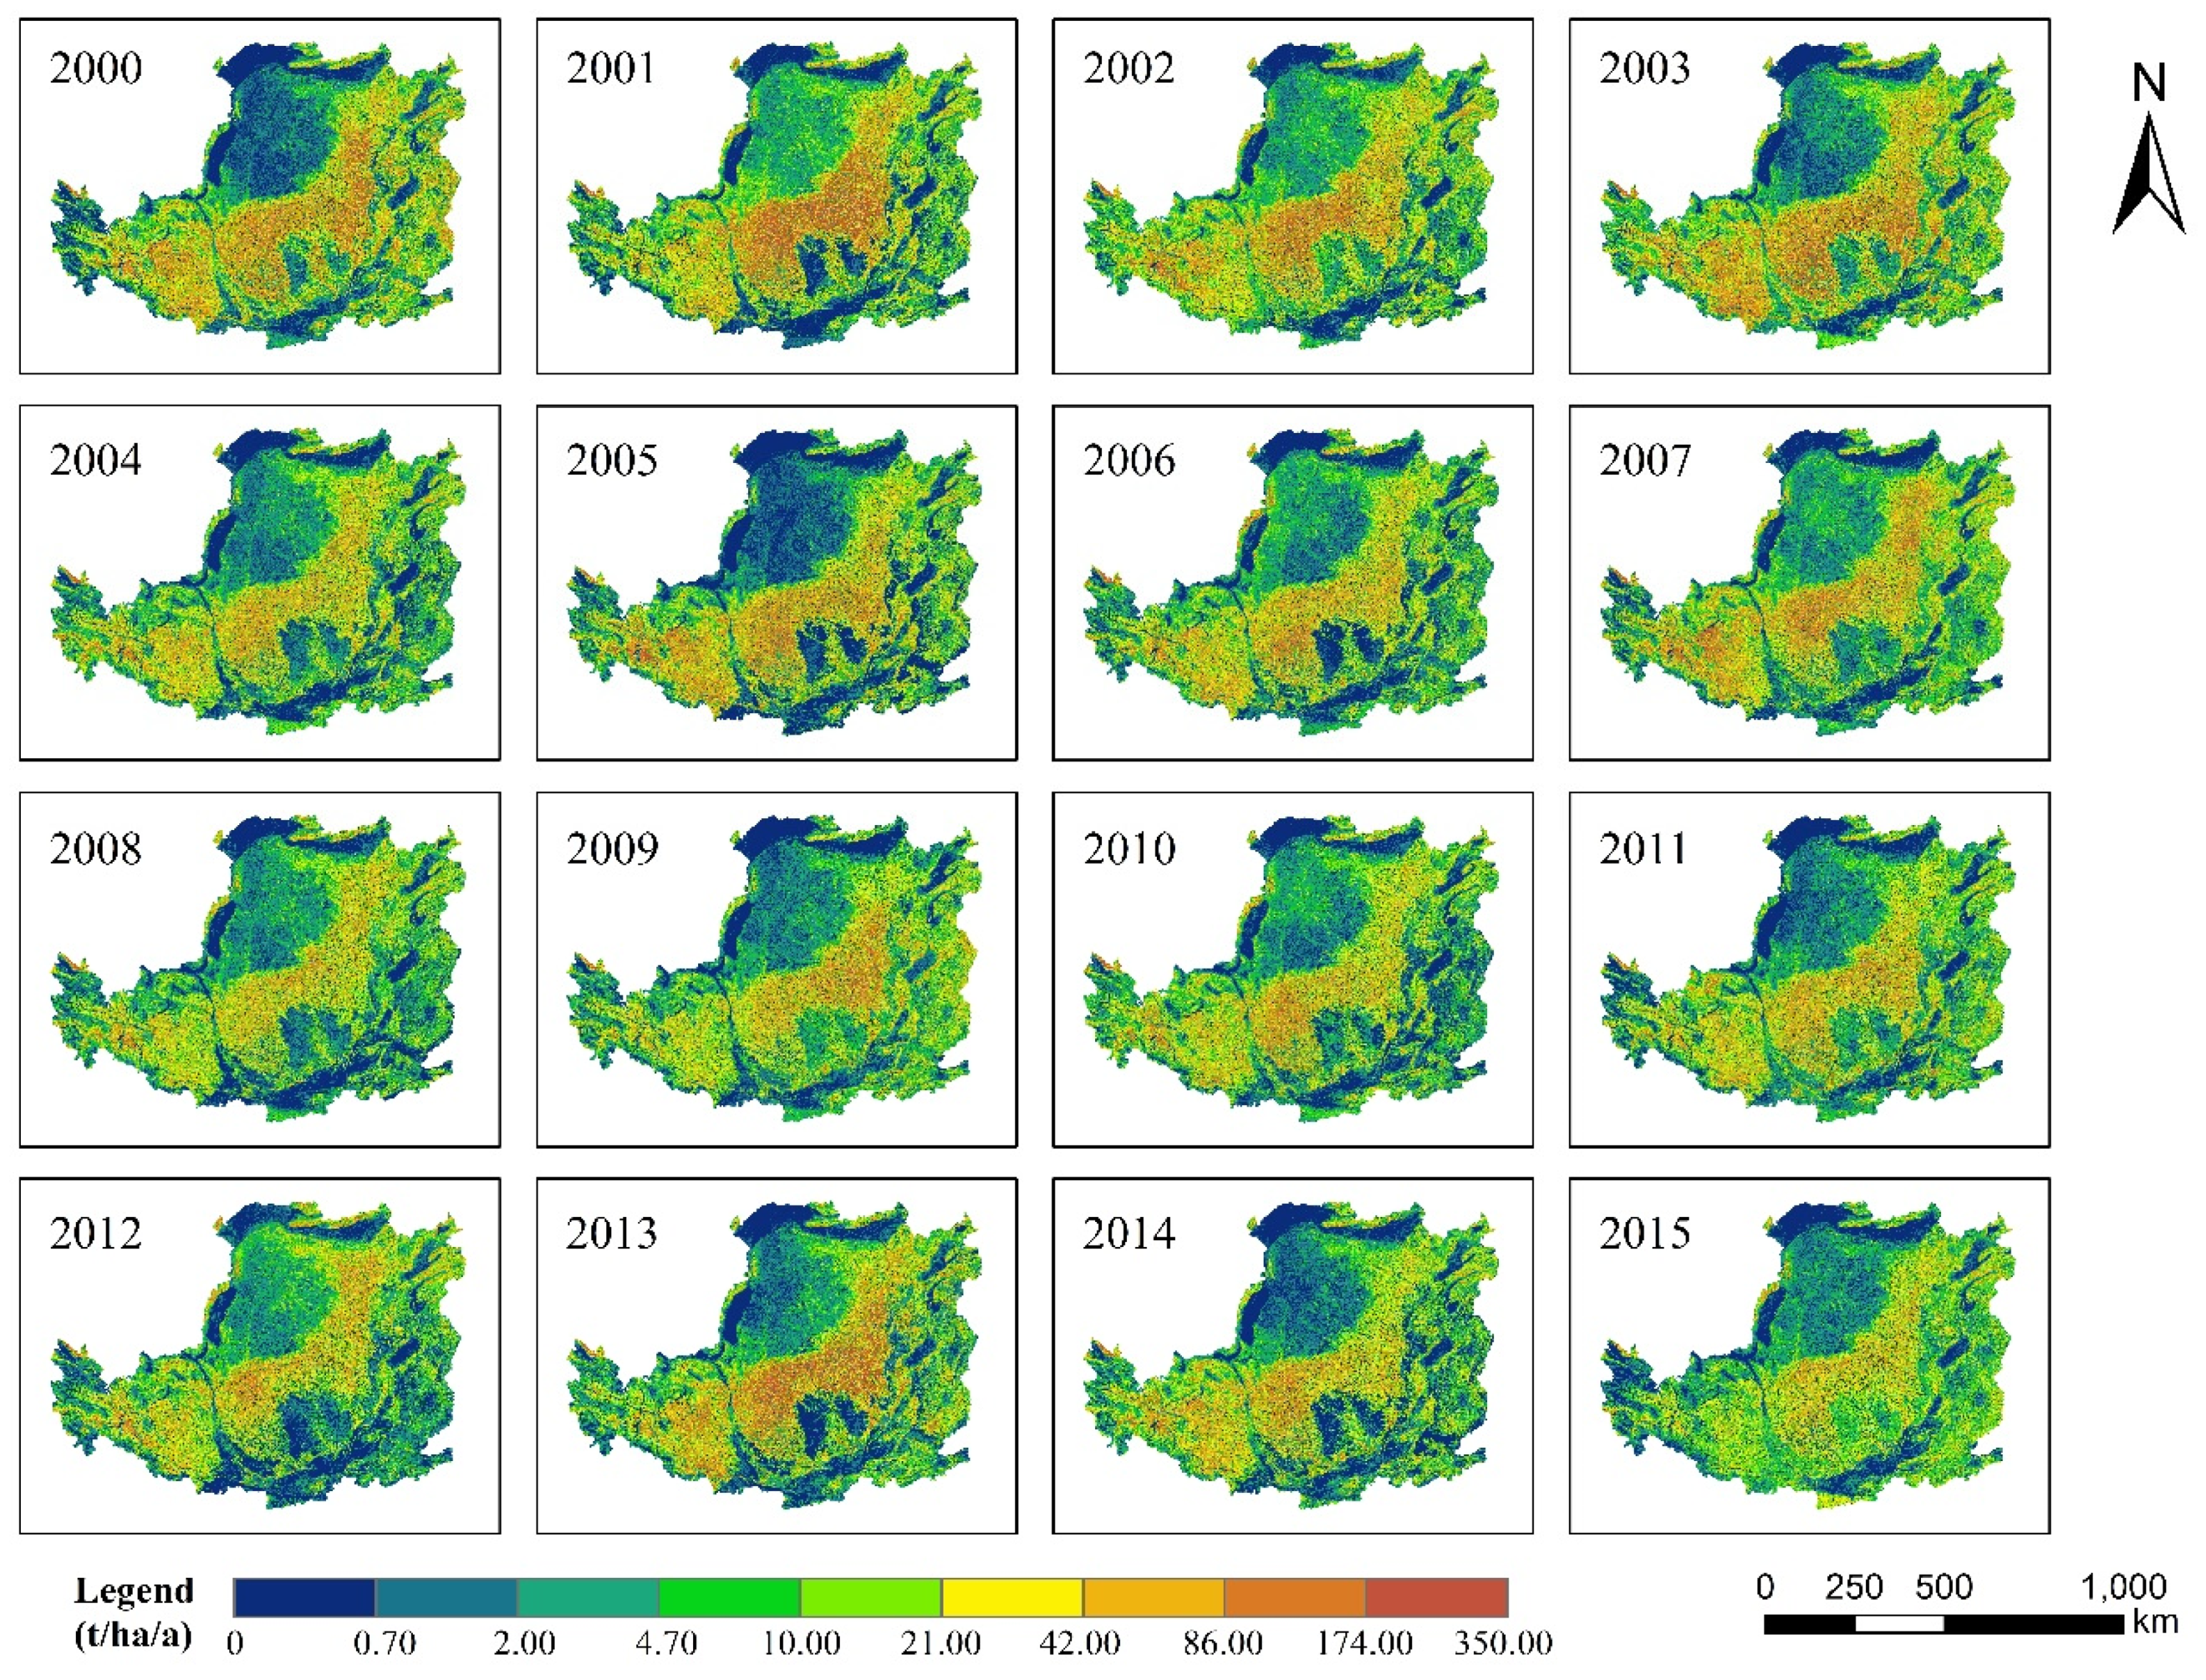
3.1.1. Spatial Distribution Characteristics

From 2000 to 2015, the annual average erosion modulus of the Loess Plateau was 20.8856 t/ha/a (Table 1), and the yearly values showed similar spatial distribution patterns (Figure 4). There was a high-value zone that extended from southwest to northeast, which was mainly located in the “hilly and gully region” and “gully region of Loess Plateau” of the comprehensive control regions in the Loess Plateau.
Regionally, the “hilly and gully region” had the highest annual average soil erosion modulus, 32.6789 t/ha/y, while the “plateau gully region” of the Loess Plateau has the second highest, 28.5799 t/ha/a. “Sandy areas” constitute the smallest region, with 421.82 t/ha/a.

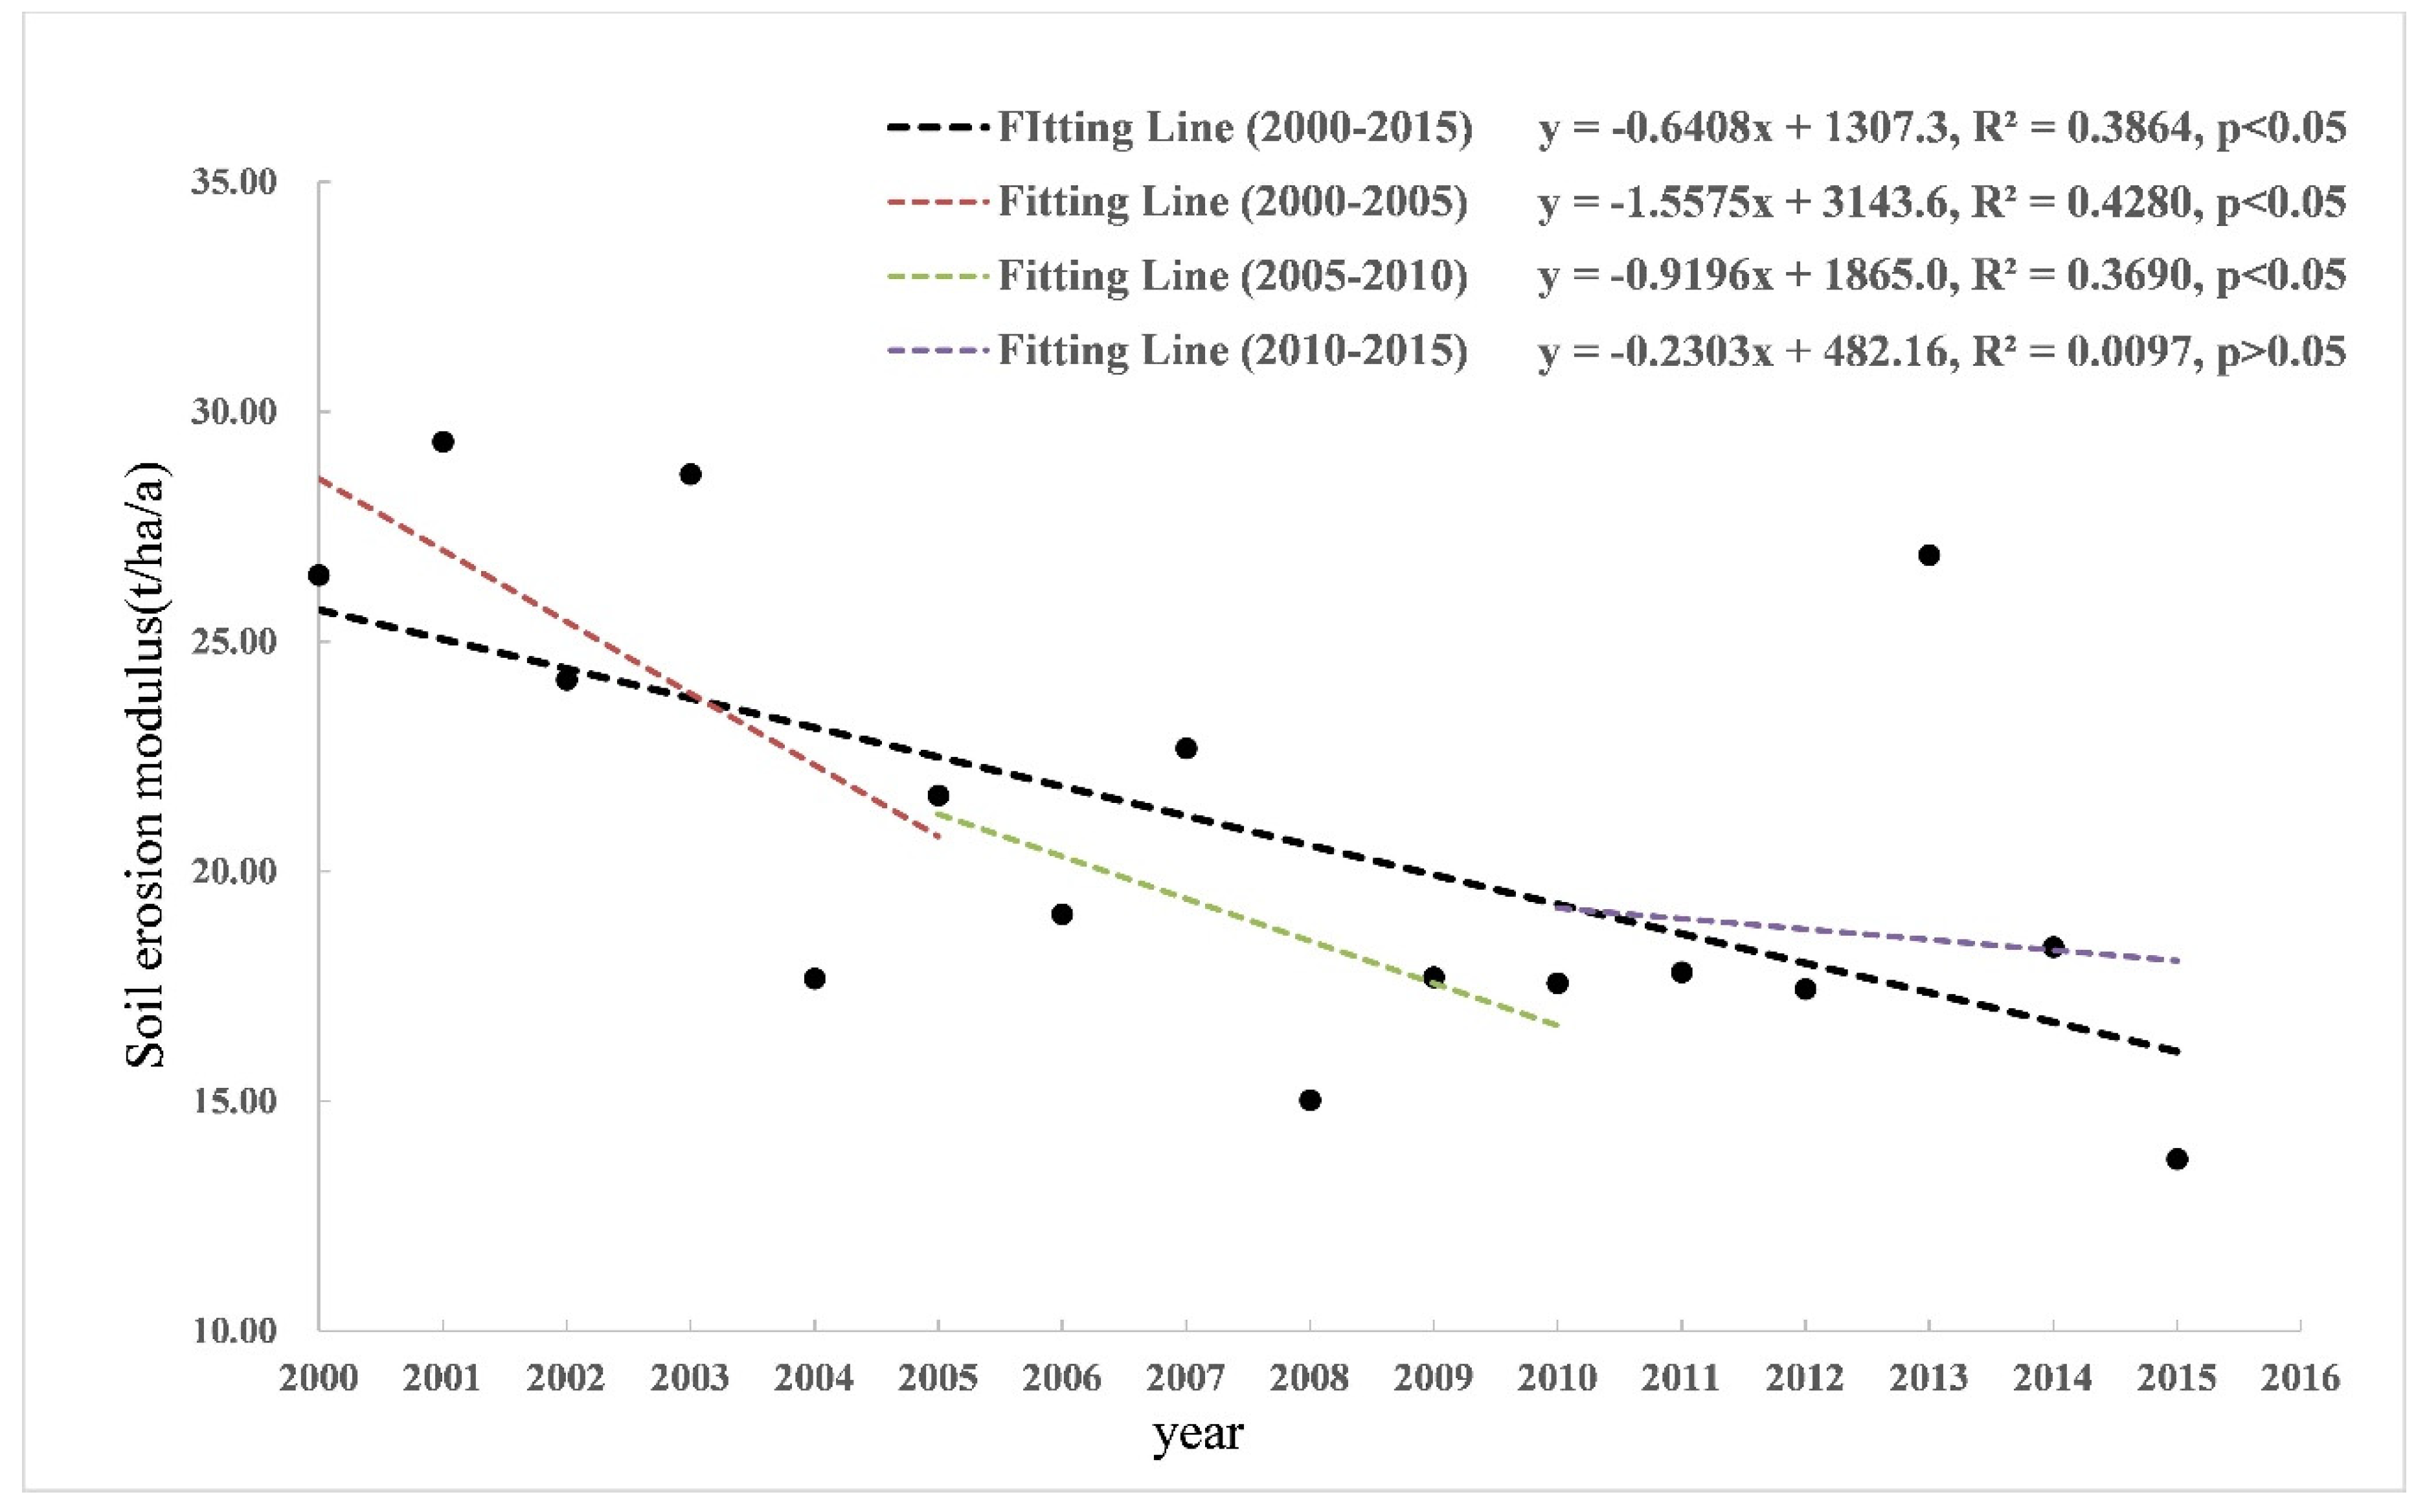
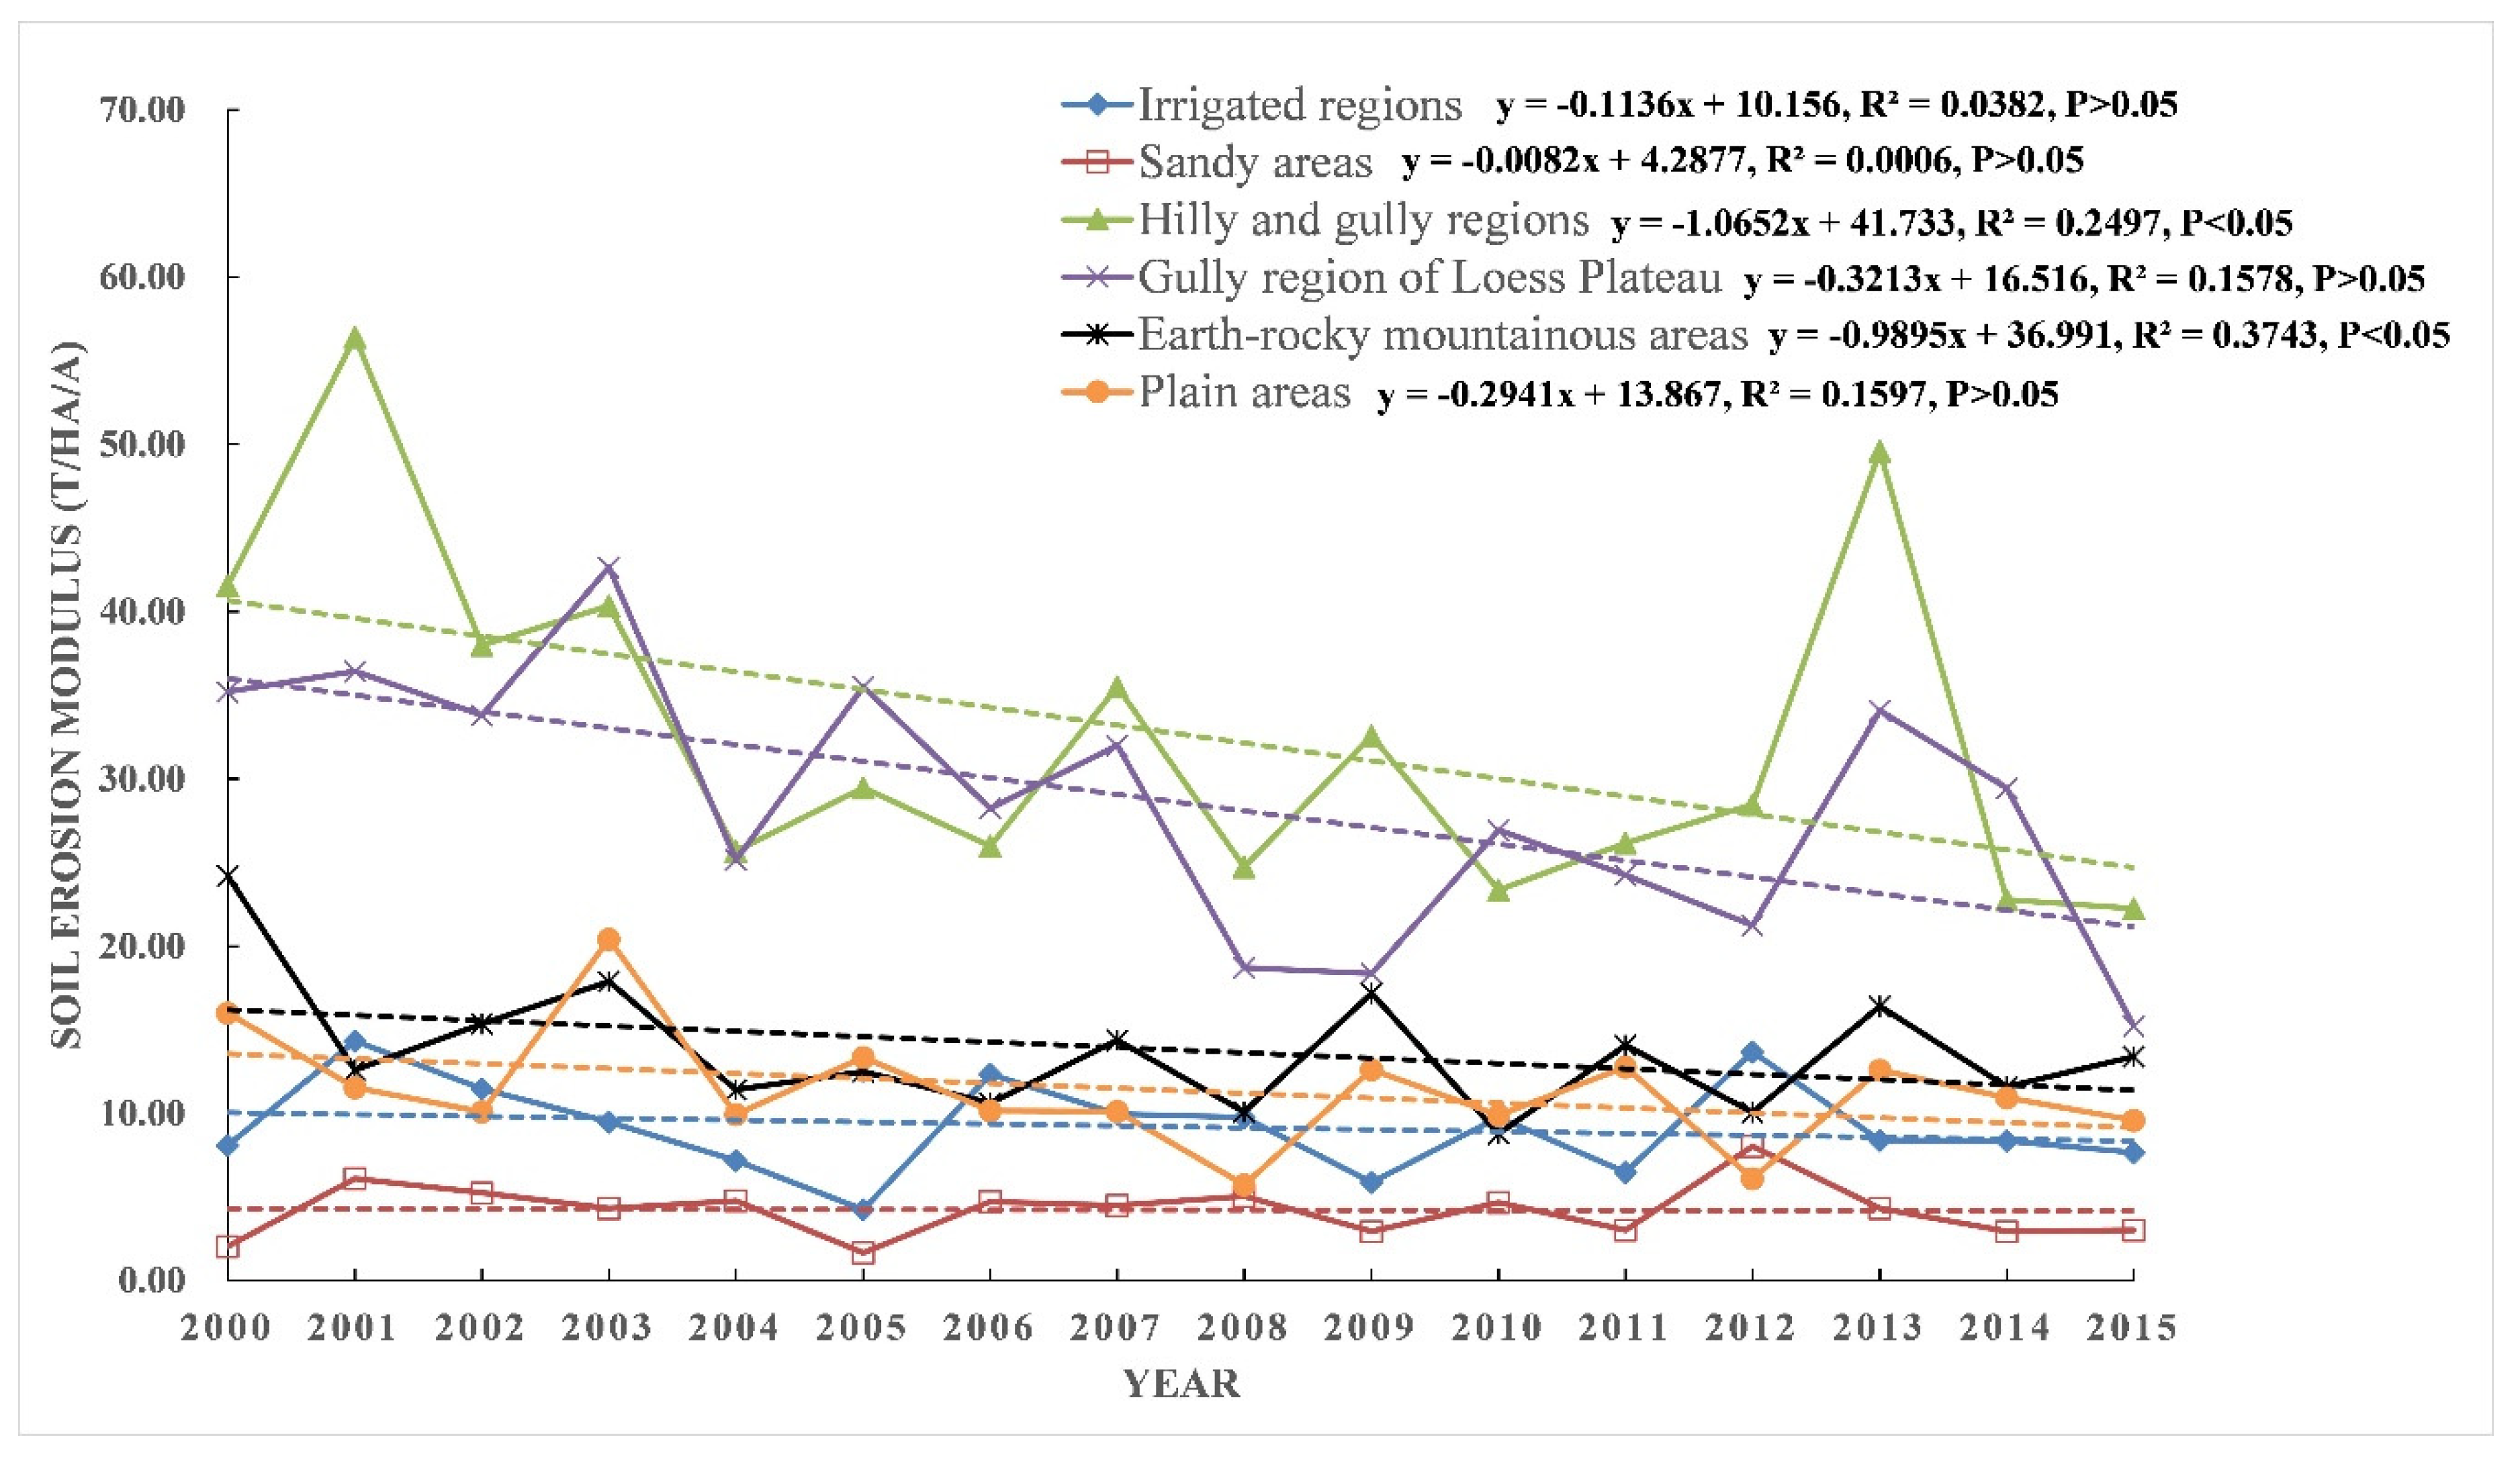
3.1.2. Spatiotemporal Variation of Soil Erosion

Over the past 16 years, the highest soil erosion modulus was 29.3461 t/ha/a in 2001, and the lowest was 13.7385 t/ha/a in 2015. From 2000 to 2015, the average soil erosion modulus of the whole Loess Plateau showed a downward trend, with a rate of −0.6408 t/ha/a (P < 0.05). However, the downward trend has gradually slowed down (Figure 5).
Regionally, the annual soil erosion modulus in the six comprehensive control regions all showed a downward trend. Among them, the most obvious downward trends were in the “hilly and gully region” and the “gully region” of the Loess Plateau, which were −0.0107t/ha/a (P < 0.05) and −0.0099 t/ha/a (P < 0.05), respectively (Figure 6).

3.1.3. Accuracy Verification

Next, we compared the results of other researchers to verify the accuracy of our soil erosion modulus estimates (Table 2). Due to the different algorithms and different model parameters, the calculation period, area and resolution had some differences and deviations with the other considered studies. The results of this study were close to those of Sun et al. [37] and Qin et al. [38], which suggested that the calculations performed in this study were credible.

3.2. Driving Mechanism and Contribution Rate of Human Activities

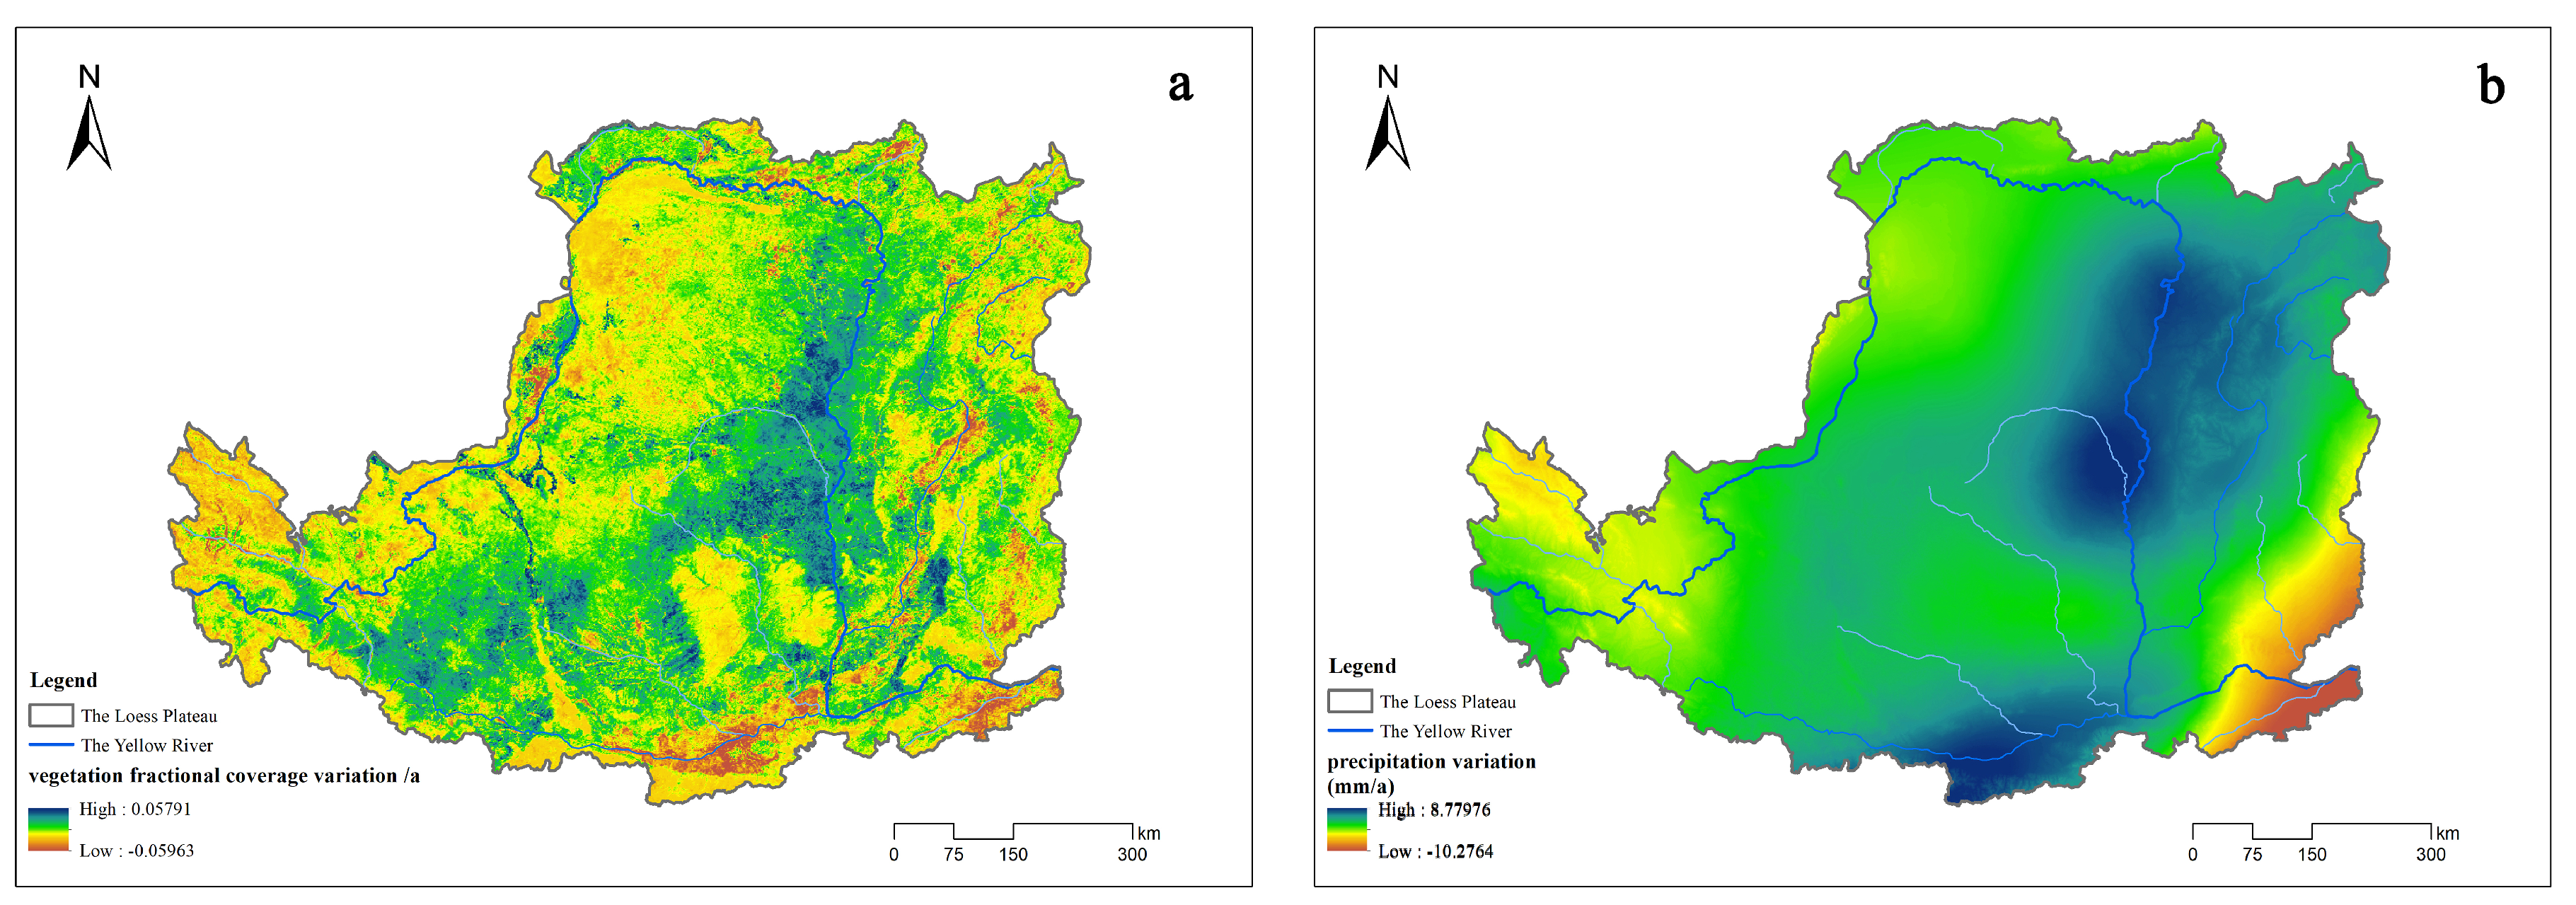
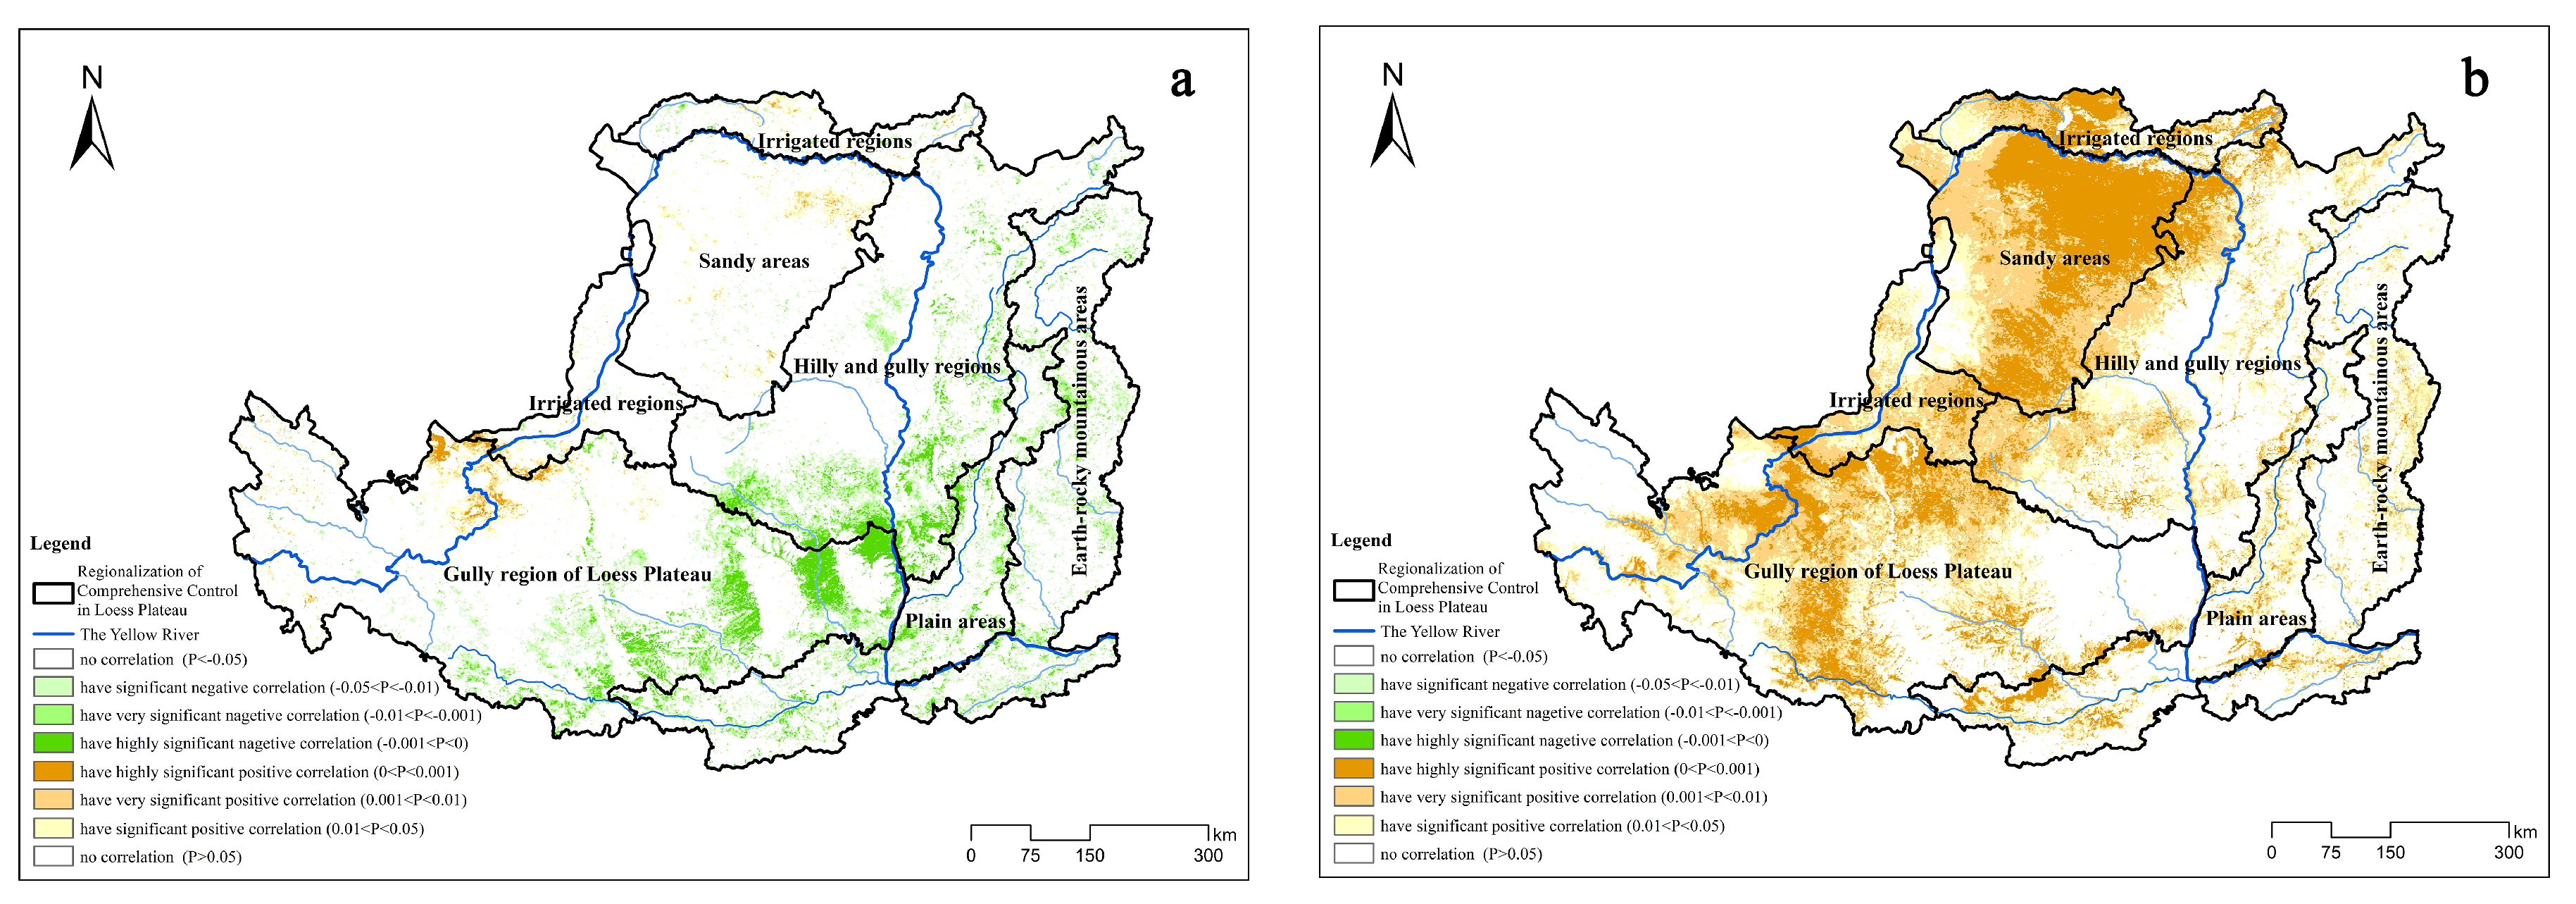
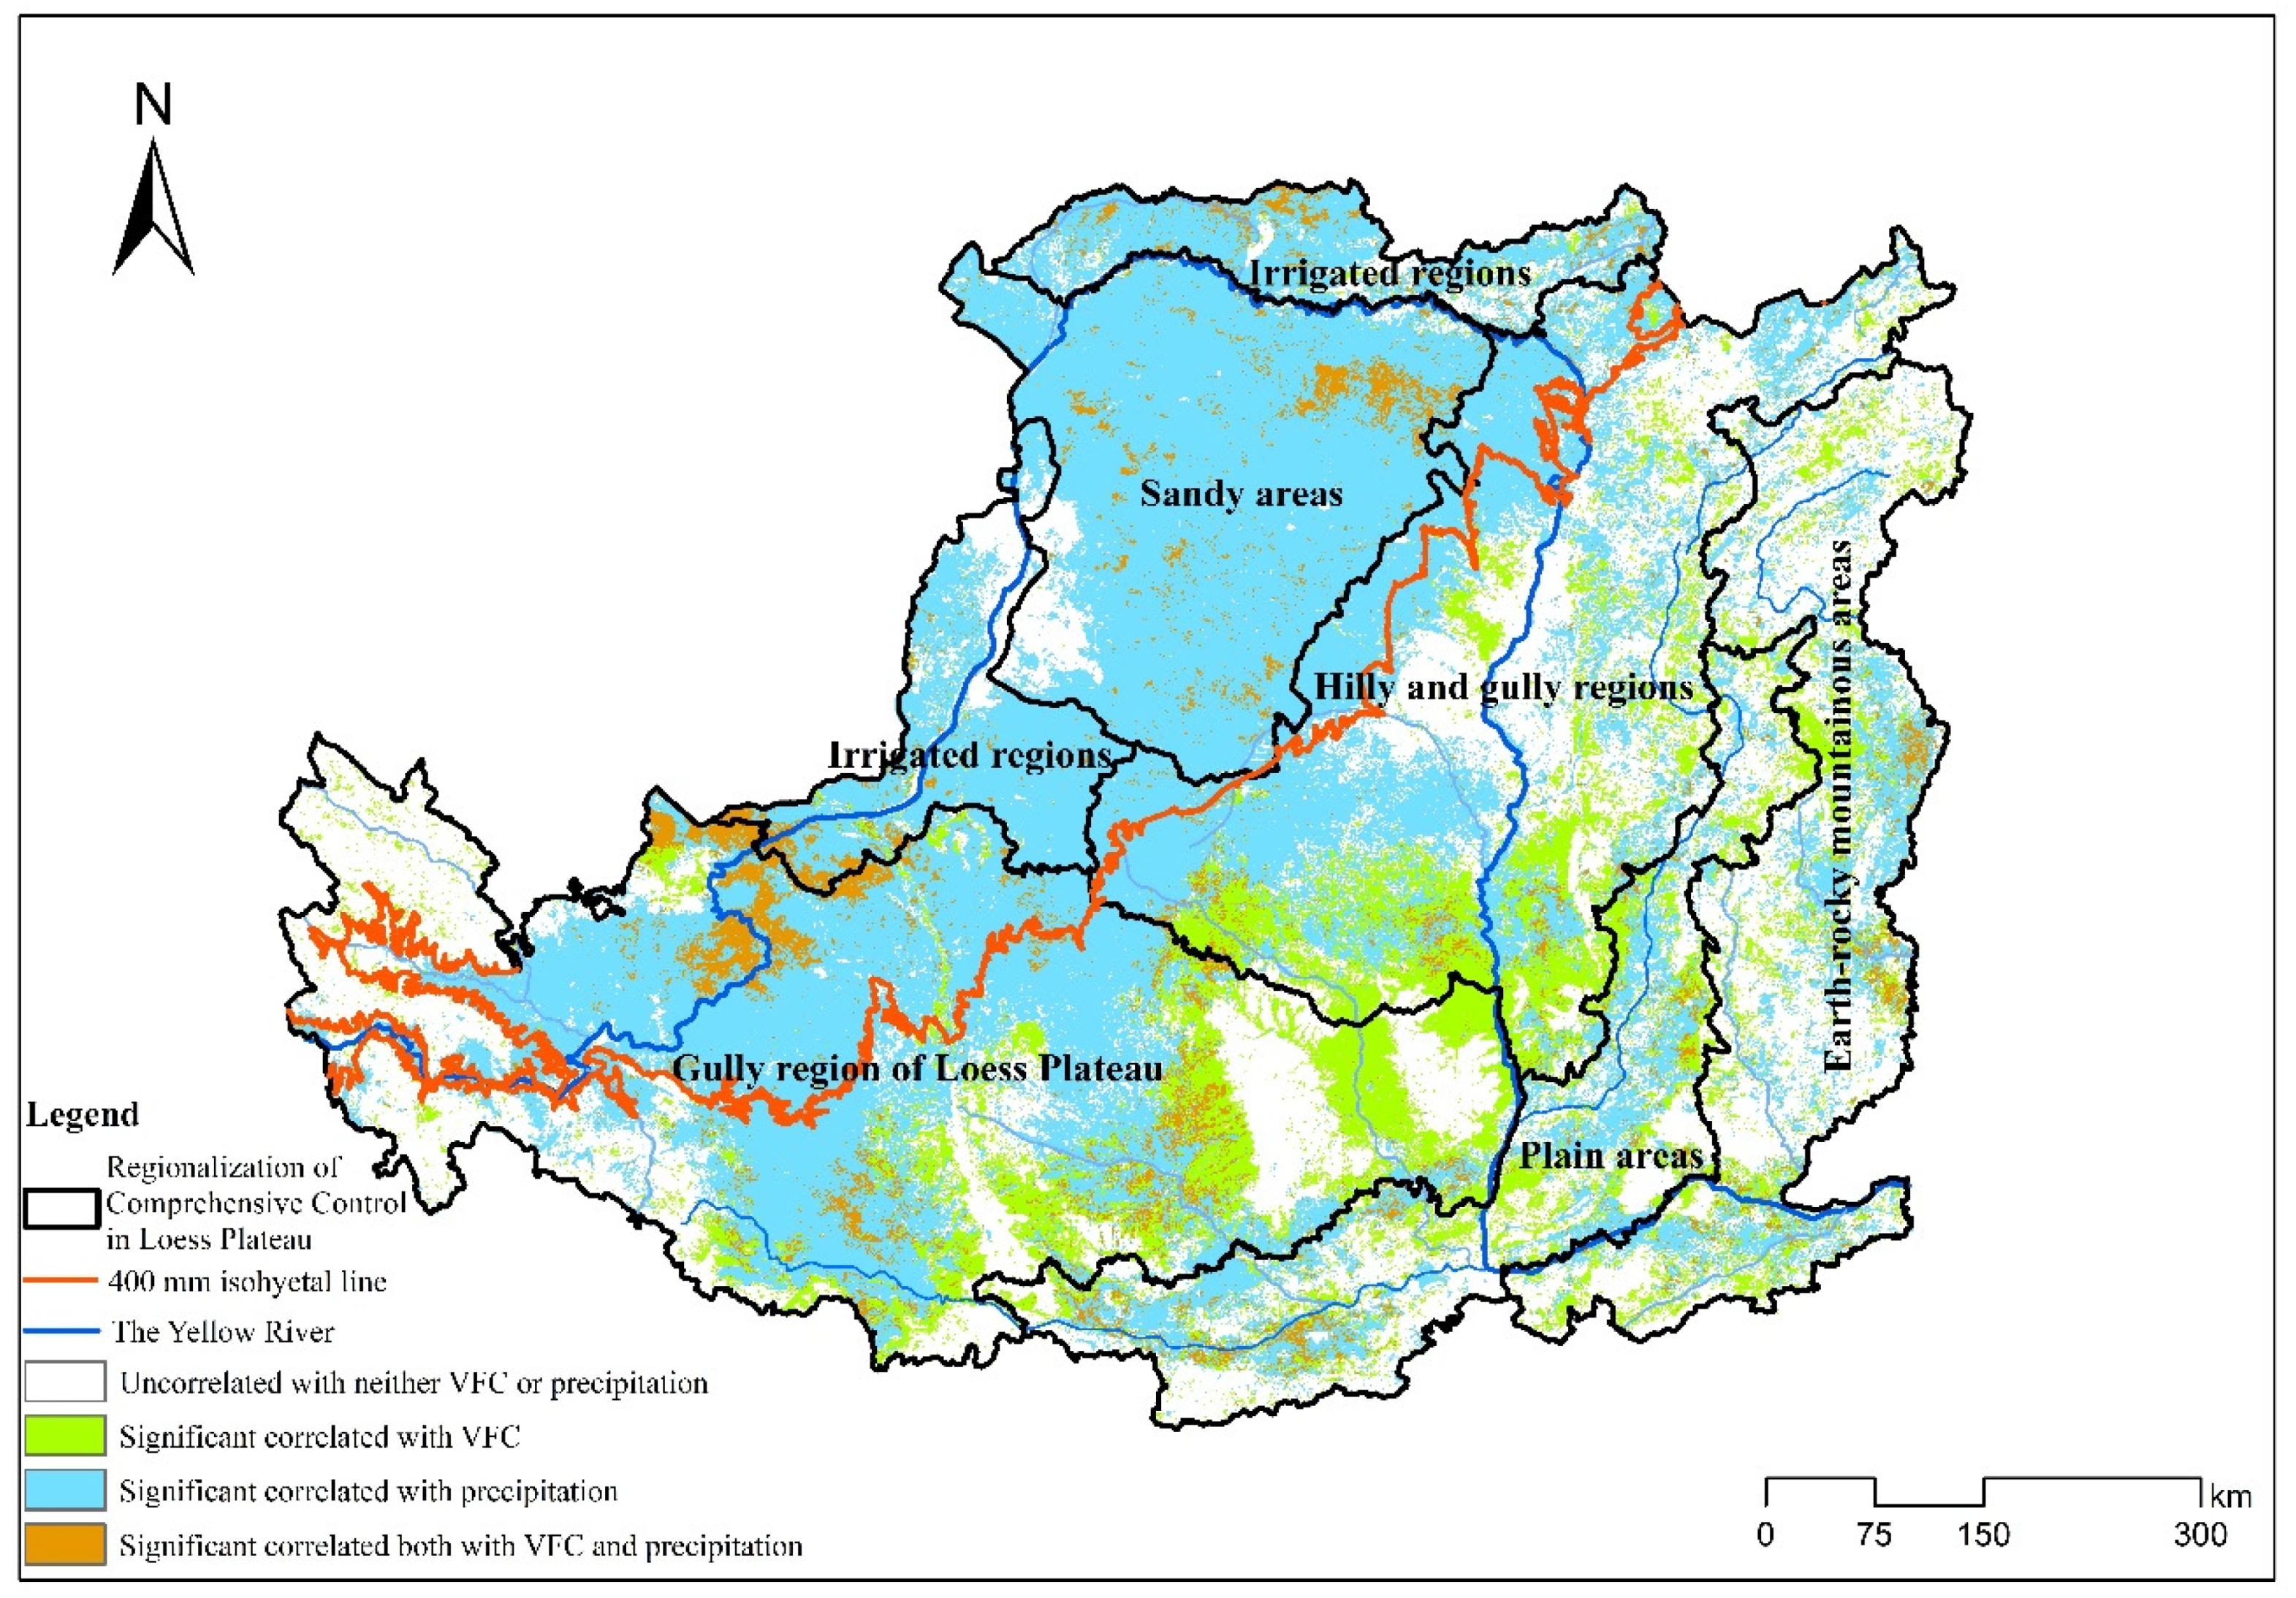
3.2.1. Response Mechanism of Soil Erosion Change to VFC and Precipitation

VFC and precipitation are the most direct and important factors affecting soil erosion change, and their annual variation ranges are much larger than other factors [37,41,42]. Understanding the driving relationship between them and soil erosion change can help deepen our understanding of the processes and mechanisms of soil erosion change.
Between 2000 and 2015, the VFC of the Loess Plateau increased as a whole, showing obvious regional differences. In the central part of the Loess Plateau, the VFC values of the “hilly and gully region” and the “plateau gully region” showed a significant upward trend. However, the VFC had a declining trend in most of the “plain areas.” some regions of the “earth-rocky mountainous,” “sandy areas” and “irrigated regions” (Figure 7a). From 2000 to 2015, precipitation in most areas of the Loess Plateau showed an upward trend, with the biggest increases in the “hilly and gully region” and the “Gully region of Loess Plateau”. Only the southeastern and western marginal regions of the Loess Plateau showed a downward trend (Figure 7b).
Through the Student’s t-test, a significant relationship between the annual variations of the VFC and precipitation with the soil erosion modulus on the Loess Plateau was obtained. According to Figure 8a, the VFC had a significant negative correlation with the soil erosion modulus in the southeastern part of the Loess Plateau (−0.05 < P < −0.01), where very significant negative correlations (−0.01 < P < −0.001) and highly significant negative correlations (−0.001 < P < 0) were seen for some areas. Hence, in these areas, the improvement of vegetation coverage restrained the occurrence of soil erosion. In the northwest, except for a small part of the region that had a significant positive correlation (0 < P < 0.05), there were no very significant correlations.
Figure 8b shows the relationships between the interannual variations of the precipitation and the soil erosion modulus. There was a significant positive correlation between them (0 < P < 0.05) in most areas of the northwestern Loess Plateau. In addition, most were very significantly positively correlated (0.001 < P < 0.01) or highly significantly positively correlated (0 < P < 0.001). This meant that precipitation controlled the amount of soil erosion modulus in the area as the soil erosion modulus will be the same whether the precipitation increases or decreases. Precipitation and soil erosion modulus did not show a very significant correlation in most areas in the southeastern part of the Loess Plateau.
Based on the t-test results of the VFC, precipitation and soil erosion modulus and their interannual variations (Figure 7 and Figure 8), we can make the following conclusions. From 2000 to 2015, the change of soil erosion modulus in the southeastern part of the Loess Plateau was mainly affected by the VFC, which showed a negative correlation. The decrease of soil erosion modulus in the “hilly and gully region” and the “plateau gully region” of the Loess Plateau were due to improved VFC. Moreover, precipitation mainly affected the soil erosion modulus in the northwest part of the Loess Plateau, which showed a positive correlation. The increase of soil erosion modulus in some areas in the “sandy areas” and “irrigated regions” is due to an increase of precipitation.

3.2.2. Contribution Rate of Human Activities

From 2000 to 2015, human activities on the Loess Plateau contributed negatively to soil erosion, with a contribution rate of −1.0774 (Table 3). An analysis of variance (ANOVA) was carried out to describe the impact of human activities and climate change on the variation of soil erosion rates, where 6210 points were randomly obtained in the study area with the sampling rate of 1%. The results show that human activities and climate change have significantly different effects on the soil erosion rate (P < 0.01), where the effect of the former is significantly greater than the latter on the decline of erosion rates (Table 4).
The contribution rate of human activities is distinct in terms of its spatial differentiation. Most of the northwestern part of the Loess Plateau had a negative contribution, that is, human activities inhibited the occurrence of soil erosion. The southeastern region was mainly characterized by a positive contribution, that is, human activities exacerbated the occurrence of soil erosion (Figure 9).
Regionally, the “sandy areas” in the northwest of the Loess Plateau had the greatest negative contribution rate to human activities, with an average contribution rate of −4.9807. This indicated that climate change in this region should had promoted the increase of soil erosion modulus, but human activities made the soil erosion modulus decrease. This may have arisen due to the limited vegetation growth conditions in the “sandy areas” and human activities in the region, including tree and grass planting and even agricultural activities which made the conditions for vegetation growth far better than they would normally be in a typical desert climate.
The “irrigated regions” had the second highest negative contribution of human activities, with an average contribution rate of −1.2717. In the process of agricultural production in the “irrigated areas”, agricultural measures such as irrigation and fertilization of cultivated land might result in the conditions of growing crops, fruit trees and other plants being better than those of vegetation under natural conditions in the area.
The average contribution rates of human beings in the “hilly and gully region” and the “plateau gully region” of the Loess Plateau are −0.5513 and −0.7805, respectively. Soil erosion declined most obviously from 2000 to 2015 in these two regions, which are the main implementation areas of the “Grain for Green Project” and the comprehensive control of small watersheds on the Loess Plateau. It can be concluded that the improvement of vegetation conditions by ecological engineering has played an important role in controlling the occurrence of soil erosion.
The contribution rate of human activities was positive in the “earth-rocky mountainous” and the “plain areas” in the southeastern part of the Loess Plateau, with average contribution rates of 0.2345 and 0.3929, respectively. These indicated that human activities in these two regions promoted the occurrence of soil erosion. The region with the largest positive contribution rate of human being was located in the Guanzhong plain urban agglomeration, where a dense population, developed industry and agriculture, frequent human production and living activities had destroyed surface vegetation and intensified the occurrence of soil erosion.

4. Discussion

4.1. Spatial Differentiation of the Soil Erosion Driving Mechanism and the Contribution Rate of Human Activities

Several areas had significant correlations between the VFC or precipitation change and soil erosion modulus change on the Loess Plateau. Additionally, each area either had a positive or negative contribution rate of human activities to the soil erosion modulus, although all showed similar spatial characteristics. The spatial differentiation between the southeast and northwest parts of the Loess Plateau was obvious, and a clear demarcation line from northeast to southwest emerged.

4.1.1. Demarcation Line of the Driving Mechanism

Using the precipitation data of the Loess Plateau from 2000 to 2015 to calculate the annual average precipitation, it is found that the 400-mm isohyetal line roughly coincides with the demarcation line of the significant influencing areas of VFC and precipitation on soil erosion on the Loess Plateau (Figure 10). The northwest, which has an annual average precipitation of less than 400 mm, is mainly affected by precipitation, while the southeast, which has an annual average precipitation of more than 400 mm, is mainly affected by VFC. The 400-mm isohyetal line is an important geographical boundary line in China, which distinguishes semi-humid and semi-arid areas, forest vegetation and grassland vegetation [43]. The southeast part of the 400-mm isohyetal line belongs to semi-humid areas with relatively better vegetation conditions, where precipitation is not a limiting factor for vegetation growth [44]. Therefore, rainfall hardly affects the soil erosion or vegetation growth, but rather the surface vegetation coverage is the main factor affecting vegetation growth in this region. However, the northwest part of 400-mm isohyetal line contains semi-arid areas, where grasslands and shrub vegetation are the main vegetation types. Arid climatic conditions make precipitation a limiting factor for vegetation growth, which can result in poorer vegetation conditions; hence, precipitation is a more effective inhibiting factor than VFC in terms of soil erosion in arid regions.

4.1.2. Demarcation Line of Human Activities Contribution Rate

The demarcation line dividing the positive and negative contribution rates of human activities on soil erosion was roughly consistent with the line proposed by Chinese geographer Hu Huanyong that expressed the distribution of population density (Figure 11) [45], which ran from Aihui, Heilongjiang Province (renamed Heihe City in 1983) to Tengchong, Yunnan Province. To the southeast of Hu’s Line, 36% of China’s territory and 96% of the population were distributed, while the northwest contained 64% of China’s territory and only 4% of the population. To the southeast of Hu’s Line, where the Guanzhong plain urban agglomeration consists of Tianshui City of Gansu Province, Baoji City, Xianyang City, Xi’an City, Shangluo City and Weinan City of Shaanxi Province, Yongji City, Yuncheng City, Hejin City and Linyi City of Shanxi Province is located in, the population density was high and human activities mainly focused on production and living activities such as the exploitation and utilization of natural and ecological resources. The land use types are mainly construction land and production land, which destroyed surface vegetation and promoted the deterioration of the ecological environment. Therefore, the occurrence of soil erosion was aggravated, as demonstrated by the positive increase in the soil erosion modulus. On the contrary, the population density northwest of Hu’s Line on the Loess Plateau was small, where both the living space and resources needed by human beings are small, and the ecological restoration and large-scale control projects have been implemented in this region, which include forests and grasslands, and which has resulted in a net inhibition of soil erosion.

4.1.3. Regional Characteristics of Soil Erosion Control on the Loess Plateau under the Combined Influence of Human and Climate

Population distribution and the natural environment are not independent of each other, as indicated by the spatial coincidence of the 400-mm isohyetal line and Hu’s Line. Climate conditions affected the natural environment of the Loess Plateau, and the natural environment determines the human population density and their way of production and lifestyle, which together had a combined effect on soil erosion on the Loess Plateau. The comprehensive influence of these processes led to the formation of the southeast-northwest spatial differentiation characteristic of the Loess Plateau in terms of soil erosion. In our study the Loess Plateau was divided into three parts: (1) Semi-arid area, where planting grass and drought-tolerant plants, building terraces and other engineering measures may better achieve soil and water conservation. This is consistent with the conclusion of Qiao’s research that the Soil Moisture Content (SMC) should be kept in mind when carrying out re-vegetation in semi-arid regions on the Loess Plateau [46]. (2) Afforestation areas, which are key areas for bioengineering and are suitable for afforestation. (3) Urban area, i.e. the main areas of human activities, which requires attention to prevent soil erosion at the same time of urban expansion, and hence achieve sustainable development (Figure 12).
Wang et, al. [47] obtained similar zoning results through an analysis of rainfall. In addition to rainfall, our study considers a variety of factors, including human activities and vegetation, which represents a more robust scientific result.

4.2. Deficiencies and Prospects in Soil-Erosion Research

In this study, human activities in farming areas showed a negative contribution to the increase of soil erosion modulus; that is, agricultural production activities could inhibit the soil erosion. In addition, the fine identification of agricultural measures could improve the accuracy and validity of the obtained results. For example, in this study, we used RUSLE to estimate soil erosion, where the C factor in our model is only based on VFC, which ignored the great impact of vertical structure of vegetation on soil erosion. The arbor layer, shrub layer, herb layer and litter could effectively intercept precipitation and reduce the rain kinetic energy. Studies have shown that the litter layer above 1 cm can reduce the occurrence of splash erosion by more than 90% [48]. Splash erosion is the main cause of soil loss in semi-arid regions with low rainfall intensities [49]. Therefore, it is necessary to further identify and study the underlying conditions of farmland and orchard vegetation to determine whether they perform the same or similar roles related to soil consolidation as grasslands and forests.
In addition, it is an indisputable fact that human-induced changes in land use patterns will indirectly affect regional climates [46,50]. The impact of human activities on soil erosion in this study refers to the direct intervention of humans on the process of soil erosion, while ignoring the complex human-land-atmosphere coupling behind it. The contribution rate of human activities calculated in this research is not a minimal aspect of the destruction of the natural environment by human production and living activities or the improvement of the natural environment by the implementation of ecological protection or restoration works, but a comprehensive contribution to environmental protection, good or bad. Generally, the actual benefits of ecological projection are higher than the contribution rate of human activities simulated in this study if a certain area contains human life activities. If the land parcel and implementation of the project area can be accurately determined, we can further separate the contribution rate of ecological engineering or human production and living activities by refining pure engineering plots, which is our future research focus.

5. Conclusions

From 2000 to 2015, the soil erosion modulus of the Loess Plateau showed a downward trend as a whole, with a rate of −0.6408 t/ha/a, although the downward trend gradually slowed down. Precipitation mainly affected the change of soil erosion modulus in the northwestern part of the Loess Plateau, as indicated by the significant positive correlation between them. The VFC mainly affected in the southeastern part of the Loess Plateau, which displayed a significant negative correlation. Within 16 years, human activities had a negative contribution to the change of soil erosion modulus, with a rate of −1.0774. The ANOVA result of the combined rate induced by human activities and climate change on the soil erosion rates was very significant (P < 0.01); that is, human activities effectively reduced the soil erosion modulus while climate change promoted soil erosion. Regionally, both the annual average soil erosion modulus and decline rate in the “hilly and gully region” and the “gully region of Loess Plateau” were the largest. The average human activity rate in these two regions were both negative, with rates of −0.5513 and −0.7805 respectively, which indicated that though climate change helped, human activities effectively controlled the occurrence of soil erosion by improving the surface vegetation conditions through ecological projects.
The soil erosion driving mechanisms and human contribution rates on the Loess Plateau showed a boundary line from northeast to southwest, which can be well explained by the identified 400-mm isohyetal line and the Hu’s Line. Finally, the Loess Plateau was divided into three parts, semi-arid area, afforestation area and urban areas, where different areas should implement different measures that meet the regional characteristics to effectively prevent soil erosion.

Author Contributions

Q.S. and X.G. conceived and designed the experiments; X.G. analyzed the data and wrote the paper.

Funding

This research was funded by the “National Key R&D Program of China, grant number 2017YFC0506501”, and “‘Beautiful China’ Ecological Civilization Construction Science and Technology Project, grant number XDA23100203”.

Acknowledgments

For data processing and calculation, we received guidance from Jiyuan Liu, researcher at the Institute of Geographic Science and Natural Resources Research, CAS, and great assist from Dapeng Liu and Haibo Huang. We would like to express our heartfelt gratitude to all of them.

Conflicts of Interest

The authors declare no conflicts of interest. The funding sponsors had no role in the study design, data collection, analyses, or interpretation; manuscript writing, or in publication decisions.

References

  1. Liu, B.Y.; Yang, Y.; Lu, S.J. Discriminations on common soil erosion terms and their implications for soil and water conservation. Sci. Soil Water Conserv. 2018, 16, 9–16. [Google Scholar] [CrossRef]
  2. Zhu, X.M.; Ren, M.E. Formation process and amelioration of the loess plateau in China. Chin. J. Popul. Resour. Environ. 1992, 1, 7–14. [Google Scholar] [CrossRef]
  3. Guo, J.Y. Research on the causes of collapsibility. Hydrogeol. Eng. Geol. 1958, 4, 9–13. [Google Scholar] [CrossRef]
  4. Guo, Y.W.; Kato, M. Discussion on the mechanism of loess collapsibility caused by irrigation from the aggregates stability-losing angle. J. Lanzhou Univ. 2007, 43, 6–10. [Google Scholar] [CrossRef]
  5. Shi, H.; Shao, M.A. Soil and water loss from the loess plateau in China. J. Arid Environ. 2000, 45, 9–20. [Google Scholar] [CrossRef]
  6. Chaplot, V.A.M.; Rumpel, C.; Valentin, C. Water erosion impact on soil and carbon redistributions within uplands of Mekong River. Glob. Biogeochem. Cycles 2005, 19. [Google Scholar] [CrossRef]
  7. Loughran, R.J.; Elliott, G.L.; Mcfarlane, D.J.; Campbell, B.L. A Survey of Soil Erosion in Australia using Caesium-137. Geogr. Res. 2010, 42, 221–233. [Google Scholar] [CrossRef]
  8. Foucher, A.; Salvador-Blanes, S.; Evrard, O.; Simonneau, A.; Chapron, E.; Courp, T.; Cerdan, O.; Lefèvre, L.; Adriaensen, H.; Lecompte, F.; et al. Increase in soil erosion after agricultural intensification: Evidence from a lowland basin in France. Anthropocene 2014, 7, 30–41. [Google Scholar] [CrossRef] [Green Version]
  9. Le Bissonnais, Y.; Montier, C.; Jamagne, M.; Daroussin, J.; King, D. Mapping erosion risk for cultivated soil in France. Catena 2002, 46, 207–220. [Google Scholar] [CrossRef]
  10. Li, Z.W.; Liu, C.; Dong, Y.T.; Chang, X.F.; Nie, X.D.; Liu, L.; Xiao, H.B.; Lu, Y.M.; Zeng, G.M. Response of soil organic carbon and nitrogen stocks to soil erosion and land use types in the loess hilly-gully region of China. Soil Tillage Res. 2017, 166, 1–9. [Google Scholar] [CrossRef]
  11. De Vente, J.; Poesen, J.; Verstraeten, G.; Govers, G.; Vanmaercke, M.; Van Rompaey, A.; Arabkhedri, M.; Boix-Fayos, C. Predicting soil erosion and sediment yield at regional scales: Where do we stand? Earth-Sci. Rev. 2013, 127, 16–29. [Google Scholar] [CrossRef]
  12. Fu, B.J. Soil erosion and its control in the loess plateau of China. Soil Use Manag. 1989, 5, 76–82. [Google Scholar] [CrossRef]
  13. Li, J.X.; Liu, Q.L.; Feng, X.M.; Shi, W.Y.; Fu, B.J.; Lv, Y.H.; Liu, Y. The synergistic effects of afforestation and the construction of check-dams on sediment trapping: Four decades of evolution on the Loess Plateau, China. Land Degrad. Dev. 2018, 30, 622–635. [Google Scholar] [CrossRef]
  14. Zhao, G.J.; Mu, X.M.; Jiao, J.Y.; An, Z.F.; Klik, A.; Wang, F.; Jiao, F.; Yue, X.L.; Peng, G.; Sun, W.Y. Evidence and causes of spatiotemporal changes in runoff and sediment yield on the Chinese Loess plateau. Land Degrad. Dev. 2016. [Google Scholar] [CrossRef]
  15. Fu, B.J.; Liu, Y.; Lv, Y.H.; He, C.S.; Zeng, Y.; Wu, B.F. Assessing the soil erosion control service of ecosystems change in the loess plateau of China. Ecol. Complex. 2011, 8, 284–293. [Google Scholar] [CrossRef]
  16. He, X.; Zhou, J.; Zhang, X.; Tang, K. Soil erosion response to climatic change and human activity during the quaternary on the loess plateau, China. Reg. Environ. Chang. 2006, 6, 62–70. [Google Scholar] [CrossRef]
  17. Fu, B.J.; Wang, Y.F.; Lv, Y.H.; He, C.S.; Chen, L.D.; Song, C.J. The effects of land-use combinations on soil erosion: A case study in the loess plateau of China. Prog. Phys. Geogr. 2009, 33, 793–804. [Google Scholar] [CrossRef]
  18. Zhao, G.; Mu, X.; Wen, Z.; Wang, F.; Gao, P. Soil erosion, conservation, and eco-environment changes in the loess plateau of China. Land Degrad. Dev. 2013, 24, 499–510. [Google Scholar] [CrossRef]
  19. Wei, Y.H.; He, Z.; Jiao, J.Y.; Li, Y.J.; Chen, Y.X.; Zhao, H.K. Variation in the sediment deposition behind check-dams under different soil erosion conditions on the Loess Plateau, China: Sediment deposition behind check-dams in different erosion conditions. Earth Surf. Process. Landf. 2018, 43. [Google Scholar] [CrossRef]
  20. Sun, L.; Zhang, G.H.; Wang, B.; Luan, L.L. Soil erosion resistance of black locust land with different ages of returning farmland on Loess Plateau. Trans. Chin. Soc. Agric. Eng. 2017, 33, 191–197. [Google Scholar] [CrossRef]
  21. Yu, K.K.; Xu, H.; Lan, J.H.; Sheng, E.G.; Liu, B.; Wu, H.X.; Tan, L.C.; Yeager, K.M. Climate change and soil erosion in a small alpine lake basin on the Loess Plateau, China. Earth Surf. Process. Landf. 2017, 8, 1238–1247. [Google Scholar] [CrossRef]
  22. The China Meteorological Data Service Center. Daily Data Set of Surface Climate in China (V3.0). Available online: http://cdc.cma.gov.cn (accessed on 7 April 2019).
  23. Wischmeier, W.H.; Smith, D.D. Predicting Rainfall Erosion Losses: A Guide to Conservation Planning [USA]; Agriculture Handbook No. 537; United States. Dept. of Agriculture: Wanshington, DC, USA, 1978; p. 537.
  24. Renard, K.G.; Foster, G.R.; Weesies, G.A.; Mccool, D.K.; Yoder, D.C. Predicting Soil Erosion by Water: A Guide to Conservation Planning with the Revised Universal Soil Loss Equation (RUSLE); Agricultural Handbook: No. 703; United States. Dept. of Agriculture: Washington, DC, USA, 1997.
  25. Lu, D.; Li, G.; Valladares, G.S.; Batistella, M. Mapping soil erosion risk in Rondônia, Brazilian Amazonia: Using RUSLE, remote sensing and GIS. Land Degrad. Dev. 2004, 15, 499–512. [Google Scholar] [CrossRef]
  26. Zhang, W.B.; Xie, Y.; Liu, B.Y. Estimation of rainfall erosivity using rainfall amount and rainfall intensity. Geogr. Res. 2002, 21, 384–390. [Google Scholar] [CrossRef]
  27. Williams, J.R. The erosion-productivity impact calculator (EPIC) model: A case history. Philos. Trans. B 1990, 329, 421–428. [Google Scholar] [CrossRef]
  28. Ministry of Ecology and Environment of the People’s Republic of China; National Development and Reform Commission. Ecological Protection Red Line Delineation Guide 2017; Document No. 48; Ministry of Ecology and Environment of the People’s Republic of China: Beijing, China; National Development and Reform Commission: Beijing, China, 2017.
  29. Mccool, D.K.; Foster, G.R.; Mutchler, C.K.; Meyer, L.D. Revised slope length factor for the universal soil loss equation. Trans. ASAE 1989, 30, 1387–1396. [Google Scholar] [CrossRef]
  30. Liu, B.Y.; Xie, Y.; Zhang, K.L. Prediction Model of Soil Erosion; Science and Technology of China Press: Beijing, China, 2001. [Google Scholar]
  31. Cai, C.F.; Ding, S.W.; Shi, Z.H.; Huang, L.; Zhang, Y.G. Study of applying USLE and Geographical Information System IDRISI to predict soil Erosion in small watershed. J. Soil Water Conserv. 2000, 14, 20–24. [Google Scholar] [CrossRef]
  32. Shobairi, S.O.; Li, M.Y. Dynamic Modelling of VFC from 2000 to 2010 Using NDVI and DMSP/OLS Time Series: A Study in Guangdong Province, China. J. Geogr. Inf. Syst. 2016, 8, 205–223. [Google Scholar] [CrossRef] [Green Version]
  33. Tang, Y.Z.; Shao, Q.Q.; Liu, J.Y.; Zhang, H.Y.; Yang, F.; Cao, W.; Wu, D.; Gong, G.L. Did Ecological Restoration Hit Its Mark? Monitoring and Assessing Ecological Changes in the Grain for Green Program Region Using Multi-Source Satellite Images. Remote Sens. 2019, 11, 358. [Google Scholar] [CrossRef]
  34. Ming, D.X. Field Trials and Statistical Analysis; Science Press: Beijing, China, 2008. [Google Scholar]
  35. Woodward, F.I.; Smith, T.M. Global Photosynthesis and Stomatal Conductance: Modelling the Controls by Soil and Climate. Adv. Bot. Res. 1994, 20. [Google Scholar] [CrossRef]
  36. Allen, R.G.; Pereira, L.S.; Raes, D.; Smith, M. Crop Evapotranspiration—Guidelines for Computing Crop Water Requirements—FAO Irrigation and Drainage Paper No. 56; FAO: Rome, Italy, 1998; p. 300. [Google Scholar] [CrossRef]
  37. Sun, W.Y.; Shao, Q.Q.; Liu, J.Y. Soil erosion and its response to the changes of precipitation and vegetation cover on the Loess plateau. J. Geogr. Sci. 2013, 23, 1091–1106. [Google Scholar] [CrossRef]
  38. Qin, W.; Guo, Q.K.; Cao, W.H.; Yin, Z.; Yan, Q.H.; Shan, Z.J.; Zheng, F.L. A new RUSLE slope length factor and its application to soil erosion assessment in a loess plateau watershed. Soil Tillage Res. 2018, 182, 10–24. [Google Scholar] [CrossRef]
  39. Tang, Q.; Xu, Y.; Bennett, S.J.; Li, Y. Assessment of soil erosion using RUSLE and GIS: A case study of the Yangou watershed in the Loess plateau, China. Environ. Earth Sci. 2015, 73, 1715–1724. [Google Scholar] [CrossRef]
  40. Qin, W.; Zhu, Q.; Zhang, Y. Soil erosion assessment of small watershed in loess plateau based on GIS and RUSLE. Trans. Chin. Soc. Agric. Eng. 2009, 25, 157–163. [Google Scholar] [CrossRef]
  41. Nearing, M.A.; Jetten, V.; Baffaut, C.; Cerdan, O.; Couturier, A.; Hernandez, M.; Le Bissonnais, Y.; Nichols, M.H.; Nunes, J.P.; Renschler, C.S.; et al. Modeling response of soil erosion and runoff to changes in precipitation and cover. Catena 2005, 61, 131–154. [Google Scholar] [CrossRef]
  42. Zhou, P.; Luukkanen, O.; Tokola, T.; Nieminen, J. Effect of vegetation cover on soil erosion in a mountainous watershed. Catena 2008, 75, 319–325. [Google Scholar] [CrossRef]
  43. Zheng, J.Y.; Yin, Y.H.; Li, B.Y. A new scheme for climate regionalization in China. Acta Geogr. Sin. 2010, 65, 3–12. [Google Scholar] [CrossRef]
  44. Du, J.Q.; Shu, J.M.; Zhang, L.B.; Guo, Y. Responses of vegetation to climate change in the headwaters of China’s Yellow River Basin based on zoning of dry and wet climate. Chin. J. Plant Ecol. 2011, 35, 1192–1201. [Google Scholar] [CrossRef]
  45. Hu, H.Y. Essays on China’s population distribution. Acta Geogr. Sin. 1935, 2, 33–74. [Google Scholar]
  46. Jiao, Q.; Rui, L.; Wang, F.; Mu, X.; Li, P.F.; An, C.C. Impacts of re-vegetation on surface soil moisture over the chinese loess plateau based on remote sensing datasets. Remote Sens. 2016, 8, 156. [Google Scholar] [CrossRef]
  47. Wang, Z.L.; Shao, M.A.; Chang, Q.R. Effects of Rainfall Factors on Soil Erosion in Loess Plateau. J. Northwest Agric. Univ. 1998, 26, 101–105. [Google Scholar]
  48. Wu, X.Q.; Zhao, H.Y.; Liu, X.D.; Han, B. Evaluation on role of forest litter to water source conservation and soil and water conservation. J. Soil Eros Soil Water Conserv. 1998, 4, 24–28. [Google Scholar] [CrossRef]
  49. Vaezi, A.R.; Ahmadi, M.; Cerdà, A. Contribution of raindrop impact to the change of soil physical properties and water erosion under semi-arid rainfalls. Sci. Total Environ. 2017, 583, 382–392. [Google Scholar] [CrossRef] [PubMed]
  50. Kalnay, E.; Cai, M. Impact of urbanization and land-use change on climate. Nature 2003, 423, 528–531. [Google Scholar] [CrossRef] [PubMed]
Figure 1. Location of the study area and regionalization of comprehensive control in the Loess Plateau.
Remotesensing 11 02429 g001
Figure 2. Technical flow chart.
Remotesensing 11 02429 g002
Figure 3. Distribution of National Meteorological station.
Remotesensing 11 02429 g003
Figure 4. Soil erosion modulus of the Loess Plateau from 2000 to 2015.
Remotesensing 11 02429 g004
Figure 5. Interannual variations of the average soil erosion modulus on the Loess Plateau.
Remotesensing 11 02429 g005
Figure 6. Interannual variations of the average soil erosion modulus of the comprehensive control regions on the Loess Plateau.
Remotesensing 11 02429 g006
Figure 7. Interannual variations of (a) Vegetation Fractional Coverage (VFC) and (b) precipitation on the Loess Plateau from 2000 to 2015.
Remotesensing 11 02429 g007
Figure 8. Student’s t-test of changes in the (a) VFC and soil erosion modulus and (b) precipitation and soil erosion modulus.
Remotesensing 11 02429 g008
Figure 9. Contribution rate of human activities on soil erosion modulus change on the Loess Plateau during 2000 to 2015.
Remotesensing 11 02429 g009
Figure 10. Correlation between VFC and precipitation and the erosion modulus determined with the student’s t-test.
Remotesensing 11 02429 g010
Figure 11. Human activity contribution rate of soil erosion modulus change and the location of Hu’s Line (1935).
Remotesensing 11 02429 g011
Figure 12. Spatial division of soil erosion characteristics in the Loess Plateau.
Remotesensing 11 02429 g012
Table 1. Annual average soil erosion moduli of the comprehensive control regions in the Loess Plateau.
Regionalization of Comprehensive ControlIrrigated RegionsSandy AreasHilly and Gully RegionsGully region of Loess PlateauEarth-Rocky Mountainous AreasPlain AreasTotal Loess Plateau
Annual average soil erosion modulus (t/ha/a)9.19084.218232.678928.579913.785011.366620.8856
Table 2. Comparison of the annual average soil erosion moduli with published studies.
AreaYearAnnual Soil Erosion Modulus (t/ha/a)Annual Soil Erosion Modulus in the Same Area (Year) (t/ha/a)References
Yangou in the Loess Plateau1997–200613,4.600041.9038 (2000–2006)Tang, Xu, Bennett, & Li, 2015. [39]
Simianyaogou in the Loess Plateau1971–200443.9979 101.1177 (2000–2004)Qin, Zhu, & Zhang, 2009. [40]
The Loess Plateau2000–201015.2000 21.8140 (2000–2010)Sun, Shao, & Liu, 2013. [37]
Lvergou in the Loess Plateau1993–201318.890018.3016 (2000–2013)Qin, et al., 2018. [38]
Table 3. Average contribution rate of human activities in the comprehensive control regions on the Loess Plateau.
Regionalization of Comprehensive ControlIrrigated RegionsSandy AreasHilly and Gully RegionsGully Region of Loess PlateauEarth-Rocky Mountainous AreasPlain AreasTotal Loess Plateau
C h 1−1.2717−4.9807−0.5513−0.78050.23450.3929−1.0774
1 Here, under the premise that the average soil erosion modulus of each region is reduced, C h < −1 indicates that human activities have a negative contribution to the increase of soil erosion modulus while climate change promotes soil erosion. When −1 ≤ C h < 0, it indicates that human activities cooperated with climate change to inhibit the increase of the soil erosion modulus. When C h > 0, it indicates that human activities inhibits climate change and promotes the increase of soil erosion modulus.
Table 4. ANOVA of the contribution rates of human activities and climate change on soil erosion rates.
Sum of SquaresdfMean SquareFSig.
Between Groups2415.1112415.1121.430.0000037
Within Groups1399184.2612418112.67
Total1401599.3712419

