Article

Increasing the Number of Sea Surface Reflected Signals Received by GNSS-Reflectometry Altimetry Satellite Using the Nadir Antenna Observation Capability Optimization Method

1
School of Astronautics, Nanjing University of Aeronautics and Astronautics, Nanjing 210016, China
2
Qian Xuesen Laboratory of Space Technology, China Academy of Space Technology, Beijing 100094, China
3
School of Data Science, Taiyuan University of Technology, Jinzhong 030600, China
4
School of Geomatics, Liaoning Technical University, Fuxin 123000, China
5
College of Aeronautics and Astronautics, University of Electronic Science and Technology of China, Chengdu 611731, China
6
School of Surveying and Landing Information Engineering, Henan Polytechnic University, Jiaozuo 454000, China
7
School of Instrumental Science and Engineering, Southeast University, Nanjing 210096, China
8
Xian Institute of Space Radio Technology, China Academy of Space Technology, Xian 710100, China
*
Author to whom correspondence should be addressed.
Those authors contributed equally to this paper.
Remote Sens. 2019, 11(21), 2473; https://doi.org/10.3390/rs11212473
Submission received: 12 September 2019 / Revised: 21 October 2019 / Accepted: 21 October 2019 / Published: 23 October 2019
(This article belongs to the Special Issue Global Navigation Satellite Systems for Earth Observing System)

Abstract

:
High spatial resolution Global Navigation Satellite System-Reflectometry (GNSS-R) sea surface altimetry is of great significance for extracting precise information from sea surface topography. The nadir antenna is one of the key payloads for the GNSS-R altimetry satellite to capture and track the sea surface GNSS reflected signal. The observation capability of the nadir antenna directly determines the number of received reflected signals, which, in turn, affects the spatial resolution of the GNSS-R altimetry. The parameters affecting the ability of the nadir antenna to receive the reflected signal mainly include antenna gain, half-power beam width (HPBW), and pointing angle. Thus far, there are rarely studies on the observation capability of GNSS-R satellite nadir antenna. The design of operational satellite antenna does not fully combine the above three parameters to optimize the design of GNSS-R nadir antenna. Therefore, it is necessary to establish a GNSS-R spaceborne nadir antenna observation capability optimization method. This is the key to improving the number of sea surface reflected signals received by the GNSS-R altimeter satellites, thereby increasing the spatial resolution of the altimetry. This paper has carried out the following research on this. Firstly, based on the GNSS-R geometric relationship and signal processing theory, the nadir antenna signal-to-noise ratio model (NASNRM) with the gain and the elevation angle at the specular point (SP) as the main parameters is established. The accuracy of the model was verified using TechDemoSat-1 (TDS-1) observations. Secondly, based on the theory of electromagnetic scattering, considering the influence of HPBW and pointing angle on the antenna footprint size, a specular point filtering algorithm (SPFA) is proposed. Combined with the results obtained by NASNRM, the number of available specular points (SPs) is counted. The results show that as the antenna gain and the nadir-pointing angle increase, the number of SPs can reach a peak and then gradually decrease. Thirdly, combined with NASNRM and SPSA, a nadir antenna observation capability optimization method (NAOCOM) is proposed. The nadir antenna observation capability is characterized through the reflected signal utilization, and the results obtained by the method are used to optimize the combination of nadir antenna parameters. The research shows that when the orbital height of the GNSS-R satellite is 635 km, the optimal combination of nadir antenna parameters is 20.94 dBi for the gain and 32.82 degrees for the nadir-pointing angle, which can increase the observation capability of the TDS-1 satellite nadir antenna by up to 5.38 times.

Graphical Abstract

1. Introduction

The global sea surface height can be used to monitor global climate change, acquire the geoid, and invert the ocean gravity field, and plays an important role in the study of oceanic dynamics, geodesy, and geophysics. At present, sea surface height can be obtained by the ship survey, tide station, and radar altimeter. However, ship survey and tide station mode are inefficient at spatial sampling and unable to reach global ocean coverage. Although radar altimeter can obtain high precision global sea surface height, its spatial resolution cannot meet the requirements of mesoscale observation [1]. As an effective and innovative bistatic radar remote sensing technique, Global Navigation Satellite System-Reflectometry (GNSS-R) has the advantages of multiple signal sources, low cost, wide coverage, and simultaneous measurement of multiple reflection points. It can be applied to sea surface height measurement to effectively make up for the shortcomings of conventional measurement methods [2]. In 1993, Martin-Neira [3] first proposed the concept of passive reflectometry and interferometry system (PARIS) and pointed out the possibility of ocean altimetry using GPS reflected signals. According to the method of obtaining the direct and the reflected signal delay, the GNSS-R altimetry can be divided into the group delay altimetry and the phase delay altimetry [4,5]. The group delay altimetry has been validated for use in open oceans and continental ice sheets [6,7]. Based on the different observation equipment configurations and data processing methods, the group delay altimetry has an accuracy of 0.2–3.0 m per second [8,9,10]. The phase delay altimetry has also been demonstrated in multiple applications, such as sea ice altimetry, using a ground-based instrument [11], water surface survey on the airborne platform [12], and ice altimetry through GNSS-R satellite [13]. Compared with the group delay altimetry, the phase delay altimetry has higher requirements for the observation environment.
To date, the feasibility of GNSS-R altimetry has been verified, and further improvement and utilization of its high sampling spatial resolution (if not stated, the spatial resolution mentioned in this paper is the sampling spatial resolution) observation capability is the key to its application. The higher spatial resolution of GNSS-R ocean altimetry can effectively improve the spatial resolution of the inversion oceanographic model, thereby reducing the error caused by a numerical difference in the model application, which is of great significance for the refined research of oceanic activity [14,15,16]. Among them, the underwater gravity-aided inertial navigation based on the ocean gravity field model is an important means of underwater autonomous navigation. This navigation has the characteristics of high precision, long navigation time, and concealment. The gravity-aided inertial navigation can match the gravity real-time measurement data with the global gravity field model to obtain the position information, and then correct the positioning error accumulated by the inertial navigation over time, which can improve the accuracy of underwater positioning and navigation [17]. Establishing a high-precision, high-spatial resolution global gravity field model is the basis for applying gravity passive navigation technology to practical underwater navigation [18]. At present, the ocean gravity field model is mainly obtained by inverting radar altimeter observations. Our research team of navigation and detection based on the information of aerospace-aeronautics-marine integration (http://www.qxslab.cn/ndia/) of Qian Xuesen Laboratory of Space Technology has carried out a prospective research on the methods and key technologies for obtaining high, spatially resolved ocean gravity field based on the GNSS-R measurements, thereby improving gravity-aided inertial navigation accuracy. Obtaining a high-spatial resolution ocean gravity field is the key technology. In terms of spatial resolution along a track, the GNSS-R altimetry can reach 1 km compared to the radar altimeter of 6 km [1]. The low power and narrow bandwidth of reflected signals are the main limitations of the performance of the group delay altimetry. Since the power of GNSS reflected signal is weak, a nadir antenna with high gain is required. In order to guarantee the spatial resolution of detection, a large HPBW is required. However, the antenna gain is inversely proportional to the HPBW [19]. In addition, the pointing angle will also affect the size of the antenna field of view. Therefore, the optimal design of the nadir antenna parameters is needed, which directly determines its ability to capture, track, and utilize the reflected signals, and ultimately affect the spatial resolution of the GNSS-R altimetry. It should be noted that the nadir antenna studied in this paper is a single antenna.
The influence of antenna parameters on GNSS-R measurement performance has been studied. Hajj et al. [20] and Jales [21] have studied the impact of HPBW or gain on the number of visible GPS satellites on GNSS-R satellites. Gao et al. [22] and Bussy-Virat et al. [23] considered the effect of nadir antenna gain on received signal power when studying the resolution of GNSS-R observations. However, the above research studied the influence of single antenna parameters on the observation capability of GNSS-R, there are relatively few studies on comprehensive consideration of multiple antenna parameters.
The link analysis is generally used in the design of satellite antennas [24]. The nadir antenna parameters of the launched GNSS-R satellites can be obtained from the relevant materials. Among them, in 2003, the UK Disaster Monitoring Constellation (UK-DMC) with an orbital altitude of 700 km successfully received GPS reflected signals using a left hand circularly polarized (LHCP) antenna with a gain of 11.8 dB [25]. In 2014, TDS-1, with an orbital altitude of 635 km, used an antenna pointing to geo-center to capture GPS L-band sea surface reflected signals. The antenna has a peak gain of 13.3 dB and an HPBW of 29~32.5° [26]. On August 15th, 2016, the GNSS-R experimental 3Cat-2 satellite designed by the Universitat Politècnica de Catalunya successfully operated in orbit at 510 km altitude. The purpose of the satellite is to evaluate the payloads and GNSS-R measurement performance. The nadir antenna uses a dual-band (L1, L2) 3 × 2 patch array. The peak gains of the L1 and L2 band LHCP antennas are 12.9 dB and 11.6 dB, respectively [27]. At the end of 2016, the National Aeronautics and Space Administration (NASA) launched the Cyclone Global Navigation Satellite System (CYGNSS) mission, which used eight micro-satellites. The purpose of the system is to enhance the ability to monitor and forecast hurricanes. Each micro-satellite carried two off-looking LHCP antennas with a pointing angle of 28 degrees, which greatly improves the number of received reflected signals and achieves a spatial resolution of 10–25 km [28]. On June 5, 2019, China Aerospace Science and Technology Corporation (CASC) successfully launched the Catching Wind No.1 Constellation. The mission expects to achieve typhoon monitoring and forecasting in orbits of nearly 600 km, which shows the broad application potential of spaceborne GNSS-R in disaster warning [29]. However, the GNSS-R altimetry environment is more complicated. In the design of the spaceborne nadir antenna, the conventional link analysis does not reflect the correlation of signal quantity and quality with pointing angle and sea state. Meanwhile, the launched GNSS-R satellites are mainly used for wind speed measurement, which focuses on the temporal resolution, while the ocean altimetry mainly focuses on spatial resolution. To summarize, at present, little and few systematic analyses consider the GNSS-R nadir antenna observation capability of gain, HPBW, and pointing angle. The existing antenna design methods cannot meet the design needs of high-precision, high-spatial resolution GNSS-R altimetry satellites.
Different from previous studies, based on the electromagnetic scattering and GNSS-R theory, this paper proposes a GNSS-R spaceborne nadir antenna observation capability optimization method (NAOCOM). The method considers the effects of parameters such as gain, HPBW, and off-pointing angle, and uses the reflected signals utilization to characterize the observation ability of the nadir antenna. The number of GNSS-R altimeter satellite received reflected signals can be increased by obtaining the optimal combination of nadir antenna parameters. Firstly, according to the geometric relationship of GNSS-R, the propagation distance of the signal is expressed by the GNSS-R satellite orbital altitude and the elevation angle at SP. By combining with different models, the model of the relationship between the signal-to-noise ratio (SNR) received by spaceborne nadir antenna, and the gain, orbital altitude, elevation angle, and wind speed is established. The accuracy of the model was verified using TDS-1 observations. Secondly, considering the sea surface Fresnel reflection, SNR threshold setting, and antenna field of view, a specular point filtering algorithm (SPFA) based on elevation angle is proposed. Using the SPFA, the number of available SPs is obtained. Thirdly, combined with NASNRM and SPSA, the NAOCOM is proposed. Using NAOCOM to analyze the relationship between the SPs number and gain, pointing angle, and wind speed, the optimal combination of nadir antenna parameters is obtained. The results are compared with those of available SPs under TDS-1 nadir antenna parameters.

2. Data Sets

2.1. TDS-1 Space GPS Receiver Remote Sensing Instrument Data Collections

The TDS-1 satellite was successfully launched on 8 July 2014. TDS-1 is a UK-funded technology demonstrator satellite which carries eight experimental payloads, including the space GNSS receiver remote sensing instrument (SGR-ReSI). Since its operation, abundant GNSS-R observation data have been obtained through SGR-ReSI. According to the data processing methods, the data collections are divided into three levels: L0, L1, and L2 (http://www.merrbys.co.uk). L0 products mainly contain the raw sample data. L1 products mainly contain information about delay Doppler maps (DDMs), satellite orbits ephemeris and SPs position. L2 products mainly include the results of mean square slope (tracks) and wind speed [26]. This paper mainly uses the following data of TDS-1:
  • The SNR of the peak DDM. This data is recorded in the metadata.nc file of the L1 products and is used to verify the accuracy of NASNRM.
  • The nadir antenna gain map. The gain of the antenna in different directions is not the same. For better simulation calculation in Section 4.1, the TDS-1 nadir antenna gain map file is used to calculate the SNR.
  • TDS-1 satellite ephemeris. Since TDS-1 products have been a threshold in terms of signal channel number, it is not possible to obtain all available SPs information within a period of time through this product. Based on this restriction, the SPs information is recalculated. In order to avoid errors introduced by the orbital simulation, the coordinates of the TDS-1 in the L1 product are used.
  • Wind speed. In order to calculate the weight of different wind speeds in a period of time, this paper gets the wind speed information from the TDS-1 observation based on the ‘L2_FDI.nc’ in the L2 product.
The TDS-1 observations of 24 h from 31 March 2018 20:00:00 h to 1 April 2018 20:00:00h were used in this study.

2.2. Global Navigation Satellite System Precision Ephemeris

The GNSS final precision orbit ephemeris released by International GNSS Service (IGS) is used for obtaining the GPS satellite coordinates (http://cddis.gsfc.nasa.gov). It is necessary to note that the observation interval set in this paper is 15 s, while the TDS-1 L1b sampling interval is 1 s, and the GNSS satellite ephemeris data interval is 15 min. Therefore, it is necessary to unify the temporal resolution of the above two satellite coordinates to 15 s. TDS-1 satellite coordinates with corresponding resolution can be obtained by the original information every 15 s. GNSS satellite coordinates with 15 s can be obtained by fitting the precise ephemeris with Chebyshev polynomial [30]. The coordinates of GPS and TDS-1 obtained from related products are represented in the ECEF WGS-84. Since the TDS-1 can only receive GPS reflected signals, this study used GPS satellite information in the GNSS precision ephemeris.

3. Methodology

The NAOCOM is the basis for obtaining the optimal parameter combination of the nadir antenna. The method consists of two parts, the NASNRM, and the SPFA. The NASNRM and the SPFA contacted with the elevation angle at the SP. The NASNRM takes the antenna gain and elevation angle as the main parameters. The SPFA considers the effect of HPBW and pointing angle on the footprint size of the antenna based on the elevation angle. The results obtained by this method provide the database for the optimal analysis of antenna observation capabilities in Section 4.

3.1. The Nadir Antenna Signal-to-Noise Ratio Model (NASNRM)

The antenna gain is a decisive factor affecting the power intensity of the GNSS-R platform receiving the GNSS reflected signals. However, the received signal power does not fully describe the clarity of the signal, and it is still necessary to obtain the strength of the signal relative to the noise. Therefore, this paper uses SNR to measure signal quality. Since the SPs can be screened based on the elevation angle, it is necessary to acquire an SNR model with the elevation angle as a parameter.
Firstly, the received GNSS reflected signal power needs to be calculated based on the gain. Zavorotny and Voronovich [31] proposed a theoretical scattering model (Z-V model) of bistatic reflected GNSS signals based on the geometric optical limit of Kirchhoff approximation. The model describes the GNSS reflected signal power as a function of geometric and environmental parameters. Based on the Z-V model, the NASNRM is derived. The Z-V model as follows [31]:
Y S τ , f 2 = P T λ 2 T c o h 2 4 π 3 A s G T ρ G R ρ Λ Δ τ ρ 2 S Δ f ρ 2 R T P 2 ρ R P R 2 ρ σ 0 ρ d 2 ρ  
where τ and f represent the delay and Doppler frequency of reflected signals, respectively, P T is the GNSS signal transmission power, λ is the electromagnetic wavelength of the signal, T c o h is coherent integration time, ρ is the position of the SP, G T ρ and G R ρ are the gain of GNSS transmit antenna and GNSS-R receive antenna, R T P and R P R represent the distances between the SP ( ρ ) and the transmitter and receiver, Δ τ ρ is the difference between the delay of the scattered signal component and τ , Δ f ρ is the Doppler shift between sea surface scattering points and SPs, and σ 0 ρ is the polarization-dependent bistatic radar scattering coefficient, or simply scattering coefficient. The integration domain A S is referred to as the “glistening zone,” which is the active scattering area that effectively contributes to the reflected signal. Λ is the Woodward ambiguity function (WAF) [32], which accounts for the signal modulation characteristics, where S is the sinc-shaped function. The DDM Y S τ , f 2 2 corresponds to the GNSS power scattered by the surface as a function of the delay τ and Doppler frequency f .
The σ 0 ρ is determined by the signal frequency and sea state and is an important characterization of the GNSS signal at the sea surface scattering intensity. This paper mainly studies the received signal power at the SP, and therefore only considers the power of the forward scattering of the GNSS signal at the SP. At present, the theoretical model of sea surface scattering mainly includes small slope approximation (SSA), Kirchhoff approximation-geometric optics (KA-GO), and two-scale model (two-scale model, TSM) et al. [33,34,35]. Since the KA-GO can give a better approximation in the specular direction, this paper uses the KA-GO to estimate the GNSS signal scattering coefficient [34].
σ 0 ρ = π 2 q / q z 4 P ( q / q z )  
where is the Fresnel scattering coefficient, and its value mainly depends on the signal polarization mode, seawater dielectric constant ε and local incident angle θ . Respectively, q is the scattering vector, q = ( q , q z ) = k ( n m ) , q and q z represent the horizontal and vertical components of scattering vectors, m and n are the vectors of incident and scattered waves. The sea surface slope probability density function P ( q / q z ) determines the GNSS signal scattering coefficient. If the sea surface is subject to Gaussian distribution, it can be known in two dimensions [36]:
P ( q / q z ) = P ( q x / q z , q y / q z ) = P ( Q x , Q y ) = 1 2 π m s s x m s s y 1 b x , y 2 exp 1 2 1 b x , y 2 Q x 2 m s s x 2 b x , y Q x Q y m s s x m s s y + Q y 2 m s s y
where m s s is the mean-square-slope (MSS), Q x and Q y represent the component of the MSS along the X and Y directions, respectively. b x , y is the correlation coefficient between the two MSS components in the horizontal direction. Both m s s and b x , y are directly related to the sea spectrum. This paper uses the Elfouhaily spectrum [37].
In this paper, the results obtained by NASNRM are used to screen the available reflected signals according to the elevation angle. Therefore, it is necessary to establish a link between the elevation angle at the SP and the NASNRM. According to the GNSS-R geometric (Figure 1), it is known that the expression of GNSS signal propagation distance from GNSS-R orbital satellite altitude and elevation angle is the key to model constructing.
According to Figure 1:
R T P 2 + R E 2 2 R T P R E cos 90 0 + α = H T + R E 2 R P R 2 + R E 2 2 R P R R E cos 90 0 + α = H R + R E 2
It can be obtained from Equation (4):
R T P = R E sin α + H T + R E 2 R E 2 cos 2 α R P R = R E sin α + H R + R E 2 R E 2 cos 2 α
The signal propagation distance R T P and R P R can be expressed by the elevation angle α and GNSS-R satellite orbital altitude H R by Equation (5).
In order to more accurately evaluate the ability of the antenna to receive signals, the SNR needs to be calculated in conjunction with the effects of the antenna thermal noise:
S N R = Y S τ , f 2 P N = P T λ 2 T c o h 2 4 π 3 k T B A s G T ρ G R ρ Λ Δ τ ρ 2 S Δ f ρ 2 R T P 2 ρ R P R 2 ρ σ 0 ρ d 2 ρ
where k is the Boltzmann constant, its value is 1.38 × 10 23 J / K , T is the equivalent noise temperature, B is the signal bandwidth.
The simultaneous Equations (5) and (6) can obtain the model between the received SNR of the GNSS-R spaceborne nadir antenna and the gain, the elevation angle, the GNSS-R altimetry satellite orbital altitude and the sea state.

3.2. The Specular Point Filtering Algorithm (SPFA)

The observation capability of the GNSS-R nadir antenna at the epoch time is reflected in the number of received signals. The reflected signal can be used as the available SP. The available conditions of SP include the same polarization mode, the requirement of signal SNR, and being in the range of antenna view. Whether the above three conditions are satisfied or not can be judged by the elevation angle at SP. Therefore, this paper proposes the SPFA based on the elevation angle, which is as follows:
1. Brewster angle filtering
The GNSS signals are right hand circularly polarized (RHCP) electromagnetic waves, but the polarization may change after sea surface reflection. The GNSS signals are RHCP electromagnetic waves, but the polarization may change after sea surface reflection. This change depends on the signal characteristics, ocean temperature and salt status, and elevation angle. The Brewster angle is the critical angle at which the signal characteristics change when electromagnetic waves are reflected on the sea surface. According to the electromagnetic theory, when the elevation angle is larger than the Brewster angle, the polarization mode of the GNSS signal changes from RHCP to LHCP [38]. To date, the GNSS-R satellite nadir antenna can only receive the LHCP signal [1,23,24,25,26], so it is necessary to filter the available SPs according to the Brewster angle.
Brewster angle is mainly based on the Fresnel coefficient . The coefficient value is determined by the signal polarization mode, seawater dielectric constant ε and local incidence angle β [38].
L R = R L = 1 2 ε sin β ε cos 2 β ε sin β + ε cos 2 β sin β ε cos 2 β sin β + ε cos 2 β
where R and L indicate right and left circular polarization. Taking the GPS L1 band as an example, assume that the seawater temperature is 25° and the salinity is 35‰, the ε is 70.53 + 65.68 i . The elevation angle corresponding to the zero point of Equation (7) is the Brewster angle, as shown in Figure 2. The Brewster angle is 5.92° under the set conditions. Only when the elevation angle is larger than the Brewster angle can the reflected signal be received by GNSS-R nadir antenna.
2. Signal-to-Noise Ratio threshold filtering
Only when the SNR of GNSS reflected signal meets the requirement can it be used in ocean altimetry. Obtaining the relationship between SNR and elevation angle based on the NASNRM is the basis for SNR threshold filtering. Then, according to the threshold setting, the minimum elevation angle that satisfies the SNR requirement under different sea state is obtained, and the SPs which cannot meet the condition are removed.
3. Antenna field of view filtering
Only when the GNSS reflected signal is within the view field of the GNSS-R nadir antenna can the signal be captured. The view field of the antenna is mainly determined by the HPBW and the pointing angle. The HPBW is evaluated by the gain as follows [1]:
G = η 40000 γ φ
where γ and φ are represent HPBW in horizontal and vertical planes, G is antenna gain. η is a dimensionless efficiency factor with a range of 0~1. For a well-designed antenna, the value of η can be close to 1. Therefore, the value of η in this study is 1.
Based on the relationship between the HPBW and the pointing angle (Figure 3), the range of the elevation angle is given as follows.
  • When θ = 0 ° , α min = 90 ° γ / 2 , α max = 90 ° ;
  • When θ < γ / 2 , α min = 90 ° θ + γ / 2 , α max = 90 ° ;
  • When θ > γ / 2 , α min = 90 ° θ + γ / 2 , α max = 90 ° θ γ / 2 .
According to the above three filtrations, the available SPs can be obtained.

4. Results and Discussions

4.1. The Signal-to-Noise Ratio of Received Reflected Signals

Since the TDS-1 observations are used to verify the reliability of the NASNRM, the parameters are as consistent as possible with the TDS-1 when calculating the SNR. The relevant parameter settings are shown in Table 1.
The relationship between SNR and satellite elevation angle shown in Figure 4 can be obtained by Equation (5), Equation (6), and parameter settings in Table 1. Meanwhile, the measured SNR of TDS-1 in 24 h from 31 March 2018 21:00:00 h to 1 April 2018 21:00:00 h are given, from which the following conclusions can be drawn. It should be noted that the values of TDS-1 and calculated wind speeds do not match each other. Wherein the wind speed and SNR of the TDS-1 are discrete, the calculated wind speeds are a fixed value. The NASNRM includes the wind-speed ranges from 1 to 23 m/s. In order to more accurately compare the TDS-1 data with the calculated values, refer to the given fixed wind speed, Figure 4 shows the corresponding TDS-1 SNR data in the range of −0.2 to 0.2 m/s. From Figure 4 we can draw conclusions as follows:
  • As the elevation angle increases, the SNR increases. This is because as the elevation angle increases, the length of the GNSS signal propagation path is reduced, which in turn reduces the power loss due to signal propagation. At the same time, the higher the elevation angle, the stronger the scattering ability of the signal on the sea surface. When the elevation angle at the range of 0 to 10 degrees, the SNR increases obviously. As the elevation angle increases gradually, the change gradually becomes gentle. This indicates that SNR is sensitive to the change of the elevation angle in a low angle range, while SNR is less affected by the change of the elevation angle in a medium and high angle range. This can provide a reference for the parameter setting of future GNSS-R spaceborne multi-channel antenna.
  • In order to ensure the quality of the observation, the TDS-1 has threshold settings at both the elevation angle (~45°) and the SNR (~−10 dB). The SNR obtained from NASNRM is consistent with the trend of TDS-1 observations, and the values are also in the same order of magnitude.
In order to more intuitively compare the calculated SNR with the TDS-1 SNR data, the standard deviations of the two results are calculated, as shown in Table 2. It should be noted that the wind speed results observed by TDS-1 are scattered, so they need to be screened when calculating the standard deviations. The screening principle is based on the range of ±0.2m/s for the twelve wind speeds given in Figure 4.
As can be seen from Table 2, the standard deviations of SNR range from 0.62 to 1.59 dB. The above differences are mainly due to the following reasons.
  • The calculated SNR is based on the wave spectrum. However, there is still a difference between the real sea conditions and the sea surface simulated according to the wave spectrum.
  • The measured antenna temperature mainly ranges from 300 to 800 K. In this paper, the antenna temperature is set to 550 K when calculating SNR. This may cause the results to deviate from the actual measurement.
  • The effect of the TDS-1 attitude is not taken into account when calculating the SNR, which may be biased when using the gain of nadir antenna.
  • The transmission power of different GPS satellites is different, and there is also a problem that the transmission power changes with time with the GPS IIF satellite. This factor is not considered in the calculation.

4.2. Minimum Elevation Angle That Meets SNR Requirements

When the SNR is 0 dB, the GNSS-R altimetry error is doubled when compared with the effect of no thermal noise [39,40]. The error is acceptable in the group delay altimetry. Therefore, the threshold of SNR is set to 0 dB. Obtaining the minimum elevation angle that meets the SNR requirement is a critical step in the filtering of the available SPs, which can link gain to antenna observation capability. Combined with the results given by Figure 4, this paper calculates the results of the minimum elevation angle under different antenna gains, as shown in Figure 5.
Figure 5 shows that the minimum satellite altitude angle decreases with the increase of antenna gain. This is because the increase of gain will increase the power of a weak signal to reach the antenna to meet the requirement of SNR and will reduce the minimum elevation angle. In addition, the effect of wind speed on the minimum elevation angle is also significant. The minimum elevation angle increases with the increase of wind speed. This is because the increase in wind speed will lead to a rougher sea surface. Thereby reducing the proportion of components of the GNSS reflected signal in the specular reflection direction. Ultimately, the signal power is weaker and cannot be captured by the GNSS-R spaceborne nadir antenna. It is noteworthy that under different wind speeds, only when the gain reaches a certain value can the antenna receive the reflection signal satisfying the threshold condition.

4.3. The Number of Received Reflected Signals

The number of received reflected signals is equivalent to the number of available SPs. The SPs data is an important database in this research. Its information is obtained through TDS-1 and GNSS satellite coordinates. The position and elevation angle of 106,150 SPs in 24 h are calculated by the gravity field normal projection reflection reference surface combination correction method (GF-NPRRSCCM) [41]. The difference between the elevation angle obtained and the TDS-1 L1b data is less than 3.6″.
The utilization of reflected signals is used to characterize the observing ability of GNSS-R spaceborne nadir antenna. It is necessary to obtain the number of available SPs. This paper makes usability judgment based on the satellite elevation angle of the SPs. The number of available SPs is obtained by counting based on the SPFA, as shown in Figure 6.
As can be seen from Figure 6:
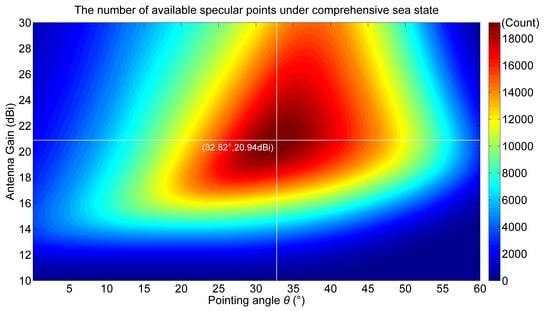
  • Under different wind speeds, as the antenna gain and the pointing angle increase, the number of SPs can be peaked. This shows that the reasonable design of antenna gain and pointing angle can optimize the number of received GNSS-R altimetry reflected signals.
  • When the pointing angle is constant, the number of SPs can be increased first as the antenna gain increases, and then gradually decreases after reaching the peak. This is because the initial increase in antenna gain will increase the weak signal power, so that more reflected signals are captured by the antenna. The number of signals increased is more than the number of signals decreased by the decrease in the antenna operating range (HPBW reduction) due to the increase of antenna gain. When the two parts are equal, the number of available SPs can reach the peak value. As the antenna gain continues to increase, the number of signals increased due to the increase in power is gradually less than the number of signals reduced due to the diminish in the antenna view field, and the number of available SPs gradually decreased.
  • When the antenna gain is low, the number of available SPs gradually decreases as the pointing angle increases. This is because the increase of the pointing angle causes the signal propagation path to become longer and causes more power loss, so that some signals cannot be captured by the low-gain antenna. When the antenna gain is high, the number of available SPs will reach the peak and then gradually decrease with the increase of the pointing angle. This is because the increase of the pointing angle will increase the coverage area of the antenna. Although the increase of the angle will lengthen the signal propagation path and cause more power loss, which will make some signals unable to be captured, the increase of the angle will also make more reflection signals received by the high-gain antenna, thus increasing the number of available SPs. When the number of available SPs reaches its peak, compared to the number of reflected signals that are increased due to the increase in angle, the number of signals that cannot meet the SNR requirement due to the longer signal propagation path is larger, which ultimately leads to the decrease of the number of available SPs.

4.4. The Nadir Antenna Parameters Combination Optimization

There are multiple GNSS reflection signals on the sea surface at epoch time, but not all of them can be used for altimetry by GNSS-R satellite. In order to better mirror the use of reflected signals, this paper uses the reflected signals utilization to evaluate and optimize the observation ability of the antenna. The reflected signals utilization is the ratio of the number of available SPs to the total number of SPs. Table 3 shows the parameter information when the number of available SPs reaches its peak at different wind speeds in Figure 6.
It can be seen from Table 3 that as the wind speed increases, the antenna gain corresponding to the peak gradually increases, and the reflected signals utilization gradually decreases. Compared with the wind speed of 1m/s, the corresponding antenna gain value is increased by 38.03% when the wind speed is 23m/s, and the reflection signal utilization rate is reduced by 13.14%. This is the difficulty of collecting GNSS-R observation data at present. The complex and variable sea state can easily lead to the GNSS reflected signal that cannot be captured and tracked by nadir antenna. When the sea state is bad, a higher antenna gain is required to increase the number of reflected signals captured by the GNSS-R spaceborne nadir antenna. This will result in higher power consumption, which will inevitably lead to the corresponding increase of satellite volume, weight and cost. Therefore, it is important to model and optimize the design of antenna parameters according to the actual requirements of satellite observation capability.
In order to comprehensively evaluate to obtain the optimal combination of parameters, the number of available SPs obtained is a weighted sum that according to the wind speed. This comprehensive sea state is weighted with a high-wind speed bias from the TDS-1 retrieval distribution.
N c p x = i = 1 n N i p i
where N c p x represents the number of available SPs under comprehensive sea state, n is the sample number of wind speed and sets it to 12 in this paper, N i is the number of available SPs under different wind speeds U 10 , U 10 = 2 i 1 , i = 1 , 2 , 3 , , 12 . P i is the weight of different wind speeds within a certain period of time. Based on the U10 data in the L2 products of TDS-1, the number of SPs in the range of ±1 m/s for each separation point is counted, and N i is obtained. According to Figure 6 and Equation (9), the relationship between the number of available SPs and the antenna gain and pointing angle is obtained under the comprehensive sea state, as shown in Figure 7.
It can be seen from Figure 7 that when the antenna gain is 20.94 dBi and the pointing angle is 32.82°, the number of reflected signals received by GNSS-R altimetry satellite is the largest, and the reflected signal utilization can reach 18.00%.
Based on the parameters of TDS-1 nadir antenna and NAOCOM and Equation (9), the number of available SPs and the utilization of reflected signals are calculated, as shown in Table 4. It can be seen from Table 4 that the number of received reflected signals obtained based on the optimal parameter combination is increased by 5.38 times compared with the TDS-1 nadir antenna parameter combination. This is because the higher antenna gain and the pointing angle can effectively increase the probability of the antenna receiving the reflected signal. When the same antenna gain and HPBW are used, the observation capability is optimal when the pointing angle is 20.23°, which is 46.63% higher than that under the TDS-1 nadir antenna parameter combination. TDS-1 nadir antenna can only receive GPS reflected signals and only four channels [42]. At present, the GNSS-R spaceborne antenna can use multi-GNSS, and the signal channel can reach 16 or more [43,44]. In order to make full use of the receiving signal channel, it is more necessary to optimize the design of the nadir antenna to ensure that more GNSS reflected signals are captured and tracked. Increasing the signal channel of nadir antenna is an effective way to improve the spatial resolution of the GNSS-R altimetry. Of course, the higher thermal noise and power consumption caused by the increase of the channel should be balanced.
The research in this paper is mainly for a single antenna. Currently, the phased array antenna is also used in some GNSS-R spaceborne mission concepts [45,46]. The elements of the phased array antenna have beamforming capabilities, which can better balance the gain and coverage of the GNSS-R nadir antenna [47]. The phased array antennas will be increasingly used in future GNSS-R missions.

5. Conclusions

Improving the spatial resolution of observation is an important research field of GNSS-R altimetry. As the critical payload of GNSS-R altimetry satellite receiving reflected signals from the sea surface, nadir antenna is the important factor affecting the resolution of Earth observation. By optimizing the combination of nadir antenna parameters of GNSS-R satellite, the number of received reflected signals can be increased to improve spatial resolution. Furthermore, the global spatial gravity field model with high spatial resolution can be inverted, which can effectively improve the accuracy of underwater gravity-aided inertial navigation. Applying the NAOCOM proposed in this study, the relationship between the number of received reflected signals and the antenna parameters is discussed in detail, and the parameters of the nadir antenna are optimized to achieve the highest observation capability. The result is compared with the observation ability of TDS-1 nadir antenna. When the orbital altitude is 635 km, the gain is 20.94 dBi and the pointing angle is 32.82 degrees, the nadir antenna receives the most reflected signals, and its observation ability is 5.38 times higher than that of TDS-1. When using the same antenna gain and HPBW as the TDS-1, the optimized design of the pointing angle can increase the reflected signal utilization by up to 46.63%. This study only uses GPS satellites as the illuminator, and its satellite geometry is not as good as that of multi-GNSS systems. If the future GNSS-R mission uses all GNSS satellites as the signal source, the optimal antenna gain value will be reduced, which is better to take advantage of GNSS-R’s low power consumption and low cost.
The NAOCOM proposed in this paper can effectively improve the ability of the GNSS-R spaceborne nadir antenna to receive altimetry reflected signals, which provides a theoretical basis for the design of the nadir antenna for future high spatial resolution GNSS-R altimetry missions.

Author Contributions

Z.L. (Zongqiang Liu), W.Z., and F.W. conceived the experiments and wrote the paper; Z.L. (Zongqiang Liu) designed and performed the experiments; F.W. and G.K. provided theory support for the index requirement of GNSS-R sea surface altimetry; Z.L. (Zhaowei Li) and Q.W. provided suggestions for the experiments and the analysis of the results; Z.C. provided theory support for antenna design.

Funding

This work was supported by the National Nature Science Foundation of China (41574014, 41774014), the Frontier Science and Technology Innovation Project (085015) and the Innovation Workstation Project of the Science and Technology Commission of the Central Military Commission, and the Outstanding Youth Foundation of the China Academy of Space Technology.

Acknowledgments

The TDS-1 SGR-RESI dataset used in this study is supported by the MERRByS team of Surrey Satellite Technology Limited.

Conflicts of Interest

The authors declare no conflict of interest.

References

  1. Jin, S.; Cardellach, E.; Xie, F. GNSS Remote Sensing: Theory, Methods and Applications; Springer-Verlag: Dordrecht, The Netherlands, 2014. [Google Scholar]
  2. Jin, S.; Feng, G.P.; Gleason, S. Remote sensing using GNSS signals: Current status and future directions. Adv. Space Res. 2011, 47, 1645–1653. [Google Scholar] [CrossRef]
  3. Martin-Neira, M. A Passive Reflectometry and Interferometry System (PARIS): Application to ocean altimetry. ESA J. 1993, 17, 331–355. [Google Scholar]
  4. Martín-Neira, M.; Caparrini, M.; Font-Rossello, J.; Lannelongue, S.; Vallmitjana, C.S. The PARIS concept: An experimental demonstration of sea surface altimetry using GPS reflected signals. IEEE Trans. Geosci. Remote Sens. 2001, 39, 142–150. [Google Scholar] [CrossRef]
  5. Martín-Neira, M.; Colmenarejo, P.; Ruffini, G.; Serra, C. Altimetry precision of 1 cm over a pond using the wide-lane carrier phase of GPS reflected signals. Can. J. Remote Sens. 2002, 28, 394–403. [Google Scholar] [CrossRef]
  6. Clarizia, M.P.; Ruf, C.; Cipollini, P.; Zuffada, C. First spaceborne observation of sea surface height using GPS-Reflectometry. Geophys. Res. Lett. 2016, 43, 767–774. [Google Scholar] [CrossRef]
  7. Rius, A.; Cardellach, E.; Fabra, F.; Li, W.; Ribó, S.; Hernández-Pajares, M. Feasibility of GNSS-R ice sheet altimetry in Greenland using TDS-1. Remote Sens. 2017, 9, 742. [Google Scholar] [CrossRef]
  8. Cardellach, E.; Rius, A.; Martín-Neira, M.; Fabra, F.; Nogués-Correig, O.; Ribó, S.; Kainulainen, J.; Camps, A.; D’Addio, S. Consolidating the precision of interferometric GNSS-R ocean altimetry using airborn eexperimental data. IEEE Trans. Geosci. Remote Sens. 2014, 52, 4992–5004. [Google Scholar] [CrossRef]
  9. Camps, A.; Park, H.; Sekulic, I.; Rius, J.M. GNSS-R altimetry performance analysis for the GEROS Experiment on board the International Space Station. Sensors 2017, 17, 1583. [Google Scholar] [CrossRef]
  10. Li, W.; Cardellach, E.; Fabra, F.; Ribó, S.; Rius, A. Lake Level and Surface Topography Measured with Spaceborne GNSS-Reflectometry from CYGNSS Mission: Example for the Lake Qinghai. Geophys. Res. Lett. 2018, 45, 13332–13341. [Google Scholar] [CrossRef]
  11. Fabra, F.; Cardellach, E.; Rius, A.; Ribó, S.; Oliveras, S.; Nogués-Correig, O.; Rivas, M.B.; Semmling, M.; D’Addio, S. Phase altimetry with dual polarization GNSS-R oversea ice. IEEE Trans. Geosci. Remote Sens. 2012, 50, 2112–2121. [Google Scholar] [CrossRef]
  12. Semmling, A.M.; Wickert, J.; Schön, S.; Stosius, R.; Markgraf, M.; Gerber, T.; Ge, M.; Beyerle, G. A zeppelin experiment to study airborne altimetry using specular Global Navigation Satellite System reflections. Radio Sci. 2013, 48, 427–440. [Google Scholar] [CrossRef] [Green Version]
  13. Li, W.; Cardellach, E.; Fabra, F.; Rius, A.; Ribó, S.; Martín-Neira, M. First spaceborne phase altimetry over sea ice using TechDemoSat-1 GNSS-R signals. Geophys. Res. Lett. 2017, 44, 8369–8376. [Google Scholar] [CrossRef]
  14. Zheng, W.; Li, Z. Preferred design and error analysis for the future dedicated deep-space Mars-SST satellite gravity mission. Astrophys. Space Sci. 2018, 363, 172. [Google Scholar] [CrossRef]
  15. Zheng, W.; Xu, H.; Zhong, M.; Yun, M. Requirements analysis for future satellite gravity mission Improved-GRACE. Surv. Geophys. 2015, 36, 87–109. [Google Scholar] [CrossRef]
  16. Zheng, W.; Hsu, H.; Zhong, M.; Yun, M. Improvement in the recovery accuracy of the lunar gravity field based on the future Moon-ILRS spacecraft gravity mission. Surv. Geophys. 2015, 36, 587–619. [Google Scholar] [CrossRef]
  17. Jircitano, A.; Dosch, D. Gravity aided inertial navigation system (GAINS). In Proceedings of the ION 47th Annual Meeting, Williamsburg, VA, USA, 10–12 June 1991. [Google Scholar]
  18. Metzger, E.H.; Jircitano, A. Inertial Navigation Performance Improvement Using Gravity Gradient Matching Techniques. J. Spacecr. Rocket. 2012, 13, 323–324. [Google Scholar] [CrossRef]
  19. Silver, S. Microwave Antenna Theory and Design; Rad. Lab Series; Institution of Electrical Engineers: London, UK, 1949. [Google Scholar]
  20. Hajj, G.A.; Zuffada, C. Theoretical description of a bistatic system for ocean altimetry using the GPS signal. Radio Sci. 2003, 38, 1089. [Google Scholar] [CrossRef]
  21. Jales, P. Spaceborne Receiver Design for Scatterometric GNSS Reflectometry. Ph.D. Thesis, University of Surrey, Guildford, UK, 2012. [Google Scholar]
  22. Gao, F.; Xu, T.; Wang, N.; Jiang, C.; Du, Y.; Nie, W.; Xu, G. Spatiotemporal Evaluation of GNSS-R Based on Future Fully Operational Global Multi-GNSS and Eight-LEO Constellations. Remote Sens. 2018, 10, 67. [Google Scholar] [CrossRef]
  23. Bussy-Virat, C.D.; Ruf, C.S.; Ridley, A.J. Relationship Between Temporal and Spatial Resolution for a Constellation of GNSS-R Satellites. IEEE J. Sel. Top. Appl. Earth Obs. Remote Sens. 2018, 99, 1–10. [Google Scholar] [CrossRef]
  24. Barbarossa, S.; Levrini, G. An antenna pattern synthesis technique for spaceborne SAR performance optimization. IEEE Trans. Geosci. Remote Sens. 1991, 29, 254–259. [Google Scholar] [CrossRef]
  25. Unwin, M.J.; Gleason, S.; Brennan, M. The space GPS reflectometry experiment on the UK disaster monitoring constellation satellite. In Proceedings of the ION-GPS/GNSS, Portland, OR, USA, 1 January 2003. [Google Scholar]
  26. Jales, P.; Unwin, M. MERRByS Product Manual—GNSS Reflectometry on TDS-1 with the SGR-ReSI; Surrey Satellite Technology LTD: Guildford, UK, 2017. [Google Scholar]
  27. Carreno-Luengo, H.; Camps, A.; Via, P.; Munoz, J.F.; Cortiella, A.; Vidal, D.; Jané, J.; Catarino, N.; Hagenfeldt, M.; Palomo, P. 3Cat-2—An Experimental Nanosatellite for GNSS-R Earth Observation: Mission Concept and Analysis. IEEE J. Sel. Top. Appl. Earth Obs. Remote Sens. 2016, 9, 4540–4551. [Google Scholar] [CrossRef]
  28. Ruf, C.; Chang, P.; Clarizia, M.P.; Gleason, S.; Jelenak, Z.; Murray, J.; Morris, M.; Musko, S.; Posselt, D.; Provost, D.; et al. CYGNSS Handbook; Michigan Publishing: Ann Arbor, MI, USA, 2016. [Google Scholar]
  29. Available online: http://www.cma.gov.cn/2011xwzx/2011xmtjj/201906/t20190608_526702.html (accessed on 12 July 2019).
  30. Feng, Y.; Zheng, Y. Efficient interpolations to GPS orbits for precise wide area applications. GPS Solut. 2005, 9, 273–282. [Google Scholar] [CrossRef]
  31. Zavorotny, V.U.; Voronovich, A.G. Scattering of GPS signals from the ocean with wind remote sensing application. IEEE Trans. Geosci. Remote Sens. 2000, 38, 951–964. [Google Scholar] [CrossRef] [Green Version]
  32. Skolnik, M.I. Radar Handbook; McGraw-Hill: New York, NY, USA, 1970. [Google Scholar]
  33. Picardi, G.; Seu, R.; Sorge, S.G. Bistatic model of ocean scattering. IEEE Trans. Antennas Propag. 2002, 46, 1531–1541. [Google Scholar] [CrossRef]
  34. Beckmann, P.; Spizzichino, A. The Scattering of Electromagnetic Wavesfrom Rough Surfaces; Pergamon Press: Oxford, UK, 1963. [Google Scholar]
  35. Soriano, G.; Saillard, M. A two-scale model for the ocean surface bistatic scattering. In Proceedings of the IEEE International Geoscience and Remote Sensing Symposium, Toulouse, France, 21–25 July 2003. [Google Scholar]
  36. Cox, C.; Munk, W. Measurement of the roughness of the sea surface from photographs of the sun’s glitter. JOSA 1954, 44, 838–850. [Google Scholar] [CrossRef]
  37. Elfouhaily, T.; Chapron, B.; Katsaros, K. A unified directional spectrum for long and short wind-driven waves. J. Geophys. Res. Oceans. 1997, 102, 157781–157796. [Google Scholar] [CrossRef]
  38. Angelopoulou, E. Specular Highlight Detection Based on the Fresnel Reflection Coefficient. In Proceedings of the IEEE International Conference on Computer Vision, Rio de Janeiro, Brazil, 14–21 October 2007. [Google Scholar]
  39. Li, W.; Cardellach, E.; Fabra, F.; Ribo, S.; Rius, A. Assessment of Spaceborne GNSS-R Ocean Altimetry Performance Using CYGNSS Mission Raw Data. IEEE Trans. Geosci. Remote Sens. 2019, 99, 1–13. [Google Scholar] [CrossRef]
  40. Li, W.; Rius, A.; Fabra, F.; Cardellach, E.; Ribo, S.; Martín-Neira, M. Revisiting the GNSS-R Waveform Statistics and Its Impact on Altimetric Retrievals. IEEE Trans. Geosci. Remote Sens. 2018, 56, 2854–2871. [Google Scholar] [CrossRef]
  41. Wu, F.; Zheng, W.; Li, Z.; Liu, Z. Improving the GNSS-R specular reflection point positioning accuracy using the gravity field normal projection reflection reference surface combination correction method. Remote Sens. 2019, 11, 33. [Google Scholar] [CrossRef]
  42. Mission and Product Descriptions. May 2016. Available online: http://www.merrbys.co.uk/Resources%20Page.htm (accessed on 12 July 2019).
  43. Lu, W.; Shuai, F.; Yang, R. Synthetic Array Processing for GNSS receiver in multipath environments. In Proceedings of the International Conference on Automatic Control and Artificial Intelligence, Xiamen, China, 3–5 March 2012. [Google Scholar]
  44. Pascual, D.; Onrubia, R.; Querol, J. Calibration of GNSS-R receivers with PRN signal injection: Methodology and validation with the microwave interferometric reflectometer (MIR). In Proceedings of the 2017 IEEE International Geoscience and Remote Sensing Symposium (IGARSS), Fort Worth, TX, USA, 23–28 July 2017. [Google Scholar]
  45. Cardellach, E.; Wickert, J.; Baggen, R.; Benito, J.; Camps, A.; Catarino, N.; Chapron, B.; Dielacher, A.; Fabra, F.; Flato, G.; et al. GNSS Transpolar Earth Reflectometry Exploring System (G-TERN): Mission Concept. IEEE Trans. Geosci. Remote Sens. 2018, 6, 13980–14018. [Google Scholar] [CrossRef]
  46. Martín-Neira, M.; Li, W.; Andrés-Beivide, A.; Ballesteros-Sels, X. Cookie: A satellite concept for GNSS remote sensing constellations. IEEE J. Sel. Top. Appl. Earth Obs. Remote Sens. 2016, 9, 4593–4610. [Google Scholar] [CrossRef]
  47. Visser, H.J. Array and Phased Array Antenna Basics; Wiley: Hoboken, NJ, USA, 2006. [Google Scholar]
Figure 1. The GNSS-R specular point positioning geometry, where O is the geo-center, P is the position of the specular point, α is elevation angle, R E is Earth radius, H T and H R are the satellite orbital altitude of GNSS and GNSS-R, respectively. R T P is the signal transmission distance from GNSS satellite to the specular point, R P R is the signal reception distance from GNSS-R satellite to the specular point.
Remotesensing 11 02473 g001
Figure 2. Relationship between elevation angle and Fresnel reflection coefficient (right hand circularly polarized (RHCP) turns to left hand circularly polarized (LHCP)).
Remotesensing 11 02473 g002
Figure 3. The Geometric relationship between half-power beam width (HPBW) and pointing angle: (a) θ = 0 ° , (b) θ < γ / 2 , (c) θ > γ / 2 . Where R is the GNSS-R satellite, O is the geo-center, θ is the pointing angle, γ and φ are horizontal and vertical HPBW, respectively, α min and α max are represent the maximum and minimum elevation angle. To simplify the analysis, γ = φ .
Remotesensing 11 02473 g003
Figure 4. The SNR obtained according to nadir antenna signal-to-noise ratio model (NASNRM) as a function of the elevation angle. The U 10 is the wind speed at 10 m height above the sea surface. The inset is the SNR when the elevation angle at the range of 45 to 90 degrees.
Remotesensing 11 02473 g004
Figure 5. The relationship between the minimum elevation angle and the gain. The U 10 is the wind speed at 10 m height above the sea surface.
Remotesensing 11 02473 g005
Figure 6. The relationship between the number of received reflection signals and antenna gain and pointing angle with respect to different wind speeds. The U 10 is the wind speed at 10 m height above the sea surface.
Remotesensing 11 02473 g006
Figure 7. The number of available SPs in a comprehensive sea state.
Remotesensing 11 02473 g007
Table 1. Related parameter settings when calculating signal-to-noise ratio (SNR) through Equation (6).
ParameterValue
Orbital altitude of GPS satellite20200
Orbital altitude of GNSS-R satellite (km)635
Pointing angle (°)0
Antenna peak gain (dBi)13.3
Antenna gain patternTDS-1 nadir antenna gain map
Signal frequency (MHz)1575.42
Signal wavelength (m)0.19
Coherent integration time (ms)1
Antenna temperature (K)550
Noise bandwidth (Hz)1000
Integration area (km × km)100 × 100
Sampling size (m × m)100 × 100
Integration approachNumerical integration
Table 2. The standard deviations of calculated SNR and TDS-1 SNR data.
U10 (m/s)1357911131517192123
Standard deviation (dB)0.700.710.690.620.730.851.120.921.221.321.541.59
Table 3. Optimal parameters combination for nadir antenna observation capability with different sea surface wind speeds.
Wind Speed U10 (m/s)Antenna Gain (dBi)Pointing Angle θ Received Signal Quantity (Count)Reflected Signal Utilization (%)
116.8030.022106819.85
318.1831.022067019.47
519.0231.542005518.89
720.0031.961992518.77
920.3332.011950718.38
1120.9732.581947318.34
1321.3532.991900417.90
1521.7732.781875617.67
1721.9832.781859717.52
1922.6033.831848817.42
2122.8733.461839917.33
2323.19.33.461829917.24
Table 4. Received signal quantity and utilization under the comprehensive sea state.
Parameter CombinationAntenna Gain (dBi)Pointing Angle θ Received Signal Quantity (Count)Reflected Signal Utilization (%)
Optimization parameters 20.9432.821910418.00%
TDS-1 satellite nadir antenna parameters13.30029942.82%
Optimized parameters using TDS-1 nadir antenna gain13.3020.2343904.14%

