Remotely-Observed Early Spring Warming in the Southwestern Yellow Sea Due to Weakened Winter Monsoon


1
College of Oceanography, Hohai University, Nanjing 210098, China
2
Center for Space and Remote Sensing Research, National Central University, Taoyuan City 32001, Taiwan
3
School of Naval Architecture and Ocean Engineering, Jiangsu University of Science and Technology, Zhenjiang 212003, China
4
Troops 91001, People’s Liberation Army, Beijing 100161, China
*
Author to whom correspondence should be addressed.
Remote Sens. 2019, 11(21), 2478; https://doi.org/10.3390/rs11212478
Submission received: 18 September 2019
/
Revised: 11 October 2019
/
Accepted: 22 October 2019
/
Published: 24 October 2019
(This article belongs to the Special Issue Satellite Remote Sensing of Weather, Water and Climate Couplings and Phenomena)
Abstract
:The seasonal warming over the southwestern Yellow Sea (YS) in the spring is of vital importance to the local ecologic environment, especially to the massive green algae blooms of the YS in late spring and early summer. Based on daily optimum interpolation sea surface temperature (SST) data consisting of satellite derived SST from Advanced Very High Resolution Radiometer (AVHRR) and in situ measurements, this study analyzed the spring SST variation over the southwestern YS (SWYS) from 1982 to 2018. The results show that the recent warming trend of spring SST over the SWYS is four-to-six times that of the global average, and as a result, sea water over the Subei Shoal (SBS) shifts about 10–13 days earlier to reach 10 °C in early April. This implies that, accordingly, the micro-propagules of green algae over the SBS may have the chance to germinate earlier. SST variability in early April significantly correlates with northerly wind and exhibits a general warming over the SWYS with an intensified warming anchored along the axis of the submarine canyon off the Yangtze estuary. The Moderate Resolution Imaging Spectroradiometer (MODIS) red–green–blue composite images captured the intrusion of the Taiwan Warm Current (TWC) into the SWYS through the submarine canyon during northerly wind relaxation in early April. Ocean remote sensing provides important clues for understanding the regional SST variability in the SWYS. Following this clue, this study finds that the weakening of winter monsoon in the spring leads to northward migration of the TWC and results in enhanced spring warming over the SWYS. The attendant advanced warming in spring, resulting in a favorable temperature condition for early development of green alga, may have contributed to the green tide blooms in the Yellow Sea in the recent decade.
1. Introduction
Sea surface temperature (SST) is one of the most important indicators in quantifying climate change and has strong influence on regional climate and regional ecosystem studies. The massive green tide blooms of Ulva prolifera (U. prolifera) in the late spring and early summer have been the most striking phenomena recurrent over the Yellow Sea (YS) in the past decade [1,2,3,4,5]. The origin area of the green tide has been identified as the Subei Shoal (SBS, see Figure 1 for location) where the sporadic patches of U. prolifera are spotted as early as middle April [6]. The ecological factors affecting algae growth have been well studied and understood [6,7,8]. It is widely accepted that the optimal sea water temperature in the YS facilitates the formation of the green tide [6,7,8,9]. Song et al. [9] reported that micro-propagules of green algae in coastal waters of the SBS begin to germinate at 10 °C or a higher water temperature. Xiao et al. [7] found the growth rate and photosynthetic rate of the detached U. prolifera were significantly higher at moderate temperature levels. Hence, sea temperature plays a significant role in the development of the green tides, especially at the early stage. Xuan et al. [10] found that SST and wind in the spring played an important role in the development of the spring phytoplankton bloom. The variation of the spring SST is of vital importance to the ecologic environment over the southwestern Yellow Sea (SWYS, Figure 1).
The variability of SST over the Yellow and East China Seas (YECS) has been widely studied in the past decade in terms of different time scales, seasons and datasets [11,12,13,14,15,16,17]. The YECS has experienced a robust, persistent SST increase in the last few decades at the rate of two-to-four times faster than the globally averaged trend. Various dynamics mechanisms have been reported to be responsible for the long-term warming: Anthropogenic effects [11], river discharge induced barrier layer [13,18], oceanic advection [19,20], and air–sea heat flux induced by weakened winds [14,20,21]. However, while most of the previous studies on the SST variability of YECS have focused on the annual mean SST, summer or winter season SST, little research has been about the variability of the spring SST. Exploring the spatial pattern of the spring SST variability and the mechanisms responsible was the goal of this study.
In the present study, the variability of the spring SST in April from 1982 to 2018 and related physical mechanism, at the early development stage of the green tide blooms over the SWYS adjacent to the SBS, was examined based on the daily optimum interpolation SST (OISST) data set. The dominant spatial pattern of the spring SST variability over the SWYS was analyzed using empirical orthogonal function (EOF). A hypothesis of the related physical mechanism was put forward using the Moderate Resolution Imaging Spectroradiometer (MODIS) images and daily advanced scatterometer (ASCAT) surface wind data, which were further verified with HYbrid Coordinate Ocean Model (HYCOM) reanalysis data.
2. Materials and Methods
The daily SST data from 1982–2018 used in this study were from OISST Analysis version 2(v2) and acquired from the National Ocean and Atmospheric Administration’s (NOAA’s) National Climatic Data Center (NCDC), available at https://www.ncdc.noaa.gov/oisst with a high spatial resolution of 0.25° × 0.25°. This dataset was generated from several data sources including SST data from the Advanced Very High Resolution Radiometer (AVHRR), sea-ice data, and in situ data from ships and buoys. The relationship between the SST variation and wind stress was diagnosed. Daily ASCAT surface wind fields over the SWYS were used to examine the atmospheric variation during the TWC intrusion in the spring of 2017. ASCAT data were obtained from the Centre de Recherche et d’Exploitation Satellitaire (CERSAT), at the French Research Institute for Exploitation of the Sea (IFREMER), Plouzané (France) [22]: http://apdrc.soest.hawaii.edu/datadoc/ascat.php. The daily wind data used to show the long-term variation of wind were from NCEP_Reanalysis 2 data (a global reanalysis of atmospheric data spanning 1979 to present, created by the National Centers for Environmental Prediction in cooperation with the Department of Energy), provided by the NOAA Earth System Research Laboratory’s Physical Sciences Division (NOAA/OAR/ESRL PSD), Boulder, Colorado, USA via their web site at https://www.esrl.noaa.gov/psd/. Red–green–blue composite images from three visible bands (645 nm: R; 555 nm: G; 469 nm: B) of the MODIS were collected along with MODIS SST images to identify the intrusion of the Taiwan Warm Current to the Jiangsu coast at favorable wind conditions in April. MODIS data were obtained from the Optical Oceanography Laboratory, College of Marine Science, University of South Florida https://optics.marine.usf.edu/cgi-bin/optics_data?roi=YS_ECS¤t=1. To explain and verify the ocean response to wind relaxation and shift, the Hybrid Coordinate Ocean Model (HYCOM) hindcast data were used to analyze the ocean currents and sea water temperature at the sea surface, the 20 m layer, and the bottom layer (Global Ocean Forecasting System 3.1, Experiment 92.8, 41-layer HYCOM and the Navy Coupled Ocean Data Assimilation (NCODA) Global 1/12° Analysis, https://www.hycom.org/data/glbv0pt08/expt-92pt8). It had a 0.08° spatial resolution between 40°S and 40°N and 3-hour temporal resolution.
The long-term trend of SST was obtained with a linear regression of the time series. Various dynamics processes have been reported to contribute to this trend [11,12,13,14,15,16,17]. To reveal the dominant mechanism, an EOF analysis was used to decompose the spring SST field time series in the SWYS into temporal and spatial components in the present study. An EOF analysis is often used to study the possible spatial modes (i.e., patterns) of the variability of a spatially distributed time series by computing the eigenvectors of the covariance matrix of the data set. The derived eigenvalues provide a measure of the percent variance explained by each mode. Most of the variance can be explained by first few modes. By examining the spatial pattern and principal component (PC), an EOF analysis provides statistical insights into physical processes in an intricate climate system. The spatial patterns and PCs extracted from an EOF analysis may be sensitive to the choice of spatial domain and the time period; therefore, to focus on the variability of SST over the SWYS, the domain of the EOF analysis was limited to (120°E, 125°E) and (30°N, 35°N), excluding the Kuroshio and Tsushima Warm Current areas.
3. Results and Discussion
3.1. Coastal Water Warming over the SBS
Figure 2a shows the long-term trend of SST over the SWYS. The SWYS has experienced an SST warming at an average rate of 0.2–0.4 °C/decade, which is two-to-three times that of the global mean warming trend, consistent with previous studies [14,16,17]. The rapid warming (>0.4 °C/decade) is centered at the submarine canyon off the Yangtze River estuary and extends to 33°N along the 30 m isobath. Park et al. [14] pointed out that spring and early summer warming from April to June has contributed to the dominant warming in the long-term trend along the eastern coast of China. The spring warming trend from 1982 to 2018 is presented in Figure 2b, with a general warming rate of 0.4–0.7 °C/decade, twice as much as that of the annual mean warming as shown in Figure 2a. Rapid warming is located near the Yangtze River estuary and the SBS.
Under such a warming trend during the period of 1982–2018, an early warming could be expected at fixed locations. Four locations (shown in Figure 2b) were selected to show SST evolution near the SBS from February to May (Figure 3a–d). An evident change (warming) of SST around the SBS occurred in 1996/1997. We calculated the differences of the mean day of year (DoY) at which sea water reached certain temperature before and after 1996/1997. The 8, 10 and 15 °C isotherms shifted earlier by 14.5, 13.2 and 18.4 days, respectively, at Station A on the south edge of the SBS at 122°E, 32°N (Figure 3a). The earlier shifted days decreased at the location northwards (Figure 3b–d).
The four-station averaged evolution is presented in Figure 3e. The 8 and 10 °C contours show a strong trend before early 2000s and an insignificant trend afterwards with large interannual variations. The 15 °C contour shows relatively smaller variability with a more consistent trend from 1982 to 2018. The early warming trend was significant for the five-point-smoothed 8, 10 and 15 °C isotherms with correlation coefficients of −0.50, −0.66 and −0.84, respectively. The dates of water temperature reaching 8, 10 and 15 °C in 2000s and 2010s were generally earlier than that in 1980s. The overall warming over the SBS showed 15.3, 9.7 and 11.6 day earlier shifting for the 8, 10 and 15 °C isotherms, respectively (Figure 3e). The 10 °C isotherm for the SBS varied around the 100th DoY (the black solid lines in Figure 3) in the early April. The date when the SBS water reached 10 °C has shifted earlier for about 10 days in the past decades. The micro-propagules of green algae germinated at 10 °C or warmer [20]. Therefore, the earlier shift of warming implies that the micro-propagules of green algae over the SBS can germinate by 10–13 days earlier, which may cast important ecological impacts on the SBS and adjacent seas.
3.2. Spatial and Temporal Variability of SST over the SWYS
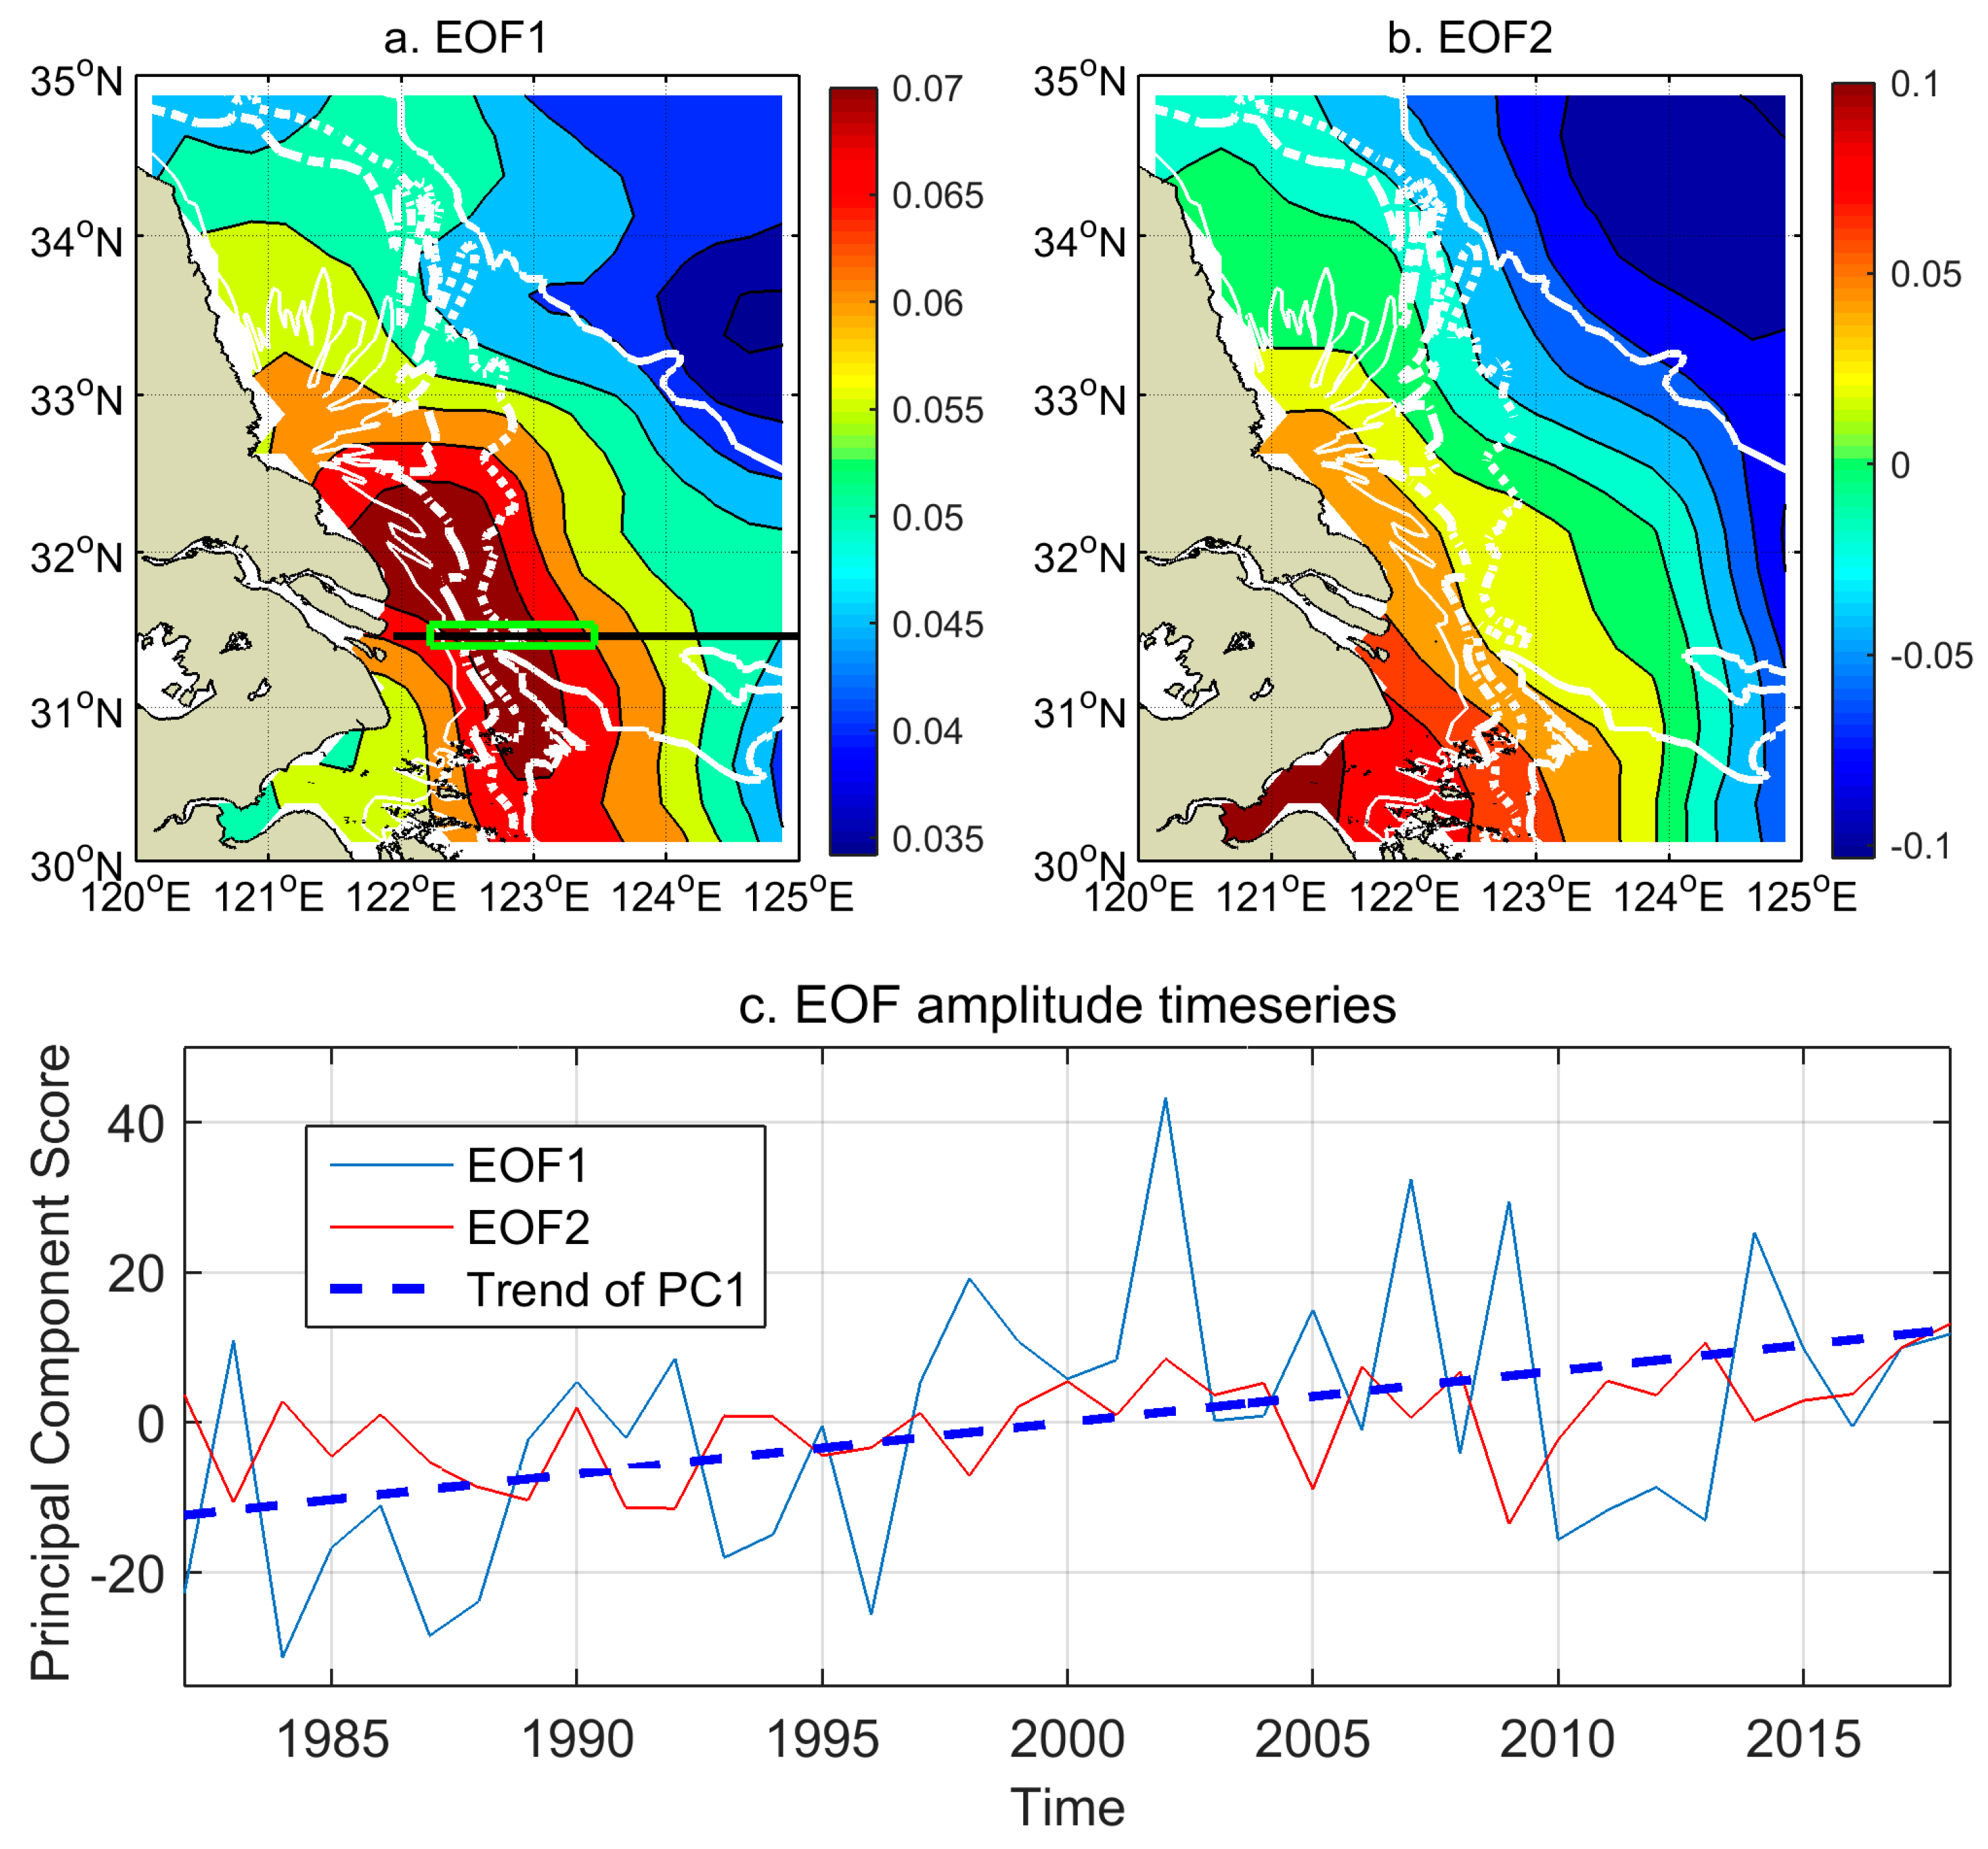
To reveal the spatial and temporal variability of the spring SST over the SWYS, time series of the 100th DoY SST was further analyzed using EOF (Figure 4). The first three modes explained over 73.5%, 11.3%, and 3.7% of the total SST variance (Figure 4c). The leading mode of the 100th year day SST showed an overall warming trend over the whole study area, with a large variation along the axis of the submarine canyon off the Yangtze estuary to the Jiangsu coast, where the maximum variation was located (Figure 4a). The PC of the leading EOF mode showed an evident increase trend (r = 0.43, p < 0.01) with a large inter-annual variation (Figure 4c).
The Yellow Sea is a shallow, macro-tidal sea, and its variability is dynamically dominated by tidal [23] and seasonal variability [24], which are associated with the Asian monsoon system and their interaction with morphology [25]. The spatial pattern of the leading EOF mode of the April SST variation suggests that the Taiwan Warm Current flows along the submarine canyon, which might have contributed to the SST variation at the Jiangsu coast.
3.3. Influence of Monsoon on the Leading Mode of SST Variation
Previous studies have shown that the shelf circulation of the Yellow Sea, the East China Sea and the canyon circulation off the Yangtze River mouth in winter are primarily forced by the northerly winds and modified by the wind stress-curl, and the canyon circulation further induces the inshore branch of the Taiwan Warm Current [26]. The PC time series of the leading EOF mode and northerly wind speed show good agreement on the variation of inter-annual timescale (Figure 5a). A positive correlation was found between them with a correlation coefficient of 0.54 (at the significance level 0.01, Figure 5), suggesting a strong northerly wind corresponding to a lower temperature and weak northerly or strong southerly wind that cause the warming of the Jiangsu coast water. Northerly wind also leads to sea surface cooling through sensible and latent heat flux. However, it cannot explain the spatial pattern of warming. The wind driven ocean circulation becomes the most probable mechanism that accounts for the strong wind-SST relationship.
3.4. Intrusion of Taiwan Warm Current at Northeasterly Relaxation in Spring
To verify the hypothesis that the wind influences the SST through wind driven circulation near the submarine canyon off the Yangtze River estuary, we examined sea surface signatures presented by the MODIS images acquisitioned in late March and early April. Evidence of the intrusion events of Taiwan Warm Current to the Subei Coast were documented by MODIS visible images (Figure 6).
Figure 6b is the visible MODIS image captured at 04:45 Greenwich Mean Time (GMT) on April 13th, 2017. It shows a clear water tongue extending northward to 32°N along the 30 m isobath. The quasi-synchronous SST image shows that warm water reaches the Jiangsu coast near 32°N (Figure 6d). For comparison, Figure 6a is the nearest image available before the intrusion event. It was captured at 05:05 GMT on 2 April 2017. The turbidity plume over the Yangtze bank covers a large area extending southeastward from the Jiangsu coast to the East China Sea shelf [27,28,29] (Figure 6a). The warm water tongue before the intrusion event is located over the submarine canyon with the north end confined south of 31°N off the Yangtze River estuary (Figure 6c).
Though the MODIS data availability over the SWYS was very limited due to cloud cover, the intrusion of clear water of the Taiwan Warm Current to the Jiangsu coast around early April was easily observed by the MODIS many times in recent years (Table 1). Such an observation was possible due to the reflectance background provided by the large-scale turbidity plume.
Figure 7 shows the time series of ASCAT daily wind speed from late February to early May in 2017 over the northern East China Sea and the SWYS. Northeasterly wind dominated in March and begins to relax in late March and April. It switched to southwesterly wind twice in the first half of April, 2017, with a stronger southwesterly wind speed at 10 m/s on 5 April. The MODIS spotted a northward intrusion of the TWC that occurred during the northeasterly wind relaxation, resulting in a warming near the Jiangsu coast (Figure 6d). The earliest image to capture this phenomenon was on 11 April with large cloud coverage (not shown), suggesting the intrusion of the TWC should have happened during the northerly wind relaxation from 1 to 5 April 2017 (Figure 7).
The concurrence of northward extending of the TWC and northeasterly wind relaxation indicates a potential causal relationship. Compared to the limited temporal resolution of the MODIS image, HYCOM reanalysis data provided not only higher resolution insight to the wind-SST relationship but also more straightforward ocean dynamic response to wind variation. A numerical reanalysis from HYCOM confirmed that the general northward migration of isotherms and the intensified TWC respond to the northeasterly wind relaxation, leading to the intensified warming over the submarine canyon to the Jiangsu coast (Figure 8). On April 1 2017, the wind was still northerly, although it began to relax on 31 March, and the surface flow was uniformly southward at the speed of 0.1–0.15 m/s over the SWYS (Figure 8a). The flow was weak at the subsurface layer and bottom layer (Figure 8c,e). The sea level tilted to northeast with high sea level located in the Hangzhou bay, the Yangtze River estuary and the Jiangsu coast, probably due to Ekman transport induced by northerly wind. The warm waters of the TWC reach 31°N from the surface to the bottom layer (Figure 8a,c,e). Dominated by a southerly wind at 10 m/s on 5 April 2017, the surface layer showed an overall northward flow of 0.3 m/s in the SWYS (Figure 8b). In the 20 m layer, the flow was relatively week compared to the surface layer, and the strong current flow of 0.2 m/s along the 50 m isotherm and the submarine canyon brought warm water northwestward to the Jiangsu coast (Figure 8d). The bottom layer showed a strong flow at the bottom of the deep canyon, suggesting an interaction of the northward mitigating current and topography (Figure 8f).
The tongue of warm water mitigated northward to 31.5°N following the submarine topography through the water column. HYCOM reanalysis data confirm that, during the northerly wind relaxation, the northward current brought warm water from the south side to push isotherms northward, and the intensified flow at the submarine canyon led to intensified warming along the axis of the canyon to the Jiangsu coast.
To verify the physical mechanism that links wind stress and ocean currents, we calculated the net water transport across the sections at 31.5°N (as shown Figure 4a) and analyzed its relation to wind speed change using HYCOM reanalysis data. Net meridional water transport was obtained after a 27-hour moving average was carried out to filter the tidal variations. In 15 strong wind days (events) when the meridional wind speed reached local peaks between the 90–110th DoY from 2015 to 2019 (Figure 9), the net meridional water transport was calculated with time lag of 0 day (T + 0), 1 day (T + 1) and 2 days (T + 2).
Figure 10 shows the net water transport across the sections at 31.5°N and its relation with wind speed. The correlation between meridional wind speed and the simultaneous net water transport is weak (Figure 10a). With a one-day lag, the net water transport was significantly correlated with the meridional wind speed at a significant level of above 90% (Figure 10b). A stronger southerly wind brings a stronger northward current, both for the whole section (r = 0.52, p = 0.05) and the western section (r = 0.53, p = 0.04). With a two-day lag, the correlation was not significant between northerly wind and net water transport, which is consistent with the results of Tak et al. that the correlations between the northerly wind and the surface flow weakened overall at the two-day lag from a numerical study [30]. However, southerly wind was found to drive northward net water transport across the sections at 31.5°N, with a significant correlation (r = 0.65, p = 0.08 for the whole section and r = 0.82, p = 0.01 for the western section, Figure 10c). The residual current response to southerly wind with a lag time of one point five-to-two days has been confirmed by field observations in the western YS [31]. A regression analysis showed that the northward net water transport increases by 0.3 Sv (1 Sv = 1 × 10⁶ m3/s) with a southerly wind increase by 5 m/s. The regression intersection shows that northward net transport begins at the speed of 3 m/s (5 m/s) for the whole section (the western section). The response of net meridional water transport to wind change was more significant in the western part of the section, as illustrated by the higher correlation coefficient and higher level of significance. This result indicates that the southerly wind has stronger influence on the ocean current at the western section near the submarine canyon, compared to the whole section.
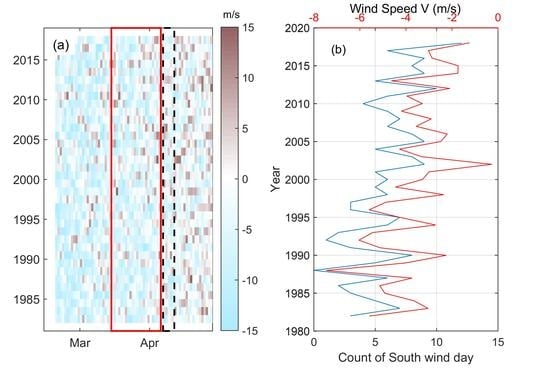
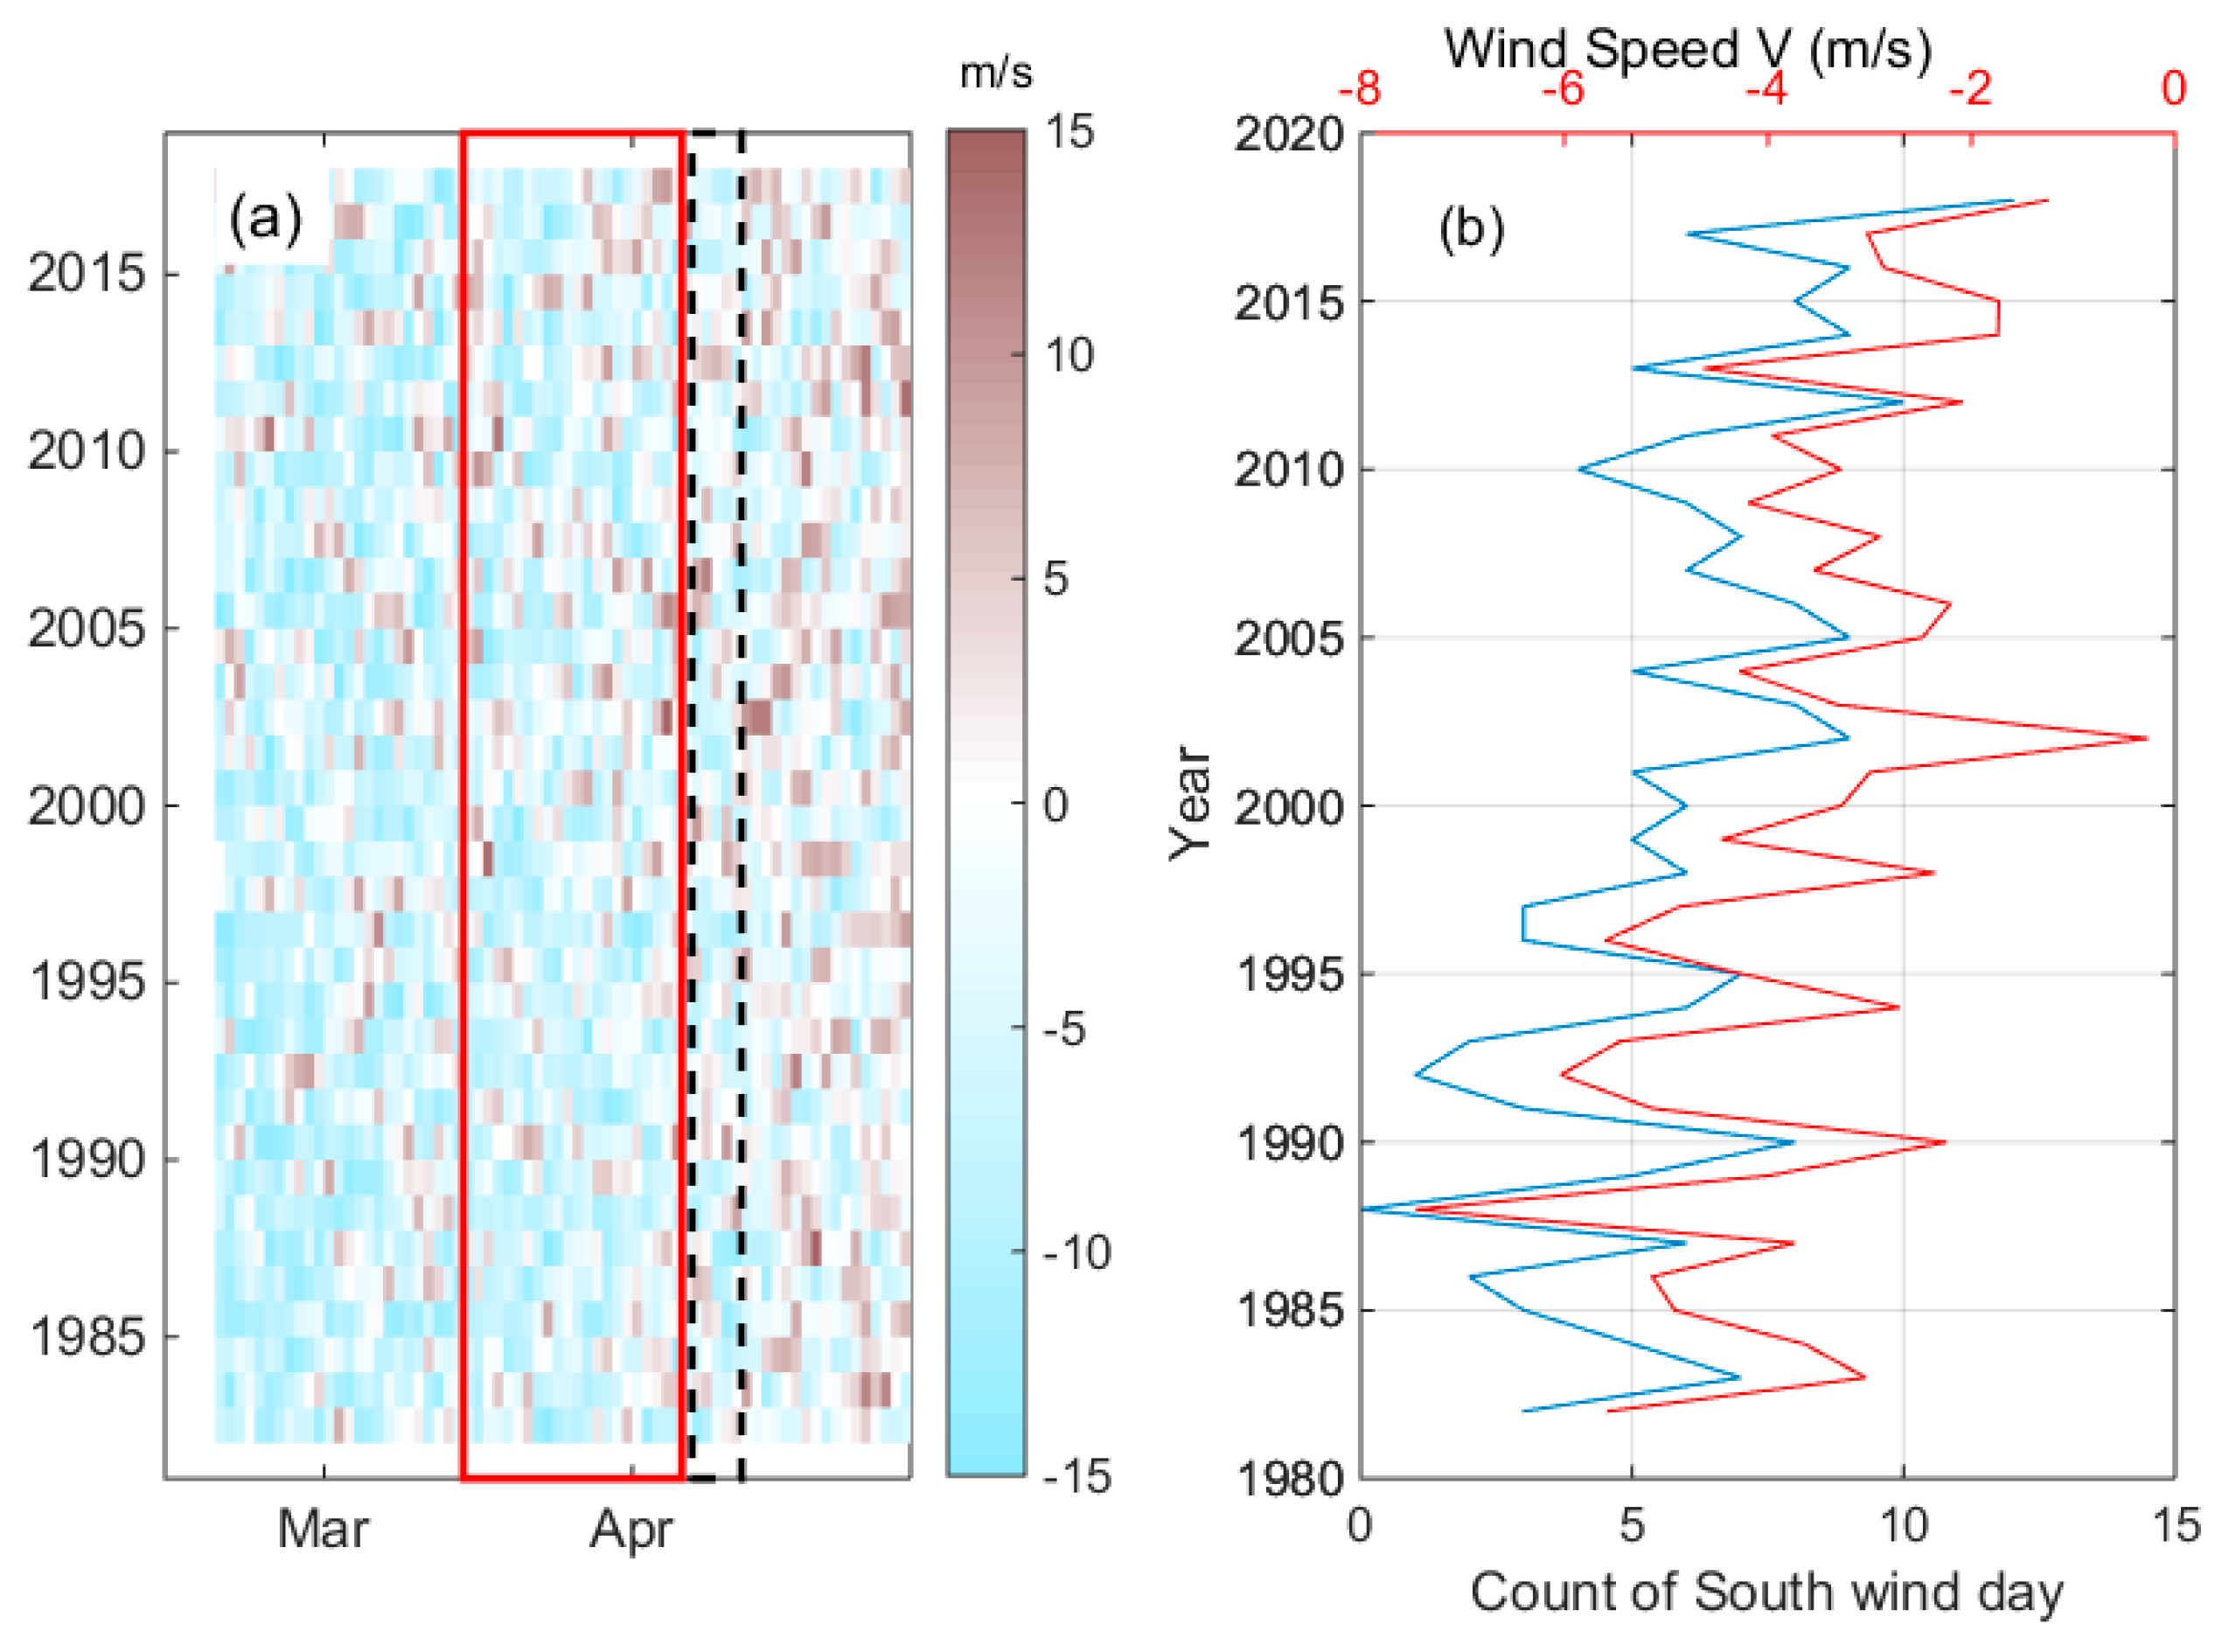
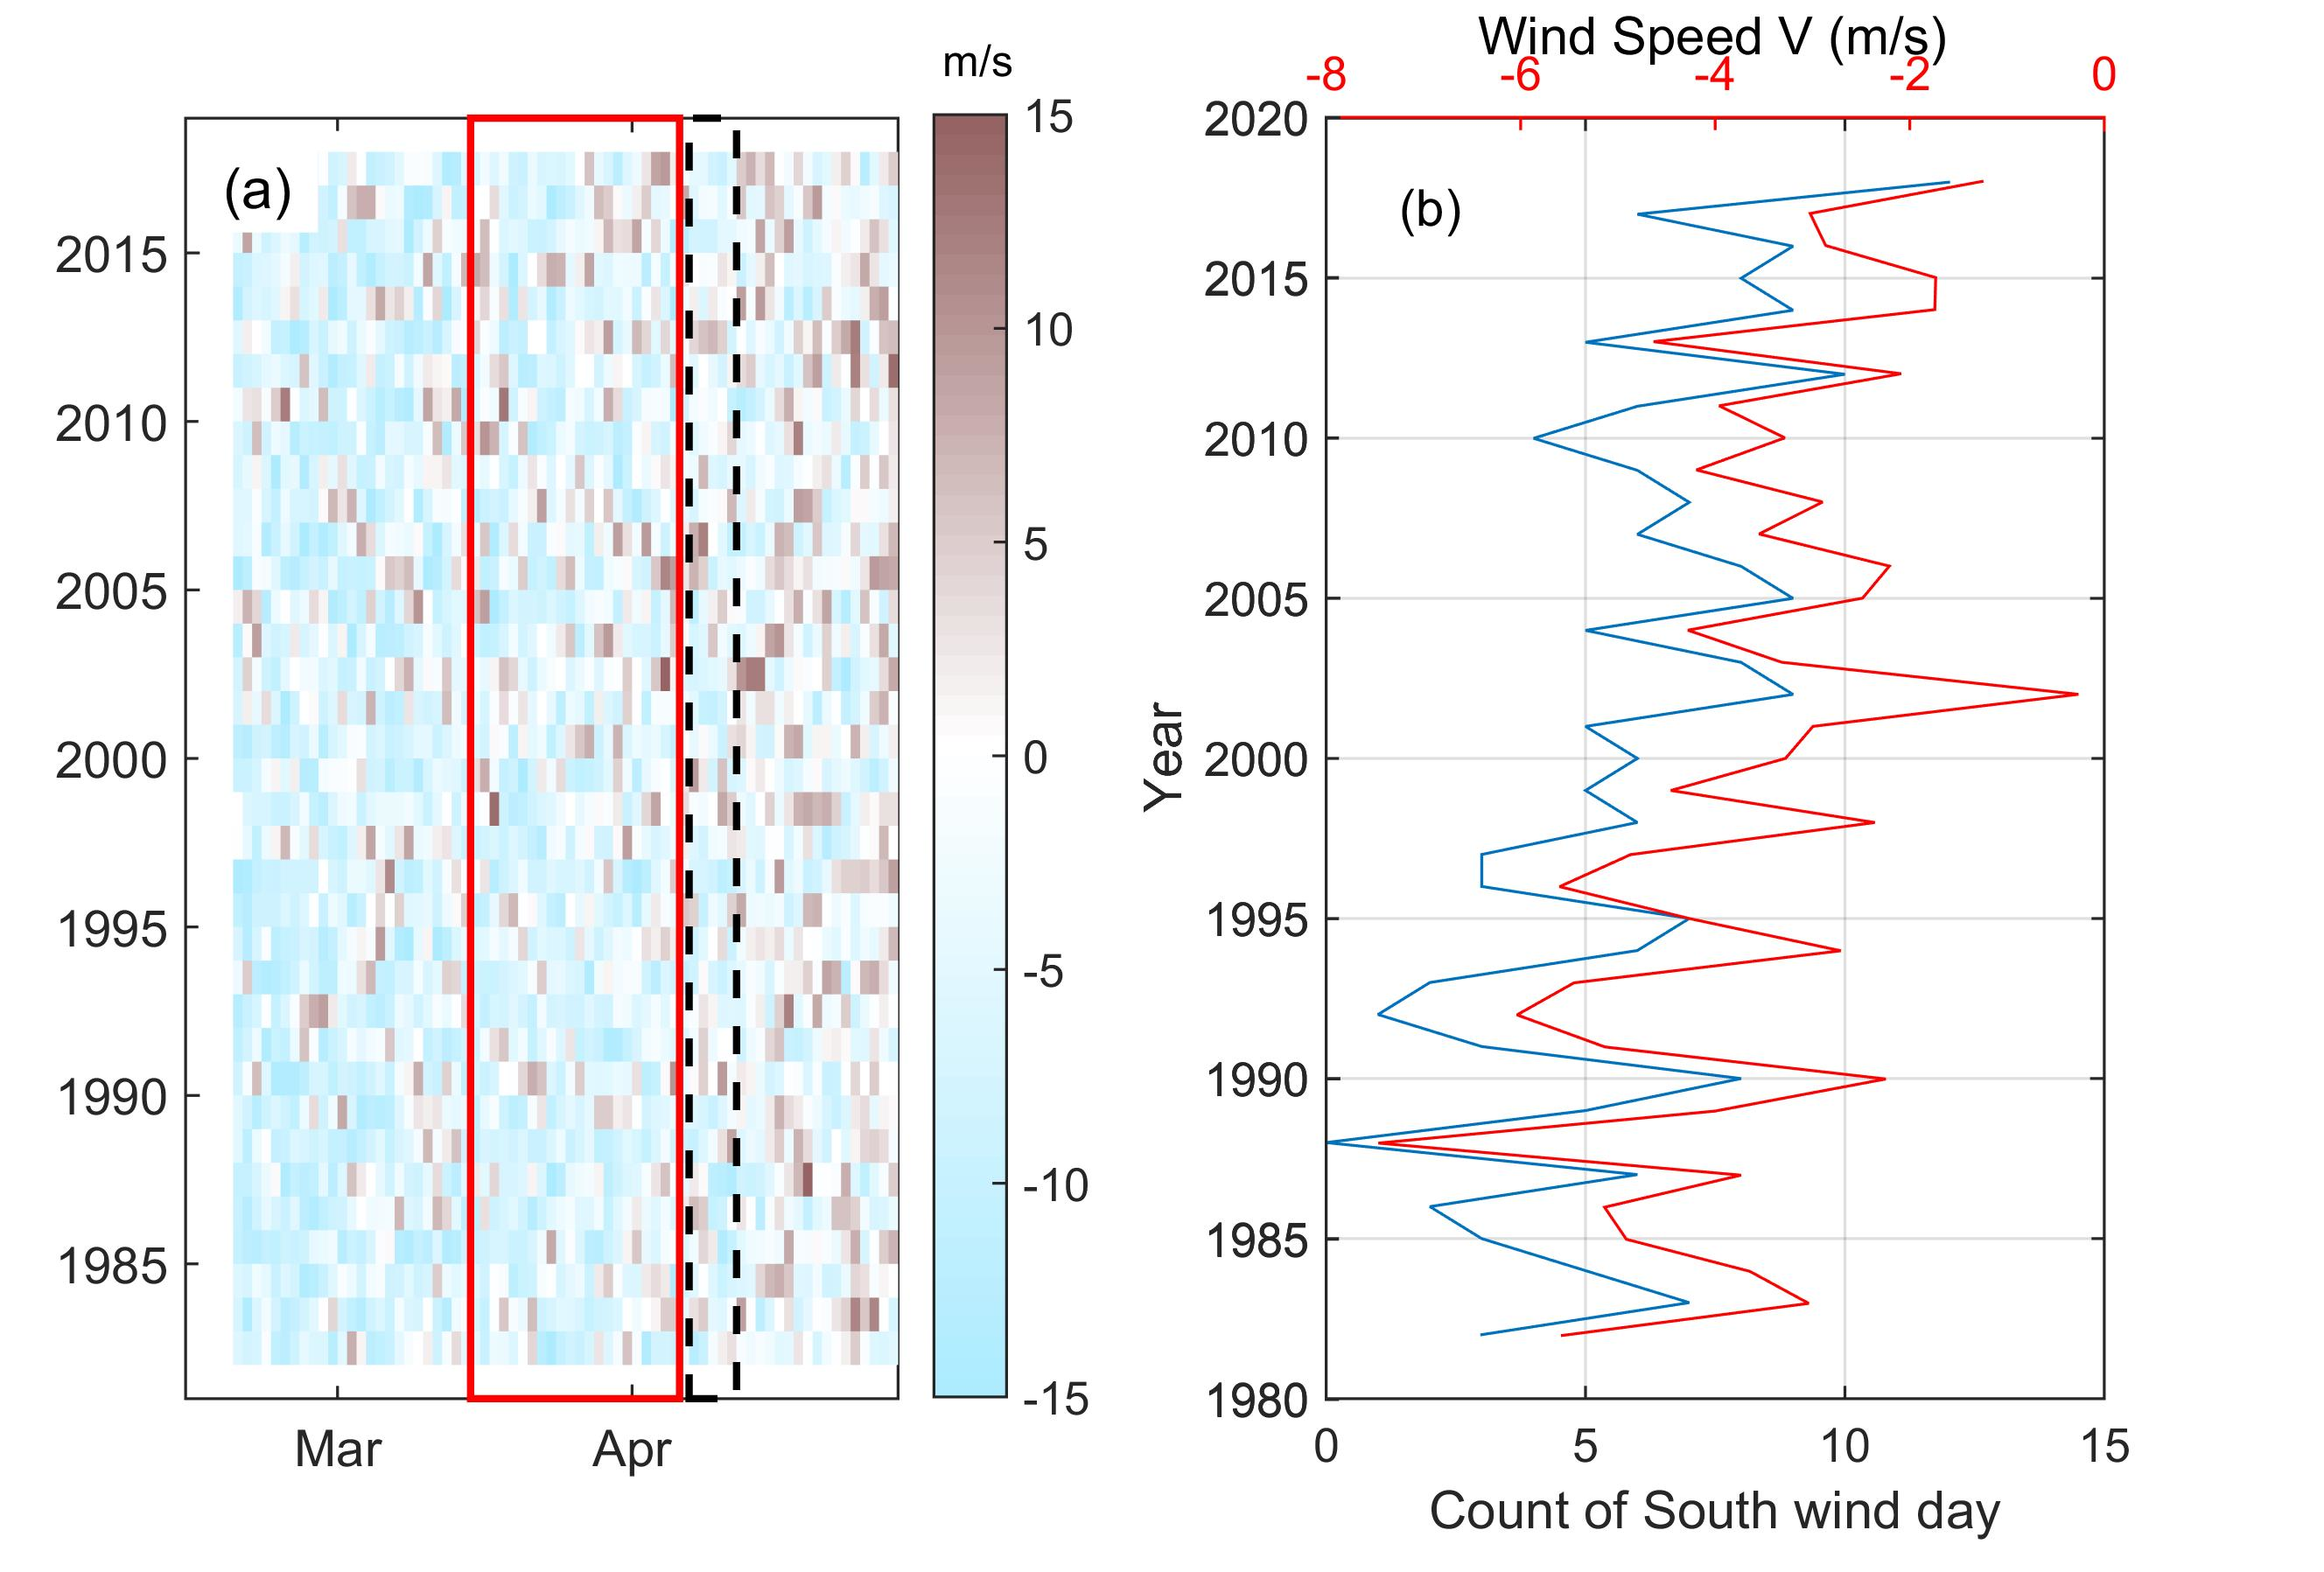
From middle March to early April, northeasterly (winter) monsoon still occupies the SWYS and northern East China Sea (Figure 11). It relaxes before shifting to southwesterly (summer) monsoon in May or June. We calculated the mean wind speed and counted the days with daily mean wind >0 (southwesterly wind) from middle March to early April. In the past few decades, the winter monsoon (northeasterly wind) has weakened from >4 m/s in 1980s to < 3 m/s in 2010s from middle March to early April over the study area. The days in which daily mean wind speed is southerly have increased from < 5 in 1980s to >8 in 2000s and 2010s, in agreement with the change of mean wind speed (with correlation coefficient of 0.89, not shown). Our analysis is consistent with the previous studies that have reported the weakening of the East Asian winter monsoon (EAWM) since the 1970s, which has been attributed to global warming [29,32], the coupling of sea surface warming with winter monsoon and ocean currents [21], and Pacific decadal variation [17]. With the increased south wind frequency, the intrusion of the Taiwan Warm Current is more frequent. Northward flow leads to a general warming over the SWYS, and the intensified flow along the submarine canyon contributes to rapid warming near the Jiangsu coast.
4. Conclusions
The water temperature in spring over the SWYS has strong ecological significance. In the present study, we analyzed the variation of spring SST in the time span of 1982–2018. A regression analysis showed that the warming trend of spring SST over the SWYS is four-to-six times faster than that of the global mean SST trend. For the SBS coastal water, the date reaching 10 °C each year shifts earlier by 10–13 days. This might lead to important ecologic consequences, since the micro-propagules of green algae in coastal waters of the SBS tend to germinate at 10 °C.
To understand such a strong warming with important potential ecological consequences, we carried out an EOF analysis to reveal the spatiotemporal characteristics of the early April SST variability. We found a dominant spatial pattern of overall warming over the SWYS with enhanced warming anchored over the submarine topography off the Yangtze River estuary and a significant temporal positive correlation with the northerly wind speed. The winter monsoon in the spring has changed a lot since the 1980s in a warming climate. The weakening of the northerly monsoon and increased southwesterly wind drive the TWC up to the canyon and spread to the SBS coast more frequently. The MODIS red–green–blue composite images captured the intrusion of the TWC into the SWYS through the submarine canyon during northerly wind relaxation in early April. Winds control the spring SST through ocean current advection and adjustment. This mechanism was verified by a HYCOM numerical reanalysis.
Our results suggest that the weakening of winter monsoon in middle March to early April in recent decades and the interaction between the TWC and submarine topography are responsible for the early spring warming over the SWYS. Multi-source remote sensing has provided important clues for understanding the regional SST variability in the SWYS. The advanced spring warming provides a favorable temperature conditions for green algae bloom in the Yellow Sea.
Author Contributions
Conceptualization, X.W.; methodology, X.W.; validation, G.L.; Writing—Original Draft preparation, X.W.; Writing—Review and Editing, Y.-A.L., B.W., K.T.; visualization, H.M.; supervision, Q.X.
Funding
This research was funded by the Fundamental Research Funds for the Central Universities (Grant No. 2018B52814 and 2016B11614), the Chinese Natural Science Foundation (Grant Nos. 41976163, 41776183, 41706003, 41706023 and 41776004), Dayu Scholar Program of Hohai University (for Q.X.) and the Natural Science Foundation of Jiangsu Province (Grants No. BK20170871).
Acknowledgments
We would like to thank Chuanmin Hu of Optical Oceanography Laboratory, College of Marine Science, University of South Florida for providing MODIS images online via https://optics.marine.usf.edu/cgi-bin/optics_data?roi=YS_ECS¤t=1. NCEP_Reanalysis 2 data provided by the NOAA/OAR/ESRL PSD, Boulder, Colorado, USA, from their Web site at https://www.esrl.noaa.gov/psd. Daily Advanced Scatterometer (ASCAT) surface wind data were obtained from the Centre de Recherche et d’Exploitation Satellitaire (CERSAT), at IFREMER, Plouzané (France) at: http://apdrc.soest.hawaii.edu/datadoc/ascat.php. We thank Yan Li of Xiamen University and Yining Chen of the Second Institute of Oceanography, MNR for insightful discussions that helped improve the framework of this study. We sincerely thank four anonymous reviewers for their constructive comments and suggestions that improved this paper.
Conflicts of Interest
The authors declare no conflict of interest.
References
- Hu, C.; Li, D.; Chen, C.; Ge, J.; Muller-Karger, F.E.; Liu, J.; Yu, F.; He, M. On the recurrent Ulva prolifera blooms in the Yellow Sea and East China Sea. J. Geophys. Res. 2010, 115, C05017. [Google Scholar] [CrossRef]
- Xu, Q.; Zhang, H.; Ju, L.; Chen, M. Interannual variability of Ulvaprolifera blooms in the Yellow Sea. Int. J. Remote Sens. 2014, 35, 4099–4113. [Google Scholar] [CrossRef]
- Xing, Q.; Hu, C.; Tang, D.; Tian, L.; Tang, S.; Wang, X.H.; Lou, M.; Gao, X. World’s Largest Macroalgal Blooms Altered Phytoplankton Biomass in Summer in the Yellow Sea: Satellite Observations. Remote Sens. 2015, 7, 12297–12313. [Google Scholar] [CrossRef]
- Cao, Y.; Wu, Y.; Fang, Z.; Cui, X.; Liang, J.; Song, X. Spatiotemporal Patterns and Morphological Characteristics of Ulva prolifera Distribution in the Yellow Sea, China in 2016–2018. Remote Sens. 2019, 11, 445. [Google Scholar] [CrossRef]
- Xu, Q.; Zhang, H.; Cheng, Y.; Zhang, W. Monitoring and tracking the green tide in the Yellow Sea with satellite imagery and trajectory model. IEEE J. Sel. Top. Appl. Earth Obs. Remote Sen. 2016, 9, 5172–5181. [Google Scholar] [CrossRef]
- Wang, Z.; Xiao, J.; Fan, S.; Li, Y.; Liu, X.; Liu, D. Who made the world’s largest green tide in China?—An integrated study on the initiation and early development of the green tide in Yellow Sea. Limnol. Oceanogr. 2015, 60, 1105–1117. [Google Scholar] [CrossRef]
- Xiao, J.; Zhang, X.; Gao, C.; Jiang, M.; Li, R.; Wang, Z.; Li, Y.; Fan, S.; Zhang, X. Effect of temperature, salinity and irradiance on growth and photosynthesis of Ulva prolifera. Acta. Oceanol. Sin. 2016, 10, 114–121. [Google Scholar] [CrossRef]
- Qi, L.; Hu, C.; Wang, M.; Shang, S.; Wilson, C. Floating Algae Blooms in the East China Sea. Geophys. Res. Lett. 2017, 44, 501–511. [Google Scholar] [CrossRef]
- Song, W.; Peng, K.; Xiao, J.; Li, Y.; Wang, Z.; Liu, X.; Fu, M.; Fan, S.; Zhu, M.; Li, R. Effects of temperature on the germination of green algae micro-propagules in coastal waters of the Subei Shoal, China. Estuar. Coast. Shelf Sci. 2015, 163, 63–68. [Google Scholar] [CrossRef]
- Xuan, J.; Zhou, F.; Huang, D.; Wei, H.; Liu, C.; Xing, C. Physical processes and their role on the spatial and temporal variability of the spring phytoplankton bloom in the central Yellow Sea. Acta Ecol. Sin. 2011, 1, 61–70. [Google Scholar] [CrossRef]
- Bao, B.; Ren, G. Climatological characteristics and long-term change of SST over the marginal seas of China. Cont. Shelf Res. 2014, 77, 96–106. [Google Scholar] [CrossRef]
- Kim, Y.S.; Jang, C.J.; Yeh, S. Recent surface cooling in the Yellow and East China Seas and the associated North Pacific climate regime shift. Cont. Shelf Res. 2018, 156, 43–54. [Google Scholar] [CrossRef]
- Park, T.; Jang, C.J.; Jungclaus, J.H.; Haak, H.; Park, W.; Sang, O.I. Effects of the Changjiang river discharge on sea surface warming in the Yellow and East China Seas in summer. Cont. Shelf Res. 2011, 31, 15–22. [Google Scholar] [CrossRef]
- Park, K.; Lee, E.; Chang, E.; Hong, S. Spatial and temporal variability of sea surface temperature and warming trends in the Yellow Sea. J. Mar. Syst. 2015, 143, 24–38. [Google Scholar] [CrossRef]
- Pei, Y.; Liu, X.; He, H. Interpreting the sea surface temperature warming trend in the Yellow Sea and East China Sea. Sci. China Earth Sci. 2017, 60, 1558–1568. [Google Scholar] [CrossRef]
- Wang, Q.; Li, Y.; Li, Q.; Liu, Y.; Wang, Y. Changes in Means and Extreme Events of Sea Surface Temperature in the East China Seas Based on Satellite Data from 1982 to 2017. Atmosphere-Basel 2019, 10, 140. [Google Scholar] [CrossRef]
- Yeh, S.; Kim, C. Recent warming in the Yellow/East China Sea during winter and the associated atmospheric circulation. Cont. Shelf Res. 2010, 13, 1428–1434. [Google Scholar] [CrossRef]
- Belkin, I.M. Rapid warming of large marine ecosystems. Prog. Oceanogr. 2009, 81, 207–213. [Google Scholar] [CrossRef]
- Wang, F.; Meng, Q.; Tang, X.; Hu, D. The long-term variability of sea surface temperature in the seas east of China in the past 40 a. Acta Oceanol. Sin. 2013, 32, 48–53. [Google Scholar] [CrossRef]
- Zhang, L.; Wu, L.; Lin, X.; Wu, D. Modes and mechanisms of sea surface temperature low-frequency variations over the coastal China seas. J. Geophys. Res. 2010, 115. [Google Scholar] [CrossRef]
- Oey, L.-Y.; Chang, M.-C.; Chang, Y.-L.; Lin, Y.-C.; Xu, F.-H. Decadal warming of coastal China Seas and coupling with winter monsoon and currents. Geophys. Res. Lett. 2013, 40, 6288–6292. [Google Scholar] [CrossRef]
- Abderrahim, B.; Denis, C.-F. Gridded surface wind fields from Metop/ASCAT measurements. Int. Remote Sens. 2012, 33, 1729–1754. [Google Scholar] [CrossRef]
- Hu, Z.; Pan, D.; He, X.; Bai, Y. Diurnal Variability of Turbidity Fronts Observed by Geostationary Satellite Ocean Color Remote Sensing. Remote Sens. 2016, 8, 147. [Google Scholar] [CrossRef]
- Hwang, J.H.; Van, S.P.; Choi, B.; Chang, Y.S.; Kim, Y.H. The physical processes in the Yellow Sea. Ocean Coast. Manag. 2014, 102, 449–457. [Google Scholar] [CrossRef]
- Yuan, D.; Zhu, J.; Li, C.; Hu, D. Cross-shelf circulation in the Yellow and East China Seas indicated by MODIS satellite observations. J. Mar. Syst. 2008, 70, 134–149. [Google Scholar] [CrossRef]
- Zhang, S.; Xu, Q.; Zheng, Q.; Li, X. Mechanisms of SAR Imaging of Shallow Water Topography of the Subei Bank. Remote Sens. 2017, 9, 1203. [Google Scholar] [CrossRef]
- Yuan, D.; Hsueh, Y. Dynamics of the cross-shelf circulation in the Yellow and East China Seas in winter. Deep Sea Res. Part II Top. Stud. Oceans 2010, 19, 1745–1761. [Google Scholar] [CrossRef]
- Shi, W.; Wang, M. Satellite observations of the seasonal sediment plume in central East China Sea. J. Mar. Syst. 2010, 82, 280–285. [Google Scholar] [CrossRef]
- Luo, Z.; Zhu, J.; Wu, H.; Li, X. Dynamics of the Sediment Plume Over the Yangtze Bank in the Yellow and East China Seas. J. Geophys. Res. Oceans 2017, 122, 10073–10090. [Google Scholar] [CrossRef] [Green Version]
- Lee, S.-S.; Kim, S.-H.; Jhun, J.-G.; Ha, K.-J.; Seo, Y.-W. Robust warming over the East Asia during the boreal winter monsoon and its possible causes. Environ. Res. Lett. 2013, 8, 034001. [Google Scholar] [CrossRef]
- Tak, Y.-J.; Cho, Y.-K.; Seo, G.-H.; Choi, B.-J. Evolution of wind-driven flows in the Yellow Sea during winter. J. Geophys. Res. Oceans 2016, 121, 1970–1983. [Google Scholar] [CrossRef]
- Xu, M.; Chang, C.-P.; Fu, C.; Qi, Y.; Robock, A.; Robinson, D.; Zhang, H.-M. Steady decline of East Asian monsoon winds, 1969–2000: Evidence from direct ground measurements of wind speed. J. Geophys. Res. 2006, 111, D24111. [Google Scholar] [CrossRef]
Figure 1.
Regional map of the southwestern Yellow Sea. Topography data deeper than 100 m are from ETOPO2 (Global elevation and bathymetry on 2 arc-minute grid from the National Geophysical Data Center, NOAA, USA) data sets, with 50, 30, 20 and 10 m isobaths from nautical charts. The arrows in the map indicate the Yellow Sea Warm Current (YSWC), the Yellow Sea Coastal Current (YSCC), the Korea Coastal Current (KCC), the Tsushima Warm Current (TSWC), Taiwan Warming Current (TWC) and Kuroshio Current (KC). SBS indicates the Subei Shoal, a radial sand ridge system (as shown by the 10 and 20 m isobaths) located near the coastline of Yangtze Bank. The blue line box (120–125°E, 30–35°N) is the study area of the present study, mainly in the southwestern Yellow Sea. The green dash line box (122.8–126.6°E, 28.5–32.3°N) indicates the area where wind data were averaged in Section 3.3. The labeled red star symbols indicate the stations for the spring sea surface temperature evolution analysis in Section 3.1.

Figure 2.
Warming trend of sea surface temperature (SST) over the southwestern Yellow Sea (°C/year). (a) Annual warming trend; (b) warming in the spring (March–May). The overlapped bold (thin) white solid line is the 50 m (10 m) isobath; doted and dash-dotted lines are the 30 and 20 m isobaths, respectively; black solid lines indicate the 95% significance for warming trend regression. Four circles in (b) labeled as A, B, C, D are the locations where SST was analyzed and which are presented in Figure 3a–d.
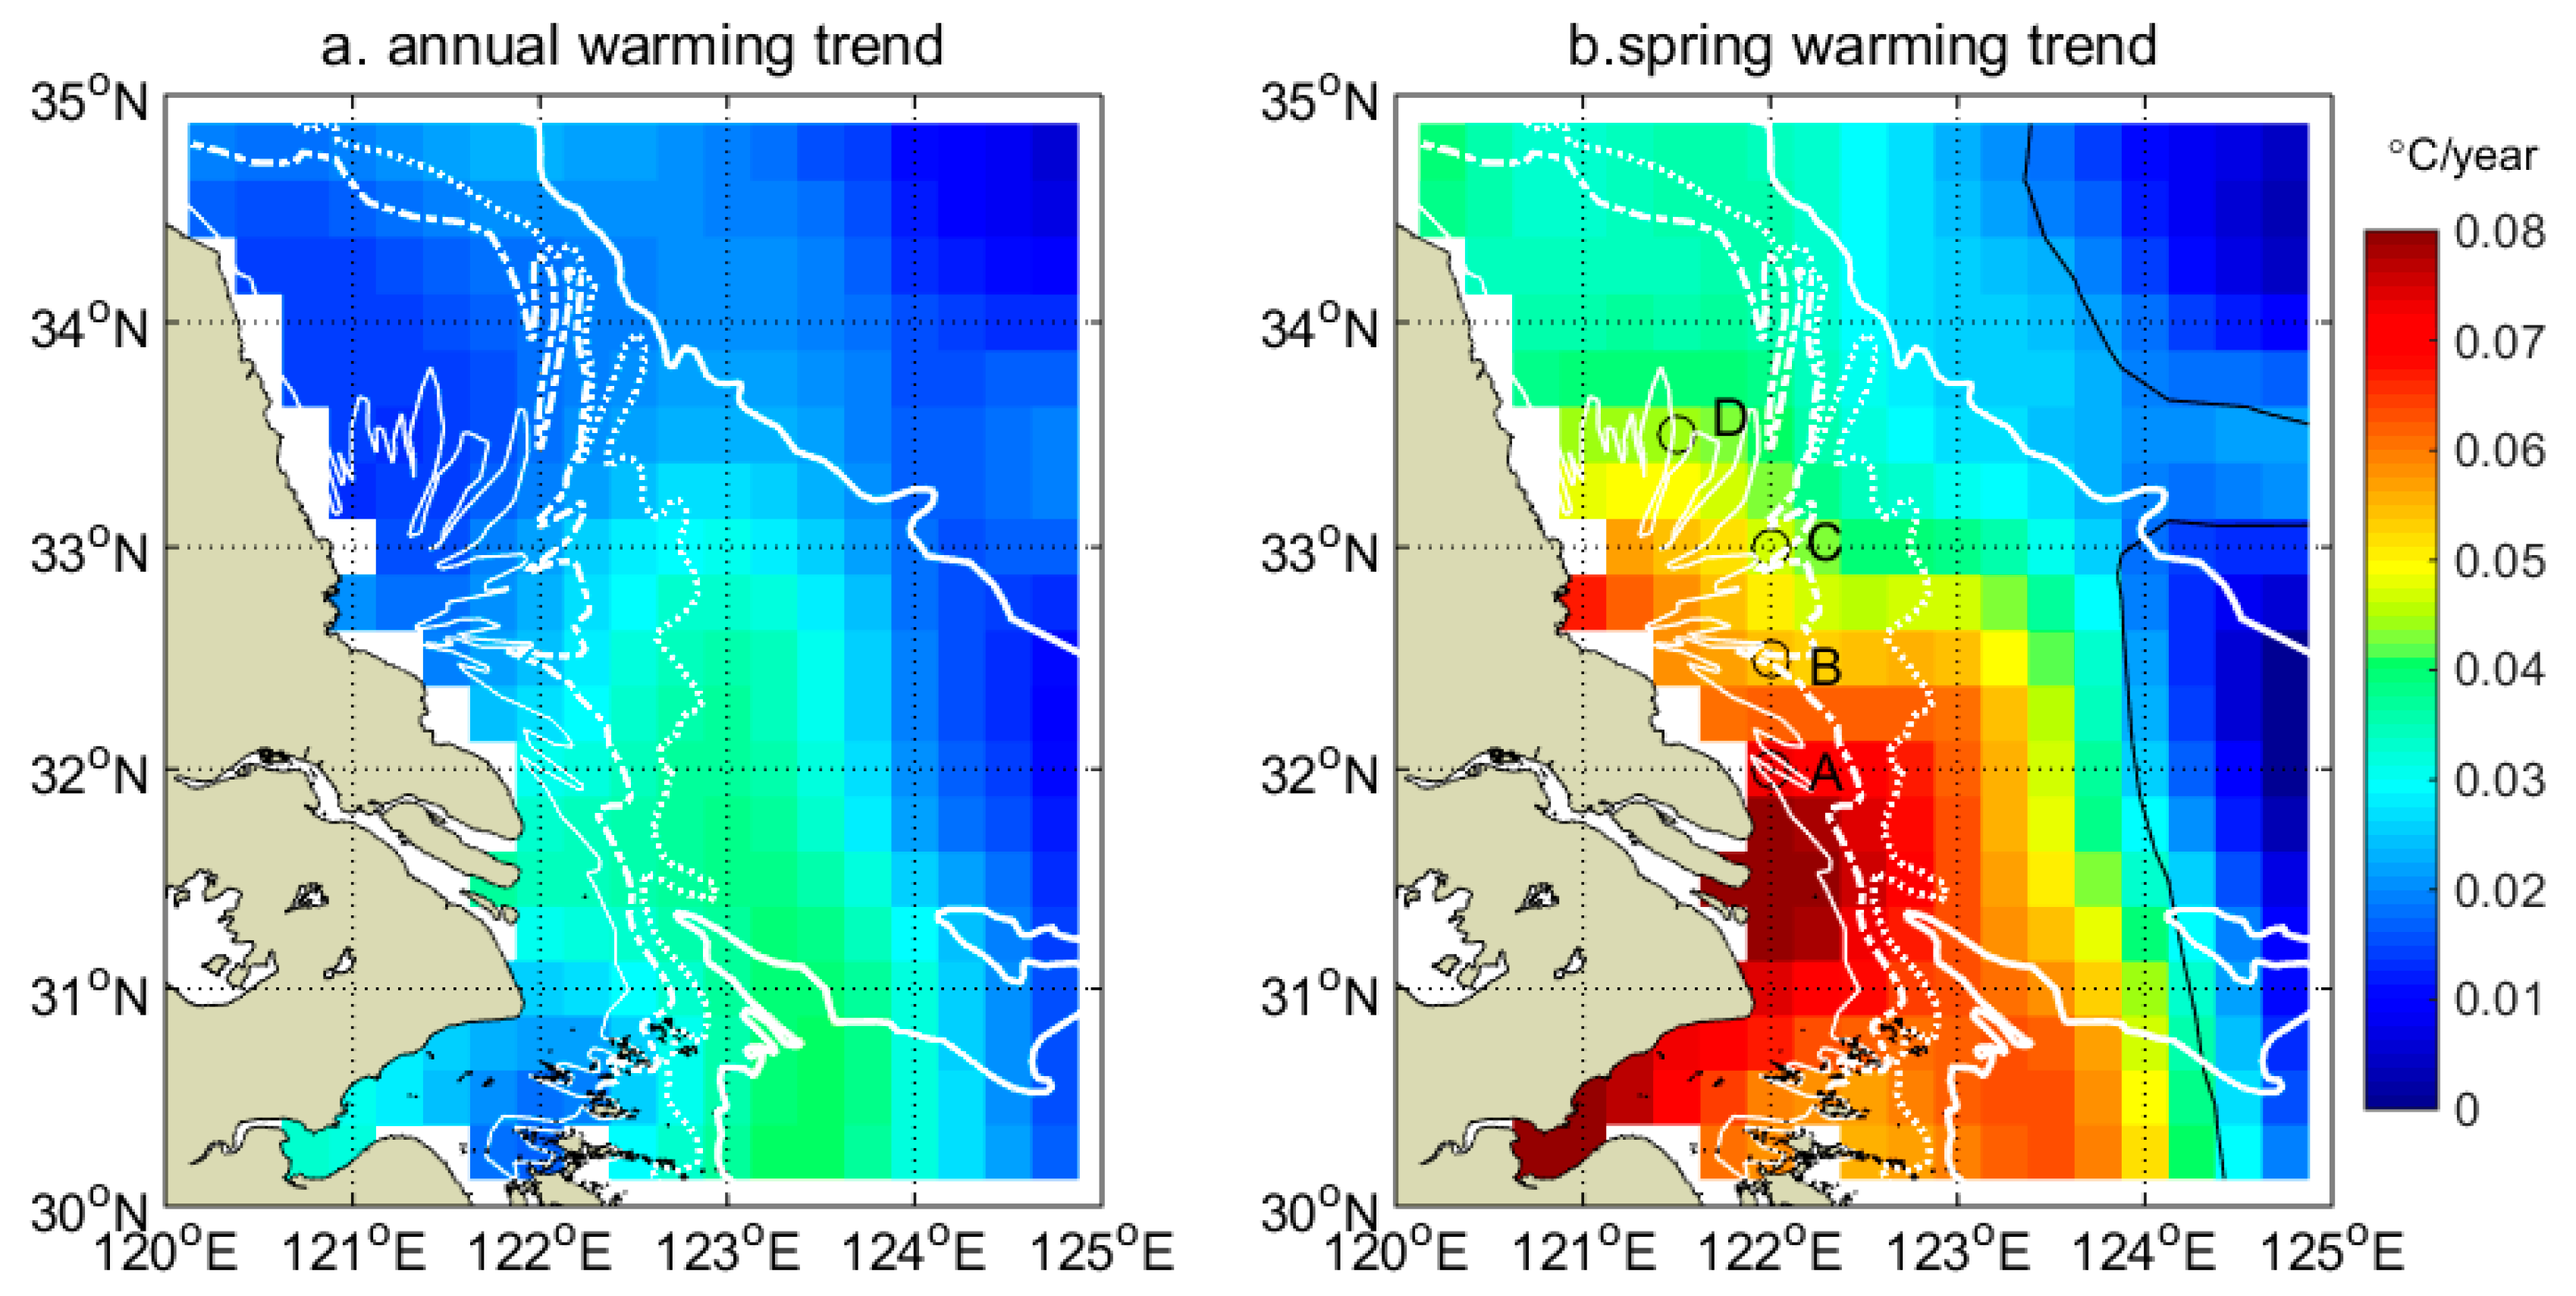
Figure 3.
SST near Jiangsu shoal as a function of year and year–day: (a–d) at locations indicated in Figure 2b, with 8, 10 and 15 °C contours lines labelled; (e) (a–d) averaged, with red, green and blue curves for five-point smoothed 8, 10 and 15 °C and colored straight lines for their trends (R = −0.50, −0.66, −0.84, respectively, p < 0.01 for all). The black vertical solid lines indicate the 100th year day.
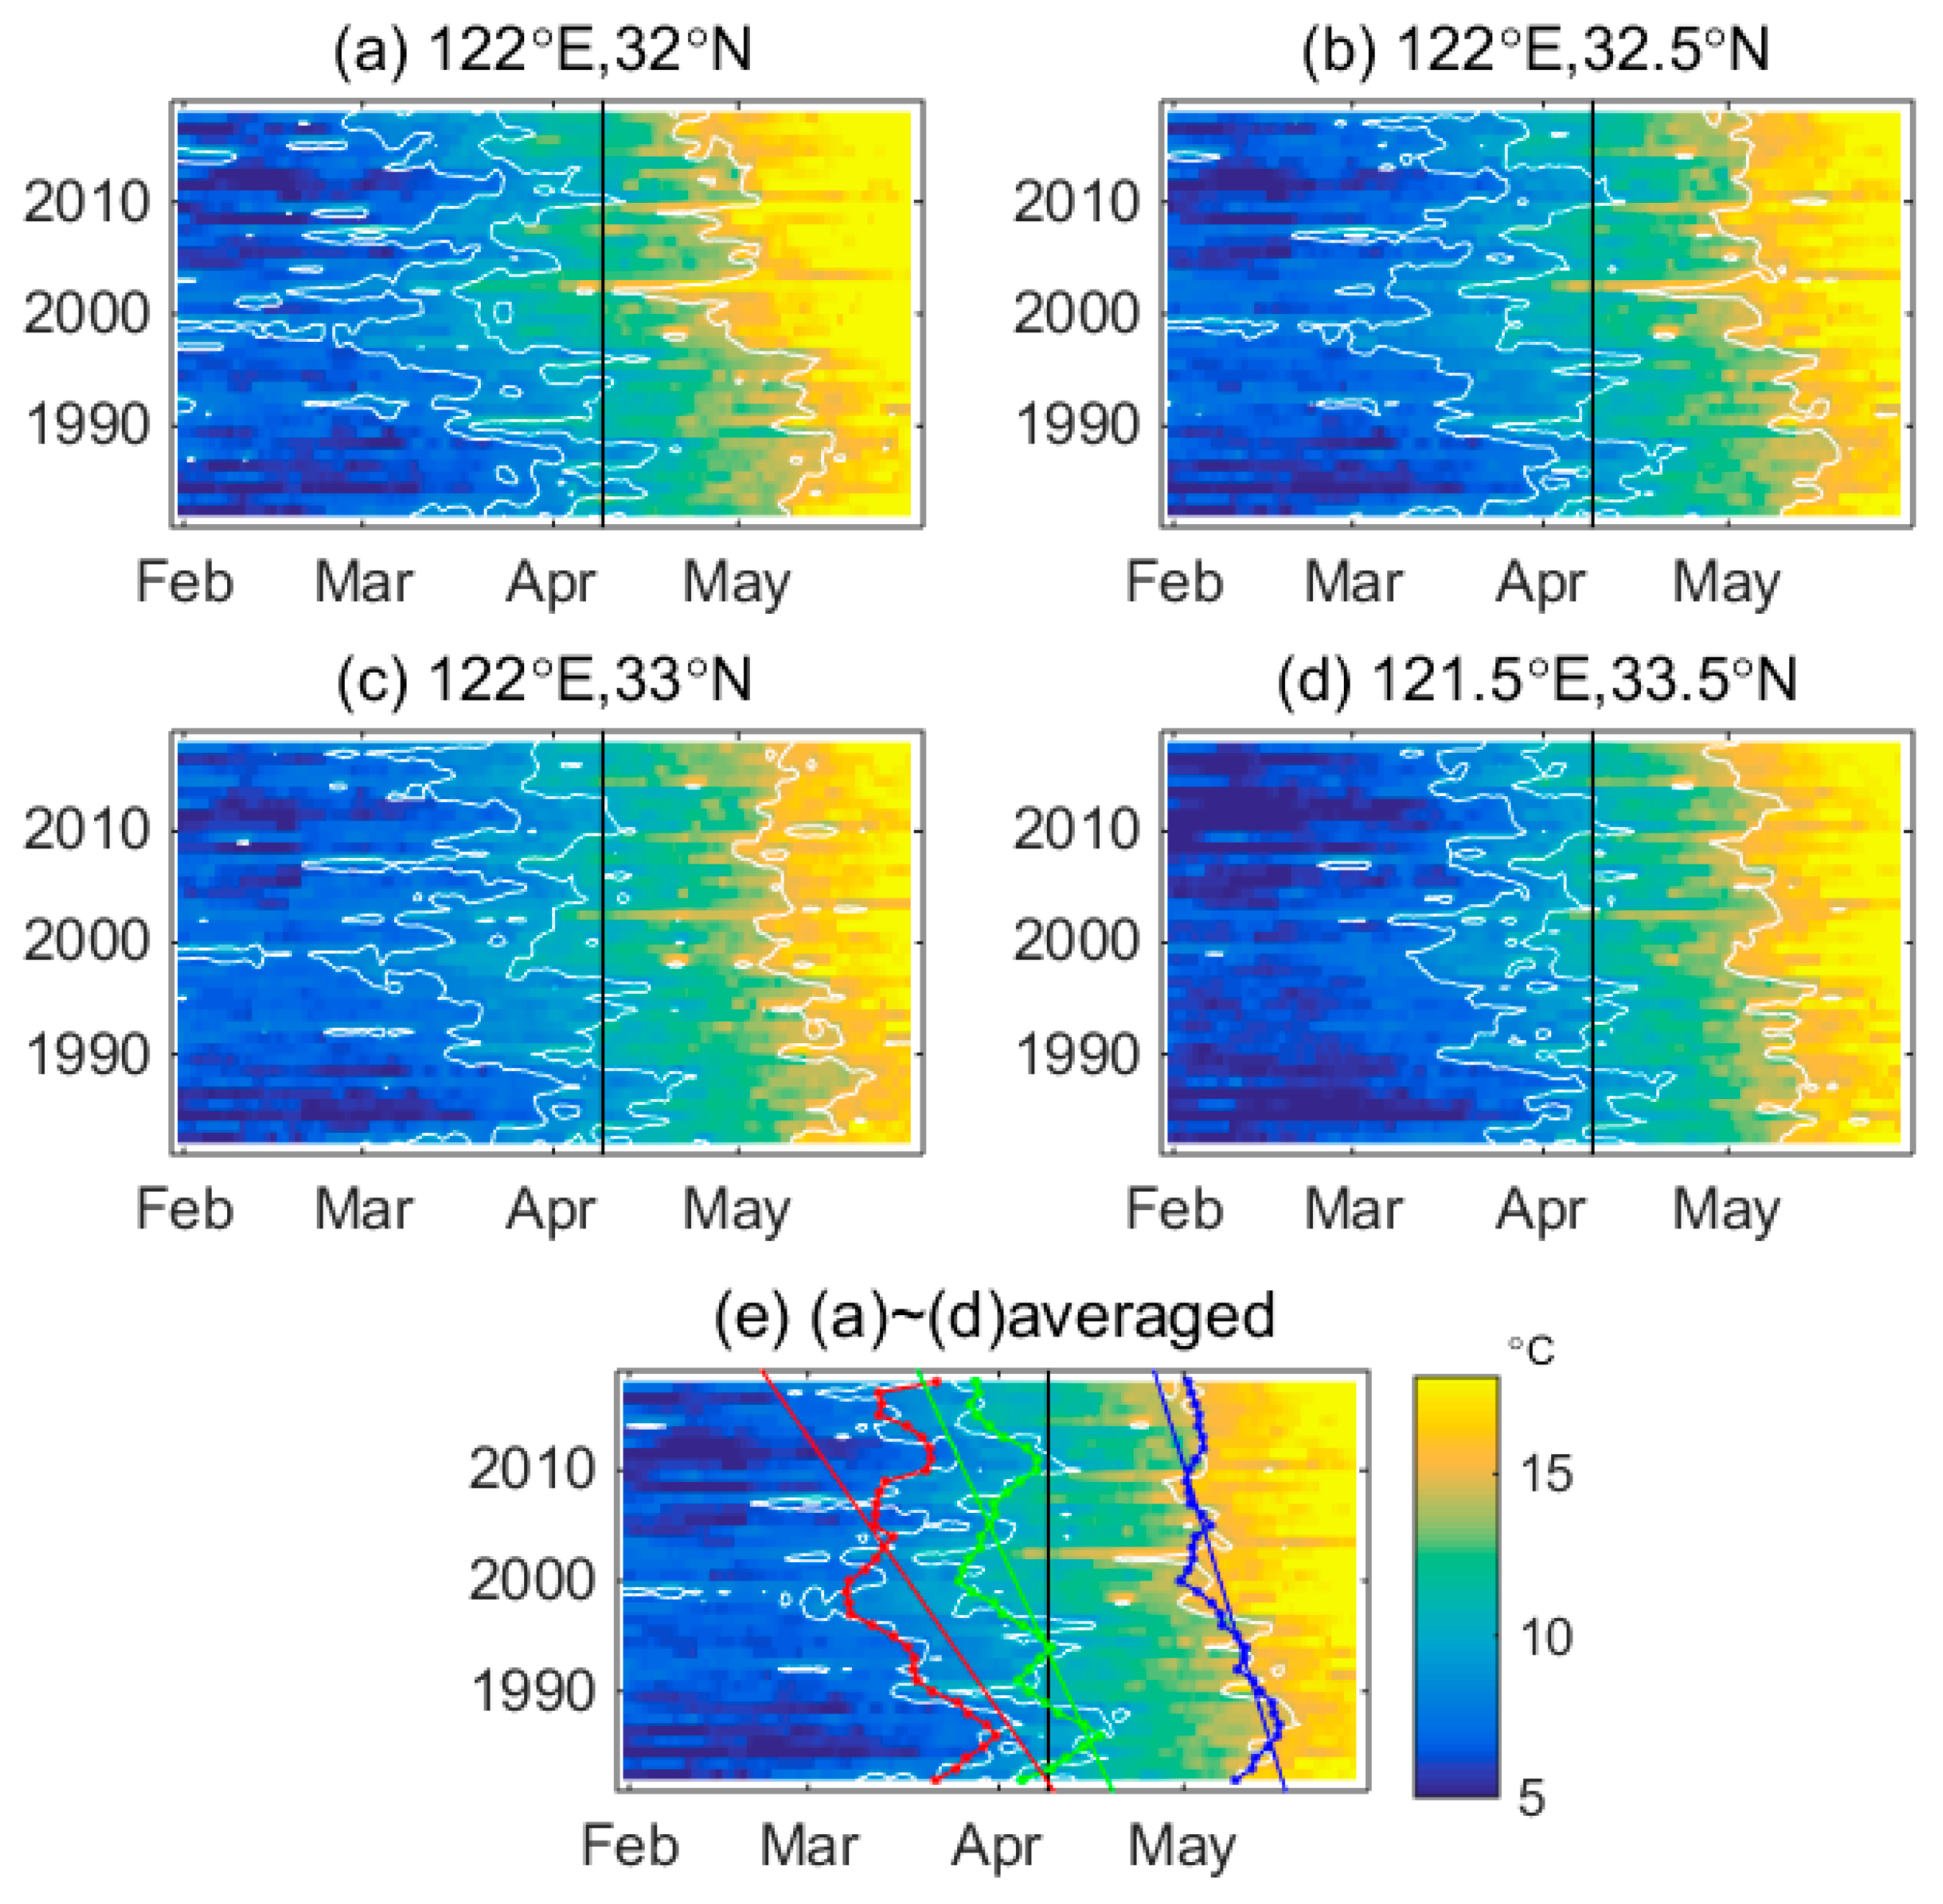
Figure 4.
Empirical orthogonal (EOF) analysis of the SST time series of year day 100 from 1982 to 2018. (a) EOF Mode 1 (73.5%); (b) EOF Mode 2 (11.3%); (c) principal component (PC) time series of first two modes and trend of PC 1. Overlapped bold (thin) solid white line in (a,b) is the 50 m (10 m) isobath; doted white line is 30 m isobath; dash-dotted white line is 20 m isobath. In (a), the thick black line shows the location of the whole section at 31.5°N for net water transport, from 122–125°E; the green rectangle shows the western section, 122.3–123.5°E.

Figure 5.
Relationship between the meridional wind speed (m/s) and the PC of the leading EOF of SST in the southwestern Yellow Sea in Figure 3. (a) Time series plot; (b) scatter plot. The wind speed was averaged over the 122.8–126.5°E, 28.6–32.4°N (location shown as the green dash box in Figure 1) from middle March to 10 April of the year 1982 to 2018.

Figure 6.
Moderate Resolution Imaging Spectroradiometer (MODIS) image before [(a) 18:00 Greenwich Mean Time (GMT) on April 1st, 2017; (c) 05:05 GMT on 2 April 2017, GMT] and after [(b) 04:45 GMT on 13 April 2017; (d) 03:10 GMT on 13 April 2017, GMT] the intrusion of the Taiwan Warm Current to the Jiangsu coast via the submarine canyon: (a,b) visible RGB (red–green–blue) composite images; (c,d) SST (°C). MODIS images were downloaded from: https://optics.marine.usf.edu/index.html.
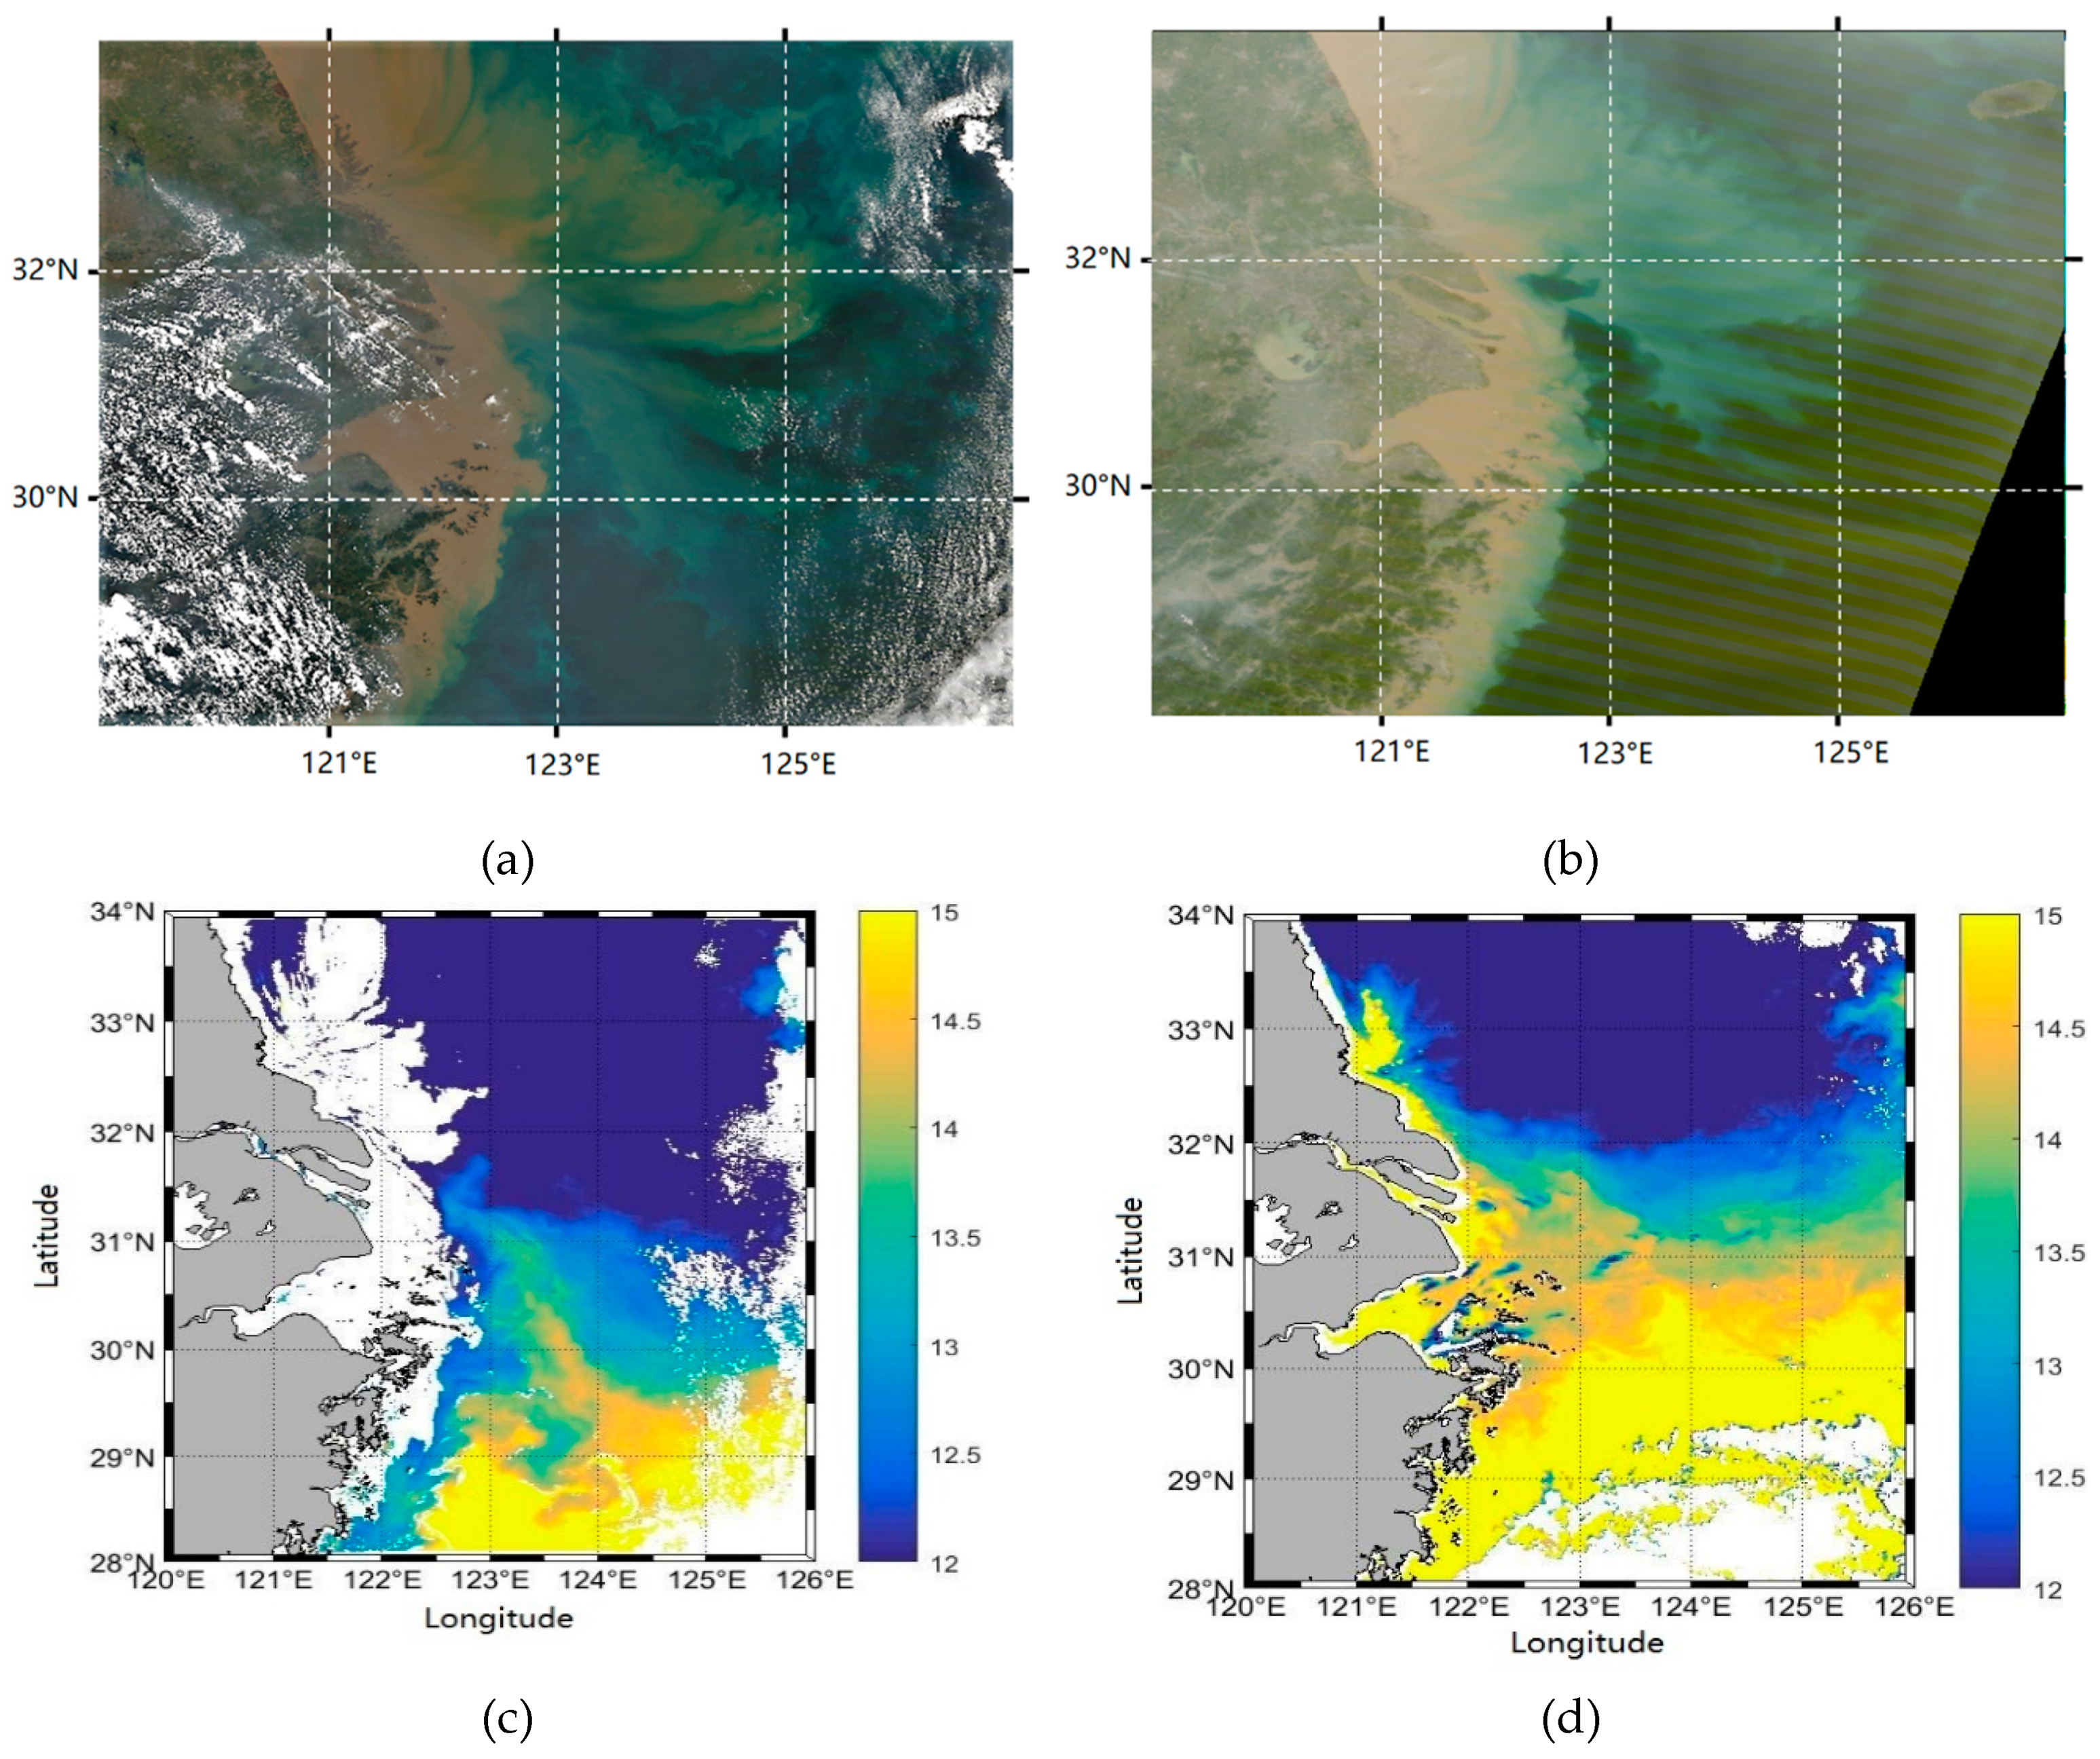
Figure 7.
Time series of the advanced scatterometer ASCAT wind speed over the northern East China Sea and the southern Yellow Sea (30–33°N; 123–125°E) from late February to early May in 2017. Two thick vertical straight lines indicate the date when the MODIS images in Figure 4 were acquired.
Figure 7.
Time series of the advanced scatterometer ASCAT wind speed over the northern East China Sea and the southern Yellow Sea (30–33°N; 123–125°E) from late February to early May in 2017. Two thick vertical straight lines indicate the date when the MODIS images in Figure 4 were acquired.
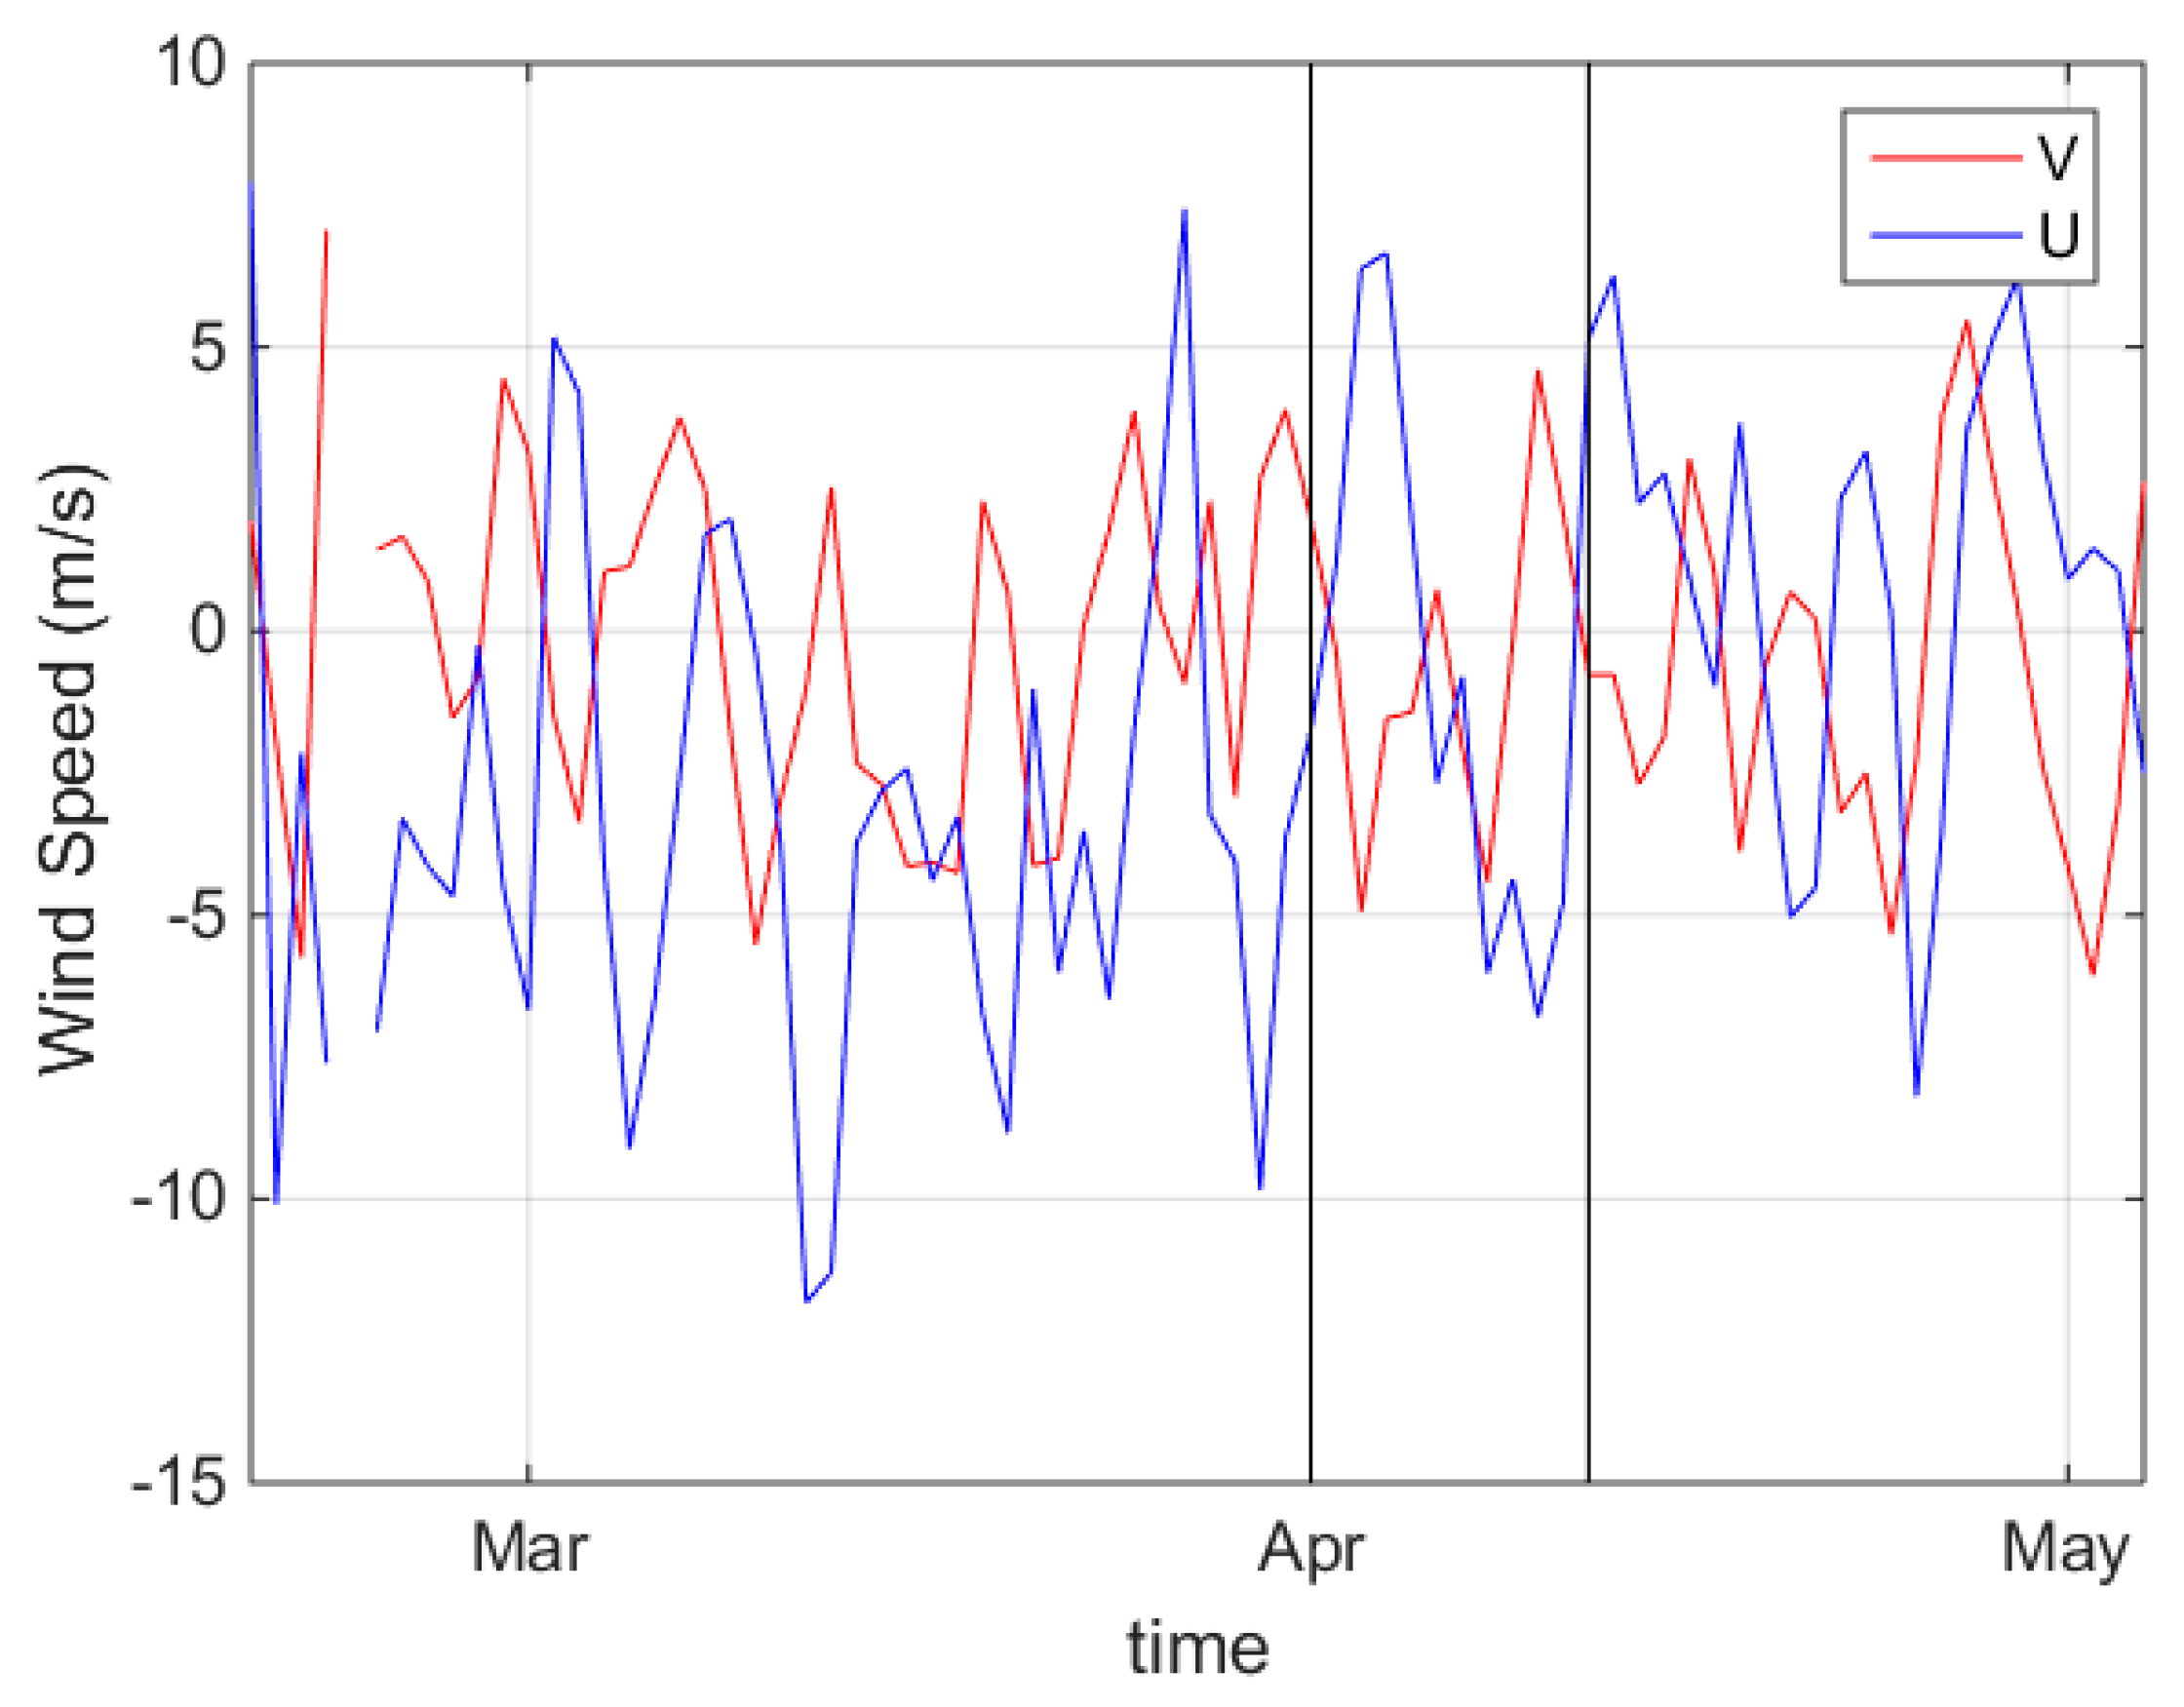
Figure 8.
Temperature (°C), velocity (m/s) and sea surface height (m) from HYbrid Coordinate Ocean Model (HYCOM) reanalysis data on April 1 (left panel) and April 5, 2017 (right panel): (a,b) surface layer; (c,d) 20 m layer; and (e,f) bottom layer. Data used here were averaged over 24 hours to remove the tidal variation. Overlapped bold (thin) solid white line is the 50 m (10 m) isobath; dashed white line is 30 m isobath; dash-dotted white line is 20 m isobath.
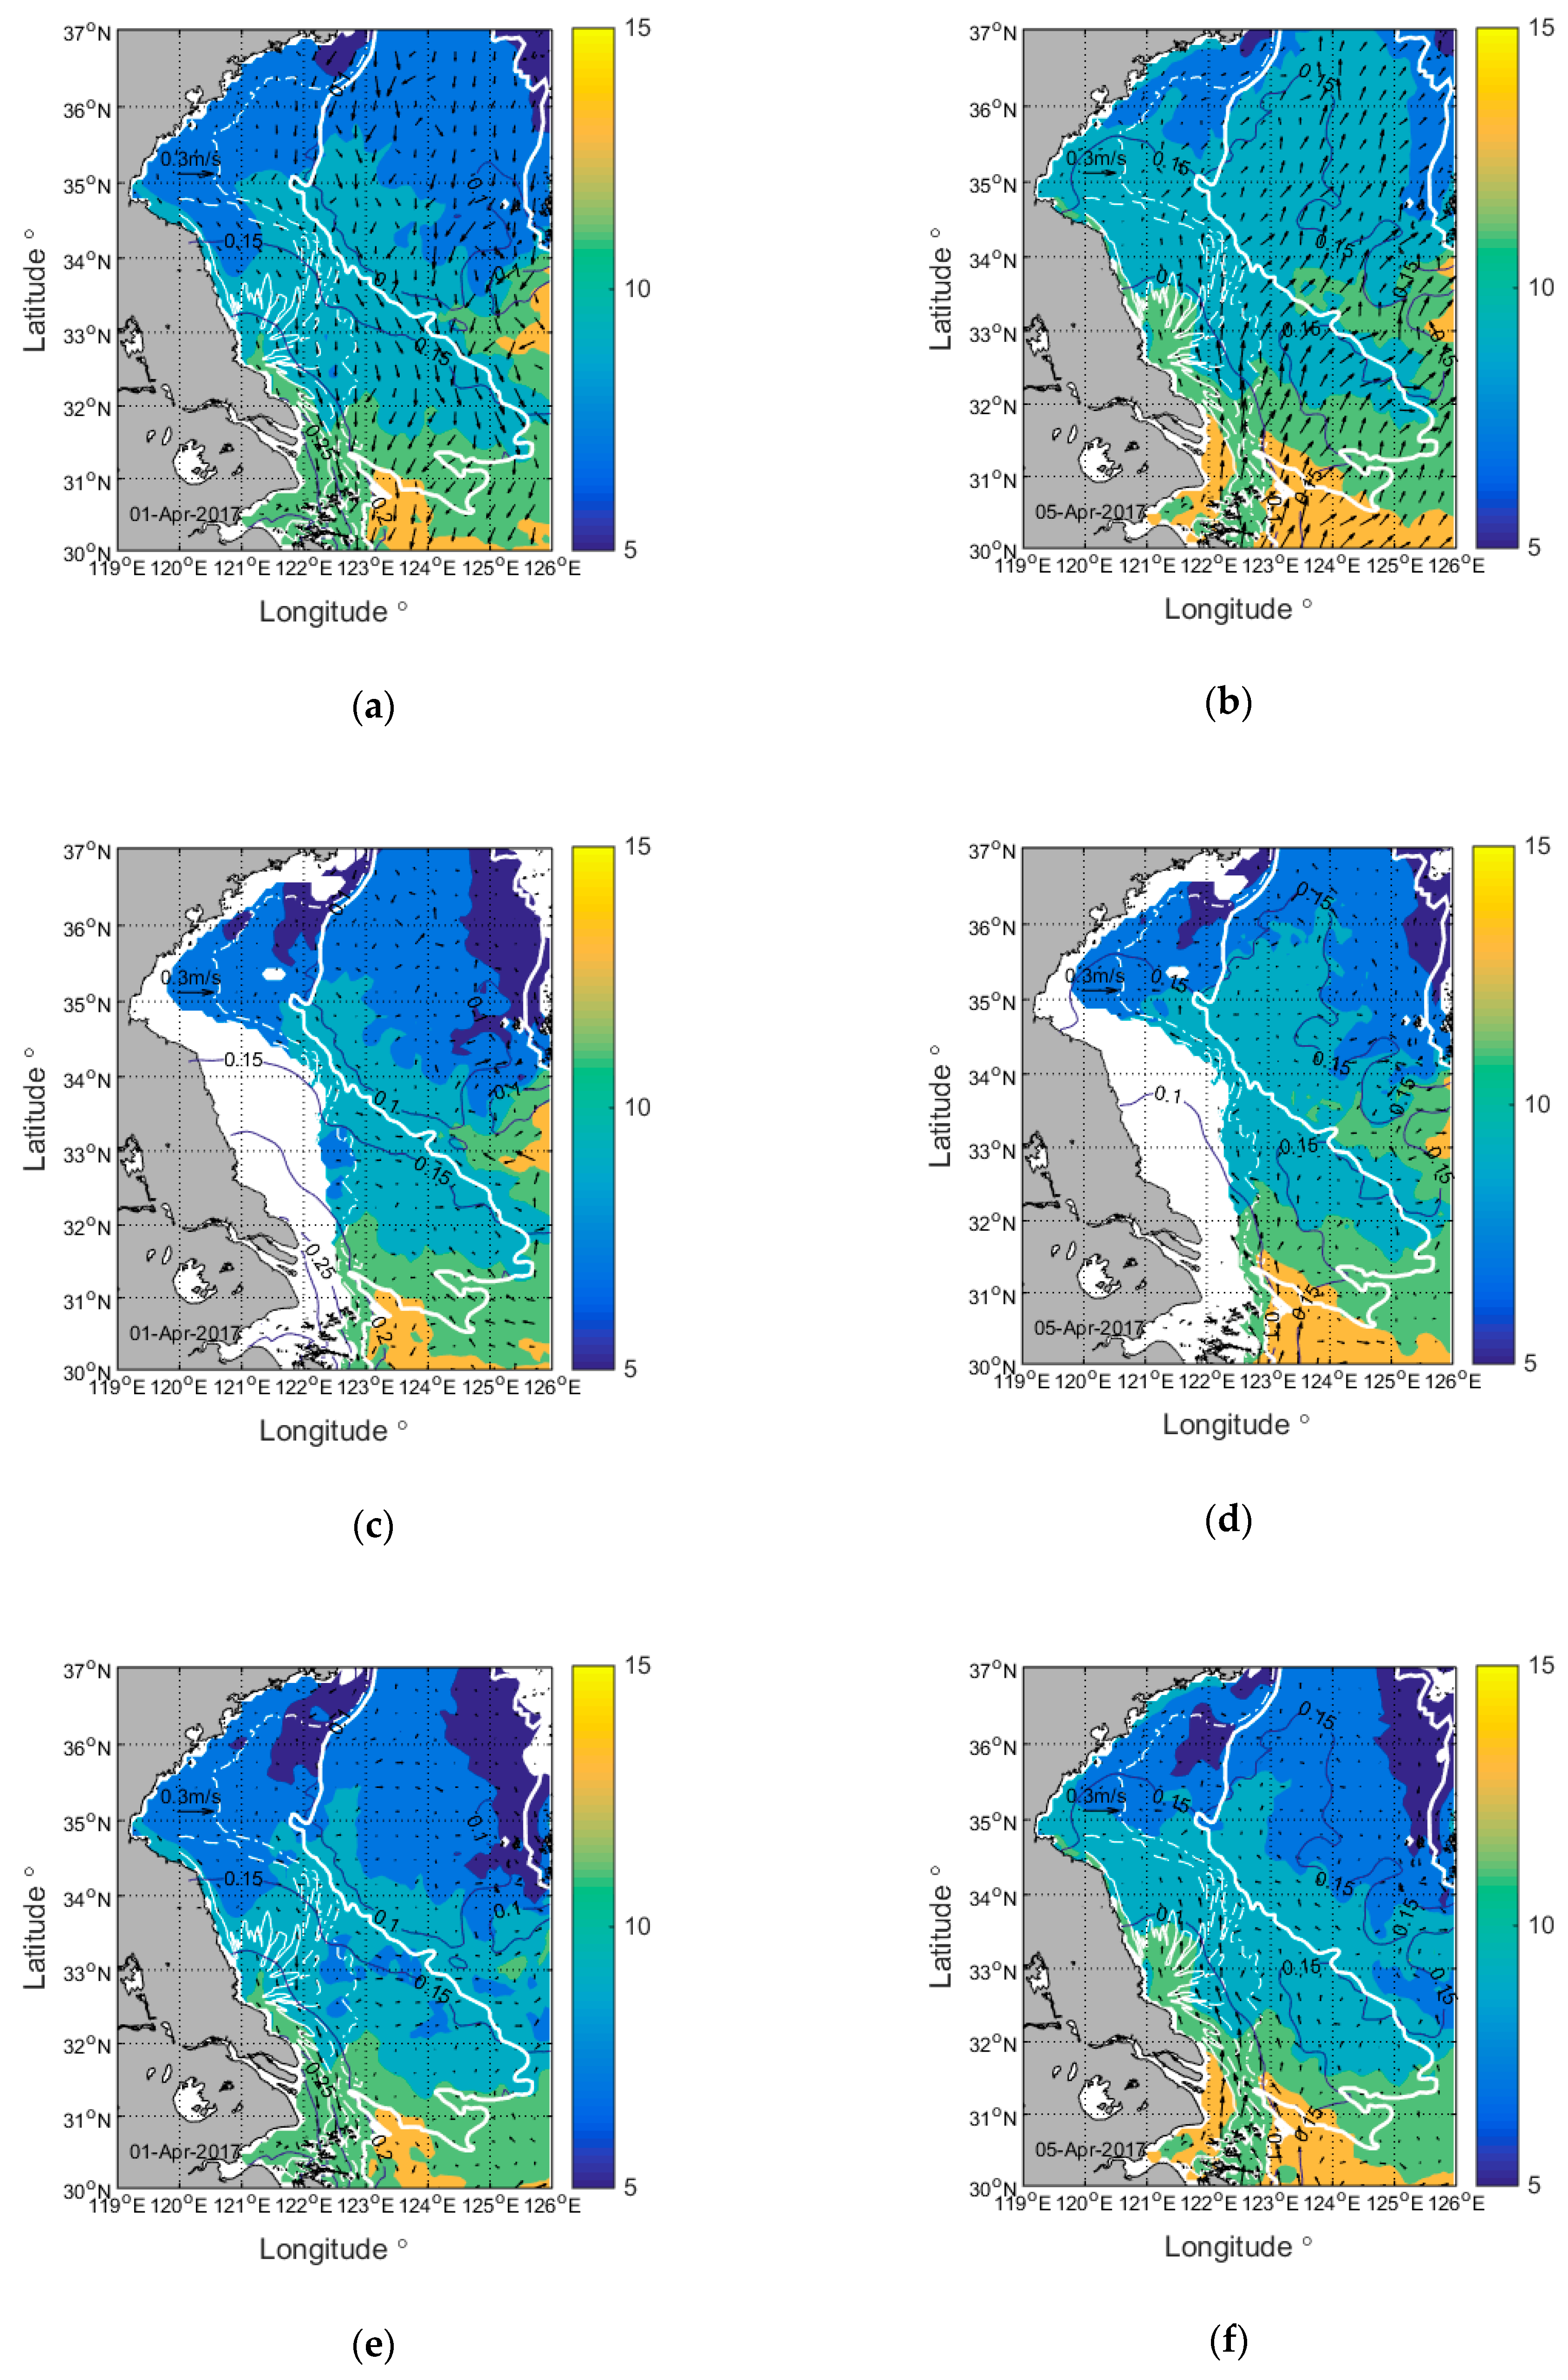
Figure 9.
Time series of meridional wind speed (m/s). (a) 2015 and 2016, (b) 2017 and 2018; colored dots denote the date and wind speed selected for net water transport analysis in Figure 10.
Figure 9.
Time series of meridional wind speed (m/s). (a) 2015 and 2016, (b) 2017 and 2018; colored dots denote the date and wind speed selected for net water transport analysis in Figure 10.

Figure 10.
Net meridional water transport (m3/s) across the sections at 31.5°N and its relation with the meridional wind speed (m/s), with red crosses for the whole section and blue diamonds for the western section. (a) T + 0 net meridional water transport. (b) Same as (a), but for the T + 1 day, dash lines indicate the regression trend. (c) Same as (a), but for the T + 2 day, solid lines indicate the regression trend between southerly wind and net meridional water transport. Correlation coefficients are labelled only for regressions above the 90% significant level.

Figure 11.
(a) The wind speed evolution as a function of year and year–day; (b) time series of spring wind speed (m/s) and count of south wind days. The wind speed (north wind v, m/s) was averaged over the 122.8–126.5°E, 28.6–32.4°N (location shown as the green dash box in Figure 1) from middle March to 10 April of 1982 to 2018, shown as the red box in (a). The black dash box marks the year day 100.

Table 1.
Date for MODIS-observed north migration of the Taiwan Warm Current in 2010s.
| Year | Day of Year |
|---|---|
| 2015 | 100 |
| 2016 | 95 |
| 2017 | 103 |
| 2018 | 105 |
| 2019 | 96 |
© 2019 by the authors. Licensee MDPI, Basel, Switzerland. This article is an open access article distributed under the terms and conditions of the Creative Commons Attribution (CC BY) license (http://creativecommons.org/licenses/by/4.0/).
Share and Cite
MDPI and ACS Style
Wu, X.; Xu, Q.; Li, G.; Liou, Y.-A.; Wang, B.; Mei, H.; Tong, K. Remotely-Observed Early Spring Warming in the Southwestern Yellow Sea Due to Weakened Winter Monsoon. Remote Sens. 2019, 11, 2478. https://doi.org/10.3390/rs11212478
AMA Style
Wu X, Xu Q, Li G, Liou Y-A, Wang B, Mei H, Tong K. Remotely-Observed Early Spring Warming in the Southwestern Yellow Sea Due to Weakened Winter Monsoon. Remote Sensing. 2019; 11(21):2478. https://doi.org/10.3390/rs11212478
Chicago/Turabian StyleWu, Xiangbai, Qing Xu, Gen Li, Yuei-An Liou, Bin Wang, Huan Mei, and Kai Tong. 2019. "Remotely-Observed Early Spring Warming in the Southwestern Yellow Sea Due to Weakened Winter Monsoon" Remote Sensing 11, no. 21: 2478. https://doi.org/10.3390/rs11212478
Note that from the first issue of 2016, this journal uses article numbers instead of page numbers. See further details here.