Article

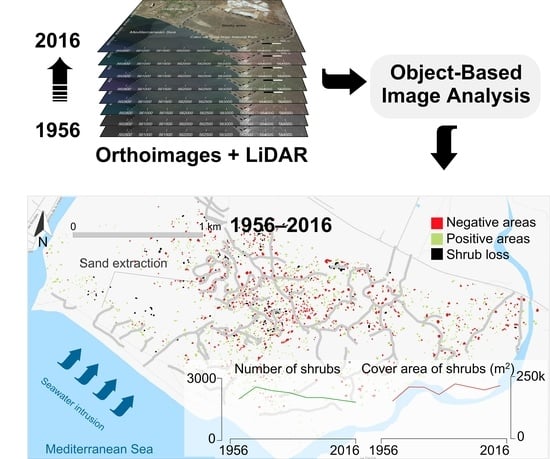
A Multi-Temporal Object-Based Image Analysis to Detect Long-Lived Shrub Cover Changes in Drylands

by
Emilio Guirado
1,2,*,
Javier Blanco-Sacristán
1,3,4,
Juan Pedro Rigol-Sánchez
5,
Domingo Alcaraz-Segura
1,3,6 and
Javier Cabello
1,5
1
Andalusian Center for Assessment and Monitoring of Global Change (CAESCG), University of Almería, 04120 Almería, Spain
2
Multidisciplinary Institute for Environment Studies “Ramon Margalef”, University of Alicante, San Vicente del Raspeig, 03690 Alicante, Spain
3
Department of Botany, Faculty of Science, University of Granada Campus Fuentenueva, 18071 Granada, Spain
4
Remote Sensing of Environmental Dynamics Lab, University of Milano – Bicocca, Piazza della Scienza 1, 20126 Milan, Italy
5
Department of Biology and Geology, University of Almería, 04120 Almería, Spain
6
Inter-university Institute for Earth System Research (IISTA), University of Granada, Av. Mediterráneo, s/n. 18006, Granada, Spain
*
Author to whom correspondence should be addressed.
Remote Sens. 2019, 11(22), 2649; https://doi.org/10.3390/rs11222649
Submission received: 10 October 2019 / Revised: 7 November 2019 / Accepted: 10 November 2019 / Published: 13 November 2019
(This article belongs to the Special Issue Remote Sensing Applications in Monitoring of Protected Areas)

Abstract

:
Climate change and human actions condition the spatial distribution and structure of vegetation, especially in drylands. In this context, object-based image analysis (OBIA) has been used to monitor changes in vegetation, but only a few studies have related them to anthropic pressure. In this study, we assessed changes in cover, number, and shape of Ziziphus lotus shrub individuals in a coastal groundwater-dependent ecosystem in SE Spain over a period of 60 years and related them to human actions in the area. In particular, we evaluated how sand mining, groundwater extraction, and the protection of the area affect shrubs. To do this, we developed an object-based methodology that allowed us to create accurate maps (overall accuracy up to 98%) of the vegetation patches and compare the cover changes in the individuals identified in them. These changes in shrub size and shape were related to soil loss, seawater intrusion, and legal protection of the area measured by average minimum distance (AMD) and average random distance (ARD) analysis. It was found that both sand mining and seawater intrusion had a negative effect on individuals; on the contrary, the protection of the area had a positive effect on the size of the individuals’ coverage. Our findings support the use of OBIA as a successful methodology for monitoring scattered vegetation patches in drylands, key to any monitoring program aimed at vegetation preservation.

Graphical Abstract

1. Introduction

A fundamental fact of ecological observation is that most living organisms do not show random distributions. In fact, environmental controls and anthropogenic impacts are determinants of the spatial patterns of these organisms. This implies that it is possible to know the performance of ecosystems through the study of the spatial distribution patterns of the organisms that live in them [1,2]. This is particularly important in drylands where, as a result of water scarcity and edaphic limitations, vegetation appears to form isolated patches of one or more plant individuals [3,4]. In these ecosystems, it has been observed that the spatial pattern of these patches determines key aspects of ecosystem functioning such as primary production [5], water and nutrient cycles [6], and biotic interactions [7,8]. Tools to produce accurate vegetation maps at the appropriate spatial scale over time could be very useful for gaining knowledge about the health and dynamics of dryland ecosystems.
Remote sensing has proven to be the most useful tool for monitoring changes in vegetation, as it is cost-effective, allows repeated mapping, and produces information on a large scale [9,10,11]. Within this technique, pixel-based methods are the most commonly used. However, these methods show several limitations for producing accurate maps of vegetation patches or plant individuals in drylands. First, pixel-based methods do not consider the spatial context in which the pixels are framed, making it difficult to identify isolated image elements. Second, they often result in a final overlap of such elements from automatic classifications, when the analysis is based on high spatial resolution images [12]. In drylands, the land surface is characterized by scattered vegetation in a matrix of bare soil and scattered shrubs, so contextual information is very useful for image classification [13]. Both characteristics limit the possibility of identifying and classifying patches of vegetation and individual plant elements.
Several methods have emerged as an alternative to pixel-based methods for mapping individuals or vegetation patches. For example, in the case of forests, light detection and ranging (LiDAR) and very high frequency (VHF) synthetic aperture radar (SAR) images allow the characterization of various attributes of individual trees from their three-dimensional structure (e.g., [14,15,16]). However, this method is difficult to use when vegetation shows reduced aerial volume such as in drylands. In these cases, object-based image analysis (OBIA) can be a good solution for mapping patches of vegetation and individual plants [17], particularly because there is currently a wide variety of freely available high spatial resolution orthoimages. OBIA can provide a more accurate and realistic identification of scattered vegetation in drylands because of the combined spectral information of each pixel with the spatial context [18,19]. This method has yielded good results in the monitoring of spatial patterns, functioning, and structure of vegetation in these environments [20,21].
OBIA may be particularly useful for assessing the dynamics of populations of long-lived plants of conservation concern. In this case, it is difficult and costly to assess the environmental controls of population dynamics due to their high persistence and sometimes low rate of regeneration, which requires very long-term studies [22,23]. It has been proposed that the maintenance of long-lived plant populations is the result of a balance between regeneration (replacement of individuals by recruiting new recruits) and persistence (maintenance of individuals in space, physically and temporarily), or a combination of both strategies [24,25], depending on abiotic stress and biotic competition [26]. Monitoring populations of persistent individuals over time is complicated, as there are continuous disturbances in the environment that can alter their performance [24]. However, the availability of the analysis of historical aerial orthophotographs and high spatial resolution satellite images with OBIA provides a good opportunity to reconstruct the interannual dynamics of long-lived plant populations over long periods of time, thus enabling the evaluation of changes experienced by these shrub populations.
Ziziphus lotus (L.) Lam, a long-lived shrub from Mediterranean drylands [27], shows characteristics for a multi-temporal analysis of the spatial distribution in its populations with OBIA. This shrub species depends on groundwater [28], forms fertility islands, and is considered an engineering species [29] of an ecosystem of interest for conservation at the European level (Directive 92/43/CEE). The main European population of the shrub species is located in a flat coastal area surrounded by greenhouses in the Cabo de Gata-Níjar Natural Park, Spain. This population has been affected by several threats for many decades, including sand mining [30,31], reducing the amount of sand available to develop the Z. lotus fertility islands; urban pressure [32], which has reduced the potential distribution of Z. lotus; and the expansion of intensive agriculture [33,34], responsible for the decline in the level of the aquifer’s water table, which may have caused the seawater intrusion [35,36]. Since 1944, several studies have evaluated this community of Z. lotus. Shrub patterns to identify groundwater dependence [28], the formations of shrubs in dunes [37], shrub spatial aggregation and consequences for reproductive success [29], and mutual positive effects between shrubs [38] have been researched. Yet, the monitoring of the shrub population dynamics has never been studied.
Despite most of the shrub population being located within the protected area, its temporal dynamics could be affected by several human-induced disturbances. However, due to the slow growth of shrubs and the inertia in the extinction of individuals, it is difficult to assess such dynamics without considering the population structure of the shrub species over the last several decades. This work proposes the use of remote sensing methods to map the spatial distributions of shrubs and to analyze their size and shape as a means of identifying anthropic disturbances. Our guiding hypothesis was that Z. lotus, phreatophytic shrubs, were affected by soil loss and seawater intrusion that decreased their cover area. On the contrary, after the legal protection of the area in 1987, the shrubs increased their cover area. Within this framework, the objectives of this work were as follows: (i) to make precision maps of scattered shrubs from historical remotely sensed images using OBIA and (ii) to extract information on changes in the shape, size, and spatial distribution of shrubs, and thus infer their relationships with human disturbances over a period of 60 years (1956–2016).

2. Materials and Methods

2.1. Study Case

We used a reliable and reproducible methodology to monitor structural changes in scattered vegetation of a dryland coastal zone using very high spatial resolution images and OBIA. The temporal dynamics of the Ziziphus lotus (L.) Lam population in a semi-arid coastal zone was evaluated to infer the effects of human disturbances on the shape and size of individuals over a period of 60 years. Two human disturbances were evaluated: (i) the extraction of coastal sands in the 1970s [30], which eliminated the aeolian sands found in the upper layer of the soil using heavy equipment and created roads and dirt tracks in the area, and (ii) the seawater intrusion in the mid-1980s caused by groundwater withdrawals for greenhouse irrigation. The withdrawals resulted in the water table of the main aquifer dropping by 30 m [35]. In addition, we evaluated the impacts of the protection of the area in 1987 in the shrub species.
The study area is located on a coastal aeolian plain in the Cabo de Gata-Níjar Natural Park, Spain (36°49′46.3″N, 2°17′37.1″W; Figure 1). This area is one of the driest in Europe, with a mean annual precipitation, temperature, and potential evapotranspiration (PET) of 200 mm, 19 ℃, and 1390 mm, respectively [39]. The area is a hydrogeological complex located between two wadis with numerous fractures [40,41] and shows the typical landscape of arid areas with bare soil and patches of shrubs dominated by Z. lotus shrubs [29,37]. This vegetation is supported by a shallow, unconfined coastal aquifer composed of gravel and sand deposits located in the discharge zone at the end of the two wadis. A major fault hydrologically separates this aquifer from the main regional one (Hornillo-Cabo de Gata, [32]). Consequently, inflows to the aquifer come mainly from scarce local rainfall.
The scattered shrubs of Ziziphus lotus in SE Spain form the largest population of this shrub species in Europe. This population is protected by the Habitat Directive (5220* habitat, 92/43/CEE) and the Water Framework Directive (WFD) in Europe [31]. In this area, Z. lotus forms intricate structures of 1–3 m tall, accumulating sand under its cover called nebkas. This forms favorable microclimatic conditions under its cover with respect to the outside and increases the water availability due to hydraulic lift [38], carbon exchanges, and energy cycles [29], creating islands of fertility [42], which increases the diversity of animal and plant species. For this reason, Z. lotus is considered an ecosystem engineering species in this environment [31,33].

2.2. Datasets and Ground Truth

Eight orthoimages from two sources were used, namely, six orthoimages from the Andalusian Environmental Information Network (REDIAM) with a spatial resolution of 1 m/pixel from 1956 and 1977 (panchromatic images) and 0.5 m/pixel from 1984, 1997, 2004, and 2008 (multispectral images), and two Google Earth orthoimages from 2013 and 2016, with a resolution of 0.5 m/pixel (multispectral images). To work with the same spatial and spectral resolution, we homogenized the images to the lowest spatial resolution (i.e., 1 m/pixel) and transformed them into panchromatic images (1 band) from the three spectral band images with QGIS software v. 3.8 (manufacturer, city, state abbreviation, country). For sand mining mapping, we used airborne LiDAR data with 1 m point spacing obtained in 2011. A summary of the dataset is shown in Table 1.
Two hundred perimeters of Z. lotus and 200 points of bare soil with scarce vegetation were randomly taken as the ground truth. A submeter precision GPS (Leica GS20 Professional Data Mapper; Leica, Wetzlar, Germany) was used. To do this, 12 longitudinal transects along the coast with a separation of 150 m between them were followed. The perimeter was taken with a distance of 1 m between nodes and the bare soil points were taken with a separation of at least 2 m from the nearest shrub. In addition, 200 shrub perimeters were digitized in each historical image with a distance of 1 m between nodes coinciding with the pixel size of the orthoimages in QGIS software v. 3.8.

2.3. Object-Based Image Analysis

OBIA consists of two phases, namely, the segmentation of the image into almost homogeneous objects and its subsequent classification based on similarities of shape, spectral information, and contextual information [17]. In the segmentation phase, it is necessary to establish an appropriate scale level depending on the size of the object studied in the image [43]; for example, low values for small vegetation and high values for large constructions [44,45]. During the classification, the segmented objects are classified to obtain cartographies of the classes of interest using algorithms such as nearest neighbor [46]. The success of the classification depends on the accuracy of the previous segmentation [47].

2.3.1. Image Segmentation

To segment the images, we used the multiresolution segmentation algorithm implemented in eCognition v. 8.9 software (Definiens, Munich, Germany). This algorithm depends on three parameters: (i) Scale, which controls the amount of spatial variation within objects and therefore their output size; (ii) Shape, which considers the form and color of objects; if it is set to high values, the form will be considered and if it is close to 0, the color will be considered instead; (iii) Compactness, a weighting to represent the smoothness of objects formed during the segmentation; if it is set to high values, the compactness will be considered complex and if it is set to values close to 0, the smoothness will be considered as simple [48]. To obtain the optimal value for each segmentation parameter, we used a ruleset in eCognition v8.9 that segmented the image by systematically increasing the Scale parameter in steps of 5 and the Shape and Compactness parameters in steps of 0.1 [49]. The Scale ranged from 5 to 50, and the Shape and the Compactness ranged from 0.1 to 0.9. A total of 6480 shapefiles were generated with possible segmentations of Z. lotus shrubs in a computer with a Core i7-4790K, 4 GHz and 32G of RAM memory (Intel, Santa Clara, CA, USA).
To evaluate the accuracy of all segmentations, we developed an R script to calculate the Euclidean Distance v.2 (ED2; [50]; Equation (1)), measuring the arithmetic and geometric discrepancies between the 200 reference polygons of Z. lotus and the corresponding segmented objects:
ED 2 = ( PSE ) 2 + ( NSR ) 2 .
ED2 optimizes geometric and the arithmetic discrepancies with the “Potential Segmentation Error” (PSE; Equation (2)) and the “Number-of-Segments Ratio” (NSR; Equation (3)), respectively. According to [50], values of ED2 close to 0 indicate good arithmetic and geometric coincidence, whereas high values indicate a mismatch between them:
PSE = | s i r k | | r k | ,
where rk is the area of the reference polygon and si is the overestimated area of the segment obtained during the segmentation;
NSR = a b s ( m v ) m ,
where NSR is the arithmetic discrepancy between the polygons of the resulting segmentation and the reference polygons and abs is the absolute value of the difference of the number of reference polygons, m, and the number of segments obtained, v.

2.3.2. Classification and Validation of Segments

We used the k-nearest neighbors algorithm to classify the best segmentations (lowest ED2 values) in two classes, that is, (i) Ziziphus lotus shrub (Z) and (ii) Bare soil with sparse vegetation patches (S). In order to train the classification algorithm, 70% of the ground-truth samples (140 Z and 140 S) and the features of greatest separability (J) between them, obtained using the separability and threshold (SEaTH) algorithm, were used [51,52]. The remaining 30% of the ground-truth samples (60 Z and 60 S) were used as the validation set [53,54], and the accuracy of the classifications was evaluated using error and confusion matrices, extracting Cohen’s kappa index of accuracy (KIA) [55] and the overall accuracy (OA) of them. Finally, errors in shrub segmentation were evaluated by estimation of the root-mean-square Error (RMSE) and the mean bias error (MBE) between reference polygons and segments classified as Z. lotus shrubs.

2.4. Sand Extraction Curvature Analysis

The evaluation of areas affected by sand extraction within the study area in the 1970s was performed using a geomorphometric analysis of the land surface [56]. The analyses were based on a LiDAR-derived digital elevation model (DEM) dataset, generated using an ArcGIS toolbox for multiscale DEM geomorphometric analysis. This toolbox allows the generation of a number of curvature-related land surface variables [57], including plane, profile, mean, minimum profile, maximum profile, tangential, non-sphericity, and total Gaussian curvature; positive and negative openness; and signed average relief. Several maps were derived for each curvature variable at different spatial scales. The sizes of the analysis window ranged from 3 × 3 m to 101 × 101 m with a 14 m interval. Univariate and bivariate statistics were calculated for variables related to curvature [56,58].
A window size of 61 m was selected for the geomorphometric analysis of the curvature of the surface, which provided a good compromise between the size of land surface depressions resulting from sand mining operations and spatial generalization. The sand extraction areas were located and digitized on a final map and validated with a field survey. In addition, an estimation of the volume of soil loss resulting from sand extractions was performed. To calculate the volume of soil loss, a new digital surface model was generated without the soil loss zones extracted with the previous curvature analysis. Then, the difference was applied to the initial surface model with the areas identified as soil loss and to the digital surface model without soil loss, obtaining the volume of the previously identified soil loss areas.

2.5. Shrub Area and Shape Dynamics

Variations in the size and number of shrubs were determined by calculating the number of shrubs lost and differences in shrub cover area between consecutive image pairs. To calculate losses and gains in the coverage of the individuals, we assumed that a resulting negative area meant a loss of surface coverage, whereas a positive area meant a gain of coverage. To determine the edge effect and the health indicator on shrubs [59], the round shape index was calculated as the ratio between the cover area and the perimeter of each shrub in different years [60]. In order to evaluate whether the shrub cover reduction that occurred between 1956 and 1977 was related to sand extraction, the average minimum distance (AMD) and average random distance (ARD) between shrubs and sand extraction areas were calculated using PASSaGE v.2 software (The Biodesign Institute, Arizona State University, Tempe, AZ, USA) [61] with 999 permutations. We assumed that the shrubs in the 1956 image rather than the 1977 image were removed during sand mining, and those that reduced their cover were affected during this process. To evaluate whether the shrub population was affected by seawater intrusion between 1977 and 1984, the AMD and the ARD between the shrubs and the coastline were calculated as previously. Shrubs affected by sand extractions (those appearing in the 1956 image but not in the 1977 one) were not included in this analysis. When calculating the AMD, the shrubs that showed a reduction in cover over the corresponding period were used, whereas for the calculation of the ARD simulated shrubs were used. In order to evaluate the effects of protecting the shrubs within the Natural Park in 1987, reduction in shrub cover and number of shrubs in the 1984–2016 period was determined.

3. Results

3.1. Segmentation Accuracy

The average values of the Scale and the ED2 were 25 and 0.45, respectively (Table 2). The most precise segmentations were from 1977 and 2016, with a Scale of 20 and an ED2 of 0.35 in both. The least accurate segmentations were the ones of 1956 and 2004, with ED2 values of 0.59 and 0.51, respectively. The lowest RMSE was obtained in the image of 2016, with a value of 46.38 m2 and an MBE of −6.36 m2, overestimating the cover area of the shrubs. The highest RMSE was up to 120.64 m2, and in 5 of the 8 years (1956, 1977, 1997, 2004, and 2008) the area of the shrubs was underestimated as indicated by the MBE. With a computation time of 20 s per segmentation, we spent 36 h for a total of 6480 segmentations.

3.2. Classification and Characteristics of Ziziphus lotus Shrubs

The analysis of class separability and threshold with the SEaTH algorithm showed that the best features for discriminating between classes (i.e., those with the highest separability) were mainly related to texture (i.e., the family of features related to the Gray-Level Co-Occurrence Matrix (GLCM)) and brightness of objects (Table 3).
All the classifications were highly accurate, with values of OA and KIA close to 1 (Table 4). The most accurately segmented image (OA = 0.98; KIA = 0.97) was the image of 2004, whereas the worst one was the image of 1956 (OA = 0.89; KIA = 0.79).

3.3. Shrub Number, Area, and Shape Dynamics

During the 60-year period evaluated, the number of shrubs decreased by 742. The moment of highest shrub population was 1977, with 2625 shrubs. Conversely, the lowest number of shrubs was detected in 2016, with 1883 shrubs (Table 5). However, the total shrub area between 1956 and 2016 increased by 3692 m2. In addition, we observed an increase in the maximum cover area value of shrubs after 1997. Finally, the most circular shrubs appeared in 1956 (i.e., the lowest values of the round shape index) and the high values of the round shape index increased over the years (Table 5).
In general, the cover area of shrubs between pairs of years showed an increase, with a trend of smaller individuals to lose more cover area than larger shrubs. In the period 1984–1997, 1423 shrubs reduced their cover area. In the period 1977–1984 (Table 6), 1650 shrubs increased their cover area.

3.4. Sand Extraction Mapping and Curvature Analysis

The results of the analyses indicated that more than 187 m3 of sand were extracted in the study area (4.2 km2). According to [30], a visual analysis of resulting maps also suggested that sand extractions were distributed spatially following a connected network and following existing roads in the area (Figure 2).

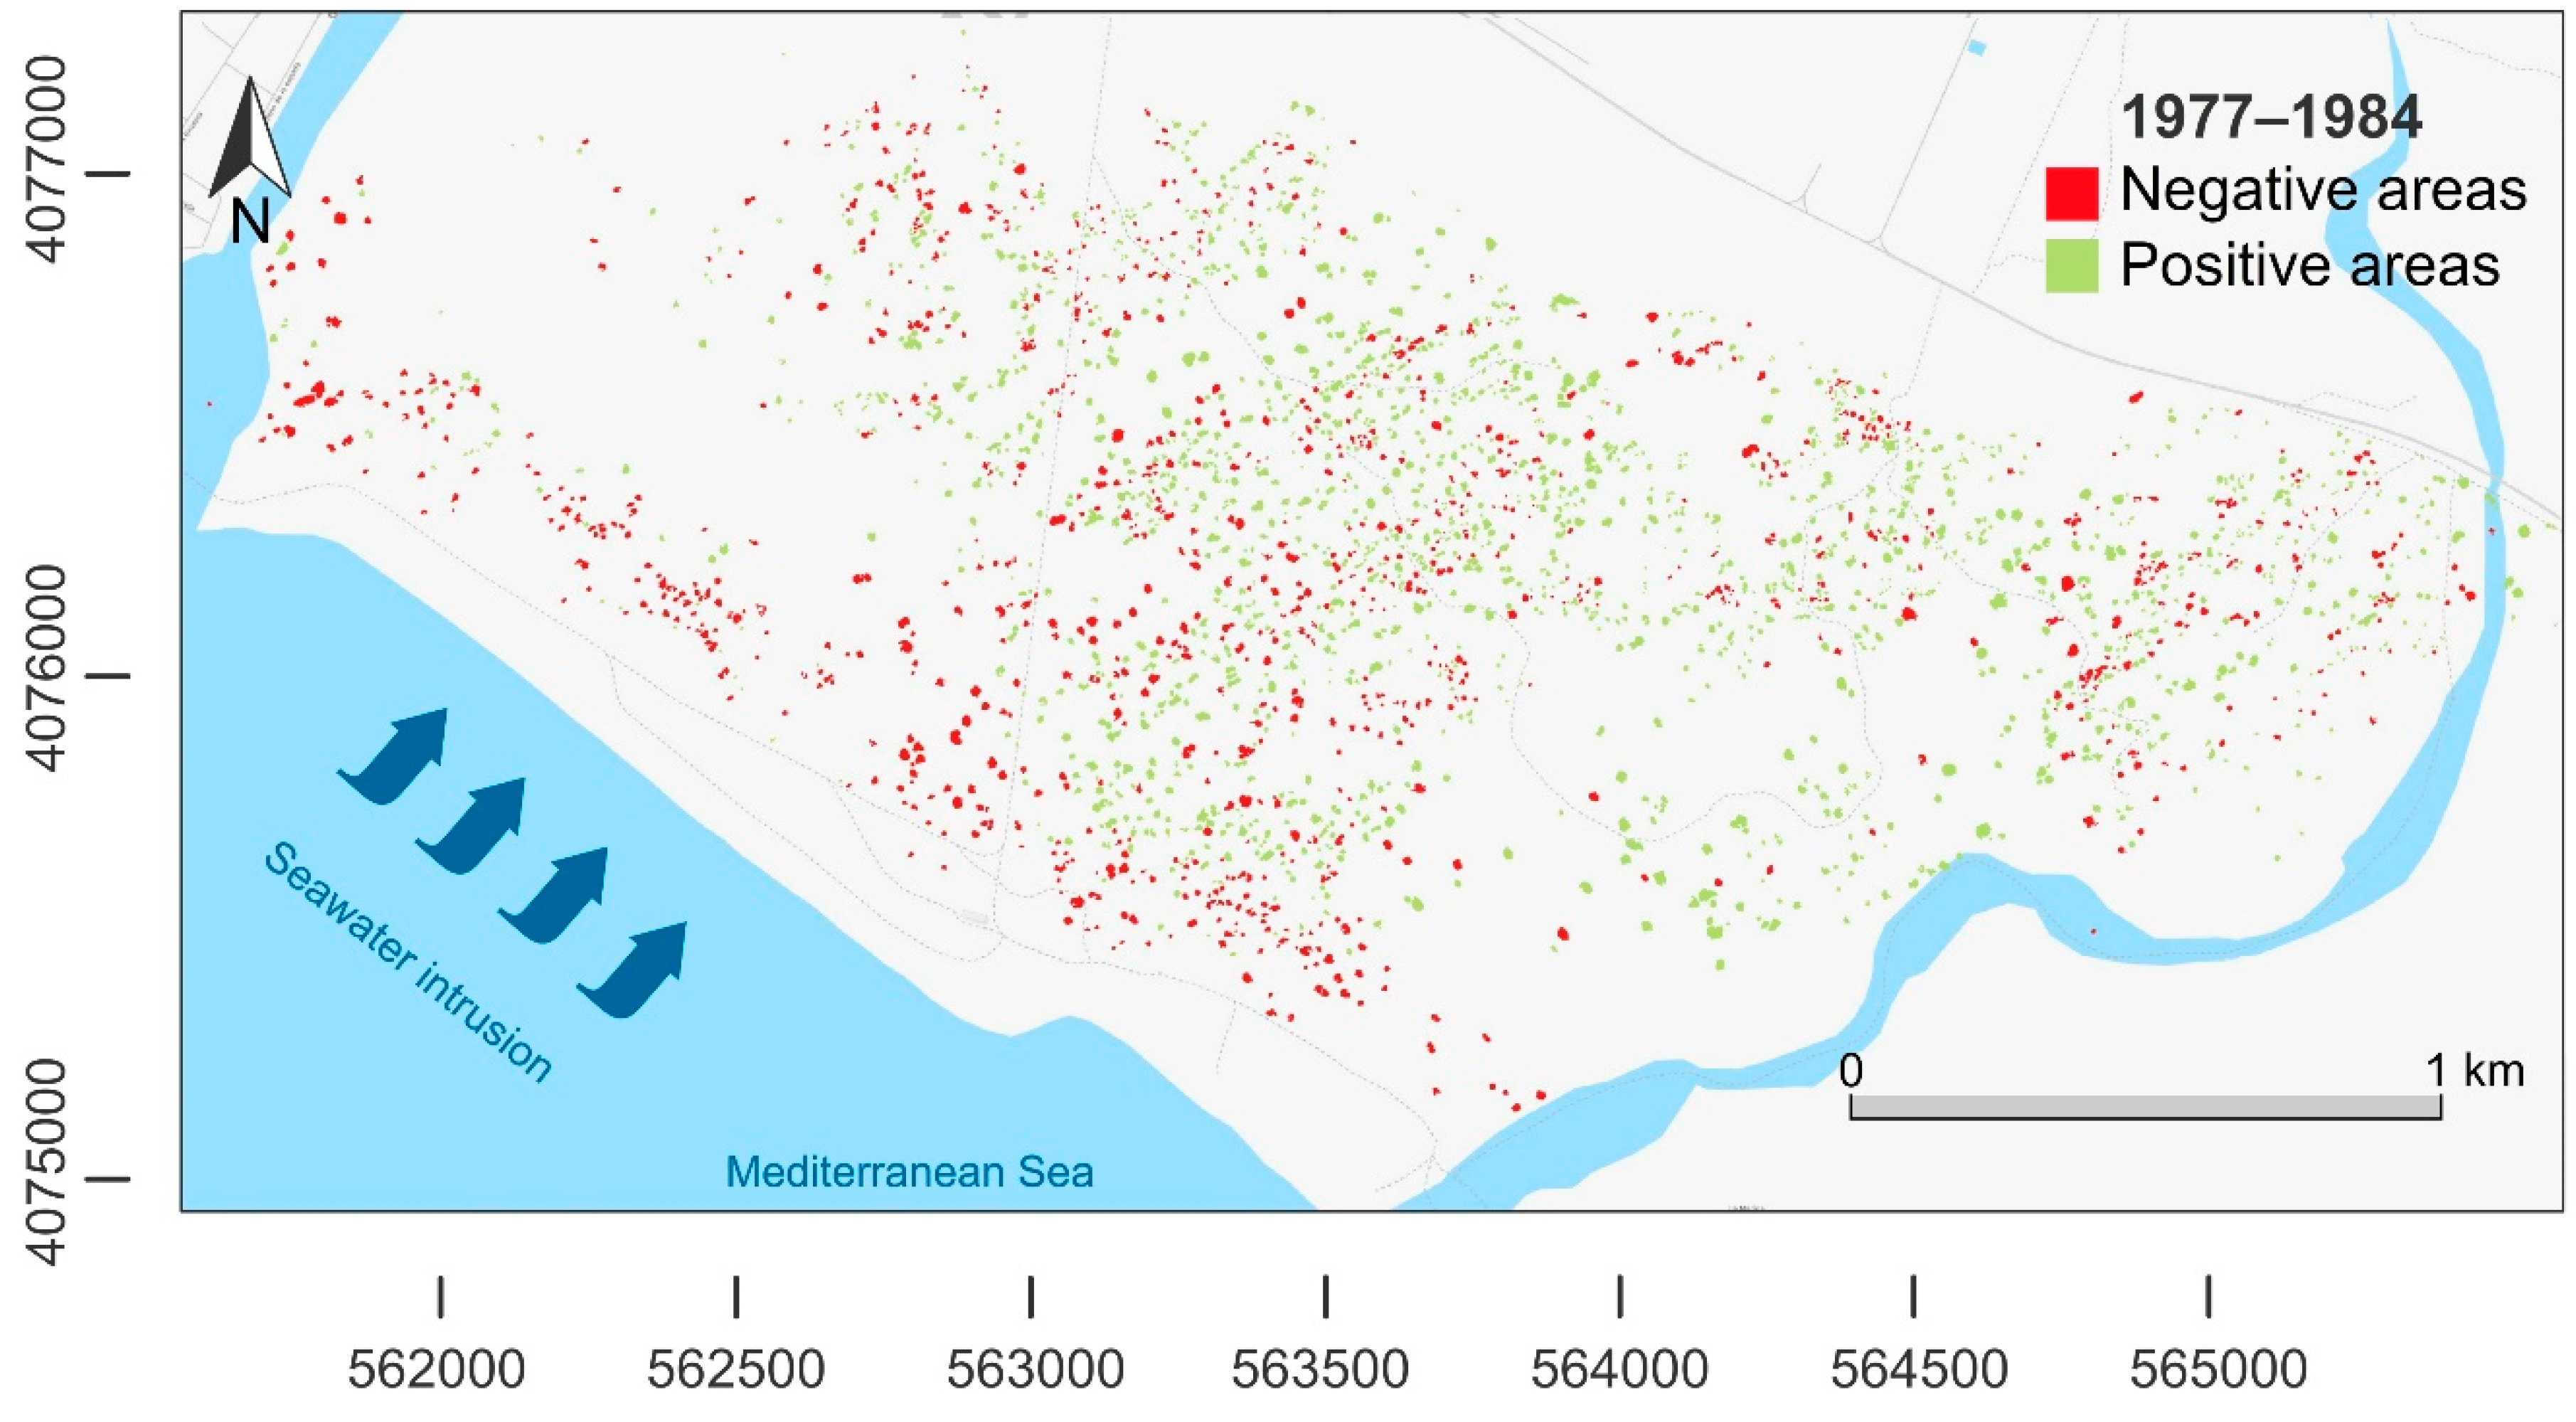
3.5. Spatial Relationships of Shrubs with Sand Extractions, Coastline (Seawater Intrusion), and Protected Area

Between 1956–1977, 752 shrubs reduced their cover area in the sand mining event. The AMD between the shrubs and the zones of sand extractions presented an average minimum distance of 25.57 ± 37.49 m. The ARD analysis showed an average minimum distance of 127.48 m ± 23.68 m between the random simulated shrubs and the zones of the sand extractions (Figure 2).
Seawater intrusion (1977–1984) reduced the cover area by 903 shrubs. The AMD analysis showed an average minimum distance of 681.32 m ± 50.15 m to the coastline. The ARD analysis showed an average minimum distance of 882.67 m ± 57.66 m between the random simulated shrubs and the coastline (Figure 3).
In the period 1984–2016, 551 individuals were lost (Figure 4), but in the area there was a total gain of more than 23 m2 (Table 5), coinciding with the protection of the study zone under the Cabo de Gata-Níjar Natural Park.

4. Discussion

The first step in inferring human disturbances in vegetation was to generate an accurate object-based map of the study area. The high accuracies obtained in the segmentations, evaluated with the ED2 index, facilitated the classifications of the shrubs, obtaining similar accuracies to previous studies in which other species of shrubs with OBIA were detected [21,62]. In the classification step, the segments of Z. lotus and bare soil with sparse vegetation showed high separability, using features related to their brightness and texture as a consequence of clear spectral differences between vegetation and bare soil [63]. According to [64] and [52], the best spectral-related features for discriminating between vegetation and bare soil with sparse vegetation were Brightness, and the GLCM family of features, which present high separability values in well-differentiated classes, such as vegetation and soil [52,65,66]. The worst features to discriminate (i.e., lowest separability) were the geometry-related ones (e.g., Roundness, Area). This is contrary to previous studies, in which Roundness has been suggested as a potential feature to discriminate between rounded shrubs and bare soil [21,66,67]. This discrepancy with previous studies could be explained by the high heterogeneity in the vegetation form that can present after disturbance [5]. However, care must be taken interpreting these results, since shadows generated by large individuals may result in an overestimation of shrub cover area [68,69], and individuals growing together may be underestimated as a result of appearing in the images as one [62].
The spatial distribution of sand extraction areas was unrelated to the topography of the area but was related to the location of older roads and tracks. This suggests that sand extractions were preferentially located to previous sand extractions in an effort to minimize labor costs. This observation is consistent with a previous study on sand extraction in the region (e.g., [30]). According to [70], the negative effect on shrubs by sand mining was shown in the low values of AMD calculated in the period 1956–1977. This reduction in population cover area could be related to sand mining during the 1960s and 1970s [30], which might confirm the positive effect that sands have on the health of Z. lotus shrubs in the study area [31] and in other areas of North Africa [71,72].
The lower value of the AMD between shrubs with reduced cover in the period 1977–1984 to the coastline suggested by the ARD that this reduction could be related to a decrease in the freshwater table and the intrusion of seawater into the aquifer [35,73]. The smallest shrubs were the most affected, which can be related to difficulties of access to groundwater due to their smaller roots compared to larger and more developed individuals [28,74]. These results agree with previous studies evaluating the negative effect that seawater intrusion has on vegetated communities and groundwater-dependent ecosystems (e.g., [75,76]).
In addition, the results of this work could be affected by other natural conditions or affections, for example, shrubs could be affected by herbivory [5,77], climate change [78], or uncontrolled use of pesticides [79]. We argue that in order to better understand the results obtained in this work, it is necessary to complement remote sensing techniques with in situ works. For example, complementing the results obtained with the presence–absence of isotopes and relating them with the seawater intrusion [80,81] could provide a better understanding of how this phreatophytic community responds to anthropic perturbations over time.
Although 742 Z. lotus individuals were lost during the study period, their average size and the round shape of the shrubs were higher and bigger at the end than at the beginning of the period. However, the variability of these characteristics also increased over time, which means that a greater variety of shapes and sizes was observed in the population. This could be explained by the 1987 declaration regarding the Cabo de Gata-Níjar Natural Park, where the study area is located. This protection, in addition to a slow recovery of the aquifer after undergoing seawater intrusion between 1977 and 1984, could have contributed to a slow but continued development in time by adults, which might have better access to fresh water from the aquifer due to a more developed root system [82] up to a length of 60 m [83]. Furthermore, the fact that the largest shrubs were the most developed in time supports the longevity character of this species through longevity [27], which is an important strategy for its survival in the Mediterranean region [26]. This, together with the anthropic pressure on the system, may explain the development of adult individuals, but the lack of recruitment of juveniles, as observed by [27] not only in this area but also in other regions in SE Spain.

5. Conclusions

The combination of very high-resolution historical images and OBIA is a powerful tool for identifying and monitoring communities of sparse vegetation in drylands [62]. Our results suggest that monitoring changes in the number and the cover of a shrub community in a semi-arid ecosystem could help to infer anthropogenic disturbances that affect its health. The vegetation conditions showed that the loss of sandy substrate affected Z. lotus negatively, either by reducing its cover or by eliminating individuals by direct sand extraction processes. In addition, seawater intrusion into the aquifer influenced the cover and structure of the shrubs close to the coastline in a period of massive groundwater extraction [35], negatively affecting the smallest shrubs for the most part. However, the legal protection of the area had a positive effect on the health of the remaining individuals, which increased their coverage. The implementation of semi-automatic methods to infer the effects of human activities on shrub populations, such as the one evaluated in this study, could help improve the monitoring programs of existing protected areas. This could reduce the cost of these activities, not only in economic terms but also from a human perspective, which is key to the long-term preservation of any protected area.

Author Contributions

E.G. and J.B.-S. designed the experiments, collected the data, implemented the codes, ran the models, analyzed the results, and wrote the first draft. E.G., J.B.-S., D.A.-S., J.P.R.-S., and J.C. provided guidance, and wrote the final manuscript.

Funding

E.G. and D.A-S. received support from the European LIFE Project ADAPTAMED LIFE14 CCA/ES/000612, and from ERDF and the Andalusian Government under the project GLOCHARID (Global Change in Arid Zones - 852/2009/M/00). E.G. is supported by the European Research Council grant agreement nº 647038 (BIODESERT). J.B.-S. received funding from the European Union’s Horizon 2020 research and innovation 514 programme under the Marie Sklodowska-Curie grant agreement No. 721995. D.A.-S. received support from the NASA Work Programme on Group on Earth Observations - Biodiversity Observation Network (GEOBON) under grant 80NSSC18K0446, from project ECOPOTENTIAL, funded by the European Union’s Horizon 2020 Research and Innovation Programme under grant agreement No. 641762, and from the Spanish Ministry of Science under project CGL2014-61610-EXP and grant JC2015-00316.

Acknowledgments

We would like to express our appreciation to the four reviewers for their comments and suggestions which served to substantially improve this research paper.

Conflicts of Interest

The authors declare no conflict of interest.

References

  1. Tilman, D.; Kareiva, P. Spatial Ecology: The Role of Space in Population Dynamics and Interspecific Interactions (MPB-30); Princeton University Press: Princeton, NJ, USA, 2018. [Google Scholar]
  2. Maestre, F.T.; Escudero, A.; Martinez, I.; Guerrero, C.; Rubio, A. Does spatial pattern matter to ecosystem functioning? Insights from biological soil crusts. Funct. Ecol. 2005, 19, 566–573. [Google Scholar] [CrossRef]
  3. Ludwig, J.A.; Wilcox, B.P.; Breshears, D.D.; Tongway, D.J.; Imeson, A.C. Vegetation Patches and Runoff–Erosion as Interacting Ecohydrological Processes in Semiarid Landscapes. Ecology 2005, 86, 288–297. [Google Scholar] [CrossRef]
  4. Thompson, S.E.; Harman, C.J.; Troch, P.A.; Brooks, P.D.; Sivapalan, M. Spatial scale dependence of ecohydrologically mediated water balance partitioning: A synthesis framework for catchment ecohydrology. Water Resour. Res. 2011, 47. [Google Scholar] [CrossRef]
  5. Aguiar, M.R.; Sala, O.E. Patch structure, dynamics and implications for the functioning of arid ecosystems. Trends Ecol. Evol. 1999, 14, 273–277. [Google Scholar] [CrossRef]
  6. Puigdefábregas, J. The role of vegetation patterns in structuring runoff and sediment fluxes in drylands. Earth Surf. Process. Landf. 2005, 30, 133–147. [Google Scholar] [CrossRef]
  7. Reynolds, J.F.; Virginia, R.A.; Kemp, P.R.; De Soyza, A.G.; Tremmel, D.C. Impact of drought on desert shrubs: Effects of seasonality and degree of resource island development. Ecol. Monogr. 1999, 69, 69–106. [Google Scholar] [CrossRef]
  8. Berdugo, M.; Maestre, F.T.; Kéfi, S.; Gross, N.; Le Bagousse-Pinguet, Y.; Soliveres, S. Aridity preferences alter the relative importance of abiotic and biotic drivers on plant species abundance in global drylands. J. Ecol. 2019, 107, 190–202. [Google Scholar] [CrossRef]
  9. Zhang, X.; Friedl, M.A.; Schaaf, C.B.; Strahler, A.H.; Hodges, J.C.; Gao, F.; Reed, B.C.; Huete, A. Monitoring vegetation phenology using MODIS. Remote Sens. Environ. 2003, 84, 471–475. [Google Scholar] [CrossRef]
  10. Tsai, Y.; Stow, D.; Chen, H.; Lewison, R.; An, L.; Shi, L. Mapping vegetation and land use types in fanjingshan national nature reserve using Google Earth Engine. Remote Sens. 2018, 10, 927. [Google Scholar] [CrossRef]
  11. Minasny, B.; Setiawan, B.I.; Saptomo, S.K.; McBratney, A.B. Open digital mapping as a cost-effective method for mapping peat thickness and assessing the carbon stock of tropical peatlands. Geoderma 2018, 313, 25–40. [Google Scholar]
  12. Schiewe, J.; Tufte, L.; Ehlers, M. Potential and problems of multi-scale segmentation methods in remote sensing. GeoBIT/GIS 2001, 6, 34–39. [Google Scholar]
  13. Zheng, X.; Wu, B.; Weston, M.; Zhang, J.; Gan, M.; Zhu, J.; Deng, J.; Wang, K.; Teng, L. Rural settlement subdivision by using landscape metrics as spatial contextual information. Remote Sens. 2017, 9, 486. [Google Scholar] [CrossRef]
  14. Hallberg, B.; Smith-Jonforsen, G.; Ulander, L.M. Measurements on individual trees using multiple VHF SAR images. IEEE Trans. Geosci. Remote Sens. 2005, 43, 2261–2269. [Google Scholar] [CrossRef]
  15. Maksymiuk, O.; Schmitt, M.; Auer, S.; Stilla, U. Single tree detection in millimeterwave SAR data by morphological attribute filters. Proc. Jahrestag. DGPF 2014, 34. [Google Scholar]
  16. Hamraz, H.; Contreras, M.A.; Zhang, J. Vertical stratification of forest canopy for segmentation of understory trees within small-footprint airborne LiDAR point clouds. ISPRS J. Photogramm. Remote Sens. 2017, 130, 385–392. [Google Scholar] [CrossRef]
  17. Blaschke, T. Object based image analysis for remote sensing. ISPRS J. Photogramm. Remote Sens. 2010, 65, 2–16. [Google Scholar] [CrossRef]
  18. Deblauwe, V.; Barbier, N.; Couteron, P.; Lejeune, O.; Bogaert, J. The global biogeography of semi-arid periodic vegetation patterns. Glob. Ecol. Biogeogr. 2008, 17, 715–723. [Google Scholar] [CrossRef]
  19. Kéfi, S.; Rietkerk, M.; Alados, C.L.; Pueyo, Y.; Papanastasis, V.P.; ElAich, A.; de Ruiter, P.C. Spatial vegetation patterns and imminent desertification in Mediterranean arid ecosystems. Nature 2007, 449, 213–217. [Google Scholar] [CrossRef]
  20. Burnett, C.; Blaschke, T. A multi-scale segmentation/object relationship modelling methodology for landscape analysis. Ecol. Model. 2003, 168, 233–249. [Google Scholar] [CrossRef]
  21. Hellesen, T.; Matikainen, L. An Object-Based Approach for Mapping Shrub and Tree Cover on Grassland Habitats by Use of LiDAR and CIR Orthoimages. Remote Sens. 2013, 5, 558–583. [Google Scholar] [CrossRef]
  22. Kallio, T. Protection of spruce stumps against Fomes annosus (Fr.) Cooke by some wood-inhabiting fungi. Acta For. Fenn. 1971, 117, 1–20. [Google Scholar] [CrossRef]
  23. Eriksson, O. Regional dynamics of plants: A review of evidence for remnant, source-sink and metapopulations. Oikos 1996, 77, 248–258. [Google Scholar] [CrossRef]
  24. Bellingham, P.J.; Sparrow, A.D. Resprouting as a life history strategy in woody plant communities. Oikos 2000, 89, 409–416. [Google Scholar] [CrossRef]
  25. Bond, W.J.; Midgley, J.J. Ecology of sprouting in woody plants: The persistence niche. Trends Ecol. Evol. 2001, 16, 45–51. [Google Scholar] [CrossRef]
  26. García, D.; Zamora, R. Persistence, multiple demographic strategies and conservation in long-lived Mediterranean plants. J. Veg. Sci. 2003, 14, 921–926. [Google Scholar] [CrossRef]
  27. Rey, P.J.; Cancio, I.; Manzaneda, A.J.; González-Robles, A.; Valera, F.; Salido, T.; Alcántara, J.M. Regeneration of a keystone semiarid shrub over its range in Spain: Habitat degradation overrides the positive effects of plant–animal mutualisms. Plant Biol. 2018, 20, 1083–1092. [Google Scholar] [CrossRef] [PubMed]
  28. Guirado, E.; Alcaraz-Segura, D.; Rigol-Sánchez, J.P.; Gisbert, J.; Martínez-Moreno, F.J.; Galindo-Zaldívar, J.; González-Castillo, L.; Cabello, J. Remote-sensing-derived fractures and shrub patterns to identify groundwater dependence. Ecohydrology 2018, 11, 1933. [Google Scholar] [CrossRef]
  29. Tirado, R.; Pugnaire, F.I. Shrub spatial aggregation and consequences for reproductive success. Oecologia 2003, 136, 296–301. [Google Scholar] [CrossRef]
  30. Martínez-Lage, A.V. Las extracciones de áridos en el litoral de almería para su utilización en la agricultura intensiva (1956-1997). In Proceedings of the Actas de Las Jornadas Sobre el Litoral de Almería: Caracterización, Ordenación y Gestión de un Espacio Geográfico Celebradas, Andalusia, Spain, 20–24 May 1997; Instituto de Estudios Almerienses: Andalusia, Spain, 1999; pp. 83–110. [Google Scholar]
  31. Tirado, R. 5220 Matorrales arborescentes con Ziziphus. VV AA Bases Ecológicas Prelim; Para Conserv. Los Tipos Hábitat Interés Comunitario En España; Dir. Gral. de Medio Natural; Ministerio de Medio Ambiente, y Medio Rural y Marino: Madrid, Spain, 2009. [Google Scholar]
  32. Daniele, L.; Sola, F.; Izquierdo, A.V.; Bosch, A.P. Coastal aquifers and desalination plants: Some interpretations to new situations. In Proceedings of the Conference on Water Observation and Information System for Decision Support, Balwois, Ohrid, Republic of Macedonia, 25–29 May 2010. [Google Scholar]
  33. Cancio, I.; González-Robles, A.; Bastida, J.M.; Manzaneda, A.J.; Salido, T.; Rey, P.J. Habitat loss exacerbates regional extinction risk of the keystone semiarid shrub Ziziphus lotus through collapsing the seed dispersal service by foxes (Vulpes vulpes). Biodivers. Conserv. 2016, 25, 693–709. [Google Scholar] [CrossRef]
  34. Martín-Rosales, W.; Gisbert, J.; Pulido-Bosch, A.; Vallejos, A.; Fernández-Cortés, A. Estimating groundwater recharge induced by engineering systems in a semiarid area (southeastern Spain). Environ. Geol. 2007, 52, 985–995. [Google Scholar] [CrossRef]
  35. García García, J.P.; Sánchez Caparós, A.; Castillo, E.; Marín, I.; Padilla, A.; Rosso, J.I. Hidrogeoquímica de las aguas subterráneas en la zona de Cabo de Gata. In Tecnología de la Intrusión de Agua de Mar en Acuíferos Costeros: Países Mediterráneos; IGME: Granada, Spain, 2003. [Google Scholar]
  36. Mendoza-Fernández, A.J.; MartíNez-Hernández, F.; Pérez-García, F.J.; Garrido-Becerra, J.A.; Benito, B.M.; Salmerón-Sánchez, E.; Guirado, J.; Merlo, M.E.; Mota, J.F. Extreme habitat loss in a Mediterranean habitat: Maytenus senegalensis subsp. europaea. Plant Biosyst.-Int. J. Deal. Asp. Plant Biol. 2015, 149, 503–511. [Google Scholar] [CrossRef]
  37. Rivas Goday, S.; Bellot, F. Las formaciones de Ziziphus lotus (L.) Lamk. en las dunas del Cabo de Gata. An. Inst. Esp. Edafol. Ecol. Fisiol. Veg. 1944, 3, 109–126. [Google Scholar]
  38. Pugnaire, F.I.; Armas, C.; Maestre, F.T. Positive plant interactions in the Iberian Southeast: Mechanisms, environmental gradients, and ecosystem function. J. Arid Environ. 2011, 75, 1310–1320. [Google Scholar] [CrossRef]
  39. Oyonarte, C.; Rey, A.; Raimundo, J.; Miralles, I.; Escribano, P. The use of soil respiration as an ecological indicator in arid ecosystems of the SE of Spain: Spatial variability and controlling factors. Ecol. Indic. 2012, 14, 40–49. [Google Scholar] [CrossRef]
  40. Goy, J.L.; Zazo, C. Synthesis of the quaternary in the almeria littoral neotectonic activity and its morphologic features, western betics, Spain. Tectonophysics 1986, 130, 259–270. [Google Scholar] [CrossRef]
  41. Sola, F.; Daniele, L.; Sánchez Martos, F.; Vallejos, A.; Urízar, R.; Pulido Bosch, A. Influencia de la desaladora de Rambla Morales (Almería) sobre las características hidrogeológicas del acuífero del que se abastece. Los Acuíferos Costeros Retos Soluc. 2007, 1, 997–1004. [Google Scholar]
  42. Tirado, R.; Bråthen, K.A.; Pugnaire, F.I. Mutual positive effects between shrubs in an arid ecosystem. Sci. Rep. 2015, 5, 14710. [Google Scholar] [CrossRef] [Green Version]
  43. Aksoy, S.; Tilton, J.C.; Tarabalka, Y. Image segmentation algorithms for land categorization. In Remote Sensing Handbook V.1 Remotely Sensed Data Characterization, Classification, and Accuracies; Taylor & Francis: Abingdon, UK, 2015; pp. 317–342. ISBN 978-1-4822-1786-5. [Google Scholar]
  44. Benz, U.C.; Hofmann, P.; Willhauck, G.; Lingenfelder, I.; Heynen, M. Multi-resolution, object-oriented fuzzy analysis of remote sensing data for GIS-ready information. ISPRS J. Photogramm. Remote Sens. 2004, 58, 239–258. [Google Scholar] [CrossRef]
  45. Drăguţ, L.; Csillik, O.; Eisank, C.; Tiede, D. Automated parameterisation for multi-scale image segmentation on multiple layers. ISPRS J. Photogramm. Remote Sens. 2014, 88, 119–127. [Google Scholar] [CrossRef] [Green Version]
  46. Kavzoglu, T.; Tonbul, H. A comparative study of segmentation quality for multi-resolution segmentation and watershed transform. In Proceedings of the 2017 8th International Conference on Recent Advances in Space Technologies (RAST), Istanbul, Turkey, 19–22 June 2017; pp. 113–117. [Google Scholar]
  47. Zhan, Q.; Molenaar, M.; Tempfli, K.; Shi, W. Quality assessment for geo-spatial objects derived from remotely sensed data. Int. J. Remote Sens. 2005, 26, 2953–2974. [Google Scholar] [CrossRef]
  48. Tian, J.; Chen, D.-M. Optimization in multi-scale segmentation of high-resolution satellite images for artificial feature recognition. Int. J. Remote Sens. 2007, 28, 4625–4644. [Google Scholar] [CrossRef]
  49. Kavzoglu, T.; Yildiz, M. Parameter-based performance analysis of object-based image analysis using aerial and Quikbird-2 images. ISPRS Ann. Photogramm. Remote Sens. Spat. Inf. Sci. 2014, 2, 31. [Google Scholar] [CrossRef] [Green Version]
  50. Liu, Y.; Bian, L.; Meng, Y.; Wang, H.; Zhang, S.; Yang, Y.; Shao, X.; Wang, B. Discrepancy measures for selecting optimal combination of parameter values in object-based image analysis. ISPRS J. Photogramm. Remote Sens. 2012, 68, 144–156. [Google Scholar] [CrossRef]
  51. Nussbaum, S.; Menz, G. SEaTH–A New Tool for Feature Analysis. In Object-Based Image Analysis and Treaty Verification: New Approaches in Remote Sensing–Applied to Nuclear Facilities in Iran; Nussbaum, S., Menz, G., Eds.; Springer: Dordrecht, The Netherlands, 2008; pp. 51–62. ISBN 978-1-4020-6961-1. [Google Scholar]
  52. Gao, Y.; Mas, J.F.; Kerle, N.; Pacheco, J.A.N. Optimal region growing segmentation and its effect on classification accuracy. Int. J. Remote Sens. 2011, 32, 3747–3763. [Google Scholar] [CrossRef]
  53. Dobrowski, S.Z.; Safford, H.D.; Cheng, Y.B.; Ustin, S.L. Mapping mountain vegetation using species distribution modeling, image-based texture analysis, and object-based classification. Appl. Veg. Sci. 2008, 11, 499–508. [Google Scholar] [CrossRef]
  54. Wang, X.Z.; Ashfaq, R.A.R.; Fu, A.M. Fuzziness based sample categorization for classifier performance improvement. J. Intell. Fuzzy Syst. 2015, 29, 1185–1196. [Google Scholar] [CrossRef] [Green Version]
  55. Cohen, J. Weighted kappa: Nominal scale agreement provision for scaled disagreement or partial credit. Psychol. Bull. 1968, 70, 213–220. [Google Scholar] [CrossRef]
  56. Jordan, G. Morphometric analysis and tectonic interpretation of digital terrain data: A case study. Earth Surf. Process. Landf. 2003, 28, 807–822. [Google Scholar] [CrossRef]
  57. Rigol-Sanchez, J.P.; Stuart, N.; Pulido-Bosch, A. ArcGeomorphometry: A toolbox for geomorphometric characterisation of DEMs in the ArcGIS environment. Comput. Geosci. 2015, 85, 155–163. [Google Scholar] [CrossRef] [Green Version]
  58. Evans, I.S. General geomorphology, derivatives of altitude and descriptive statistics. In Spatial Analysis in Geomorphology; Chorley, R.J., Ed.; Harper and Row: Manhattan, NY, USA, 1972; pp. 17–90. [Google Scholar]
  59. Collinge, S.K.; Palmer, T.M. The influences of patch shape and boundary contrast on insect response to fragmentation in California grasslands. Landsc. Ecol. 2002, 17, 647–656. [Google Scholar] [CrossRef]
  60. Schumaker, N.H. Using Landscape Indices to Predict Habitat Connectivity. Ecology 1996, 77, 1210–1225. [Google Scholar] [CrossRef] [Green Version]
  61. Rosenberg, M.S.; Anderson, C.D. PASSaGE: Pattern Analysis, Spatial Statistics and Geographic Exegesis. Version 2. Methods Ecol. Evol. 2011, 2, 229–232. [Google Scholar] [CrossRef]
  62. Laliberte, A.S.; Rango, A.; Havstad, K.M.; Paris, J.F.; Beck, R.F.; McNeely, R.; Gonzalez, A.L. Object-oriented image analysis for mapping shrub encroachment from 1937 to 2003 in southern New Mexico. Remote Sens. Environ. 2004, 93, 198–210. [Google Scholar] [CrossRef]
  63. Fernández-Buces, N.; Siebe, C.; Cram, S.; Palacio, J.L. Mapping soil salinity using a combined spectral response index for bare soil and vegetation: A case study in the former lake Texcoco, Mexico. J. Arid Environ. 2006, 65, 644–667. [Google Scholar] [CrossRef]
  64. Yu, Q.; Gong, P.; Clinton, N.; Biging, G.; Kelly, M.; Schirokauer, D. Object-based Detailed Vegetation Classification with Airborne High Spatial Resolution Remote Sensing Imagery. Photogramm. Eng. Remote Sens. 2006, 7, 799–811. [Google Scholar] [CrossRef] [Green Version]
  65. Murray, H.; Lucieer, A.; Williams, R. Texture-based classification of sub-Antarctic vegetation communities on Heard Island. Int. J. Appl. Earth Obs. Geoinf. 2010, 12, 138–149. [Google Scholar] [CrossRef]
  66. Laliberte, A.S.; Browning, D.M.; Rango, A. A comparison of three feature selection methods for object-based classification of sub-decimeter resolution UltraCam-L imagery. Int. J. Appl. Earth Obs. Geoinf. 2012, 15, 70–78. [Google Scholar] [CrossRef]
  67. Laliberte, A.S.; Rango, A. Texture and Scale in Object-Based Analysis of Subdecimeter Resolution Unmanned Aerial Vehicle (UAV) Imagery. IEEE Trans. Geosci. Remote Sens. 2009, 47, 761–770. [Google Scholar] [CrossRef] [Green Version]
  68. Asner, G.P.; Knapp, D.E.; Kennedy-Bowdoin, T.; Jones, M.O.; Martin, R.E.; Boardman, J.; Hughes, R.F. Invasive species detection in Hawaiian rainforests using airborne imaging spectroscopy and LiDAR. Remote Sens. Environ. 2008, 112, 1942–1955. [Google Scholar] [CrossRef]
  69. Walsh, S.J.; McCleary, A.L.; Mena, C.F.; Shao, Y.; Tuttle, J.P.; González, A.; Atkinson, R. QuickBird and Hyperion data analysis of an invasive plant species in the Galapagos Islands of Ecuador: Implications for control and land use management. Remote Sens. Environ. 2008, 112, 1927–1941. [Google Scholar] [CrossRef]
  70. Partridge, T.R. Vegetation recovery following sand mining on coastal dunes at Kaitorete Spit, Canterbury, New Zealand. Biol. Conserv. 1992, 61, 59–71. [Google Scholar] [CrossRef]
  71. Tengberg, A.; Chen, D. A comparative analysis of nebkhas in central Tunisia and northern Burkina Faso. Geomorphology 1998, 22, 181–192. [Google Scholar] [CrossRef]
  72. Wang, X.; Yang, F.; Yang, D.; Chen, X. Relationship between the growth of Tamarix ramosissima and morphology of nebkhas in oasis-desert ecotones. In Global Climate Change and Its Impact on Food & Energy Security in the Drylands, Proceedings of the Eleventh International Dryland Development Conference, Beijing, China, 18–21 March 2013; International Dryland Development Commission (IDDC): Beijing, China, 2014; pp. 616–628. [Google Scholar]
  73. Sánchez, F.J.T. El uso del agua en Nijar: Implicaciones ambientales del modelo actual de gestión. Rev. Estud. Reg. 2008, 83, 145–176. [Google Scholar]
  74. Houérou, H.N.L. Agroforestry and sylvopastoralism: The role of trees and shrubs (Trubs) in range rehabilitation and development. Sci. Chang. Planétaires Sécher. 2006, 17, 343–348. [Google Scholar]
  75. Howard, J.; Merrifield, M. Mapping Groundwater Dependent Ecosystems in California. PLoS ONE 2010, 5, e11249. [Google Scholar] [CrossRef] [PubMed] [Green Version]
  76. Ponce, V.M. Effect of groundwater pumping on the health of arid vegetative ecosystems. Online Report, December. 2014. Available online: http://ponce.sdsu.edu/effect_of_groundwater_pumping.html (accessed on 10 November 2019).
  77. Roques, K.G.; O’connor, T.G.; Watkinson, A.R. Dynamics of shrub encroachment in an African savanna: Relative influences of fire, herbivory, rainfall and density dependence. J. Appl. Ecol. 2001, 38, 268–280. [Google Scholar] [CrossRef]
  78. Sturm, M.; Racine, C.; Tape, K. Increasing shrub abundance in the Arctic. Nature 2001, 411, 546–547. [Google Scholar] [CrossRef]
  79. Leonard, J.A.; Yeary, R.A. Exposure of Workers Using Hand-Held Equipment During Urban Application of Pesticides to Trees and Ornamental Shrubs. Am. Ind. Hyg. Assoc. J. 1990, 51, 605–609. [Google Scholar] [CrossRef]
  80. Bear, J.; Cheng, A.H.-D.; Sorek, S.; Ouazar, D.; Herrera, I. Seawater Intrusion in Coastal Aquifers: Concepts, Methods and Practices; Springer Science & Business Media: Berlin, Germany, 1999; Volume 14. [Google Scholar]
  81. Mahlknecht, J.; Merchán, D.; Rosner, M.; Meixner, A.; Ledesma-Ruiz, R. Assessing seawater intrusion in an arid coastal aquifer under high anthropogenic influence using major constituents, Sr and B isotopes in groundwater. Sci. Total Environ. 2017, 587, 282–295. [Google Scholar] [CrossRef]
  82. Jackson, R.B.; Canadell, J.; Ehleringer, J.R.; Mooney, H.A.; Sala, O.E.; Schulze, E.D. A global analysis of root distributions for terrestrial biomes. Oecologia 1996, 108, 389–411. [Google Scholar] [CrossRef]
  83. Nègre, R. Recherches Phytogéographiques Sur L’étage de Végétation Méditerranéen Aride (Sous-Étage Chaud) au Maroc Occidental; Société des Sciences Naturelles et Physiques du Maroc: Rabat, Morocco, 1959. [Google Scholar]
Figure 1. Upper images: the distribution of Ziziphus lotus priority habitat 5220* in the Mediterranean area. Lower image: Dashed line shows the study area under urban and intensive agricultural pressure in 2016. UTM projection Zone 30N; WGS 1984 Datum. Map data: Google, Maxar.
Remotesensing 11 02649 g001
Figure 2. Sand extraction areas and differences of cover areas of Ziziphus lotus shrubs in the 1956–1977 period, when massive sand extractions took place in the study area. In red are shown negative areas, in green, positive areas, and in black, shrub loss. Spatial coordinate system, WGS84/UTM Zone 30 N.
Remotesensing 11 02649 g002
Figure 3. Differences of cover areas of Ziziphus lotus shrubs in the 1977–1984 period, when massive groundwater withdrawals took place in the study area. In red are shown negative areas and in green, positive areas. Spatial coordinate system, WGS84/UTM Zone 30 N.
Remotesensing 11 02649 g003
Figure 4. Differences of cover areas of Ziziphus lotus shrubs in the 1984–2016 period, when the area was protected under the Cabo de Gata-Níjar Natural Park. In red are shown negative areas, in green, positive areas, and in black, shrub loss. Spatial coordinate system, WGS84/UTM Zone 30 N.
Remotesensing 11 02649 g004
Table 1. Data sources, spatial resolution, band numbers and year of the data used in the object-based shrub mapping and sand extraction estimation from airborne laser scanning (light detection and ranging (LiDAR)).
Data SourceSpatial ResolutionBand NumberYear
Andalusian Environmental Information Network (REDIAM)1 m/pixel11956
1 m/pixel11977
0.5 m/pixel31984
0.5 m/pixel31997
0.5 m/pixel32004
0.5 m/pixel32008
Google EarthTM0.5 m/pixel32013
0.5 m/pixel32016
Airborne laser scanning1 m point spacing-2011
Table 2. Parameters used for the segmentation and their accuracies. RMSE, root-mean-square error; MBE, mean bias error; ED2, Euclidean Distance v.2. Lower (better) values of RMSE and ED2 are highlighted in bold type.
Year19561977198419972004200820132016
Scale parameter3020353015202020
RMSE (m2)112.9169.96110.04120.6480.5784.2697.0246.38
MBE (m2)14.0715.07−6.590.7832.7815.74−9.96−6.37
ED20.590.350.430.490.510.470.420.35
Table 3. Features used in the classifications and separability between them using the separability and threshold (SEaTH) algorithm. In bold, the two features for each year with the highest separability used to classify the images.
Year19561977198419972004200820132016
Separability (J)
Brightness0.921.240.880.971.041.130.530.86
GLCM Homogeneity0.030.870.470.290.340.560.450.8
GLCM Contrast0.250.770.140.290.940.261.010.79
GLCM Entropy0.060.380.380.2400.411.240.56
GLCM Mean0.911.320.8911.031.140.570.86
GLCM SD0.060.350.20.30.060.450.840.26
GLCM Correlation0.010.060.060.20.351.930.940.59
Area0.550.150.920.040.380.71.080.19
Border Length0.70.540.270.350.061.370.790.07
Border Index0.790.690.510.50.171.70.280.32
Compactness0.730.630.460.510.51.380.290.46
Density0.321.110.520.820.860.641.420.85
Roundness0.630.350.250.360.221.440.290.2
Shape Index0.820.70.520.570.251.740.220.4
Table 4. Error matrix of all the classified images in the study. Z, Ziziphus lotus; S, Bare soil with sparse vegetation patches; Uncl., Unclassified; Prod., Producer’s accuracy; User, User’s accuracy; Held, Helden; KIA-c, KIA per class; AO, Overall accuracy; KIA, Kappa index of agreement. Highest (best) KIA values for Z (Z. lotus) and S (Bare soil) classes are highlighted in bold type.
Year1956197719841997
ClassZSsumZSsumZSsumZSsum
Z52557470475926157158
S755621360730585835962
Uncl.101000101000
Sum6060 6060 6060 6060
Prod.0.860.92 0.781 0.980.97 0.950.98
User0.920.88 10.82 0.971 0.980.95
Total
KIA-c 0.740.84 0.641 0.950.94 0.90.96
OA0.890.89 0.890.89 0.970.97 0.970.97
KIA0.790.79 0.780.78 0.950.95 0.930.93
Year2004200820132016
ClassZSsumZSsumZSsumZSsum
Z59160550555715858159
S15960560653596225961
Uncl.000000000000
Sum6060 6060 6060 6060
Prod.0.980.99 0.921 0.950.99 0.960.99
User0.990.98 0.990.92 0.990.95 0.990.96
Total
KIA-c0.950.98 0.840.99 0.90.98 0.920.99
OA0.980.98 0.960.96 0.970.97 0.980.96
KIA0.970.97 0.910.91 0.940.94 0.960.99
Table 5. The number of shrubs detected each year and their cover-related average statistics. The highest number of bushes, the maximum area, the total cover area, and the lowest (best) round shape index are highlighted in bold type.
Year19561977198419972004200820132016
Number of shrubs20552625243423452071207819991883
Average area (m2)82.6278.3287.9876.5193.78100.5799.5111.31
SD area (m2)67.6567.2379.4566.9176.7782.2877.8483.22
Minimum area (m2)85746786
Maximum area (m2)525570643701586742678658
Total cover area (m2)152,932208,702209,763177,706223,322208,889198,708212,394
Round shape index1.321.521.471.531.711.762.041.94
SD round shape index0.160.260.260.270.360.380.470.46
Table 6. Change of cover and frequency of the difference in Ziziphus lotus area in the studied years (1956–2016). The negative and positive areas are the result of the subtraction between the year and its predecessor. The highest lost area, the largest positive area, the balance between greater areas, the positive frequency and the negative frequency of shrubs are highlighted in bold type.
Difference of Area
Between
1956–1977
Difference of area
Between
1977–1984
Difference of Area
Between
1984–1997
Difference of area
Between
1997–2004
Difference of area
Between
2004–2008
Difference of area
Between
2008–2013
Difference of area
Between
2013–2016
Negative area (m2)−27,797−18,917−56,838−25,968−32,426−34,902−29,684
Positive area (m2)42,75369,20731,59484,89860,87044,14745,101
Balance of areas (m2)14,95650,290−25,24458,93028,444924515,417
Negative frequency (n)7529031423824726861893
Positive frequency (n)11581650871140513191150978

