Article

Interactions among the Phenological Events of Winter Wheat in the North China Plain-Based on Field Data and Improved MODIS Estimation

1
Graduate School of Science and Engineering, Chiba University, Chiba 2638522, Japan
2
Center for Environmental Remote Sensing, Chiba University, Chiba 2638522, Japan
3
School of Surveying and Land Information Engineering, Henan Polytechnic University, Jiaozuo 454000, China
4
Key Laboratory of Agricultural Water Resources, Center for Agricultural Resources Research, Institute of Genetics and Developmental Biology, Chinese Academy of Sciences, Shijiazhuang 050021, China
*
Author to whom correspondence should be addressed.
Remote Sens. 2019, 11(24), 2976; https://doi.org/10.3390/rs11242976
Submission received: 22 October 2019 / Revised: 9 December 2019 / Accepted: 10 December 2019 / Published: 11 December 2019
(This article belongs to the Section Environmental Remote Sensing)

Abstract

:
Identification of complete drivers for phenology changes is crucial for developing prediction models of plant phenology. In addition to climatic factors, the interaction among phenological events has recently been reported as an important driver for the phenology changes of forests, savannas, and grasslands. However, open questions remain as to whether the phenological interaction exists in agricultural ecosystems, among which winter wheat plays a vital role in feeding human beings. In this study, we investigated the interaction among the phenological events of winter wheat in the North China Plain (NCP) using both field and satellite data. Considering the large discrepancies between the existing satellite estimation and field measurements of winter wheat phenology, we first improved the MODIS-based estimation of green-up date (GUD), heading date (HD), and maturity date (MD) through a re-calibrated relative threshold method (RTM) in the NCP. The GUD, HD, and MD were accurately estimated with the mean absolute errors (MAE) and root mean squared errors (RMSE) lower than 7.5 days, compared with the RMSEs ranging from 12.0 to 36.1 days in previous studies. Then, the relationships among the GUD, HD, and MD were analyzed using the field data collected at agricultural meteorological stations. The GUD (HD) showed a significantly positive correlation with the HD (MD). Quantitatively, a one-day earlier GUD (HD) would result in an earlier HD (MD) of 0.57 days (0.60 days). Furthermore, we applied the partial correlation analysis to the improved MODIS estimation of GUD, HD, and MD to investigate their interactions by considering the simultaneous influences from climatic factors. The results showed that the HD (MD) with 85.2% (94.5%) of all winter wheat pixels presented a significantly positive correlation with the GUD (HD). Meanwhile, the GUD (HD) with 84.2% (33.3%) of the entire winter wheat area presented a significantly negative correlation with pre-season temperature. These results suggest that both the climatic factors and phenological interactions should be included in the future development of winter wheat phenology models to improve the prediction accuracies.

Graphical Abstract

1. Introduction

Wheat is widely grown around the world as a major staple food, and feeds more than 35% of the world’s population [1]. The North China Plain (NCP), one of the most important production bases of winter wheat in China [2], provides 25% of the wheat supply of the country. Nevertheless, the NCP has been encountering severe shortages of water resources in recent decades, which has become the largest risk for the agricultural sustainability of the NCP, threatening its reliable contributions to guaranteed food security in China [3,4].
To facilitate the water resource management and yield estimation of winter wheat in the NCP, the observations and models of winter wheat phenology are extensively required [5]. For example, measurements of the key phenological events, including green-up date (GUD), heading date (HD), and maturity date (MD), are necessary for computing the water demand of winter wheat throughout the growing season [6]. Moreover, the phenology models are essential for predicting the responses and feedbacks of winter wheat to future climate change, and for analyzing the changes of its water demands under different simulation scenarios of management strategies [7].
Although a number of efforts have been undertaken in recent decades, it has been found that the existing phenology models cannot accurately reproduce the spatial and temporal patterns of vegetation phenology [8], possibly because the drivers of the phenology changes have not been fully identified. To date, both the climatic and biological factors are considered as essential drivers for the changes of vegetation phenology [9]. For the winter wheat phenology, previous studies mainly focused on the relationships between climatic factors and GUD, and found that the GUD of winter wheat was more influenced by pre-season temperature than precipitation due mainly to the influence of irrigation [2,10,11]. However, little attention has been paid to the driving forces of the HD and MD of winter wheat, which are also crucial for the studies of water consumption and yield estimation.
Regarding the biological factors, a forest warming experiment found that the interaction between phenological events would be a major driver for the phenology changes of two temperate tree species [12]. Furthermore, Keenan et al. [13] found that the timing of autumn senescence was correlated with the timing of spring budburst in the entire eastern United States using decadal estimates of phenology from MODIS data. Liu et al. [14] also found that autumn vegetation phenology was related to both climatic factors and spring phenology in the Northern Hemisphere based on GIMMS satellite data. However, these studies were all conducted in non-agricultural ecosystems (i.e., forests, savannas, and grasslands). Scientific questions still remain open as to whether the interactions significantly exist among the major phenological events of winter wheat (i.e., GUD, HD, and MD).
To answer the above question, it is necessary to collect long-term and extensive measurements of winter wheat phenology. The phenological events of winter wheat have been traditionally obtained through field observations in the NCP. That is, the metrics of GUD, HD, and MD have been continuously recorded at the meteorological stations located in the NCP from 2000 to now [15,16,17]. These long-term ground observations have been successfully applied to several studies analyzing the relationships between winter wheat phenology and climatic factors [16,17,18]. Nevertheless, these field measurements of winter wheat phenology are usually time-consuming, inefficient, labor-intensive, and lacking in spatial coverages [19,20]. Additionally, it is almost impossible to maintain the field monitoring of winter wheat phenology at a large spatial scale over long-term periods [21].
On the other hand, satellite remote sensing provides the only feasible technique to continuously observe the land surface at regional to global scales in an operational manner, and thus can largely expand the horizon of traditional field measurements of vegetation phenology [22]. To estimate the phenology metrics from satellite observations, vegetation indexes (VIs)—like normalized difference vegetation index (NDVI, [23]) and enhanced vegetation index (EVI, [24])—should firstly be calculated from the surface reflectance datasets. However, the NDVI and EVI are prone to be influenced by the snow effect in high latitude and altitude areas [25]. That is, NDVI increases when the snow cover fraction decreases, and decreases when the fraction increases [25]. Thus, NDVI can be increased in spring not only by growth of vegetation but also by snowmelt [26]. Therefore, in order to reduce the effects of snow on NDVI, a novel snow-free type of VIs, including the empirical normalized difference phenology index (NDPI, [27]) and the semi-analytical normalized difference greenness index (NDGI, [26]), were recently proposed. Based on the time-series of the computed VIs, vegetation phenology can be estimated by extracting the day of year (DOY) corresponding to pre-determined absolute or relative thresholds of the VI values [1,15] or the maximum change rate of the trajectories of VIs [11,28]. For winter wheat, the GUDs were previously estimated based on either a relative threshold of 20% or a maximum change rate of the fitted curve of the time series VIs [1,2,10,11]. These studies mainly focused on changing trends of winter wheat phenology and its responses to climatic factors from the perspective of regarding the wheat fields as important agricultural ecosystems to the global carbon cycle. Correspondingly, only a high correlation between the field measurements and satellite estimation of wheat phenology was required for those studies. However, significant discrepancies have been observed between the field measured and satellite estimated GUDs. For example, the root-mean-square-error (RMSE) between the measured and estimated GUDs ranged from 12.0 to 36.1 days [2,11]. This results in inconsistencies between the phenological interactions based on field measurements and satellite observations, and finally limits the applications of satellite estimates to phenology model development.
Consequently, the objectives of this study were (1) to improve the agreements between field measurements and the MODIS-based estimation of the GUD, HD, and MD of winter wheat in the NCP; and (2) to investigate the interactions among the GUD, HD, and MD using both the field measurements and the improved satellite estimation toward improving the phenology models of winter wheat.

2. Study Area and Datasets
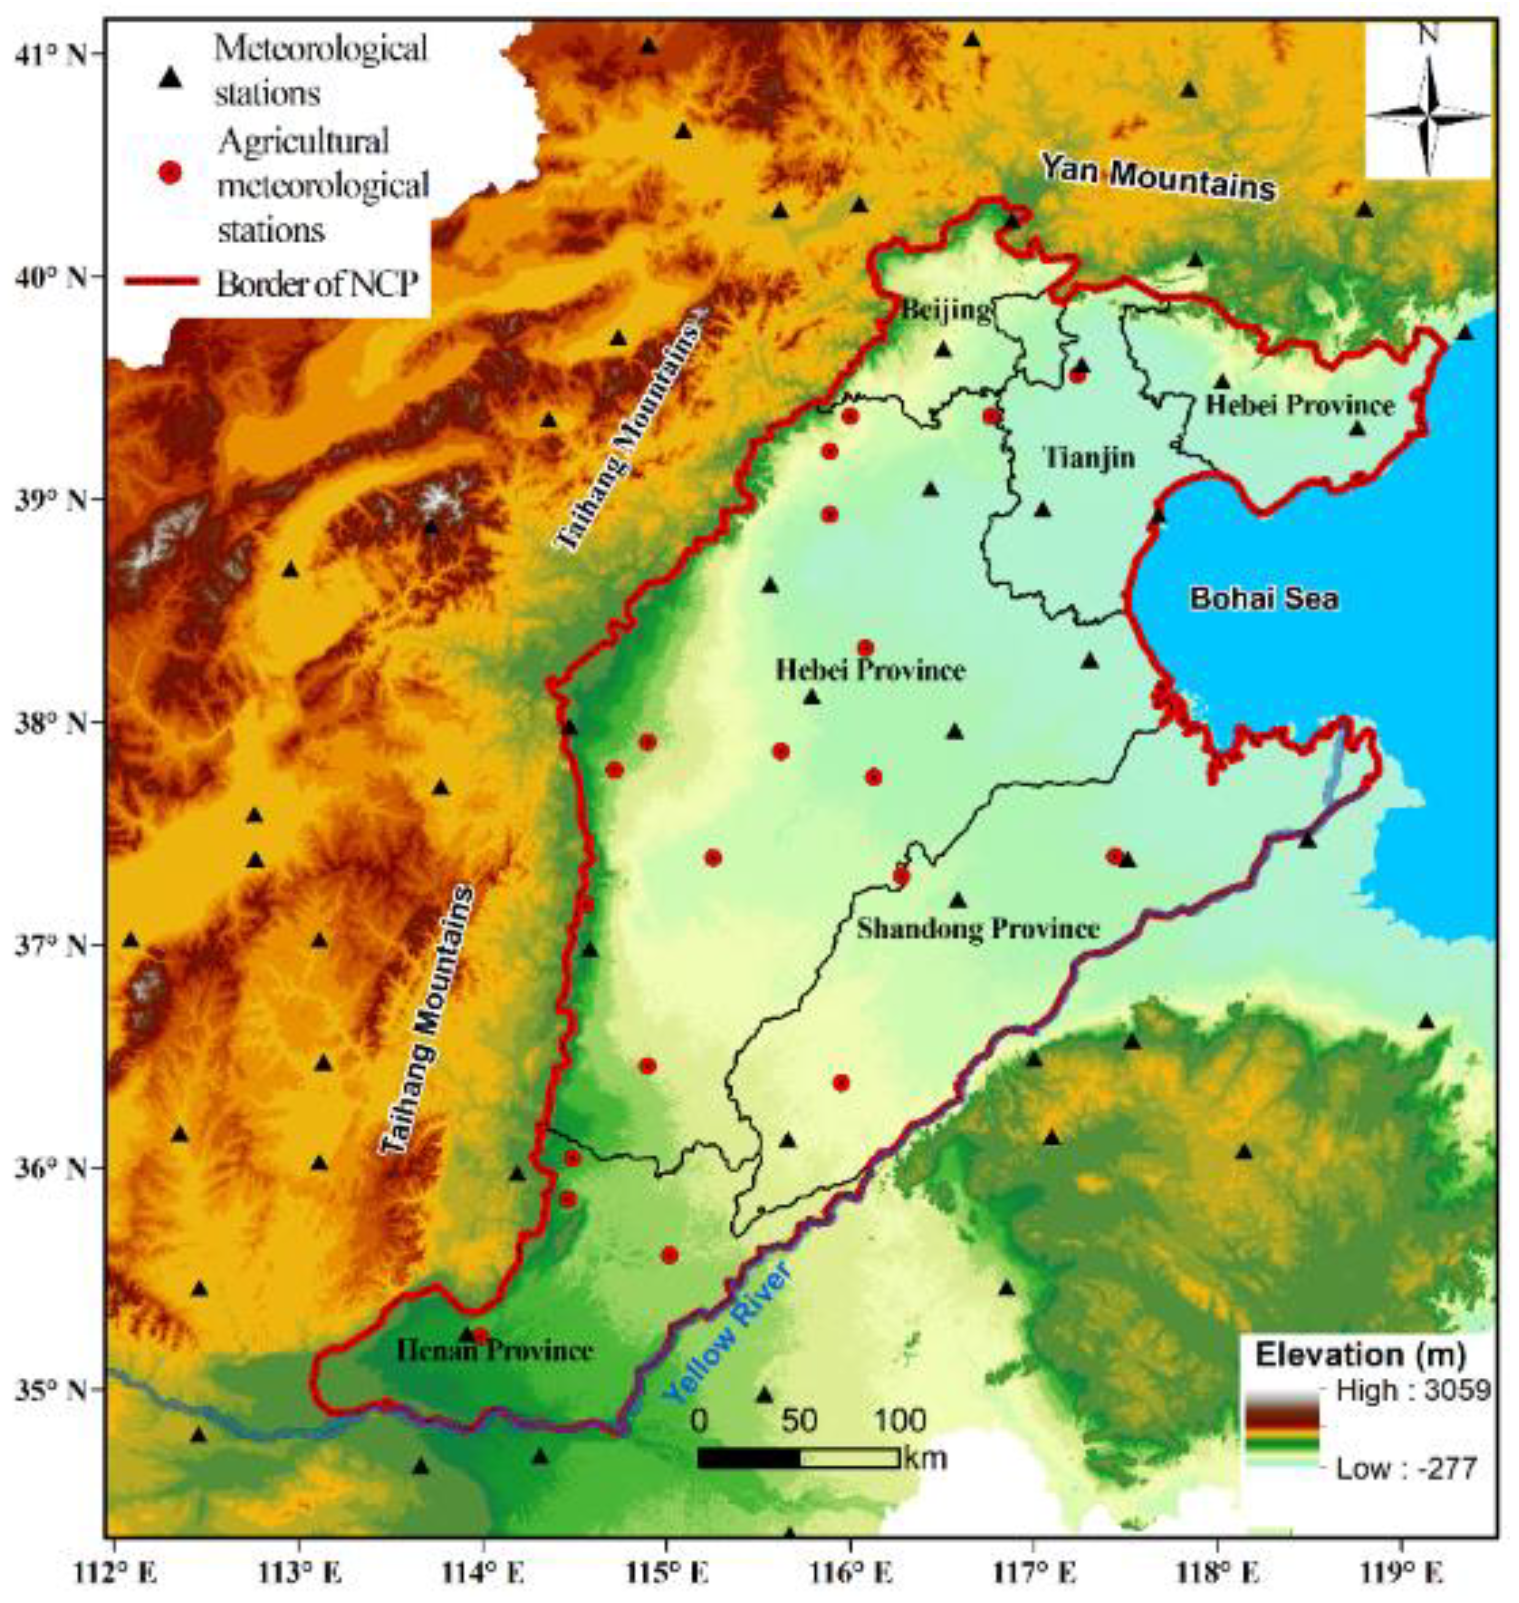
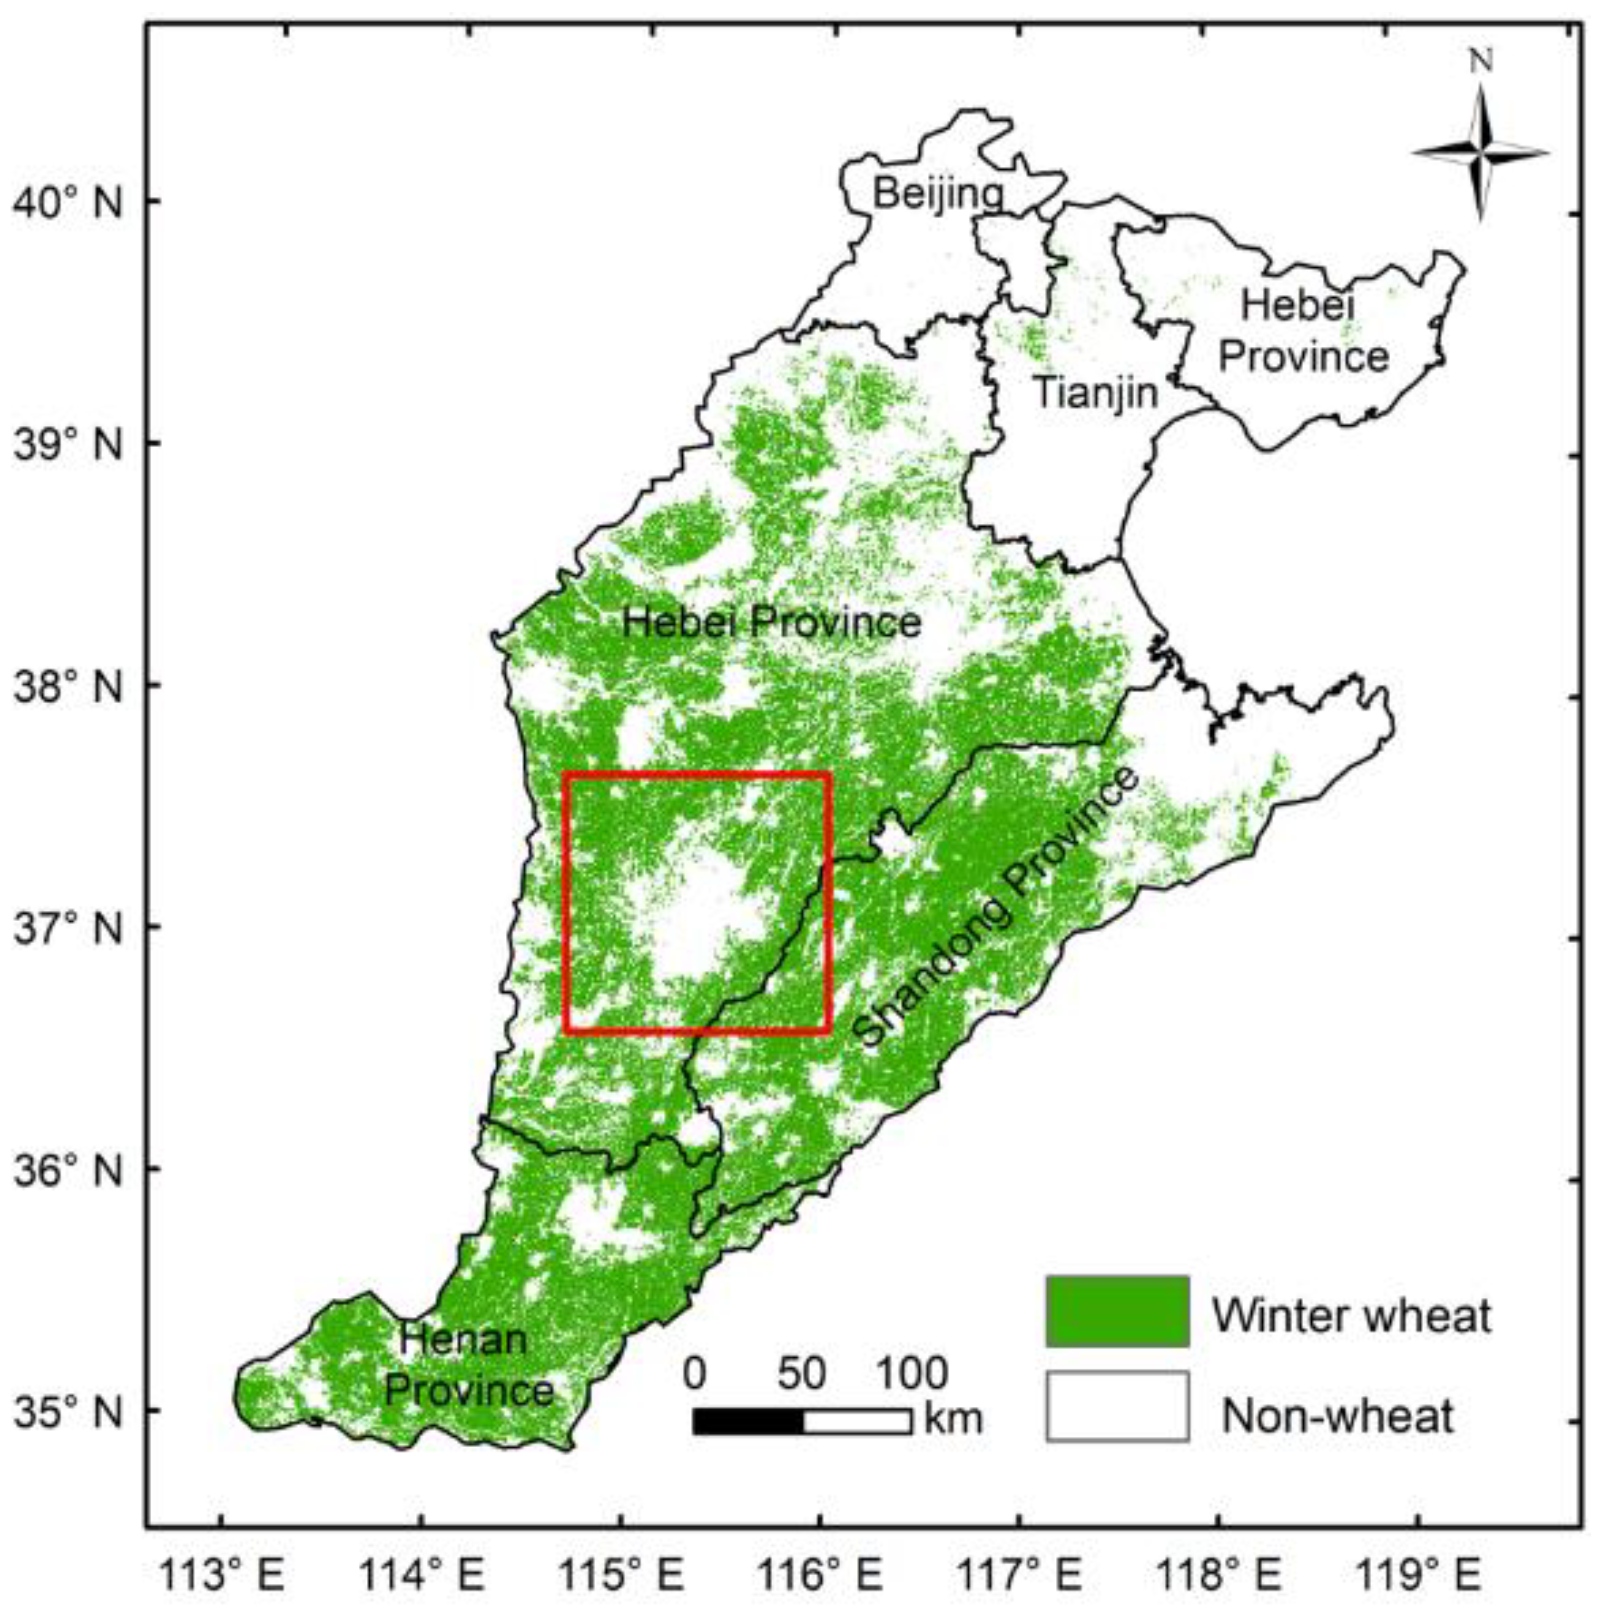
2.1. Study Area

The NCP, which is located in the eastern part of China (Figure 1), is one of the most important grain production bases in China [2,17]. The NCP covers the area from the Yan Mountains in the north to the Yellow River in the south and from the Taihang Mountains in the west to the Bohai Sea in the east [29,30]. It includes the plains areas of the Beijing municipality, Tianjin municipality, Hebei Province, Henan Province, and Shandong Province with a total area of 140,000 km2. The study area has an average altitude of about 50 meters above sea level and belongs to the typical temperate monsoonal climate [28]. The average annual precipitation is 500–600 mm and 70% of precipitation is concentrated from late June to September [31]. In the study area, shortage of water resources is the main limiting factor for the sustainable development of agriculture. Rotation of winter wheat and summer maize is the dominant cropping system because of suitable climate conditions and good soil conditions [32].

2.2. Datasets

2.2.1. MODIS Data

This study used the MODIS/Terra surface reflectance product (MOD09A1) [33] from 2001 to 2018 acquired from the Oak Ridge National Laboratory Distributed Active Archive Center (ORNL DAAC, https://daac.ornl.gov). This product includes seven reflectance bands with the spatial and temporal resolution of 500 m and 8 days, respectively. Meanwhile, the actual acquisition DOY of the land surface reflectance within the eight days for composition was also collected.
Since there is no consensus on which VI is the most appropriate for extracting crop phenology, and snow events often happen in winter and early spring in the NCP, we computed two types of VIs, namely the classical ones (i.e., NDVI and EVI), and the newly proposed snow-free ones (i.e., NDPI and NDGI), by using the MOD09A1 product. NDVI reflects the vegetation status because there is a high reflectance in the near-infrared band and high absorption in the red band for vegetation, NDVI is calculated using the following formula [23]
N D V I =   ρ N I R ρ R E D ρ N I R + ρ R E D
where ρ N I R and ρ R E D are the surface reflectance in the near-infrared band and red band, respectively.
The EVI was proposed to enhance the vegetation signal with improved sensitivity in high-biomass regions and improve vegetation monitoring by the decoupling of the canopy background signal and a reduction in atmosphere influences [24]. The formula is
EVI = 2.5 × ρ N I R ρ R E D ρ N I R + 6 × ρ R E D 7.5 × ρ B L U E + 1
where ρ B L U E is the surface reflectance in the blue band.
The NDPI is an empirical snow-free vegetation index proposed by Wang et al. [27]. NDPI was designed to best contrast vegetation from the background (including soil and snow), as well as to minimize the difference among the backgrounds. The NDPI formula for MODIS bandwidths is expressed as
N D P I M O D I S =   ρ N I R ( 0.74 × ρ R E D + 0.26 × ρ S W I R ) ρ N I R + ( 0.74 × ρ R E D + 0.26 × ρ S W I R )
where ρ S W I R is the surface reflectance in the short-wave infrared band.
The NDGI is also a novel snow-free VI defined by Yang et al. [26]. The NDGI is a semi-analytical index based on a linear spectral mixture model and the spectral characteristics of vegetation, snow, soil, and dry grass. The NDGI formula for MODIS bandwidths is
N D G I M O D I S = 0.65 × ρ N I R + 0.35 × ρ G R E E N ρ R E D 0.65 × ρ N I R + 0.35 × ρ G R E E N + ρ R E D
where ρ G R E E N is the surface reflectance in the green band.
In addition, this study also used the MODIS land-cover yearly product (MCD12Q1 V006) [34] with the spatial resolution of 500 m, from 2001 to 2018, to acquire the pixels of unchanged land cover type. This dataset was derived using supervised classification of MODIS Terra and Aqua reflectance data and provides six different classification schemes. This study used the classification results of the International Geosphere-Biosphere Progamme (IGBP) scheme.

2.2.2. Ten-Meter Resolution Map of Winter Wheat in the NCP

To determine the pixels for analyzing winter wheat phenology, this study used a previously generated distribution map of winter wheat at 10 m resolution in 2017 from Wang et al. [35]. This map was generated based on monthly maximum NDVI of Sentinel-2 data on the Google Earth Engine (GEE) platform. To circumvent the problem of phenology variation in winter wheat mapping, the NCP was firstly divided into 21 regions, and the winter wheat sub-map for each region was then acquired through random forest (RF)–based classification using the training samples collected in each corresponding region. The classification map for the whole NCP was finally generated by mosaicking the sub-maps of the 21 regions. The overall accuracy was up to 95% through visual interpretation, and R2 between the satellite-based and statistical planting area of winter wheat was up to 0.95. The classification map included three types of classifications, namely non-vegetation, non-wheat vegetation, and winter wheat, as shown in Appendix A Figure A1.

2.2.3. Field Observation and Meteorological Datasets

To evaluate MODIS-based phenology of winter wheat, ground records of winter wheat phenology for 2001–2013 from 20 agricultural meteorological stations (Figure 1) were collected from the China Meteorological Data Sharing Service (http://data.cma.cn). As for the definition of phenological events in field observation, GUD is determined as the day when the length of new leaves reached 1–2 cm after winter dormancy; HD is identified as the day when the tip of the ear is exposed from the flag sheath; and MD is defined as the day when more than 80% of the grains, husks, and stems turn yellow [36].
In addition, to understand the responses of winter wheat phenology to climatic factors, meteorological data obtained from the China Meteorological Data Sharing Service for 2000–2018 were used. The meteorological data included the daily mean temperature and total precipitation (including rainfall and snow) for 57 stations located within and around the NCP (Figure 1). The monthly mean temperature and the monthly total precipitation were calculated from the daily meteorological data and then were interpolated to the 500 m resolution through the Kriging method to match with the spatial resolution of MODIS data.

3. Methodology

The phenological interactions for winter wheat were investigated in the NCP using field measurements and MODIS-based estimation. The analysis based on field data was simply implemented using regression analysis. On the other hand, the MODIS-based analysis was performed according to the flowchart shown in Figure 2, which was mainly composed of three steps. First, the winter wheat phenological events (GUD, HD, and MD) were derived through the relative threshold method (RTM) based on time series of MODIS/VI. Second, the winter wheat dominated map was identified by combining the Sentinel-2 classification map with the MODIS land cover product. Third, the phenological interactions among GUD, HD, and MD were investigated based on the phenological events derived from MODIS data.

3.1. Improving the Estimation of Winter Wheat Phenology from MODIS Data

Since the previous studies showed remarkable discrepancies between the satellite estimation and field measurements of winter wheat phenology in the NCP [1,2], we applied an empirical relative threshold method (RTM) to improve the MODIS-based phenology of winter wheat in the NCP, which has been widely utilized owing to its simplicity and effectiveness [37]. Compared with other methods (i.e., maximum change rate [2,15] or the fixed threshold [1]), RTM is more flexible because various dates can be obtained by setting the different thresholds, making it possible to improve the agreement between the satellite estimation and field measurements through RTM.
In detail, the first step of the RTM is to reconstruct the continuous time series of MODIS vegetation indices through nonlinear curve fitting. The sixth-degree polynomial function was adopted for this fitting because it can provide proper fit for crop growth curves under natural conditions [38], and it has been widely used to mimic the procedure of vegetation growth [9,39,40,41]. We implemented the fitting for time series of vegetation indices using the ‘polyfit’ function in the NumPy library of Python, and the formula can be expressed as
y   =   p 0 + p 1 x +   p 2 x 2 + p 3 x 3 + + p 6 x 6
where x represents the day of year (DOY); p 0 ,   p 1 ,   p 2 ,   p 3 p 6 are the fitted coefficients derived from least-square optimization for each pixel; and y represents the value of vegetation indices at the corresponding DOY. However, because of the inevitable noise caused by clouds, snow, or heavy aerosols (as shown in Figure 3a) in the raw data, the MODIS time series data of vegetation indices used for fitting were reconstructed through the state-of-the-art filtering algorithm, Spatial-Temporal Savitzky-Golay (STSG) [42]. An example of the performance of the STSG filter is shown in Figure 3b. According to the phenology records of ground observation in the study area, winter wheat GUD generally occurred around the end of February to early March, and the harvesting occurred around the middle of June every year. Therefore, MODIS vegetation indices during the DOY 1 to DOY 185 were used for fitting. Then, by combining the actual DOY and fitting parameters, a time series of daily vegetation indices during DOY 1 to DOY 180 (Figure 3c) was generated.
The second step of the RTM is to calculate the specified fraction of the seasonal amplitude of vegetation indices (VIratio) using the fitted daily time series of VIs [37]
V I ratio =   V I t V I m i n V I m a x   V I m i n
where VIt refers to the value of vegetation indices on day t, VImax refers to the maximum value of vegetation indices across the DOY 1 to DOY 180; and VImin is the local minimum value of vegetation indices before (for GUD and HD) or after (for MD) the date of maximum value. Figure 3 shows an example from the raw NDGI to the final generation of the daily fitted NDGI.
Lastly, the phenological metrics of GUD, HD, and MD were extracted by determining the thresholds that achieved the best agreements with corresponding ground observations. In detail, as shown in Figure 3c, the thresholds ranging from 0% (the minimum value before the maximum) to 100% with an interval of 5% were implemented to match with the ground GUD and HD. The thresholds ranging from 0% (the minimum value after the maximum) to 100% with an interval of 5% were implemented to match with the ground MD.
It is worth noting that the publicly available latitudes and longitudes of the agricultural meteorological stations showed that the locations were in certain towns or cities in the NCP, rather than any croplands. That is, the actual locations for collecting the field phenology were unclear. Therefore, we could not obtain the matched-up satellite data directly based on the provided latitudes and longitudes of the stations. To mitigate this problem, we proposed a strategy to obtain the most possible MODIS pixels for each station with the consideration of removing the influence of spatial heterogeneity (Figure 4). The first step was to select the five nearest pixels of winter wheat for each station based on the time-series of MODIS data; we assumed that these five pixels for each station occupied each field measurement site. The second step was to calculate the standard deviation of the estimated date corresponding to each threshold from these five pixels. The third step was to discard the stations with the standard deviation of estimated date for the threshold of 0% before the maximum of the fitted daily VI, the threshold of 100%, and the threshold of 0% after the maximum of the fitted daily VI larger than five days. Finally, only the retained stations were used to conduct the comparison between satellite estimated and ground observed phenology.

3.2. Identifying the Winter Wheat Dominated Pixels for Long-Term Analysis

The winter wheat distribution during the study period of 2001–2018 was needed for carrying out the long-term analysis on the phenological events. Considering the significant changes of winter wheat distributions in the NCP in recent decades, we first screened the pixels without land cover changes for the years 2001 and 2018; then, we selected those with no less than 10 unchanged years during 2002–2017 using the MODIS land cover product (i.e., MCD12Q1). However, this product does not provide the spatial distribution of winter wheat. We therefore further screened the winter wheat-dominated pixels using the previously generated Sentinel-2 classification map with 10 m resolution [35]. First, the fractions of winter wheat and non-wheat vegetation at 500 m were obtained using the Sentinel-2 map from 2017. Then, the thematic map of winter wheat in 2017 was determined based on the criteria of (1) the fraction of winter wheat larger than 10%, and (2) the difference between the fractions of winter wheat and non-wheat vegetation larger than 10%. Last, we retained only the no-changed MODIS pixels that were identified as winter wheat in the resampled thematic map from the Sentinel-2 map in 2017.

3.3. Investigating the Interactions among the GUD, HD, and MD

The interactions among the GUD, HD, and MD of winter wheat were investigated using both field measurements, as well as the improved MODIS based on the above RTM method (Section 3.1). Partial correlation analysis was applied to identify the penological interactions from the influences of climatic factors for the multi-year MODIS observations. Specifically, the climatic factors included the pre-season mean temperature and cumulative precipitation. For the GUD, the most appropriate pre-season needs to be determined from the candidate periods from the sowing date (early October) to the regionally averaged winter wheat GUD (March). Thus, we conducted a general linear regression analysis between the different periods of monthly mean temperature and the monthly total precipitation and winter wheat GUD. The results indicated that the pre-season mean temperature from January to March and the cumulative precipitation from December to March yielded the highest correlation. Thus, we conducted the partial correlation analysis between the mean temperature from January to March and the total precipitation from December to March. For winter wheat HD, we calculated the partial correlation coefficient between the HD and mean temperature, the cumulative precipitation during March and April, and the winter wheat GUD. For winter wheat MD, we calculated the partial correlation coefficient between MD and mean temperature, the cumulative precipitation during April and May, and the winter wheat HD.
However, it should be noted that a simple correlation analysis was applied to the field data because it was not feasible to determine the appropriate preseason temperatures and precipitations based on the limited applicable observation years.

4. Results

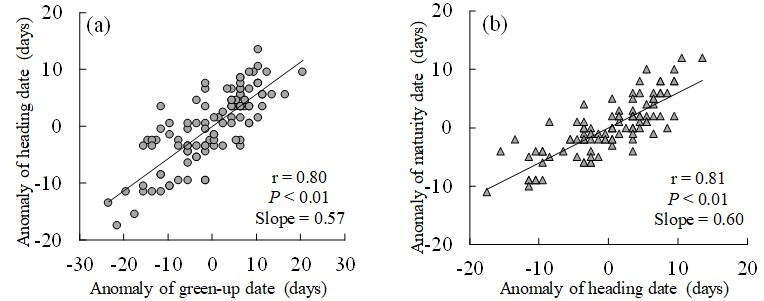
4.1. Phenological Interactions Observed by Field Measurements

Figure 5 showed the simple correlation analysis results among the anomaly of the field GUD, HD, and MD of winter wheat provided by the agricultural meteorological stations. It can be seen that the winter wheat HD was positively correlated (r = 0.80, p < 0.01) with the GUD with a slope of 0.57, which implied that a one-day earlier GUD would result in an earlier HD of 0.57 days (Figure 5a). Figure 5b showed that winter wheat MD was also positively correlated (r = 0.81, p < 0.01) with the HD. The slope of the relationship between MD and HD indicated that a one-day earlier HD would result in an earlier MD of 0.6 days (Figure 5b). Consequently, the latter phenological events presented a significant positive correlation with the former phenological events for winter wheat at the site scale.

4.2. Improved MODIS Estimation of the Phenological Events

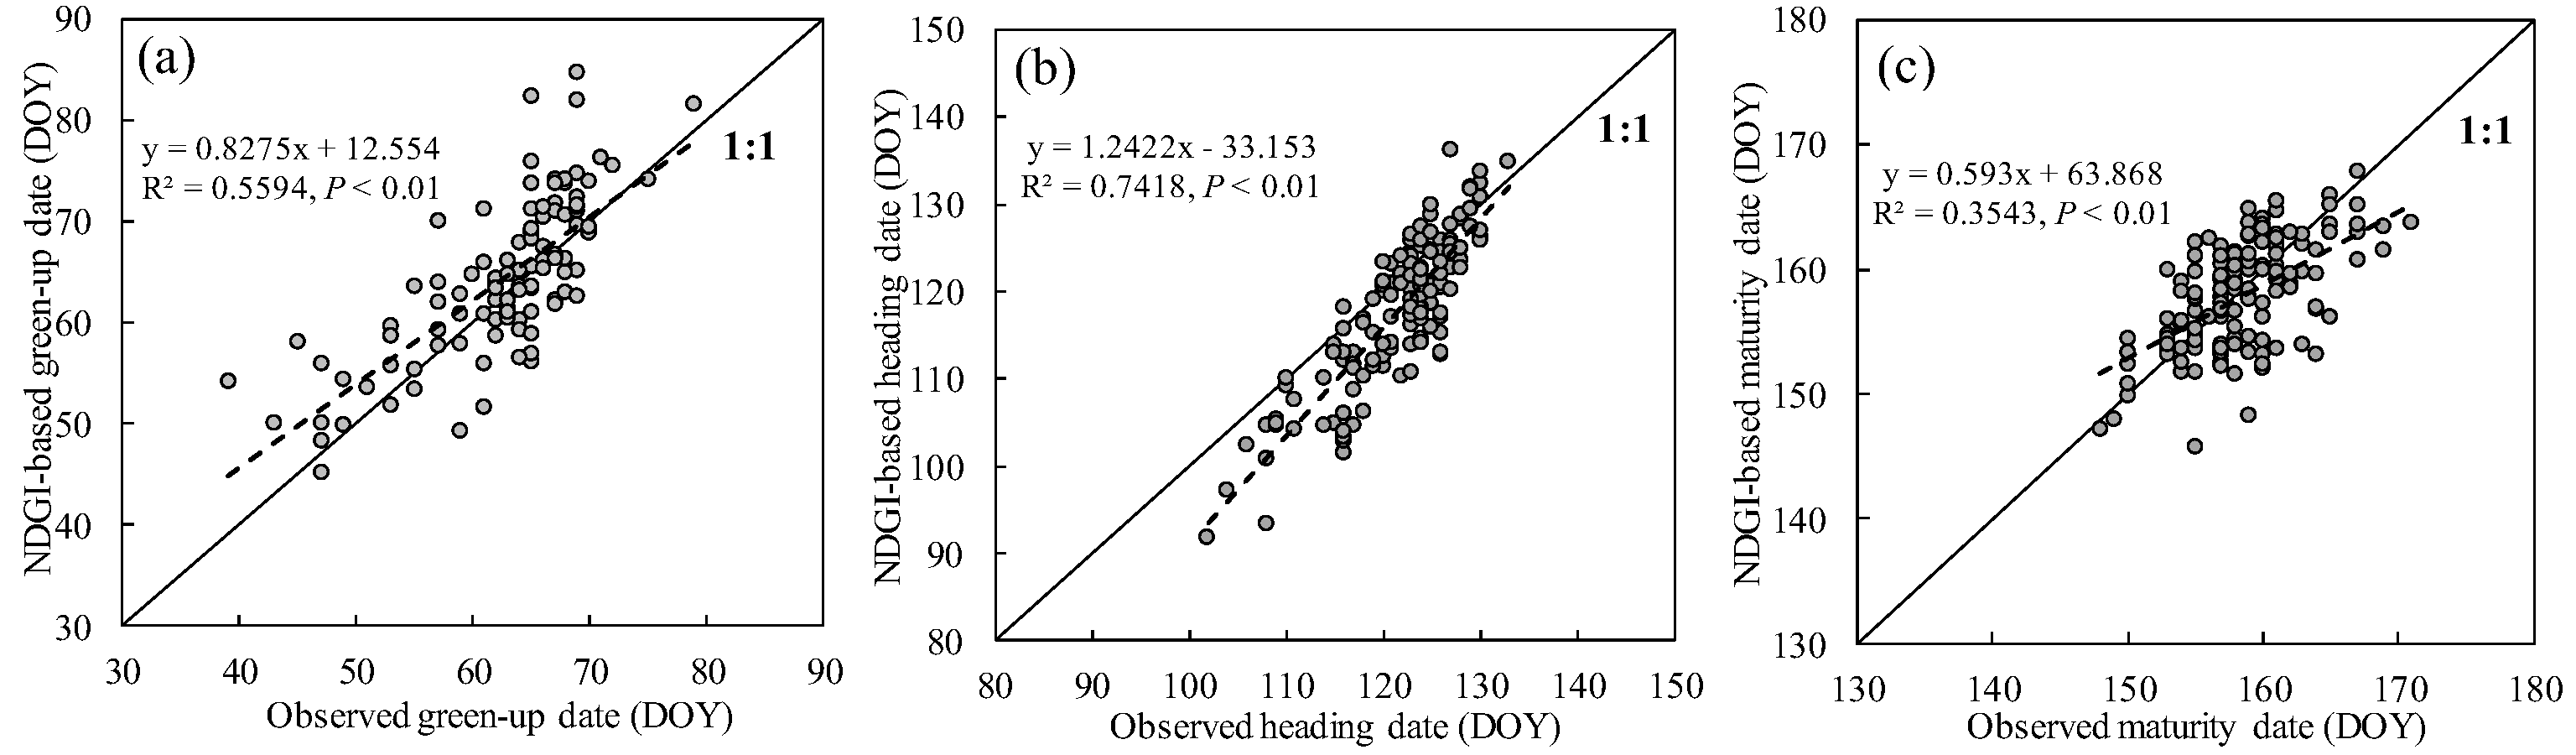
4.2.1. Comparison between Satellite-Estimated and Ground-Observed Winter Wheat Phenology

We compared the DOYs corresponding to different values of VIratio (Equation (6)) at a 5% interval with the ground phenology data collected during 2001–2013. It was found that the relative thresholds of 5% for GUD, 95% for HD, and 30% for MD yielded the best agreements with ground phenology for all of the four VIs (i.e., NDVI, EVI, NDPI, and NDGI). Table 1 summarized the accuracy indices for the VIs, including correlation coefficient (r), mean absolute error (MAE), and root mean squared error (RMSE). Figure 6 showed the scatterplots between the estimated GUD, HD, and MD from the NDGI and the corresponding field measurements. The scatterplots for the other three VIs were shown in Supplementary Materials Figure S1.
It can be seen that the estimation of NDVI, EVI, NDPI, and NDGI yielded similar and satisfactory agreements with the field measurements. All the satellite-based phenological events of winter wheat were significantly correlated with the ground phenology records with p < 0.01 (Figure 6 and Supplementary Materials Figure S1). In detail, the GUDs were estimated with r, MAE, and RMSE around 0.75, 4.5 days, and 5.5 days, respectively (Table 1). The MAE and RMSE for the estimation of HD were lower than 6.0 and 7.5 days, respectively. The estimation of MD yielded the best performances with MAE and RMSE ranges of 2.9–3.3 and 3.6–4.2 days, respectively. Although the four VIs showed similar performances in the validation experiments, we only presented the analysis based on the estimation of NDGI hereafter (results for the other three VIs were provided in Supplementary Materials), due mainly to its simplicity for implementation and effectiveness for removing the influence of the snow effect.

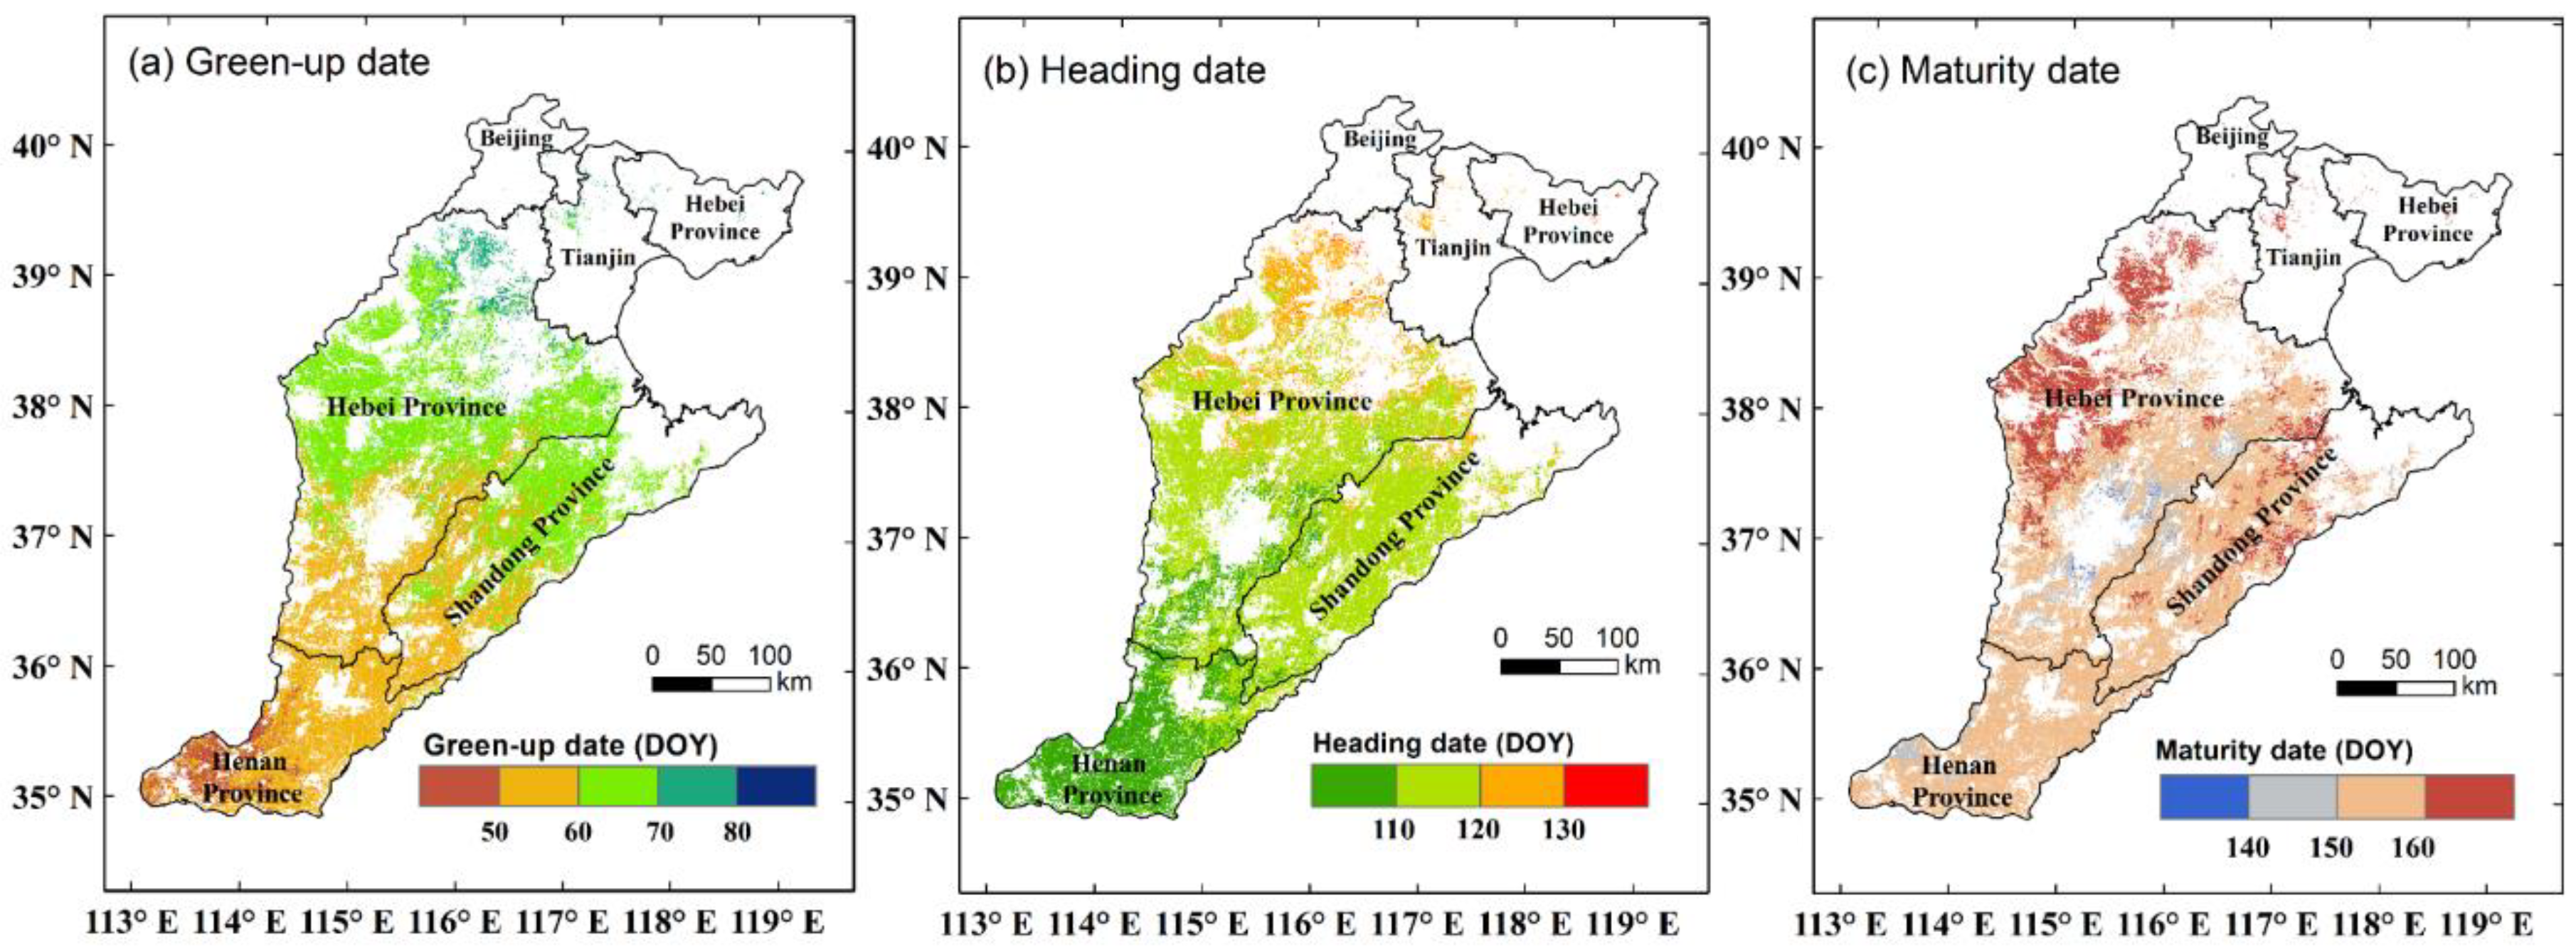
4.2.2. Spatial Distribution and Annual Changes of Winter Wheat Phenology

Figure 7 showed the spatial distribution of average phenological events during 2001–2018 for winter wheat derived from NDGI. Overall, the average GUD, HD, and MD of winter wheat showed a delayed pattern from the south to the north of the NCP. The average GUD occurred in mid-to-late February in the southern regions of the NCP, which was noticeably earlier than that in the northern regions (Figure 7a). The average HD in the southern regions generally occurred in early April, compared to that in northern regions, which occurred around early to middle May (Figure 7b). The MD was also found earlier in the southern regions than that in the northern regions (Figure 7c): it occurred in the southern regions in early June and in the northern regions during mid-to-late June. It should be noted that the results from NDVI and EVI, NDPI showed the same spatial patterns as NDGI (Supplementary Materials Figure S2).
Besides the spatial distributions, the inter-annual changing trends of GUD, HD, and MD for the whole NCP were also analyzed (Figure 8) by using the simple linear regression method, which has been widely used to analyze changing trends of phenological events [2,10,11]. It can be seen that GUD, HD, and MD of winter wheat presented as delayed, but not statistically significant (p > 0.1) trends during 2001–2018. Specifically, the winter wheat GUD had a change rate of 1.6 days/decade. Furthermore, the GUD in 2010 and 2012 occurred later than other years. The HD and MD presented a change rate of 0.5 days/decade and 1.5 days/decade, respectively. The HD and MD in 2010 occurred the latest during the study period. Additionally, the NDVI, EVI, and NDPI yielded similar results with NDGI, as shown in Supplementary Materials Figure S3.

4.2.3. Test of the Relationships between GUD and Climatic Factors

Figure 9 showed the partial correlation coefficient between winter wheat GUD derived from NDGI and the mean temperature from January to March and the cumulative precipitation from December to March. As shown in Figure 9a, the results showed that winter wheat GUD with 99.0% of the entire winter wheat area presented a negative correlation with temperature, and 84.2% presented a significant negative correlation. This implied that winter wheat GUD could advance with increases of the mean temperature from January to March. In contrast, winter wheat GUD with 85.6% of winter wheat pixels presented a negative correlation with cumulative precipitation from December to March, but only 21.4% presented a significant negative correlation (Figure 9b). Although it indicated that increased precipitation could cause the advance of winter wheat GUD, the temperature dominated the changes of winter wheat GUD. The other three vegetation indices also obtained similar results with NDGI (Supplementary Materials Figure S4). These results are comparable to the existing studies on the relationships between winter wheat GUD and climatic factors [2,11], which indicates the reasonability of the improved MODIS GUD derived in this study.

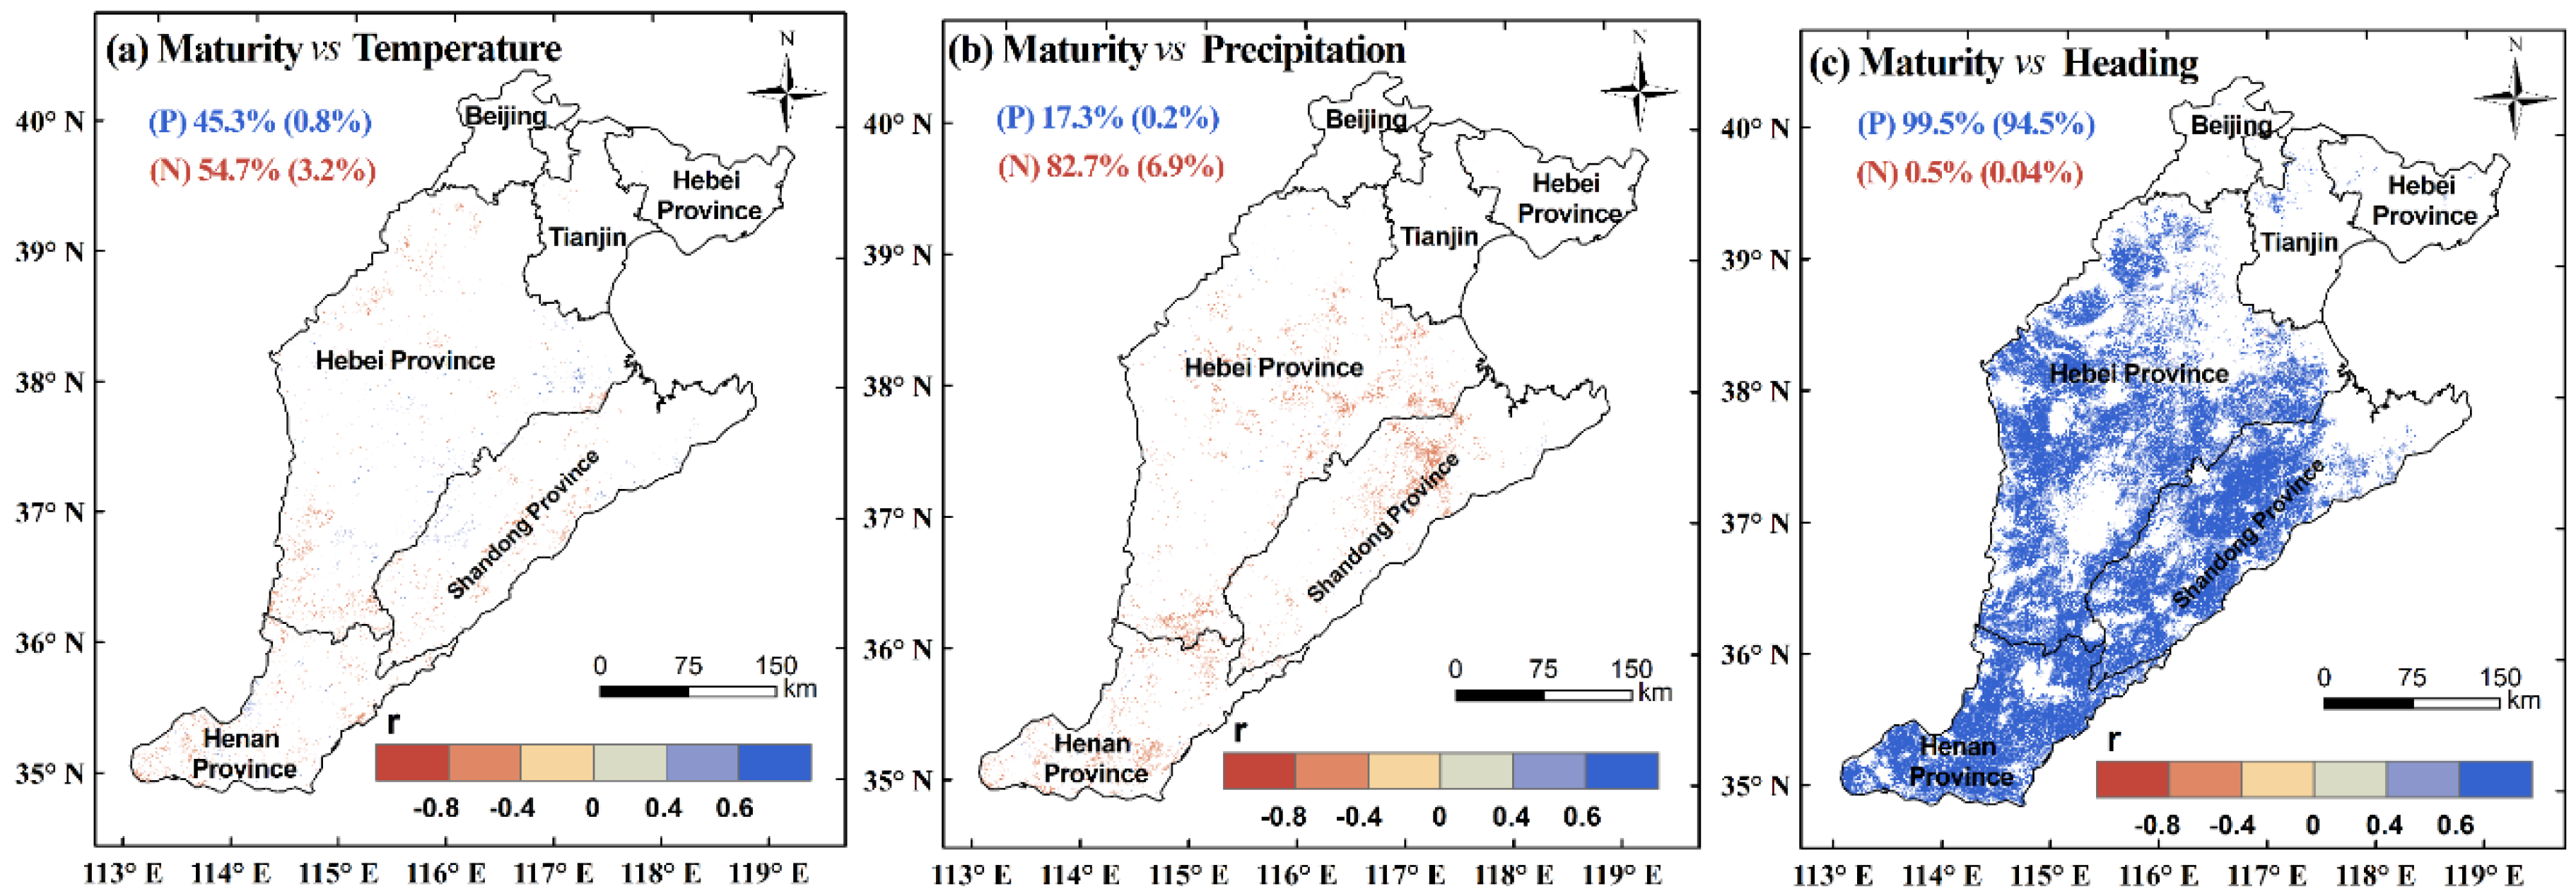
4.3. Phenological Interactions Observed from the Improved MODIS Estimation

4.3.1. Relationship between GUD and HD by Excluding the Influence of Climatic Factors

As shown in Figure 10c, the HD with 98.9% of all winter wheat pixels presented a positive correlation with winter wheat GUD, with 85.2% showing a significant positive correlation. In contrast, the results indicated that winter wheat HD with 88.6% of the entire winter wheat area presented a negative correlation with the mean temperature during March and April, but only 33.3% showed a significant negative correlation (Figure 10a). Moreover, as seen in Figure 10b, winter wheat HD with 68.8% of the entire winter wheat area presented a negative correlation with cumulative precipitation but only 1.8% showed a significant negative correlation. From the percentage of significant pixels, it was found that the HD was more influenced by the interactions with the GUD than by the pre-season temperature. The other three vegetation indices also presented similar results with that of NDGI (Supplementary Materials Figure S5).

4.3.2. Relationship between HD and MD by Excluding the Influence of Climatic Factors

As shown in Figure 11c, the MD with 99.5% of all winter wheat pixels presented a positive correlation with HD, with 94.5% showing a significant positive correlation. As shown in Figure 11a, the winter wheat MD with 54.7% of the entire winter wheat area presented a negative correlation with the mean temperature during April and May, and about 3.2% showed a significant negative correlation. MD with 45.3% of winter wheat pixels showed a positive correlation, but only 0.8% of the area presented a significant positive correlation. Figure 11b showed that MD with 82.7% of the entire winter wheat area presented a negative correlation with precipitation, and about 6.9% showed a significant negative correlation. From the percentage of significant pixels, it was found that winter wheat MD was also essentially dominated by the interactions with the HD. The other three vegetation indices also demonstrated similar results (Supplementary Materials Figure S6).

5. Discussion

5.1. Significance for Improving the Satellite Estimation of Winter Wheat Phenology

Crop phenology is strongly needed for crop mapping [43,44], crop yield predicting [45], process-based crop simulation models [46], and agricultural water management [6]. In these applications, it is essential to obtain an accurate satellite estimation of phenology showing no biases with field measurements. As for NCP, the water resource is the major limiting factor for wheat production. To facilitate the agricultural water management, water consumption for crops needs to be estimated accurately. This estimation is usually based on the Penman–Monteith equation and crop coefficient [6], which is determined from the different phenological stages of winter wheat. Therefore, phenological results that agree with ground observations are essentially needed to calculate crop water consumption, and to aid in the agricultural water management in different phenology stages. Moreover, crop phenology is an indispensable module of some process-based crop models (e.g., World Food Study (WOFOST), Crop Environment Resource Synthesis (CERES), and ORYZA models [47,48,49]). Specifically, accurate phenology is crucial for improving crop growth simulation, net carbon land-atmosphere exchanges, and yield prediction [50,51].
In this study, we applied an empirical relative threshold method (RTM) to improve the agreements between the MODIS estimation and field measurements of winter wheat GUD, HD, and MD. The evaluation results showed that these phenological events can be estimated with RMSEs and MAEs lower than 7 days, showing noticeably higher agreements than previous studies based on either the threshold of 20% or the maximum change rate method [1,2]. The improved performances can be attributed to (1) the high-quality of time series data derived from the STSG filter, (2) the flexibility of the RTM method in setting the thresholds for phenology extractions, and (3) the recalibration process based on field measurements of winter wheat phenology. It is worth noting that the threshold of 5% was used for the GUD estimation, which is reasonable for improving the agreements, because the previous studies using 20% showed significantly delayed estimates. Moreover, the changing trends of phenological events (i.e., Figure 8), as well as the relationships between GUD and climatic factors (Figure 9) were also comparable to the results in existing studies [2,10,11].

5.2. Implications of the Interactions among Phenological Events of Winter Wheat

It has long been recognized that vegetation phenology is strongly influenced by climatic factors [52,53,54]. The results of this study also demonstrated the importance of temperature in regulating winter wheat phenology (Figure 9 and Figure 10). Recently, it was reported that biological factors also contribute to the regulation of vegetation phenological processes [9], which are usually referred to the interactions among the phenological events. For example, it was found out that spring and autumn phenology were positively correlated in situ observations at the species level [55] and remote sensing-based phenology at the ecosystem level [13,14]. These findings were of great importance to the modeling of vegetation phenology to improve the predictions of phenological events as well as the understanding of the global carbon and nutrient balance [14].
In this study, we investigated the interactions among the phenological events in agricultural ecosystems (i.e., GUD, HD, and MD of winter wheat) for the first time. Our results indicated that the former and latter phenological events of winter wheat were positively correlated in both the field and satellite observations. The mechanisms for explaining the interaction effects of winter wheat phenology (i.e., an earlier GUD/HD was significantly associated with an earlier HD/MD) may be attributed to direct biological and indirect environmental factors. The first biological mechanism might be attributed to the issue that the leaf traits may constrain the leaf life span [56]. Second, it was also hypothesized that a carbon sink limitation could be induced by an earlier spring, because carbohydrate reserves achieve the maximum carbon earlier [12,57]. Last, the indirect environmental factors include the increased risk of drought with an earlier spring and a related increase of suffering from the spring frost [58]. However, further studies are still needed to thoroughly understand the mechanisms.
The findings of phenological interactions of winter wheat derived in this study implied that both climatic factors and interaction effects should be considered in the future modeling of winter wheat phenology under climate warming. As pointed out by Keenan et al. [13], the existing phenology models had over-predicted future increases of the length of the growing season due mainly to the sole driver of climatic factors. For winter wheat, this over-prediction may cause the subsequent effects on the modeling of water consumption and yield. Therefore, phenological interactions had an important effect on the modeling of predicting phenology in agricultural ecosystems.

5.3. Issues that Need to Be Further Addressed

There are several issues that may need to be further addressed to strengthen the analysis of this study. First, the actual latitudes and longitudes for the field observations of winter wheat phenology are still unavailable. Accordingly, we proposed a searching and screening strategy to obtain the ‘most possible’ matched-up satellite data in this study, and the validation results showed satisfactory improvements over previous studies. Nevertheless, it is still necessary to seek the accurate locations of the measurements in the future to further ascertain the reliability of the results.
Second, the annual distribution maps of winter wheat are not available for the 2001–2018 time period in the NCP. In this study, we detected unchanged winter wheat pixels for long-term analysis based on the combination of a 10 m resolution winter wheat map in 2017 [35] and the MODIS land cover product [59]. Even though we did not generate the distribution changes of winter wheat directly, this is a noticeable improvement over previous studies, which only used the cropland map [2,11] or the winter wheat map of one year [1] to analyze winter wheat phenology. By doing so, the pixels in the non-wheat region were also possibly used for the analysis of winter wheat phenology metrics in some previous studies. For example, cotton planted in the central and eastern regions of Hebei province (the red rectangular area in Figure 12) [60], has been widely treated as winter wheat for the phenology analysis [2,11]. Although the winter wheat dominated pixels can be effectively detected through the method we used in this study, some of the winter wheat might be lost due to the critical criterion for the screening. In the future, the generation of reliable annual distribution maps of winter wheat is needed to solve this problem.
Last, as for the RTM used in this study, the specific thresholds for extracting the GUD, HD, and MD were empirically determined for the winter wheat at the NCP. However, we do not expect that these thresholds are generically applicable for winter wheat at other regions beyond the NCP. More extensive calibrations and validations are still needed for future studies.

6. Conclusions

In this study, we re-calibrated a relative threshold method (RTM) to improve the agreements between the MODIS-based estimation and field measurements of winter wheat phenology in the North China Plain (NCP). The thresholds of 5%, 95%, and 30% of the seasonal amplitude of vegetation indices (VIs) were used to extract the green-up date (GUD), heading date (HD), and maturity date (MD) of winter wheat, respectively. Validation results showed that the GUD, HD, and MD can be accurately estimated with the mean absolute error (MAE) and root mean squared error (RMSE) ranging from 2.9 to 7.5 days. Furthermore, the relationships among the GUD, HD, and MD were first analyzed using the field measurements of winter wheat phenology. It was found that the GUD (HD) was positively correlated with the HD (MD) with correlation coefficient higher than 0.80. Quantitatively, a one-day earlier GUD (HD) would result in an earlier HD (MD) of 0.57 days (0.60 days). Partial correlation analysis was then applied to the improved MODIS estimation of GUD, HD, and MD to investigate the phenological interactions by separating the influences from climatic factors (i.e., temperature and precipitation). The results showed that the GUD with 84.2% of the entire winter wheat area presented a significantly negative correlation with pre-season temperature. The HD with 85.2% of all winter wheat pixels presented a significantly positive correlation with the GUD, and only 33.3% of the entire winter wheat area presented a significantly negative correlation with temperature. Finally, the MD with 94.5% of all winter wheat pixels presented a significantly positive correlation with the HD, but almost no correlation with climate. These results suggest that both the climatic factors and phenological interactions should be included in the models of winter wheat phenology to improve the prediction accuracies.

Supplementary Materials

The following are available online at https://www.mdpi.com/2072-4292/11/24/2976/s1. Figure S1: Comparison between satellite-based winter wheat phenology and ground observations; Figure S2: Average spatial pattern of winter wheat phenological events derived from NDVI, EVI and NDPI during 2001–2018; Figure S3: Inter-annual trend of satellite-based green-up date, heading date and maturity date derived from NDVI, EVI, and NDPI during 2001–2018; Figure S4: Partial correlation coefficient between green-up date of winter wheat derived from NDVI (a,b), EVI (c,d) and NDPI (e,f) and the mean temperature from January to March and the cumulative precipitation from December to March; Figure S5: Partial correlation coefficient between heading date of winter wheat derived from NDVI (a–c), EVI (d–f), NDPI (g–i) and the mean temperature, the cumulative precipitation during March and April and green-up date of winter wheat; Figure S6: Partial correlation coefficient between maturity date of winter wheat derived from NDVI (a–c), EVI (d–f), NDPI (g–i) and the mean temperature and the cumulative precipitation during April and May, green-up date of winter wheat; Figure S7: An example of the calculated fitted coefficients through sixth- degree polynomial function ( y   =   p 0 + p 1 x +   p 2 x 2 + p 3 x 3 + + p 6 x 6 ) based on time series of STSG NDGI in 2013.

Author Contributions

W.Y. and X.W. conceived the idea and designed the research. X.W. collected data, conducted the experiments, and drafted the initial manuscript. W.Y. also contributed to the discussions of the results and the revision of the manuscript. C.W. contributed to data processing. Y.S. and A.K. gave valuable suggestions to improve the manuscript.

Funding

This research is funded by the China Scholarship Council under no. 201508130061 and no. 201708410299 and the Ministry of Education, Culture, Sports, Science, and Technology (MEXT), JAXA Second Research Announcement on the Earth Observations (GCOM-C no. 106), as well as a JSPS Grant-Aid for Scientific Research (C) no. 17K00540.

Acknowledgments

The authors are thankful to Zhiyan Liu, Yuki Sofue, and Mengyu Li for their help and advice on the data processing. The authors would also like to express their thanks for anonymous reviewers and the editor for comments that improved this manuscript.

Conflicts of Interest

The authors declare no conflict of interest.

Appendix A

Figure A1. Distribution map of winter wheat, non-wheat vegetation, non-vegetation of the NCP in 2017 derived from Wang et al. [35].
Remotesensing 11 02976 g0a1

References

  1. Ren, S.; Qin, Q.; Ren, H. Contrasting wheat phenological responses to climate change in global scale. Sci. Total Environ. 2019, 665, 620–631. [Google Scholar] [CrossRef] [PubMed]
  2. Wang, S.; Mo, X.; Liu, Z.; Baig, M.H.A.; Chi, W. Understanding long-term (1982–2013) patterns and trends in winter wheat spring green-up date over the North China Plain. Int. J. Appl. Earth Obs. Geoinf. 2017, 57, 235–244. [Google Scholar] [CrossRef]
  3. Chen, J.; Tang, C.; Shen, Y.; Sakura, Y.; Kondoh, A.; Shimada, J. Use of water balance calculation and tritium to examine the dropdown of groundwater table in the piedmont of the North China Plain (NCP). Environ. Geol. 2003, 44, 564–571. [Google Scholar] [CrossRef]
  4. Sun, H.; Liu, C.; Zhang, X.; Shen, Y.; Zhang, Y. Effects of irrigation on water balance, yield and WUE of winter wheat in the North China Plain. Agric. Water Manag. 2006, 85, 211–218. [Google Scholar] [CrossRef]
  5. Ruml, M.; Vulić, T. Importance of phenological observations and predictions in agriculture. J. Agric. Sci. 2005, 50, 217–225. [Google Scholar] [CrossRef]
  6. Allen, R.G.; Pereira, L.S.; Raes, D.; Smith, M. Crop evapotranspiration-Guidelines for computing crop water requirements-FAO Irrigation and drainage paper 56. FAO Rome 1998, 300, D05109. [Google Scholar]
  7. Liu, Q.; Piao, S.; Fu, Y.H.; Gao, M.; Peñuelas, J.; Janssens, I.A. Climatic warming increases spatial synchrony in spring vegetation phenology across the Northern Hemisphere. Geophys. Res. Lett. 2019, 46, 1641–1650. [Google Scholar] [CrossRef] [Green Version]
  8. Keenan, T.; Baker, I.; Barr, A.; Ciais, P.; Davis, K.; Dietze, M.; Dragoni, D.; Gough, C.M.; Grant, R.; Hollinger, D. Terrestrial biosphere model performance for inter-annual variability of land-atmosphere CO2 exchange. Glob. Chang. Biol. 2012, 18, 1971–1987. [Google Scholar] [CrossRef]
  9. Piao, S.; Liu, Q.; Chen, A.; Janssens, I.A.; Fu, Y.; Dai, J.; Liu, L.; Lian, X.; Shen, M.; Zhu, X. Plant phenology and global climate change: Current progresses and challenges. Glob. Chang. Biol. 2019, 25, 1922–1940. [Google Scholar] [CrossRef]
  10. Guo, L.; Gao, J.; Hao, C.; Zhang, L.; Wu, S.; Xiao, X. Winter Wheat Green-up Date Variation and its Diverse Response on the Hydrothermal Conditions over the North China Plain, Using MODIS Time-Series Data. Remote Sens. 2019, 11, 1593. [Google Scholar] [CrossRef] [Green Version]
  11. Liu, Z.; Wu, C.; Liu, Y.; Wang, X.; Fang, B.; Yuan, W.; Ge, Q. Spring green-up date derived from GIMMS3g and SPOT-VGT NDVI of winter wheat cropland in the North China Plain. ISPRS J. Photogramm. Remote Sens. 2017, 130, 81–91. [Google Scholar] [CrossRef]
  12. Fu, Y.S.; Campioli, M.; Vitasse, Y.; De Boeck, H.J.; Van den Berge, J.; AbdElgawad, H.; Asard, H.; Piao, S.; Deckmyn, G.; Janssens, I.A. Variation in leaf flushing date influences autumnal senescence and next year’s flushing date in two temperate tree species. Proc. Natl. Acad. Sci. USA 2014, 111, 7355–7360. [Google Scholar] [CrossRef] [PubMed] [Green Version]
  13. Keenan, T.F.; Richardson, A.D. The timing of autumn senescence is affected by the timing of spring phenology: Implications for predictive models. Glob. Chang. Biol. 2015, 21, 2634–2641. [Google Scholar] [CrossRef] [PubMed] [Green Version]
  14. Liu, Q.; Fu, Y.H.; Zhu, Z.; Liu, Y.; Liu, Z.; Huang, M.; Janssens, I.A.; Piao, S. Delayed autumn phenology in the Northern Hemisphere is related to change in both climate and spring phenology. Glob. Chang. Biol. 2016, 22, 3702–3711. [Google Scholar] [CrossRef] [PubMed]
  15. Guo, L.; An, N.; Wang, K. Reconciling the discrepancy in ground-and satellite-observed trends in the spring phenology of winter wheat in China from 1993 to 2008. J. Geophys. Res. Atmos. 2016, 121, 1027–1042. [Google Scholar] [CrossRef] [Green Version]
  16. Tao, F.; Zhang, S.; Zhang, Z. Spatiotemporal changes of wheat phenology in China under the effects of temperature, day length and cultivar thermal characteristics. Eur. J. Agron. 2012, 43, 201–212. [Google Scholar] [CrossRef]
  17. Xiao, D.; Tao, F.; Liu, Y.; Shi, W.; Wang, M.; Liu, F.; Zhang, S.; Zhu, Z. Observed changes in winter wheat phenology in the North China Plain for 1981–2009. Int. J. Biometeorol. 2013, 57, 275–285. [Google Scholar] [CrossRef]
  18. Liu, Y.; Chen, Q.; Ge, Q.; Dai, J.; Qin, Y.; Dai, L.; Zou, X.; Chen, J. Modelling the impacts of climate change and crop management on phenological trends of spring and winter wheat in China. Agric. For. Meteorol. 2018, 248, 518–526. [Google Scholar] [CrossRef]
  19. Hmimina, G.; Dufrêne, E.; Pontailler, J.Y.; Delpierre, N.; Aubinet, M.; Caquet, B.; De Grandcourt, A.; Burban, B.; Flechard, C.; Granier, A. Evaluation of the potential of MODIS satellite data to predict vegetation phenology in different biomes: An investigation using ground-based NDVI measurements. Remote Sens. Environ. 2013, 132, 145–158. [Google Scholar] [CrossRef]
  20. Zhao, J.; Zhang, H.; Zhang, Z.; Guo, X.; Li, X.; Chen, C. Spatial and temporal changes in vegetation phenology at middle and high latitudes of the Northern Hemisphere over the past three decades. Remote Sens. 2015, 7, 10973–10995. [Google Scholar] [CrossRef] [Green Version]
  21. Luo, Z.; Yu, S. Spatiotemporal variability of land surface phenology in China from 2001–2014. Remote Sens. 2017, 9, 65. [Google Scholar] [CrossRef] [Green Version]
  22. Jeganathan, C.; Dash, J.; Atkinson, P.M. Characterising the spatial pattern of phenology for the tropical vegetation of India using multi-temporal MERIS chlorophyll data. Landsc. Ecol. 2010, 25, 1125–1141. [Google Scholar] [CrossRef]
  23. Tucker, C.J. Red and photographic infrared linear combinations for monitoring vegetation. Remote Sens. Environ. 1979, 8, 127–150. [Google Scholar] [CrossRef] [Green Version]
  24. Huete, A.; Didan, K.; Miura, T.; Rodriguez, E.P.; Gao, X.; Ferreira, L.G. Overview of the radiometric and biophysical performance of the MODIS vegetation indices. Remote Sens. Environ. 2002, 83, 195–213. [Google Scholar] [CrossRef]
  25. Delbart, N.; Kergoat, L.; Le Toan, T.; Lhermitte, J.; Picard, G. Determination of phenological dates in boreal regions using normalized difference water index. Remote Sens. Environ. 2005, 97, 26–38. [Google Scholar] [CrossRef] [Green Version]
  26. Yang, W.; Kobayashi, H.; Wang, C.; Shen, M.; Chen, J.; Matsushita, B.; Tang, Y.; Kim, Y.; Bret-Harte, M.S.; Zona, D. A semi-analytical snow-free vegetation index for improving estimation of plant phenology in tundra and grassland ecosystems. Remote Sens. Environ. 2019, 228, 31–44. [Google Scholar] [CrossRef]
  27. Wang, C.; Chen, J.; Wu, J.; Tang, Y.; Shi, P.; Black, T.A.; Zhu, K. A snow-free vegetation index for improved monitoring of vegetation spring green-up date in deciduous ecosystems. Remote Sens. Environ. 2017, 196, 1–12. [Google Scholar] [CrossRef]
  28. Lu, L.; Wang, C.; Guo, H.; Li, Q. Detecting winter wheat phenology with SPOT-VEGETATION data in the North China Plain. Geocarto Int. 2014, 29, 244–255. [Google Scholar] [CrossRef]
  29. Cao, G.; Zheng, C.; Scanlon, B.R.; Liu, J.; Li, W. Use of flow modeling to assess sustainability of groundwater resources in the North China Plain. Water Resour. Res. 2013, 49, 159–175. [Google Scholar] [CrossRef]
  30. Pei, H.; Scanlon, B.R.; Shen, Y.; Reedy, R.C.; Long, D.; Liu, C. Impacts of varying agricultural intensification on crop yield and groundwater resources: Comparison of the North China Plain and US High Plains. Environ. Res. Lett. 2015, 10, 044013. [Google Scholar] [CrossRef] [Green Version]
  31. Zhang, X.; Qin, W.; Chen, S.; Shao, L.; Sun, H. Responses of yield and WUE of winter wheat to water stress during the past three decades—a case study in the North China Plain. Agric. Water Manag. 2017, 179, 47–54. [Google Scholar] [CrossRef]
  32. Wu, X.; Qi, Y.; Shen, Y.; Yang, W.; Zhang, Y.; Kondoh, A. Change of winter wheat planting area and its impacts on groundwater depletion in the North China Plain. J. Geogr. Sci. 2019, 29, 891–908. [Google Scholar] [CrossRef] [Green Version]
  33. Vermote, E. MOD09A1 MODIS/Terra Surface Reflectance 8-Day L3 Global 500m SIN Grid V006; NASA EOSDIS Land Processes DAAC: Sioux Falls, SD, USA, 2015; Volume 10.
  34. Friedl, M.; Sulla-Menashe, D. ORYZA2000: Modeling Lowland Rice [Data Set]; NASA EOSDIS Land Processes DAAC: Sioux Falls, SD, USA, 2015; Volume 10.
  35. Wang, C.; Yang, W.; Wu, X.; Chen, Z.; Lu, J.; Zhao, Z.; Zhang, H. Classification of Winter Wheat using high spatial resolution data in North China Plain. In Proceedings of the Japan Geoscience Union Meeting, Makuhari Messa, Chiba, Japan, 26 May 2019. [Google Scholar]
  36. China Meteorological Administration. Observation Criterion of Agricultural Meteorology; Meteorological Press: Beijing, China, 1993. [Google Scholar]
  37. White, M.A.; Thornton, P.E.; Running, S.W. A continental phenology model for monitoring vegetation responses to interannual climatic variability. Glob. Biogeochem. Cycles 1997, 11, 217–234. [Google Scholar] [CrossRef]
  38. Cong, N.; Wang, T.; Nan, H.; Ma, Y.; Wang, X.; Myneni, R.B.; Piao, S. Changes in satellite-derived spring vegetation green-up date and its linkage to climate in China from 1982 to 2010: A multimethod analysis. Glob. Chang. Biol. 2013, 19, 881–891. [Google Scholar] [CrossRef] [PubMed]
  39. Cong, N.; Piao, S.; Chen, A.; Wang, X.; Lin, X.; Chen, S.; Han, S.; Zhou, G.; Zhang, X. Spring vegetation green-up date in China inferred from SPOT NDVI data: A multiple model analysis. Agric. For. Meteorol. 2012, 165, 104–113. [Google Scholar] [CrossRef]
  40. Jeong, S.J.; HO, C.H.; GIM, H.J.; Brown, M.E. Phenology shifts at start vs. end of growing season in temperate vegetation over the Northern Hemisphere for the period 1982–2008. Glob. Chang. Biol. 2011, 17, 2385–2399. [Google Scholar] [CrossRef]
  41. Yang, Y.; Guan, H.; Shen, M.; Liang, W.; Jiang, L. Changes in autumn vegetation dormancy onset date and the climate controls across temperate ecosystems in China from 1982 to 2010. Glob. Chang. Biol. 2015, 21, 652–665. [Google Scholar] [CrossRef]
  42. Cao, R.; Chen, Y.; Shen, M.; Chen, J.; Zhou, J.; Wang, C.; Yang, W. A simple method to improve the quality of NDVI time-series data by integrating spatiotemporal information with the Savitzky-Golay filter. Remote Sens. Environ. 2018, 217, 244–257. [Google Scholar] [CrossRef]
  43. Pan, Y.; Li, L.; Zhang, J.; Liang, S.; Zhu, X.; Sulla-Menashe, D. Winter wheat area estimation from MODIS-EVI time series data using the Crop Proportion Phenology Index. Remote Sens. Environ. 2012, 119, 232–242. [Google Scholar] [CrossRef]
  44. Xiao, X.; Boles, S.; Frolking, S.; Li, C.; Babu, J.Y.; Salas, W.; Moore, B., III. Mapping paddy rice agriculture in South and Southeast Asia using multi-temporal MODIS images. Remote Sens. Environ. 2006, 100, 95–113. [Google Scholar] [CrossRef]
  45. Bolton, D.K.; Friedl, M.A. Forecasting crop yield using remotely sensed vegetation indices and crop phenology metrics. Agric. For. Meteorol. 2013, 173, 74–84. [Google Scholar] [CrossRef]
  46. Doraiswamy, P.; Hatfield, J.; Jackson, T.; Akhmedov, B.; Prueger, J.; Stern, A. Crop condition and yield simulations using Landsat and MODIS. Remote Sens. Environ. 2004, 92, 548–559. [Google Scholar] [CrossRef]
  47. Heulen, H.v.; Van Diepen, C. Crop growth models and agro-ecological characterization. In Proceedings of the First Congress of the European Society of Agronomy, European Society of Agronomy, Paris, France, 5–7 December 1990. [Google Scholar]
  48. Otter-Nacke, S.; Ritchie, J.; Godwin, D.; Singh, U. A User’s Guide to CERES Barley—V2. 10; Simulation Manual IFDC-SM-3; International Fertilizer Development Center: Muscle Shoals, AL, USA, 1991. [Google Scholar]
  49. Bouman, B.A.M.; Kropff, M.J.; Tuong, T.P.; Wopereis, M.C.S.; Ten Berge, H.F.M.; Van Laar, H.H. ORYZA2000: Modeling Lowland Rice; IRRI: Manila, Philippines, 2001. [Google Scholar]
  50. Zhou, G.; Liu, X.; Liu, M. Assimilating Remote Sensing Phenological Information into the WOFOST Model for Rice Growth Simulation. Remote Sens. 2019, 11, 268. [Google Scholar] [CrossRef] [Green Version]
  51. Chen, Y.; Zhang, Z.; Tao, F. Improving regional winter wheat yield estimation through assimilation of phenology and leaf area index from remote sensing data. Eur. J. Agron. 2018, 101, 163–173. [Google Scholar] [CrossRef]
  52. Fitter, A.; Fitter, R.; Harris, I.; Williamson, M. Relationships between first flowering date and temperature in the flora of a locality in central England. Funct. Ecol. 1995, 9, 55–60. [Google Scholar] [CrossRef]
  53. Chmielewski, F.M.; Rötzer, T. Response of tree phenology to climate change across Europe. Agric. For. Meteorol. 2001, 108, 101–112. [Google Scholar] [CrossRef]
  54. Zhang, X.; Friedl, M.A.; Schaaf, C.B.; Strahler, A.H. Climate controls on vegetation phenological patterns in northern mid-and high latitudes inferred from MODIS data. Glob. Chang. Biol. 2004, 10, 1133–1145. [Google Scholar] [CrossRef]
  55. Fu, Y.H.; Piao, S.; Op de Beeck, M.; Cong, N.; Zhao, H.; Zhang, Y.; Menzel, A.; Janssens, I.A. Recent spring phenology shifts in western Central Europe based on multiscale observations. Glob. Ecol. Biogeogr. 2014, 23, 1255–1263. [Google Scholar] [CrossRef]
  56. Reich, P.B.; Walters, M.B.; Ellsworth, D.S. Leaf life-span in relation to leaf, plant, and stand characteristics among diverse ecosystems. Ecol. Monogr. 1992, 62, 365–392. [Google Scholar] [CrossRef]
  57. Fatichi, S.; Leuzinger, S.; Körner, C. Moving beyond photosynthesis: From carbon source to sink-driven vegetation modeling. New Phytol. 2014, 201, 1086–1095. [Google Scholar] [CrossRef]
  58. Hufkens, K.; Friedl, M.A.; Keenan, T.F.; Sonnentag, O.; Bailey, A.; O’Keefe, J.; Richardson, A.D. Ecological impacts of a widespread frost event following early spring leaf-out. Glob. Chang. Biol. 2012, 18, 2365–2377. [Google Scholar] [CrossRef]
  59. Sulla-Menashe, D.; Friedl, M.A. User Guide to Collection 6 MODIS Land Cover (MCD12Q1) Product; NASA EOSDIS Land Processes DAAC: Sioux Falls, SD, USA, 2018.
  60. Mingwei, Z.; Qingbo, Z.; Zhongxin, C.; Jia, L.; Yong, Z.; Chongfa, C. Crop discrimination in Northern China with double cropping systems using Fourier analysis of time-series MODIS data. Int. J. Appl. Earth Obs. Geoinf. 2008, 10, 476–485. [Google Scholar] [CrossRef]
Figure 1. Digital elevation model (DEM) of the North China Plain (NCP) and spatial distribution of meteorological stations and agricultural meteorological stations.
Remotesensing 11 02976 g001
Figure 2. Flowchart for analyzing the MODIS-based phenological interactions of winter wheat. fc,wheat refers to the fraction of winter wheat; fc,wheatfc,non-wheat refers to the difference between the fractions of winter wheat and non-wheat vegetation.
Remotesensing 11 02976 g002
Figure 3. An example showing the improved estimation of winter wheat phenology based on the relative threshold method (RTM) at each step. NDGI is normalized difference greenness index; STSG is Spatial-Temporal Savitzky-Golay; DOY is day of year.
Remotesensing 11 02976 g003
Figure 4. Flow diagram for determining stations for comparing with ground observed phenology.
Remotesensing 11 02976 g004
Figure 5. Interactions among ground observed phenology of winter wheat. (a) The relationship between anomaly of green-up date (GUD) and anomaly of heading date (HD). (b) The relationship between anomaly of heading date (HD) and anomaly of maturity date (MD).
Remotesensing 11 02976 g005
Figure 6. Comparison between NDGI-based estimation and ground observations of (a) green-up date (GUD), (b) heading date (HD), (c) maturity date (MD) of winter wheat in the NCP.
Remotesensing 11 02976 g006
Figure 7. Spatial distribution of winter wheat phenology averaged during 2001–2018 derived from NDGI. (ac) refer to the green-up date (GUD), heading date (HD), and maturity date (MD), respectively.
Remotesensing 11 02976 g007
Figure 8. Inter-annual changing trends of satellite estimation of green-up date (GUD), heading date (HD), and maturity date (MD) of winter wheat derived from NDGI during 2001–2018. Trend analyses of winter wheat GUD, HD, and MD were implemented by using a simple linear regression method.
Remotesensing 11 02976 g008aRemotesensing 11 02976 g008b
Figure 9. Partial correlation coefficient between Green-up Date (GUD) of winter wheat and the mean temperature from January to March (a) and the cumulative precipitation from December to March (b). Colored regions indicate the detected correlation that was significant with p < 0.05. “P” and “N” refer to the positive and negative correlation, respectively.
Remotesensing 11 02976 g009
Figure 10. Partial correlation coefficient between Heading Date (HD) of winter wheat and the mean temperature (a), cumulative precipitation (b) during March and April and green-up date (GUD) of winter wheat (c). Colored regions indicate the detected correlation that was significant with p < 0.05. “P” and “N” refer to the positive and negative correlation, respectively.
Remotesensing 11 02976 g010
Figure 11. Partial correlation coefficient between Maturity Date (MD) of winter wheat and the mean temperature (a), the cumulative precipitation (b) during April and May, heading date (HD) of winter wheat (c). Colored regions indicate the detected correlation that was significant with p < 0.05. ‘P’ and ‘N’ refer to the positive and negative correlation, respectively.
Remotesensing 11 02976 g011
Figure 12. Winter wheat map used for trend analysis of phenological events of winter wheat.
Remotesensing 11 02976 g012
Table 1. Comparison among accuracy indices for phenological events of winter wheat estimated from NDVI, EVI, NDPI, and NDGI.
Phenological EventsAccuracy IndicesNDVIEVINDPINDGI
GUDr0.710.740.770.75
MAE4.64.54.14.3
RMSE6.15.85.35.6
HDr0.860.860.870.86
MAE564.74.6
RMSE6.27.55.95.9
MDr0.610.650.620.6
MAE2.93.32.93
RMSE3.74.23.63.9

