Long-Term Dynamic of Poyang Lake Surface Water: A Mapping Work Based on the Google Earth Engine Cloud Platform


1
Ministry of Education, Key Laboratory of Biodiversity Science and Ecological Engineering, Institute of Biodiversity Science, Fudan University, Shanghai 200433, China
2
Department of Microbiology and Plant Biology, Center for Spatial Analysis, University of Oklahoma, Norman, OK 73019, USA
*
Authors to whom correspondence should be addressed.
Remote Sens. 2019, 11(3), 313; https://doi.org/10.3390/rs11030313
Submission received: 20 December 2018
/
Revised: 1 February 2019
/
Accepted: 2 February 2019
/
Published: 5 February 2019
(This article belongs to the Special Issue Remote Sensing and Modeling of Land Surface Water)
Abstract
:In recent years, the shrinkage of Poyang Lake, the largest freshwater lake in China, has raised concerns for society. The regulation of the Three Gorges Dam (TGD) has been argued to be a cause of the depletion of the lake by previous studies. However, over the past few decades, the lake’s surface water dynamic has remained poorly characterized, especially before the regulation of the TGD (2003). By calculating the inundation frequency with an index- and pixel-based water detection algorithm on Google Earth Engine (GEE), this study explored the spatial–temporal variation of the lake during 1988–2016 and compared the differences in Poyang Lake’s water body between the pre- and post-TGD periods. The year-long water body area of the lake has shown a significant decreasing trend over the past 29 years and has shifted to a smaller regime since 2006. The inundation frequency of the lake has also generally decreased since 2003, particularly at the central part of the lake, and the effects of this trend have been most severe in the spring and autumn seasons. The lake’s area has shown significant correlation with the precipitation of the Poyang Lake Basin on an inner-annual scale. The drivers of and relevant factors relating to the inter-annual variation of the lake’s surface water should be further investigated in the future.

1. Introduction
Lakes are valuable water resources for human beings. They are major wetland components of the landscape of the earth and indispensable components of global biogeochemical and hydrological cycles. Lakes play irreplaceable roles in ecological systems, regulating regional climates and controlling floods [1,2]. Severe fluctuations in the inundation patterns of a lake are directly connected to the wellbeing of the local people, because floods and droughts are both extremely devastating natural disasters, leading to great economic loss and even human casualties. Lake inundation patterns also signal the status of other regional hydrological features (e.g., water levels [3] and terrestrial water storage [4]), which could be crucial to ensuring sustainable local water use [5] and ecological and environmental security [6]. Great efforts have been made to develop surface water maps for lakes, both regionally and globally (e.g., the Global Water Bodies database (GLOWABO) [7]), which constitute important parts of wetland inventories [8].
Over the past few decades, with 30-m fine resolution, free access, and global coverage, Landsat satellite images have been used in studies related to long-term surface water mapping and analysis [9,10,11]. Traditionally, the first step of mapping is to visually select qualified (typically cloud-free) Landsat images (temporal resolution: 16 days). Having to remove unqualified images could seriously compromise the integrity and continuity of the time series data of the water body area, making it difficult to capture the seasonal variation of lake inundation patterns. One solution is to map the extent of the lake water during a specified period, generally the wet season, in successive years (see e.g., [12,13]), but such analysis ignores uncertainties in the seasonal variation of lake inundation patterns. The cloud-based high-performance computing platform Google Earth Engine (GEE) increases the utilization efficiency of satellite data (i.e., enables pixel-based algorithms to process massive amounts of images) [14]. On GEE, good observations from cloud-contaminated images can also be included in the analysis, even though this information tends to be excluded from the pre-processing of traditional satellite images. GEE supports many large-scale geoscientific studies including forest cover mapping, wetland mapping, urban land cover mapping, soil moisture mapping, etc. [15]. The high-resolution analysis of changes in surface water has been undertaken on a global scale by processing three million Landsat images on GEE [9,16]. On the regional scale, to our knowledge, a few studies have explored lake mapping techniques on GEE [17,18], but the long-term analysis on both the change process and causes of lake surface water has been rarely explored using the GEE platform. The platform provides us with a good opportunity to obtain more insight into the long-term changes in the surface water of lakes.
Here, we chose Poyang Lake, the largest freshwater lake in China and a research hotspot, to be the object of this study. Many researchers have identified a pattern of shrinkage (or a regime shift) of the lake over the last few decades. While some researchers have attributed these changes to the operation of the Three Gorges Dam (TGD) since 2003 [19,20,21,22], some studies have indicated that reduced precipitation is, in fact, the principal reason for the lake’s shrinkage instead of the regulation of the TGD [23,24,25,26,27,28]. Some researchers have emphasized the negative impact of sand mining activities since 2000 [29,30]. Moreover, there exists contradictory evidence suggesting that the lake’s area has actually increased since 2002 [28]. Although Moderate Resolution Imaging Spectroradiometer (MODIS) data have been used frequently in monitoring the surface water of Poyang Lake (e.g., [24]), such data are insufficient for a long-term comprehensive study because of the MODIS data’s coarse spatial resolution and lack of baseline information from before 2000. While Landsat data could provide more baseline information from before 2003, the existing long-term water monitoring studies of this lake still have not made full use of such data. In previous studies of the monitoring of the surface water of Poyang Lake by Landsat datasets, visually selecting cloud-free images compromised the quality and continuity of the time series data of the lake area, with the selected images numbering 0.27–5.08/year [20,28,31]. For example, Han et al. analyzed the inter-annual variation of Poyang Lake’s winter water body areas between 1973 and 2013 with 11 Landsat images (0.27/year on average) [31]. Taking full advantage of Landsat data via pixel-based image processing algorithms on GEE could help us better explore the changing patterns of the surface water of Poyang Lake over the past few decades. This study aims to provide a comprehensive analysis of the inundation frequency and area dynamic of the surface water of Poyang Lake during 1988–2016 by doing the following:
- Mapping and exploring the spatial–temporal variation of the surface water of Poyang Lake during the last few decades on GEE;
- Making a comparison of the lake’s surface water between the pre-TGD (1988–2002) and post-TGD (2003–2016) periods;
- Analyzing the precipitation influence on the variation of the lake’s surface water body area.
2. Materials and Methods
2.1. Study Area
Poyang Lake (28°22′N–29°45′N, 115°47′E–116°45′E) is located in the northern Poyang Lake Basin, about 910 km downstream from the TGD [32]. It is the largest freshwater lake in China, with a lakeshore length of about 1200 km and a water body area that fluctuates widely from around 1000 to 3000 km2 [24]. The area of Poyang Lake Basin is 16.22 × 10⁴ km2, making up 9% of the area of the Yangtze River Basin. Poyang Lake is one of the world’s most important wetlands according to the United Nations (UN) [5,33,34] and one of the last six natural river-connected lake regions in the middle and lower reaches of the Yangtze River (MLRY) [26]. The highly fluctuating hydrologic regime has shaped the abundant biodiversity in the Poyang Lake wetlands and has made the area an indispensable stopover site for winter birds on the East Asian–Australasian Flyway, creating a valuable ecosystem that benefits human wellbeing and the diverse wildlife [35]. The inundation pattern of Poyang Lake is largely decided by the inflows of five rivers (Xiushui, Ganjiang, Fuhe, Xinjiang, and Raohe) from the Poyang Lake Basin and the outflow interacting with the Yangtze river at the river–lake junction of Hukou [21,29,36,37]. The lake can be divided into five zones corresponding to its hydrological and topographical features: zone 1 is a deep channel-type water body located in the northern Songmen Mountain area; zone 2, which is a wider and shallower lake-type water body, is in the southern Songmen Mountain area; zone 3 is the west branch of the Ganjiang and Xiushui estuary delta; zone 4 is the southern central branch of the Ganjiang and Fuhe estuary delta; and zone 5 is the Raohe estuary delta (Figure 1) [3,38]. The space division in this study makes it convenient for us to quantify the spatial distribution of Poyang Lake water variation, providing more detailed baseline information for future studies or management of the lake.
2.2. Data Collection
The archives of the Landsat 5 Thematic Mapper (TM), the Landsat 7 Enhanced Thematic Mapper-plus (ETM+), and the Landsat 8 Operational Land Imager (OLI) Surface Reflectance (SR) datasets in Google Earth Engine (GEE), including more than 2000 images, were utilized (Figure S1) as the data source for the water detection in this study [39]. The Landsat 5 and 7 SR datasets are generated in the United States Geological Survey (USGS) from Landsat standard Level 1 Terrain-corrected (L1T) images with the Landsat Ecosystem Disturbance Adaptive Processing System (LEDAPS) algorithm, and the Landsat 8 SR dataset is generated in USGS with the Landsat Surface Reflectance Code (LaSRC) algorithm [40].
Precipitation was chosen as a representation of the factors of climate influence, leaving out negligible factors (i.e., temperature, humidity, and sunshine duration) [24,41]. TRMM3B43 satellite data have been used in previous studies and have shown good spatial–temporal correlativity with the precipitation data from meteorological stations [23]. However, TRMM data do not cover the years before 1997. A quasi-global precipitation product, the PERSIANN Precipitation Climate Data Record (PERSIANN-CDR), contains daily data from 1 January 1983 to 31 December 2017 at a spatial resolution of 0.25 degrees [42]. The Pearson correlation test showed a high correlation between PERSIANN-CDR and TRMM data during 1 January 1998–31 December 2016 (statistics of annual value: r = 0.973, p < 0.001; statistics of monthly value: r = 0.972, p < 0.001). Therefore, we selected PERSIANN-CDR as the precipitation data source to analyze the influence of the climate on Poyang Lake.
All the data used in this study were accessed through the GEE’s public data catalogue.
2.3. Data Processing
2.3.1. Detection, Frequency Mapping, and Classification of the Surface Water of Poyang Lake
Water indices have often been used to detect open surface water with satellite data. One of the most widely applied water indices is the Modified Normalized Difference Water Index (MNDWI), which was developed from the Normalized Difference Water Index (NDWI) [43,44]. MNDWI improved the performance of NDWI by removing the built-up land noises and replacing the near-infrared (NIR) band with the shortwave-infrared (SWIR) band in the calculation process [43]. Combining vegetation indices could help avoid the commission error caused by MNDWI in identifying water–vegetation mixed wetlands, which would improve the water classification accuracy [45]. Therefore, we adopted a decision-tree-based water detecting method, which has been proven to be efficient in Poyang Lake [46] and the United States [4], the overall accuracy of which was 94.0% and 96.91%, respectively. In this method, two vegetation indices, the enhanced vegetation index (EVI) and the normalized difference vegetation index (NDVI), were utilized to reduce the effects of vegetation in distinguishing water pixels with the water index, MNDWI [47]. Pixels meeting the following criteria were classified as water: MNDWI > NDVI or MNDWI > EVI and EVI < 0.1. We conducted an accuracy evaluation of the water detection of Poyang Lake by visually interpreting 2000 random sampling points on a false color composite of Landsat 8 (Figure S2). As shown in the confusion matrix (Table S1), the producer’s accuracy and the user’s accuracy of the water classification were 97.17% and 96.10%, respectively, which further validated the algorithm. Clouds and shadows were identified by the C code based on the Function of Mask algorithm (CFMask) in the SR collection on GEE as bad observations and masked before the water detection [48]. The Scan Line Corrector (SLC)-off pixels in the Landsat ETM+ SR dataset were treated as clouds or shadows, because they had limited impact on the time series analysis [49,50]. The unmasked pixels were defined as good observations. Then, the inundation frequency (F) of each pixel time series for the same location was calculated as the percentage of water observations in all the good observations. Based on the inundation frequency of a year (Fy), the water pixels were classified into the seasonal water body (Fy ∈ [0.25, 0.75)), year-long water body (Fy ∈ [0.75, 1]), and maximum water body (Fy ∈ [0.25, 1]) [47]. Accordingly, considering the inundation frequency of a single month through multiple years (Fm), the pixels were classified into the month-short water body (Fm ∈ [0.25, 0.75)), month-long water body (Fm ∈ [0.75, 1]), and month-maximum water body (Fm ∈ [0.25, 1]). With a similar range for the threshold, we also classified the water pixels into three major types according to their inundation frequency in the same seasons of three consecutive years (Fs) (i.e., Fs of spring in 1989 was calculated with all the Landsat images during March–May in 1988, 1989, and 1990). The water body types in four seasons included the spring (summer/fall/winter)-short water body (Fs ∈ [0.25, 0.75)), spring (summer/fall/winter)-long water body (Fs ∈ [0.25, 0.75)), and spring (summer/fall/winter)-maximum water body (Fs ∈ [0.25, 1]). Because pixels with F < 0.25 have a greater potential to be non-effective pixels, they were excluded from the analysis to reduce the potential error from uncertainty [47]. The exclusion rate of pixels with F < 0.25 was 0.17. The exclusion did not narrow our samples significantly.
To quantitatively compare our results of surface water body area with related studies (i.e., study 1 [20], study 2 [24], and study 3 [19]), which includes annual average water body area of Poyang Lake, we defined and calculated the area of average water body of the lake in each year during 1988–2016 with Equation (1):
where n is the total number of water pixels in the study area; Fi is the Fy of water pixel i ranging from 0.25 to 1; A is a constant, which equals to the area of one pixel, 900 m2. We also accessed the Global Surface Water (GSW) dataset produced by the Joint Research Centre (JRC) group on GEE to extract the permanent water body area of Poyang Lake in 1988–2015 (abbreviated as “JRC data” for short) [9], which was then compared with the year-long water body area in our study.
2.3.2. Spatial–Temporal Variation Analysis
In the Landsat SR dataset, imagery from 1984–1987 did not meet our 12-month coverage requirement (Figure S1), so 1988–2016 was chosen as the time range for this study. The surface water dynamics of Poyang Lake were analyzed based on the trends of Fy and three types of annual water body areas. The Fy trends were shown as spatial maps of p values and slopes of pixel-based Fy value linear regression. The area trends were analyzed through a robust linear trend regression method, the Theil–Sen (Kendall–Theil, TS) regression [51,52,53,54,55]. A regime shift detection test was also conducted to verify if the lake’s water body had experienced any regime changes. A regime shift indicates whether a system has experienced an abrupt change rather than a slow and monotonic variation of the kind detected by trend regression [56]. The sequential t-test algorithm (STARS) [57] was applied to detect any regime shifts in the inter-annual variation of the seasonal, year-long, and maximum water body areas, respectively. This method has also been used to detect the year of the regime shift of the annual area of Poyang Lake [20] and other ecological or meteorological time series [58,59,60]. Relative parameters were set according to Liu et al. [20] and the STARS documentation [61].
2.3.3. A Comparison of Poyang Lake’s Surface Water between Two Periods
The operation of the TGD has altered the regime of its downstream river—the middle and lower Yangtze River—in many ways, including the water level, water level variation, and channel morphology [32]. These changes could have a profound impact on the inundation patterns of the river-connected lakes on the MLRY, including Poyang Lake. Because 2003 was the year of the first impoundment of the TGD, studies about the dynamics of water bodies on the MLRY usually use 2003 as a watershed year to compare the water body areas between the pre- and post-TGD eras [19,26,62,63]. Here, we also divided the entire timeframe of 1988–2016 into the pre-TGD (1988–2002) and post-TGD (2003–2016) periods to compare the changes in the surface water of Poyang Lake. Student’s t test was used to compare the yearly area of the water between the two periods. The spatial–temporal trends of the two periods were calculated by the methods described in Section 2.3.2 for the annual water change comparison. To further compare the surface water of Poyang Lake in the two periods on a seasonal scale (i.e., the periods of the year in which the surface water experienced the most change after the operation of the TGD), we mapped the difference of the monthly inundation frequency (ΔFm) between the two periods in each month.
2.3.4. Relationship between the Poyang Lake Water and Precipitation
Because Poyang Lake accepts water from local precipitation and upstream water from the Poyang basin, we calculated the precipitation of the Poyang Lake Basin to explore its relationship with Poyang Lake’s surface water [19,26,64,65]. For the timeframe of 1988–2016, we performed a linear correlation test for the annual precipitation with three types of yearly water body areas and a linear correlation test for the multi-year average monthly precipitation with three types of monthly water body areas. Because it may take around 2 months for the precipitation to transfer into the lake from the upstream runoff [64], we considered time lags from 0 to 3 months to inspect successively the precipitation data’s relationship with the three types of monthly water body areas. Based on the linear relationship between the monthly average precipitation and the surface water body area of the lake, the precipitation (with one-month lag) in different seasons was also calculated with a 3-year moving average as the seasonal precipitation for a linear correlation test with the water body area in four seasons.
2.4. Data Processing Tools
The geographic mapping work in this study was conducted by GEE, ArcGIS 10.5, or the “raster” package in R software. Other plotting was finished in Origin Pro 2017. The Theil–Sen (Kendall–Theil, TS) trend regressions [51,52,53,54,55] were carried out by the “mblm” package (version 0.12) in R (version 3.4.3), a package of “Median-Based Linear Models”, which could provide linear models based on Theil–Sen single median. According to regression results, the Kendall–Theil robust lines were added to the inter-annual dynamic plots of the water body area. The sequential t-test algorithm (STARS) was conducted in Excel with an add-in software “Shift detection v3-4.xla” [57].
The work flow of this study is shown in Figure 2.
3. Results
3.1. Inundation Frequency Mapping
The inundation frequency (F) distributions of a single year (2016) and multiple years (1988–2016) are shown in Figure 3. On average, the lake F in 2016 (0.679) was slightly lower than that of the entire study period (0.681) (Table 1). As channel- or lake-type deep bodies of water, zones 1 and 2 have relatively higher mean values and lower standard deviation (SD) values for F than those of the surrounding floodplain zones (zones 3, 4, and 5). Zone 3, containing the Poyang Lake National Nature Reserve, had the lowest inundation frequency in 2016 and in the past few decades (Table 1). We presented sample classification maps with the corresponding inundation frequency maps in the supplementary materials (Figure S3).
3.2. Surface Water Variation of Poyang Lake during 1988–2016
Based on 29 annual inundation frequency (Fy) maps, the variation tendency of each pixel’s inundation frequency was further mapped to visualize the spatial distribution of the annual water variation. We found significant increasing trends scattered on the marginal areas of the lake, while significant declining trends of the inundation frequency were distributed across the whole lake, covering the majority of zones 1, 2, and 5 and the northeastern part of zones 3 and 4 (Figure 4).
Based on Fy, we derived different types of annual water body areas in Poyang Lake, some of which were compared with results from previous studies (Figure 5, Table 2). Our results have significant positive linear correlation with all previous studies (Table 2). In study 1, 59 Landsat images were used to calculate the annual average water body area of the lake during 1973–2011. Basically, the annual average lake areas in study 1 [20], which were also derived from Landsat data, were less than the maximum water body area and more than the year-long water body area. This is in line with our expectation, because the year-long water body has water for most of a year, while the maximum water body includes both the seasonal and year-long water body. It is interesting that the annual average water body area in study 2 [24] and study 3 [19] were closer to or even smaller than the year-long water body area in our study. This could be due to the fact that MODIS data have a coarser spatial resolution than Landsat data, leading to the loss of some pixels when delineating the lake boundary. We found permanent water body area values abnormal in the year 1988 (36.38 km2), 1994 (31.74 km2), 1997 (0 km2), and 1998 (0 km2), which compromised the consistency of the JRC data series (Figure 5). We deleted data in the four years before correlation analysis. The abnormal values were directly caused by the lack of valid data in the JRC Yearly Water Classification History (v1.0) dataset [9] in the Poyang Lake region. To be specific, in 1988, 1994, 1997, and 1998, the pixels under “No data” classification take up 95.79%, 95.37%, 98.08%, and 98.08% of the study area, respectively. However, in a study of surface water body area in the United States, the year-long water body area series (produced through the same algorithm in this study) during 1984–2015 agreed well with a consecutive permanent water body area series from JRC dataset [4]. Based on these facts, we thought that the JRC permanent water body area could be a good reference to the year-long water body area, but it is not qualified enough in the Poyang Lake region at present for a cross validation with results in this study.
Then, we summarized the dynamic of the maximum/year-long/seasonal water body area of Poyang Lake and its five zones. In the past 29 years, the annual maximum water body area did not change significantly (p = 0.12), but the year-long and seasonal water body area experienced a decreasing (−21.38 km2/yr, p < 0.001) and increasing (23.79 km2/yr, p < 0.001) trend, respectively (Figure 6, Table 3). The regime shift detection revealed different change points in the three types of annual water body areas: the maximum water body area of Poyang Lake had an abrupt ascending point in 2016, while the year-long water body area shifted to a lower area regime in 2006, and the seasonal water body area also had a regime shift in 2006 in the opposite direction (Figure 6). In the five subzones of Poyang Lake, the year-long and seasonal water displayed change tendencies similar to those of the entire lake, except zone 3, which had no significant variation trend in any of the three study periods. The largest subregion, zone 4, had the greatest shrinkage tendency in its annual maximum water body area (−8.62 km2/yr, −0.98% of mean) of all the zones (Table 3). The maximum and long-type water body areas in all the seasons showed significant decreasing trends during 1989–2015, among which the fall-long water body area declined the most (−50.55 km2/yr) (Table S2).
3.3. Differences in the Poyang Lake Water between the Pre- and Post-TGD Periods
The two periods’ t-test showed that the maximum water body areas did not demonstrate a significant difference between the pre-TGD and post-TGD periods, while the year-long area was smaller (p = 0.006) in the post-TGD than in the pre-TGD period and the seasonal water body area was larger in the post-TGD period (p = 0.021) (Figure 7). With regard to the variation trends of the three types of water body areas in the pre- or post-TGD periods, only the seasonal water body area in the post-TGD period had a significant increasing trend (26.60 km2/yr, p < 0.001).
The spatial distribution of the Fy trend better illustrates the differences in the water body variation between the pre- and post-TGD periods (Figure 8). In the post-TGD period, the water body area had greater decreasing Fy trends than that in the pre-TGD period (Figure 8). Similar to the entire study period, the area with the most significant decreasing Fy trend in the post-TGD period was mainly distributed in the northeastern part of Poyang Lake (Figure 8).
To explore during which period of the year Poyang Lake’s surface water’s F declined the most in the post-TGD relative to the pre-TGD period, we introduced Fm, calculated Fm in the two periods, and mapped ΔFm to show the spatial distribution of the F variation in the post-TGD period in each month. The extent of the decline of F in the post-TGD period was not temporally uniform throughout the year (Figure 9, Figure S4). In the first two months of the winter, December and January, Fm declined severely, especially in zones 1 and 2. In February and March, most of the lake had greater Fm in the post-TGD period except zone 2. In April and May of the spring, the Fm decline spread to the whole lake. With respect to the summer, in July and August, the declining regions were mostly distributed in the southern part of the lake in zones 3 and 4, while in June the increasing area was very close to the decreasing area. In autumn, the declining area continued to dominate the whole lake, except some areas of increase concentrated in the southeast (mainly in zone 3) in the last two months of the season. In brief, the surface water declined in most regions in all the months (except June) in the post-TGD period, and this decline was more severe in the spring and autumn than in the winter; summer was the season when the surface water declined the least (Figure 9). In order to further quantify the seasonal inequity of ΔFm, the distribution area of the different ΔFm levels of Poyang Lake and its subzones were mapped, as shown in Figure S4.
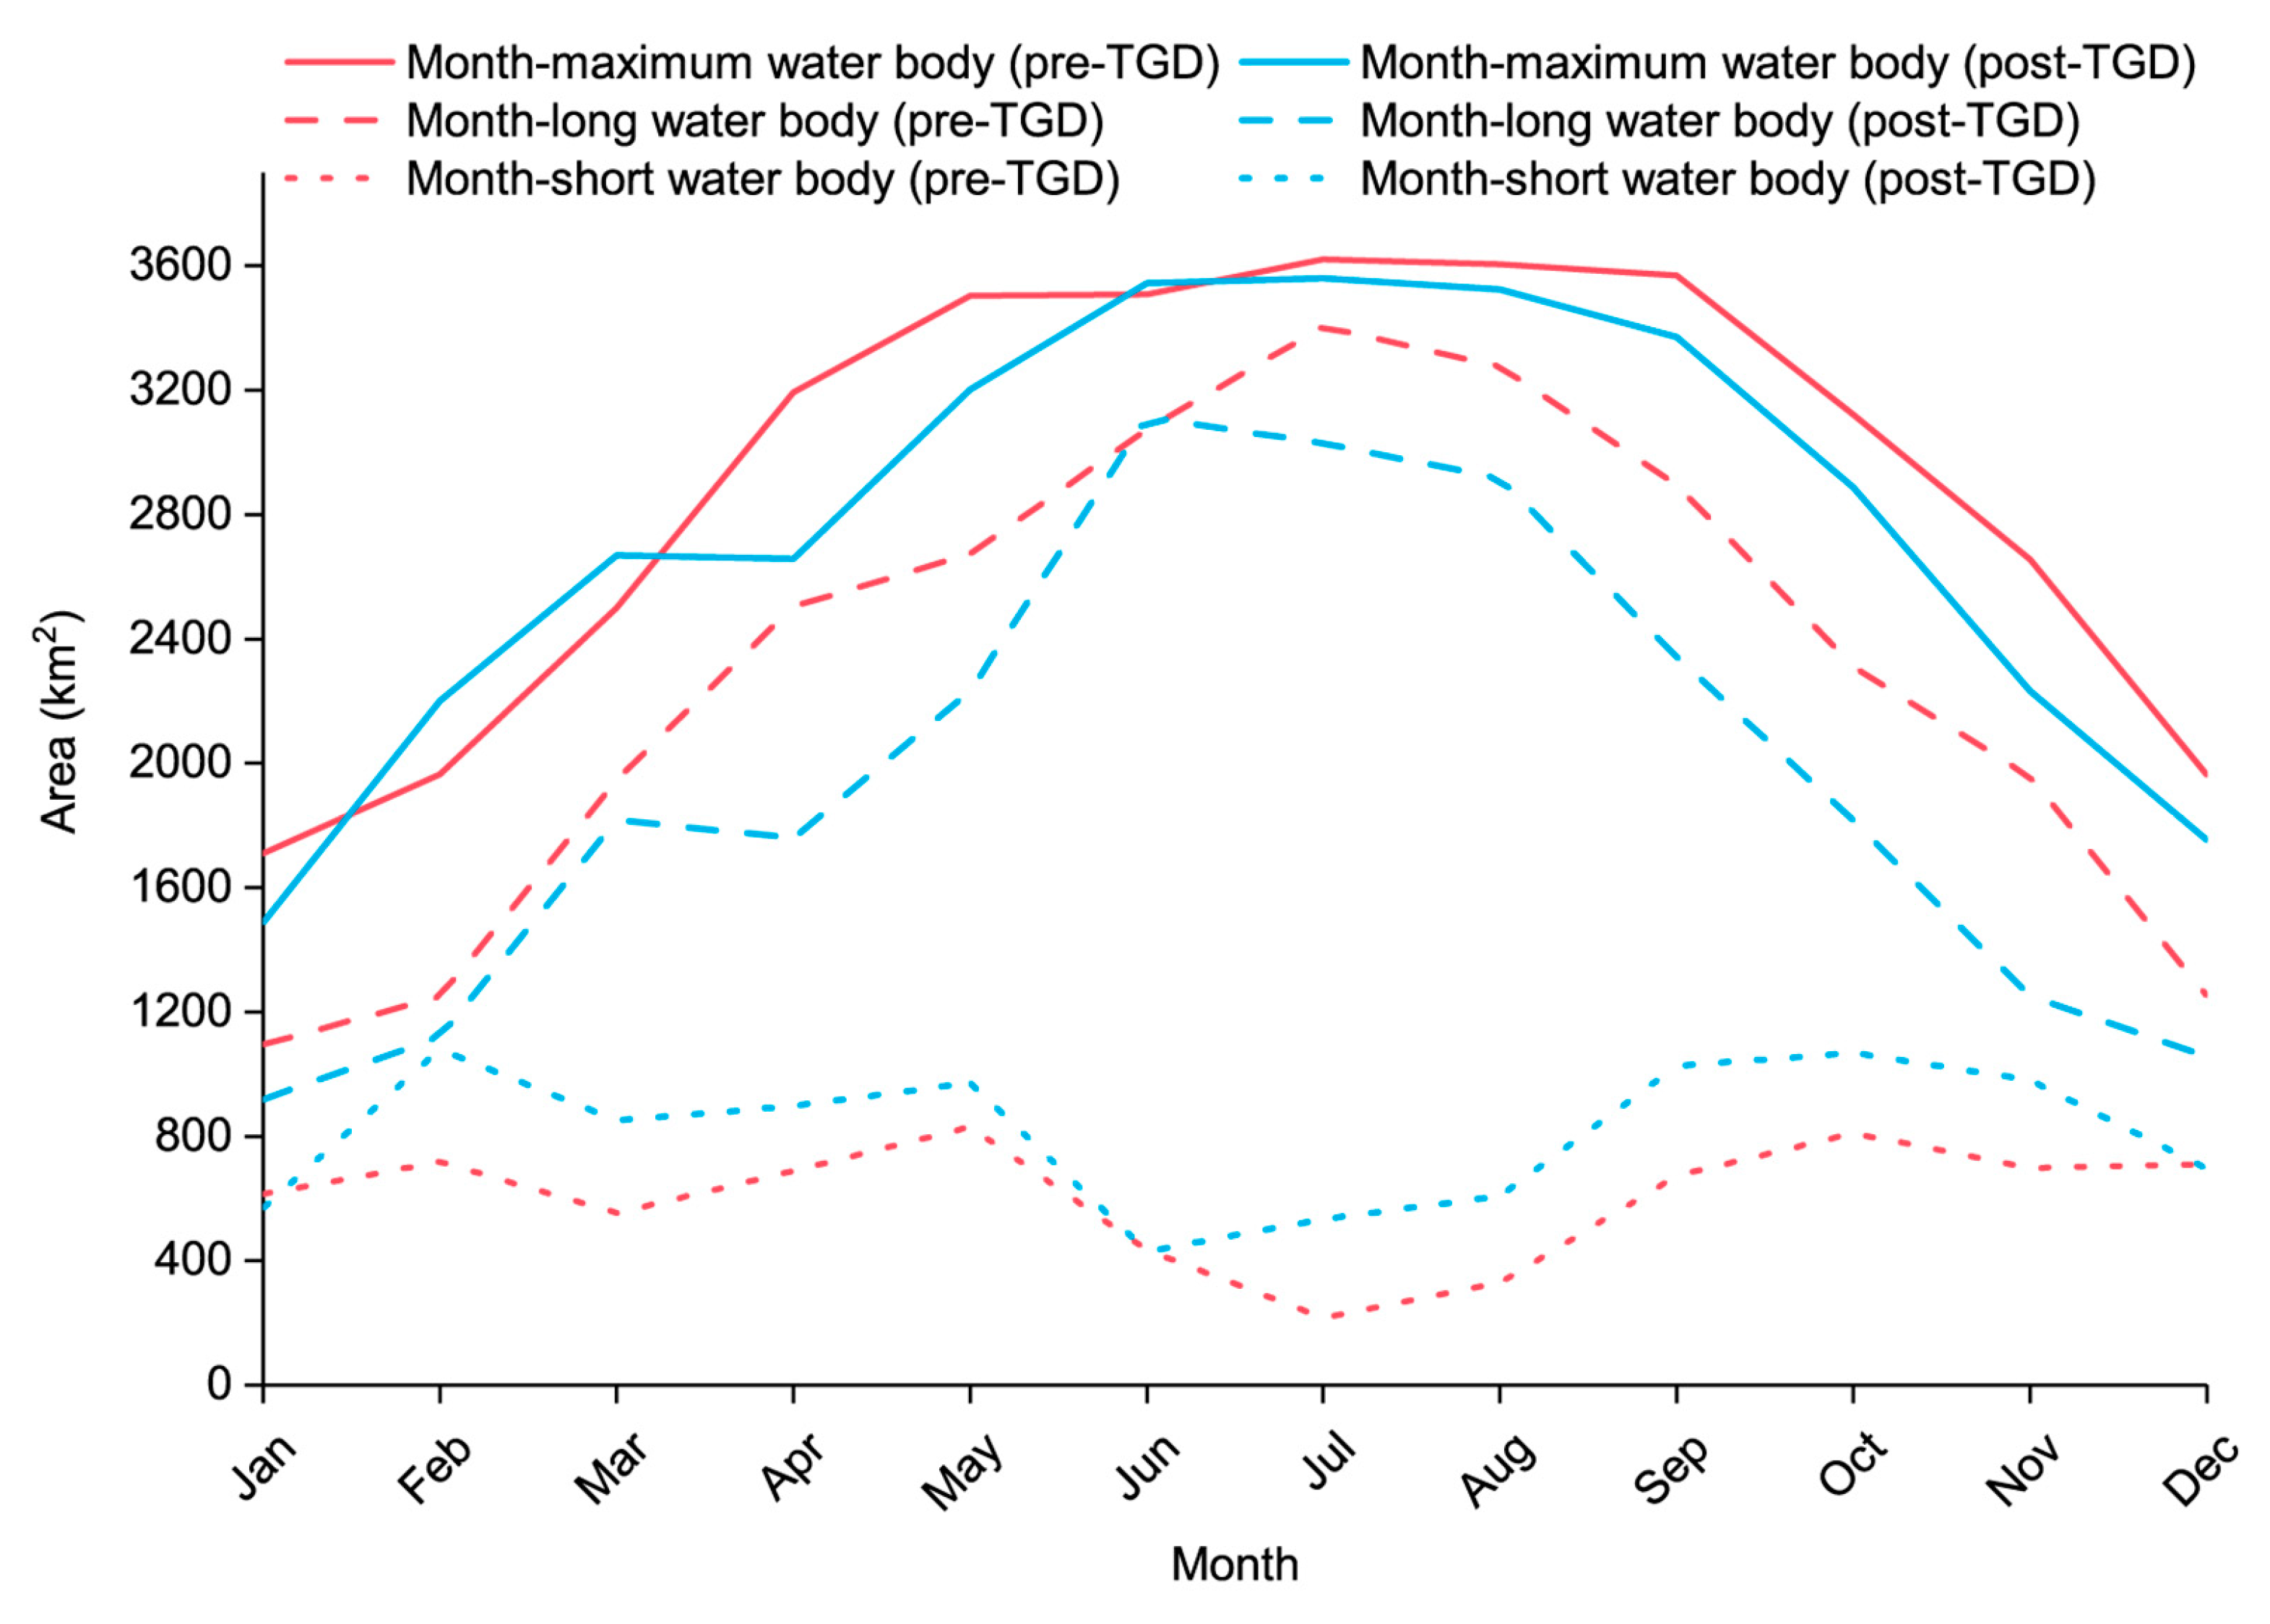
The seasonal behavior of the water body area in the two periods was also graphed. In Figure 10, the three types of monthly water body areas show different variation patterns. As mentioned in Section 2.3.1, the month-long water is the surface water appears most (i.e., more than three quarters) of the time in a month, while the occurrence time of month-short water is less than the month-long water within a month. The month-maximum water body area is the sum of the month-long water body area and month-short water body area, which indicates the maximum area of surface water body in a month. The month-maximum water body area of Poyang Lake had an “up-steady-down” pattern of variation: the area grew steadily beginning in January (except for a small drop in April in the post-TGD period), kept a stable and high level in the summer, and began to decrease in autumn. The month-long water body area presented a similar pattern but had a shorter steady stage. The month-short water body area had more wave crests and did not show a typical pattern of inner-annual fluctuation. Comparing the water body area between the two periods in Poyang Lake, we could find that in most months, the month-maximum and month-long water body areas in the pre-TGD period were larger than those in the post-TGD period, and the month-short water body area showed the opposite trend.
3.4. Relationship between the Upstream Basin Precipitation and Poyang Lake’s Water
On the inner-annual scale, the precipitation of the Poyang Lake Basin had a great influence on the water body area of Poyang Lake (with a time lag of 1–2 months), and such precipitation could explain most (71.6%–83.1%, according to the R2) of the variation in the month-maximum or month-long water body area of Poyang Lake (Table 4).
On an inter-annual scale, during 1988–2016, the precipitation in the Poyang Lake Basin had a very weak correlation with the Poyang Lake maximum water body area (R2 = 0.152, p = 0.037) and no significant correlation with the year-long or seasonal water body areas. The variation trend of the annual precipitation was also not significant (p = 0.670), though we found an abrupt increasing point in 2015 in the regime shift detection test (Figure S5). When looking further into the influence of the precipitation in the Poyang Lake area in different seasons, we found a significant correlation in the seasonal precipitation with the spring/fall-maximum/long area (Table 5). In the spring, the decline of the precipitation in the Poyang Lake Basin could explain 34.4% of the spring-maximum water body area and 58.3% of the spring-long water body area reduction (Table 5). In the fall, only 19.7% of the fall-maximum water body area and 30.1% of the fall-long water body area decline could be explained by the variation in the precipitation (Table 5).
4. Discussion
Inundation frequency is a frequently utilized index for lake surface water dynamics, and previous studies have mainly used MODIS data to calculate inundation frequency [3,24]. In this study, to gain a better understanding of the long-term changes in Poyang Lake, we chose Landsat data to map and analyze the inundation status with a similar index. The average F maps display the hydrological heterogeneity of the lake. The channel- and lake-type water bodies in zones 1 and 2 had higher water coverage frequency and relatively lower SD than other subregions. This is related to their close geographical connection to the Yangtze River, which helps to maintain a stable long-term inundation state. Among the rest of the regions, zone 3 had a relatively lower inundation frequency than the other subregions of the lake over the past few decades. In another paper, zone 3 was also identified as the worst affected area in a study about the Poyang Lake drought in 2011 [3]. The water shortage in Poyang Lake has brought trouble to the local water supply and the wetland ecosystem protection (http://www.chinadaily.com.cn/china/2012-01/05/content_14382441.htm). Our results suggest that more attention should be paid to the west branch of the Ganjiang and Xiushui estuary delta (zone 3) when Poyang Lake and its surrounding areas suffer water deficit problems. Zone 4 also worth more concerns from administrators of the local wetland protection, since we found that it had the largest shrinkage tendency in the past decades among the five subregions.
In this study, we used different approaches to explore the long-term variation in the surface water of Poyang Lake. As in previous studies on the long-term variations of Poyang Lake surface water, we found a decreasing trend in the annual area of the lake. The greatest difference between our studies and previous studies is that the type of decreasing water body area—year-long water body area—was specified in our study. The maximum water body area, which represents the maximum extent of the annual lake water coverage, has not changed significantly over the past few decades. The regime shift analysis identified an abrupt decreasing point in 2006 in the year-long water body area, consistent with the findings of [20], although, in [20], no significant decreasing trend was found in the variation in the lake’s annual area. The consistency in the regime shift year in the year-long water body area in this study and in the annual lake area in [20] demonstrates the effectiveness of the water classification method we adopted, in which the year-long water body area could be the strongest indicator for measuring the annual inundation status of a lake. The abrupt increase of the maximum water body area in 2016 has not been reported before, which might be related to the abrupt increasing point of the precipitation in 2015.
The precipitation in the Poyang Lake Basin could represent climate influence on the lake’s area. Such precipitation in the lake region directly increases the amount of lake water, and precipitation in other parts of the basin first flows into the runoff of the five rivers and then enters the lake to increase the area of surface water. Precipitation could explain more than 70% of the seasonal variation in the Poyang Lake surface water with a 1–2-month time lag, which is in line with the correlation analysis between the lake water level and the precipitation in a previous study (a maximum R2 = 0.54 (p < 0.05) with a 2-month time lag) [64]. This time lag indicates that it may take rainwater in the Poyang Lake Basin 1–2 months to completely enter the lake. As for the inter-annual variation, Liu et al. [20] found a significant correlation (R2 = 0.7300) between the basin precipitation and the area of Poyang Lake during 1973–2013. The lower correlation level in our study could be related to the shorter study time period. It may also indicate that the inter-annual variation in the year-long water body area of Poyang Lake was not largely dominated by the precipitation in the Poyang Lake Basin. With respect to the influence of the precipitation in different seasons, we found that the decline of the seasonal precipitation accounted for 58.3% of the spring-long water body area decline and 30.1% of the fall-long water body area decline, respectively. Thus, the lack of precipitation could be the main reason for the inundation frequency/ area reduction in April and May of the post-TGD period (Figure 9 and Figure 10). The significant decrease of water body area in summer and winter should not be blamed on the inter-annual variation in the seasonal precipitation. Moreover, the variation trend of the annual precipitation was not significant, indicating a relatively steady climate situation in the Poyang Lake Basin. Therefore, the climate influence of the upstream basin may not be primarily responsible for the long-term water body area variation in the Poyang Lake region. Anthropogenic factors would be more likely to bring about a reduction in the area of year-long water body of Poyang Lake.
Since the first impoundment in June 2003, the regulation of the TGD has significantly changed the seasonal variation in the water level of the Yangtze River [32], and the interrelationship between the river and Poyang Lake has also been altered [22,25]. Typically, the TGD has four water dispatch modes as follows: (1) pre-discharge dispatch in late May–early June, during which water is released to prepare for the flood control in the summer; (2) flood control dispatch in July–August, which consists of downstream flood adjustment; (3) water storage dispatch in mid-September–October, including impoundment for the water supply in the winter and electricity generation; and (4) water supplement dispatch in December–March, involving water release [66,67]. In the post-TGD period, Poyang Lake has had lower inundation frequency and smaller surface water body area (Figure 7, Figure 9 and Figure 10) and has experienced more violent decreasing of inundation frequency/area (Figure 8) than in the pre-TGD period. A weakened “blocking effect”, because of the TGD regulation, could be the principal reason for Poyang Lake’s loss of surface water [22,23,68]. This blocking effect represents the intense effect of the Yangtze River water on Poyang Lake [69], during which the Yangtze River flow exerts strong pressure to block the outflow or add to the inflow of Poyang Lake. The blocking effect mostly happens during July–September, when the precipitation and snow-melting begin to concentrate over the Yangtze River headwater area and the runoff of the Poyang Lake Basin happens to decrease [37,70]. In this study, the sustained, large month-maximum and month-long areas in the summer were a result of the blocking effect from the Yangtze River (Figure 10). Impoundment leads to a decline in the flow and water level downstream of the TGD and thus results in a weakened river forcing and blocking effect on Poyang Lake, directly inducing more outflows from the lake into the river [22,25]. It is quite obvious that the month-maximum/long water body areas declined earlier in the post-TGD period than they did in the pre-TGD period (Figure 10), which could be largely due to the weakened blocking effect in the fall after the implementation of the TGD regulation; this also explains the overall shrinkage of the lake to some extent. While the impoundment of the TGD could contribute to the shrinkage of Poyang Lake in the fall, when the TGD is in water storage mode (15 September–31 October) [66], it could not account for the decline of the water body area or inundation frequency in the other seasons (Figure 9 and Figure 10), when the TGD operation contributes to the downstream Yangtze River flow and increases the river level at Hukou, which strengthens the blocking effect and increases the lake area [27,66,71]. Apart from the regulated downstream flow, some researchers have emphasized another downstream impact of the TGD—channel erosion. The TGD traps upstream sediment (80% recorded during 2003–2012), increasing the discharged water momentum so that the erosion of the downstream channels remains aggressive [72,73,74,75]. The long-term channel erosion irreversibly lowers the Yangtze River level downstream of the TGD, which may create a crucial anthropogenic factor affecting the natural lake area on the MLRY [25]. We recommend that future studies consider both water regulation and channel erosion in quantifying the influence of the TGD on the variation in the Poyang Lake surface water body area.
Besides the TGD, other anthropogenic factors in the Poyang Lake Basin may also contribute to the variation in the Poyang Lake surface water body area. These factors include human water utilization, hydropower construction, land cover change, and forest restoration projects in the Poyang Lake Basin that affect the water inflow into the lake [25,76,77]. Among the factors affecting the outflow, a major issue has been the sand mining activity in the lake area since 2000 [29]. The major influence of sand mining has been a result of its huge alteration to the geomorphology of the Hukou channel. The increased amount of the channel cut-off and the expanded channel cross section caused by the sand mining has added to the wetted cross-sectional area and shortened the outflow channel length, which ultimately increased the discharge ability of Poyang Lake during the winter dry season by 1.5–2 times [29,30]. Such fundamental geomorphic alteration has made the lake discharge stronger and greater and has caused drought to occur quickly in the winter. As a result of the influence of sand mining, the discharge ability of Poyang Lake has increased rapidly since 2002—a time that is very close to the date of the first impoundment of the TGD. Because neither the precipitation nor the TGD regulation could explain the great loss of the lake area in the winter (Figure 9 and Figure 10, Table S2), we believe that sand mining is the main cause of the winter water body area shrinkage. Continuous mining has also deepened the lake basin, directly decreasing the lake water level to a small degree (<4.4%) [62]. The water body area of Poyang Lake also has a close positive relationship with the lake water stage at Hukou [20]. Further analyzing the hydrologic change (e.g., lake stage, inflow, outflow) of the lake during 1988–2016 would help us better understand the reason or the long-term trend of the decreasing lake area. To what extent anthropogenic factors, especially the TGD regulation and sand mining activity, has influenced the long-term dynamic of the Poyang Lake area still requires further investigation.
5. Conclusions
This paper demonstrates the utility of processing Landsat data on GEE to explore both the inner- and inter-annual variability in the surface water body of a seasonal inundation lake. We presented the spatial and temporal variation of the surface water of Poyang Lake during the time period of 1988–2016. Most of the area of the lake, especially the central part, experienced a decrease in the annual inundation frequency over the past 29 years, and the decreasing trend mainly occurred in the post-TGD period. Spring and autumn are the seasons during which the surface water loss was the most severe in the post-TGD period compared with the pre-TGD period. The surface water body area was classified into different types according to the inundation frequency levels. The year-long water body area showed a significant decreasing trend over the past 29 years and has shifted to a smaller regime since 2006. Precipitation is the determinant factor of the variation in Poyang Lake’s surface water body area on an inner-annual scale, and it accounts for the long-lasting shrinkage of the lake area to some extent (~58.3% in the spring and ~30.1% in the fall), but it could not totally account for the lake’s shrinkage tendency over the past few decades. The effects of anthropogenic factors, especially the decreased blocking effect in the fall due to the regulation of the TGD and the increased discharge ability in the winter due to sand mining, should be further quantified to develop a comprehensive explanation of the lake’s long-term shrinkage tendency.
Supplementary Materials
The following are available online at https://www.mdpi.com/2072-4292/11/3/313/s1, Figure S1: Number of Landsat TM/ETM+/OLI SR images at the study area in each year from 1984 to 2016; Figure S2: The false color composite (a) and water classification result in this study (b) of Landsat 8 image (Date: 2016.02.16; Path/Row: 121/040); Figure S3: Inundation frequency (in 2016 (a) and January of pre-TGD (b)) and water body classification maps of Poyang Lake ((in 2016 (c) and January of pre-TGD (d))); Figure S4: Area distribution of different monthly water frequency change levels in (a) Poyang Lake, (b) Zone 1, (c) Zone 2, (d) Zone 3, (e) Zone 4, and (f) Zone 5; Figure S5: Annual precipitation on the Poyang Lake Basin, with TS trend line and regime shift denoted. Table S1: The confusion matrix for water detection algorithm evaluation of this study; Table S2: Statistical summary of water body area dynamics of Poyang Lake in different seasons.
Author Contributions
Y.W. and J.M. conceived and wrote the original draft. X.X. and X.W. contributed in data processing and analysis. S.D. contributed to data visualization. B.Z. revised the paper and assumed the responsibility of foundation. All authors reviewed and contributed to the organization of the manuscript.
Funding
This work was funded by the Key project of Shanghai science and technology commission [grant number 18DZ1206507], National Key Research and Development Program of China [grant number 2018YFD0900806], and the Natural Science Foundation of China [grant number 41601181].
Acknowledgments
We appreciate the vector data of Poyang Lake from “Lake-Watershed Science Data Center, National Earth System Science Data Sharing Infrastructure, National Science & Technology Infrastructure of China. (http://lake.geodata.cn)”. We also gratefully acknowledge Yuanbo Liu for offering the vector data of Poyang Lake subzones.
Conflicts of Interest
The authors declare no conflict of interest.
References
- Beeton, A.M. Large freshwater lakes: Present state, trends, and future. Environ. Conserv. 2002, 29, 21–38. [Google Scholar] [CrossRef]
- Palmer, S.C.J.; Kutser, T.; Hunter, P.D. Remote sensing of inland waters: Challenges, progress and future directions. Remote Sens. Environ. 2015, 157, 1–8. [Google Scholar] [CrossRef] [Green Version]
- Wu, G.; Liu, Y. Satellite-based detection of water surface variation in China’s largest freshwater lake in response to hydro-climatic drought. Int. J. Remote Sens. 2014, 35, 4544–4558. [Google Scholar] [CrossRef]
- Zou, Z.; Xiao, X.; Dong, J.; Qin, Y.; Doughty, R.B.; Menarguez, M.A.; Zhang, G.; Wang, J. Divergent trends of open-surface water body area in the contiguous united states from 1984 to 2016. Proc. Natl. Acad. Sci. USA 2018. [Google Scholar] [CrossRef] [PubMed]
- Du, Y.; Xue, H.-P.; Wu, S.-J.; Ling, F.; Xiao, F.; Wei, X.-H. Lake area changes in the middle yangtze region of China over the 20th century. J. Environ. Manag. 2011, 92, 1248–1255. [Google Scholar] [CrossRef] [PubMed]
- Coops, H.; Beklioglu, M.; Crisman, T.L. The role of water-level fluctuations in shallow lake ecosystems—Workshop conclusions. Hydrobiologia 2003, 506, 23–27. [Google Scholar] [CrossRef]
- Verpoorter, C.; Kutser, T.; Seekell, D.A.; Tranvik, L.J. A global inventory of lakes based on high-resolution satellite imagery. Geophys. Res. Lett. 2014, 41, 6396–6402. [Google Scholar] [CrossRef] [Green Version]
- Fluet-Chouinard, E.; Lehner, B.; Rebelo, L.-M.; Papa, F.; Hamilton, S.K. Development of a global inundation map at high spatial resolution from topographic downscaling of coarse-scale remote sensing data. Remote Sens. Environ. 2015, 158, 348–361. [Google Scholar] [CrossRef]
- Pekel, J.-F.; Cottam, A.; Gorelick, N.; Belward, A.S. High-resolution mapping of global surface water and its long-term changes. Nature 2016, 540, 418. [Google Scholar] [CrossRef]
- Sheng, Y.; Song, C.; Wang, J.; Lyons, E.A.; Knox, B.R.; Cox, J.S.; Gao, F. Representative lake water extent mapping at continental scales using multi-temporal landsat-8 imagery. Remote Sens. Environ. 2016, 185, 129–141. [Google Scholar] [CrossRef]
- Lyons, E.; Sheng, Y. Laketime: Automated seasonal scene selection for global lake mapping using Landsat ETM+ and OLI. Remote Sens. 2018, 10, 54. [Google Scholar] [CrossRef]
- Tao, S.; Fang, J.; Zhao, X.; Zhao, S.; Shen, H.; Hu, H.; Tang, Z.; Wang, Z.; Guo, Q. Rapid loss of lakes on the Mongolian plateau. Proc. Natl. Acad. Sci. USA 2015, 112, 2281–2286. [Google Scholar] [CrossRef] [PubMed]
- Liu, H.; Yin, Y.; Piao, S.; Zhao, F.; Engels, M.; Ciais, P. Disappearing lakes in semiarid northern China: Drivers and environmental impact. Environ. Sci. Technol. 2013, 47, 12107–12114. [Google Scholar] [CrossRef] [PubMed]
- Gorelick, N.; Hancher, M.; Dixon, M.; Ilyushchenko, S.; Thau, D.; Moore, R. Google earth engine: Planetary-scale geospatial analysis for everyone. Remote Sens. Environ. 2017, 202, 18–27. [Google Scholar] [CrossRef]
- Hird, J.; DeLancey, E.; McDermid, G.; Kariyeva, J. Google earth engine, open-access satellite data, and machine learning in support of large-area probabilistic wetland mapping. Remote Sens. 2017, 9, 1315. [Google Scholar] [CrossRef]
- Donchyts, G.; Baart, F.; Winsemius, H.; Gorelick, N.; Kwadijk, J.; van de Giesen, N. Earth’s surface water change over the past 30 years. Nat. Clim. Chang. 2016, 6, 810. [Google Scholar] [CrossRef]
- Chen, F.; Zhang, M.; Tian, B.; Li, Z. Extraction of glacial lake outlines in Tibet plateau using Landsat 8 imagery and google earth engine. IEEE J. Sel. Top. Appl. Earth Obs. Remote Sens. 2017, 10, 4002–4009. [Google Scholar] [CrossRef]
- Xu, H.; Bai, Y. In Evaluation of urban lake evolution using google earth engine—A case study of Wuhan, China. In Proceedings of the 2015 Fourth International Conference on Agro-Geoinformatics (Agro-geoinformatics), Istanbul, Turkey, 20–24 July 2015. [Google Scholar]
- Feng, L.; Hu, C.; Chen, X.; Zhao, X. Dramatic inundation changes of China’s two largest freshwater lakes linked to the three gorges dam. Environ. Sci. Technol. 2013, 47, 9628–9634. [Google Scholar] [CrossRef]
- Liu, Y.; Wu, G.; Zhao, X. Recent declines in China’s largest freshwater lake: Trend or regime shift? Environ. Res. Lett. 2013, 8. [Google Scholar] [CrossRef]
- Zhang, Q.; Ye, X.-C.; Werner, A.D.; Li, Y.-L.; Yao, J.; Li, X.-H.; Xu, C.-Y. An investigation of enhanced recessions in Poyang lake: Comparison of Yangtze river and local catchment impacts. J. Hydrol. 2014, 517, 425–434. [Google Scholar] [CrossRef]
- Guo, H.; Hu, Q.; Zhang, Q.; Feng, S. Effects of the three gorges dam on Yangtze river flow and river interaction with Poyang lake, China: 2003–2008. J. Hydrol. 2012, 416, 19–27. [Google Scholar] [CrossRef]
- Feng, L.; Hu, C.; Chen, X. Satellites capture the drought severity around China’s largest freshwater lake. IEEE J. Sel. Top. Appl. Earth Obs. Remote Sens. 2012, 5, 1266–1271. [Google Scholar] [CrossRef]
- Feng, L.; Hu, C.; Chen, X.; Cai, X.; Tian, L.; Gan, W. Assessment of inundation changes of Poyang lake using MODIS observations between 2000 and 2010. Remote Sens. Environ. 2012, 121, 80–92. [Google Scholar] [CrossRef]
- Wang, J.; Sheng, Y.; Wada, Y. Little impact of the three gorges dam on recent decadal lake decline across China’s Yangtze plain. Water Resour. Res. 2017, 53, 3854–3877. [Google Scholar] [CrossRef]
- Wang, J.; Sheng, Y.; Tong, T.S.D. Monitoring decadal lake dynamics across the Yangtze basin downstream of three gorges dam. Remote Sens. Environ. 2014, 152, 251–269. [Google Scholar] [CrossRef]
- Lai, X.; Jiang, J.; Yang, G.; Lu, X.X. Should the three gorges dam be blamed for the extremely low water levels in the middle-lower Yangtze river? Hydrol. Process. 2014, 28, 150–160. [Google Scholar] [CrossRef]
- Li, L.; Xia, H.; Li, Z.; Zhang, Z. Temporal-spatial evolution analysis of lake size-distribution in the middle and lower Yangtze river basin using Landsat imagery data. Remote Sens. 2015, 7, 10364–10384. [Google Scholar] [CrossRef]
- Lai, X.; Shankman, D.; Huber, C.; Yesou, H.; Huang, Q.; Jiang, J. Sand mining and increasing Poyang lake’s discharge ability: A reassessment of causes for lake decline in China. J. Hydrol. 2014, 519, 1698–1706. [Google Scholar] [CrossRef]
- De Leeuw, J.; Shankman, D.; Wu, G.; de Boer, W.F.; Burnham, J.; He, Q.; Yesou, H.; Xiao, J. Strategic assessment of the magnitude and impacts of sand mining in Poyang lake, China. Reg. Environ. Chang. 2010, 10, 95–102. [Google Scholar] [CrossRef]
- Han, X.; Chen, X.; Feng, L. Four decades of winter wetland changes in Poyang lake based on Landsat observations between 1973 and 2013. Remote Sens. Environ. 2015, 156, 426–437. [Google Scholar] [CrossRef]
- Wang, J.; Sheng, Y.; Gleason, C.J.; Wada, Y. Downstream Yangtze river levels impacted by three gorges dam. Environ. Res. Lett. 2013, 8. [Google Scholar] [CrossRef]
- Zhang, L.; Yin, J.; Jiang, Y.; Wang, H. Relationship between the hydrological conditions and the distribution of vegetation communities within the Poyang lake national nature reserve, China. Ecol. Inform. 2012, 11, 65–75. [Google Scholar] [CrossRef]
- Wu, G.; de Leeuw, J.; Skidmore, A.K.; Prins, H.H.T.; Best, E.P.H.; Liu, Y. Will the three gorges dam affect the underwater light climate of Vallisneria spiralis L. and food habitat of Siberian crane in Poyang lake? Hydrobiologia 2009, 623, 213–222. [Google Scholar] [CrossRef]
- Li, X.; Yu, X.; Jiang, L.; Li, W.; Liu, Y.; Hou, X. How important are the wetlands in the middle-lower Yangtze river region: An ecosystem service valuation approach. Ecosyst. Serv. 2014, 10, 54–60. [Google Scholar] [CrossRef]
- Shankman, D.; Keim, B.D.; Nakayama, T.; Li, R.; Wu, D.; Remington, W.C. Hydroclimate analysis of severe floods in China’s Poyang lake region. Earth Interact. 2012, 16, 1–16. [Google Scholar] [CrossRef]
- Shankman, D.; Keim, B.D.; Song, J. Flood frequency in China’s Poyang lake region: Trends and teleconnections. Int. J. Climatol. 2006, 26, 1255–1266. [Google Scholar] [CrossRef]
- Zhou, W.B.; Wan, J.B.; Jiang, J.H. Impacts of the Variation of Poyang Lake Water Level on Its Ecosystem; Science Press: Beijing, China, 2011; ISBN 7030315545. [Google Scholar]
- Landsat 5/7/8 Surface Reflectance Datasets. Available online: https://code.earthengine.google.com/dataset/LANDSAT/LC8_SR (accessed on 17 December 2017).
- Vermote, E.; Justice, C.; Claverie, M.; Franch, B. Preliminary analysis of the performance of the Landsat 8/OLI land surface reflectance product. Remote Sens. Environ. 2016, 185, 46–56. [Google Scholar] [CrossRef]
- Allen, R.G.; Pereira, L.S.; Raes, D.; Smith, M. Crop Evapotranspiration-Guidelines for Computing Crop Water Requirements-FAO Irrigation and Drainage Paper 56; FAO: Rome, Italy, 1998; Volume 300, D05109. [Google Scholar]
- Ashouri, H.; Hsu, K.-L.; Sorooshian, S.; Braithwaite, D.K.; Knapp, K.R.; Cecil, L.D.; Nelson, B.R.; Prat, O.P. PERSIANN-CDR: Daily precipitation climate data record from multisatellite observations for hydrological and climate studies. Bull. Am. Meteorol. Soc. 2015, 96, 69–83. [Google Scholar] [CrossRef]
- Xu, H. Modification of normalised difference water index (NDWI) to enhance open water features in remotely sensed imagery. Int. J. Remote Sens. 2006, 27, 3025–3033. [Google Scholar] [CrossRef]
- McFeeters, S.K. The use of the normalized difference water index (NDWI) in the delineation of open water features. Int. J. Remote Sens. 1996, 17, 1425–1432. [Google Scholar] [CrossRef]
- Dong, J.; Xiao, X.; Kou, W.; Qin, Y.; Zhang, G.; Li, L.; Jin, C.; Zhou, Y.; Wang, J.; Biradar, C.; et al. Tracking the dynamics of paddy rice planting area in 1986–2010 through time series Landsat images and phenology-based algorithms. Remote Sens. Environ. 2015, 160, 99–113. [Google Scholar] [CrossRef] [Green Version]
- Zhou, Y.; Dong, J.; Xiao, X.; Xiao, T.; Yang, Z.; Zhao, G.; Zou, Z.; Qin, Y. Open surface water mapping algorithms: A comparison of water-related spectral indices and sensors. Water 2017, 9, 256. [Google Scholar] [CrossRef]
- Zou, Z.; Dong, J.; Menarguez, M.A.; Xiao, X.; Qin, Y.; Doughty, R.B.; Hooker, K.V.; David Hambright, K. Continued decrease of open surface water body area in Oklahoma during 1984–2015. Sci. Total Environ. 2017, 595, 451–460. [Google Scholar] [CrossRef] [PubMed]
- Foga, S.; Scaramuzza, P.L.; Guo, S.; Zhu, Z.; Dilley, R.D.; Beckmann, T.; Schmidt, G.L.; Dwyer, J.L.; Joseph Hughes, M.; Laue, B. Cloud detection algorithm comparison and validation for operational Landsat data products. Remote Sens. Environ. 2017, 194, 379–390. [Google Scholar] [CrossRef] [Green Version]
- Zhu, Z.; Wang, S.; Woodcock, C.E. Improvement and expansion of the Fmask algorithm: Cloud, cloud shadow, and snow detection for Landsats 4–7, 8, and sentinel 2 images. Remote Sens. Environ. 2015, 159, 269–277. [Google Scholar] [CrossRef]
- Zhu, Z. Change detection using Landsat time series: A review of frequencies, preprocessing, algorithms, and applications. ISPRS J. Photogramm. Remote Sens. 2017, 130, 370–384. [Google Scholar] [CrossRef]
- Theil, H. A rank-invariant method of linear and polynomial regression analysis. In Henri Theil’s Contributions to Economics and Econometrics; Springer: Dordrecht, The Netherlands, 1992; pp. 345–381. [Google Scholar]
- Nitze, I.; Grosse, G.; Jones, B.; Arp, C.; Ulrich, M.; Fedorov, A.; Veremeeva, A. Landsat-based trend analysis of lake dynamics across northern permafrost regions. Remote Sens. 2017, 9, 640. [Google Scholar] [CrossRef]
- Fickas, K.C.; Cohen, W.B.; Yang, Z. Landsat-based monitoring of annual wetland change in the willamette valley of Oregon, USA from 1972 to 2012. Wetlands Ecol. Manag. 2016, 24, 73–92. [Google Scholar] [CrossRef]
- Sen, P.K. Estimates of the regression coefficient based on Kendall’s tau. J. Am. Stat. Assoc. 1968, 63, 1379–1389. [Google Scholar] [CrossRef]
- Siegel, A.F. Robust regression using repeated medians. Biometrika 1982, 69, 242–244. [Google Scholar] [CrossRef] [Green Version]
- Villarini, G.; Smith, J.A.; Serinaldi, F.; Ntelekos, A.A. Analyses of seasonal and annual maximum daily discharge records for central Europe. J. Hydrol. 2011, 399, 299–312. [Google Scholar] [CrossRef]
- Rodionov, S.N. A sequential algorithm for testing climate regime shifts. Geophys. Res. Lett. 2004, 31. [Google Scholar] [CrossRef] [Green Version]
- Frank, K.T.; Petrie, B.; Fisher, J.A.D.; Leggett, W.C. Transient dynamics of an altered large marine ecosystem. Nature 2011, 477, 86. [Google Scholar] [CrossRef]
- Rodionov, S. A sequential method of detecting abrupt changes in the correlation coefficient and its application to Bering sea climate. Climate 2015, 3, 474. [Google Scholar] [CrossRef]
- Lo, T.-T.; Hsu, H.-H. The early 1950s regime shift in temperature in Taiwan and east Asia. Clim. Dyn. 2008, 31, 449–461. [Google Scholar] [CrossRef]
- Regime Shift Detection Software. Available online: https://sites.google.com/site/climatelogic/documentation (accessed on 12 March 2018).
- Mei, X.; Dai, Z.; Du, J.; Chen, J. Linkage between three gorges dam impacts and the dramatic recessions in China’s largest freshwater lake, Poyang lake. Sci. Rep. 2015, 5. [Google Scholar] [CrossRef] [PubMed]
- Wu, G.; Liu, Y. Assessment of the hydro-ecological impacts of the three gorges dam on China’s largest freshwater lake. Remote Sens. 2017, 9. [Google Scholar] [CrossRef]
- Cai, X.; Feng, L.; Wang, Y.; Chen, X. Influence of the three gorges project on the water resource components of Poyang lake watershed: Observations from TRMM and grace. Adv. Meteorol. 2015. [Google Scholar] [CrossRef]
- Feng, L.; Hu, C.; Chen, X.; Li, R. Satellite observations make it possible to estimate Poyang lake’s water budget. Environ. Res. Lett. 2011, 6. [Google Scholar] [CrossRef]
- Ou, C.; Li, J.; Zhang, Z.; Li, X.; Yu, G.; Liao, X. Effects of the dispatch modes of the three gorges reservoir on the water regimes in the Dongting lake area in typical years. J. Geogr. Sci. 2012, 22, 594–608. [Google Scholar] [CrossRef]
- Wang, X.; de Linage, C.; Famiglietti, J.; Zender, C.S. Gravity recovery and climate experiment (grace) detection of water storage changes in the three gorges reservoir of China and comparison with in situ measurements. Water Resour. Res. 2011, 47. [Google Scholar] [CrossRef]
- Zhang, Q.; Li, L.; Wang, Y.G.; Werner, A.D.; Xin, P.; Jiang, T.; Barry, D.A. Has the three-gorges dam made the Poyang lake wetlands wetter and drier? Geophys. Res. Lett. 2012, 39. [Google Scholar] [CrossRef]
- Hu, Q.; Feng, S.; Guo, H.; Chen, G.; Jiang, T. Interactions of the yangtze river flow and hydrologic processes of the Poyang lake, China. J. Hydrol. 2007, 347, 90–100. [Google Scholar] [CrossRef]
- Shankman, D.; Liang, Q. Landscape changes and increasing flood frequency in China’s Poyang lake region. Prof. Geogr. 2003, 55, 434–445. [Google Scholar] [CrossRef]
- Herve, Y.; Claire, H.; Lai, X.; Stephane, A.; Li, J.; Sylviane, D.; Muriel, B.-N.; Chen, X.; Huang, S.; Burnham, J.; et al. Nine years of water resources monitoring over the middle reaches of the Yangtze river, with ENVISAT, MODIS, Beijing-1 time series, Altimetric data and field measurements. Lakes Reserv. Res. Manag. 2011, 16, 227–243. [Google Scholar] [CrossRef]
- Dai, Z.; Liu, J.T. Impacts of large dams on downstream fluvial sedimentation: An example of the three gorges dam (TGD) on the Changjiang (Yangtze river). J. Hydrol. 2013, 480, 10–18. [Google Scholar] [CrossRef]
- Yang, S.L.; Xu, K.H.; Milliman, J.D.; Yang, H.F.; Wu, C.S. Decline of Yangtze river water and sediment discharge: Impact from natural and anthropogenic changes. Sci. Rep. 2015, 5, 12581. [Google Scholar] [CrossRef]
- Yang, S.L.; Milliman, J.D.; Xu, K.H.; Deng, B.; Zhang, X.Y.; Luo, X.X. Downstream sedimentary and geomorphic impacts of the three gorges dam on the Yangtze river. Earth-Sci. Rev. 2014, 138, 469–486. [Google Scholar] [CrossRef]
- Lai, X.; Liang, Q.; Huang, Q.; Jiang, J.; Lu, X.X. Numerical evaluation of flow regime changes induced by the three gorges dam in the middle Yangtze. Hydrol. Res. 2016, 47, 149–160. [Google Scholar] [CrossRef]
- Zhao, G.; Hörmann, G.; Fohrer, N.; Zhang, Z.; Zhai, J. Streamflow trends and climate variability impacts in Poyang lake basin, China. Water Resour. Manag. 2010, 24, 689–706. [Google Scholar] [CrossRef]
- Huang, L.; Shao, Q.; Liu, J. Forest restoration to achieve both ecological and economic progress, Poyang lake basin, China. Ecol. Eng. 2012, 44, 53–60. [Google Scholar] [CrossRef]
Figure 1.
The location and hydrographical zones of Poyang Lake in China.

Figure 2.
Workflow of this study. MNDWI: modified normalized difference water index; NDVI: normalized difference vegetation index; EVI: enhanced vegetation index; and TGD: Three Gorges Dam.
Figure 2.
Workflow of this study. MNDWI: modified normalized difference water index; NDVI: normalized difference vegetation index; EVI: enhanced vegetation index; and TGD: Three Gorges Dam.

Figure 3.
Inundation frequency (F) distribution of (a) 2016 and (b) 1988–2016 (the zone numbers and their respective boundaries are presented with five different colors).
Figure 3.
Inundation frequency (F) distribution of (a) 2016 and (b) 1988–2016 (the zone numbers and their respective boundaries are presented with five different colors).

Figure 4.
The variation tendency mapping of Fy of Poyang Lake during 1988–2016 ((a) slope, (b) p-value).
Figure 4.
The variation tendency mapping of Fy of Poyang Lake during 1988–2016 ((a) slope, (b) p-value).

Figure 5.
Comparison of Poyang Lake’s annual water body area in this study with study 1 [20], study 2 [24], and study 3 [19] and JRC data [9], with abnormal values denoted in red circles.

Figure 6.
The inter-annual dynamics of the (a) maximum, (b) year-long, and (c) seasonal water body areas during 1988–2016, with the Theil–Sen (TS) trends fitted in dashed lines and the average annual area regime shifts denoted in bold lines.
Figure 6.
The inter-annual dynamics of the (a) maximum, (b) year-long, and (c) seasonal water body areas during 1988–2016, with the Theil–Sen (TS) trends fitted in dashed lines and the average annual area regime shifts denoted in bold lines.

Figure 7.
Box–whisker plots of the (a) maximum, (b) year-long, and (c) seasonal water body areas with t-test significance level (“*”: p < 0.05; “**”: p < 0.01; “NS”: non-significant) between the pre- and post-TGD periods.
Figure 7.
Box–whisker plots of the (a) maximum, (b) year-long, and (c) seasonal water body areas with t-test significance level (“*”: p < 0.05; “**”: p < 0.01; “NS”: non-significant) between the pre- and post-TGD periods.

Figure 8.
Map of the variation tendency of Fy of Poyang Lake ((a) slope in the pre-TGD period, (b) p-value in the pre-TGD period, (c) slope in the post-TGD period, and (d) p-value in the post-TGD period).
Figure 8.
Map of the variation tendency of Fy of Poyang Lake ((a) slope in the pre-TGD period, (b) p-value in the pre-TGD period, (c) slope in the post-TGD period, and (d) p-value in the post-TGD period).

Figure 9.
Spatial distribution of the differences in the monthly inundation frequency between the pre- and post-TGD periods.
Figure 9.
Spatial distribution of the differences in the monthly inundation frequency between the pre- and post-TGD periods.
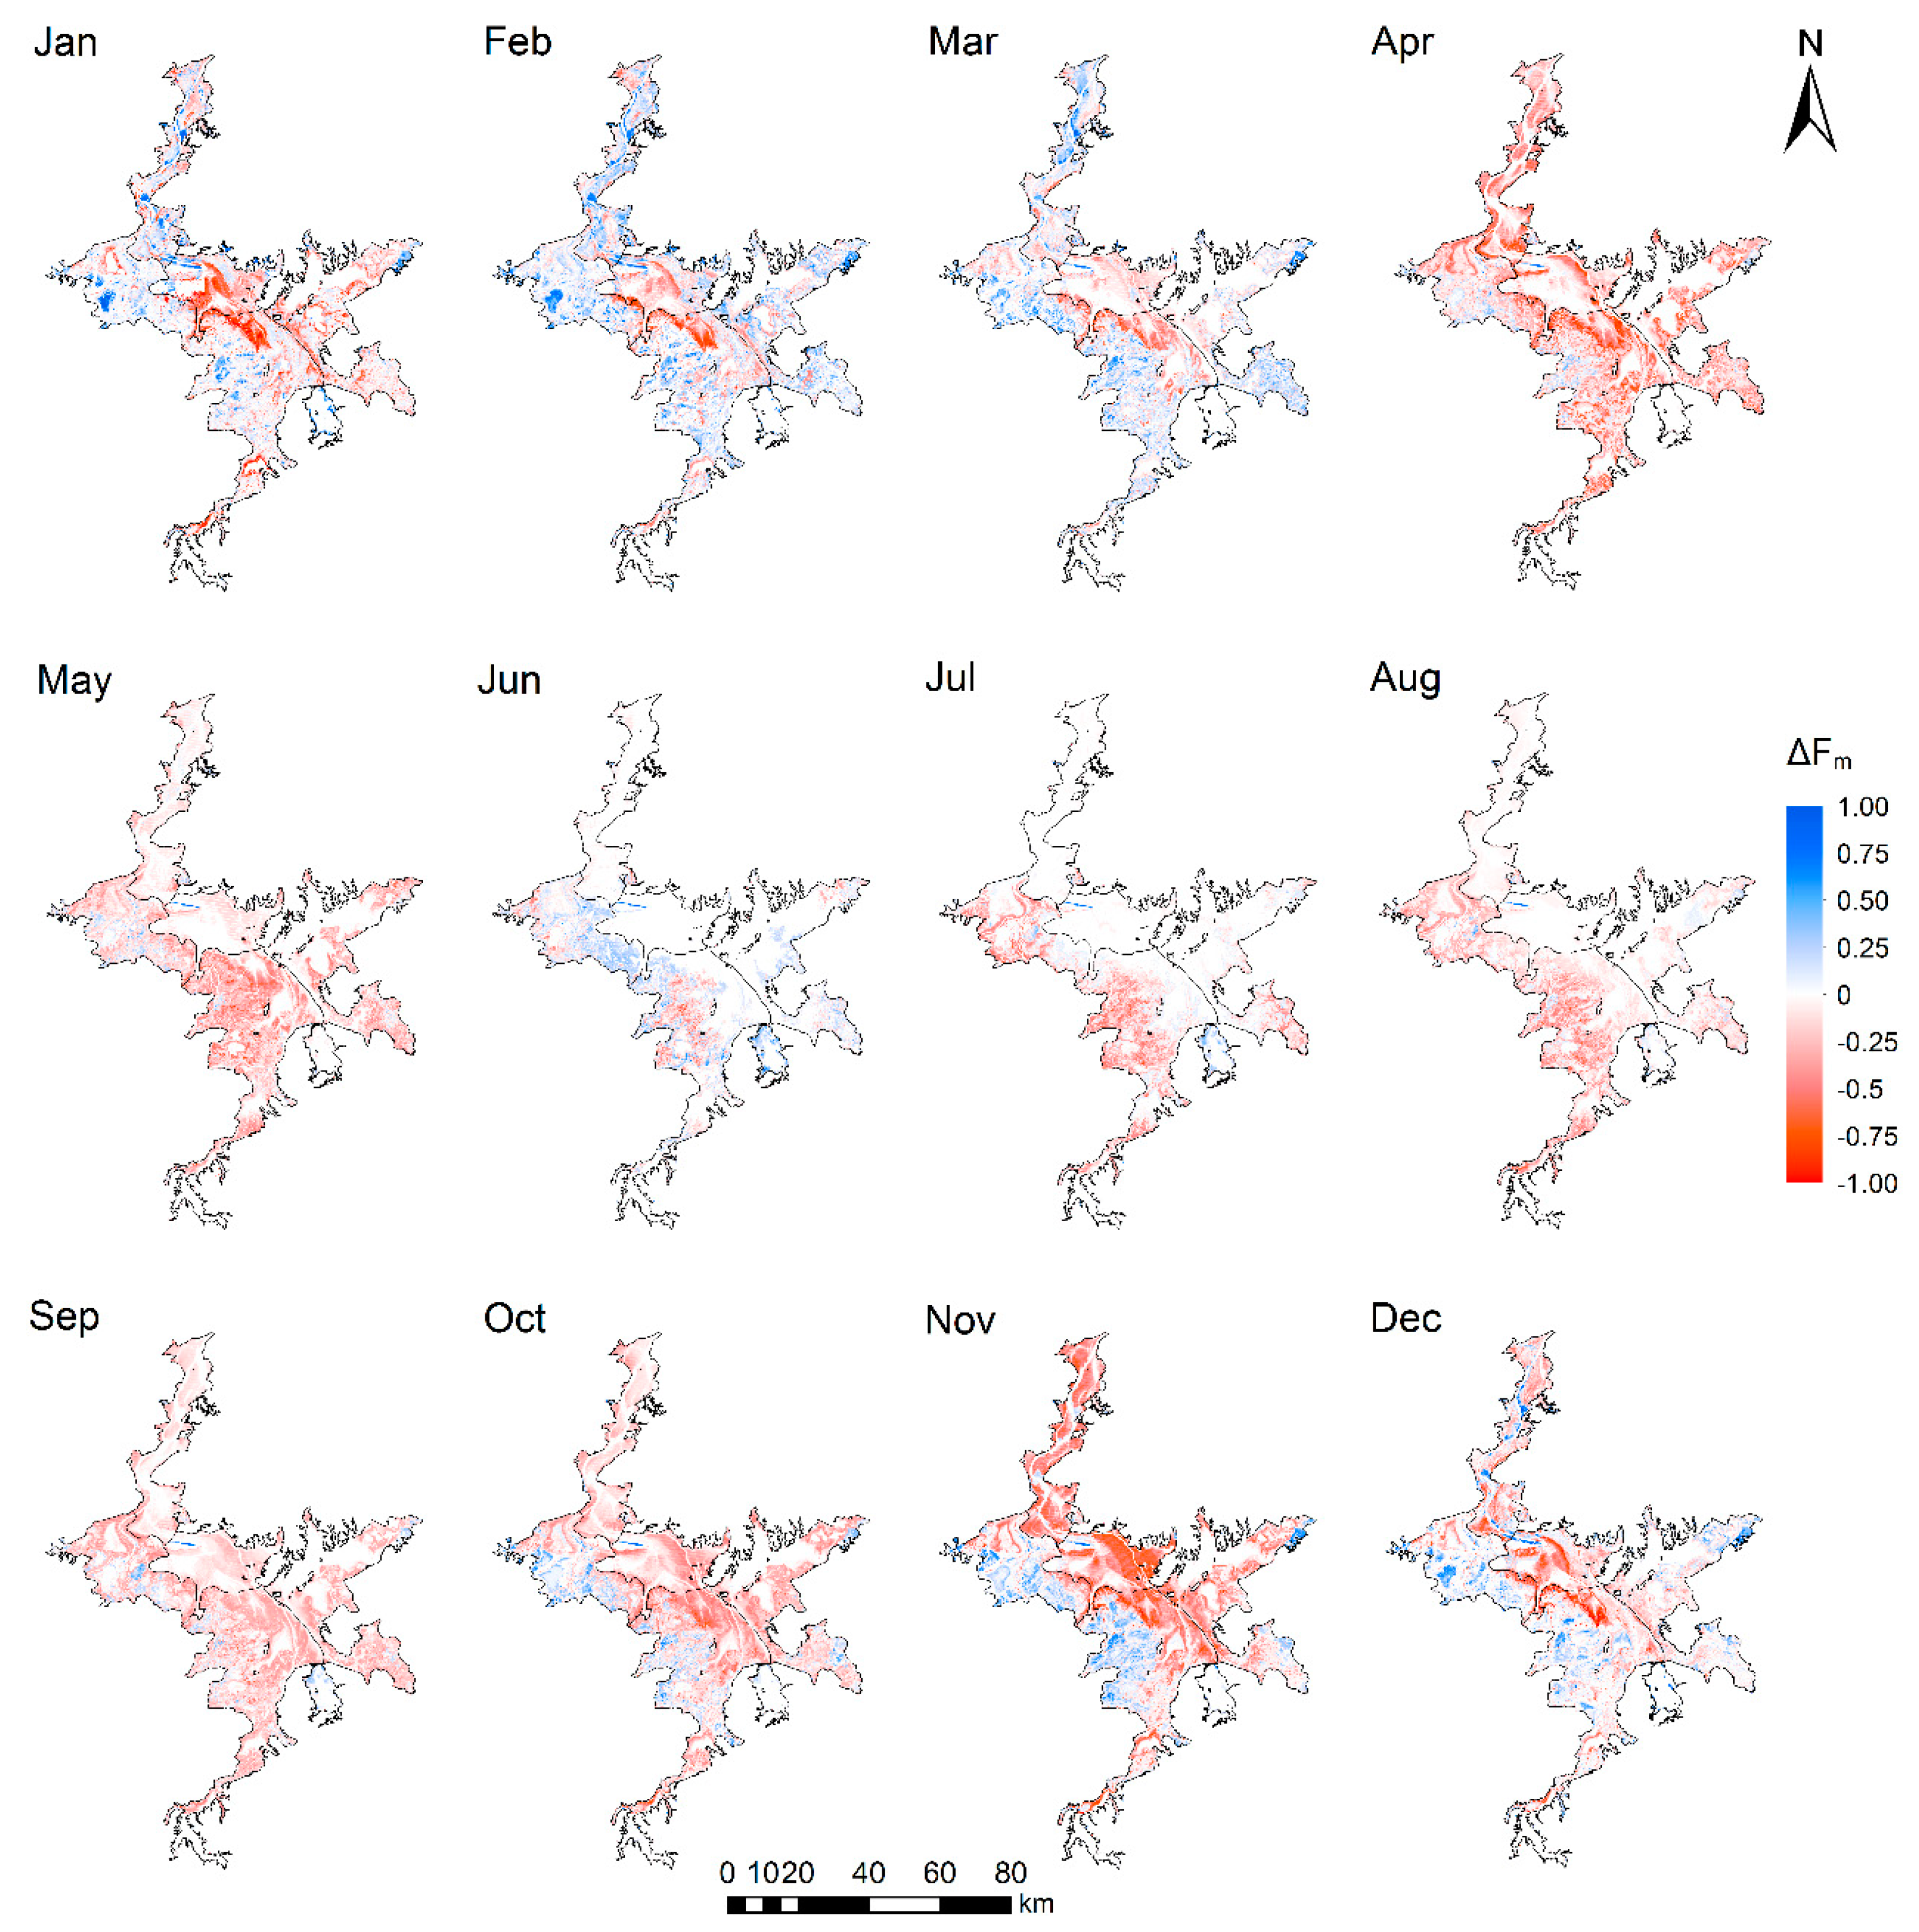
Figure 10.
Month-maximum, month-long, and month-short water body area variations in Poyang Lake during the pre- and post-TGD periods.
Figure 10.
Month-maximum, month-long, and month-short water body area variations in Poyang Lake during the pre- and post-TGD periods.

Table 1.
Mean and standard deviation value of the Poyang Lake F in 2016 and 1988–2016.
| Zone * | Mean ± SD | |
|---|---|---|
| 2016 | 1988–2016 | |
| 0 | 0.679 ± 0.281 | 0.681 ± 0.281 |
| 1 | 0.761 ± 0.227 | 0.796 ± 0.170 |
| 2 | 0.751 ± 0.259 | 0.831 ± 0.204 |
| 3 | 0.549 ± 0.277 | 0.521 ± 0.297 |
| 4 | 0.645 ± 0.268 | 0.608 ± 0.277 |
| 5 | 0.724 ± 0.296 | 0.747 ± 0.266 |
* Zones 0–5 represent “Poyang Lake”, “zone 1”, “zone 2”, “zone 3”, “zone 4”, and “zone 5”, respectively.
Table 2.
Linear correlation between results of this study and previous studies.
| Study | Comparative Item | R | p-Value |
|---|---|---|---|
| Study 1 | Average water body area | 0.701 * | <0.001 |
| Study 2 | Average water body area | 0.829 * | 0.002 |
| Study 3 | Average water body area | 0.821 * | 0.004 |
| JRC data | Year-long/Permanent water body area | 0.659 * | <0.001 |
R represents the Pearson Correlation Coefficient; * indicates a significant value with a 95% confidence interval.
Table 3.
Statistical summary of surface water body area dynamics in Poyang Lake and its five zones.
| Zone | Water Body Type | Rate of Change (yr−1) | ||
|---|---|---|---|---|
| Area (km2) | % of Mean | p-Value | ||
| 0 | Maximum | −11.18 | −0.37 | 0.121 |
| Year-long | −21.38 * | −1.29 * | <0.001 | |
| Seasonal | 23.79 * | 1.74 * | <0.001 | |
| 1 | Maximum | −0.14 | −0.03 | 0.092 |
| Year-long | −6.06 * | −1.95 * | <0.001 | |
| Seasonal | 6.33 * | 3.10 * | <0.001 | |
| 2 | Maximum | 0.08 * | 0.02 * | 0.026 |
| Year-long | −4.99 * | −1.67 * | <0.001 | |
| Seasonal | 4.48 * | 3.68 * | <0.001 | |
| 3 | Maximum | −1.23 | −0.32 | 0.347 |
| Year-long | −1.11 | −0.83 | 0.190 | |
| Seasonal | 0.34 | 0.14 | 0.733 | |
| 4 | Maximum | −8.62 * | −0.98 * | 0.020 |
| Year-long | −9.50 * | −2.33 * | <0.001 | |
| Seasonal | 7.86 * | 1.66 * | 0.006 | |
| 5 | Maximum | −1.66 | −0.20 | 0.205 |
| Year-long | −4.55 * | −0.90 * | 0.003 | |
| Seasonal | 5.25 * | 1.66 * | 0.004 | |
Zones 0–5 represent “Poyang Lake”, “zone 1”, “zone 2”, “zone 3”, “zone 4”, and “zone 5”, respectively; * indicates a significant value with a 95% confidence interval.
Table 4.
Statistical summary of the linear correlation between the multi-year (1988–2016) average monthly precipitation and the Poyang Lake water body area.
Table 4.
Statistical summary of the linear correlation between the multi-year (1988–2016) average monthly precipitation and the Poyang Lake water body area.
| Water Body Type | Precipitation Time Lag (months) | |||||||
|---|---|---|---|---|---|---|---|---|
| 0 | 1 | 2 | 3 | |||||
| R2 | p-Value | R2 | p-Value | R2 | p-Value | R2 | p-Value | |
| Month-maximum | 0.448 * | 0.017 | 0.735 * | <0.001 | 0.716 * | <0.001 | 0.430 * | 0.021 |
| Month-long | 0.488 * | 0.012 | 0.831 * | <0.001 | 0.787 * | <0.001 | 0.439 * | 0.019 |
| Month-short | 0.199 | 0.146 | 0.394 * | 0.029 | 0.332 | 0.050 | 0.132 | 0.247 |
* indicates a significant value with a 95% confidence interval.
Table 5.
Statistical summary of the linear correlation between seasonal precipitation and the Poyang Lake water body area during 1989–2015.
Table 5.
Statistical summary of the linear correlation between seasonal precipitation and the Poyang Lake water body area during 1989–2015.
| Water Body Type | R2 | p-Value |
|---|---|---|
| Spring-maximum | 0.344 * | 0.001 |
| Spring-long | 0.583 * | <0.001 |
| Spring-short | 0.070 | 0.18 |
| Summer-maximum | 0.064 | 0.203 |
| Summer-long | 0.108 | 0.095 |
| Summer-short | 0.083 | 0.145 |
| Fall-maximum | 0.197 * | 0.020 |
| Fall-long | 0.301 * | 0.003 |
| Fall-short | 0.050 | 0.262 |
| Winter-maximum | 0.0002 | 0.941 |
| Winter-long | 0.024 | 0.440 |
| Winter-short | 0.012 | 0.583 |
* indicates a significant value with a 95% confidence interval.
© 2019 by the authors. Licensee MDPI, Basel, Switzerland. This article is an open access article distributed under the terms and conditions of the Creative Commons Attribution (CC BY) license (http://creativecommons.org/licenses/by/4.0/).
Share and Cite
MDPI and ACS Style
Wang, Y.; Ma, J.; Xiao, X.; Wang, X.; Dai, S.; Zhao, B. Long-Term Dynamic of Poyang Lake Surface Water: A Mapping Work Based on the Google Earth Engine Cloud Platform. Remote Sens. 2019, 11, 313. https://doi.org/10.3390/rs11030313
AMA Style
Wang Y, Ma J, Xiao X, Wang X, Dai S, Zhao B. Long-Term Dynamic of Poyang Lake Surface Water: A Mapping Work Based on the Google Earth Engine Cloud Platform. Remote Sensing. 2019; 11(3):313. https://doi.org/10.3390/rs11030313
Chicago/Turabian StyleWang, Yingbing, Jun Ma, Xiangming Xiao, Xinxin Wang, Shengqi Dai, and Bin Zhao. 2019. "Long-Term Dynamic of Poyang Lake Surface Water: A Mapping Work Based on the Google Earth Engine Cloud Platform" Remote Sensing 11, no. 3: 313. https://doi.org/10.3390/rs11030313
Note that from the first issue of 2016, this journal uses article numbers instead of page numbers. See further details here.